
Micromechanical Modeling Tensile and Fatigue Behavior of Fiber-Reinforced Ceramic-Matrix Composites Considering Matrix Fragmentation and Closure


Abstract
:1. Introduction
2. Micromechanical Constitutive Models
2.1. Micromechanical Tensile Constitutive Model Considering Matrix Fragmentation
2.2. Micromechanical Cyclic Hysteresis Loops Constitutive Model Considering Matrix Fragmentation and Closure
- ▪
- Stage I, when σunloading > σtr_unloading, the unloading interface reverse slip length is less than the interface debonding length.
- ▪
- Stage II, when σmin < σunloading < σtr_unloading, the unloading interface reverse slip length is equal to the interface debonding length.
- ▪
- Stage I, when σreloading > σ > σmin, the reloading interface new slip length is less than the interface debonding length.
- ▪
- Stage II, when σ > σreloading, the reloading interface new slip length is equal to the interface debonding length.
3. Experimental Comparisons
3.1. Prediction of Tensile and Fatigue Hysteresis Loops of Mini-SiC/SiC Composite
- (a)
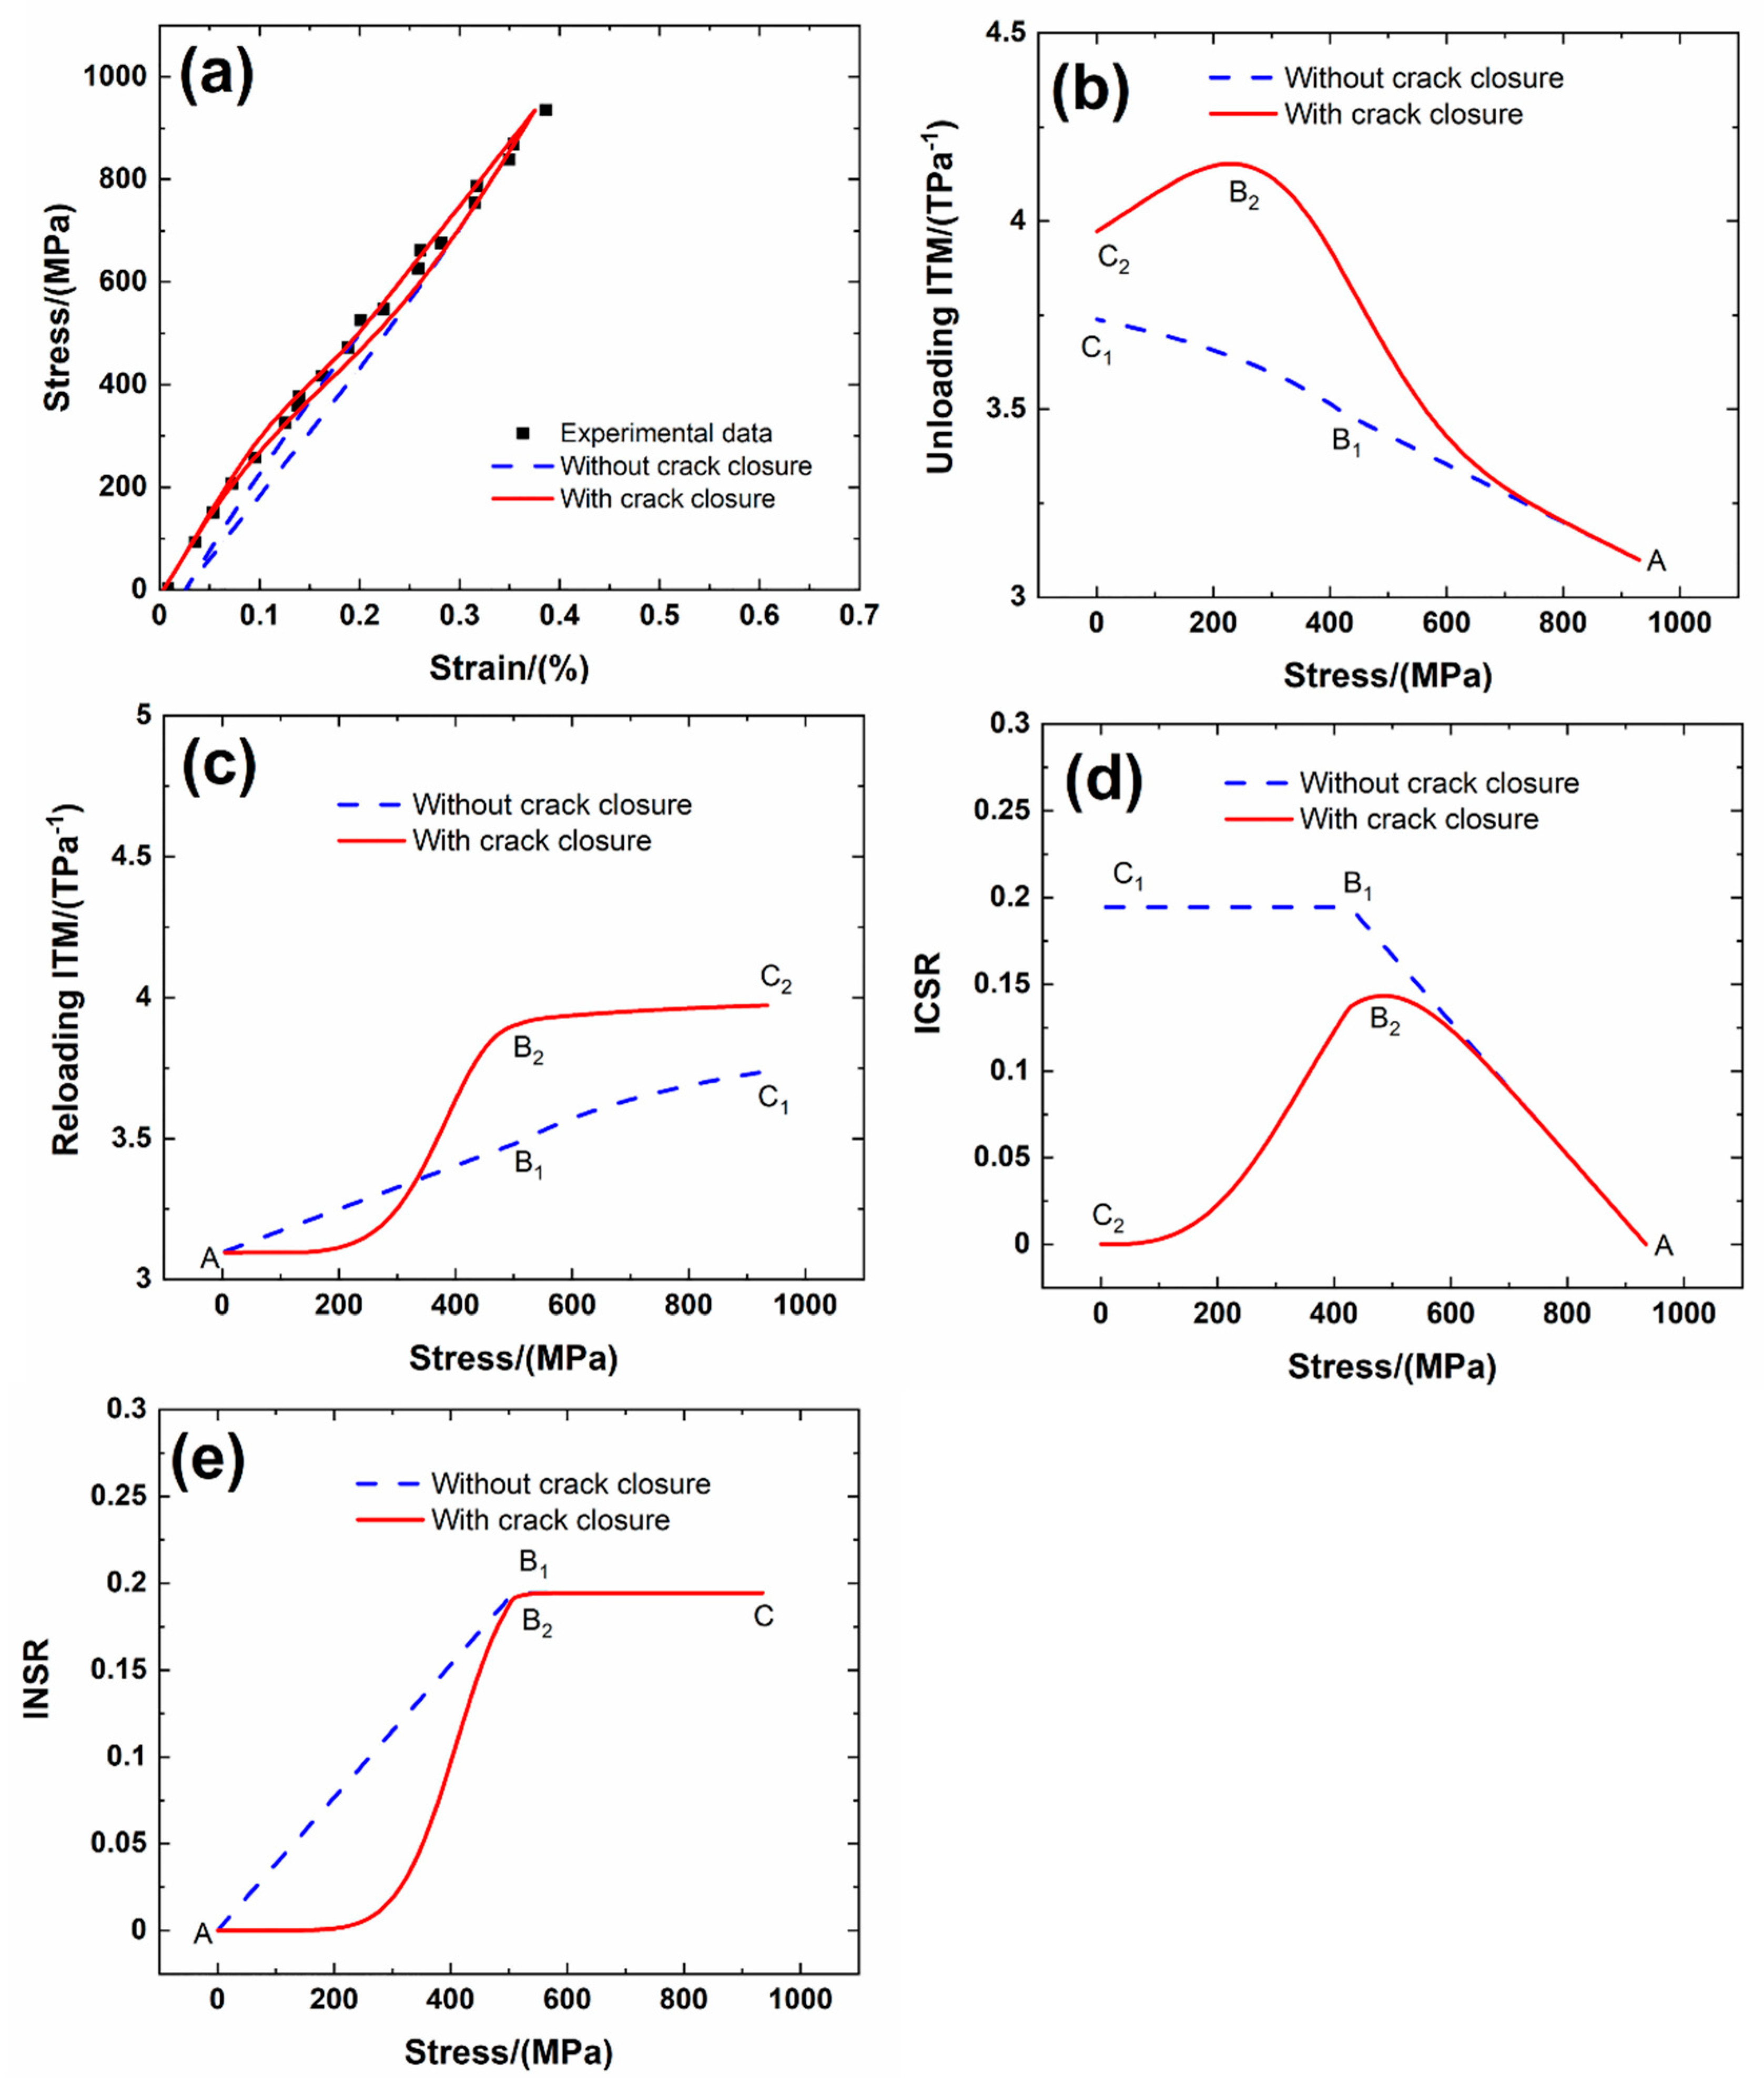
- Under σmax = 935 MPa, when the closure of matrix fragmentation is not considered, the unloading ITM increases with unloading stress due to internal damage of interface debonding and counter sliding, i.e., from ITM = 3.1 TPa−1 at the tensile peak stress σmax = 935 MPa to ITM = 3.48 TPa−1 at the unloading transition stress σtr_unloading = 427 MPa (i.e., A–B1 in Figure 2b), and then increases to ITM = 3.73 TPa−1 at the valley stress σmin = zero MPa (i.e., B1–C1 in Figure 2b); the reloading ITM increases with reloading stress due to internal damage of interface debonding and new sliding, i.e., from ITM = 3.1 TPa−1 at the valley stress σmin = zero MPa to ITM = 3.48 TPa−1 at the reloading transition stress σtr_reloading = 508 MPa (i.e., A–B1 in Figure 2c), and increases to ITM = 3.73 TPa−1 at the tensile peak stress σmax = 935 MPa (i.e., B1–C1 in Figure 2c); the unloading ICSR increases with unloading stress due to the increase of interface counter slip length, i.e., from ICSR = zero at the tensile peak stress σmax = 935 MPa to ICSR = 0.194 at the unloading transition stress σtr_unloading = 427 MPa (i.e., A–B1 in Figure 2d), and remains constant till the unloading valley stress σmin = zero MPa (i.e., B1–C1 in Figure 2d); and the reloading INSR increases with reloading stress due to the increase of the interface new slip length, i.e., from INSR = zero at the valley stress σmin = zero MPa to INSR = 0.194 at the reloading transition stress σtr_reloading = 508 MPa (i.e., A–B2 in Figure 2e), and then remains constant till the tensile peak stress σmax = 935 MPa (i.e., B2–C in Figure 2e).
- (b)
- Considering the closure of matrix fragmentation, the unloading ITM increases with unloading stress due to internal damage of interface debonding and counter sliding, i.e., from ITM = 3.1 TPa−1 at the tensile peak stress σmax = 935 MPa to ITM = 4.15 TPa−1 at the unloading stress σunloading = 229 MPa (i.e., A–B2 in Figure 2b), and then decreases to ITM = 3.97 TPa−1 at the valley stress σmin = zero MPa (i.e., B2–C2 in Figure 2b); the reloading ITM increases with reloading stress due to internal damage of interface debonding and new sliding, i.e., from ITM = 3.1 TPa−1 at the valley stress σmin = zero MPa to ITM = 3.9 TPa−1 at the reloading stress σreloading = 508 MPa (i.e., A–B2 in Figure 2c), and increases slowly to ITM = 3.97 TPa−1 at the tensile peak stress σmax = 935 MPa (i.e., B2–C in Figure 2c); the unloading ICSR increases with unloading stress due to the increase of interface counter slip length, i.e., from ICSR = zero at the tensile peak stress σmax = 935 MPa to ICSR = 0.143 at the unloading stress σunloading = 486 MPa (i.e., A–B2 in Figure 2d), and decreases to ICSR = zero the valley stress σmin = zero MPa (i.e., B2–C2 in Figure 2d); and the reloading INSR increases with reloading stress due to the increase of the interface new slip length, i.e., from INSR = zero at the valley stress σmin = zero MPa to INSR = 0.194 at the reloading stress σreloading = 589 MPa (i.e., A–B2 in Figure 2e), and then remains constant till the peak stress σmax = 935 MPa (i.e., B2–C in Figure 2e).
3.2. Prediction of Fatigue Hysteresis Loops of Unidirectional SiC/SiC Composite
- (a)
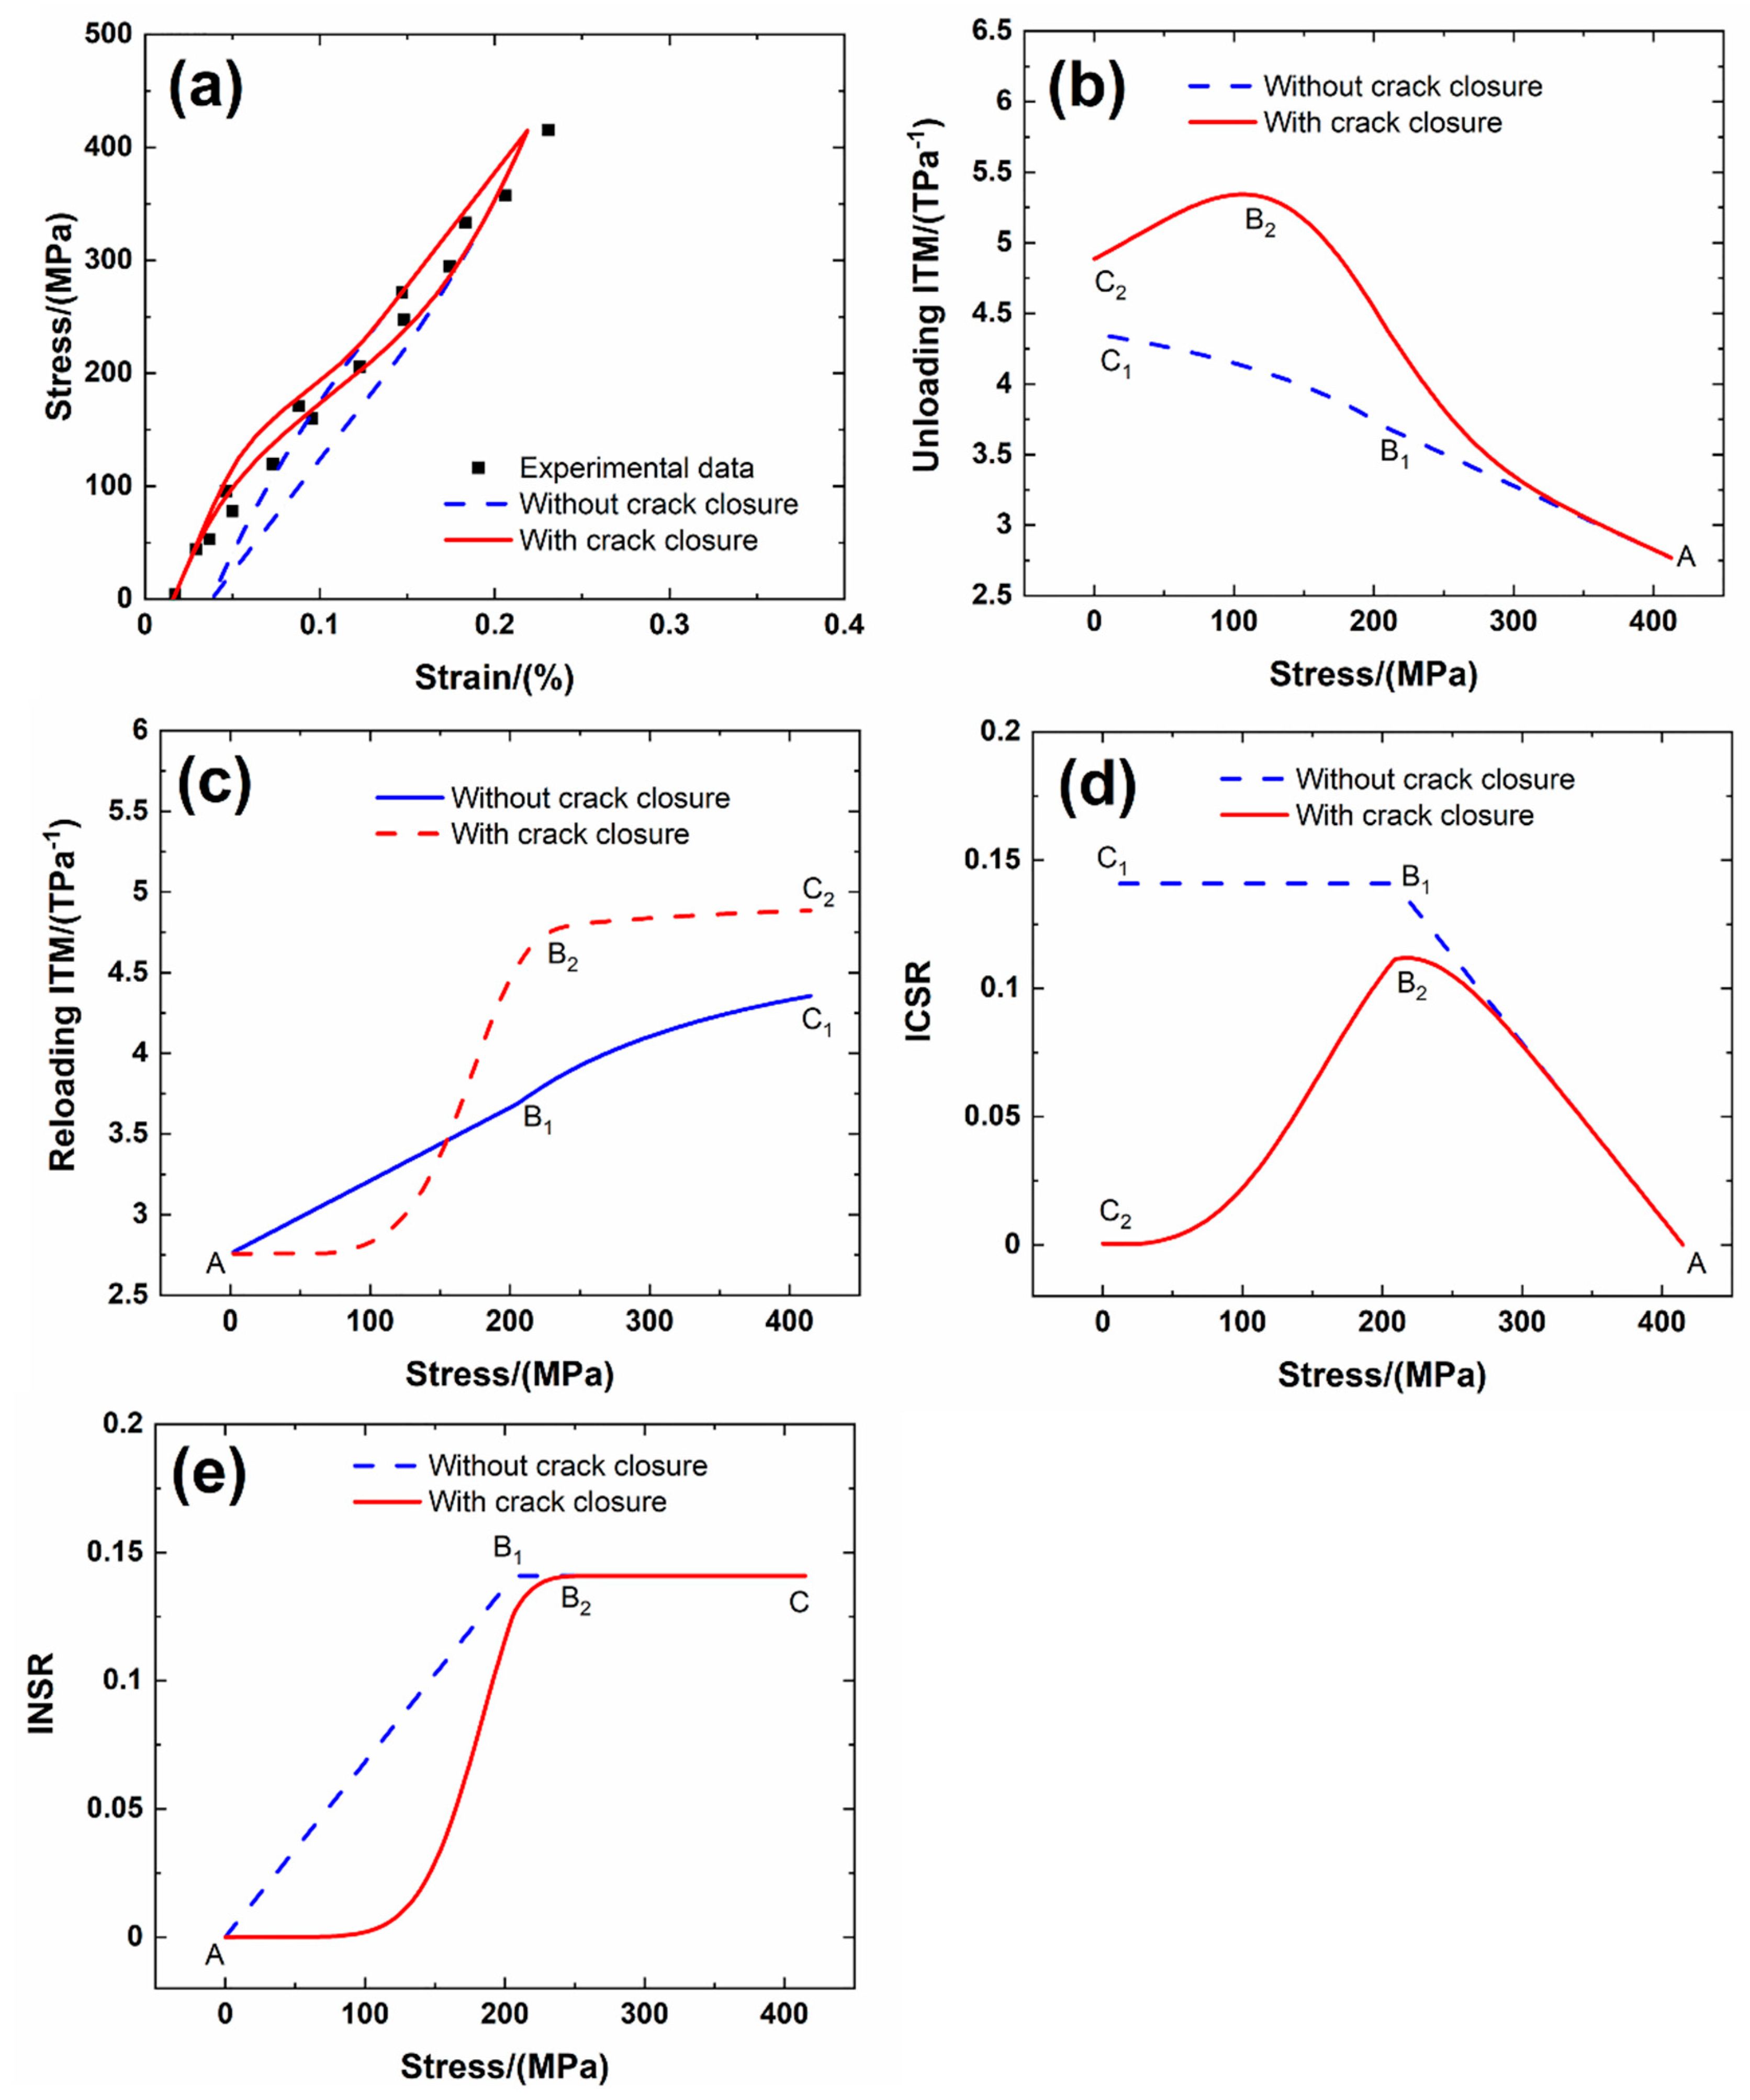
- Under σmax = 415 MPa, when the closure of matrix fragmentation is not considered, the unloading ITM increases with unloading stress due to internal damage of interface debonding and counter sliding, i.e., from ITM = 2.76 TPa−1 at the tensile peak stress σmax = 415 MPa to ITM = 3.68 TPa−1 at the unloading transition stress σtr_unloading = 209 MPa (i.e., A–B1 in Figure 3b), and then increases to ITM = 4.35 TPa−1 at the valley stress σmin = zero MPa (i.e., B1–C1 in Figure 3b); the reloading ITM increases with reloading stress due to internal damage of interface debonding and new sliding, i.e., from ITM = 2.76 TPa−1 at the valley stress σmin = zero MPa to ITM = 3.68 TPa−1 at the reloading transition stress σtr_reloading = 206 MPa (i.e., A–B1 in Figure 3c), and increases to ITM = 4.35 TPa−1 at the tensile peak stress σmax = 415 MPa (i.e., B1–C1 in Figure 3c); the unloading ICSR increases with unloading stress due to the increase of interface counter slip length, i.e., from ICSR = zero at the tensile peak stress σmax = 415 MPa to ICSR = 0.14 at the unloading transition stress σtr_unloading = 209 MPa (i.e., A–B1 in Figure 3d), and remains constant till the valley stress σmin = zero MPa (i.e., B1–C1 in Figure 3d); and the reloading INSR increases with reloading stress due to the increase of the interface new slip length, i.e., from INSR = zero at the valley stress σmin = zero MPa to INSR = 0.14 at the reloading transition stress σtr_reloading = 206 MPa (i.e., A–B1 in Figure 3e), and then remains constant till the tensile peak stress σmax = 415 MPa (i.e., B1–C in Figure 3e).
- (b)
- When the closure of matrix fragmentation is considered, the unloading ITM increases with unloading stress due to internal damage of interface debonding and counter sliding, i.e., from ITM = 2.76 TPa−1 at the peak stress σmax = 415 MPa to ITM = 5.34 TPa−1 at the unloading stress σunloading = 105.8 MPa (i.e., A–B2 in Figure 3b), and then decreases to ITM = 4.88 TPa−1 at the valley stress σmin = zero MPa (i.e., B2–C2 in Figure 3b); the reloading ITM increases with reloading stress due to internal damage of interface debonding and new sliding, i.e., from ITM = 2.75 TPa−1 at the valley stress σmin = zero MPa to ITM = 4.53 TPa−1 at the reloading stress σreloading = 206 MPa (i.e., A–B2 in Figure 3c), and increases slowly to ITM = 4.88 TPa−1 at the tensile peak stress σmax = 415 MPa (i.e., B2–C2 in Figure 3c); the unloading ICSR increases with unloading stress due to the increase of the interface counter slip length, i.e., from ICSR = zero at the tensile peak stress σmax = 415 MPa to ICSR = 0.11 at the unloading stress σunloading = 217.8 MPa (i.e., A–B2 in Figure 3d), and decreases to ICSR = zero the valley stress σmin = zero MPa (i.e., B2–C2 in Figure 3d); and the reloading INSR increases with reloading stress due to the increase of the interface new slip length, i.e., from INSR = zero at the valley stress σmin = zero MPa to INSR = 0.14 at the reloading stress σreloading = 236 MPa (i.e., A–B2 in Figure 3e), and then remains constant till the tensile peak stress σmax = 415 MPa (i.e., B2–C in Figure 3e).
3.3. Prediction of Fatigue Hysteresis Loops of Cross-Ply SiC/SiC Composite
- (a)
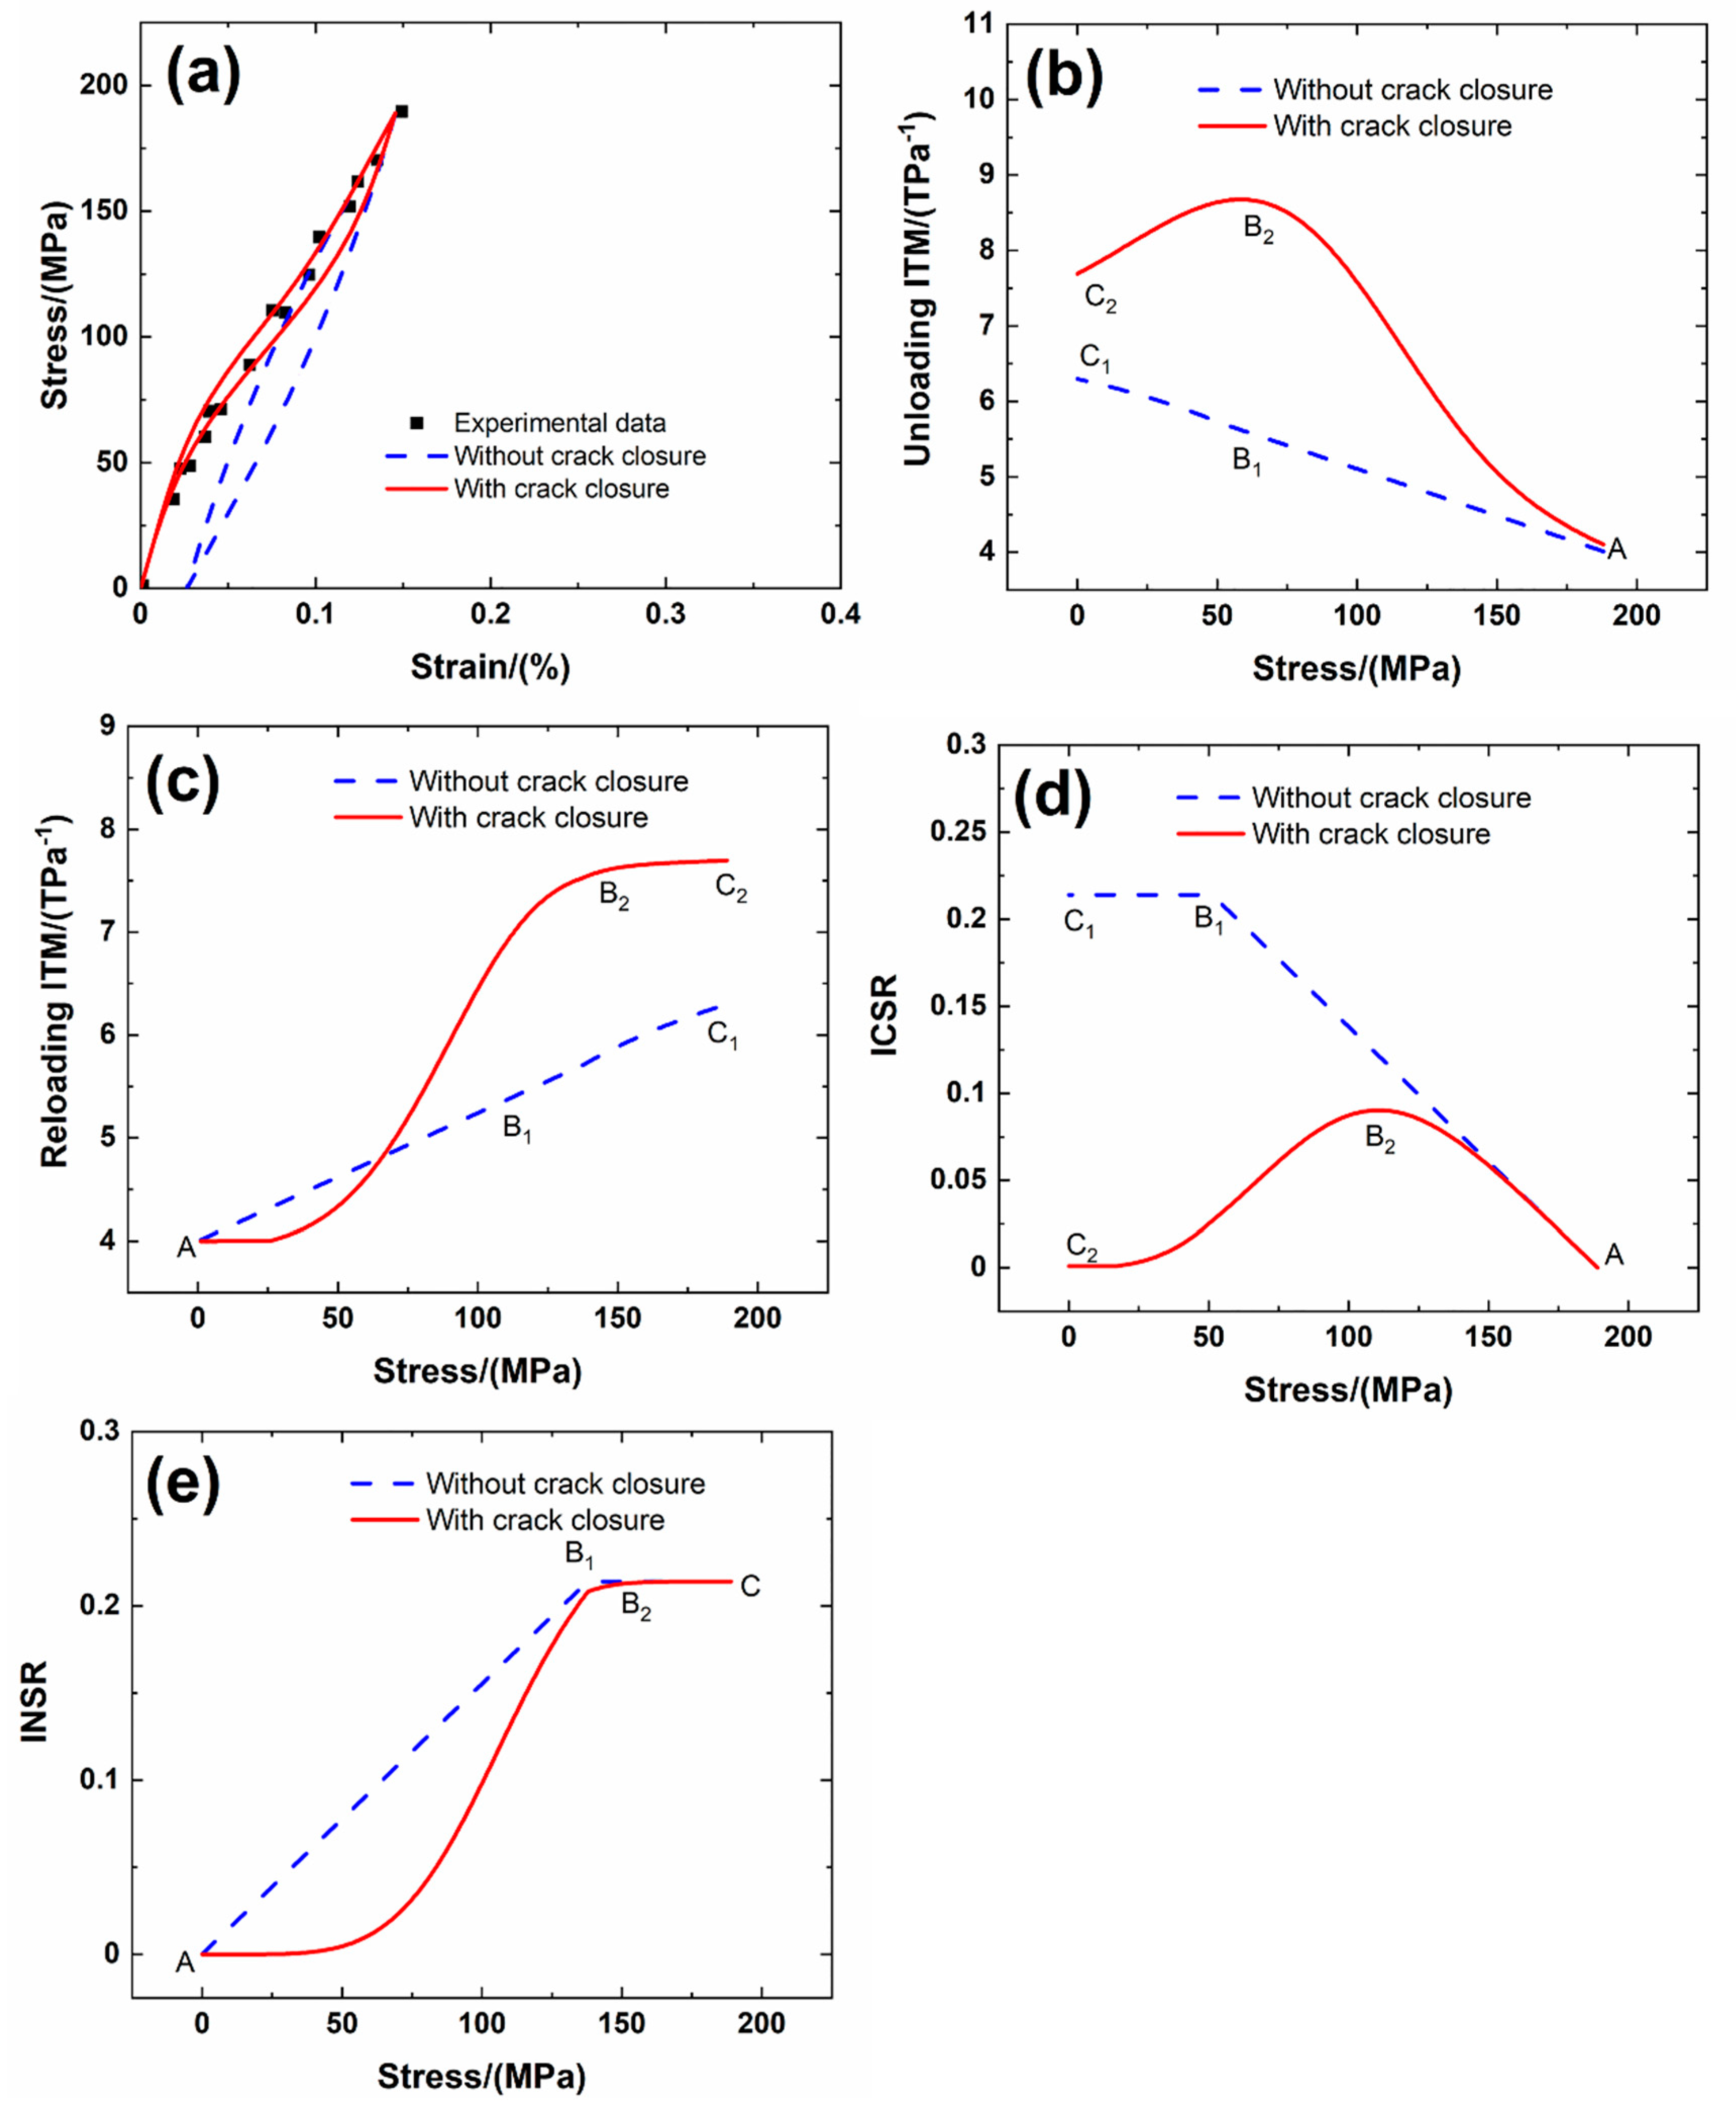
- Under σmax = 189 MPa, when the closure of matrix fragmentation is not considered, the unloading ITM increases with unloading stress due to internal damage of interface debonding and counter sliding, i.e., from ITM = 4.01 TPa−1 at the tensile peak stress σmax = 189 MPa to ITM = 5.7 TPa−1 at the transition stress σtr_unloading = 52 MPa (i.e., A–B1 in Figure 4b), and then increases to ITM = 6.29 TPa−1 at the valley stress σmin = zero MPa (i.e., B1–C1 in Figure 4b); the reloading ITM increases with reloading stress due to internal damage of interface debonding and new sliding, i.e., from ITM = 4.01 TPa−1 at the valley stress σmin = zero MPa to ITM = 5.7 TPa−1 at the reloading transition stress σtr_reloading = 137 MPa (i.e., A–B1 in Figure 4c), and increases to ITM = 6.29 TPa−1 at the tensile peak stress σmax = 189 MPa (i.e., B1–C1 in Figure 4c); the unloading ICSR increases with unloading stress due to the increase of the interface counter slip length, i.e., from ICSR = zero at the tensile peak stress σmax = 189 MPa to ICSR = 0.214 at the unloading transition stress σtr_unloading = 52 MPa (i.e., A–B1 in Figure 4d), and remains constant till the valley stress σmin = zero MPa (i.e., B1–C1 in Figure 4d); and the reloading INSR increases with reloading stress due to the increase of the interface new slip length, i.e., from INSR = zero at the valley stress σmin = zero MPa to INSR = 0.214 at the transition stress σtr_reloading = 137 MPa (i.e., A–B1 in Figure 4e), and then remains constant till the peak stress σmax = 189 MPa (i.e., B1–C in Figure 4e).
- (b)
- When the closure of matrix fragmentation is considered, the unloading ITM increases with unloading stress due to internal damage of interface debonding and counter sliding, i.e., from ITM = 4.01 TPa−1 at the tensile peak stress σmax = 189 MPa to ITM = 8.67 TPa−1 at the unloading stress σunloading = 58.6 MPa (i.e., A–B2 in Figure 4b), and then decreases to ITM = 7.69 TPa−1 at the valley stress σmin = zero MPa (i.e., B2–C2 in Figure 4b); the reloading ITM increases with reloading stress due to internal damage of interface debonding and new sliding, i.e., from ITM = 4 TPa−1 at the valley stress σmin = zero MPa to ITM = 7.52 TPa−1 at the reloading stress σreloading = 137 MPa (i.e., A–B2 in Figure 4c), and increases slowly to ITM = 7.69 TPa−1 at the tensile peak stress σmax = 189 MPa (i.e., B2–C2 in Figure 4c); the unloading ICSR increases with unloading stress due to the increase of the interface counter slip length, i.e., from ICSR = zero at the peak stress σmax = 189 MPa to ICSR = 0.09 at the unloading stress σunloading = 110 MPa (i.e., A–B2 in Figure 4d), and decreases to ICSR = zero the valley stress σmin = zero MPa (i.e., B2–C2 in Figure 4d); and the reloading INSR increases with reloading stress due to the increase of the interface new slip length, i.e., from INSR = zero at the valley stress σmin = zero MPa to INSR = 0.214 at the reloading stress σreloading = 164 MPa (i.e., A–B2 in Figure 4e), and then remains constant till the peak stress σmax = 189 MPa (i.e., B2–C in Figure 4e).
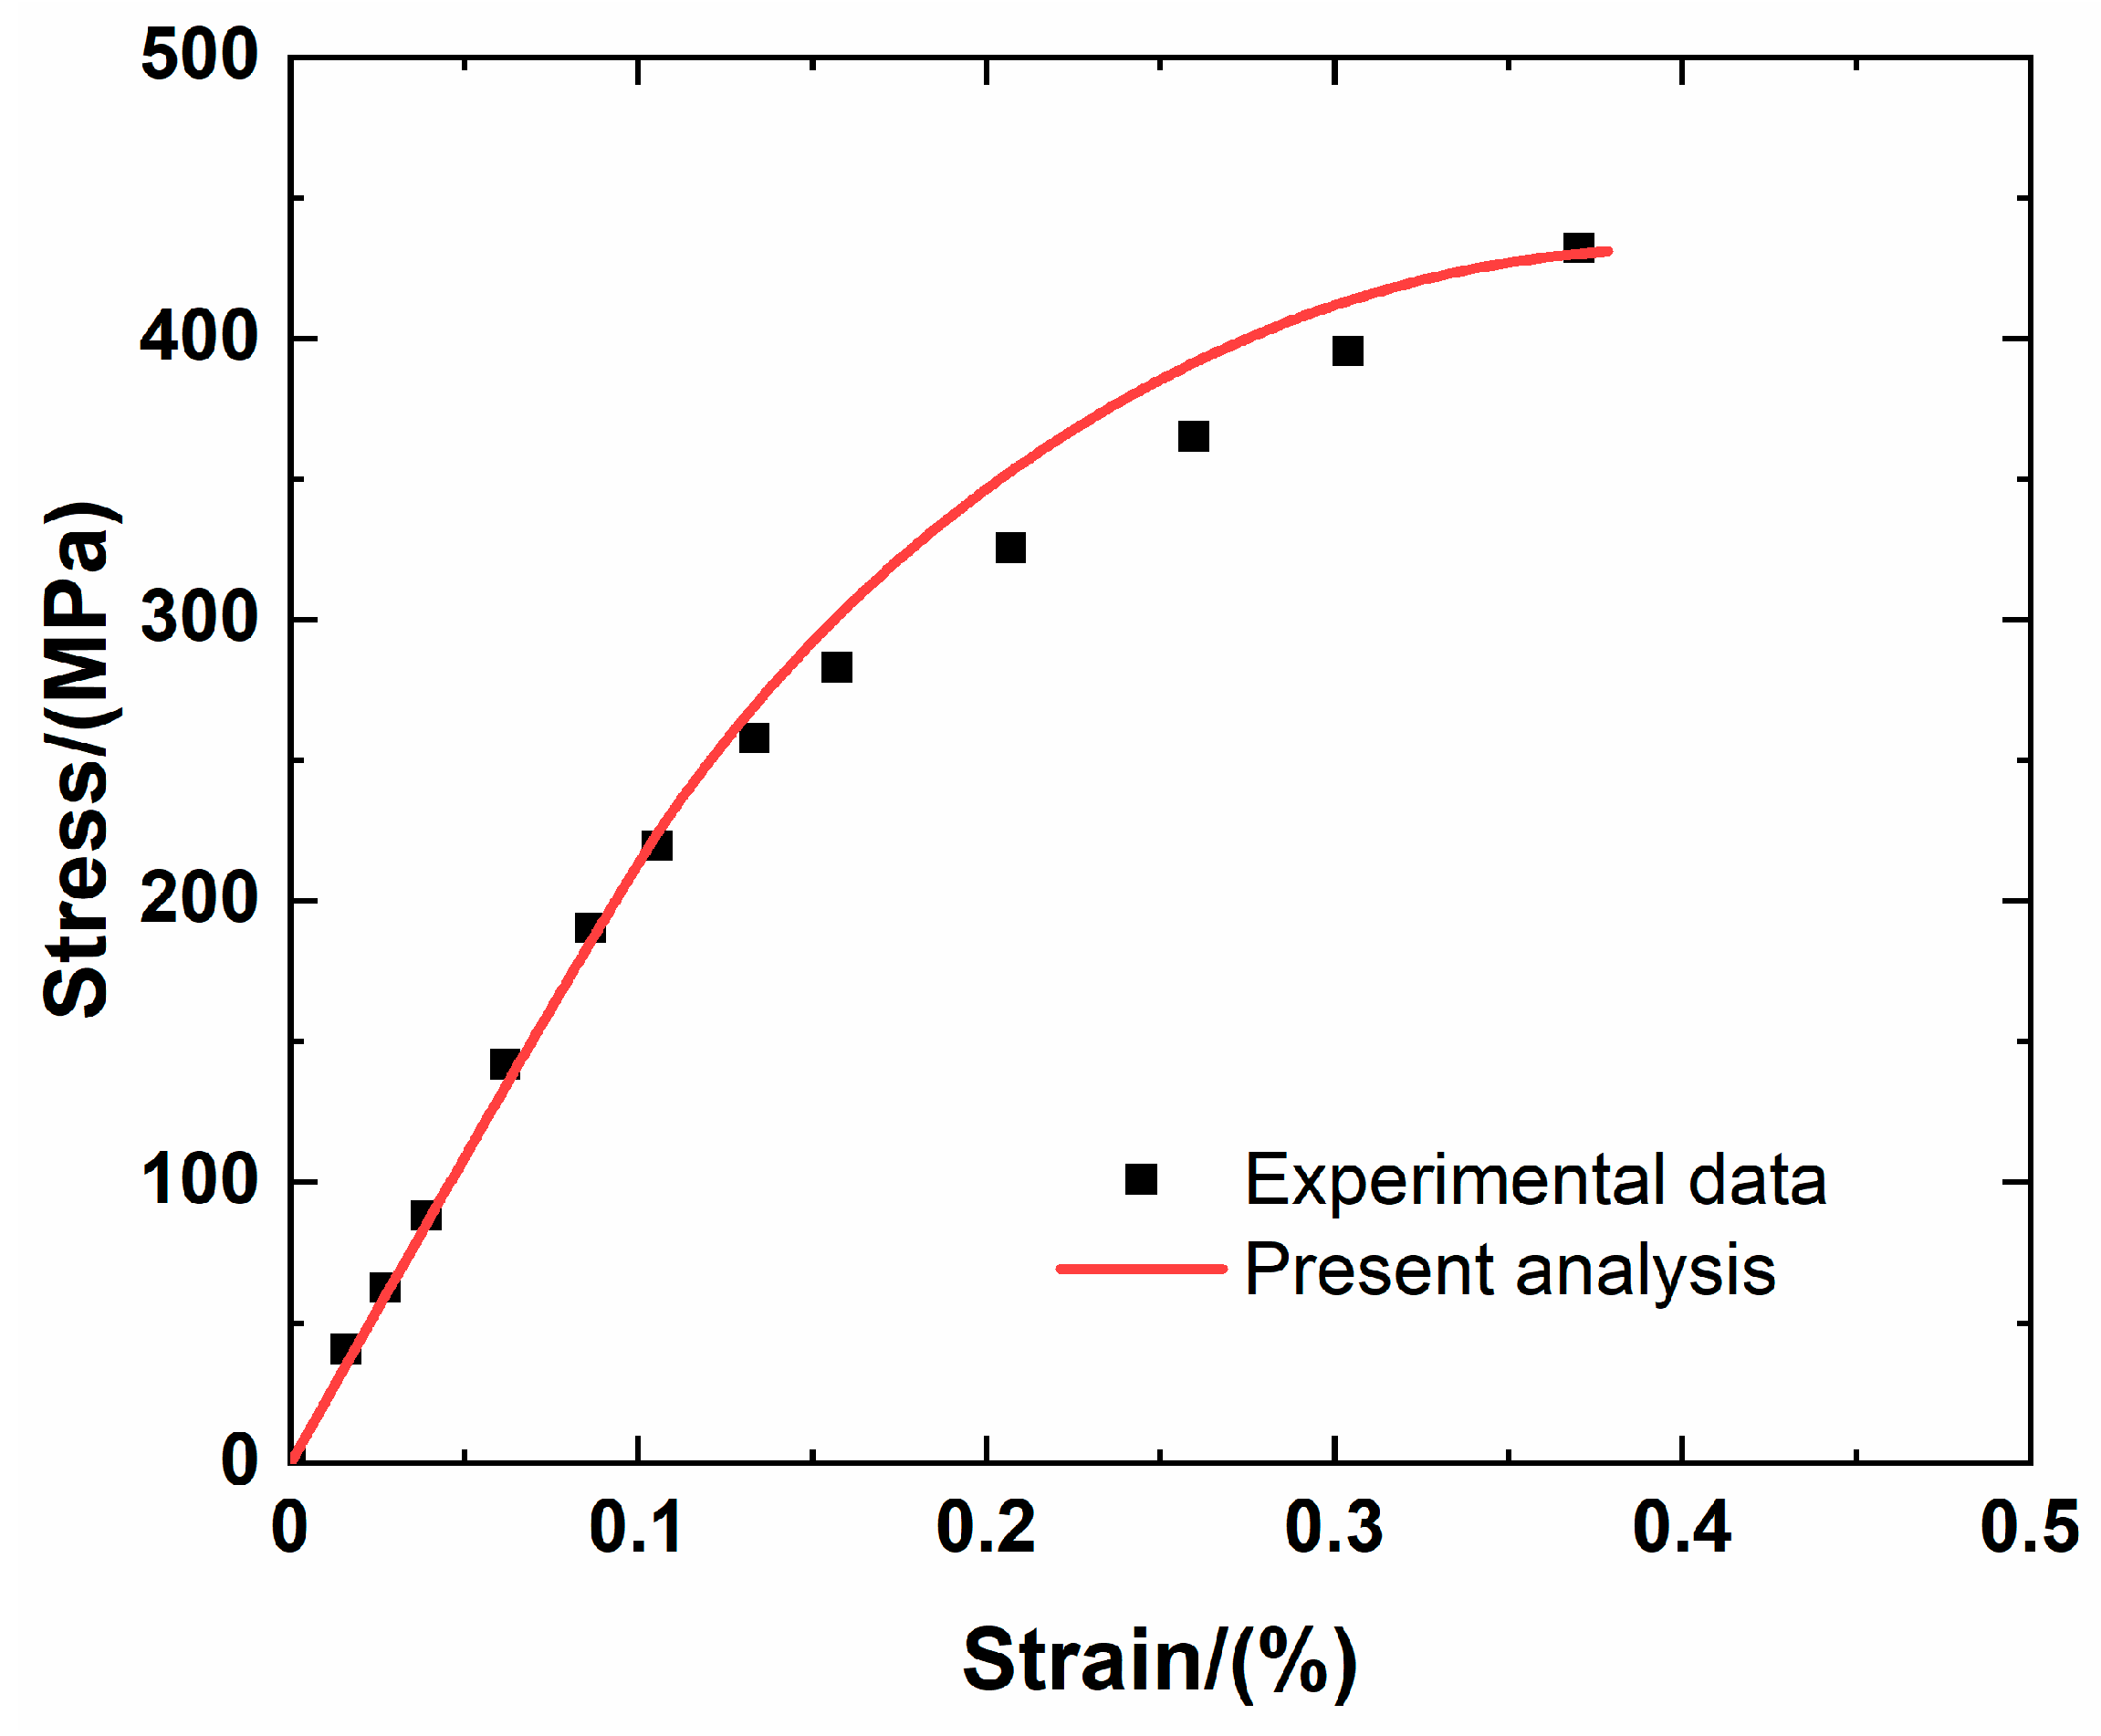
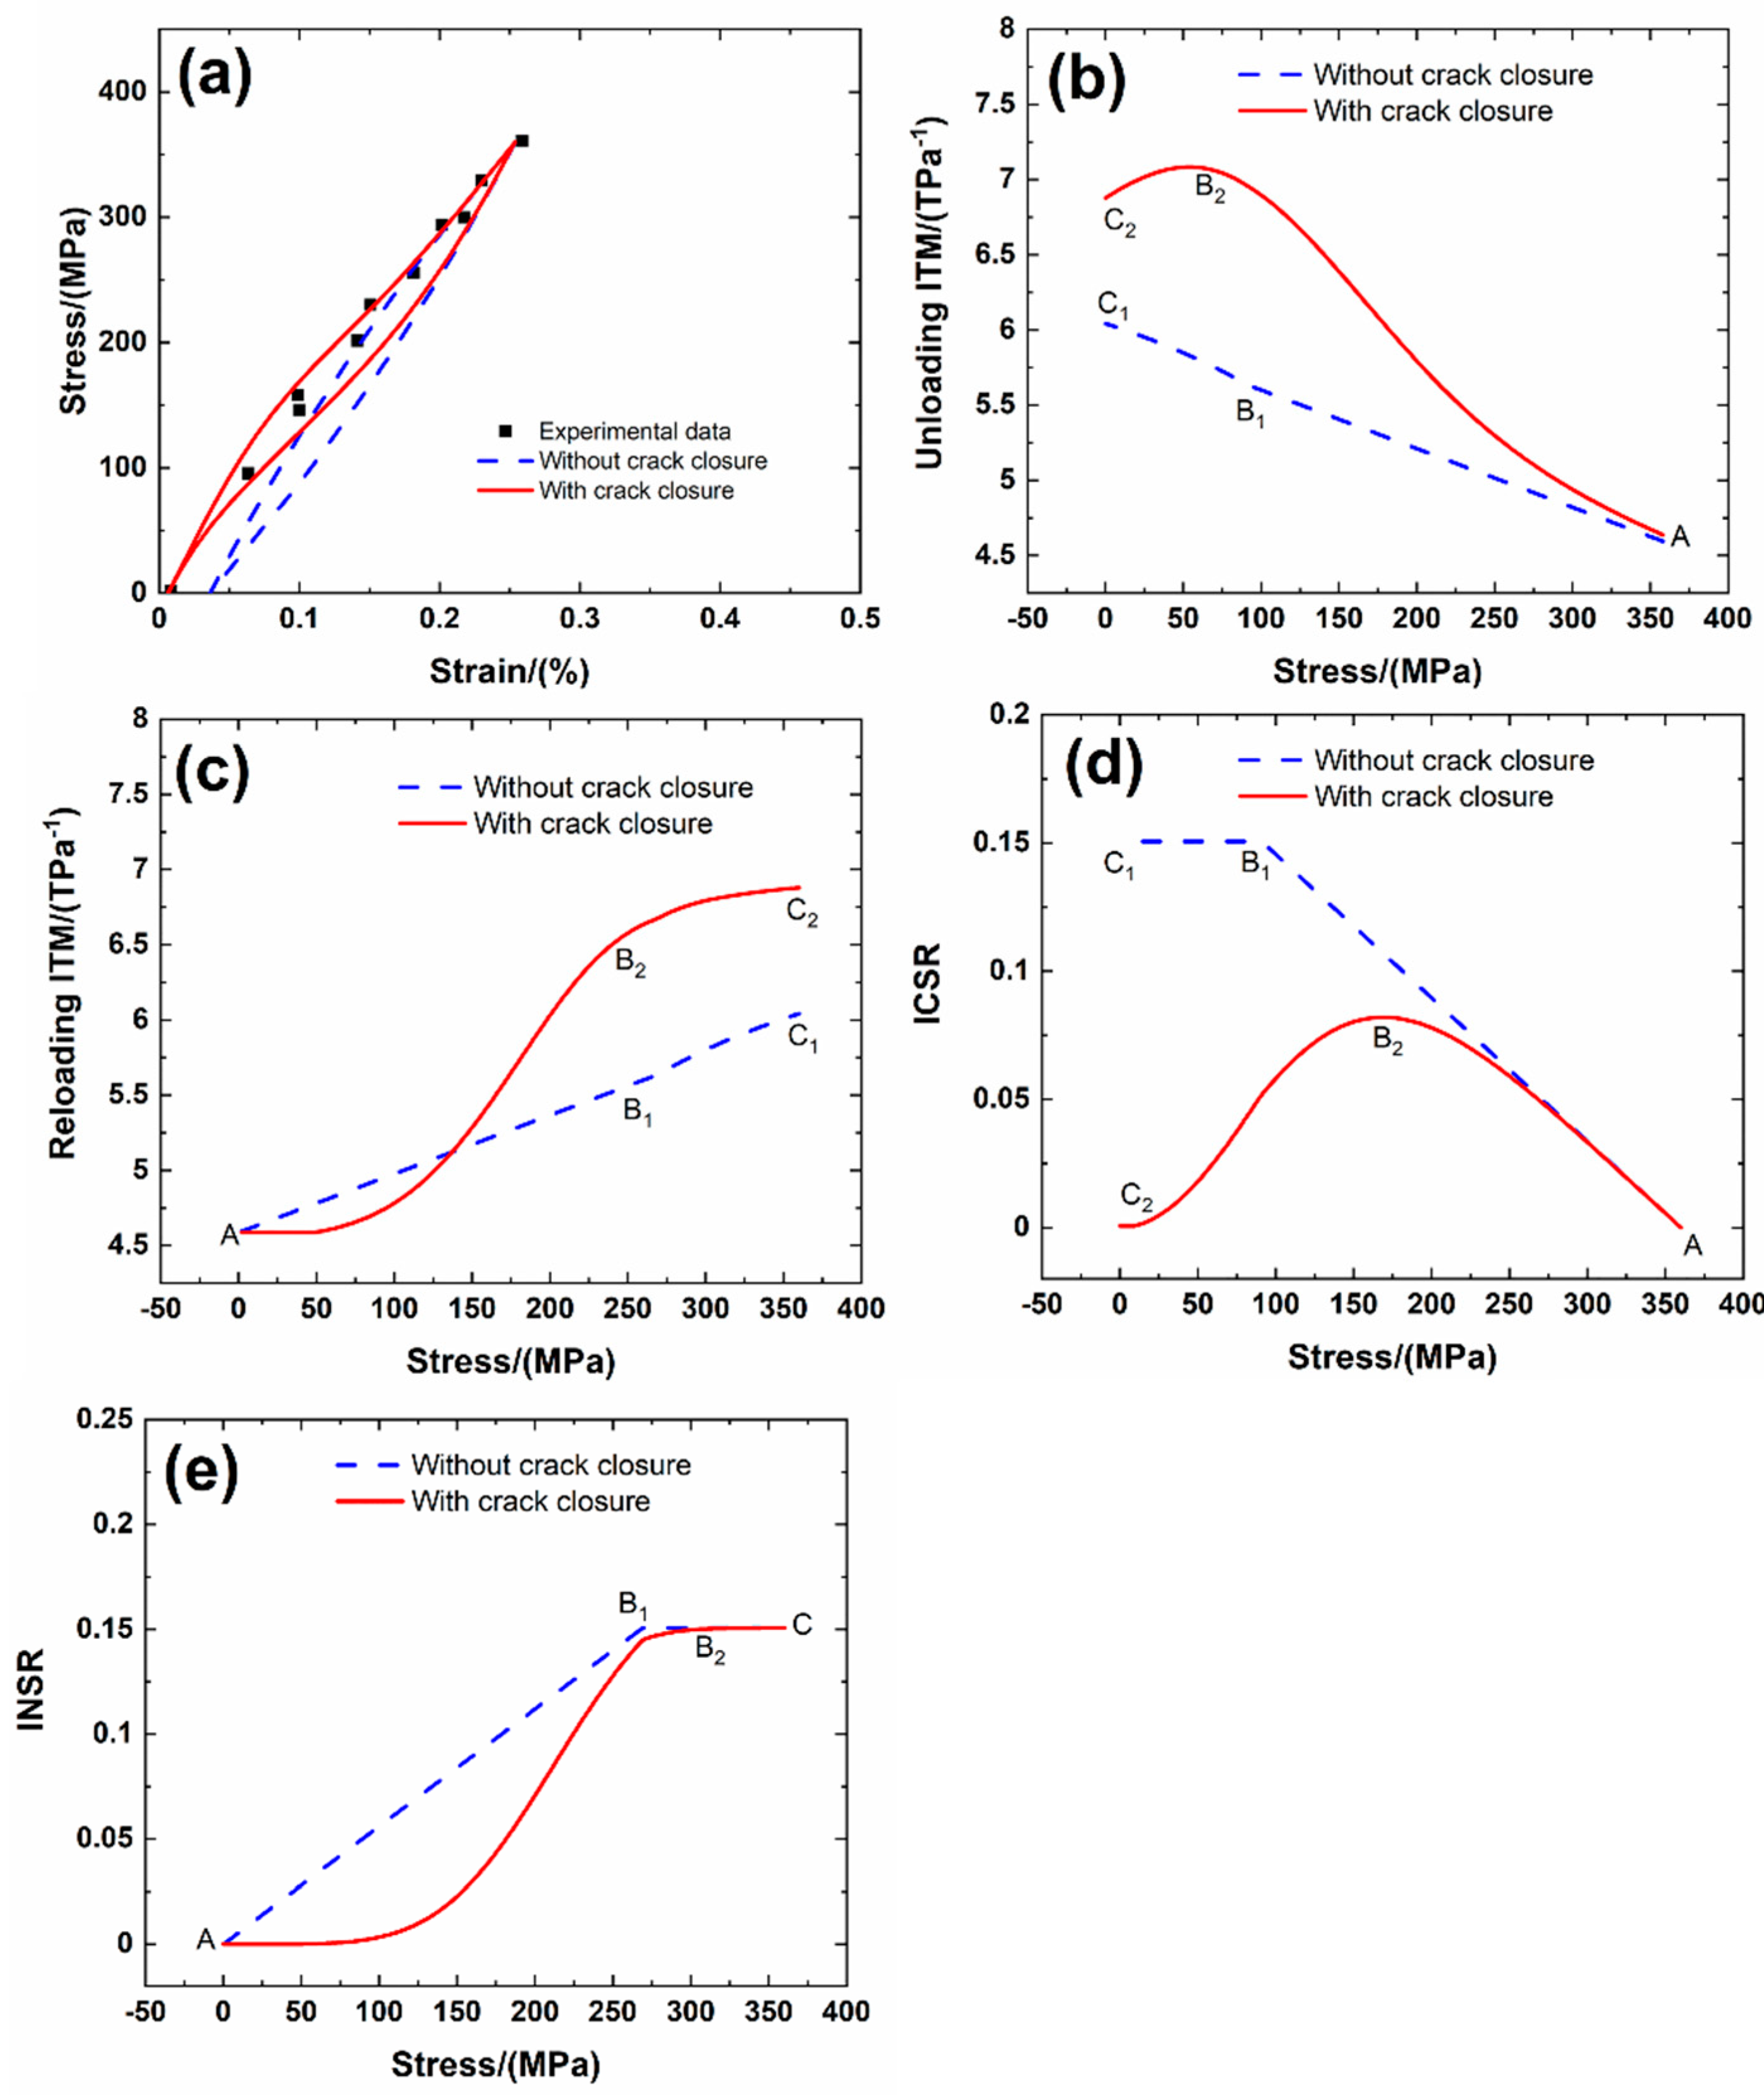
3.4. Prediction of Tensile and Fatigue Hysteresis Loops of 2D Plain-Woven SiC/SiC Composite
- (a)
- Under σmax = 360 MPa, when the closure of matrix fragmentation is not considered, the unloading ITM increases with unloading stress due to internal damage of interface debonding and counter sliding, i.e., from ITM = 4.59 TPa−1 at the peak stress σmax = 360 MPa to ITM = 5.63 TPa−1 at the unloading transition stress σtr_unloading = 91 MPa (i.e., A–B1 in Figure 6b), and then increases to ITM = 6.04 TPa−1 at the valley stress σmin = zero MPa (i.e., B1–C1 in Figure 6b); the reloading ITM increases with reloading stress due to internal damage of interface debonding and new sliding, i.e., from ITM = 4.59 TPa−1 at the valley stress σmin = zero MPa to ITM = 5.63 TPa−1 at the reloading transition stress σtr_reloading = 269 MPa (i.e., A–B1 in Figure 6c), and increases to ITM = 6.04 TPa−1 at the tensile peak stress σmax = 360 MPa (i.e., B1–C1 in Figure 6c); the unloading ICSR increases with unloading stress due to the increase of the interface counter slip length, i.e., from ICSR = zero at the tensile peak stress σmax = 360 MPa to ICSR = 0.15 at the unloading transition stress σtr_unloading = 91 MPa (i.e., A–B1 in Figure 6d), and remains constant till the valley stress σmin = zero MPa (i.e., B1–C1 in Figure 6d); and the reloading INSR increases with reloading stress due to the increase of the interface new slip length, i.e., from INSR = zero at the valley stress σmin = zero MPa to INSR = 0.15 at the reloading transition stress σtr_reloading = 269 MPa (i.e., A–B1 in Figure 6e), and then remains constant till the tensile peak stress σmax = 360 MPa (i.e., B1–C in Figure 6e).
- (b)
- When the closure of matrix fragmentation is considered, the unloading ITM increases with unloading stress due to internal damage of interface debonding and counter sliding, i.e., from ITM = 4.63 TPa−1 at the tensile peak stress σmax = 360 MPa to ITM = 7.08 TPa−1 at the unloading stress σunloading = 54 MPa (i.e., A–B2 in Figure 6b), and then decreases to ITM = 6.87 TPa−1 at the valley stress σmin = zero MPa (i.e., B2–C2 in Figure 6b); the reloading ITM increases with reloading stress due to internal damage of interface debonding and new sliding, i.e., from ITM = 4.58 TPa−1 at the valley stress σmin = zero MPa to ITM = 6.67 TPa−1 at the reloading stress σreloading = 269 MPa (i.e., A–B2 in Figure 6c), and increases slowly to ITM = 6.88 TPa−1 at the tensile peak stress σmax = 360 MPa (i.e., B2–C2 in Figure 6c); the unloading ICSR increases with unloading stress due to the increase of the interface counter slip length, i.e., from ICSR = zero at the peak stress σmax = 360 MPa to ICSR = 0.082 at the unloading stress σunloading = 169 MPa (i.e., A–B2 in Figure 6d), and decreases to ICSR = zero the valley stress σmin = zero MPa (i.e., B2–C2 in Figure 6d); and the reloading INSR increases with reloading stress due to the increase of the interface new slip length, i.e., from INSR = zero at the valley stress σmin = zero MPa to INSR = 0.15 at the reloading stress σreloading = 307 MPa (i.e., A–B2 in Figure 6e), and then remains constant till the peak stress σmax = 360 MPa (i.e., B2–C in Figure 6e).
3.5. Comparative Analysis
- ▪
- For mini-SiC/SiC composite with the fiber’ volume of Vf = 0.43, when the tensile peak stress increases from σmax = 890 to 1078 MPa, the unloading peak ITM increases from ITM = 3.58 to 5.18 TPa−1; the reloading ITM increases from ITM = 3.486 to 4.87 TPa−1.
- ▪
- For cross-ply SiC/SiC composite with fiber’s volume of Vf = 0.25, when the peak stress increases from σmax = 189 to 206 MPa, the unloading ITM increases from ITM = 8.67 to 10.32 TPa−1; the reloading ITM increases from ITM = 7.69 to 9.68 TPa−1.
- ▪
- For mini-SiC/SiC composite with the fiber’ volume of Vf = 0.43, when the tensile peak stress increases from σmax = 890 to 1078 MPa, the interface debonding ratio increases from η = 0.075 to 0.38; the unloading peak ICSR increases from 0.07 to 0.17; and the reloading peak INSR increases from 0.075 to 0.38.
- ▪
- For unidirectional SiC/SiC composite with fiber’s volume of Vf = 0.25, when the peak stress increases from σmax = 415 to 449 MPa, the interface debonding ratio increases from η = 0.14 to 0.295; the unloading peak ICSR increases from 0.11 to 0.1888; and the reloading peak INSR increases from 0.14 to 0.295.
4. Summary and Conclusions
- (1)
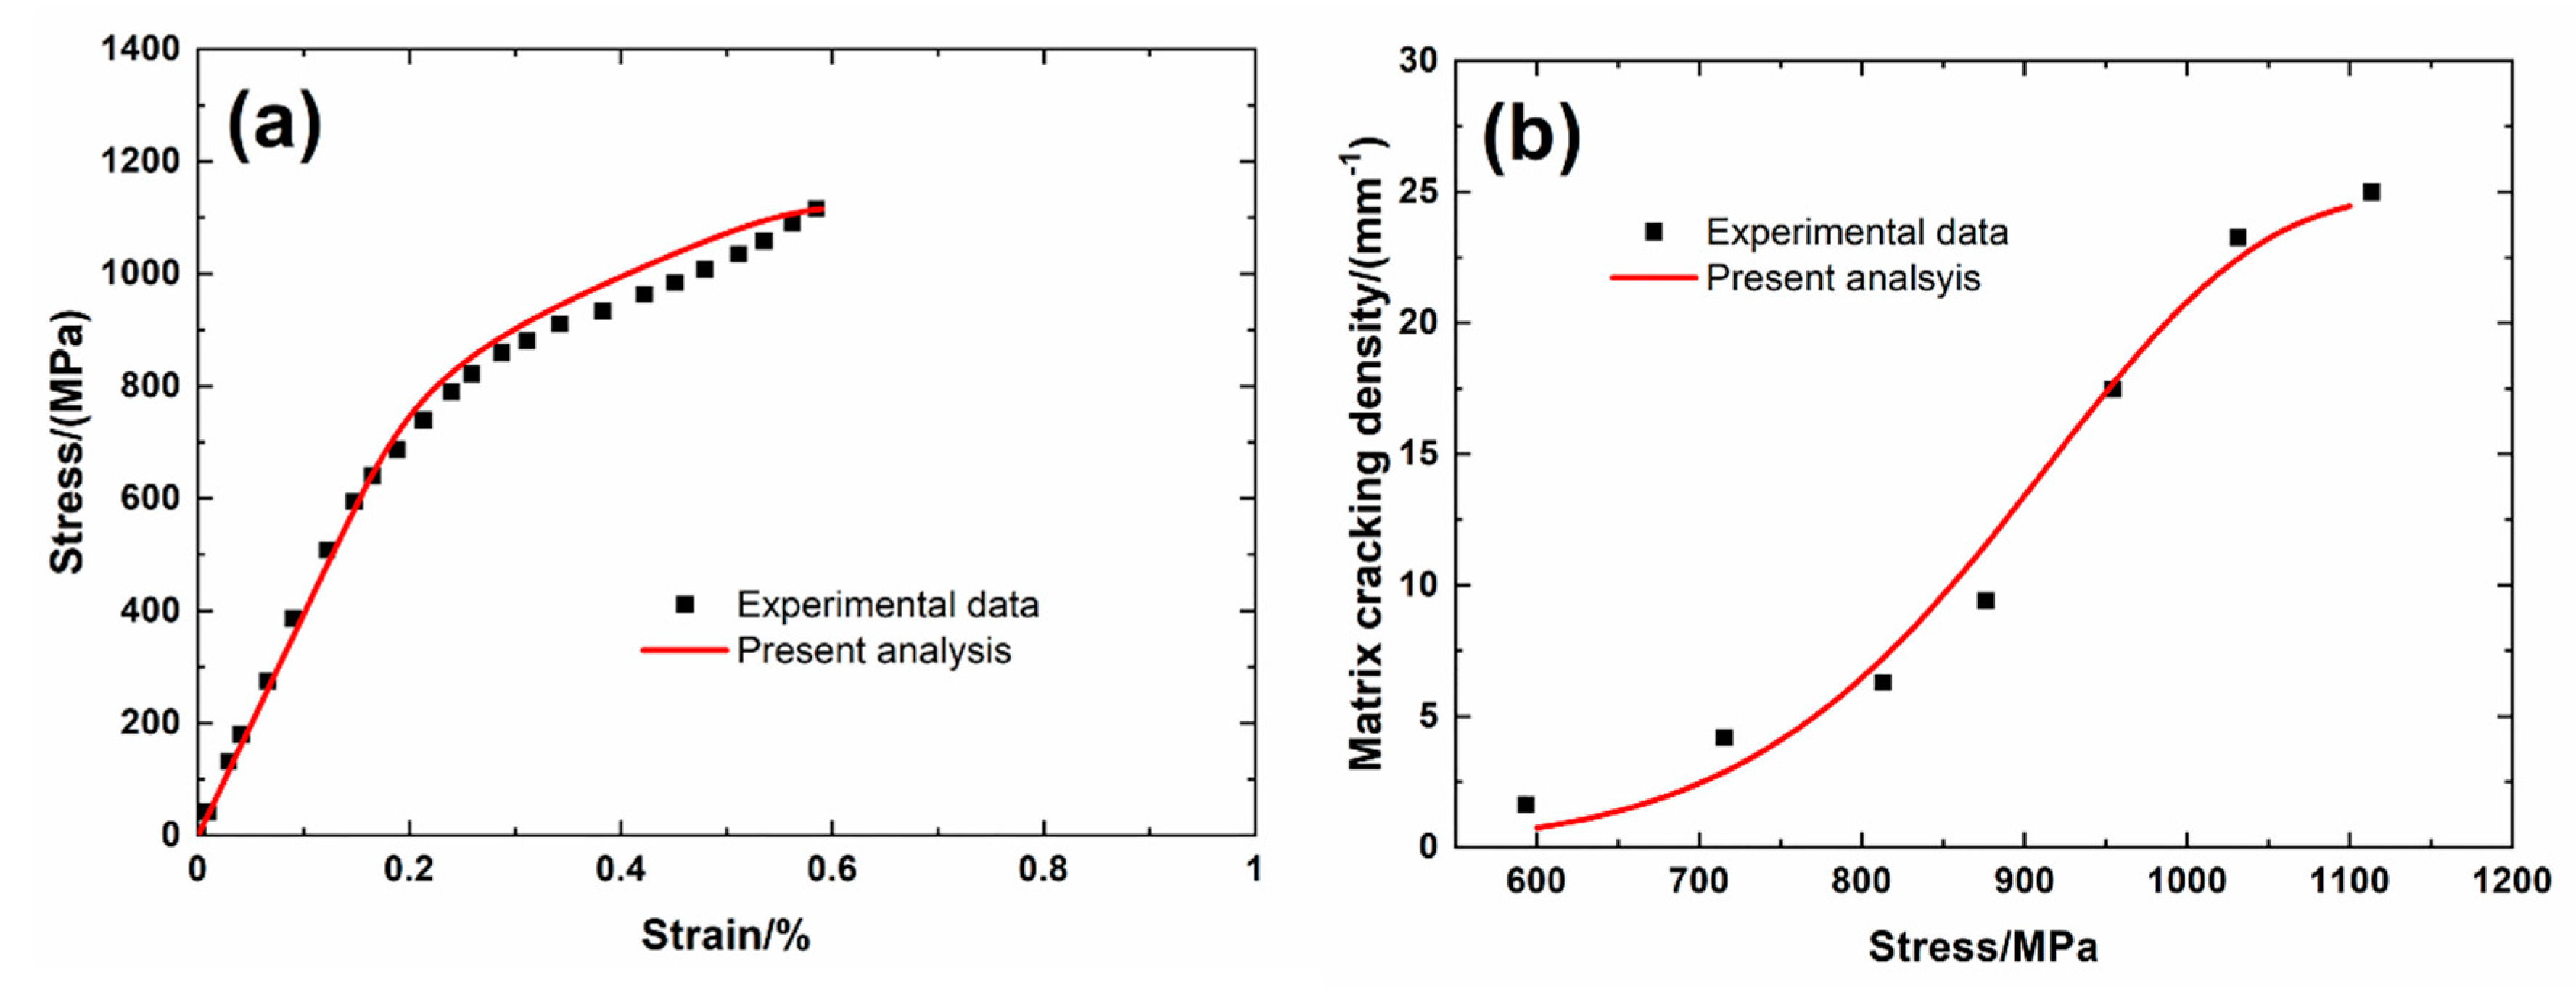
- The Matrix fragmentation density changes with increasing or decreasing tensile stress and affects the tensile nonlinear strain and the interface debonding ratio.
- (2)
- The closure of matrix fragmentation affects the fatigue hysteresis loops. Upon unloading, the inverse tangent modulus increases to the peak value, and then decreases with unloading stress, and the interface counter slip ratio increases to the peak value, and then decreases to zero with unloading stress; upon reloading, the inverse tangent modulus increases with reloading stress, and the interface new slip ratio increases slowly during initial stage of reloading, then increases to the peak value, and remains constant till peak stress.
- (3)
- Theoretical predicted matrix fragmentation density, tensile nonlinear curves, and the fatigue hysteresis loops agreed with experimental data.
Funding
Acknowledgments
Conflicts of Interest
References
- Naslain, R. Design, preparation and properties of non-oxide CMCs for application in engines and nuclear reactors: An overview. Compos. Sci. Technol. 2004, 64, 155–170. [Google Scholar] [CrossRef]
- Li, L.B. Durability of Ceramic Matrix Composites; Woodhead Publishing: Oxford, UK, 2020. [Google Scholar] [CrossRef]
- Li, L.B. High Temperature Mechanical Behavior of Ceramic-Matrix Composites; Wiley-VCH: Weinheim, Germany, 2021. [Google Scholar]
- Li, L.B. Damage and Fracture of Ceramic-Matrix Composites under Stochastic Loading; Springer Nature: Singapore, 2021. [Google Scholar] [CrossRef]
- Li, L.B. Damage, Fracture and Fatigue of Ceramic-Matrix Composite; Springer Nature: Singapore, 2018. [Google Scholar] [CrossRef]
- Li, L.B. Thermomechanical Fatigue of Ceramic-Matrix Composites; Wiley-VCH: Weinheim, Germany, 2019. [Google Scholar]
- Li, L.B. Interfaces of Ceramic-Matrix Composites. Design, Characterization and Damage Effects; Wiley-VCH: Weinheim, Germany, 2020. [Google Scholar]
- Li, L.B. Nonlinear Behavior of Ceramic-Matrix Composites; Woodhead Publishing: Oxford, UK, 2021. [Google Scholar]
- Ikarashi, Y.; Ogasawara, T.; Aoki, T. Micromechanical model of time-dependent damage and deformation behavior for an orthogonal 3D-woven SiC/SiC composite at elevated temperature in vacuum. J. Eur. Ceram. Soc. 2020, 40, 3887–3896. [Google Scholar] [CrossRef]
- Mu, Y.; Zhou, W.; Luo, F.; Zhu, D. Effects of BN/SiC dual-layer interphase on mechanical and dielectric properties of SiCf/SiC composites. Ceram. Int. 2014, 40, 3411–3418. [Google Scholar] [CrossRef]
- Sevener, K.M.; Tracy, J.M.; Chen, Z.; Kiser, J.D.; Daly, S. Crack opening behavior in ceramic matrix composites. J. Am. Ceram. Soc. 2017, 100, 4734–4747. [Google Scholar] [CrossRef]
- Li, L. A micromechanical crack opening displacement model for fiber-reinforced ceramic-matrix composites considering matrix fragmentation. Theor. Appl. Fract. Mech. 2021, 112, 102875. [Google Scholar] [CrossRef]
- Chen, Y.; Gelebart, L.; Chateau, C.; Bornert, M.; King, A.; Sauder, C.; Aimedieu, P. Crack initiation and propagation in braided SiC/SiC composite tubes: Effect of braiding angle. J. Eur. Ceram. Soc. 2020, 40, 4403–4418. [Google Scholar] [CrossRef]
- Longbiao, L. Synergistic effects of fiber debonding and fracture on matrix cracking in fiber-reinforced ceramic-matrix composites. Mater. Sci. Eng. A 2017, 682, 482–490. [Google Scholar] [CrossRef]
- Morscher, G.N.; Baker, C.A.; Smith, C.E. Electrical Resistance of SiC Fiber Reinforced SiC/Si Matrix Composites at Room Temperature during Tensile Testing. Int. J. Appl. Ceram. Technol. 2014, 11, 263–272. [Google Scholar] [CrossRef]
- Goulmy, J.P.; Camus, G.; Rebillat, F. Monitoring damage evolution of ceramic matrix composites during tensile tests using electrical resistivity: Crack density-based electromechanical model. J. Eur. Ceram. Soc. 2021, 41, 121–129. [Google Scholar] [CrossRef]
- Li, L. Modeling matrix fracture in fiber-reinforced ceramic-matrix composites with different fiber preforms. Text. Res. J. 2020, 90, 909–924. [Google Scholar] [CrossRef]
- Curtin, W.; Ahn, B.; Takeda, N. Modeling brittle and tough stress–strain behavior in unidirectional ceramic matrix composites. Acta Mater. 1998, 46, 3409–3420. [Google Scholar] [CrossRef]
- Evans, A.; Zok, F.; McMeeking, R.; Evans, A.; Zok, F.; McMeeking, R. Fatigue of ceramic matrix composites. Acta Met. Mater. 1995, 43, 859–875. [Google Scholar] [CrossRef]
- Reynaud, P. Cyclic fatigue of ceramic-matrix composites at ambient and elevated temperatures. Compos. Sci. Technol. 1996, 56, 809–814. [Google Scholar] [CrossRef]
- Staehler, J.M.; Mall, S.; Zawada, L.P. Frequency dependence of high-cycle fatigue behavior of CVI C/SiC at room temperature. Compos. Sci. Technol. 2003, 63, 2121–2131. [Google Scholar] [CrossRef]
- Ruggles-Wrenn, M.; Christensen, D.; Chamberlain, A.; Lane, J.; Cook, T. Effect of frequency and environment on fatigue behavior of a CVI SiC/SiC ceramic matrix composite at 1200 °C. Compos. Sci. Technol. 2011, 71, 190–196. [Google Scholar] [CrossRef]
- Li, L. Fatigue hysteresis behavior of cross-ply C/SiC ceramic matrix composites at room and elevated temperatures. Mater. Sci. Eng. A 2013, 586, 160–170. [Google Scholar] [CrossRef]
- Longbiao, L. Fatigue hysteresis behavior in fiber-reinforced ceramic-matrix composites at room and elevated temperatures. Ceram. Int. 2017, 43, 2614–2624. [Google Scholar] [CrossRef]
- Longbiao, L. Hysteresis loops of carbon fiber-reinforced ceramic-matrix composites with different fiber preforms. Ceram. Int. 2016, 42, 16535–16551. [Google Scholar] [CrossRef]
- Ahn, B. Strain and hysteresis by stochastic matrix cracking in ceramic matrix composites. J. Mech. Phys. Solids 1997, 45, 177–209. [Google Scholar] [CrossRef]
- Liu, Y.; Li, L.; Zhang, Z.; Wang, Y. Micromechanical modeling cyclic loading/unloading hysteresis loops of 3D needle-punched C/SiC ceramic-matrix composites. Compos. Interfaces 2021, 1–24. [Google Scholar] [CrossRef]
- Li, L. Micromechanical modeling of cyclic non-closure hysteresis loops of fiber-reinforced ceramic-matrix composites considering variable matrix fragmentation density. Mater. Sci. Eng. A 2021, 805, 140795. [Google Scholar] [CrossRef]
- Curtin, W. Multiple matrix cracking in brittle matrix composites. Acta Met. Mater. 1993, 41, 1369–1377. [Google Scholar] [CrossRef]
- Gao, Y.-C.; Mai, Y.-W.; Cotterell, B. Fracture of fiber-reinforced materials. J Appl. Math. Phys. 1988, 39, 550–572. [Google Scholar] [CrossRef]
- Curtin, W.A. Theory of Mechanical Properties of Ceramic-Matrix Composites. J. Am. Ceram. Soc. 1991, 74, 2837–2845. [Google Scholar] [CrossRef]
- Sauder, C.; Brusson, A.; Lamon, J. Influence of Interface Characteristics on the Mechanical Properties of Hi-Nicalon type-S or Tyranno-SA3 Fiber-Reinforced SiC/SiC Minicomposites. Int. J. Appl. Ceram. Technol. 2010, 7, 291–303. [Google Scholar] [CrossRef]
- Domergue, J.-M.; Vagaggini, E.; Evans, A.G. Relationships between Hysteresis Measurements and the Constituent Properties of Ceramic Matrix Composites: II, Experimental Studies on Unidirectional Materials. J. Am. Ceram. Soc. 1995, 78, 2721–2731. [Google Scholar] [CrossRef]
- Gordon, N. Material Health Monitoring of SiC/SiC Laminated Ceramic Matrix Composites with Acoustic Emission and Electrical Resistance. Master’s Thesis, University of Akron, Akron, OH, USA, 2014. [Google Scholar]
- Smith, C.E. Electrical Resistance Changes of Melt Infiltrated SiC/SiC Subjected to Long-Term Tensile Loading at Elevated Temperature. Ph.D. Thesis, University of Akron, Akron, OH, USA, 2016. [Google Scholar]


| Items | Mini | Unidirectional | Cross-Ply | 2D Plain-Woven |
|---|---|---|---|---|
| Vf | 0.43 [32] | 0.25 [33] | 0.25 [34] | 0.36 [35] |
| rf/(μm) | 3.5 [32] | 7.5 [34] | 7.5 [34] | 7.5 [35] |
| Ef/(GPa) | 387 [35] | 420 [34] | 420 [34] | 350 [35] |
| Em/(GPa) | 400 [35] | 339 [34] | 339 [34] | 400 [35] |
| αf/(10−6/K) | 2.3 [34] | 5.1 [34] | 5.1 [34] | 4 [29] |
| αm/(10−6/K) | 1.48 [34] | 4.38 [34] | 4.38 [34] | 4.6 [29] |
| ΔT/(°C) | −1000 [32] | −1400 [34] | −1400 [34] | −1400 [35] |
| τi/(MPa) | 100 [33] | 60 [34] | 30 [34] | 100 [33] |
| ΓI/(J/m2) | 4.0 [33] | 5 [29] | 2.0 [33] | 6.0 [33] |
| Items | σmax = 890 MPa | σmax = 935 MPa | σmax = 1078 MPa |
|---|---|---|---|
| η | 0.075 | 0.194 | 0.38 |
| σtr_unloading/(MPa) | 563 | 427 | 195 |
| σtr_reloading/(MPa) | 327 | 508 | 883 |
| Unloading Peak ITM/(TPa−1) | 3.58 | 4.15 | 5.18 |
| Reloading Peak ITM/(TPa−1) | 3.486 | 3.97 | 4.87 |
| Unloading Peak ICSR | 0.07 | 0.143 | 0.17 |
| Reloading Peak INSR | 0.075 | 0.194 | 0.38 |
| Items | σmax = 415 MPa | σmax = 449 MPa |
|---|---|---|
| η | 0.14 | 0.295 |
| σtr_unloading/(MPa) | 209 | 170 |
| σtr_reloading/(MPa) | 206 | 279 |
| Unloading Peak ITM/(TPa−1) | 5.34 | 7.21 |
| Reloading Peak ITM/(TPa−1) | 4.88 | 6.76 |
| Unloading Peak ICSR | 0.11 | 0.188 |
| Reloading Peak INSR | 0.14 | 0.295 |
| Items | σmax = 189 MPa | σmax = 206 MPa |
|---|---|---|
| η | 0.214 | 0.35 |
| σtr_unloading/(MPa) | 52 | 34 |
| σtr_reloading/(MPa) | 137 | 172 |
| Unloading Peak ITM/(TPa−1) | 8.67 | 10.32 |
| Reloading Peak ITM/(TPa−1) | 7.69 | 9.68 |
| Unloading Peak ICSR | 0.09 | 0.137 |
| Reloading Peak INSR | 0.214 | 0.35 |
| Items | σmax = 312 MPa | σmax = 360 MPa | σmax = 410 MPa |
|---|---|---|---|
| η | 0.084 | 0.15 | 0.23 |
| σtr_unloading/(MPa) | 138 | 91 | 41 |
| σtr_reloading/(MPa) | 174 | 269 | 369 |
| Unloading Peak ITM/(TPa−1) | 6.32 | 7.08 | 8.01 |
| Reloading Peak ITM/(TPa−1) | 6.12 | 6.87 | 7.73 |
| Unloading Peak ICSR | 0.054 | 0.08 | 0.098 |
| Reloading Peak INSR | 0.084 | 0.15 | 0.23 |
Publisher’s Note: MDPI stays neutral with regard to jurisdictional claims in published maps and institutional affiliations. |
© 2021 by the author. Licensee MDPI, Basel, Switzerland. This article is an open access article distributed under the terms and conditions of the Creative Commons Attribution (CC BY) license (https://creativecommons.org/licenses/by/4.0/).
Share and Cite
Li, L. Micromechanical Modeling Tensile and Fatigue Behavior of Fiber-Reinforced Ceramic-Matrix Composites Considering Matrix Fragmentation and Closure. J. Compos. Sci. 2021, 5, 187. https://doi.org/10.3390/jcs5070187
Li L. Micromechanical Modeling Tensile and Fatigue Behavior of Fiber-Reinforced Ceramic-Matrix Composites Considering Matrix Fragmentation and Closure. Journal of Composites Science. 2021; 5(7):187. https://doi.org/10.3390/jcs5070187
Chicago/Turabian StyleLi, Longbiao. 2021. "Micromechanical Modeling Tensile and Fatigue Behavior of Fiber-Reinforced Ceramic-Matrix Composites Considering Matrix Fragmentation and Closure" Journal of Composites Science 5, no. 7: 187. https://doi.org/10.3390/jcs5070187
APA StyleLi, L. (2021). Micromechanical Modeling Tensile and Fatigue Behavior of Fiber-Reinforced Ceramic-Matrix Composites Considering Matrix Fragmentation and Closure. Journal of Composites Science, 5(7), 187. https://doi.org/10.3390/jcs5070187