Article

Finite Element Analysis for Nonlinear Unbonded Circular Fiber-Reinforced Elastomeric Bearings

by
Pablo Castillo Ruano
* and
Alfred Strauss
Institute of Structural Engineering, University of Natural Resources and Life Sciences, Peter-Jordan-Strasse 82, 1190 Vienna, Austria
*
Author to whom correspondence should be addressed.
J. Compos. Sci. 2021, 5(7), 170; https://doi.org/10.3390/jcs5070170
Submission received: 13 May 2021 / Revised: 16 June 2021 / Accepted: 21 June 2021 / Published: 29 June 2021
(This article belongs to the Special Issue Progress in Rubber Blends and Composites Technology)

Abstract

:
In recent years, interest in low-cost seismic isolation systems has increased. The replacement of the steel reinforcement in conventional elastomeric bearings for a carbon fiber reinforcement is a possible solution and has garnered increasing attention. To investigate the response of fiber-reinforced elastomeric bearings (FREBs) under seismic loads, it is fundamental to understand its mechanical behavior under combined vertical and horizontal loads. An experimental investigation of the components presents complexities due to the high loads and displacements tested. The use of a finite element analysis can save time and resources by avoiding partially expensive experimental campaigns and by extending the number of geometries and topologies to be analyzed. In this work, a numerical model for carbon fiber-reinforced bearings is implemented, calibrated, and validated and a set of virtual experiments is designed to investigate the behavior of the bearings under combined compressive and lateral loading. Special focus is paid to detailed modeling of the constituent materials. The elastomeric matrix is modeled using a phenomenological rheological model based on the hyperelastic formulation developed by Yeoh and nonlinear viscoelasticity. The model aims to account for the hysteretic nonlinear hyper-viscoelastic behavior using a rheological formulation that takes into consideration hyperelasticity and nonlinear viscoelasticity and is calibrated using a series of experiments, including uniaxial tension tests, planar tests, and relaxation tests. Special interest is paid to capturing the energy dissipated in the unbonded fiber-reinforced elastomeric bearing in an accurate manner. The agreement between the numerical results and the experimental data is assessed, and the influence of parameters such as shape factor, aspect ratio, vertical pressure, and fiber reinforcement orientation on stress distribution in the bearings as well as in the mechanical properties is discussed.

1. Introduction

Seismic base isolation by introducing a flexible horizontal layer at the foundation level of a structure has been proven to significantly reduce the seismic demand [1]. The mechanical properties of elastomers are well suited for the implementation of seismic isolation systems. To add the required stability to elastomer-based seismic isolation systems, reinforcement layers are added. Conventionally reinforced elastomers consist of thin steel sheets embedded in an elastomeric matrix. Recently, the use of multilayered, reinforced elastomeric bearings consisting of elastomeric layers reinforced by fiber sheets as seismic isolators has been investigated [2,3]. Fiber-reinforced elastomeric bearings (FREBs) are much lighter and easier to produce as conventional steel bearings, as large sheets can be manufactured and then cut to the requested size. This leads to a cost reduction that enables the use of seismic isolation systems in applications that are currently not cost-efficient [4,5]. Several studies have also investigated the use of materials alternative to carbon fiber, such as glass fiber [6], graphene [7], and polyester fiber [8]. Lately, the possibility of applying these fiber-reinforced devices for seismic retrofitting of masonry buildings [9] as well as strategies to tune the response of the devices according to the application [10] have been investigated. Moreover, the production of bearings with non-standard geometries is simplified. Among these geometries, circular bearings have the ability to withstand successful multidirectional loading. The elimination of steel also reduces the risk of corrosion and improves the behavior of the bearings in locations with high humidity. Elastomeric bearings can sustain high vertical loads while simultaneously reducing horizontal stiffness, which allows for the structure to bear large lateral deformations caused by strong ground motions. The possibility of discarding the thick end steel plates used for fixing the elastomeric bearing to the structure has been investigated, analytically and experimentally [6,11,12,13]. The resulting elastomeric bearings present a unique behavior, named rollover deformations at high horizontal displacements. In a first phase, the upper and lower contact layers detach from the supports of the structural system, increasing the lateral flexibility and energy dissipation capacity of the system. If the lateral displacement increases, a second phase called stable rollover deformation arises, the lateral surfaces of the bearings make contact with the structural supports, which leads to an overall increase in the system’s horizontal stiffness. The rollover effect also allows for an increase in the energy absorption capacity of the base isolation device [14,15]. An example of early application for these unbonded fiber-reinforced elastomeric devices can be found in Tawang, India [16]. The aforementioned experimental works conclude that the device presents a mechanical response that corresponds to a hyperelastic and nonlinear viscoelastic behavior. Although simplified expressions that consider the rollover effect and the flexibility of reinforcement have been formulate [17,18], the current codes do not yet cover these behaviors [19,20,21]. A numerical analysis applying the finite element method accompanied by a validation and calibration process based on experiments [22,23,24,25,26] provides a possibility to investigate, analyze, and optimize the behavior of materials and composite parts in an extensive and cost-effective way. Finite element investigations trying to capture the complex behavior of fiber-reinforced elastomeric devices have been performed, obtaining a reasonable agreement in terms of horizontal and vertical stiffness [27,28,29,30]. Several previous numerical analyses have modelled the elastomeric matrix using different hyperelastic models, Neo-Hookean [30,31,32], Ogden [28], or Yeoh [33]. Nevertheless, constituent models used in the cited works are not able to represent the energy absorption and nonlinear hysteretic behavior of the fiber-reinforced elastomeric bearings and only a few works have used a combination of hyperelasticity and linear viscoelasticity [14,34,35]. In order to fill that gap, the current study aims to extend the result of previous numerical investigations on fiber-reinforced elastomeric bearings, focusing on the accurate definition of the constituent materials for the isolation device. To capture the mechanical behavior of rubber material, an advanced material model based on a phenomenological rheological model that accounts for hyperelastic and nonlinear viscoelastic properties was calibrated and validated using experimental results obtained in previous studies. To the best of the authors’ knowledge, the use of a combination of nonlinear viscoelastic and hyperelastic formulation for modelling the elastomeric matrix was used for the first time in this work. Furthermore, nonlinearities caused by large deflections and contact conditions were considered during the development of the numerical model.

2. Materials and Methods

The response of fiber-reinforced elastomeric bearings under seismic load can be investigated by experiments subjecting the devices to combinations of vertical and horizontal loads. Based on the experiments performed by the authors in [13], a set of virtual experiments relying on a calibrated and validated finite element model was set up to evaluate the mechanical behavior of the elastomeric bearings regarding relevant parameters. For elastomeric bearings, the shape factor, S, representing the slenderness in a single rubber layer, is one of the variables that drives the overall behavior of the device. The relation between the width and height of the bearing, aspect ratio A, was assessed as an important parameter for the lateral stability in previous works [6,36]. The compressive load applied and the orientation of the fiber reinforcement mesh effects on the mechanical response were also taken into account in this numerical analysis. Table 1 shows the specimens investigated along with their geometrical and mechanical parameters.

2.1. Fiber-Reinforced Elastomeric Bearings

The numerical analysis performed in this work relies on the experimental investigation of fiber-reinforced elastomeric bearings performed in [13]. The tested bearings consisted of natural rubber elastomeric layers with a density of 1.16 g/cm 3 and a shear modulus of 0.96 GPa. The reinforcement layer is a carbon fiber fabric with a thickness of 0.4 cm and a weight of 345 g/cm 2 . Eight carbon fiber reinforcement layers were bonded to the elastomeric layers through a vulcanization process. The first and last rubber layers presented half the thickness of the interior layers. The total height of the experimentally analyzed bearings was 44.6 cm, with a total rubber thickness t r of 41.5 mm. To investigate the rollover deformation, no steel plates were vulcanized at the top and bottom surfaces. The tested bearings correspond to the specimen 08RL_09S listed in Table 1. Figure 1 depicts the cyclic lateral test performed under several horizontal deformations.

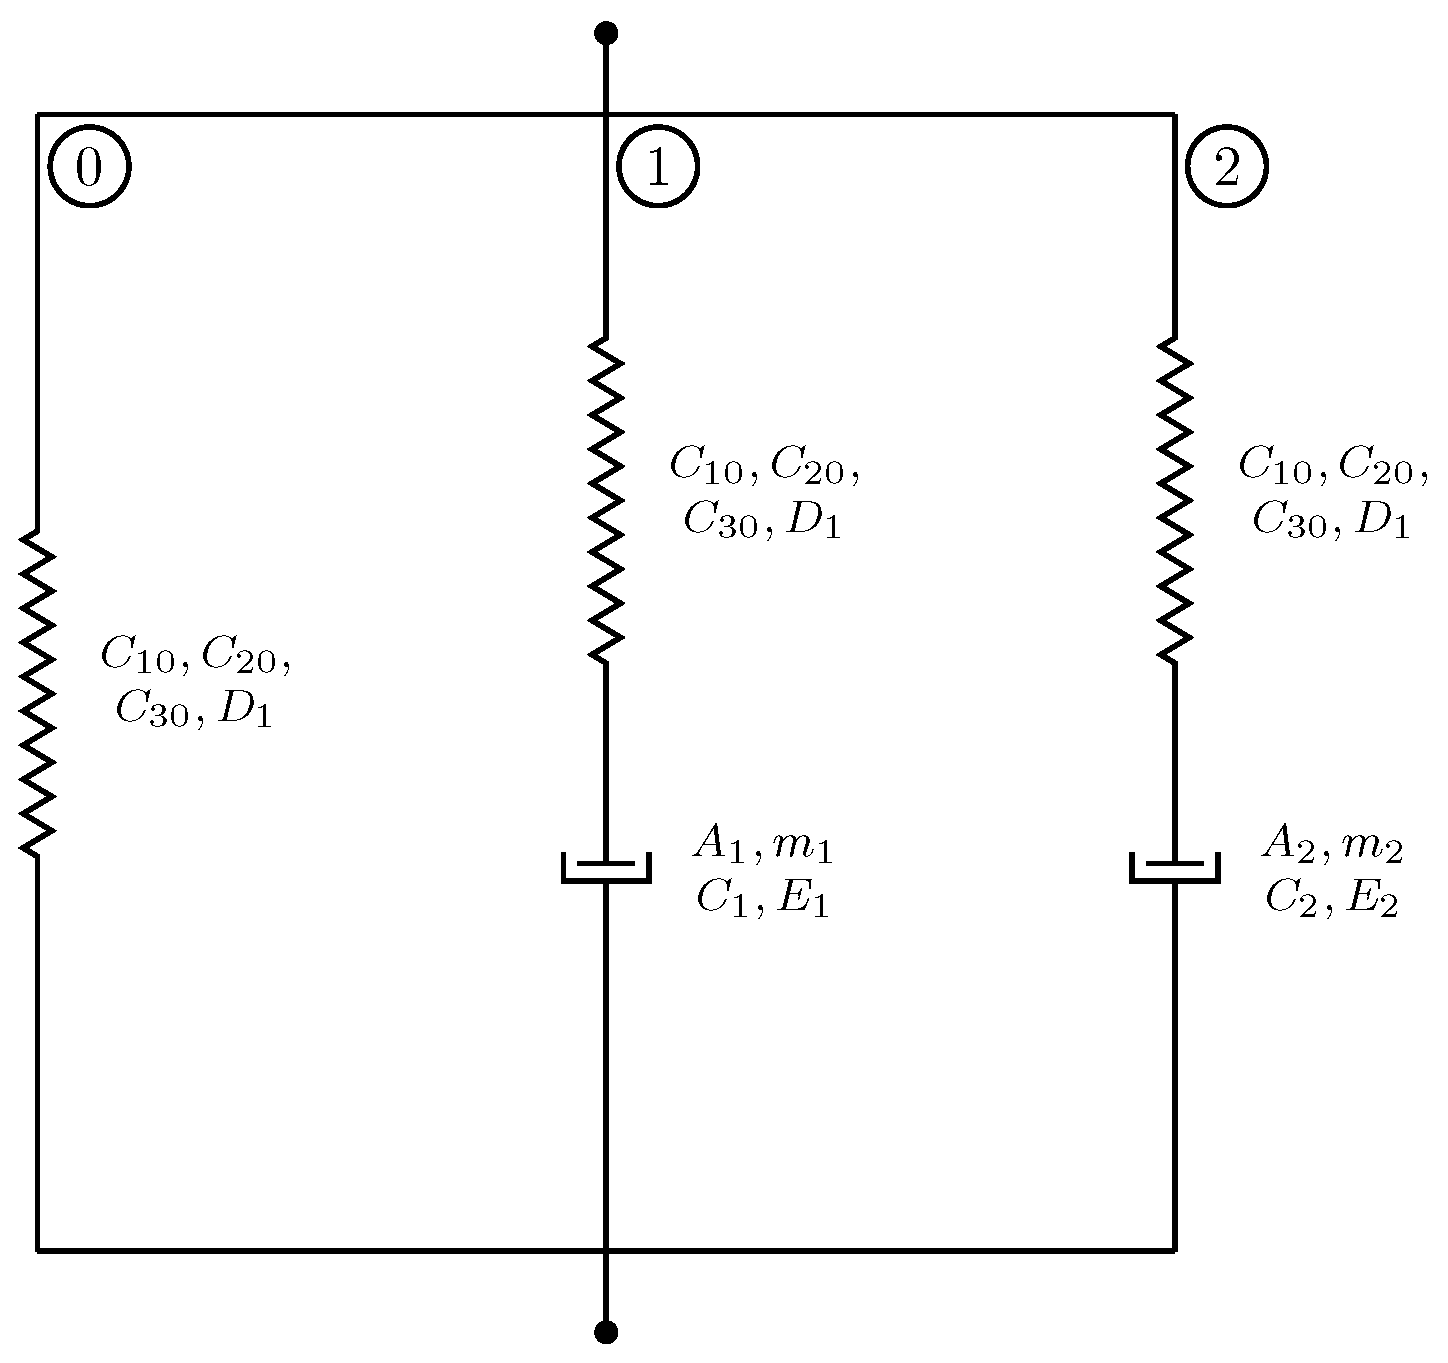
2.2. Constitutive Materials Models
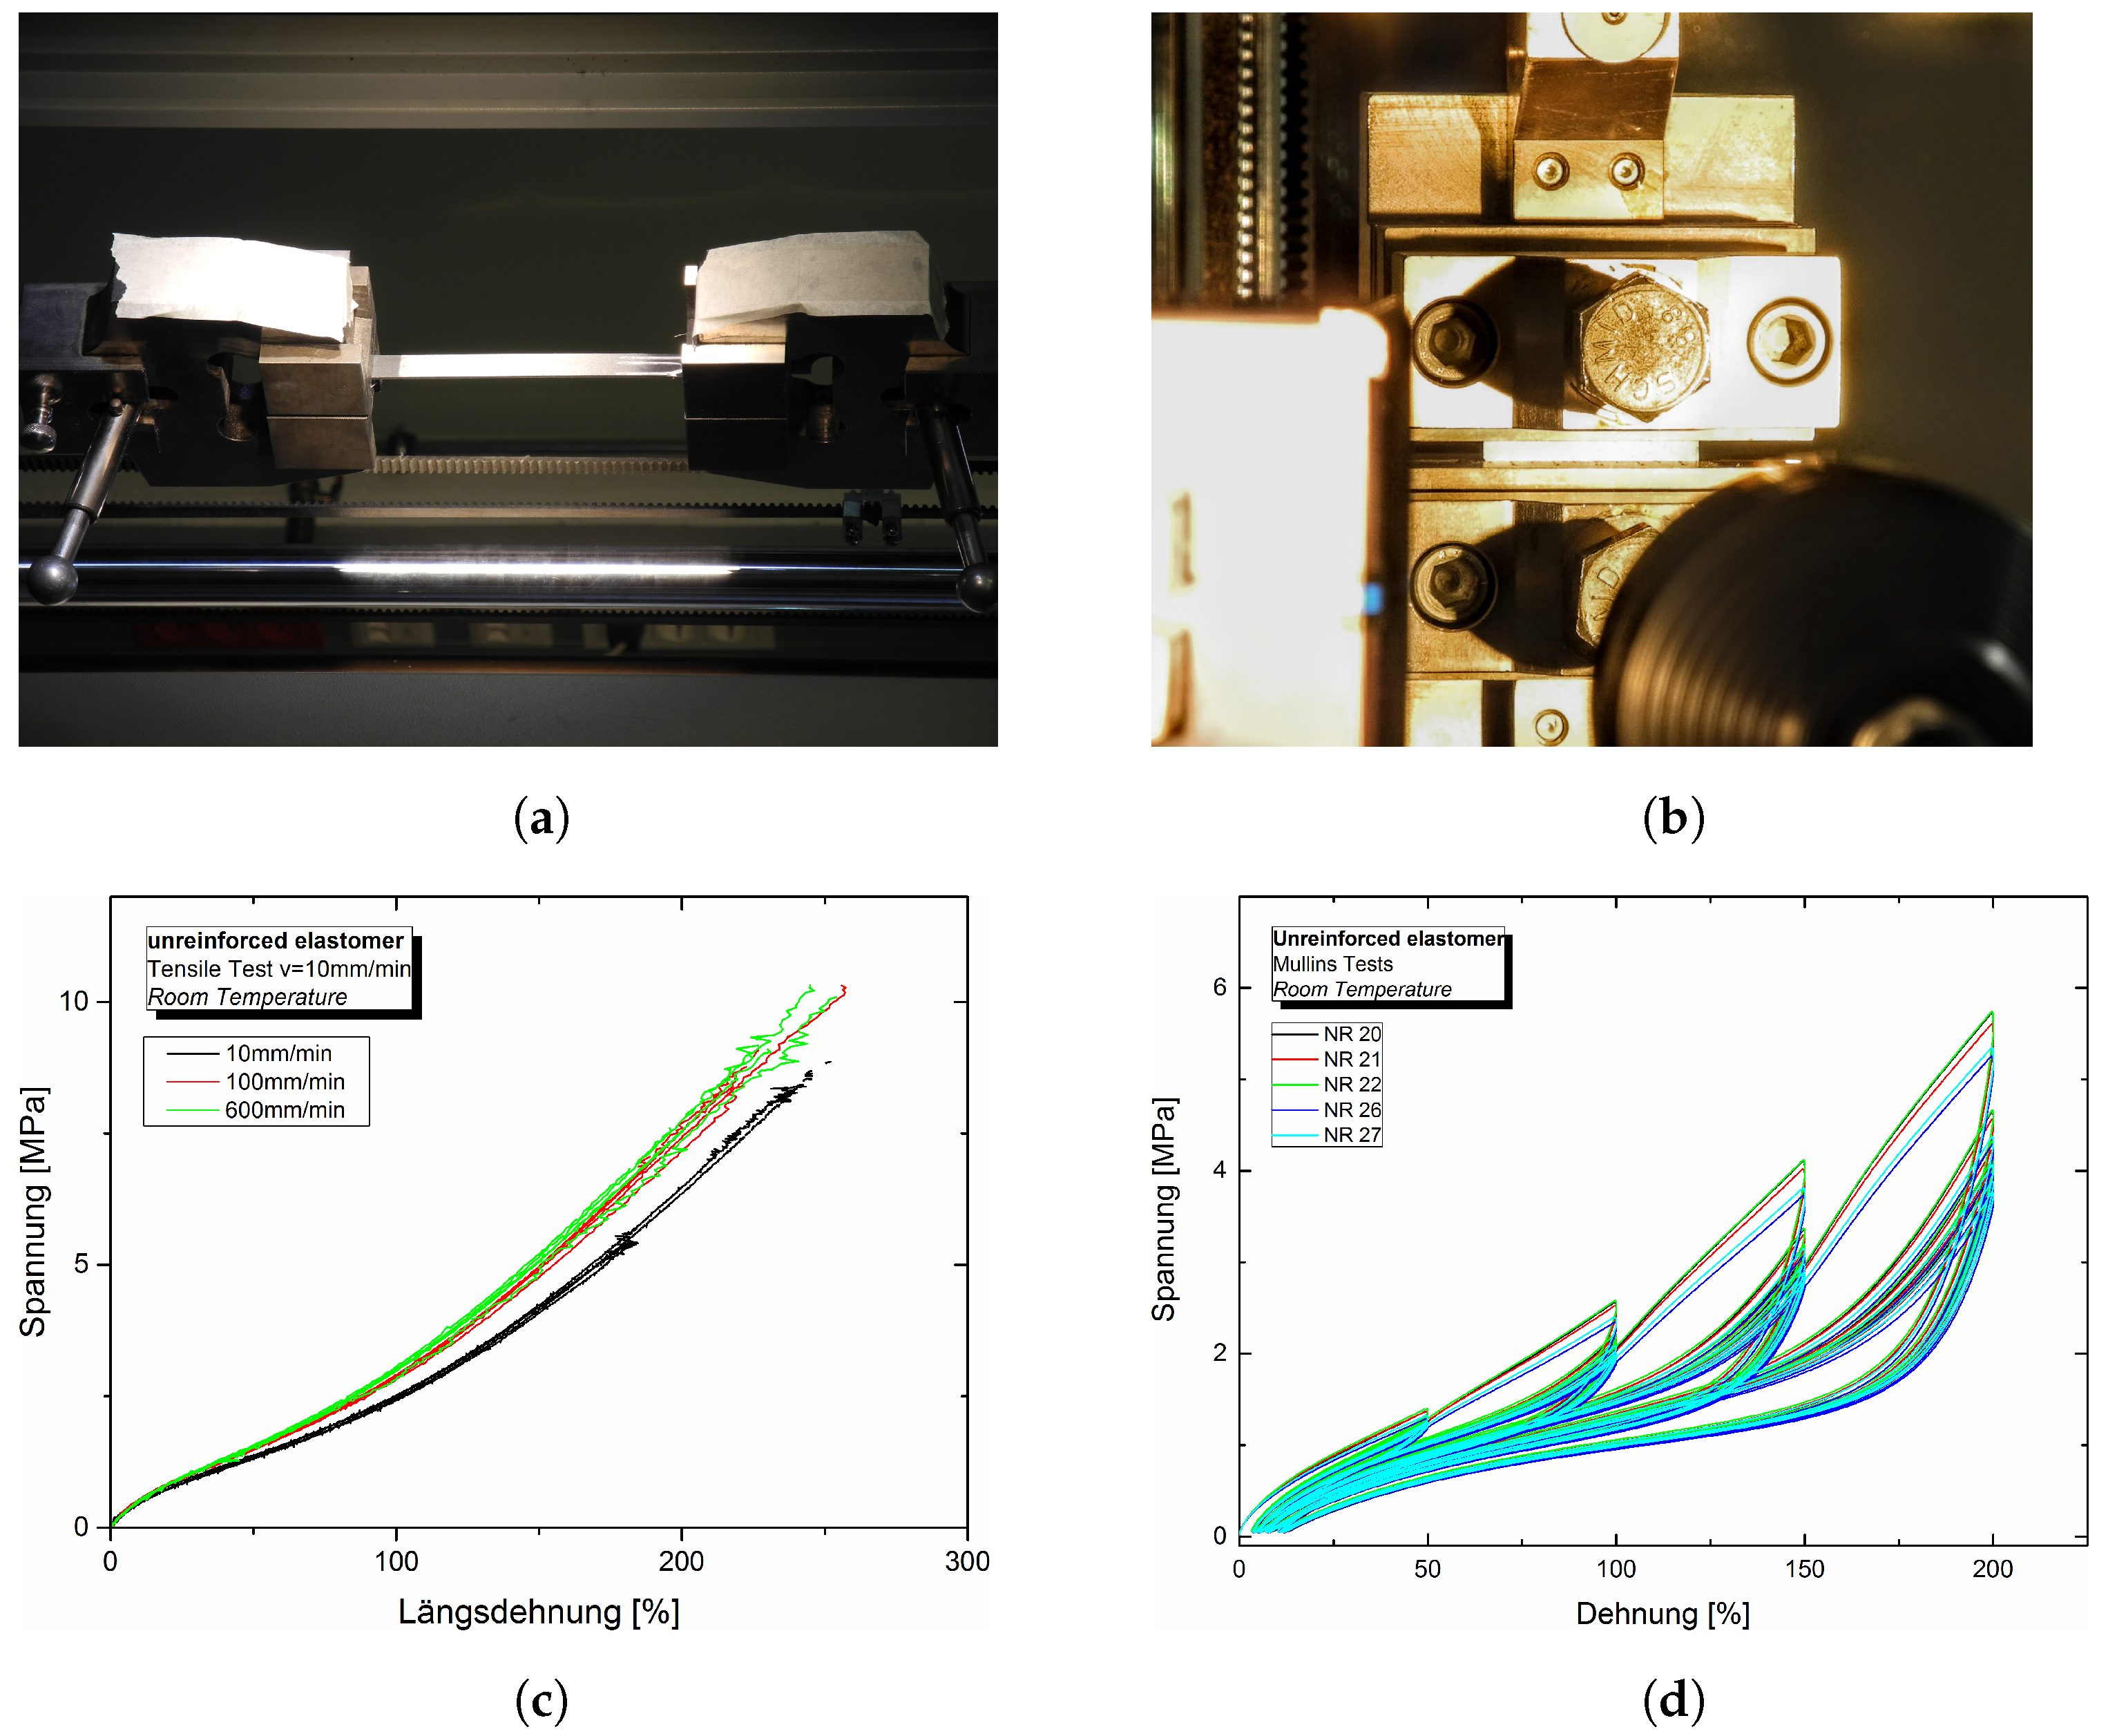
In order to develop an accurate numerical model that reflects the complex mechanical behavior and material nonlinearities of the investigated bearings, it is of high importance to select adequate models for the constituent materials.

2.2.1. Elastomer

From the results of the cyclic loading experiments, in which the specimens to be tested were subjected to deformations of up to 200% of the height, it is observed that the lateral behavior of the bearings presents a nonlinear path, with a softening from a certain lateral deformation and a final stiffening at high deformations, as shown in Figure 2.
These zones correspond to the beginning of the rollover effect, when the upper and lower surfaces begin to separate from the supports, and to the moment when there is (almost) total contact of the walls with the surface, a full rollover. It is also possible to appreciate the hysteretic behavior caused by energy absorption. In the current work, this nonlinear hyperviscoelastic behavior of the elastomer is modelled using a phenomenological representation. The filled elastomeric materials present a complex nonlinear mechanical behavior that includes rate dependence, hyperelasticity, and damage dependent on preloads, among others. To take into consideration all of these effects, a rheological based framework implemented on ABAQUS 2016 was chosen for this analysis. The Parallel Rheological Framework [37] consists of several viscoelastic networks complemented by a pure elastic network connected in parallel, as shown in Figure 3.
The elastic network represents the hyperelastic behavior of the bearing, which was modeled using the polynomial strain energy function formulated by Yeoh in [38].
W = i = 1 3 C i 0 ( I 1 3 ) i + i = 1 3 1 D 1 ( J e l 1 ) 2 i ,
where W is the strain energy density; C 10 , C 20 , C 30 , D 1 , D 2 , and D 3 are material parameters; I 1 is the first deviatoric strain invariant; and J e l is the elastic volume strain. The nonlinear viscoelastic behavior is characterized using the Bergstrom–Boyce formulation that is suitable for predicting large-strain time-dependent, cyclic, and stress relaxation behaviors [39]. For each viscoelastic network, the model assumes a multiplicative split of the deformation gradient and the existence of the creep potential G c r from which the flow rule is derived [40].The deformation gradient has the form expressed by Equation (2):
F = F e F cr ,
where F e represents the hyperelastic behavior and takes the same form as the elastic network and F cr is the creep part of the deformation gradient, expressed by G c r = q ¯ , where q ¯ is the equivalent deviatoric Cauchy stress. The flow rule then has the form given by Equation (3):
D cr = 3 2 q ¯ ϵ c ¯ r ˙ σ ¯ ,
where σ ¯ is the deviatoric Cauchy stress and the equivalent creep strain rate ϵ c ¯ r ˙ is provided by the Bergstrom–Boyce model 4
ϵ c ¯ r ˙ = A ( λ c r 1 + E ) C ( q ˜ ) m ,
where λ c r is given by Equation (5); q ˜ = J q ¯ is the equivalent deviatoric Kirchhoff stress; J is the determinant of F ; and A, m, C, and E are material parameters.
λ c r = 1 2 I : C c r
To calibrate the material parameters, a set of experiments was performed on thin rubber sheets extracted from the same fabrication batch as the tested elastomeric bearings. The setup for uniaxial tension, plane shear, and stress relaxation tests are shown in Figure 4. Three different strain rates (10 mm/min, 100 mm/min, and 600 mm/min) were applied to capture the rate-dependent response of the elastomer. The dedicated optimization software Isight developed by Simulia/Dassault Systemes [41] was used to approximate the response of the model to the data from cyclic uniaxial tension, stress relaxation, and simple shear tests by applying several optimization strategies implemented on the software. Stress softening is a characteristic present in filled elastomers. To maintain the computational efficiency of the material model, no correction for this so-called Mullins effect was added to the equilibrium network of the rheological framework. Pre-conditioned test specimens and data corresponding to the last cycle in the case of cyclic experiments were selected for the calibration procedure.

2.2.2. Fiber Reinforcement

Multiple experimental studies [2,42] seem to indicate that carbon fiber reinforcement presents a complex mechanical behavior, with internal friction between the fabric fibers and between the reinforcement and the elastomer layers that are difficult to quantify. In an attempt to capture the response of the reinforcement as accurately as possible, stress tests were performed on specimens composed of a layer of carbon fiber reinforcement sandwiched between two thin layers of elastomer and vulcanized. The data extracted from the tests show a slight hysteretical behavior of the specimen. Nevertheless, the amount of energy dissipated by the reinforcement in comparison with the elastomer is negligible, as demonstrated by [36]. Aiming to reduce the computational complexity of the model, the behavior of the woven fiber reinforcement was simplified by applying an orthotropic linear elastic material model.

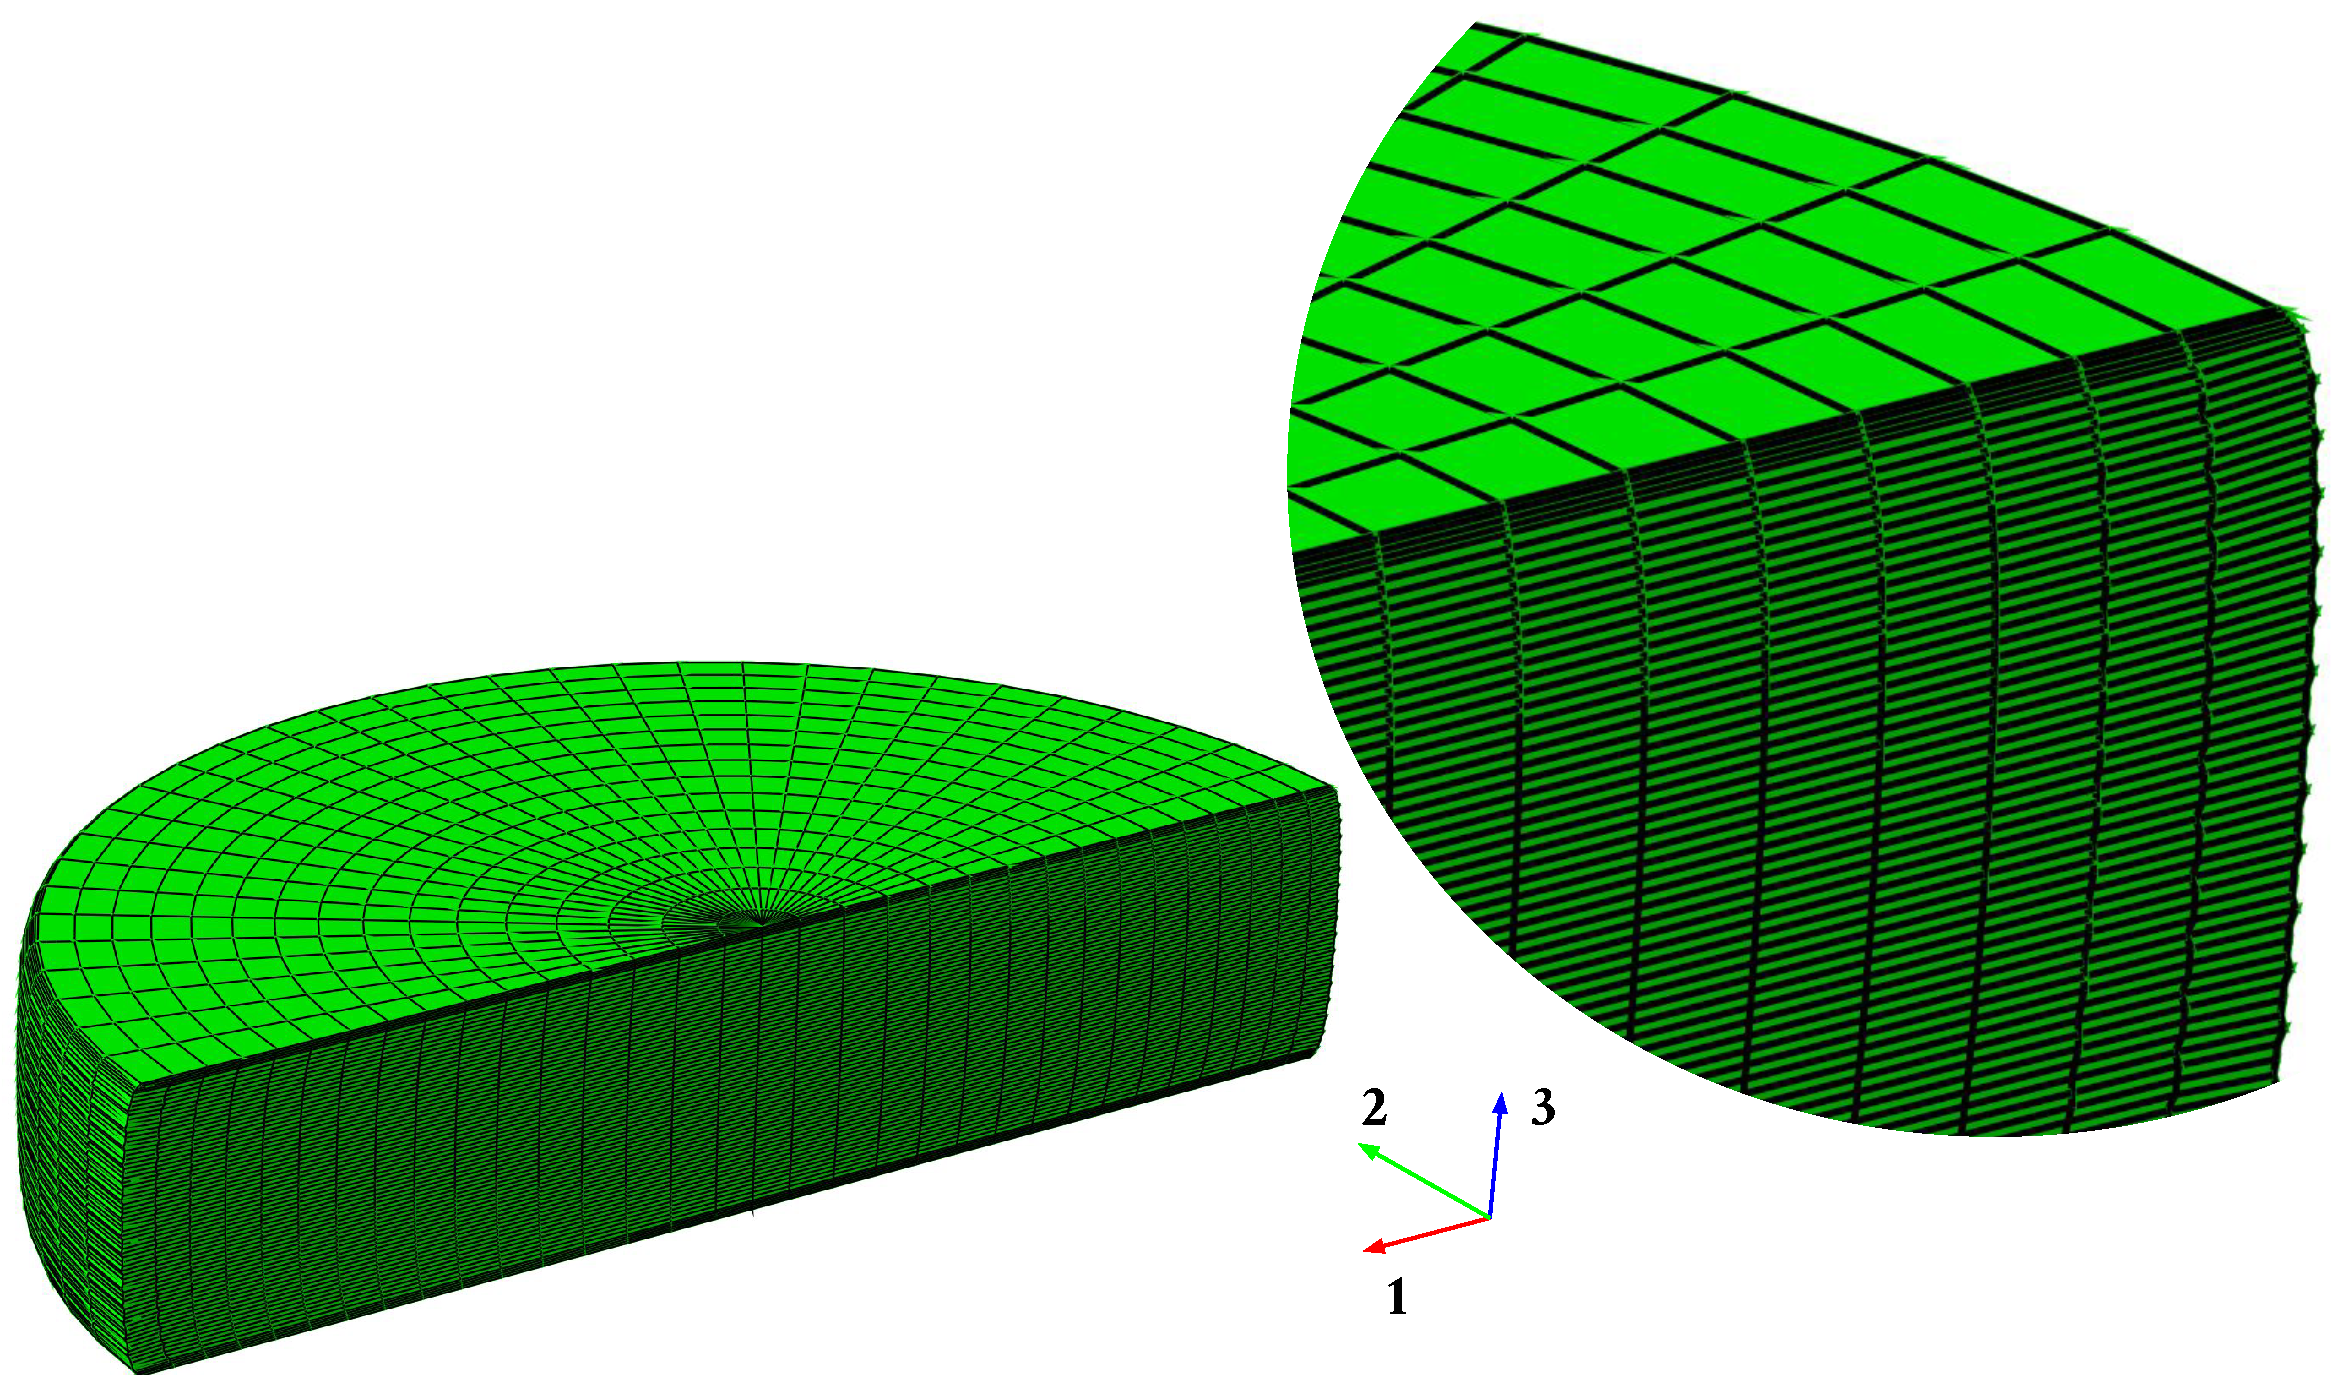
2.3. Fiber-Reinforced Bearing Finite Element Model

The commercial finite element analysis code ABAQUS 2016 was used to create a numerical model for round bearings. A first-order, reduced integration hexahedral element, C3D8R, was chosen for the elastomeric part of the bearing as its properties allow us to reduce the detrimental effects caused by shear locking. To reduce the potential hourglassing effect, the enhanced hourglass control available in ABAQUS was employed and layers consisting of four elements were distributed along the height of an elastomeric layer. The model was meshed using a regular meshing technique with 16 elements along the radius and 64 elements along the circular perimeter. The total number of elements for each analyzed specimen and the meshed model with detail are shown in Table 2 and Figure 5, respectively. To model the lack of flexural rigidity present on the carbon fiber sheets, the reinforcement was meshed using first-order membrane elements, M3D4R.
As for the reinforcement part of the bearing, each carbon fiber reinforcement layer was meshed using 16 elements in the radial direction and 64 elements in the circular direction. The radius of the reinforcement layers was 5 mm smaller than the elastomer layers radius to replicate the geometry present on the experimentally investigated bearings. The elemental layers of the membrane were integrated into the elastomeric matrix as embedded elements.
Rigid bodies were chosen to act as loading planes, applying fixed boundary conditions to the bottom plane and horizontal displacement boundary condition to the top plate. The displacement along the Z-Axis of the top rigid body remained unrestricted to analyze the vertical deformation of the bearing. The displacement of the loading plate was transmitted to the bearing through friction; thus, a friction penalty coefficient of μ = 0.85 was introduced to model the contact conditions between bearing and support surfaces.
The symmetry conditions along axis 1 were applied to reduce the computational cost, halving the number of elements of the finite element model. The predicted deformed shape of the bearings under increasing horizontal deformations are presented in Figure 6.
The validation of the described model was performed by comparing the predicted force–deformation curves under horizontal deformation by up to 200% of the height of the bearing and vertical compressive pressures of 4 MPa and 8 MPa with the results obtained experimentally in previous analysis [13]. The relevant parameters for seismic applications such as effective horizontal stiffness k h and equivalent dumping ratio ξ were calculated for both experimental and virtual specimens using Equations (7) and (8), respectively, and are presented in Figure 7.
The model accurately predicts the horizontal stiffness, and the force–displacement curves present a good agreement. The finite element representation seems to slightly overestimate the equivalent damping ratio, which is, again, a sign that the energy dissipation mechanism of the bearing requires a more in-depth understanding.

2.4. Virtual Experiments

To understand the mechanical behavior of the fiber-reinforced elastomeric bearings and to evaluate the effect of relevant parameters that can influence the performance as base isolation devices, a set of virtual numerical analyses replicating the conditions used during the mechanical testing of bearings were developed. Previous numerical analyses assessed the importance of factors such as shape factor, S, aspect ratio, A, vertical compression, P, and reinforcement orientation on the overall behavior of the elastomeric bearings. In this work, combinations of such parameters, shown in Table 1, were investigated. The shape factor is a measure of the slenderness of the elastomeric layers and is calculated using Equation (6)
S = d 4 t r ,
where d is the diameter of the bearing and t r is the thickness of the elastomeric layer. The aspect ratio represents the relation between total width and total height, H, of the bearing, A = d H . Compression values of 4, 6, and 8 MPa were applied to the virtual specimens, and reinforcement orientations rotated 0°, 30°, and 45° with respect to the horizontal axis 1 were investigated. For each experiment, effective horizontal stiffness, k h , and equivalent damping ratio, ξ , were calculated using Equations (7) and (8) respectively, according to [19,20]
k h = F + F ( u x + u x )
ξ = 2 W π K h ( u x + u x ) 2 ,
where W is the area of the hysteresis loop obtained in the experiments; u x + and u x are the maximum and minimum horizontal displacement, respectively; and F + and F are the values of the force at maximum and minimum horizontal displacement, respectively.
A python script was programmed to create the ABAQUS input files required to run the numerical simulations.

3. Results

The results after processing the predictions obtained by the software are presented below. The axial stress distribution in the direction of axis 1, normalized by the value of the vertical compression, is shown for both the elastomeric matrix and the carbon fiber reinforcement. The pressure distribution in the direction of axis 3 is also presented for the case of the elastomeric material. Diagrams showing the stress along the path corresponding to the symmetry axis were created for a better interpretation of the zones subjected to tension and compression. Finally, the calculated data of effective horizontal stiffness, k h , and equivalent damping coefficient, ξ , were plotted against different levels of horizontal deformation, and the values are shown in Table 3.

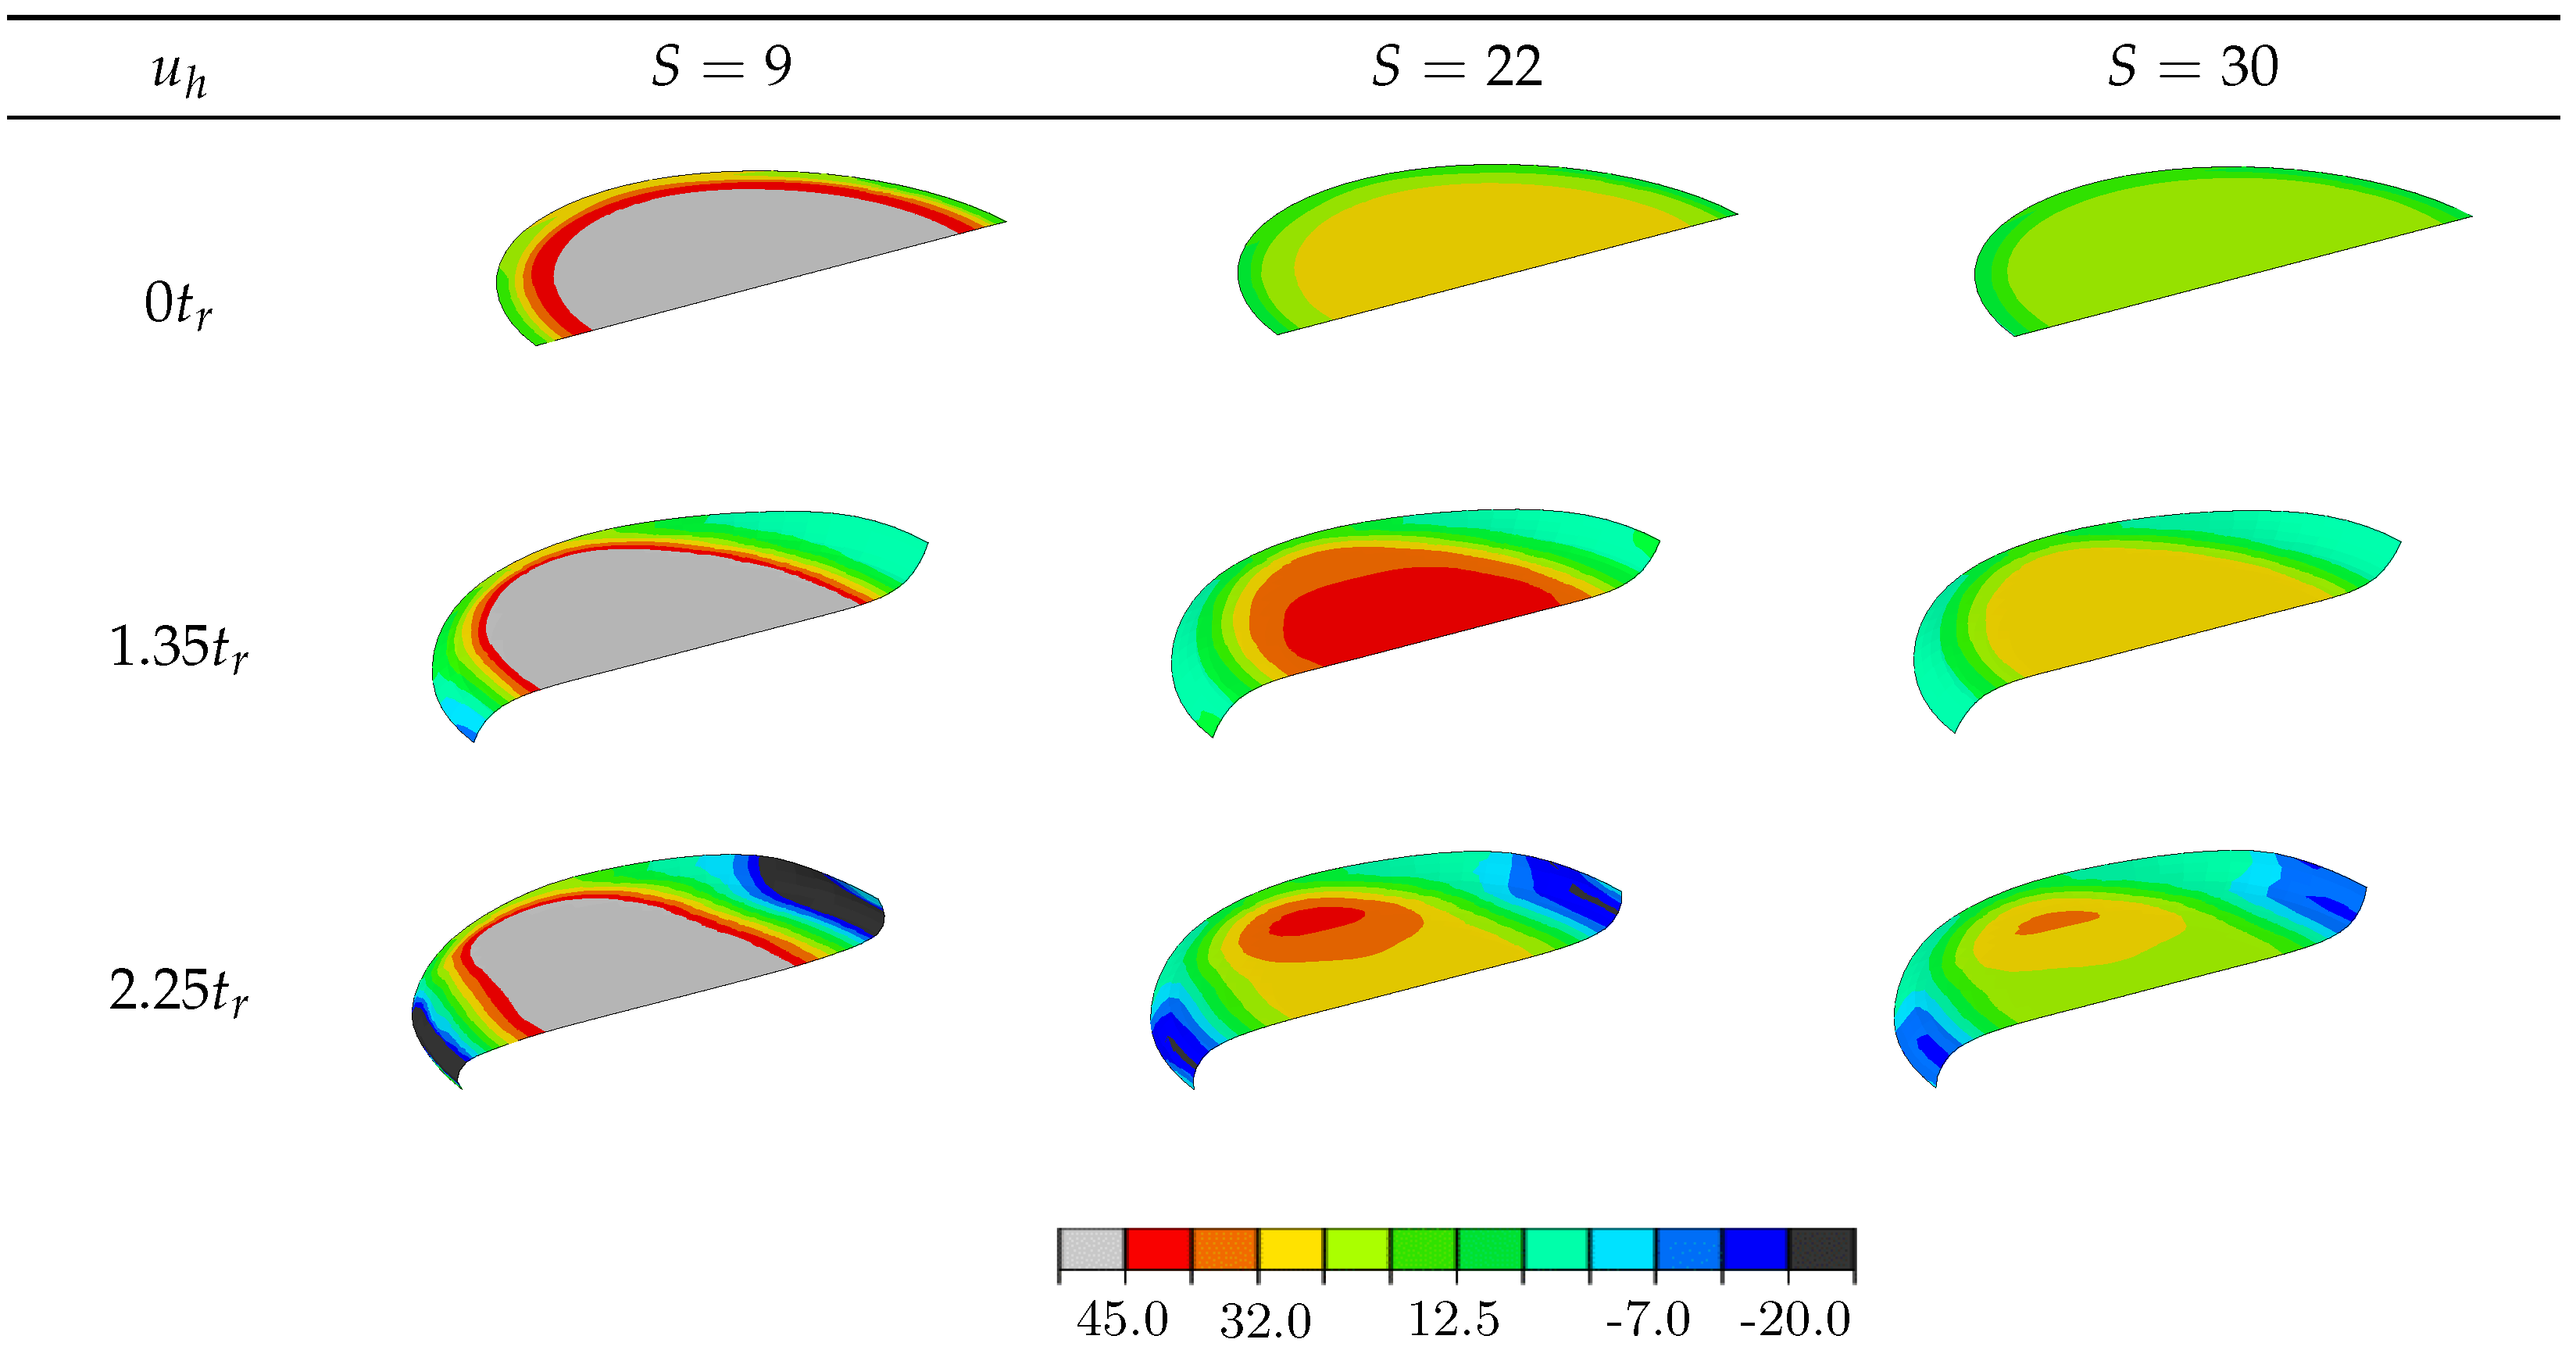
3.1. Influence of Shape Factor, S

Figure 8 shows the axial S11 and vertical S33 normal stress distributions. Regarding S11, if no lateral displacement is imposed, the area subjected to high compression stress is higher as shape factor S increases, showing a marginal difference between the bearings with S over 20. As the lateral displacement increases and the rollover effect appears, the tensile stress at the exterior zones decreases at increasing values for the shape factor.
It can be observed that the total area under compression is reduced as horizontal deformation increases and that a reduction of 30% of the compressive stress occurs on the elastomeric matrix with S = 9 , while the bearings with shape factors equal to 22 and 30 present a reduction of less than 10%. The complex stress distribution at a full rollover can be observed in Figure 9, where the first elastomer layer presents several transitions between tension and compression.
Regarding S33, it is observed that the first layer is subjected to the maximum compressive stress, about 190% of the applied vertical pressure. In all investigated specimens, the first elastomeric layer presents small stress deviations around the central area of the bearing that can be ascribed to the contact conditions. The difference in maximum compression normal stress for the three specimens is not remarkable, while the area under maximum compressive stress decreases with decreasing values of the shape factor.
The normal stress distribution S11 on the reinforcement is shown in Figure 10 and presents a complementary behavior to that of the elastomeric matrix. It is observed that the maximum tensile stress is met before the full rollover condition, with values 233% larger at the bearing with S = 9 than for the specimen with S = 30 . It can also be seen in Figure 11 that the area at the edge works under compression before a full rollover appears in the bearing with a low shape factor.
The values calculated for the effective horizontal stiffness k h present a slightly stiffer behavior with a more pronounced effect of the full rollover condition for increasing values of the shape factor, as seen in Figure 12. Increasing equivalent damping ratio values, ξ , with decreasing values for shape were assessed. An increase in damping at high lateral deformations is observed in the bearings investigated except for the specimen 22RL_30S.

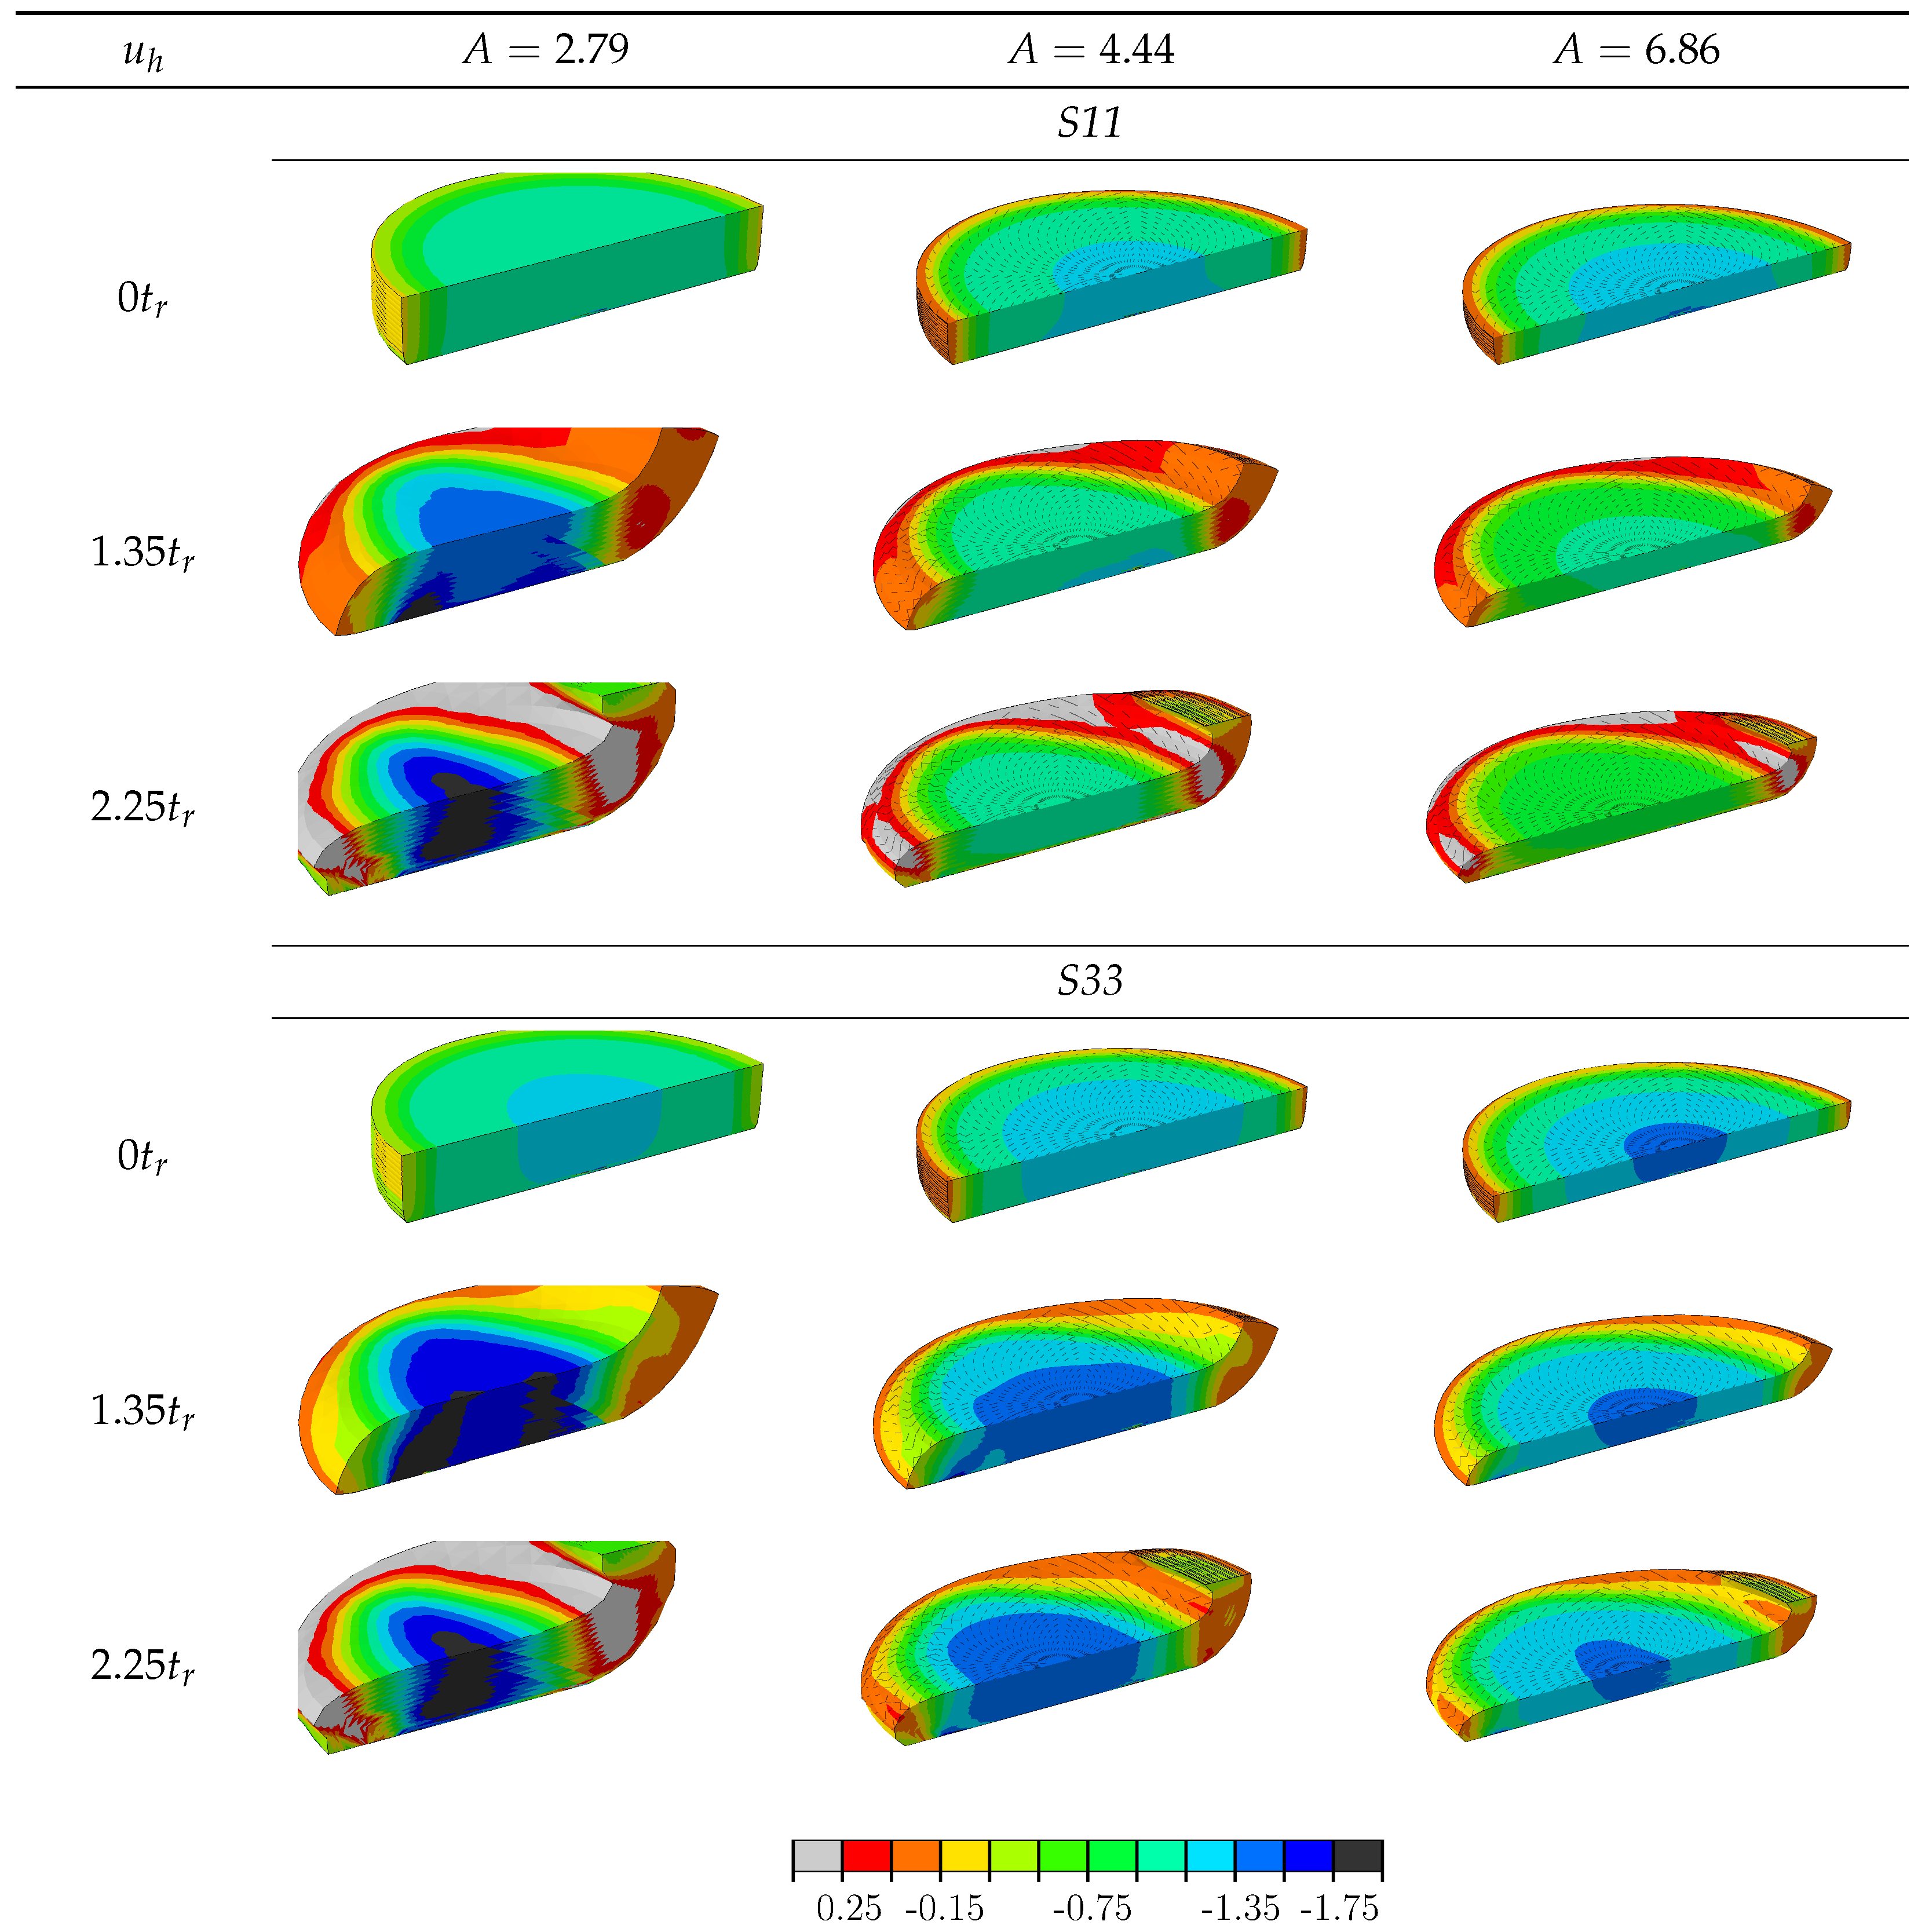
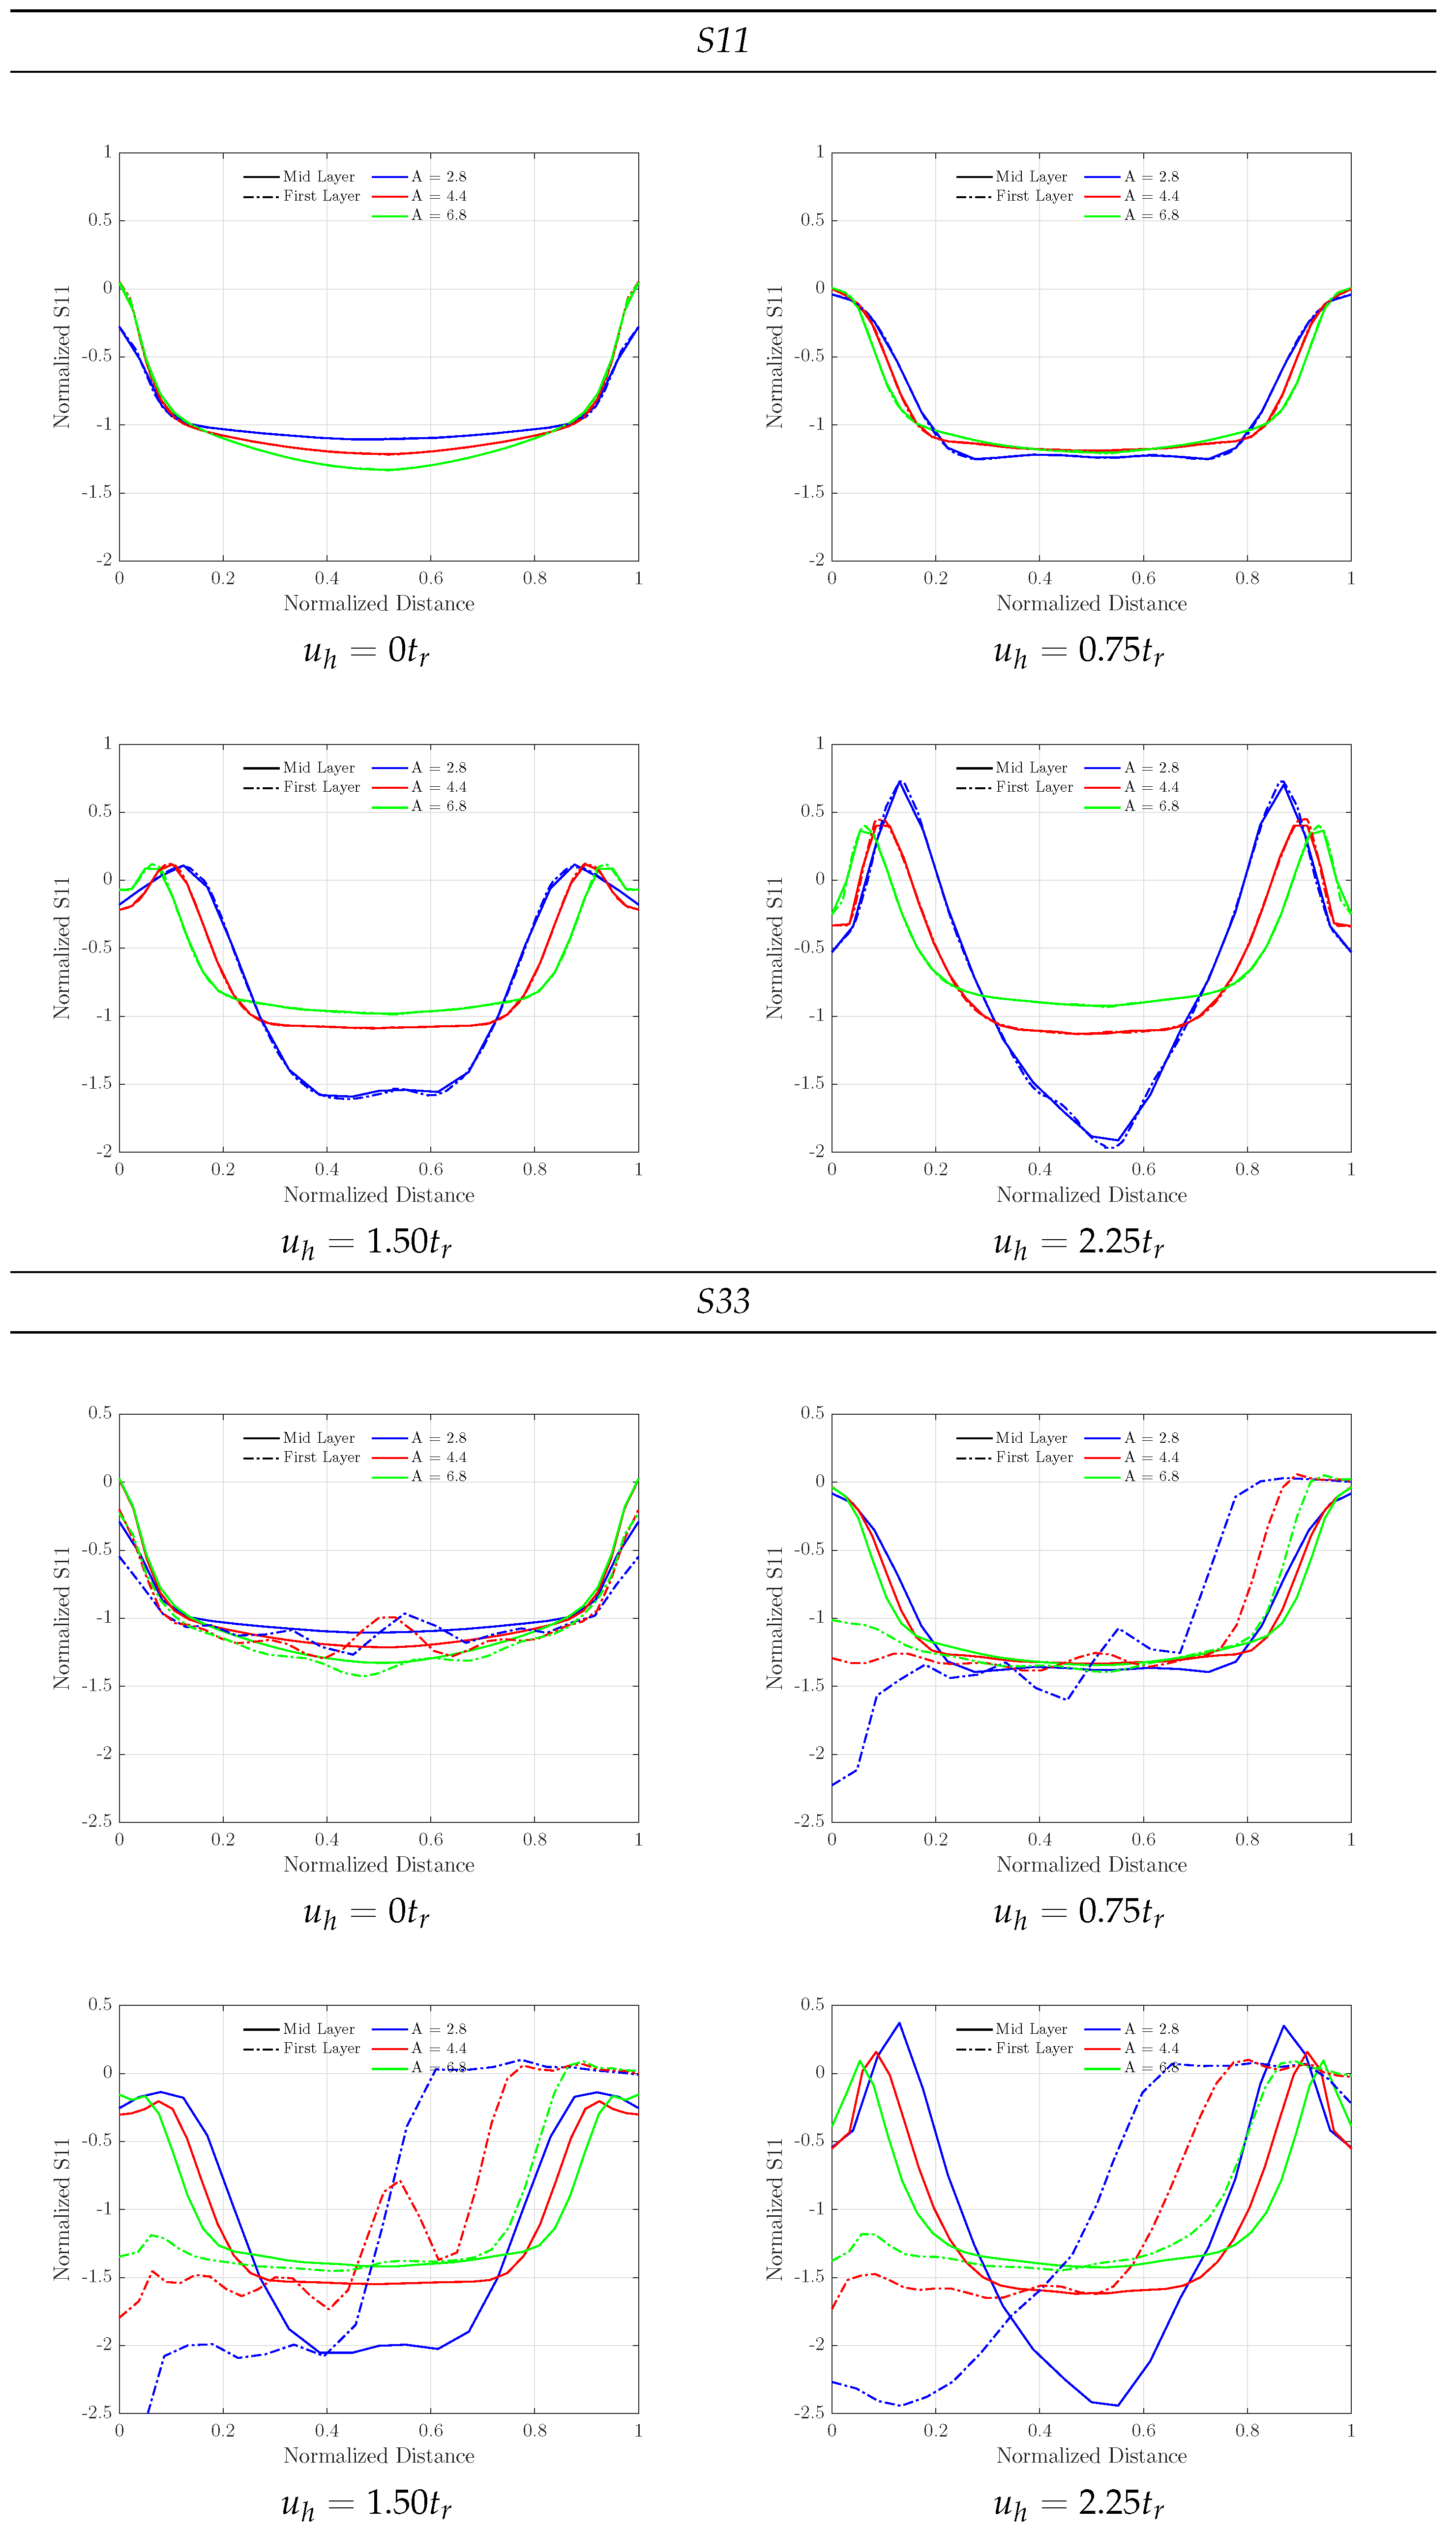
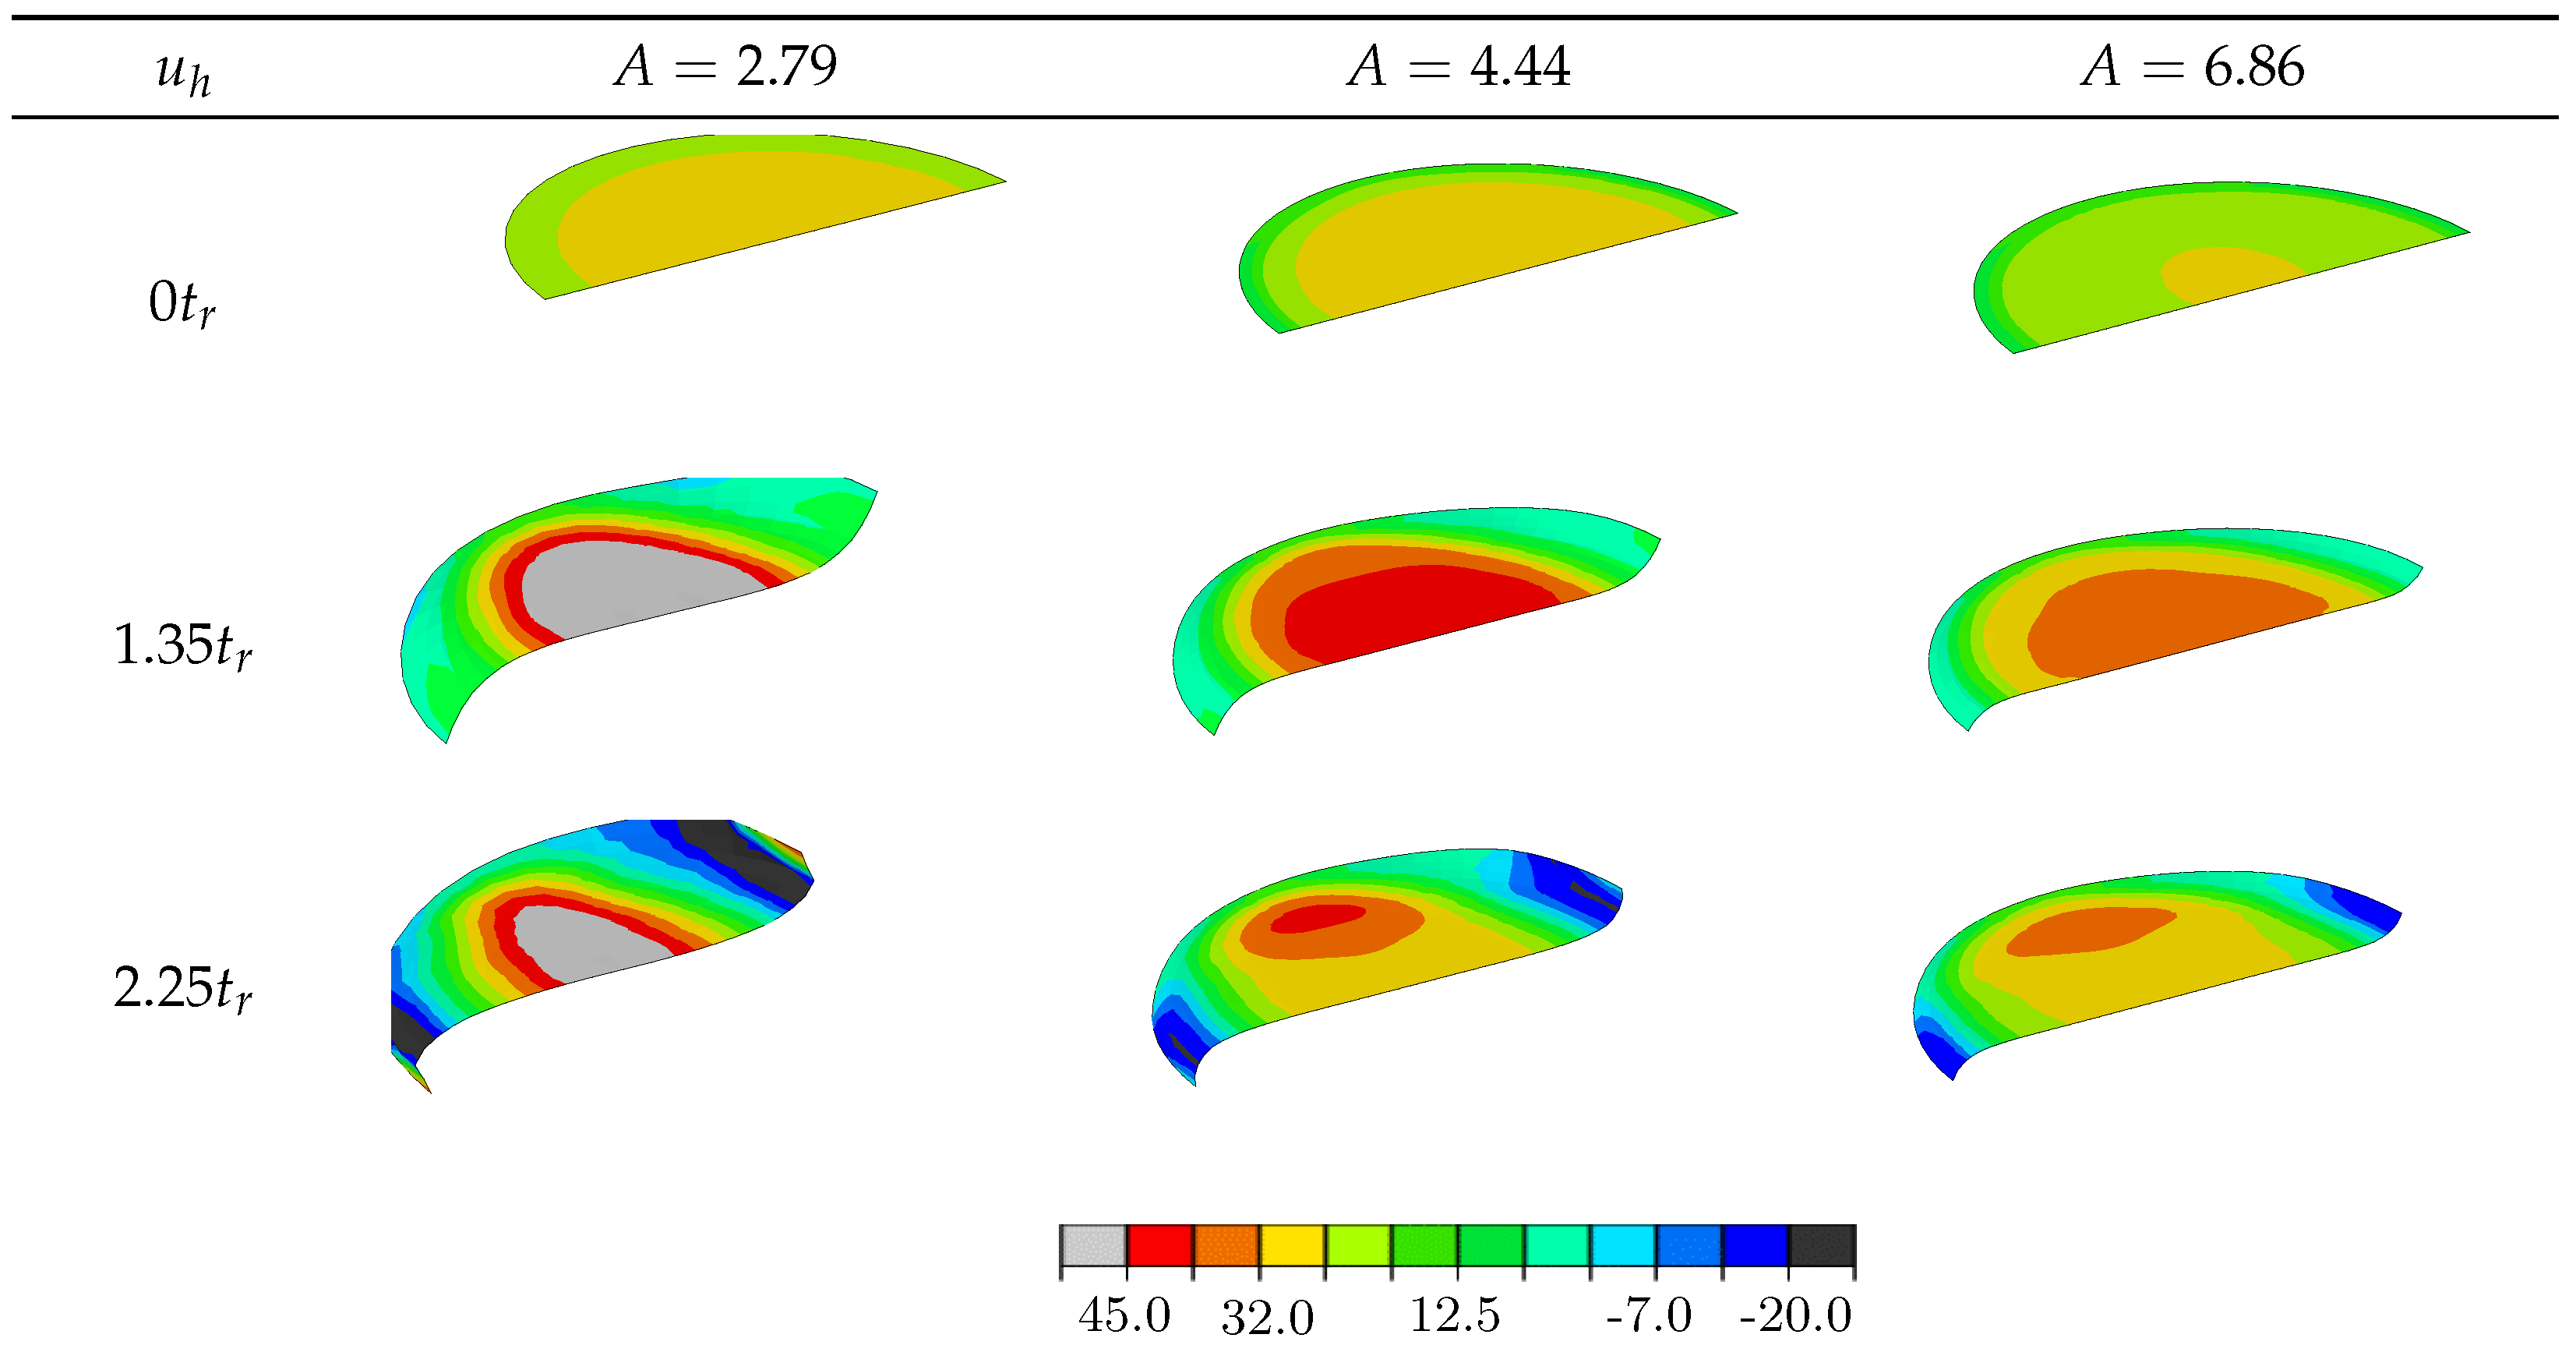
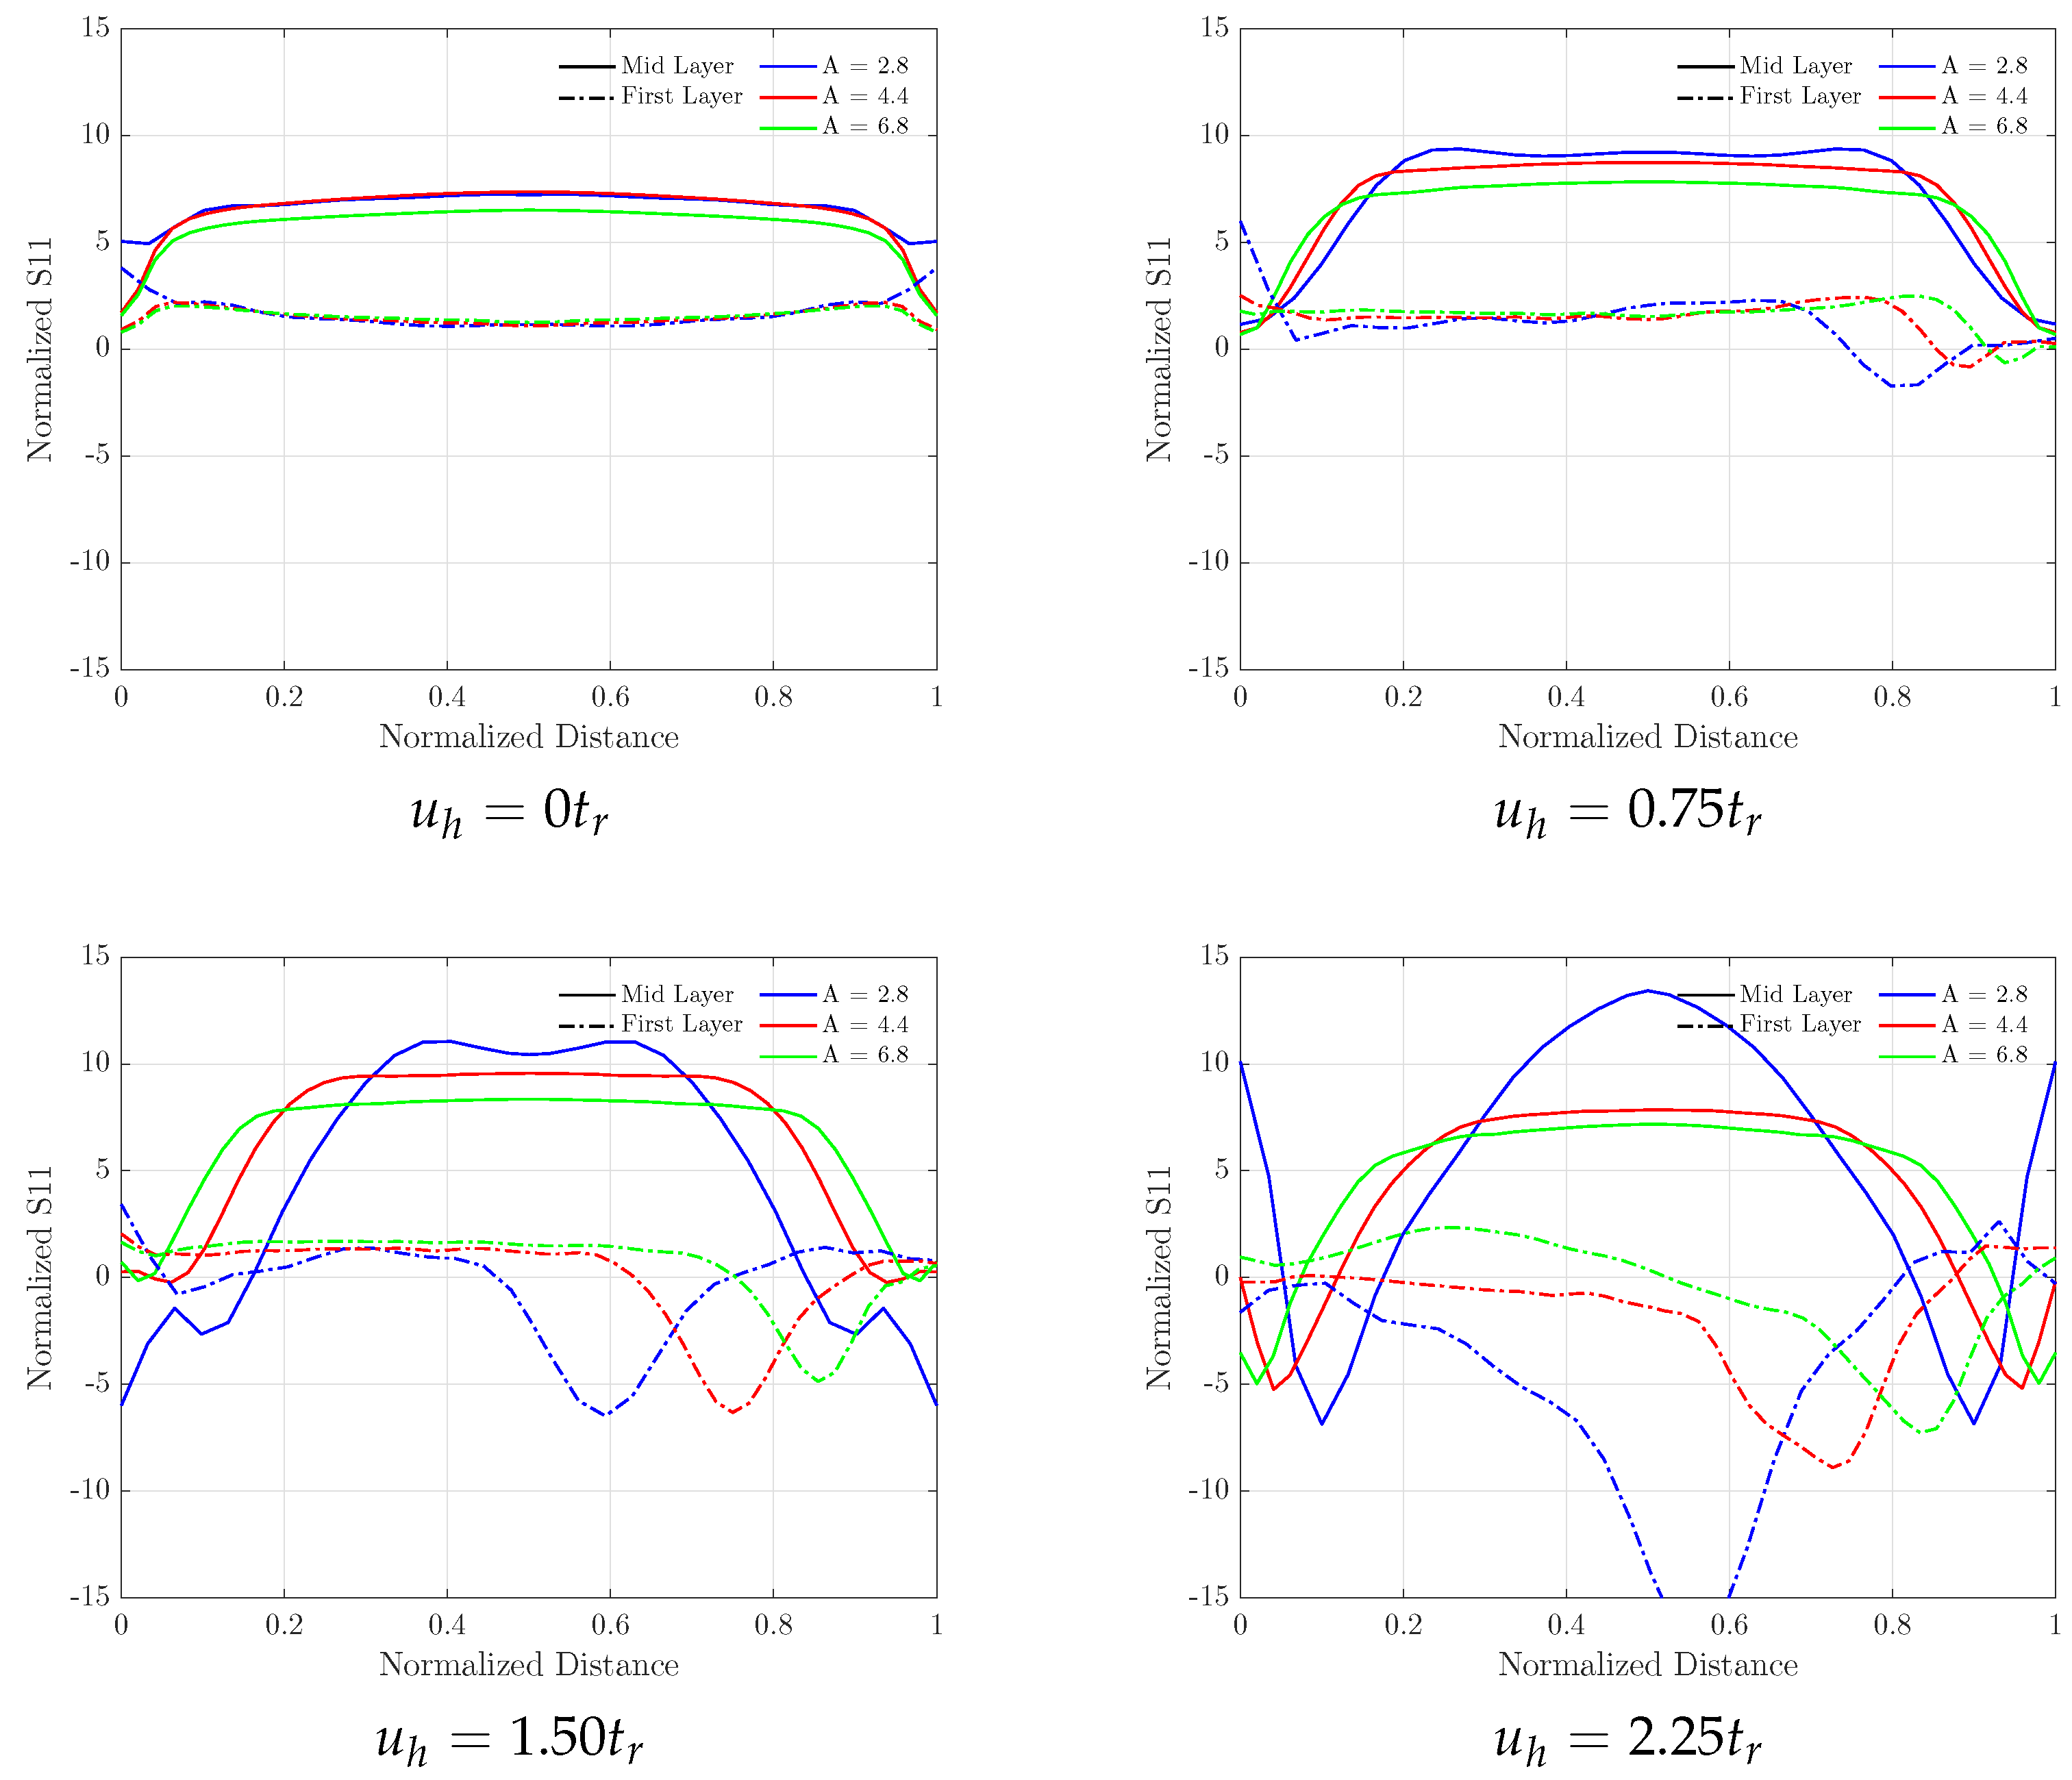
3.2. Influence of Aspect Ratio, A

The normal axial and vertical stress distributions as well as the stresses along the symmetry axis are presented in Figure 13 and Figure 14. It can be observed that the normal axial stress working in compression mode exhibits lower values at decreasing aspect ratios, presenting a very small free stress area.
With increasing lateral deformation, higher compressive stress can be observed at the central area combined with the higher tensile stresses at the exterior zone of the specimen, with the maximal compression and tension being 200% and 75% of the applied vertical pressure, respectively.
Figure 14 shows that, with smaller aspect ratios, increasing vertical normal stress S33 values are obtained. The stresses on the first elastomer layer indicate that the stress-free zone in the specimen 27RL_30S, with aspect ratio A = 2.79 , also represents about 40% of the bearings’ diameter, with the stress on the opposite area being higher than 250% of the applied vertical pressure.
Regarding the stress distribution in the reinforcement, the specimens 17RL_22S, where A = 4.44 , and 11RL_22S, with A = 6.86 , exhibit similar patterns both for the maximum value reached and for the surface that is subjected to tensile stress, as observed in Figure 15. On the other hand, specimen 27RL_22S shows maximal stresses up to 1.6 times larger than the previous bearings. As can be seen in Figure 16, the first layer of reinforcement works in a zone comprising more than 80% of the specimen diameter under compression, reaching values up to 15 times the applied pressure.
Figure 17 depicts the mechanical properties k h and ξ calculated for different values of aspect ratio. It is remarkable to mention that the horizontal stiffness for specimen 11RL_22S is close to those obtained in the experimental tests for the bonded bearings.
The damping coefficient value for specimen 27RL_22S presents a sharp increase at 200 % t r lateral deformation. As shown in Figure 18, the tangent of the force–displacement curve flattens at increasing horizontal deflection and takes negative values when the deformation is greater than 100%. This fact points to the unstable overall behavior of the bearing and could explain the unexpected spring in the damping coefficient value.

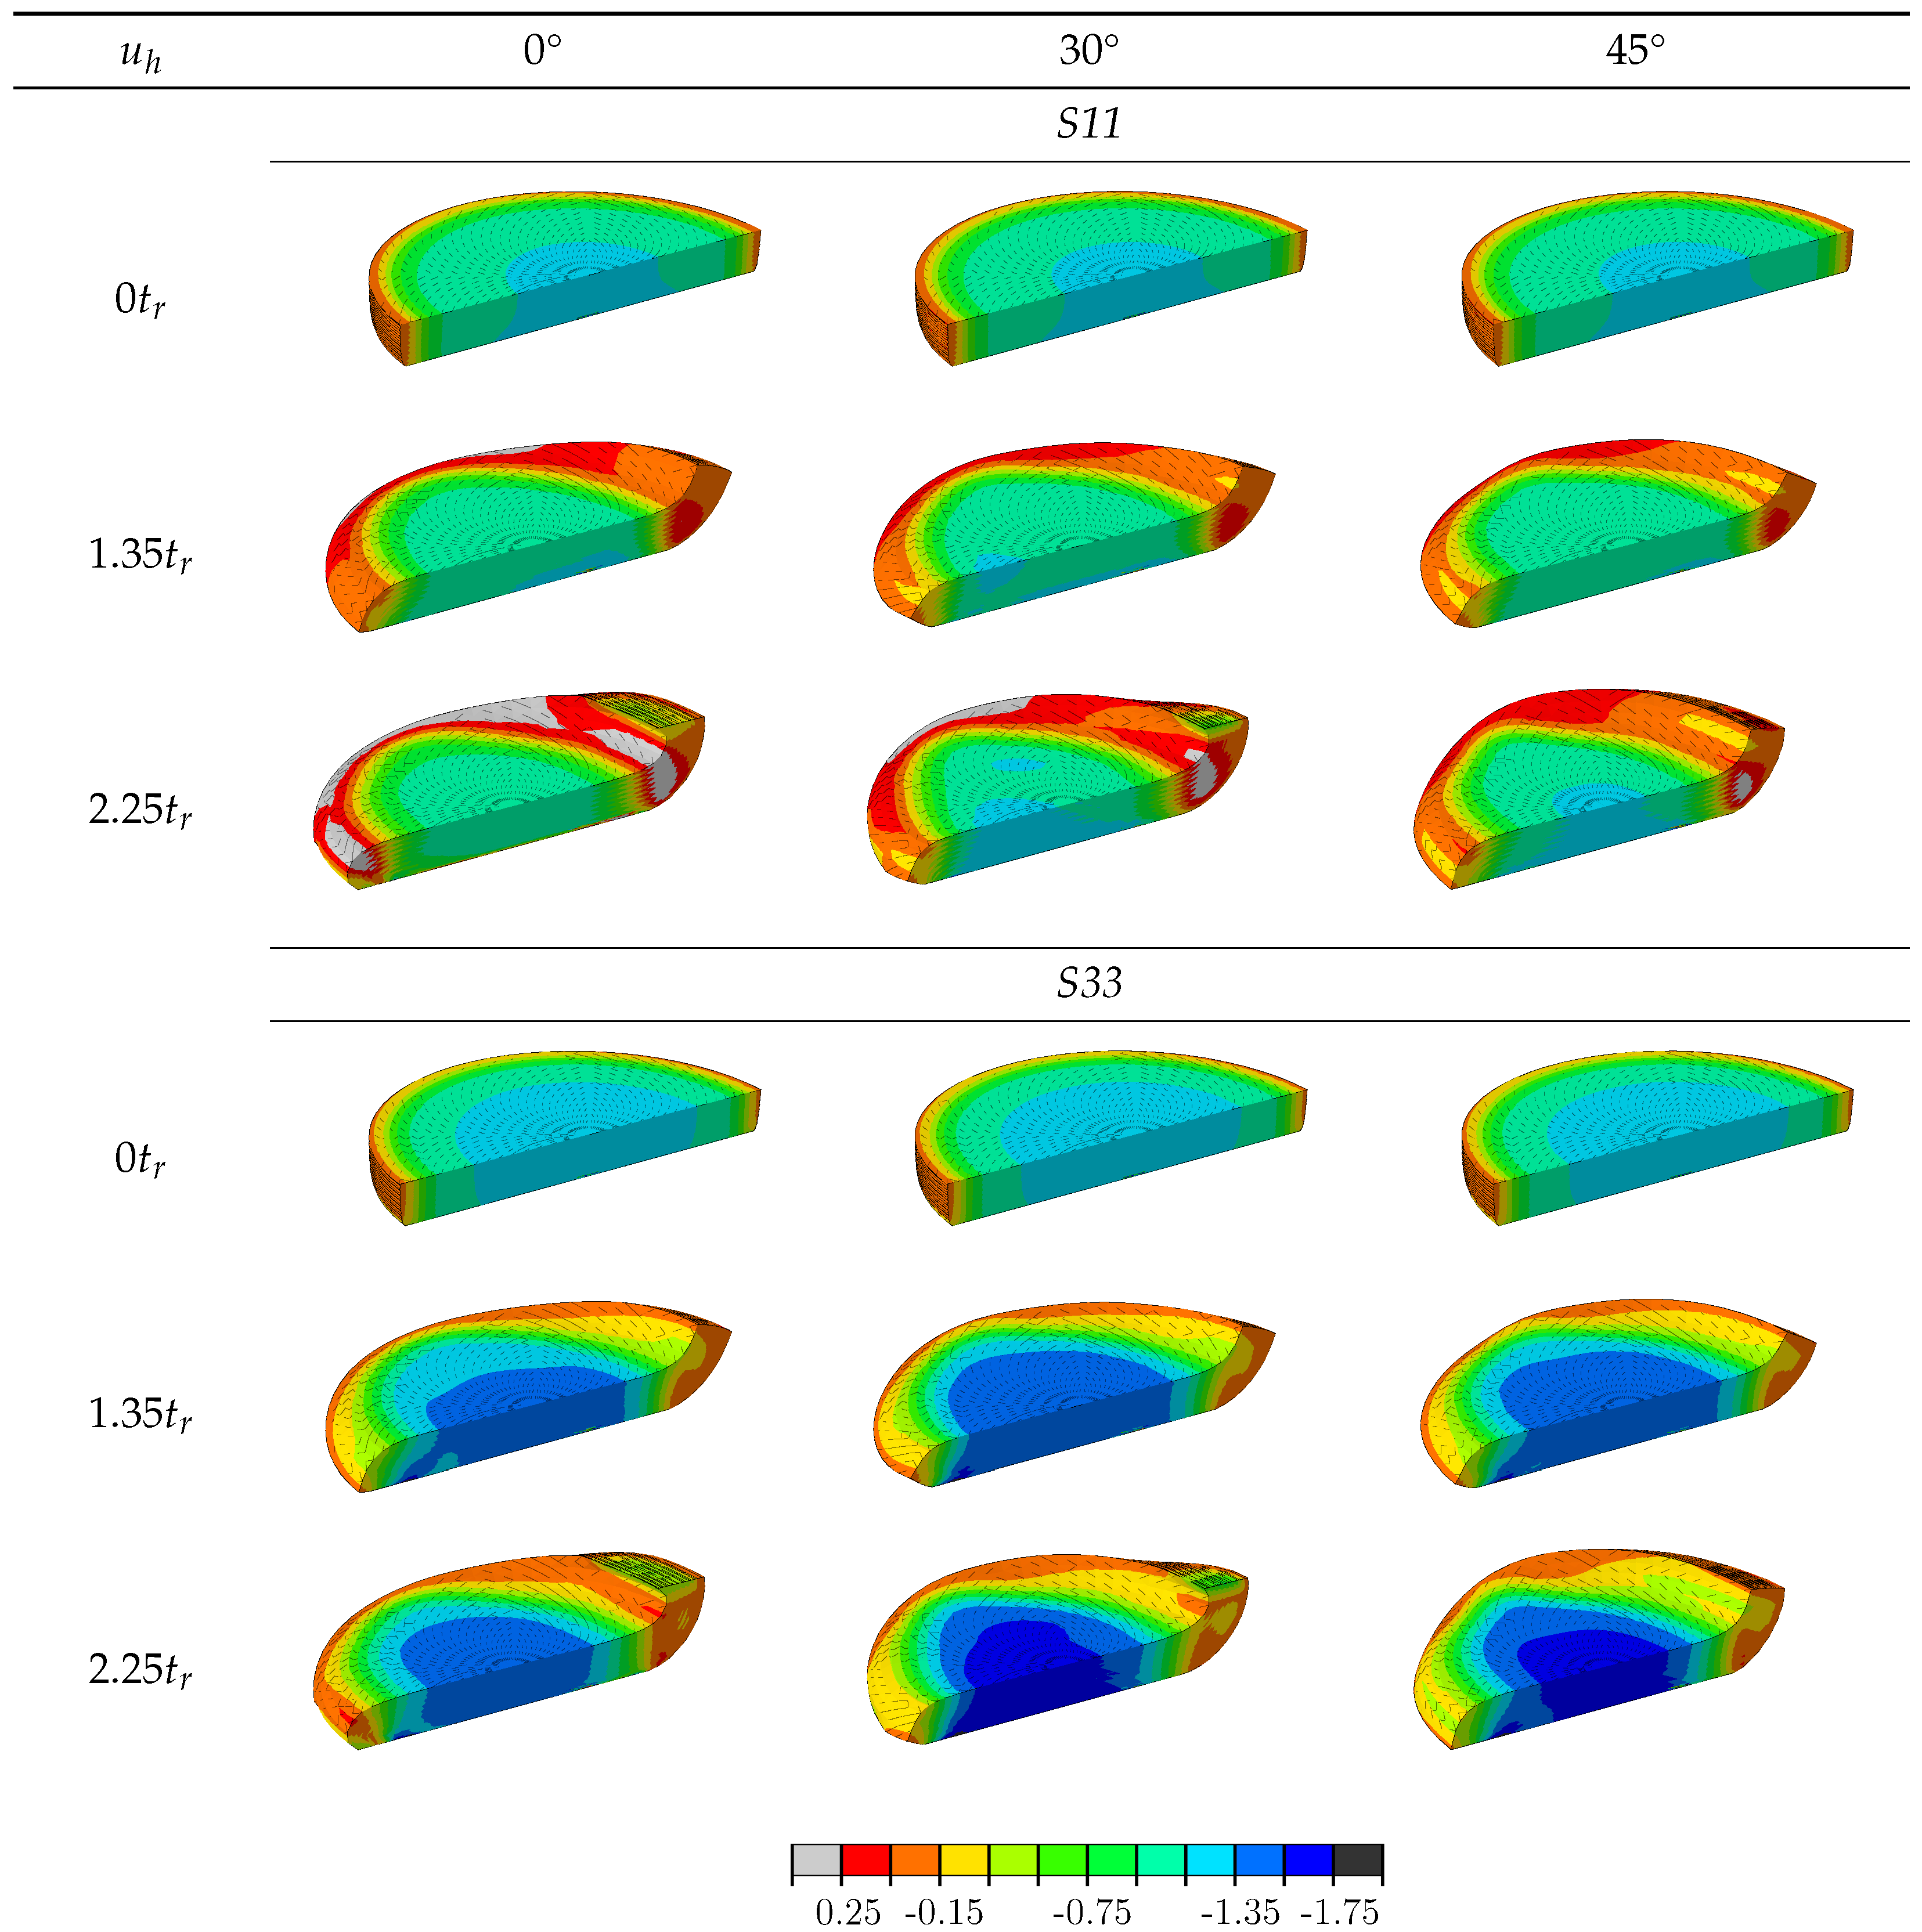
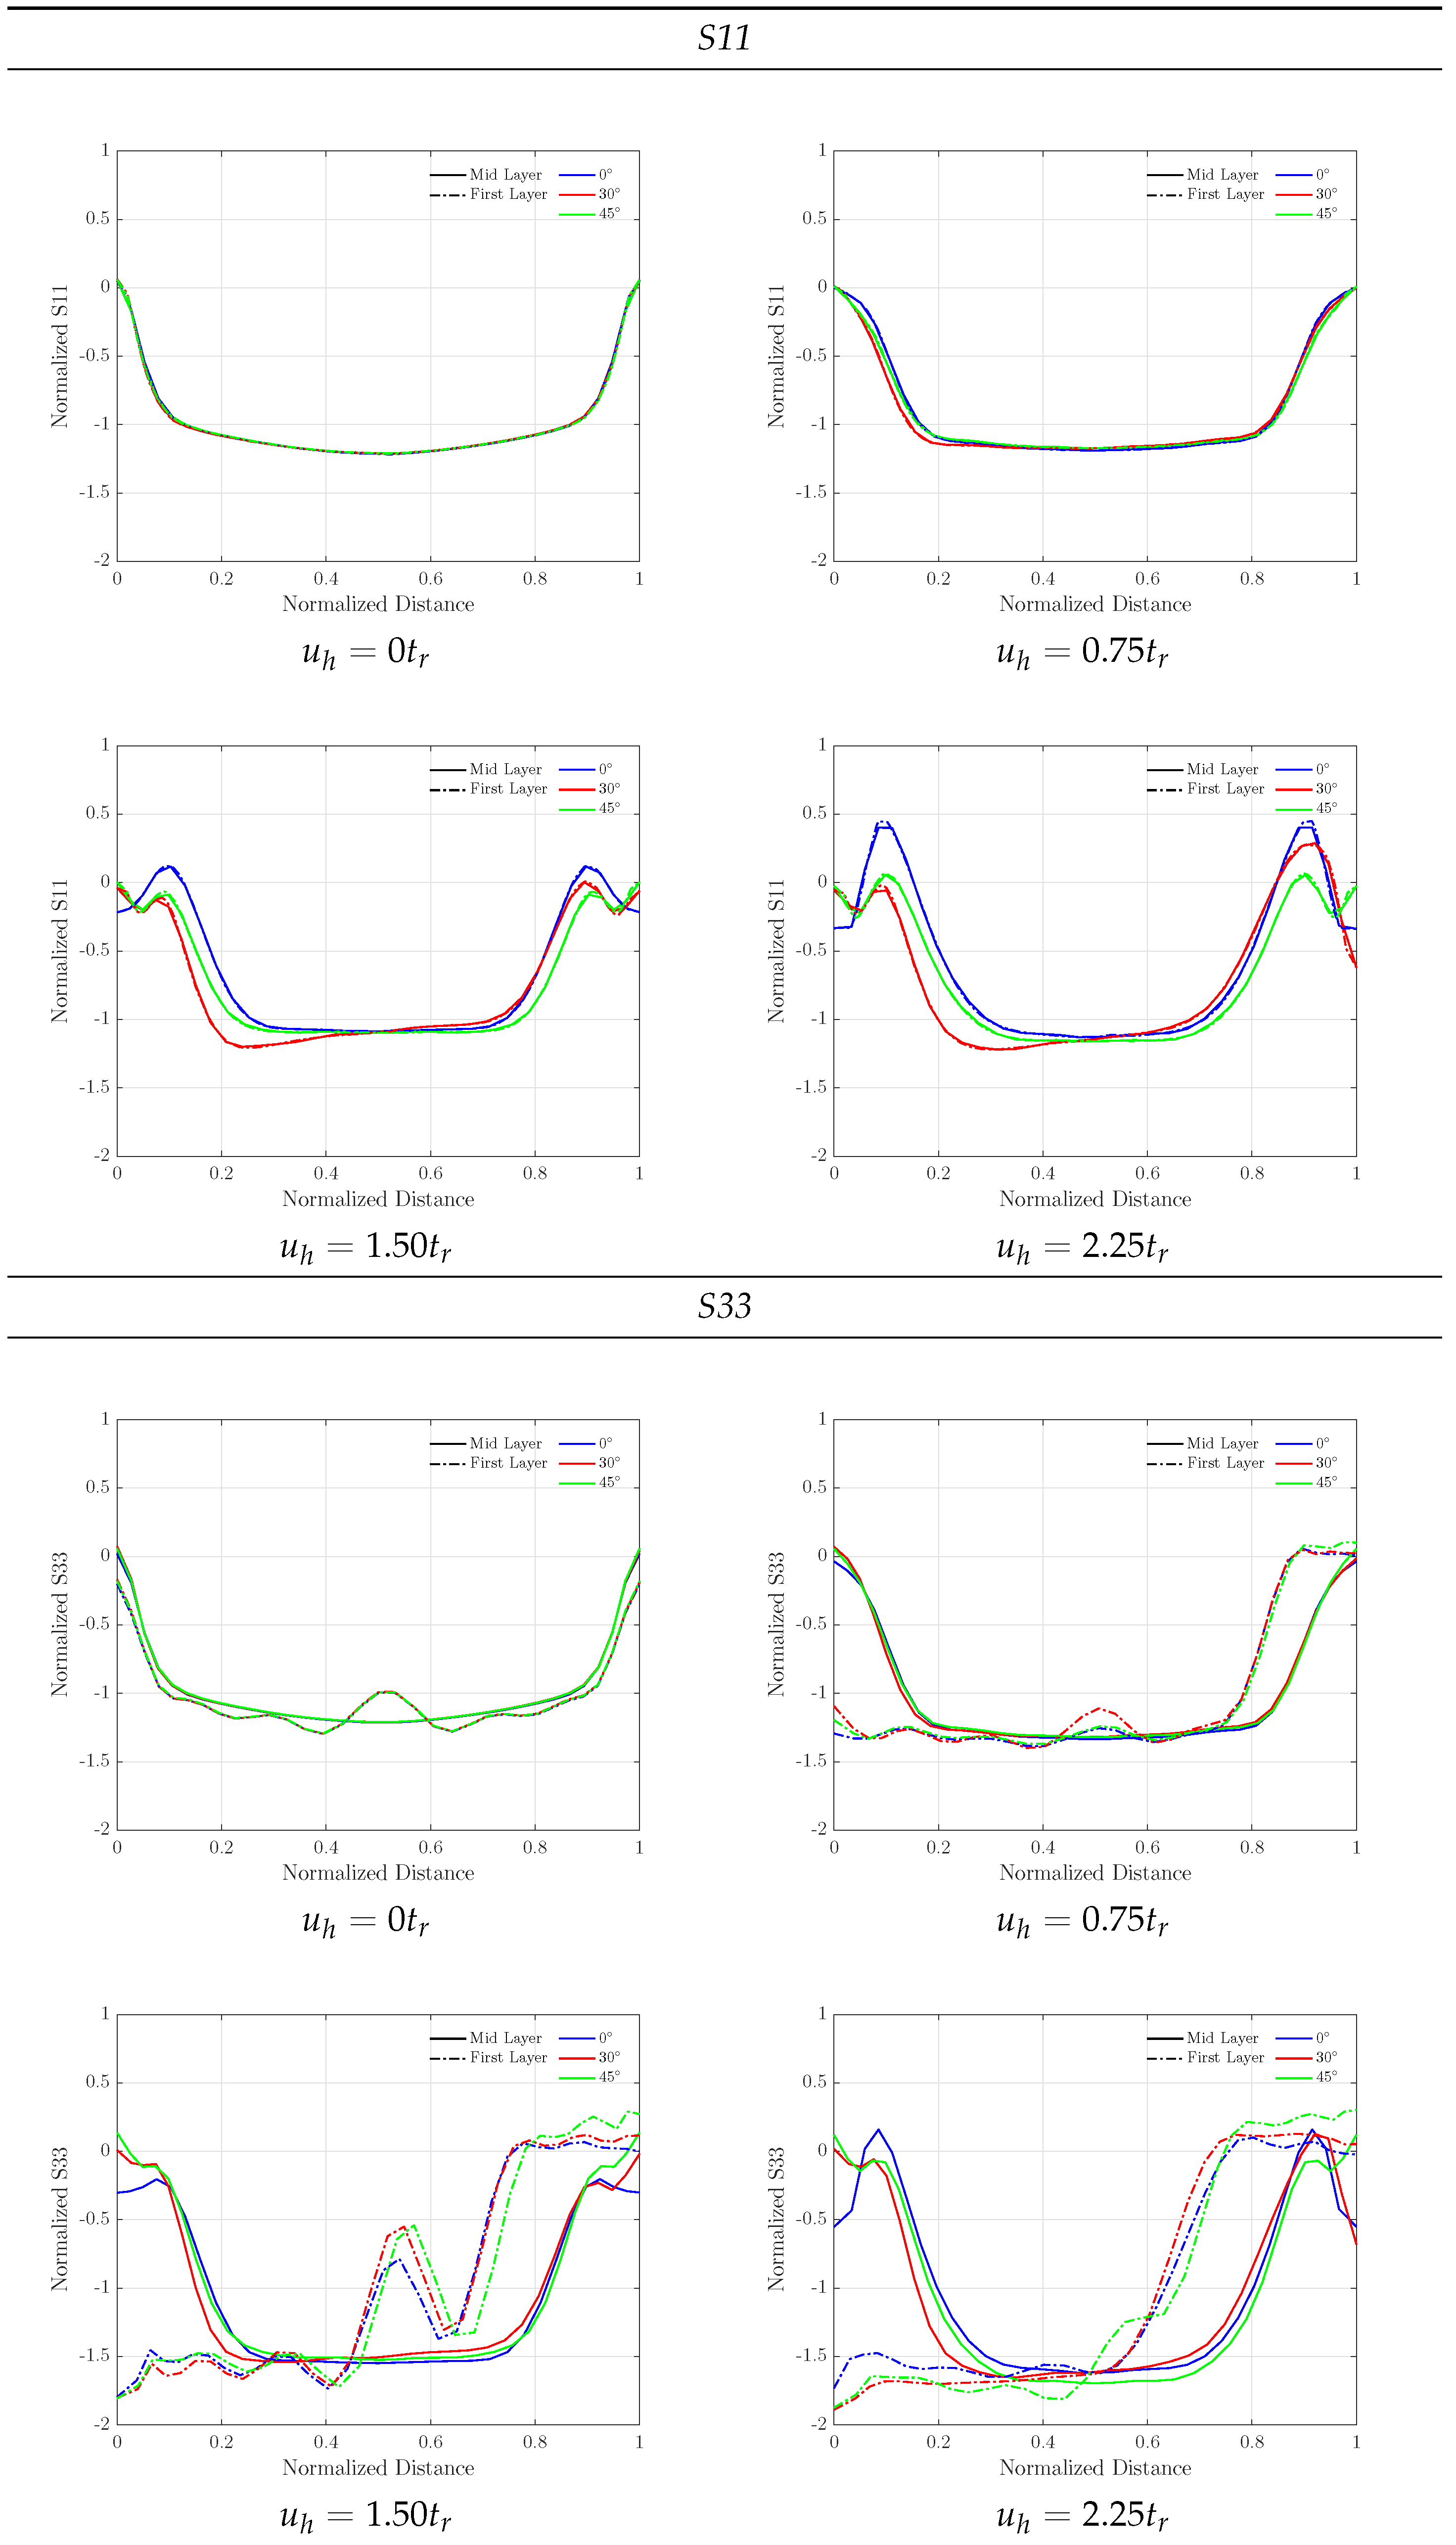
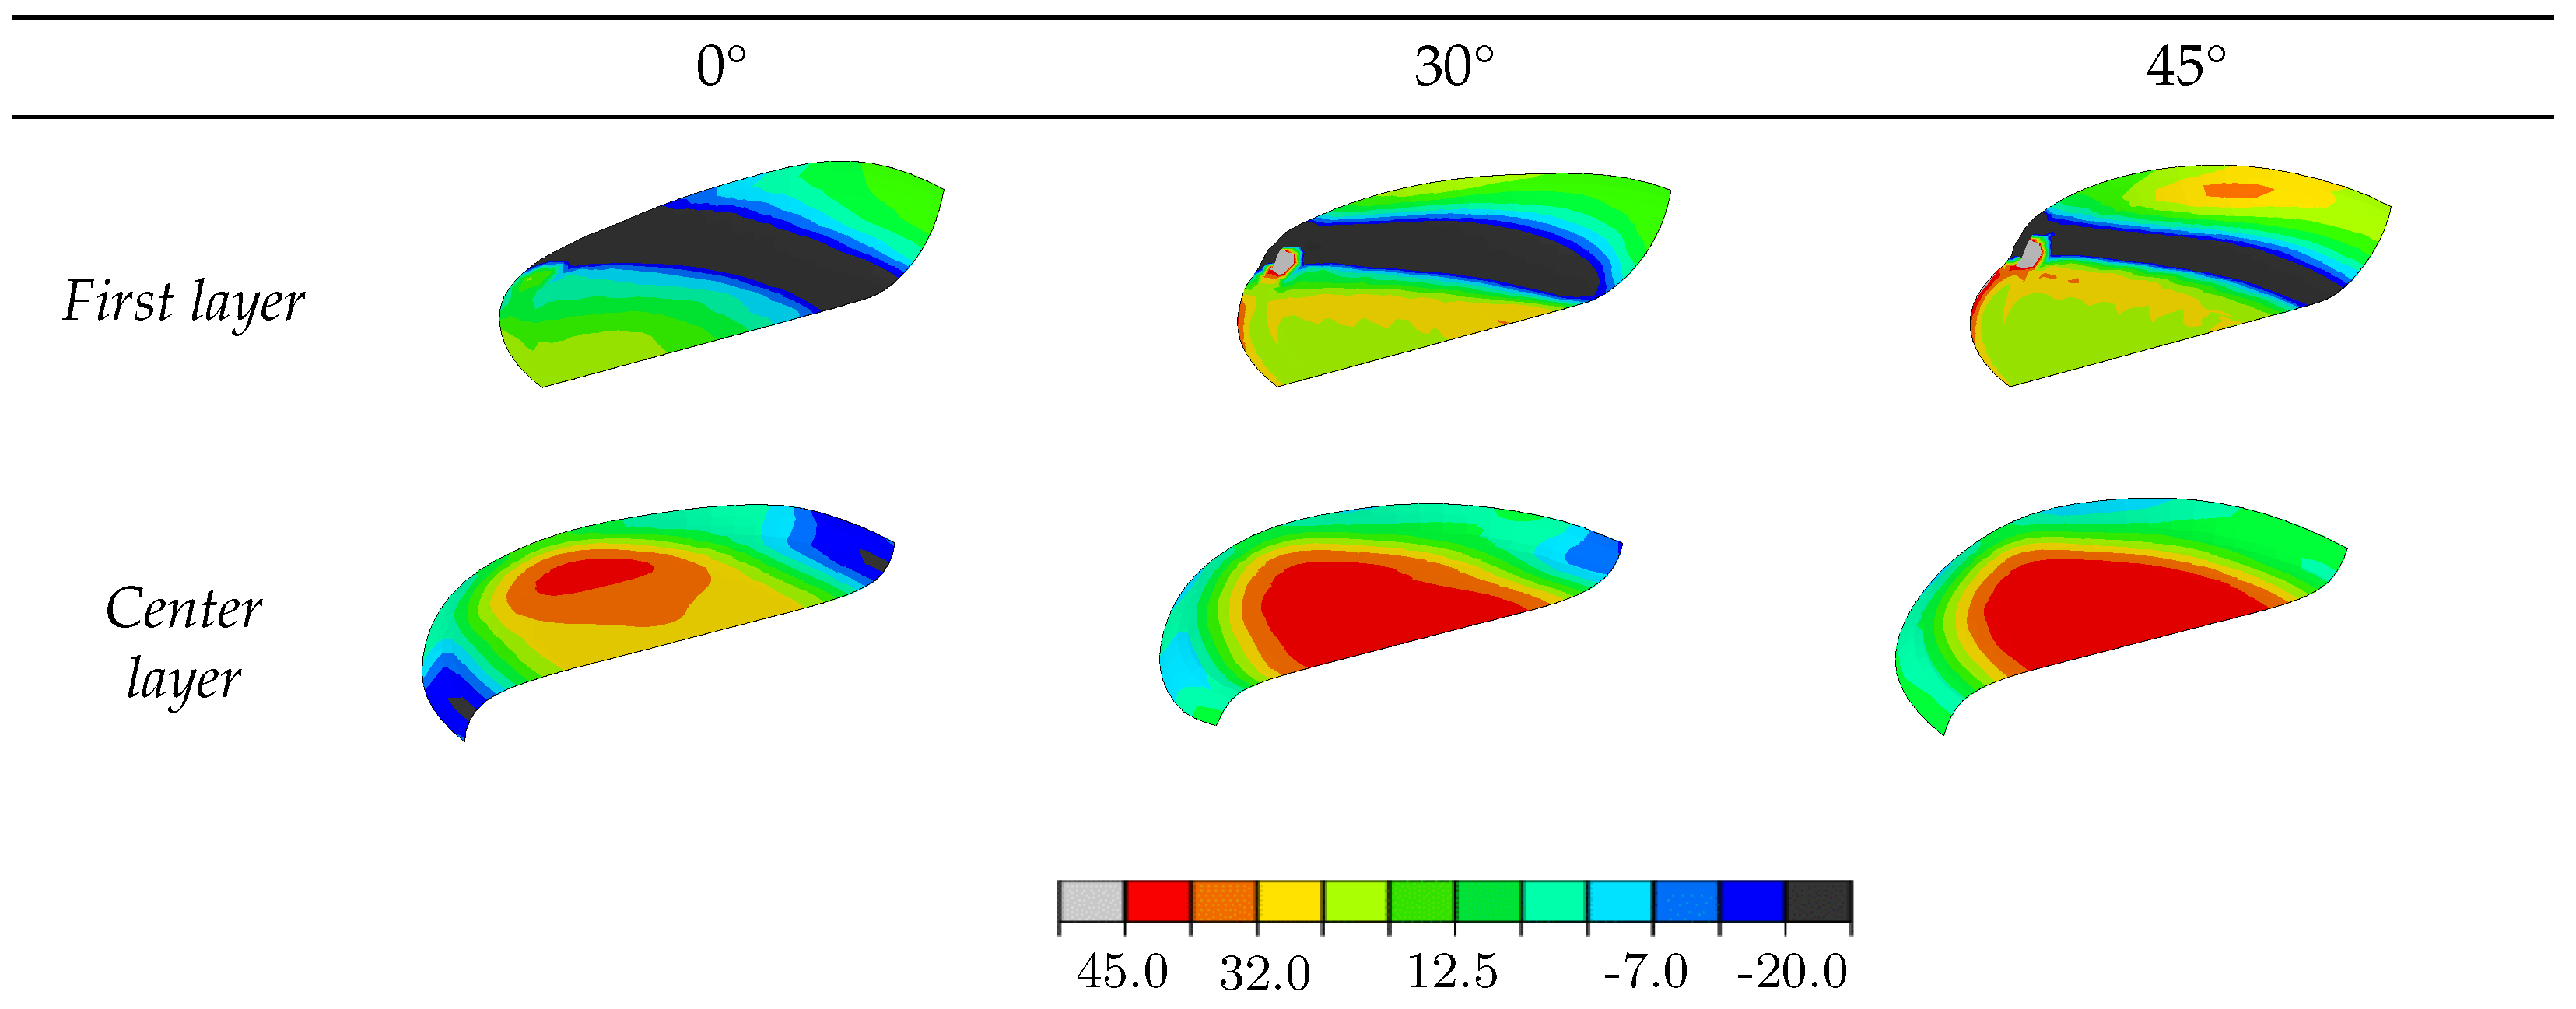
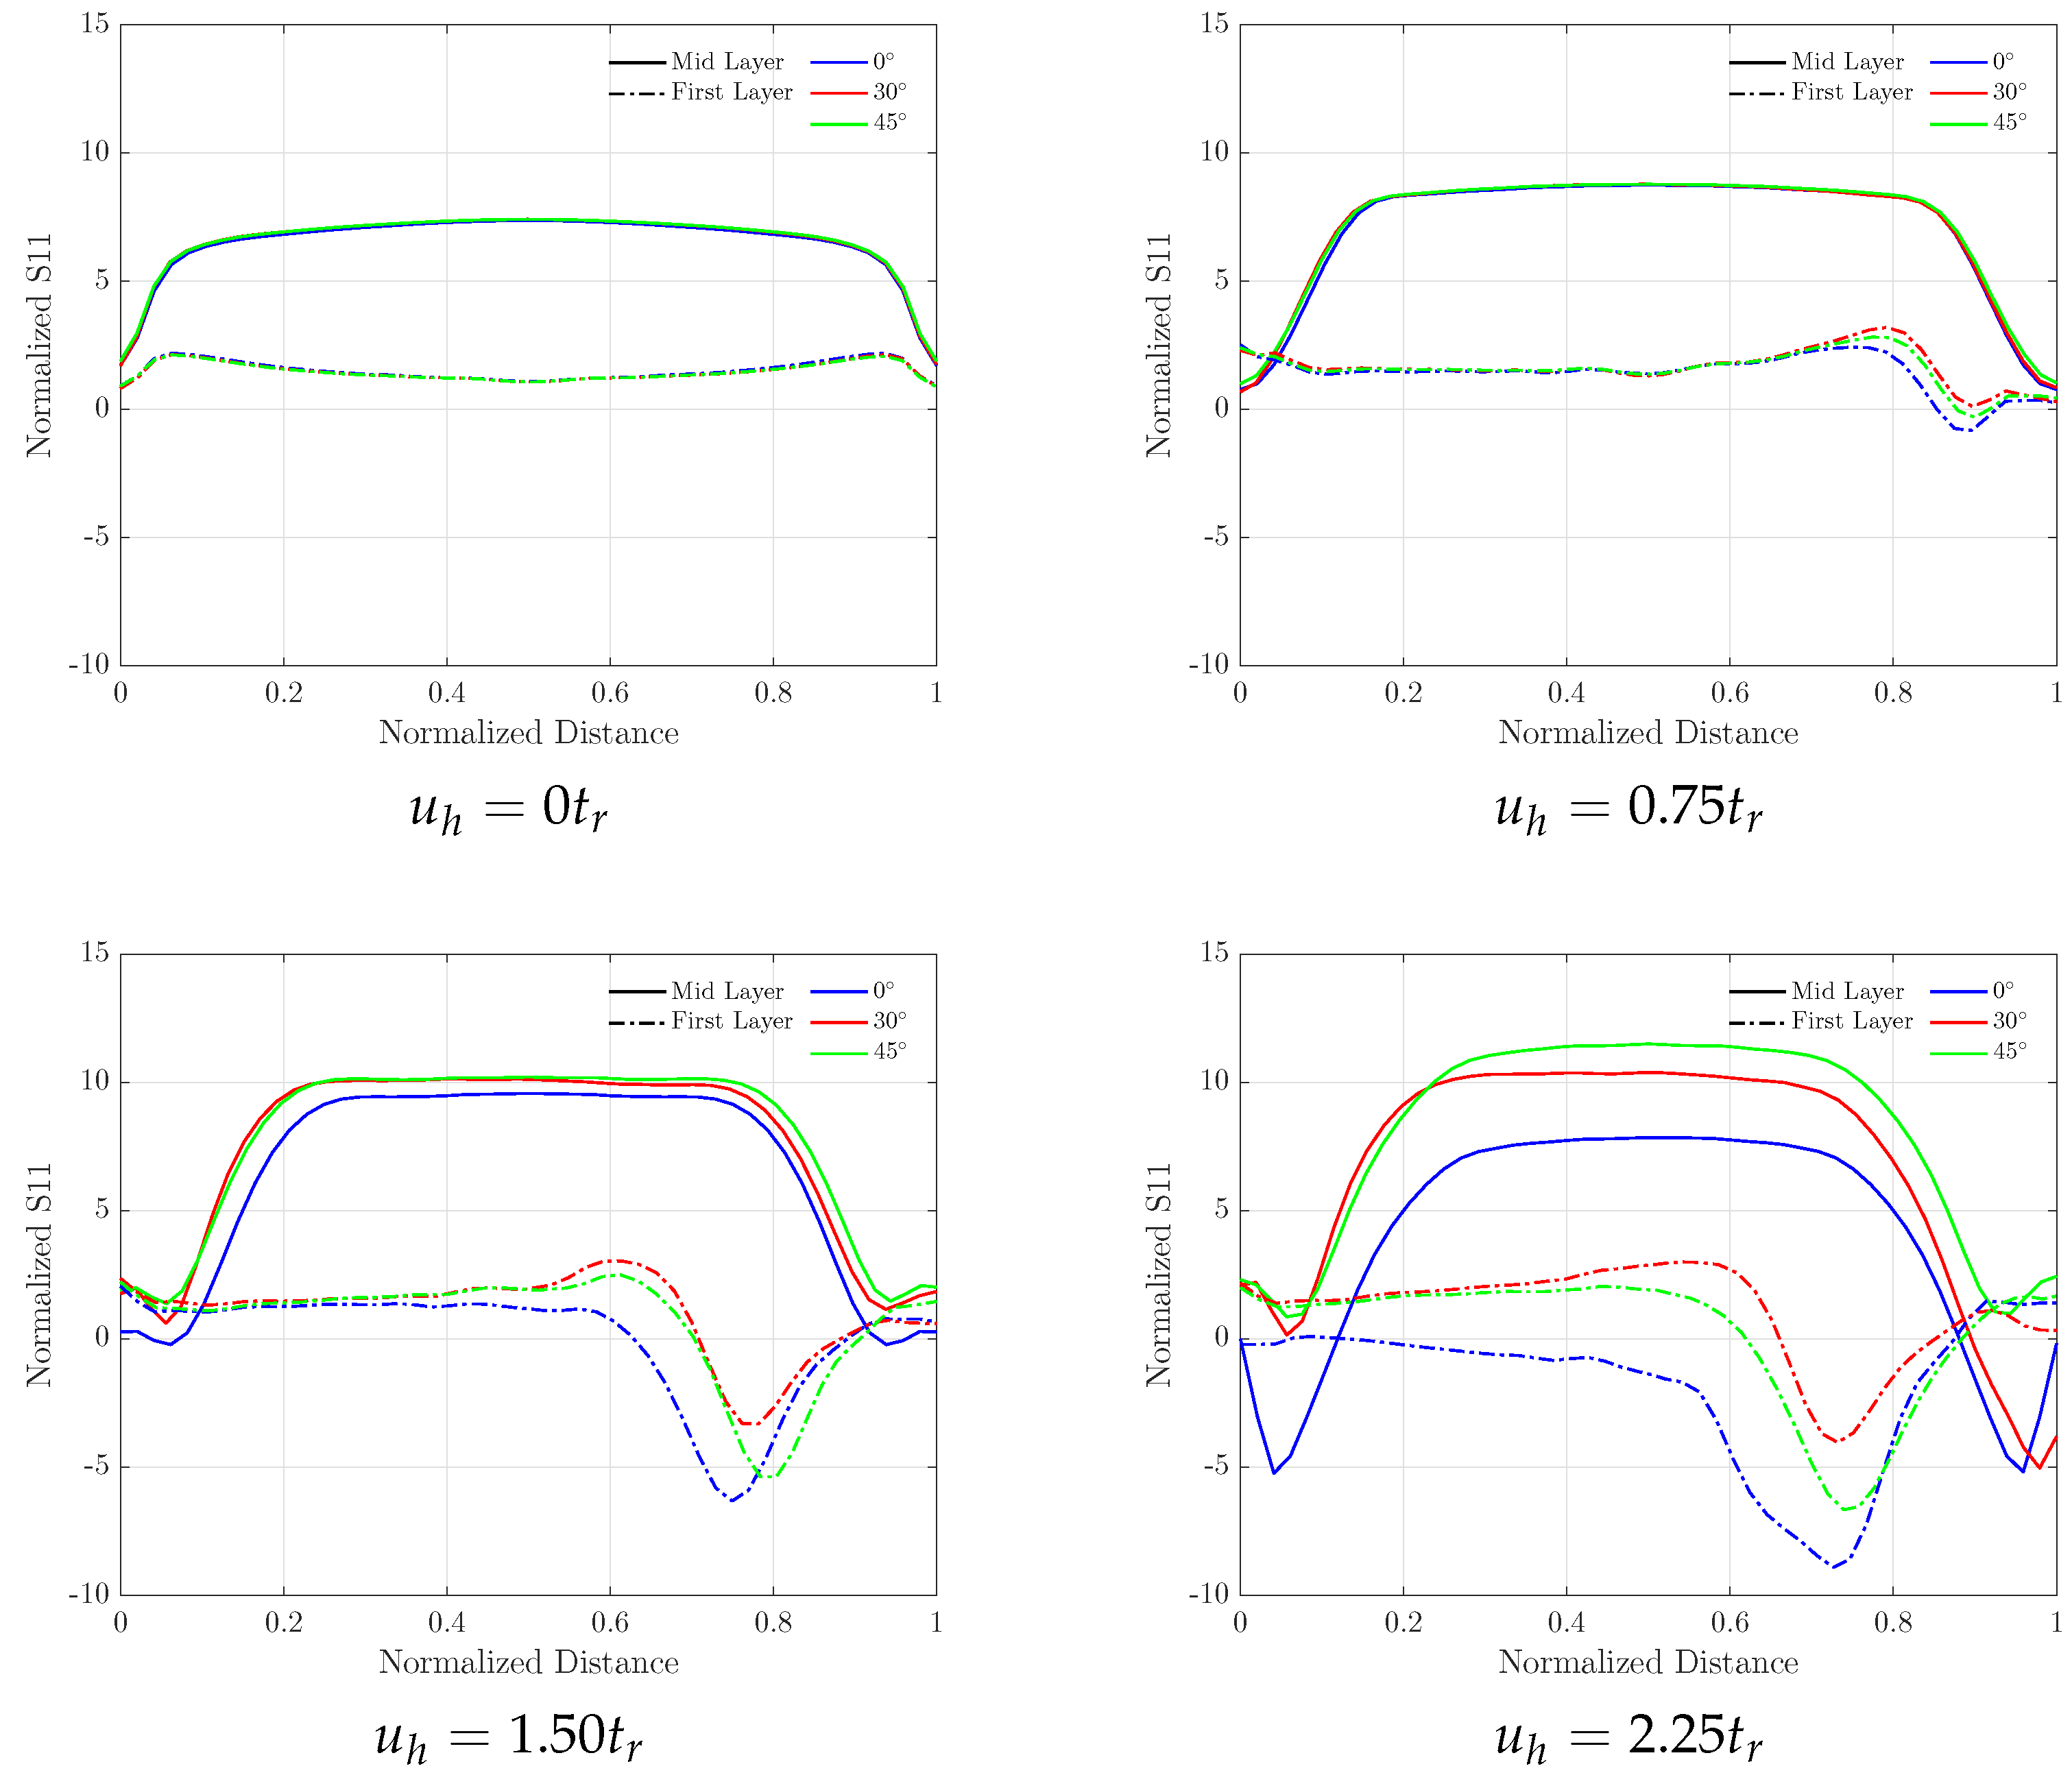
3.3. Influence of Reinforcement Orientation

The stress distribution on the elastomeric matrix on all three investigated reinforcement orientations exhibits similar patterns under horizontal deformations before the appearance of the rollover effect, as depicted in Figure 19.
Larger deformations cause a slight increase in the maximal compressive stress on the specimen with a 30° orientation and an increase in the area under compressive stress on the bearing with a 45° reinforcement orientation. Any rotation in the orientation of the reinforcement avoids the occurrence of tensile axial stress in the elastomeric matrix. The vertical stress distribution, S33, on the central as well as on the first elastomeric layer exhibits a similar configuration for the three investigated reinforcement orientations except for a small area under tensile stress at the external zone of the first layer of the specimen with a 45° reinforcement orientation, as observed in Figure 20.
The stress distributions on the reinforcement shown in Figure 21 and Figure 22 present similar structures for all tested orientations before the appearance of rollover. Increasing the horizontal deformation under the effect of rollover causes larger tensile stress on the reinforcement, and it is remarkable that compressive stresses on the central reinforcement layer are avoided by applying a fiber orientation of 45°.
In Figure 23, reinforcement orientations other than 0° cause a softening in the mechanical behavior after the occurrence of a rollover in which no softening of the effective horizontal stiffness can be detected, while the equivalent damping ratio presents a clear increase for specimens with rotated reinforcements.

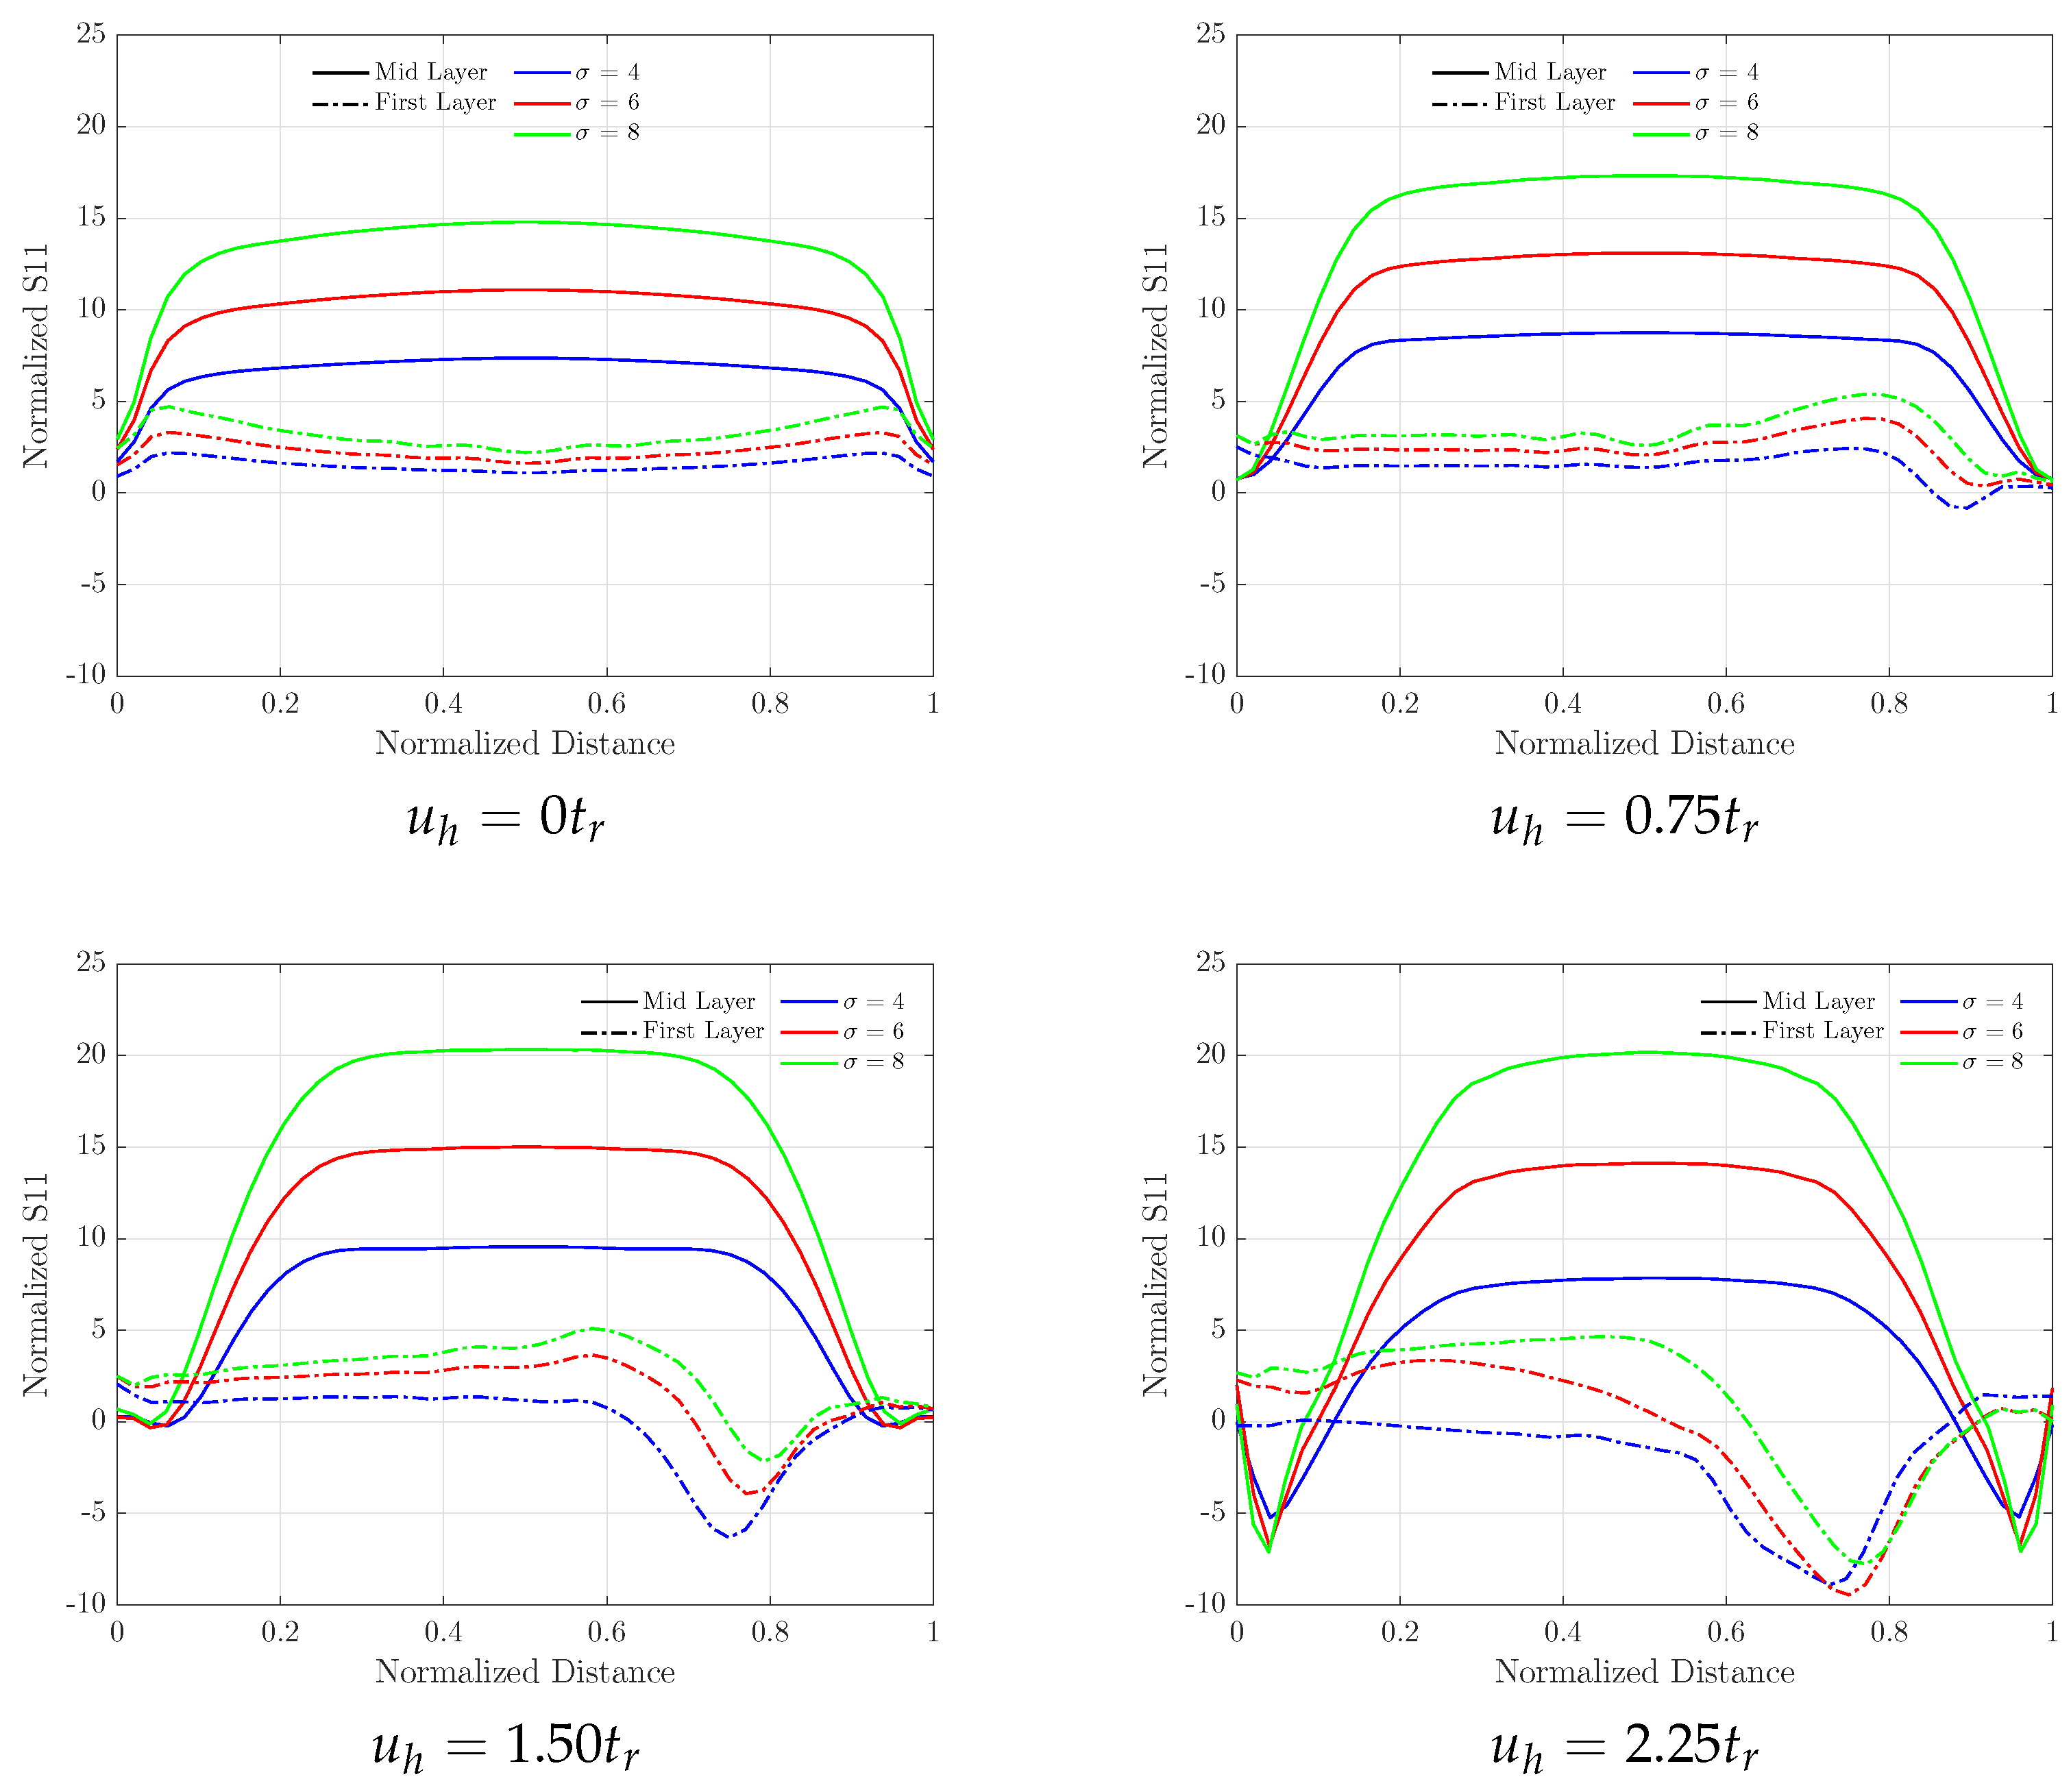
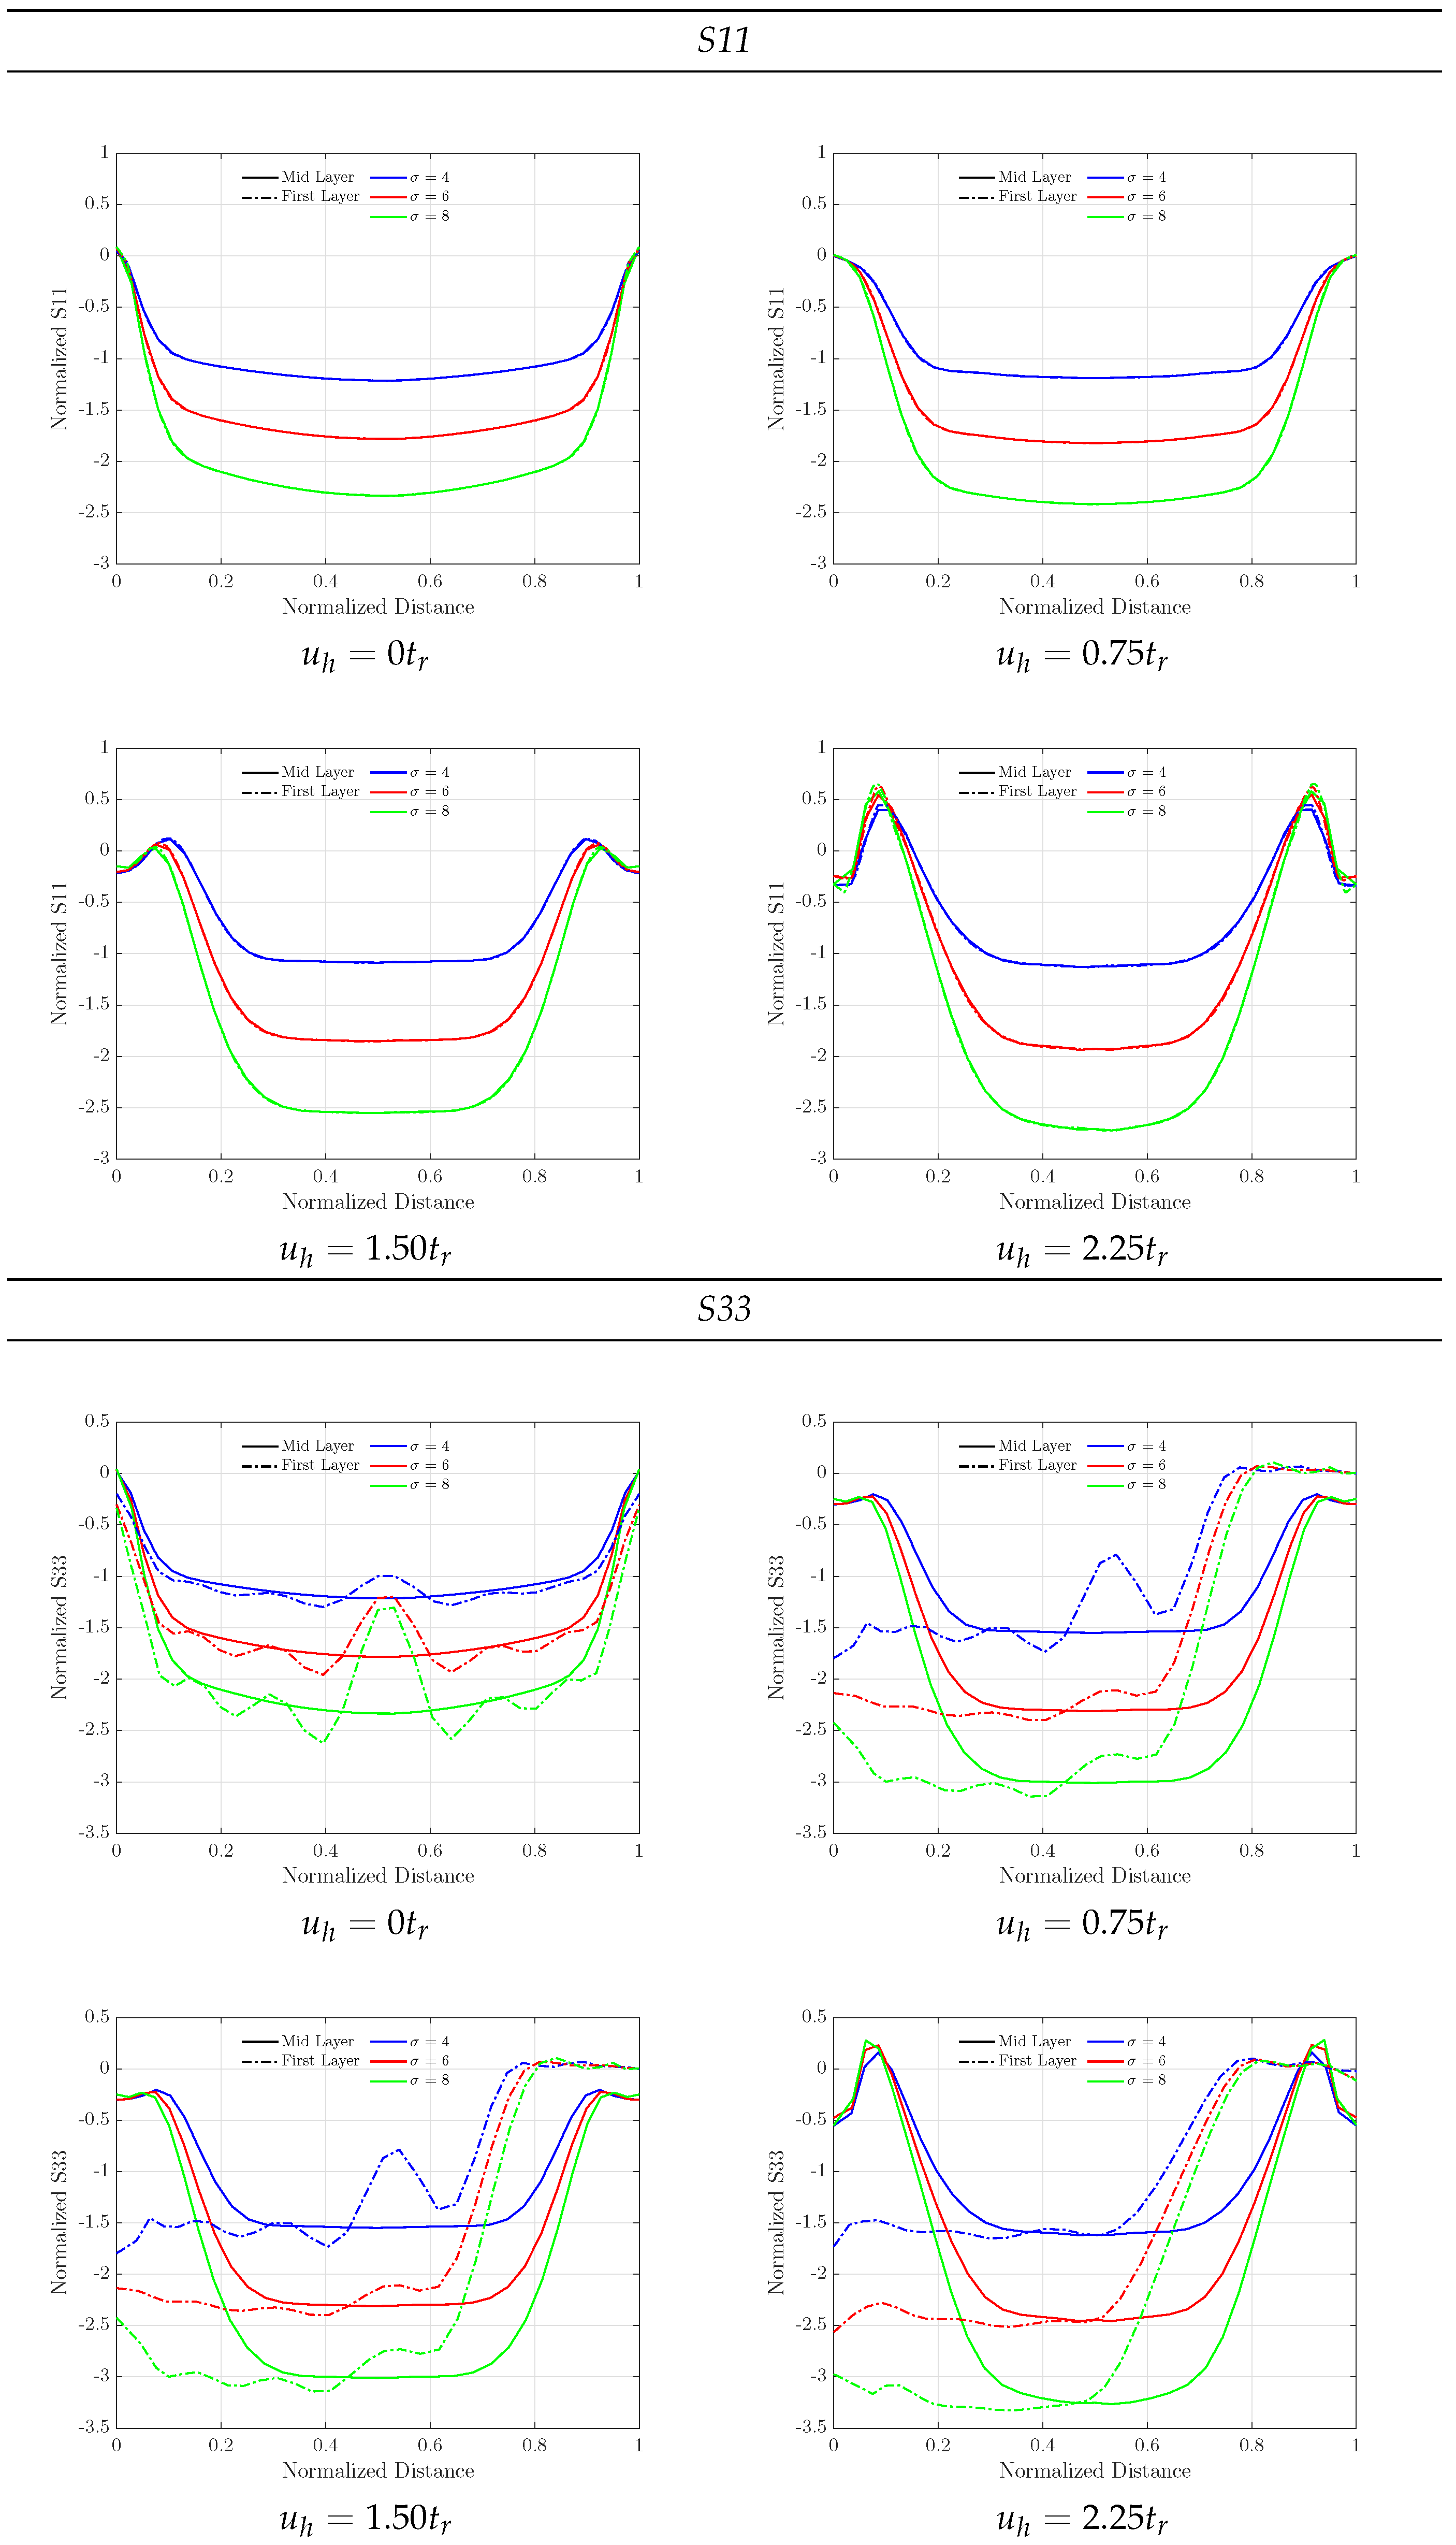
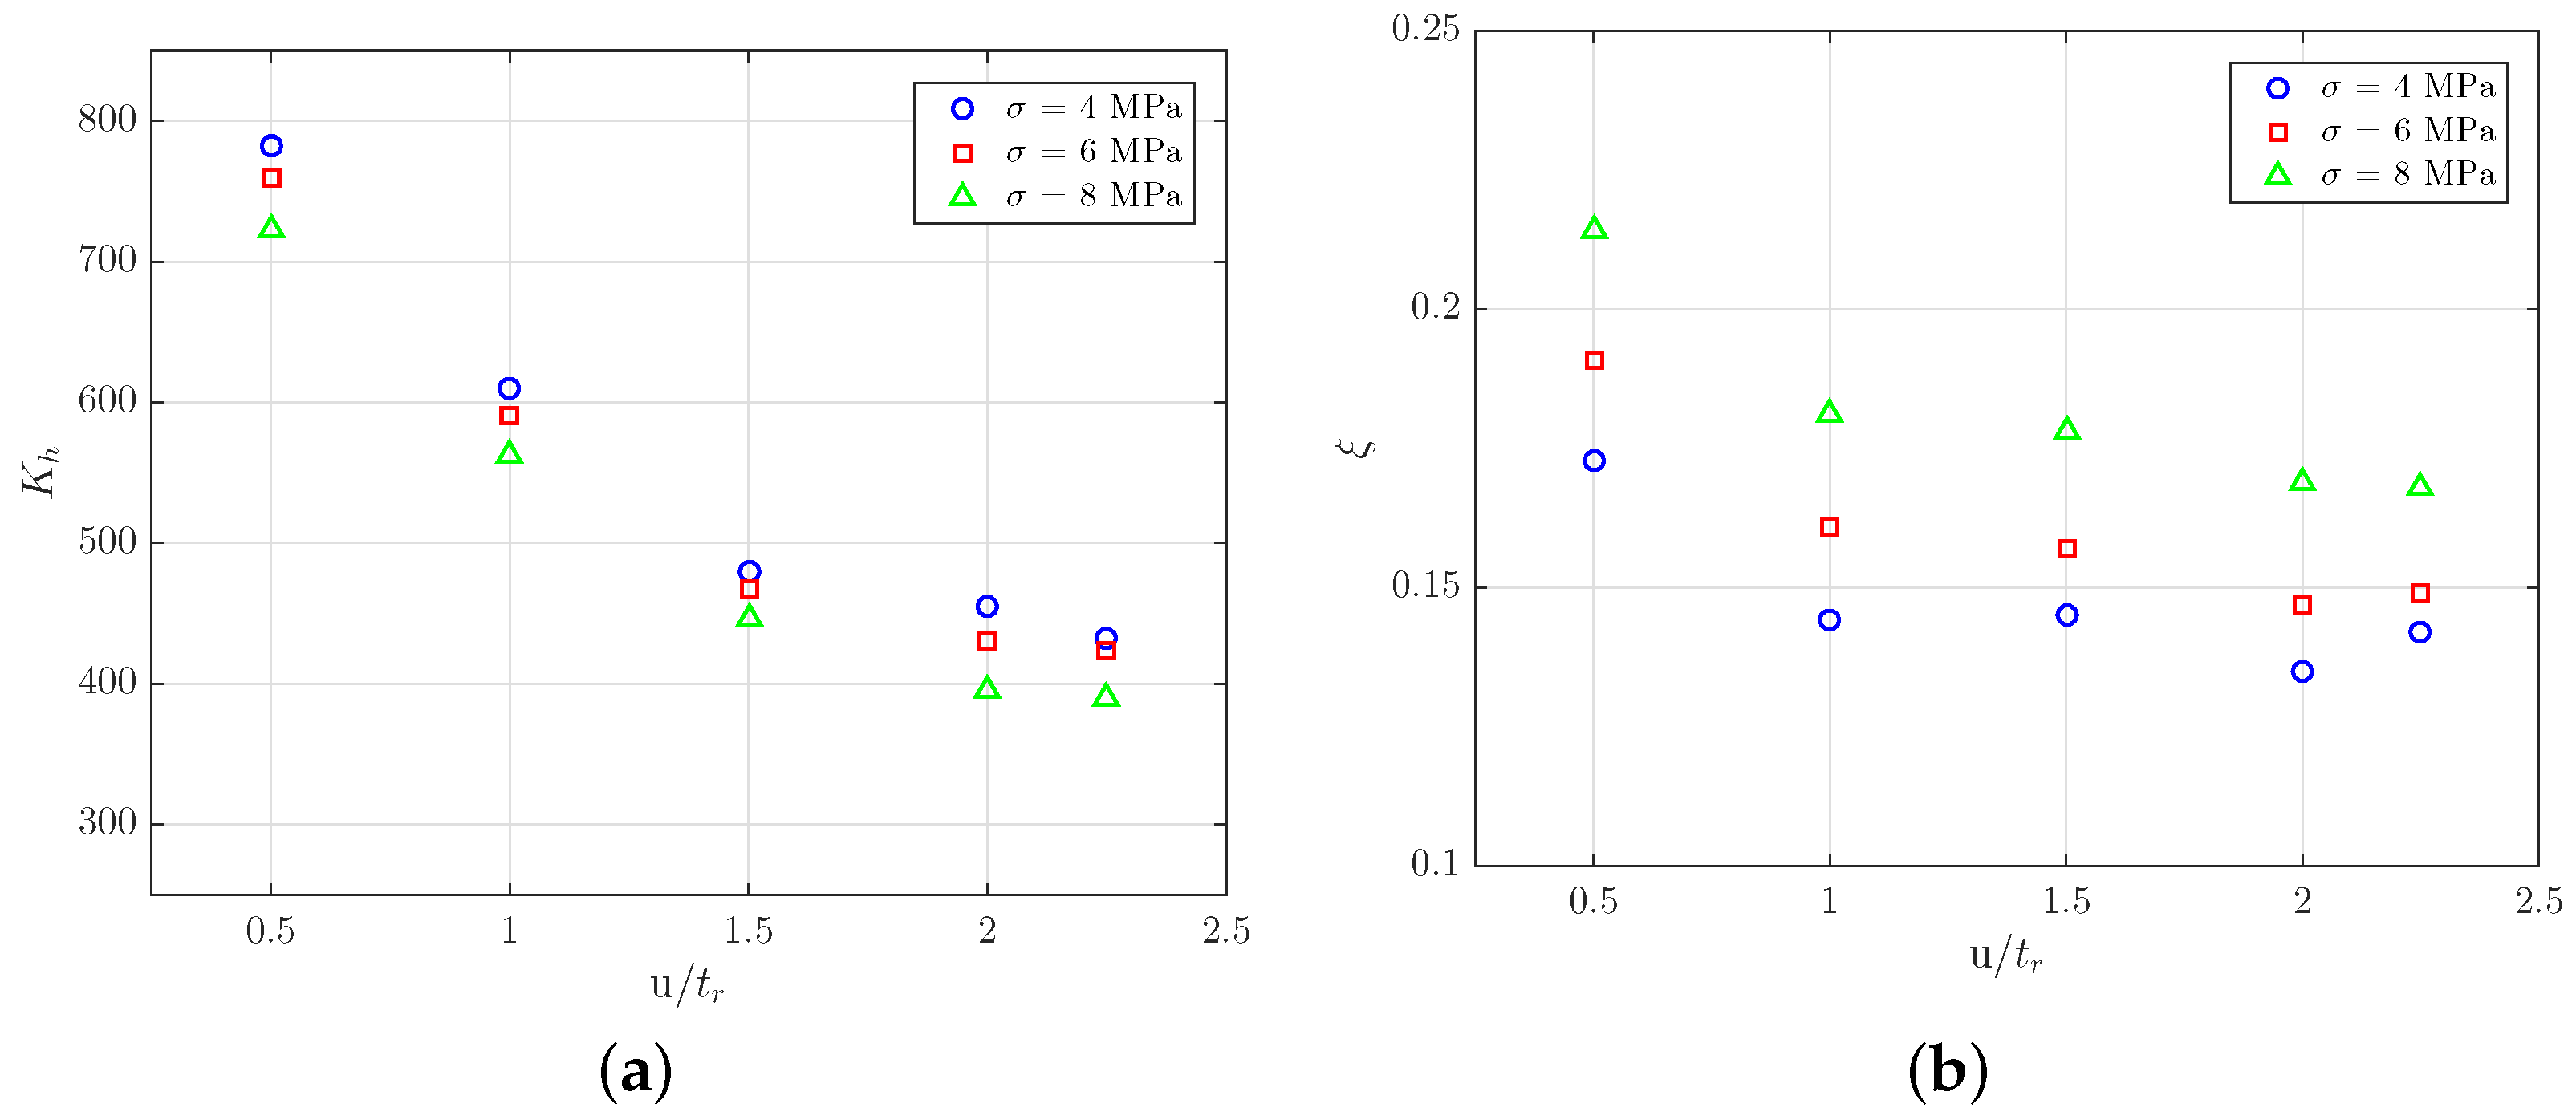
3.4. Influence of Vertical Pressure

With respect to the growing pressure applied, the axial stress distribution S11 exhibits a nearly linear increasing development, doubling the maximal compressive stress when the applied vertical force is doubled. The area under tensile stresses at high lateral deformation is not affected by the increase in vertical pressure, as depicted in Figure 24 and Figure 25.
Figure 26 and Figure 27 depict the stress distribution on the reinforcement. The tensile stress on the reinforcement presents a nearly linear behavior, in a similar way to the stresses on the elastomeric matrix, increasing the maximum tensile value with increasing pressure applied.
In Figure 28, a softening in the behavior and a corresponding increase in the equivalent damping coefficient with increasing pressure level can be observed.

4. Discussion

In the current study, a numerical finite element model that can accurately predict mechanical behavior in terms of horizontal stiffness and damping capacity of fiber-reinforced elastomeric bearings was developed. This model aims to capture the complex behavior of isolation devices with the aid of a detailed constitutive material model based on a phenomenological, rheological framework that accounts for existing nonlinearities, such as hyperelasticity and nonlinear viscoelasticity present in the elastomer. The presented model reasonably reproduces the experimental results. A calibration workflow for the elastomer constitutive model based on experimental tests and parameter identification was presented. A set of virtual experiments was set to analyze the parameters that affect the behavior of a seismic isolator for fiber-reinforced elastomeric bearings. Increasing the shape factor, a measure of the slenderness of an elastomeric layer, increases the elastomer area working in compression, increasing the stiffness of the whole bearing. Low aspect ratios induce instabilities in the mechanical behavior, while high aspect ratios stiffen the response of the bearing in a similar way to fixing the bearing to the supports. The orientation of the reinforcement fibers modifies tension–compression areas in the elastomeric matrix at high horizontal deflections, and the vertical pressure applied to the bearings affects the axial and vertical stresses in a quasi-linear form. The finite element model developed can be applied to new sets of virtual experiments, and the results can be useful for the calibration of simplified mechanical models as well as formulae describing the mechanical behavior of unbonded fiber-reinforced elastomeric bearings. Potential improvements to the model should consider a detailed model of the energy absorbing mechanism, which currently needs further investigations.

5. Conclusions

In this work, a numerical investigation of carbon fiber-reinforced elastomeric bearings as seismic isolators was presented. To capture the nonlinear hysteretic behavior of the devices, an innovative numerical material model for the elastomeric matrix that considers hyperelasticity and nonlinear viscoelasticity was implemented. The results obtained in this work lead to the following conclusions:
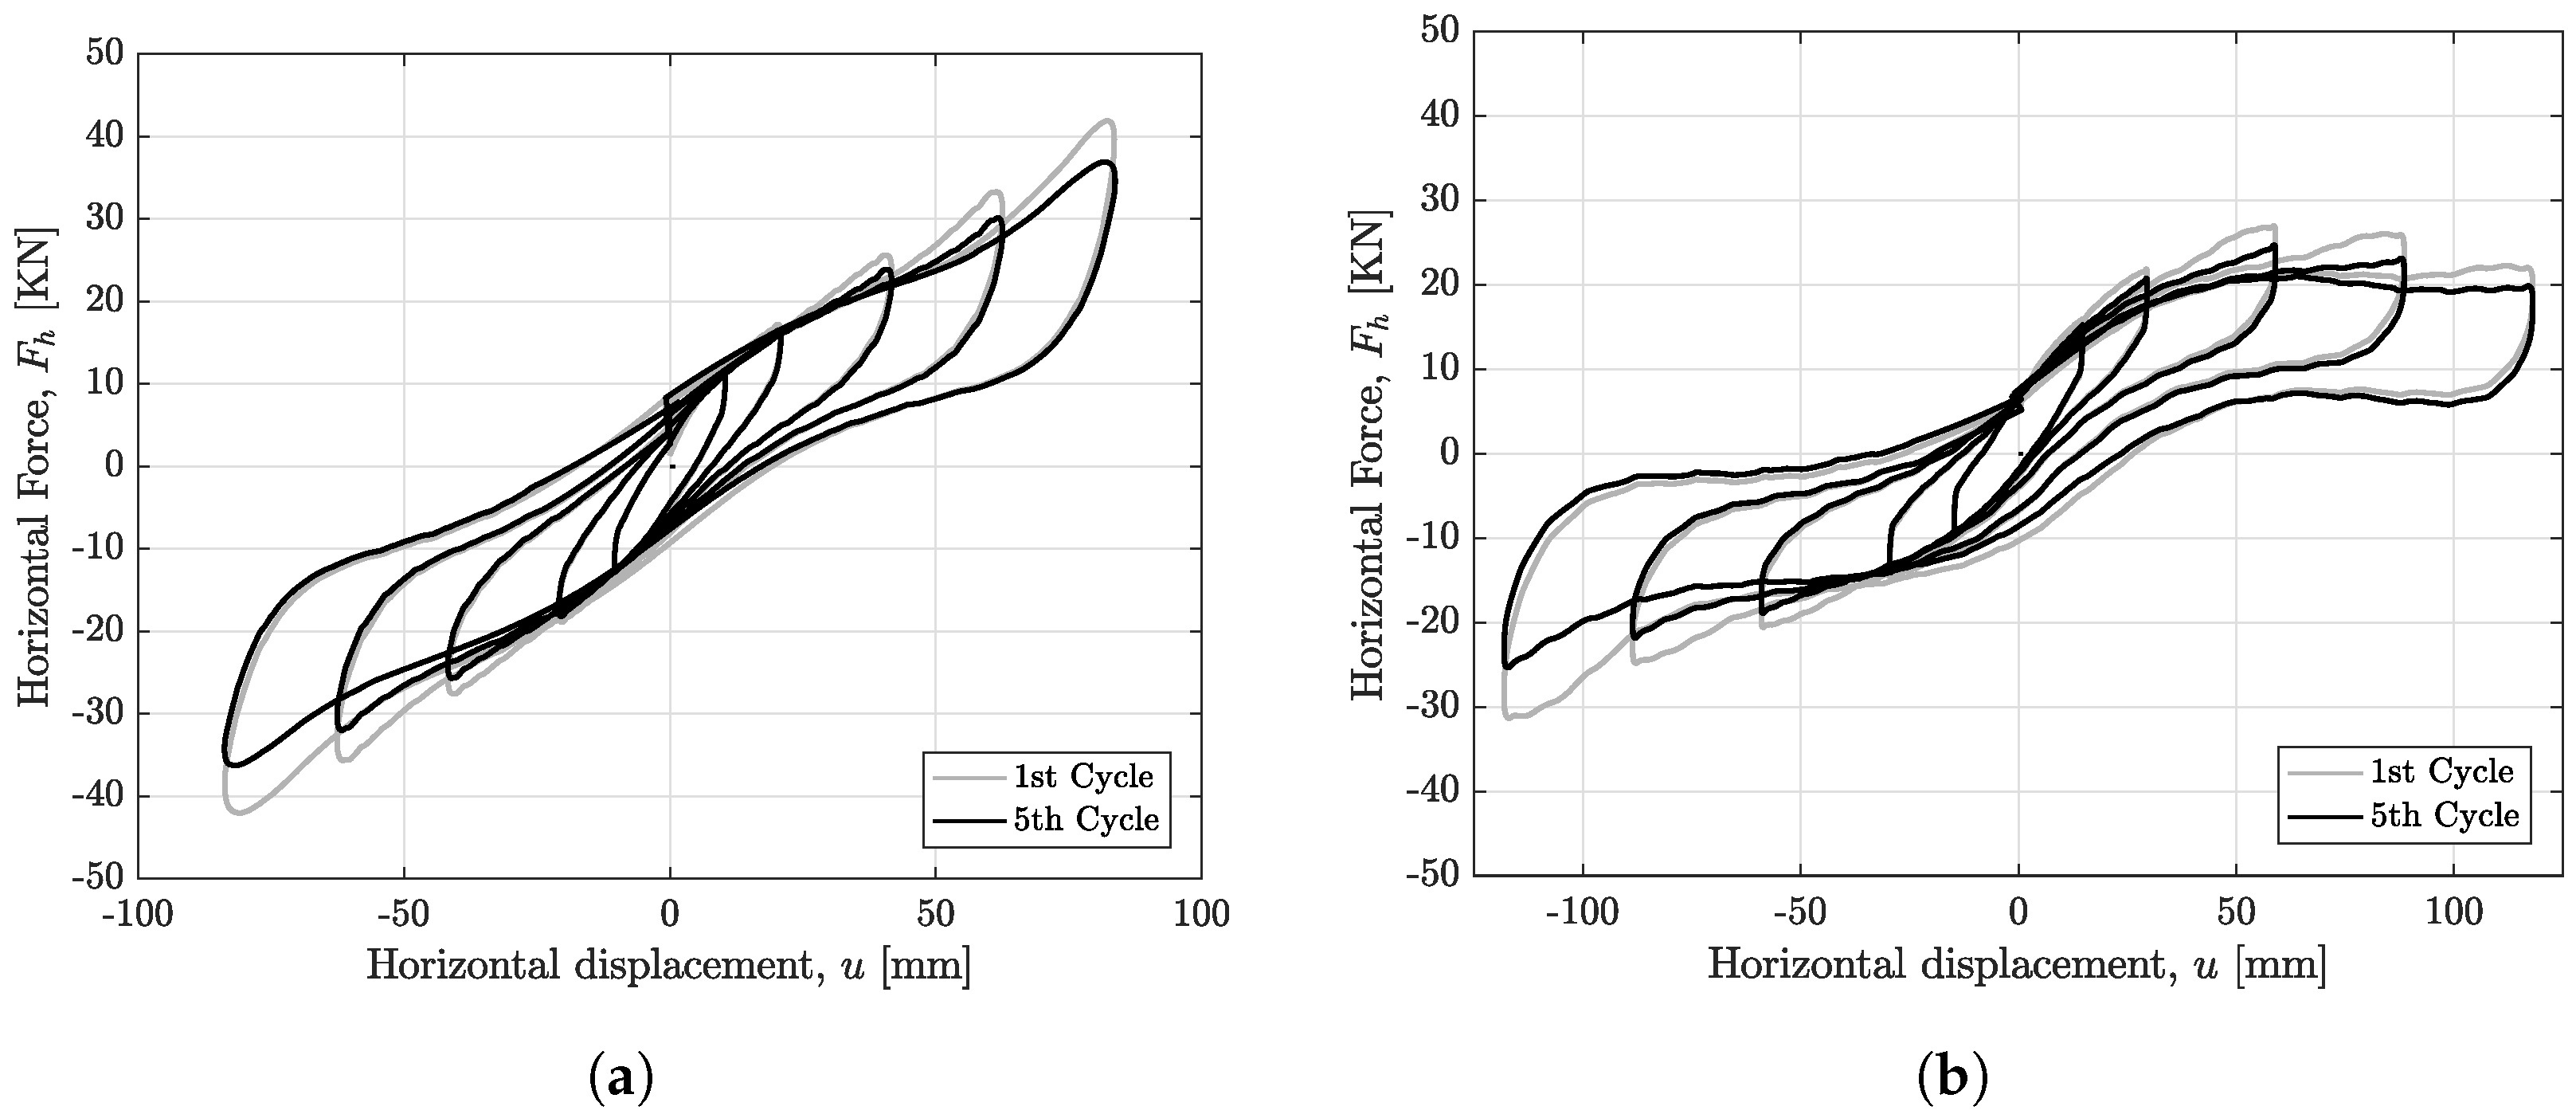
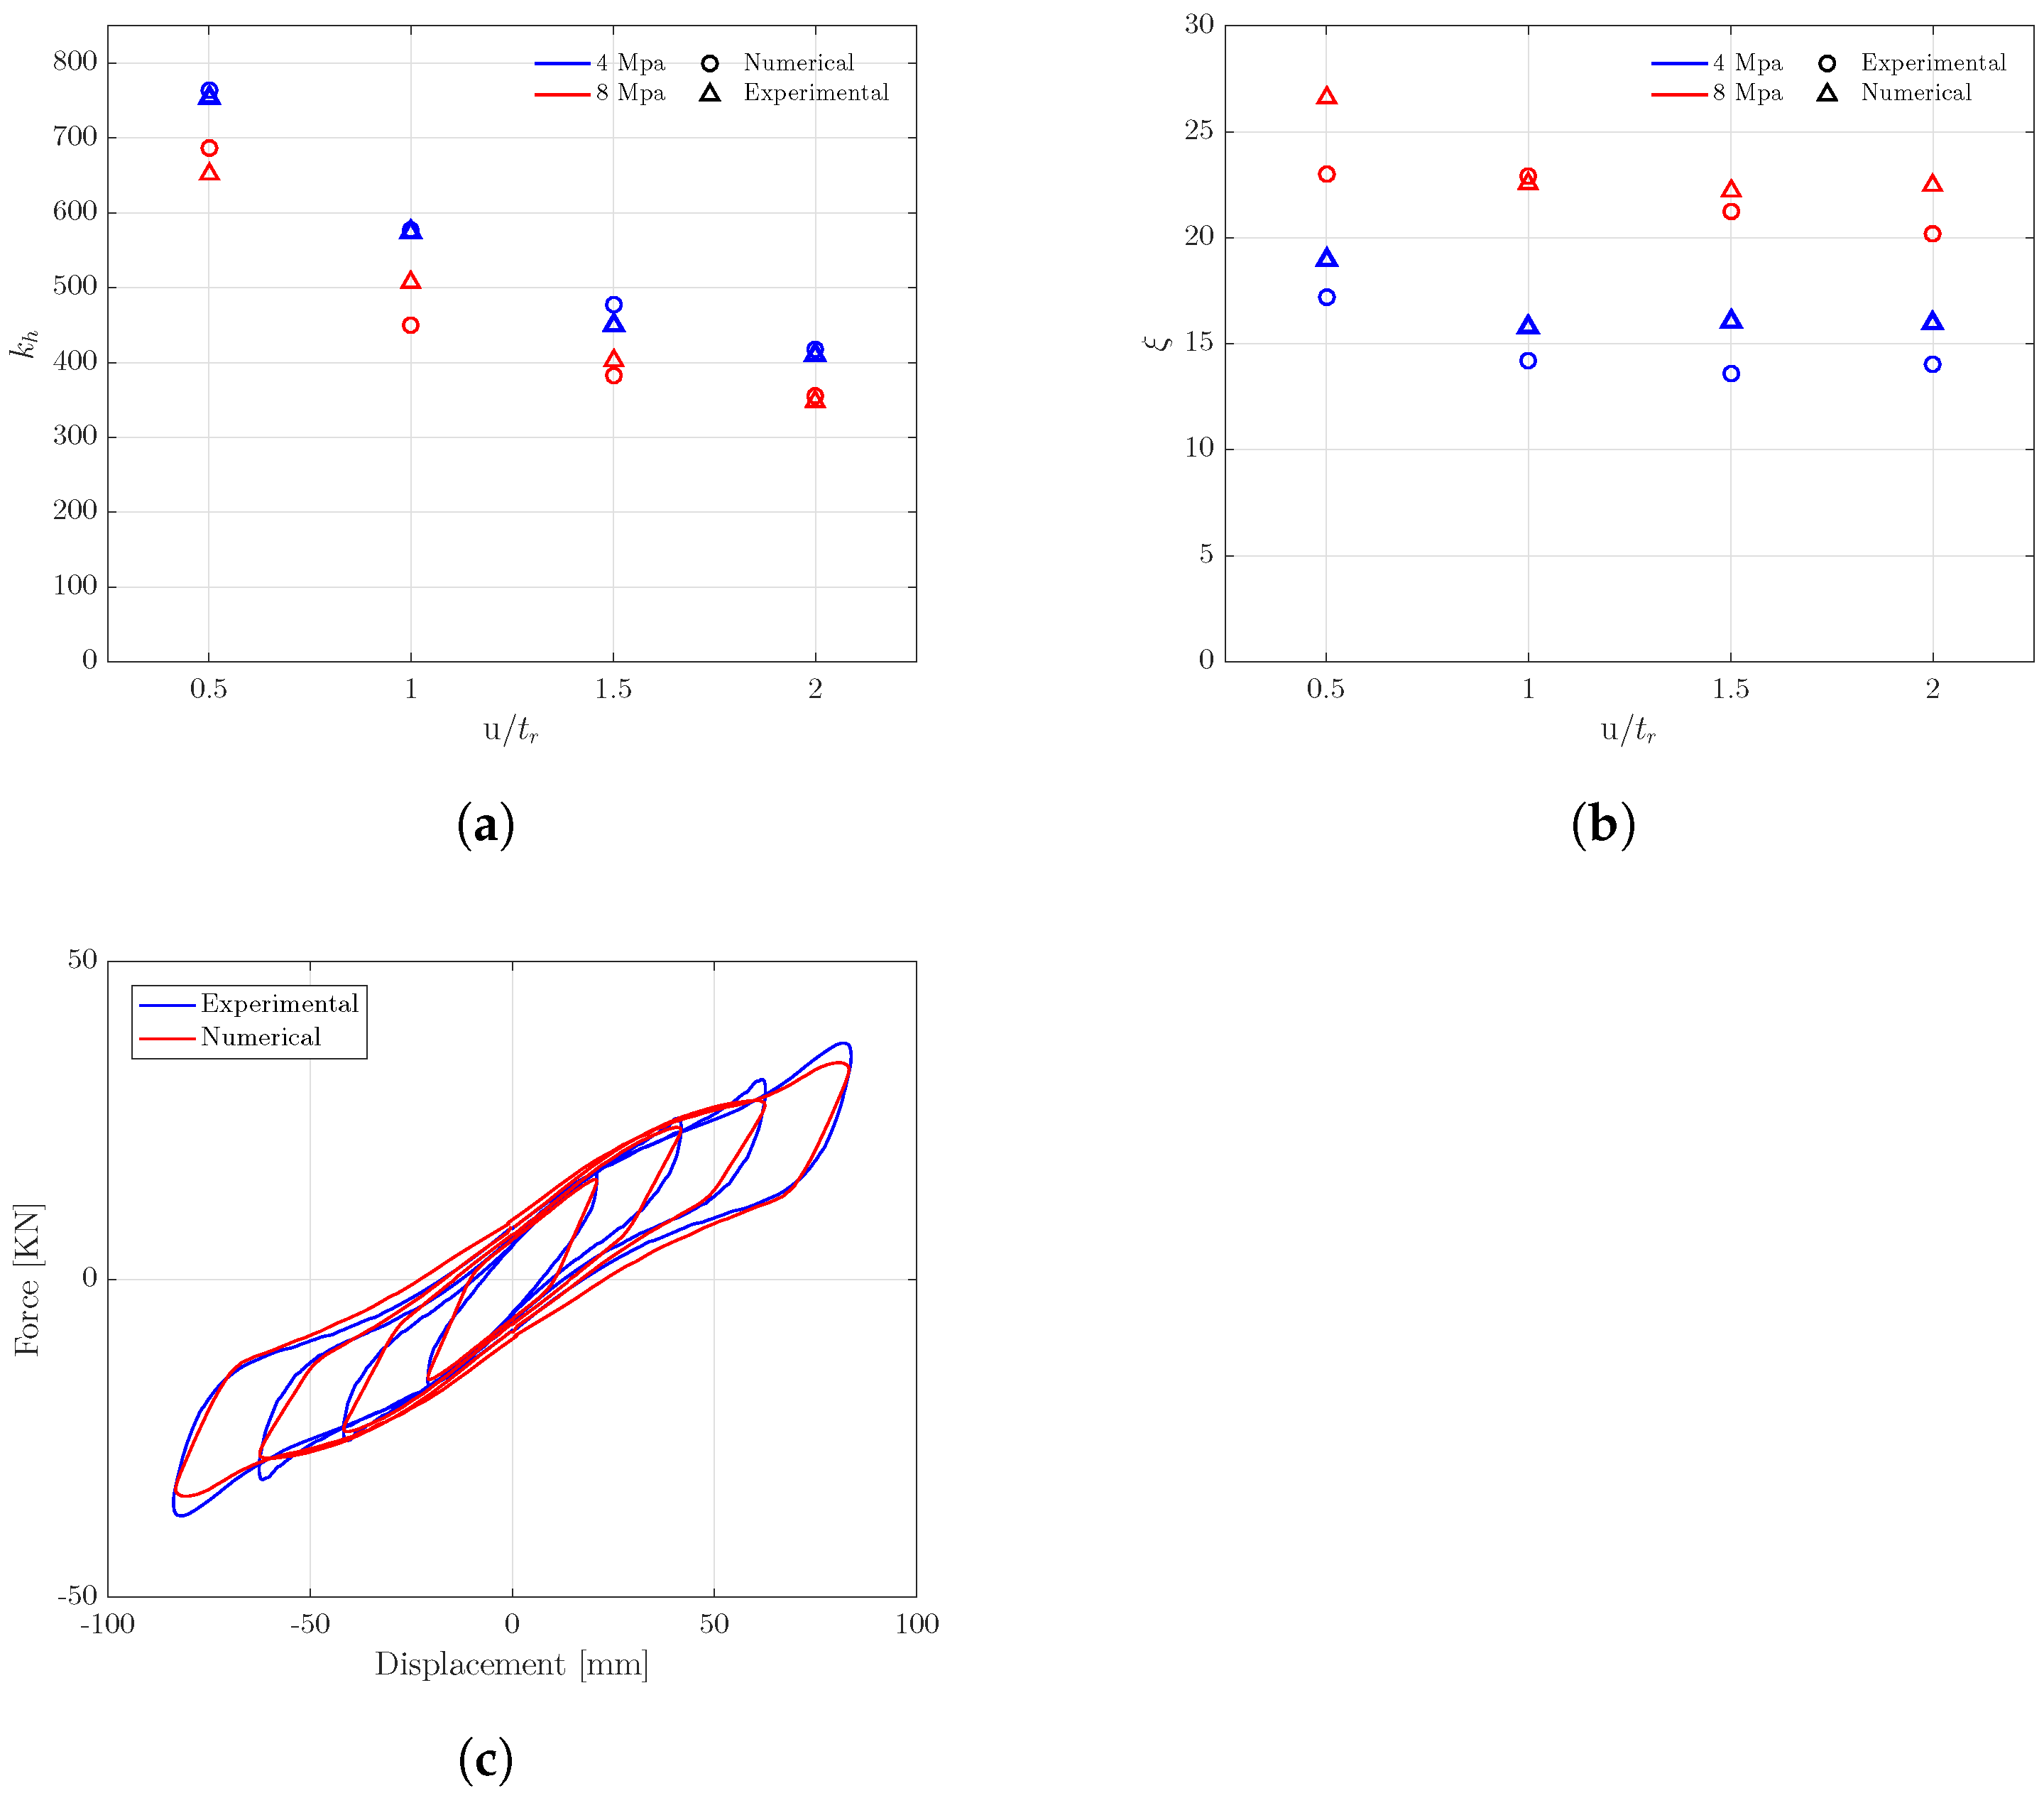
  • The calibrated and validated numerical model captures the hyperelastic and nonlinear viscoelastic behavior of the investigated fiber-reinforced elastomeric bearings
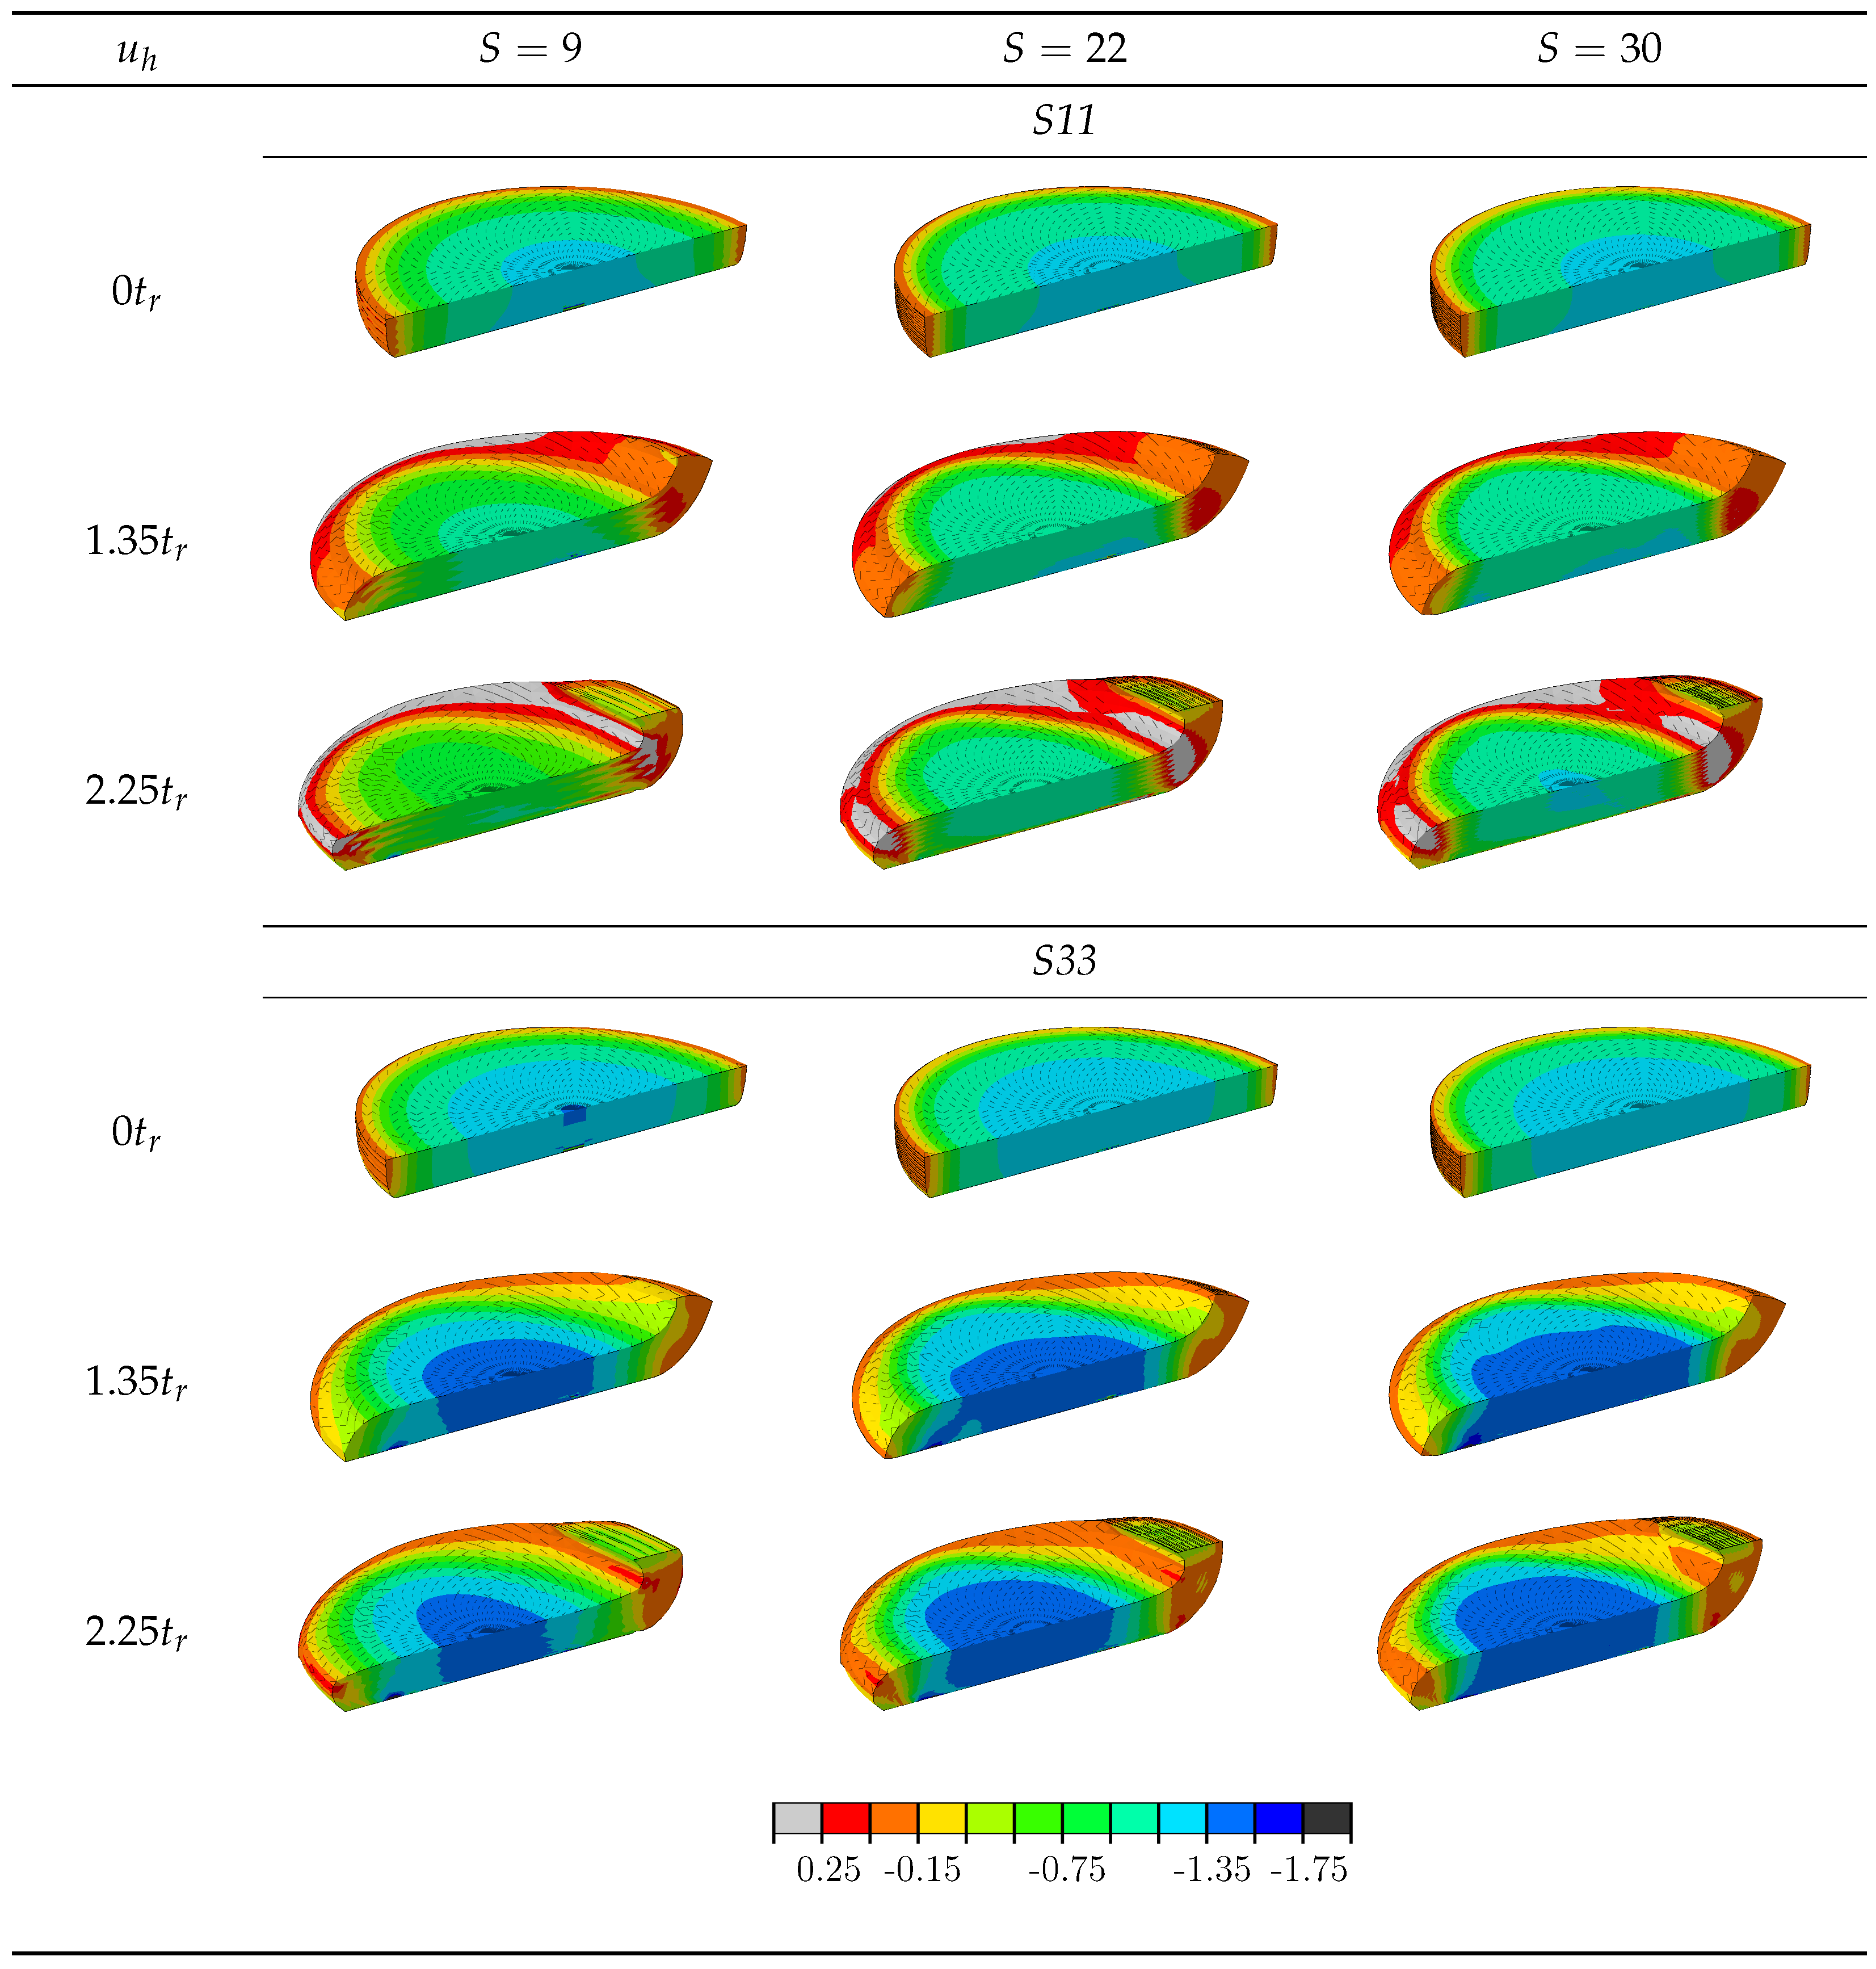
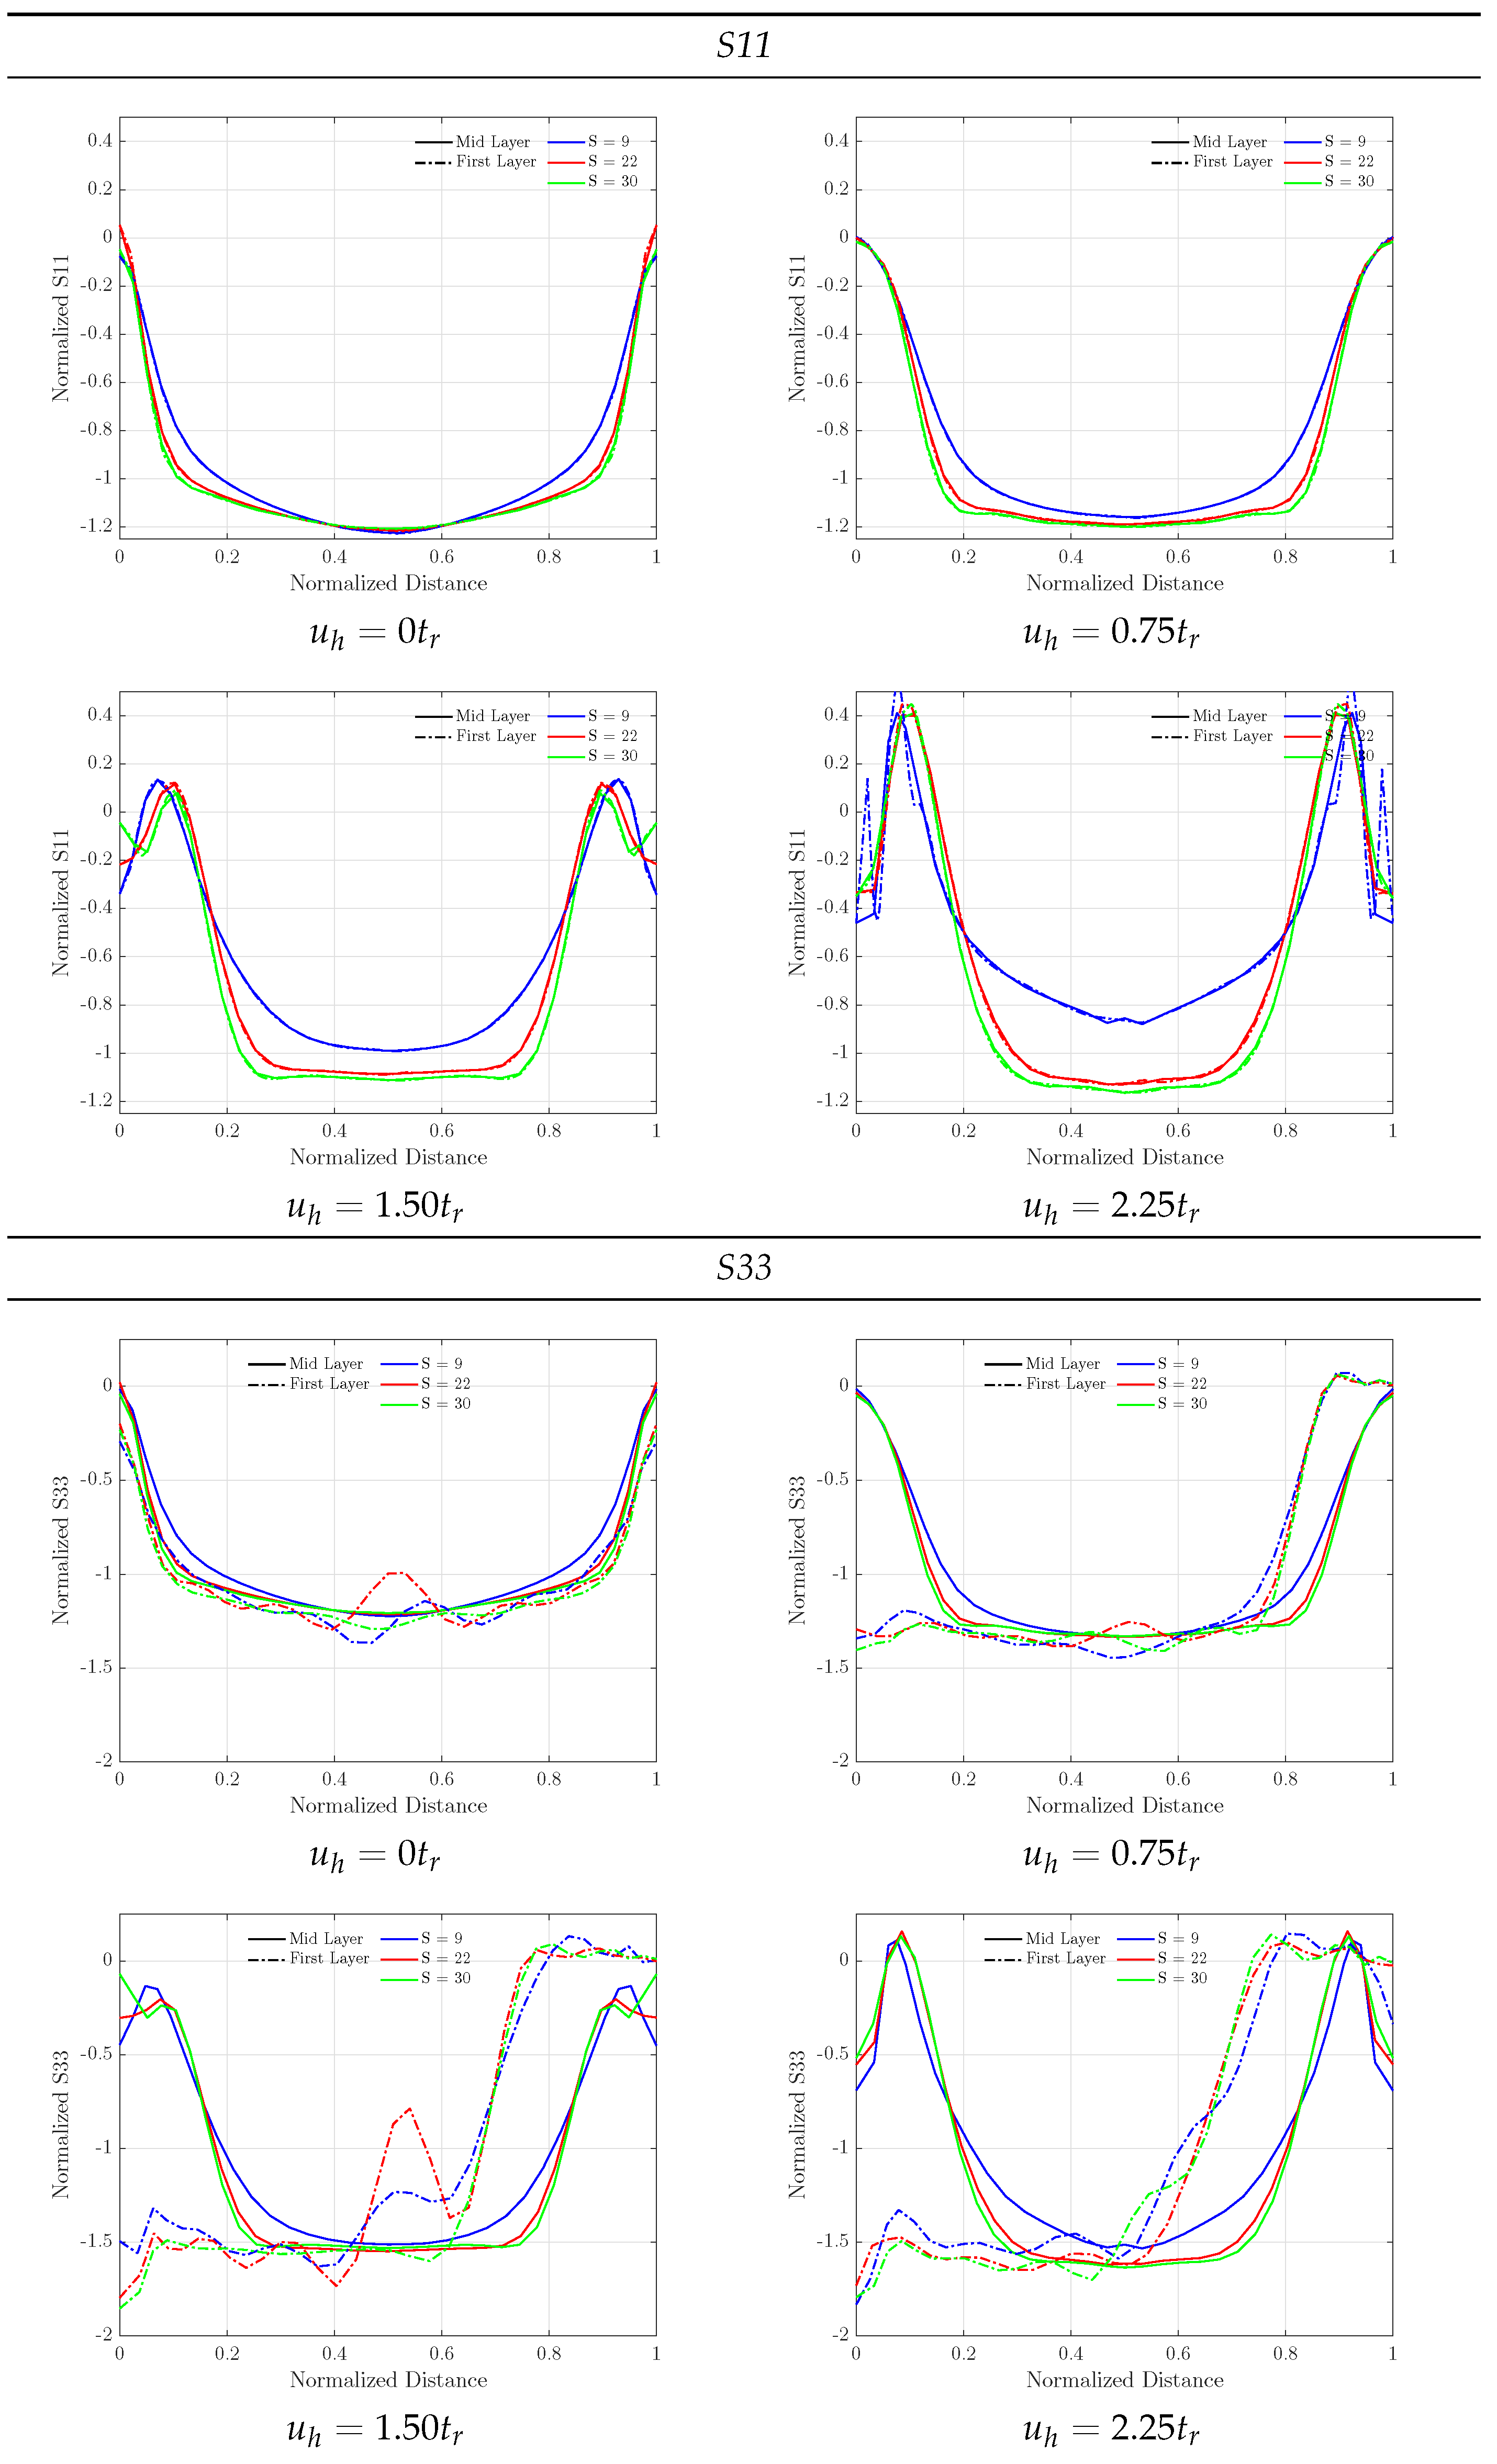
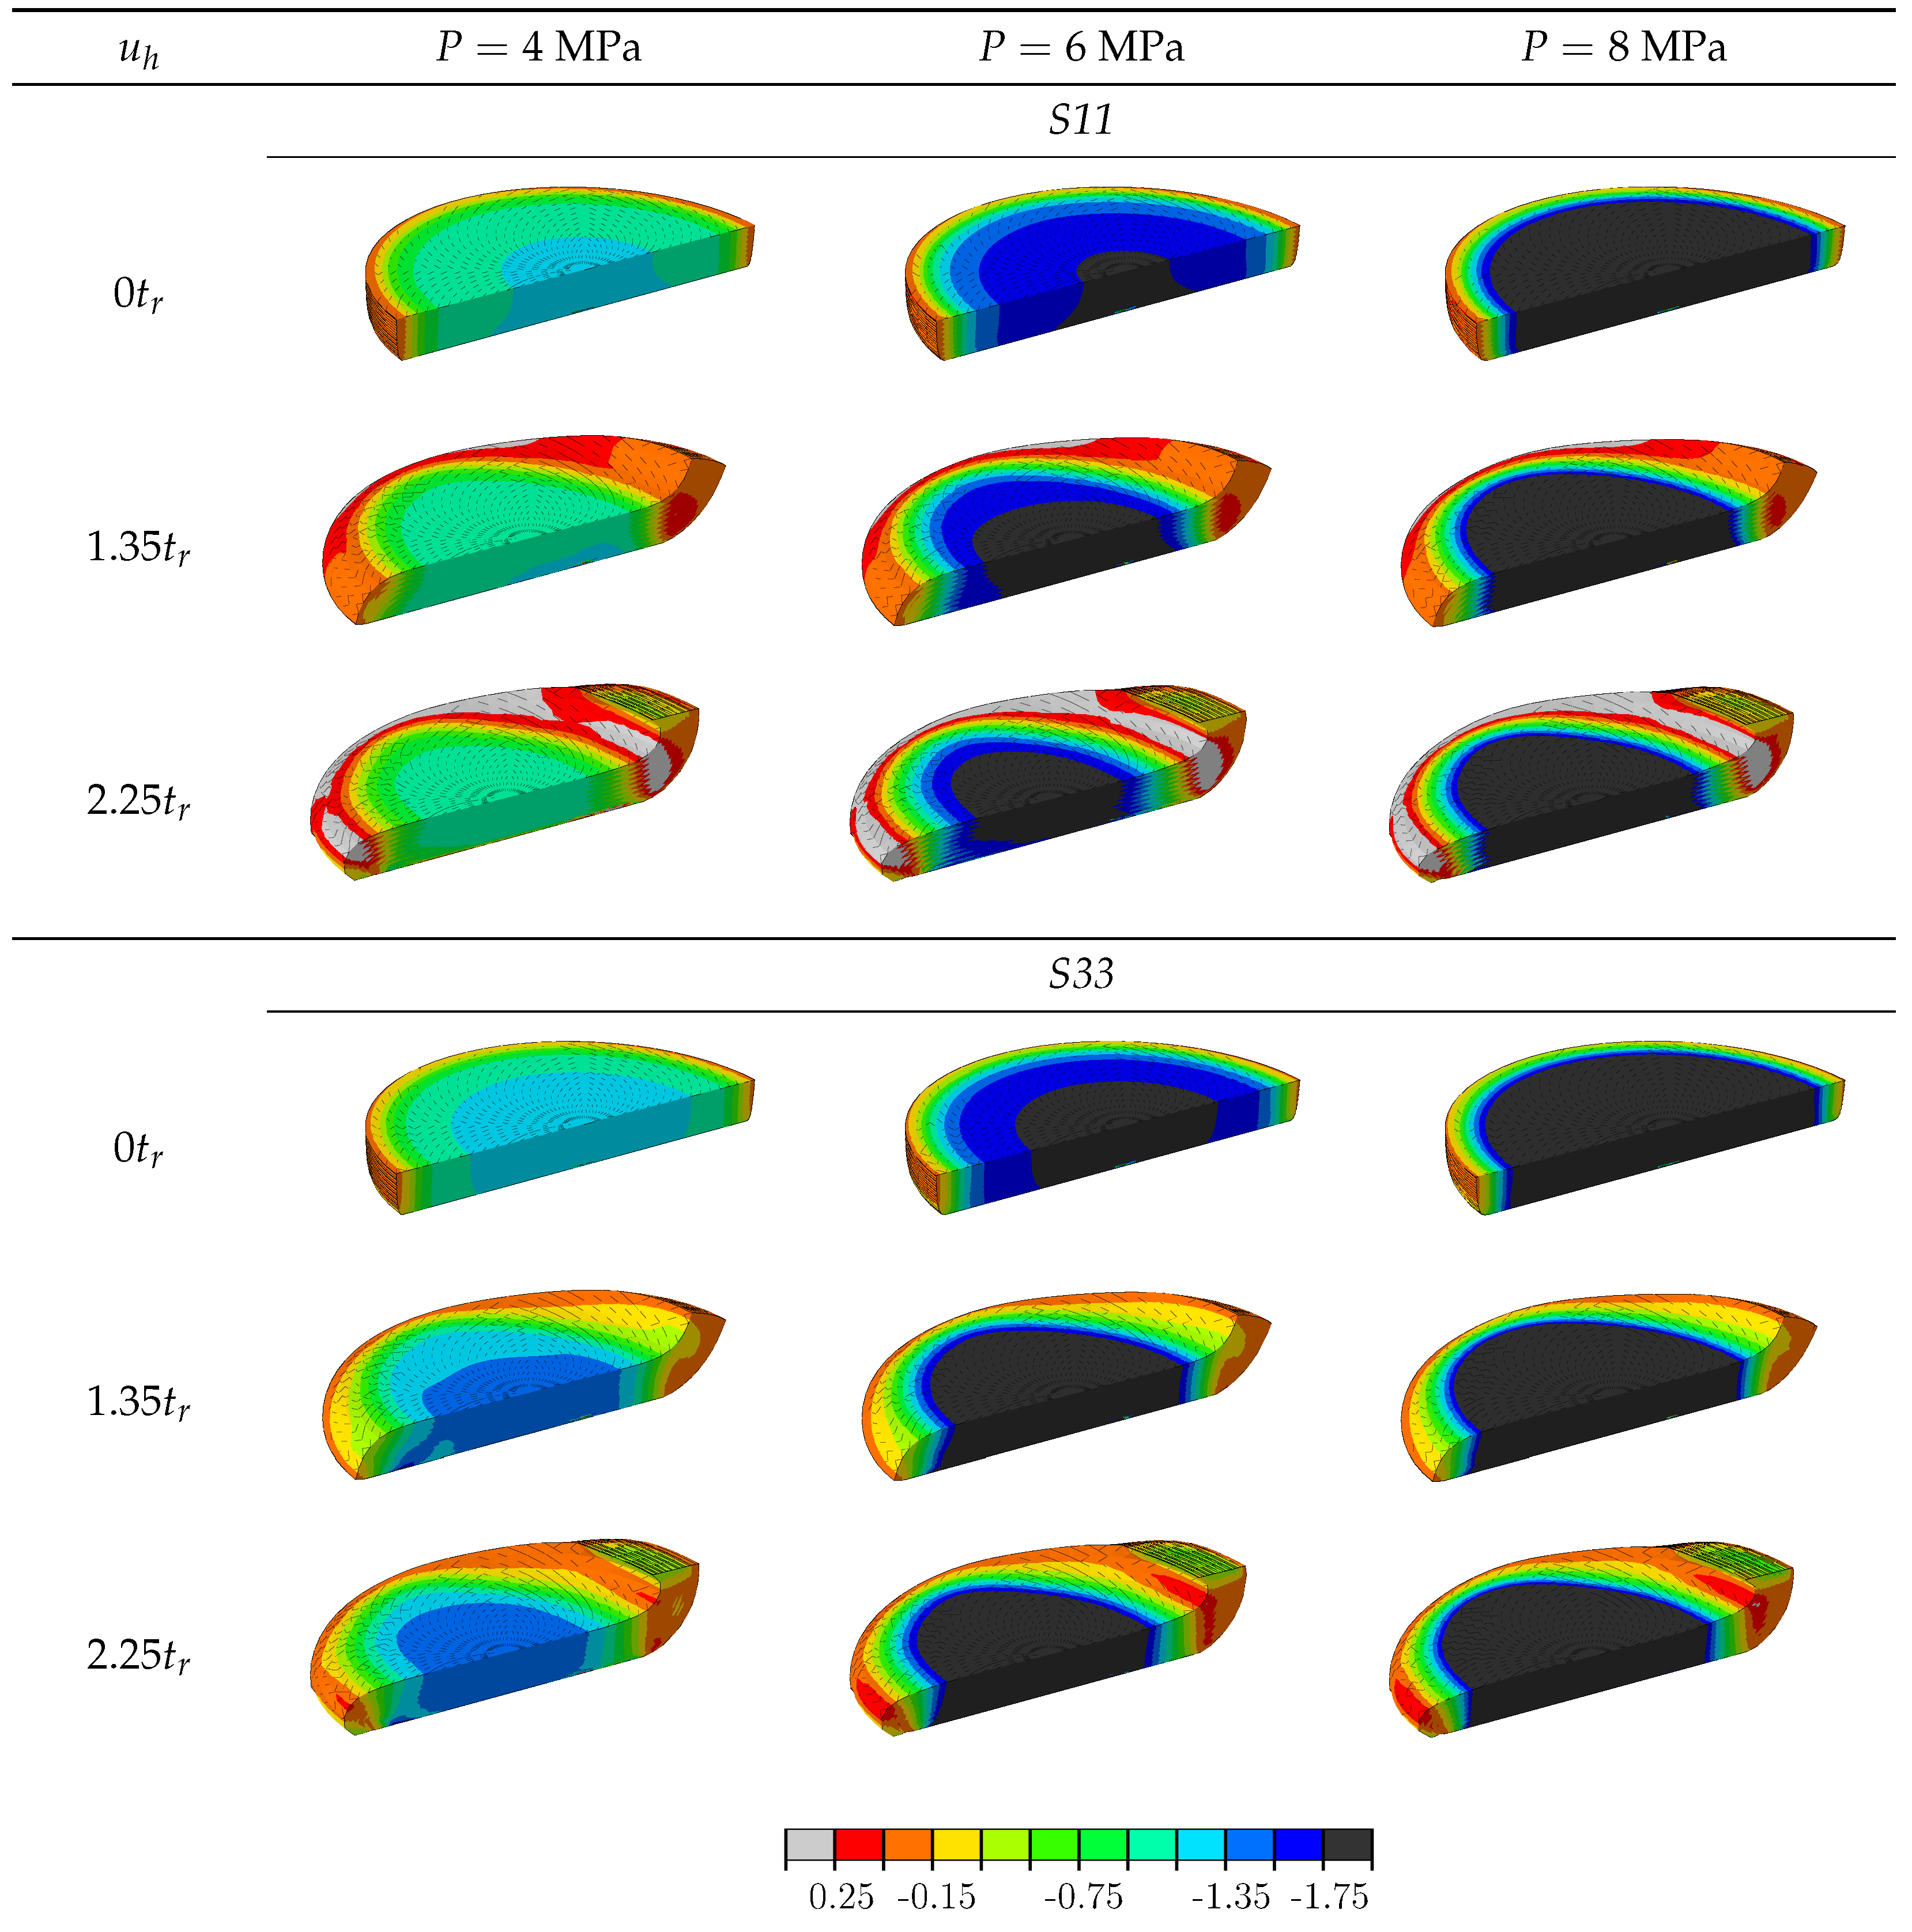
  • The mechanical response of the FREBs is driven by the ratio of area subjected to compressive and tensile stresses as well as by the maximum value of those stresses.
  • A decrease in the shape factor S from 30 to 9 causes a slight softening of the mechanical behavior at high horizontal deformations (less than 20% reduction of k h at u h = 2.25 t r ) and an increase in the absorbed energy (28.5% increase of ξ at u h = 2.25 t r ). While the trend is maintained when comparing bearings with shape factors 22 and 30, the change in the calculated mechanical properties is marginal.
  • The lateral behavior of bearings with different aspect ratios A presents remarkable differences on the whole range of lateral deflections investigated. Bearings with high aspect ratios show a much stiffer behavior (up to 300%), while only a minor difference in the damping coefficient is obtained. We also mention that large aspect ratios can lead to unstable device operation.
  • The orientation of the reinforcement has a more pronounced effect on large horizontal deformations, especially after the occurrence of a full rollover, where orientations of 30° and 45° show softer mechanical behaviors with reductions in k h by 20% and 29% as well as increases in the equivalent damping coefficient by 35% and 51%, respectively.

Author Contributions

Conceptualization, P.C.R. and A.S.; methodology, P.C.R. and A.S.; software, P.C.R.; validation, P.C.R. and A.S.; formal analysis, P.C.R.; investigation, P.C.R.; resources, P.C.R. and A.S.; data curation, P.C.R.; writing—original draft preparation, P.C.R.; writing—review and editing, P.C.R. and A.S.; visualization, P.C.R. and A.S.; supervision, A.S.; project administration, A.S.; funding acquisition, A.S. All authors have read and agreed to the published version of the manuscript.

Funding

This work was financially supported by the FWF Austrian Science Fund through the research project “Innovative circular fiber reinforced elastomeric isolation devices”.

Acknowledgments

We are grateful to the company MAURER SE for providing the specimens for the experimental program.

Conflicts of Interest

The funders had no role in the design of the study; in the collection, analyses, or interpretation of data; in the writing of the manuscript; or in the decision to publish the results.

References and Notes

  1. Kelly, J.M. Aseismic Base Isolation: Review and Bibliography. Soil Dyn. Earthq. Eng. 1986, 5, 202–216. [Google Scholar] [CrossRef]
  2. Kelly, J.M. Analysis of Fiber-Reinforced Elastomeric Isolators. J. Seismol. Earthq. Eng. 1999, 2, 19–34. [Google Scholar]
  3. Van Engelen, N.C. Fiber-Reinforced Elastomeric Isolators: A Review. Soil Dyn. Earthq. Eng. 2019, 125, 105621. [Google Scholar] [CrossRef]
  4. Moon, B.Y.; Kang, G.J.; Kang, B.S.; Kelly, J.M. Design and Manufacturing of Fiber Reinforced Elastomeric Isolator for Seismic Isolation. J. Mater. Process. Technol. 2002, 130–131, 145–150. [Google Scholar] [CrossRef]
  5. Naeim, F.; Kelly, J.M. Design of Seismic Isolated Structures; John Wiley & Sons, Inc.: Hoboken, NJ, USA, 1999. [Google Scholar]
  6. Strauss, A.; Apostolidi, E.; Zimmermann, T.; Gerhaher, U.; Dritsos, S. Experimental Investigations of Fiber and Steel Reinforced Elastomeric Bearings: Shear Modulus and Damping Coefficient. Eng. Struct. 2014, 75, 402413. [Google Scholar] [CrossRef]
  7. Marsico, M.R.; Monsalve, J.M.L.; Shin, D.W.; Craciun, M.F. Graphene–Rubber Layered Functional Composites for Seismic Isolation of Structures. Adv. Eng. Mater. 2020, 22, 1900852. [Google Scholar] [CrossRef] [Green Version]
  8. Losanno, D.; Madera Sierra, I.E.; Spizzuoco, M.; Marulanda, J.; Thomson, P. Experimental Performance of Unbonded Polyester and Carbon Fiber Reinforced Elastomeric Isolators under Bidirectional Seismic Excitation. Eng. Struct. 2020, 209, 110003. [Google Scholar] [CrossRef]
  9. Habieb, A.B.; Valente, M.; Milani, G. Base Seismic Isolation of a Historical Masonry Church Using Fiber Reinforced Elastomeric Isolators. Soil Dyn. Earthq. Eng. 2019, 120, 127–145. [Google Scholar] [CrossRef]
  10. Tran, C.; Calabrese, A.; Vassiliou, M.F.; Galano, S. A Simple Strategy to Tune the Lateral Response of Unbonded Fiber Reinforced Elastomeric Isolators (FREIs). Eng. Struct. 2020, 222, 111128. [Google Scholar] [CrossRef]
  11. Toopchi-Nezhad, H.; Tait, M.J.; Drysdale, R.G. Testing and Modeling of Square Carbon Fiber-Reinforced Elastomeric Seismic Isolators. Struct. Control Health Monit. 2008, 15, 876–900. [Google Scholar] [CrossRef]
  12. Kelly, J.; Calabrese, A. Analysis of Fiber-Reinforced Elastomeric Isolators Including Stretching of Reinforcement and Compressibility of Elastomer. Ing. Sismica 2013, 30, 5–14. [Google Scholar]
  13. Castillo Ruano, P.; Strauss, A. An Experimental Study on Unbonded Circular Fiber Reinforced Elastomeric Bearings. Eng. Struct. 2018, 177, 72–84. [Google Scholar] [CrossRef]
  14. Das, A.; Dutta, A.; Deb, S.K. Performance of Fiber-Reinforced Elastomeric Base Isolators under Cyclic Excitation. Struct. Control Health Monit. 2015, 22, 197–220. [Google Scholar] [CrossRef]
  15. Russo, G.; Pauletta, M. Sliding Instability of Fiber-Reinforced Elastomeric Isolators in Unbonded Applications. Eng. Struct. 2013, 48, 70–80. [Google Scholar] [CrossRef]
  16. Thuyet, V.N.; Deb, S.K.; Dutta, A. Mitigation of Seismic Vulnerability of Prototype Low-Rise Masonry Building Using U-FREIs. J. Perform. Constr. Facil. 2018, 32, 04017136. [Google Scholar] [CrossRef]
  17. Gerharer, U.; Strauss, A.; Bergmeister, K. Verbesserte Bemessungsrichtlinien für Bewehrte Elastomerlager. Bautechnik 2011, 88, 451–458. [Google Scholar] [CrossRef]
  18. Ehsani, B.; Toopchi-Nezhad, H. Systematic Design of Unbonded Fiber Reinforced Elastomeric Isolators. Eng. Struct. 2017, 132, 383–398. [Google Scholar] [CrossRef]
  19. EN1337-3. Structural Bearings—Part3: Elastomeric Bearings. European Code. 2005.
  20. EN15129. Anti-Seismic Devices. European Code. 2009.
  21. ISO 22762-3. Elastomeric Seismic-Protection Isolators—Part 3: Applications for Buildings—Specifications. 2018.
  22. Ruano, P.C.; Apostolidi, E.; Strauss, A. Reliability Based Optimization of Fiber Reinforced Elastomeric Bearings. Beton-Und Stahlbetonbau 2018, 113, 103–109. [Google Scholar] [CrossRef]
  23. Rozylo, P.; Ferdynus, M.; Debski, H.; Samborski, S. Progressive Failure Analysis of Thin-Walled Composite Structures Verified Experimentally. Materials 2020, 13, 1138. [Google Scholar] [CrossRef] [Green Version]
  24. Debski, H.; Rozylo, P.; Teter, A. Buckling and Limit States of Thin-Walled Composite Columns under Eccentric Load. Thin-Walled Struct. 2020, 149, 106627. [Google Scholar] [CrossRef]
  25. Jonak, J.; Karpiński, R.; Siegmund, M.; Wójcik, A.; Jonak, K. Analysis of the Rock Failure Cone Size Relative to the Group Effect from a Triangular Anchorage System. Materials 2020, 13, 4657. [Google Scholar] [CrossRef] [PubMed]
  26. Jonak, J.; Karpiński, R.; Wójcik, A.; Siegmund, M. The Influence of the Physical-Mechanical Parameters of Rock on the Extent of the Initial Failure Zone under the Action of an Undercut Anchor. Materials 2021, 14, 1841. [Google Scholar] [CrossRef]
  27. Al-Anany, Y.M.; Van Engelen, N.C.; Tait, M.J. Vertical and Lateral Behavior of Unbonded Fiber-Reinforced Elastomeric Isolators. J. Compos. Constr. 2017, 21, 04017019. [Google Scholar] [CrossRef]
  28. Mordini, A.; Strauss, A. An Innovative Earthquake Isolation System Using Fibre Reinforced Rubber Bearings. Eng. Struct. 2008, 30, 2739–2751. [Google Scholar] [CrossRef]
  29. Spizzuoco, M.; Calabrese, A.; Serino, G. Innovative Low-Cost Recycled Rubber–Fiber Reinforced Isolator: Experimental Tests and Finite Element Analyses. Eng. Struct. 2014, 76, 99–111. [Google Scholar] [CrossRef]
  30. Toopchi-Nezhad, H.; Tait, M.J.; Drysdale, R.G. Influence of Thickness of Individual Elastomer Layers (First Shape Factor) on the Response of Unbonded Fiber-Reinforced Elastomeric Bearings. J. Compos. Mater. 2013, 47, 3433–3450. [Google Scholar] [CrossRef]
  31. Osgooei, P.M.; Tait, M.J.; Konstantinidis, D. Finite Element Analysis of Unbonded Square Fiber-Reinforced Elastomeric Isolators (FREIs) under Lateral Loading in Different Directions. Compos. Struct. 2014, 113, 164–173. [Google Scholar] [CrossRef]
  32. Osgooei, P.M.; Tait, M.J.; Konstantinidis, D. Three-Dimensional Finite Element Analysis of Circular Fiber-Reinforced Elastomeric Bearings under Compression. Compos. Struct. 2014, 108, 191–204. [Google Scholar] [CrossRef]
  33. Habieb, A.B.; Milani, G.; Tavio, T. Two-Step Advanced Numerical Approach for the Design of Low-Cost Unbonded Fiber Reinforced Elastomeric Seismic Isolation Systems in New Masonry Buildings. Eng. Fail. Anal. 2018, 90, 380–396. [Google Scholar] [CrossRef]
  34. Hedayati Dezfuli, F.; Alam, M.S. Sensitivity Analysis of Carbon Fiber-Reinforced Elastomeric Isolators Based on Experimental Tests and Finite Element Simulations. Bull. Earthq. Eng. 2014, 12, 1025–1043. [Google Scholar] [CrossRef]
  35. Ngo, T.V.; Dutta, A.; Deb, S.K. Predicting Stability of a Prototype Unbonded Fiber-Reinforced Elastomeric Isolator by Finite Element Analysis. Int. J. Comput. Methods 2020, 17, 2050015. [Google Scholar] [CrossRef]
  36. Gerhaher, U. Faserverstärke Elastomerlager-Konzeption Und Bemessung. Ph.D. thesis, Universität für Bodenkultur Wien, Wien, Austria, 2010. [Google Scholar]
  37. Hurtado, J.; Lapczyk, I.; Govindarajan, S. Parallel Rheological Framework to Model Non-Linear Viscoelasticity, Permanent Set, and Mullins Effect in Elastomers. Const. Model. Rubber VIII 2013, 8, 95–100. [Google Scholar]
  38. Yeoh, O.H. Some Forms of the Strain Energy Function for Rubber. Rubber Chem. Technol. 1993, 66, 754–771. [Google Scholar] [CrossRef]
  39. Bergström, J. Mechanics of Solid Polymers: Theory and Computational Modeling, 1st ed.; Elsevier: Amsterdam, The Netherlands, 2015. [Google Scholar]
  40. Simulia. ABAQUS 2016 Analysis User’s Manual; Simulia: Providence, RI, USA, 2015. [Google Scholar]
  41. Simulia. Isight 2016 Analysis User’s Manual; Simulia: Providence, RI, USA, 2015. [Google Scholar]
  42. Russo, G.; Pauletta, M.; Cortesia, A. A Study on Experimental Shear Behavior of Fiber-Reinforced Elastomeric Isolators with Various Fiber Layouts, Elastomers and Aging Conditions. Eng. Struct. 2013, 52, 422–433. [Google Scholar] [CrossRef]
Figure 1. Lateral cyclic tests on FREB. (a) uh = 0%tr. (b) uh = 1.0%tr. (c) uh = 1.5%tr. (d) uh = 2.0%tr.
Jcs 05 00170 g001
Figure 2. Load-displacement curves for the experimentally tested bearings: (a) 08RL_09S under 4 MPa vertical pressure; (b) 27RL_22S under 4 MPa vertical pressure.
Jcs 05 00170 g002
Figure 3. Parallel Rheological Framework scheme.
Jcs 05 00170 g003
Figure 4. (a) Uniaxial tension test setup. (b) Plane shear test setup. (c). Force–displacement curves for uniaxial tension test. (d) Force–displacement curves for cyclic tests.
Jcs 05 00170 g004
Figure 5. Meshed FREB model and detailed view.
Jcs 05 00170 g005
Figure 6. Meshed model at different horizontal deflections. (a) Initial state. (b) uh = 112.5%tr. (c) uh = 225%tr.
Jcs 05 00170 g006
Figure 7. Comparison of predicted and experimental behaviors. (a) Experimental and predicted horizontal stiffness. (b) Experimental and predicted damping ratios. (c) Force-displacement curves under 4 MPa vertical pressure.
Jcs 05 00170 g007
Figure 8. Influence of shape factor S on the axial normal stress S11 and vertical normal stress S33 distributions.
Jcs 05 00170 g008
Figure 9. Axial normal stress S11 and vertical normal stress S33 along the symmetry axis. Effect of shape factor S.
Jcs 05 00170 g009
Figure 10. Influence of the factor shape S on the axial stress S11 distribution in the carbon fiber reinforcement.
Jcs 05 00170 g010
Figure 11. Axial stress S11 on the reinforcement along the symmetry axis. Effect of shape factor S.
Jcs 05 00170 g011
Figure 12. (a) Effective horizontal stiffness, kh, and (b) equivalent damping ratio, ξ, under different values for the factor shape.
Jcs 05 00170 g012
Figure 13. Influence of aspect ratio A on the normal axial S11 and vertical S33 stress distributions.
Jcs 05 00170 g013
Figure 14. Axial normal stress S11 and vertical normal stress S33 along the symmetry axis. Effect of aspect ratio A.
Jcs 05 00170 g014
Figure 15. Influence of aspect ratio A on the axial stress S11 distribution in the carbon fiber reinforcement.
Jcs 05 00170 g015
Figure 16. Axial stress S11 on the reinforcement along the symmetry axis. Effect of aspect ratio A.
Jcs 05 00170 g016
Figure 17. (a) Effective horizontal stiffness, k h , and (b) equivalent damping ratio, ξ , under different compression levels.
Jcs 05 00170 g017
Figure 18. Force-displacement curve for 27RL_22S.
Jcs 05 00170 g018
Figure 19. Influence of reinforcement orientation on the normal axial S11 and vertical S33 distributions.
Jcs 05 00170 g019
Figure 20. Normal axial S11 and vertical S33 stress along the symmetry axis. Effect of reinforcement orientation.
Jcs 05 00170 g020
Figure 21. Influence of reinforcement orientation on the axial stress S11 distribution.
Jcs 05 00170 g021
Figure 22. Axial stress S11 on reinforcement along the symmetry axis. Effect of reinforcement orientation.
Jcs 05 00170 g022
Figure 23. (a) Effective horizontal stiffness, k h , and (b) equivalent damping ratio, ξ , under different reinforcement orientations.
Jcs 05 00170 g023
Figure 24. Influence of vertical pressure P on the normal axial S11 and vertical S33 distribution.
Jcs 05 00170 g024
Figure 25. Normal axial S11 and vertical S33 stresses along the symmetry axis. Effect of vertical pressure P.
Jcs 05 00170 g025
Figure 26. Influence of vertical pressure P on the axial stress S11 distribution in the carbon fiber reinforcement.
Jcs 05 00170 g026
Figure 27. Axialstress S11 on reinforcement along the symmetry axis. Effect of vertical Pressure P.
Jcs 05 00170 g027
Figure 28. (a) Effective horizontal stiffness, k h , and (b) equivalent damping ratio, ξ , under different compression levels.
Jcs 05 00170 g028
Table 1. Virtual  specimens.
SpecimenDiameter
[mm]
Ht
[mm]
te
[mm]
nRSA
17RL_22S20045.052.251722.24.44
11RL_22S20029.152.251122.26.86
27RL_22S20071.552.252722.22.79
08RL_09S20044.85.2089.614.46
22RL_30S20045.101.652230.34.43
Table 2. Number of elements of the virtual experiment specimens.
Specimen
17RL_22S11RL_22S27RL_22S08RL_22S22RL_30S
C3D8R
Elements
36,86424,57657,34418,43247,104
M3D4R
Elements
8704563213,824409611,264
Tot. number
Elements
45,56830,20871,16822,52858,368
Table 3. Predicted horizontal mechanical properties.
u h = 0.5 t r u h = 1.0 t r u h = 1.5 t r u h = 2.0 t r u h = 2.25 t r
SpecimenReinf. Orien.Vert. Press. k h
[KN/mm]
ξ
[%]
k h
[KN/mm]
ξ
[%]
k h
[KN/mm]
ξ
[%]
k h
[KN/mm]
ξ
[%]
k h
[KN/mm]
ξ
[%]
17RL_22S4 MPa782.317.3610.714.4479.014.5454.913.5431.914.2
17RL_22S6 MPa759.119.1590.816.1467.915.7430.914.7423.914.9
17RL_22S8 MPa721.921.4563.018.1447.017.8395.116.9390.116.8
17RL_22S30°4 MPa768.317.5592.415.0446.116.3365.618.1--
17RL_22S45°4 MPa771.417.5583.015.4433.417.1324.620.4--
11RL_22S4 MPa126116.9102813.7851.613.1712.314.1669.114.7
27RL_22S4 MPa424.418.2305.715.7216.217.2161.628.6253.813.2
08RL_09S4 MPa754.618.9574.515.8450.716.0409.716.0374.917.1
22RL_30S4 MPa791.117.1626.614.2501.114.0444.513.7455.313.3
Publisher’s Note: MDPI stays neutral with regard to jurisdictional claims in published maps and institutional affiliations.

