Article

Numerical Modelling of Bond Strength in Overmoulded Thermoplastic Composites

1
Institut für Umformtechnik und Umformmaschinen (IFUM), Leibniz Universität Hannover, 30823 Garbsen, Germany
2
Open Hybrid LabFactory, Hermann-Münch-Straße 2, 38440 Wolfsburg, Germany
3
Institut für Werkzeugmaschinen und Fertigungstechnik (IWF), Technische Universität Braunschweig, Langer Kamp 19b, 38106 Braunschweig, Germany
*
Author to whom correspondence should be addressed.
J. Compos. Sci. 2021, 5(7), 164; https://doi.org/10.3390/jcs5070164
Submission received: 22 May 2021 / Revised: 3 June 2021 / Accepted: 6 June 2021 / Published: 23 June 2021

Abstract

:
Overmoulding of thermoplastic composites combines the steps of thermoforming and injection moulding in an integrated manufacturing process. The combination of continuous fibre-reinforced thermoplastics with overmoulded polymer enables the manufacturing of highly functionally integrated structures with excellent mechanical properties. When performed as a one-shot process, an economically efficient manufacturing of geometrical complex lightweight parts within short cycle times is possible. However, a major challenge in the part and process design of overmoulded thermoplastic composites (OTC) is the assurance of sufficient bond strength between the composite and the overmoulded polymers. Within the framework of a simulation-based approach, this study aims to develop a methodology for predicting the bond strength in OTC using simulation data and a numerical model formulation of the bonding mechanisms. Therefore, a modelling approach for the determination of the bond strength depending on different process parameters is presented. In order to validate the bond strength model, specimens are manufactured with different process settings and mechanical tests are carried out. Overall, the results of the numerical computation are in good agreement with the experimentally determined bond strength. The proposed modelling approach enables the prediction of the local bond strength in OTC, considering the interface conditions and the processing history.

Graphical Abstract

1. Introduction

Due to the high demand for technical products in terms of their ecological and economic efficiency, lightweight design is one of the key technologies for achieving current and future goals in the field of energy revolution. Modern lightweight design concepts are increasingly dominated by the use of hybrid material composites [1]. In addition to lightweight alloys, fibre-reinforced plastics (FRP) are increasingly being used in automotive [2,3] or aerospace [4,5] applications. Geiger and Ehrenstein [6] demonstrated the potential of a hybrid material combination on different cross beams. In this case, the bending and torsional strength of a hybrid beam was increased by using FRP and overmoulded plastic ribs when compared to a metal-plastic solution. However, the use of fibre-reinforced plastics and hybrid materials has economic and ecological challenges in markets that have to supply high manufacturing volumes, for example, the automotive industry. For the manufacturing of hybrid components with fibre-reinforced plastics in combination with or without metals, various established processes are already being used in aerospace and automotive engineering. For an efficient realisation of series manufacturing-suited cycle times, thermoplastics are convenient in the field of FRP [7]. In comparison to thermosetting plastics, shorter cycle times can be realised with FRP in manufacturing processes. Furthermore, the development of integrated manufacturing processes is advancing in order to use the potential of already established technologies to an optimum extent [8]. A promising solution that meets the growing demand for large-scale manufacturing of hybrid lightweight structures is injection moulding, which is already established for thermoplastics in various industries. In addition, new industrial processing methods for FRP, such as thermoforming, are also becoming increasingly established [9]. The thermoforming of woven fabrics with a thermoplastic matrix material (for example, organo sheets) is one of the processes which is considered to have a high potential for the manufacturing of high-performance lightweight structures [10,11]. The combination of both processes in one step, known as a one-shot process, is a promising technology that makes it possible to apply geometrically complex functional elements to a basic carrier of thermoformed organo sheet by overmoulding a polymer. A reliable control of all sub-processes is an essential requirement for the implementation of integrated processes that are of high economic relevance [12]. In addition, the connection between the organo sheet and the overmoulded structure is of decisive importance for the subsequent structural performance of the produced part, since additional joints can weaken the material and lead to a higher weight [13]. Process influences such as temperature, pressure, time, and forming history have a strong influence on the process and subsequent bond behaviour. In [14], bond strength is experimentally investigated using specimens made of organo sheets and injection-moulded rib structures. Bond strength depends largely on the temperature of the pre-heated organo sheet and the base geometry of the ribs. Al-Sheyyab et al. [15] used In-Mould Forming to achieve an improvement in bond strength, in addition to shortening the process chain by injecting the formed semi-finished product in a molten state. Several investigations of bond strength between thermoformed FRP and injection moulded ribs are solely based on experiments that only allow a global view of the phenomena in the interface [5,16]. Hürkamp et al. [17] correlated the experimentally measured bond strength between an organo sheet and overmoulded ribs with the interface temperature, determined by simulating the specimen manufacturing process. By applying machine learning methods, they developed a surrogate model of the injection moulding process to predict the quality of the bonding for arbitrary process settings within seconds. Akkermann et al. [4] propose an approach based on simulation data, to determine the local autohesion between a thermoplastic organo sheet and an overmoulded polymer. Correlating the degree of autohesion to the measured bond strength in different specimen geometries showed reasonable results. However, some influences on the bond strength could not be explained by considering the autohesion alone, and a possible influence of local contact conditions between the organo sheet and the overmoulded polymer was neglected. Lucchhetta et al. [18] analysed the influence of process parameters of the injection moulding process, as well as the pre-heating conditions of the organo sheet on the resulting bond strength. It was shown that the pre-heating strategy significantly influences the resulting bond strength, as well as the local surface conditions prior to overmoulding. In summary, no precise predictions about the local bond strength can be provided as only correlations between calculated and measured bond strengths are shown.
In addition to the studies mentioned above, this paper presents a numerical approach that provides the possibility of computing the local, as well as global bond strength, by using material and simulation data. The study focuses on the experimental and numerical investigation of overmoulded thermoplastic structures consisting of an organo sheet and reinforcing ribs. Therefore, a novel model based on a consolidation approach for thermoplastics is developed. By performing simulations of the overmoulding process, the necessary information about the local process parameters and conditions at the interface can be obtained. Thus, the bond strength for each element of the interface can be calculated. Finally, the numerically determined bond strengths are validated by comparison to the experimental results.

2. Materials and Methods

To validate the numerically computed bond strength, it is necessary to generate a proper experimental data basis. Therefore, specimens were manufactured in an overmoulding process under different process settings. Thus, different interface conditions and locally varying parameters, such as temperature and pressure, have been established to result in locally different bond strengths. These experimental bond strengths were measured by means of mechanical testing. Corresponding to the manufacturing schedule, process simulations of the overmoulding were carried out. This allows a locally resolved determination of the interface parameters, which are used as input data for the bond strength model. For the numerical determination of bond strength, a modelling approach based on the autohesion effect of thermoplastics is used and adapted for the application in overmoulding processes. Furthermore, the presented modelling approach allows a direct prediction of the local bond strength based on simulation data.

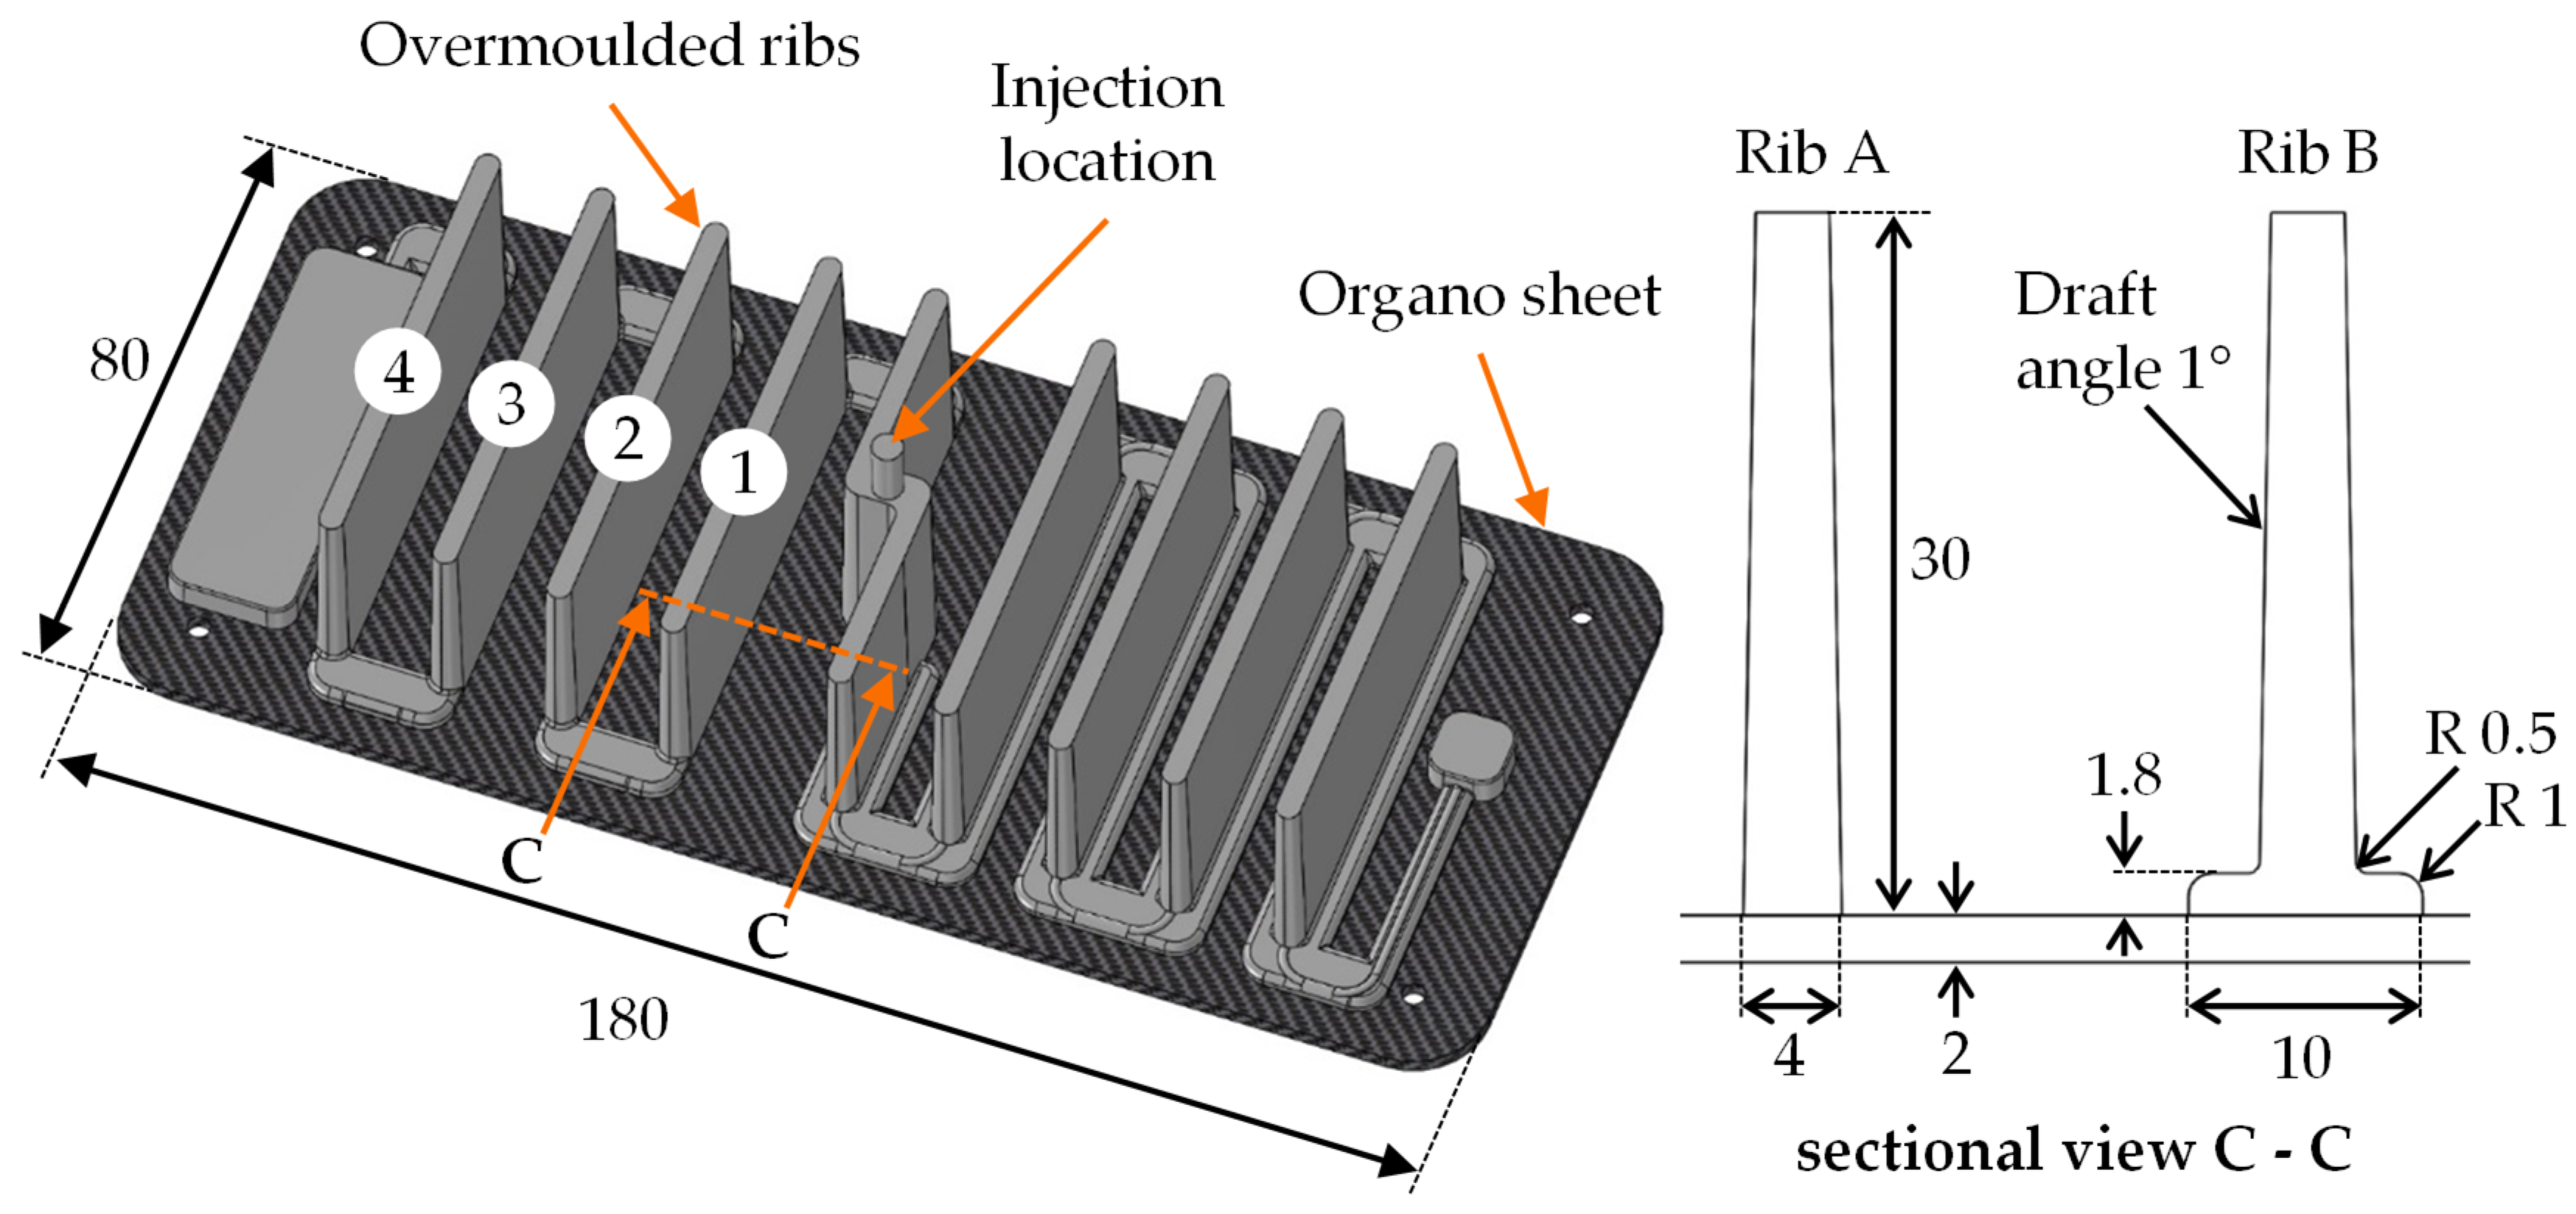
2.1. Specimen Manufacturing and Cross-Tension Test

For the characterisation of bond strength between the organo sheet and the overmoulded ribs, cross-tension test specimens were manufactured. In this study, an organo sheet with a polypropylene (PP) matrix (Tepex dynalite 104RG600(4)/47%) (Bond-Laminates, Brilon, Germany) and a homopolymer polypropylene (Moplen HP501H) (Lyondellbasell, Rotterdam, The Netherlands) injection moulding granulate were used. The meander-shaped specimen design allows the manufacturing of four ribs with two different base geometries at each shot (Figure 1). In this study, the focus is on the testing of the rib type A, since the base geometry is an almost perfectly orthogonal t-joint with the organo sheet. This enables a good comparability between experimental and numerical bond strengths, since notch effects do not occur in the base, as is the case with rib type B. The type A ribs are numbered from the injection location so that rib 1 has the shortest flow path and rib 4 the longest. The specimens are manufactured on an injection moulding machine Engel victory 120 (ENGEL AUSTRIA, Schwertberg, Austria).
During the manufacturing of the specimens, different parameter configurations were set on the injection moulding machine. The pre-heating of the organo sheet was realised by means of infrared radiation (IR). Therefore, a moveable IR-module is installed on the machine and coupled with the machine control system, so that each shot can be carried out in an automated process, in a highly reproducible manner [19]. The organo sheet is first positioned on ejector pins in the mould. Afterwards, the IR-module moves between the mould halves and heats the semi-finished product to the target temperature. The regulator of the heating power is coupled to a pyrometer, allowing a controlled heating cycle of 60 s each. The indicated temperatures (Table 1) were recorded at the organo sheet surface just before the closing of the mould. The cooling time between mould closure and the start of injection moulding was two seconds and has been considered accordingly in the injection moulding simulation (Section 2.2). The parameter variations for the injection moulding process are shown in Table 1. These parameter sets are used for the experimental injection moulding process, as well as the injection moulding simulation (Section 2.2). For each process setting, a total of ten test specimens were produced from the rib samples (Figure 1), providing a sufficient database for the validation of the model-based approach.
Each parameter set has an assigned short name. The short names indicate the special features of each parameter combination. Accordingly, the set “Low” includes the lowest process parameters of the test schedule. The sets “HiMelt” and “HiOrg” indicate that the temperature of the melt and the organo sheet, respectively, was increased in comparison to set “Low”. These three sets are used for the subsequent evaluation in this study (Section 3.2). All other sets with the name “Ref1/2/3” provide additional data for the later calibration of the bond strength model (Section 3.2.4). The parameters shown above obviously have an influence on the local interface parameters, such as temperature, pressure, viscosity, and the contact time between the organo sheet and the polymer melt. The influence of the varying process parameters on the resulting bond strength is shown in Section 3.1. After manufacturing, the single ribs (Figure 1, 1–4) are cut out of the specimen by water jet cutting. The cross-tension test was conducted on a Zwick Z050 universal tensile testing machine (Zwick Roell, Ulm, Germany) with an appropriate testing device (Figure 2). The rib specimen is inserted into a fixation and then pulled off orthogonally to the surface of the organo sheet at a testing speed of 2 mm/min.

2.2. Overmoulding Simulation

In order to identify the interface parameters between the organo sheet and the polymer melt during the overmoulding process, the specimen manufacturing was reproduced in process simulations. From these simulations, the time-dependent nodal values of temperature, pressure, viscosity, and contact time were used as input data for the computation of the bond strength (Section 2.4). This allows a locally resolved determination of the interface conditions. Since the overmoulding process takes place in a closed tool with high clamp forces, the integration of sensors for measuring the inner conditions is challenging and provides only few data points. In addition, the interface area is rather inaccessible due to complex cavity geometries. Here, the simulation proves to be suitable for determining a large and time dependent database with regard to the interface parameters.
The simulation was performed using the commercial software Autodesk Moldflow (v2017). First, the CAD geometry of the rib cavity and the organo sheet insert was imported and meshed with linear four-node tetrahedral elements. At the interface, both parts were remeshed with an average element edge length of 0.8   mm to obtain an adequate amount of data points at the interface. The organo sheet was three-dimensionally meshed with four elements in the thickness direction, whereas the rib cavity was meshed with 10 elements over the thickness, allowing an accurate representation of the fluid flow. The material data for the polypropylene granules used was taken from the Autodesk Moldflow database. In order to ensure the usability of this database for the material batch, the granules were characterised using a capillary rheometer (Malvern, RH 2000) (Malvern Instruments, Malvern, United Kingdom). The shear rate dependent viscosity between 10   s 1 and 8000   s 1 at different temperatures was determined and compared with the given material data. The results showed a good agreement with the material data from the simulation database, which is used later on in this paper.
For the organo sheet, a homogeneous initial temperature distribution was assumed and set to different temperature values according to the process settings (Table 1). Additionally, a contact time of two seconds between the organo sheet and the tool prior to overmoulding was defined. As soon as the polymer melt overflows the organo sheet surface, the interface is formed and the autohesion process of the polymer chains starts. It is assumed that significant autohesion only occurs at temperatures above the melting temperature of the polymers, which is at about 160 °C for the used polypropylene material. In Figure 3, an exemplary temperature distribution in the test specimen is shown at a timestamp of 0.36 s and the process setting “HiOrg” (Table 1). At this time, the polymer melt has filled about half of the cavity domain of the rib A1. In the unfilled areas, the surface temperature of the organo sheet is about 145 °C. The difference of 15 °C to the initially applied temperature of 160 °C is caused by the heat loss during the contact time of two seconds between the organo sheet and the relatively cold tool, which was set to a constant temperature of 50 °C. The overflowing melt causes the temperature at the interface to increase to approximately 200 °C, resulting in a fusion of the components.
Corresponding to the interface temperatures, the other relevant interface parameters, in particular pressure, viscosity, and contact time, are determined and exported to be used as input for the bond strength computation (Section 2.4).

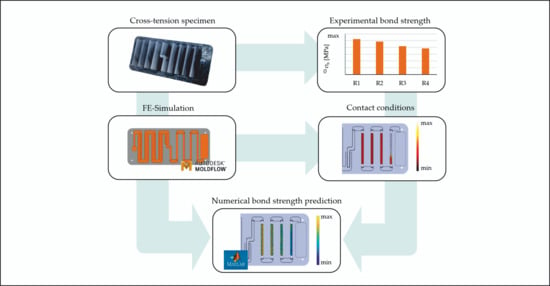
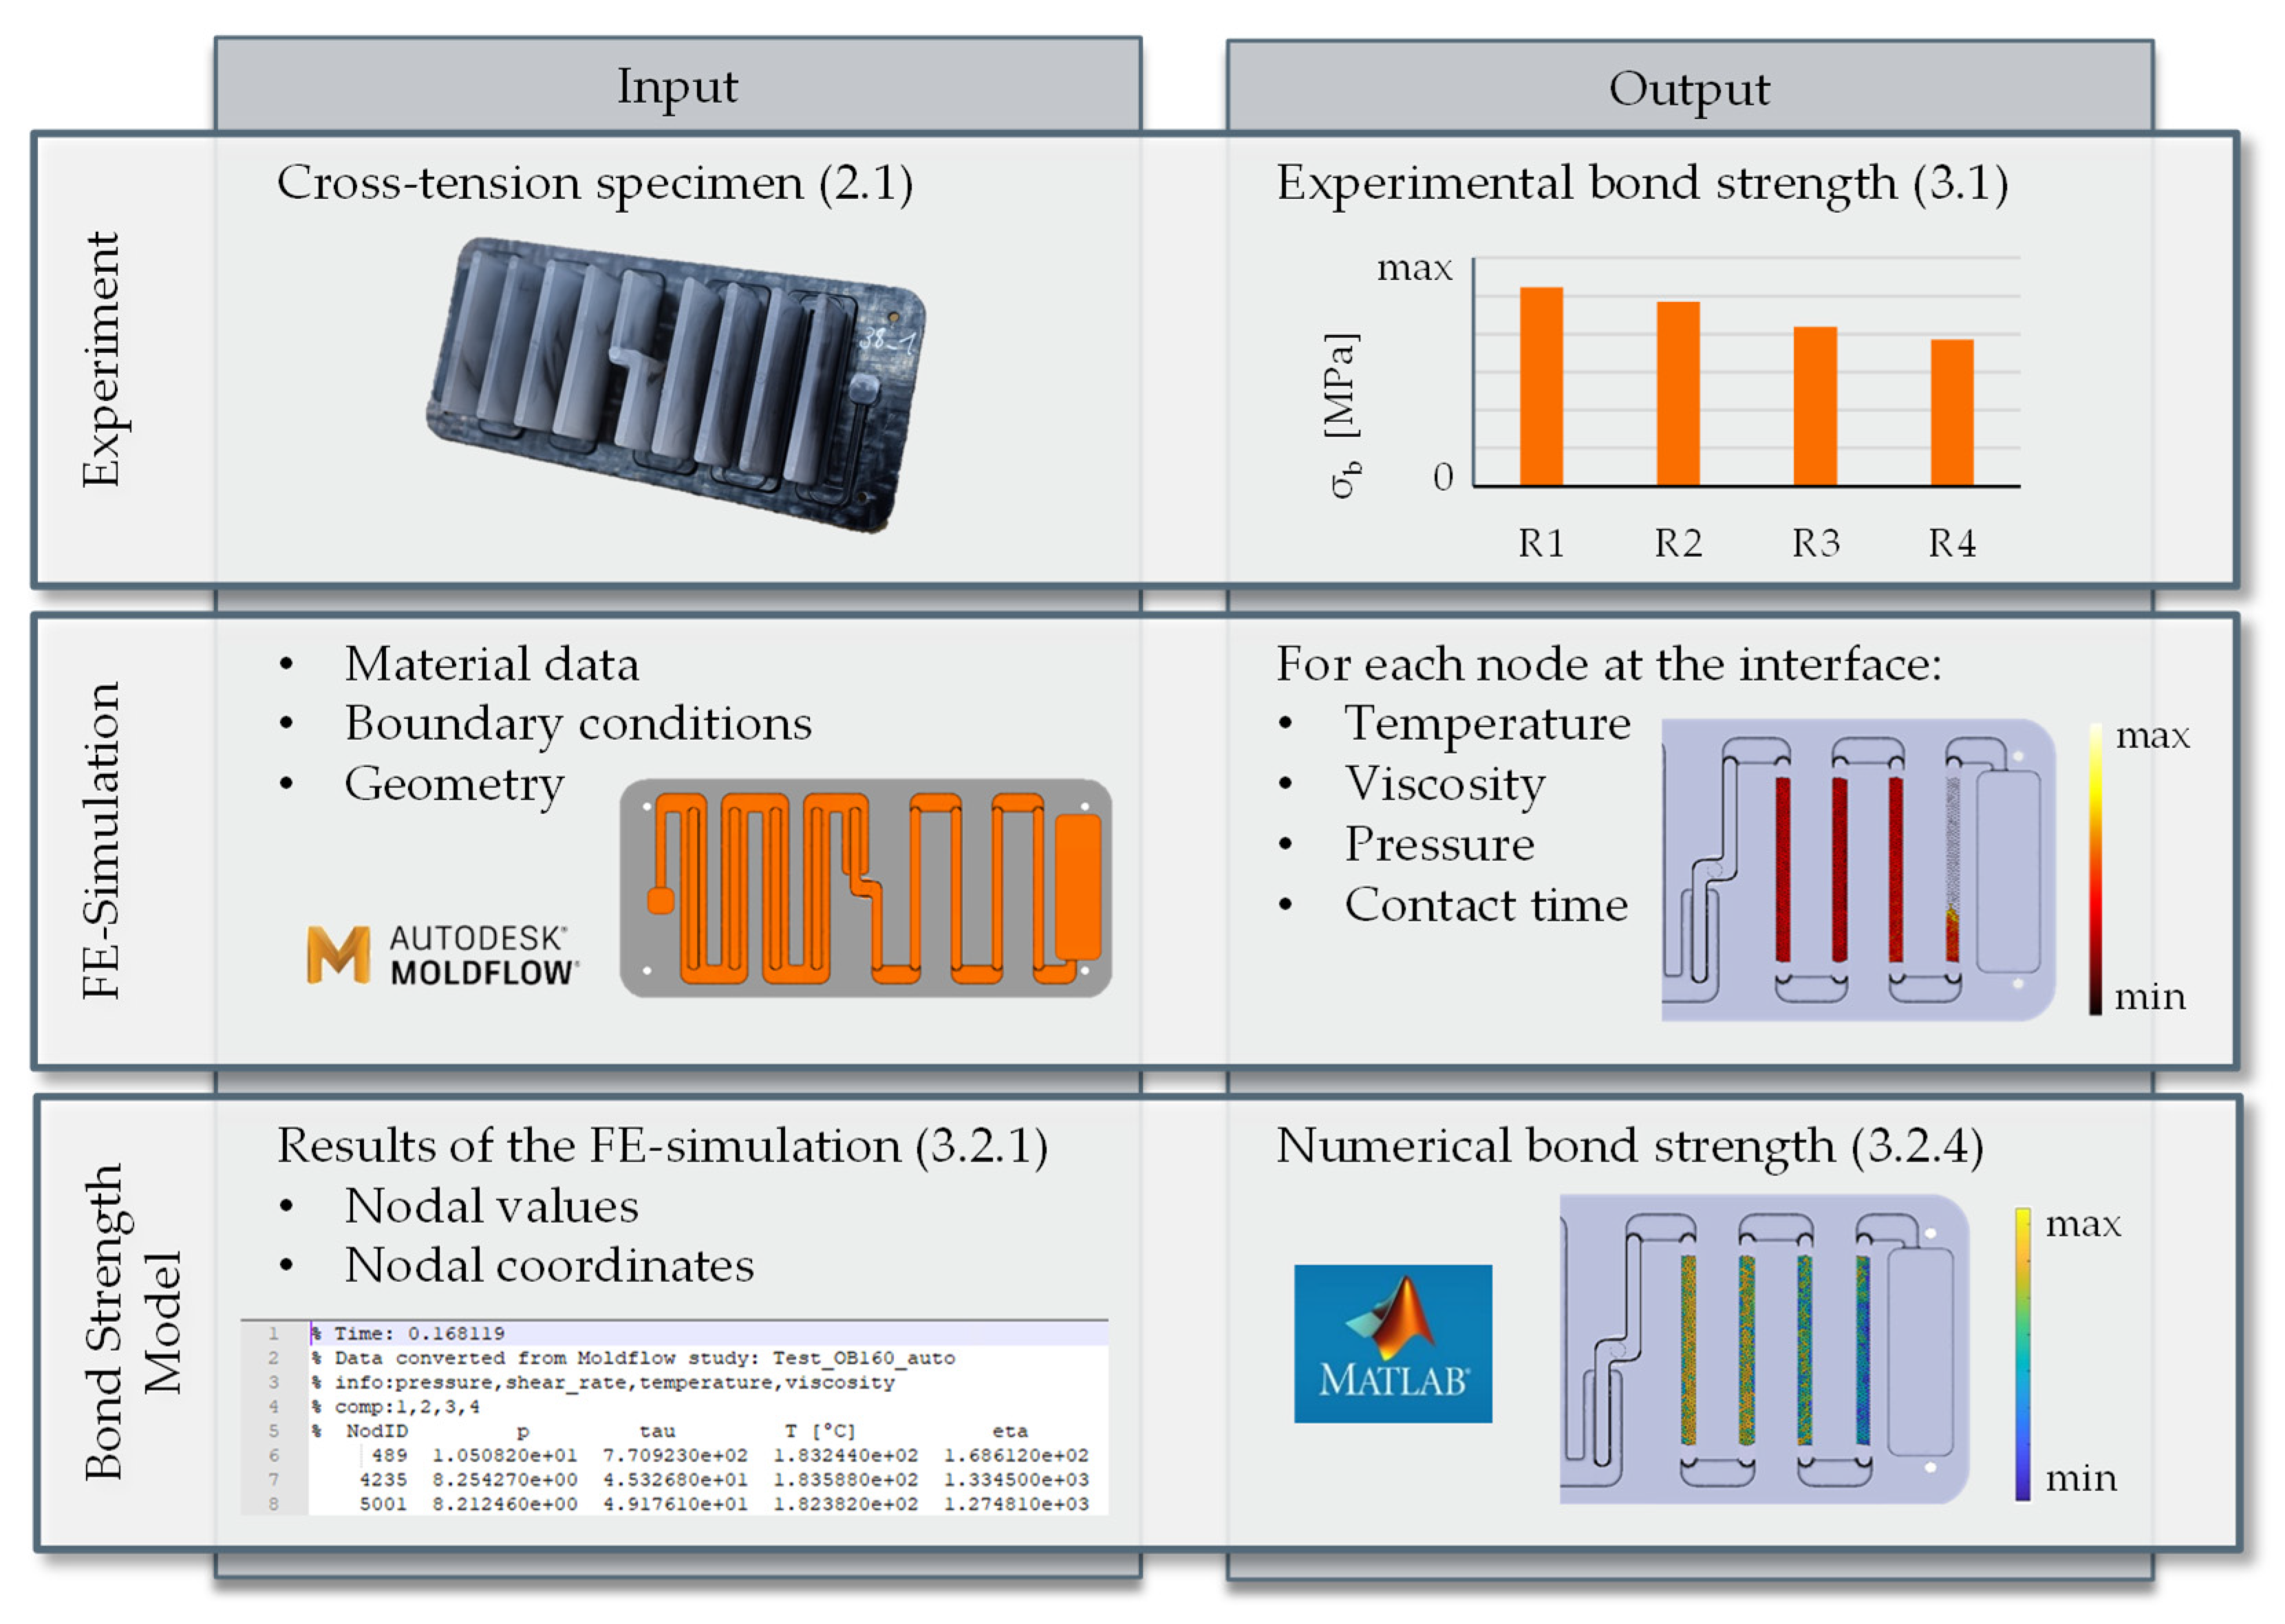
2.3. Workflow of Data Processing

This section elaborates the workflow of simulation data acquisition and processing into the bond strength computation model. To illustrate the procedure for determining the bond strength, the workflow is summarised in Figure 4. The procedure is divided into three steps. In each step, there is an input and output of information and data. The experimental step provides information on the influences of the process parameters on the bond strength, based on the example of cross-tension specimens, as well as data for the validation of the model based bond strength computation.
The simulation step makes it possible to determine the conditions at the interface during the manufacturing process with a fine temporal and local resolution. For each time step, which is defined by the numerical simulation, the nodal values are exported from Moldflow and further processed in a MATLAB post-processing script, in which the bond strength is computed at each node. By interpolating between the nodal values, the bond strength can be displayed for each element at the interface. Finally, the numerical results of the bond strength are compared with the experimental results.

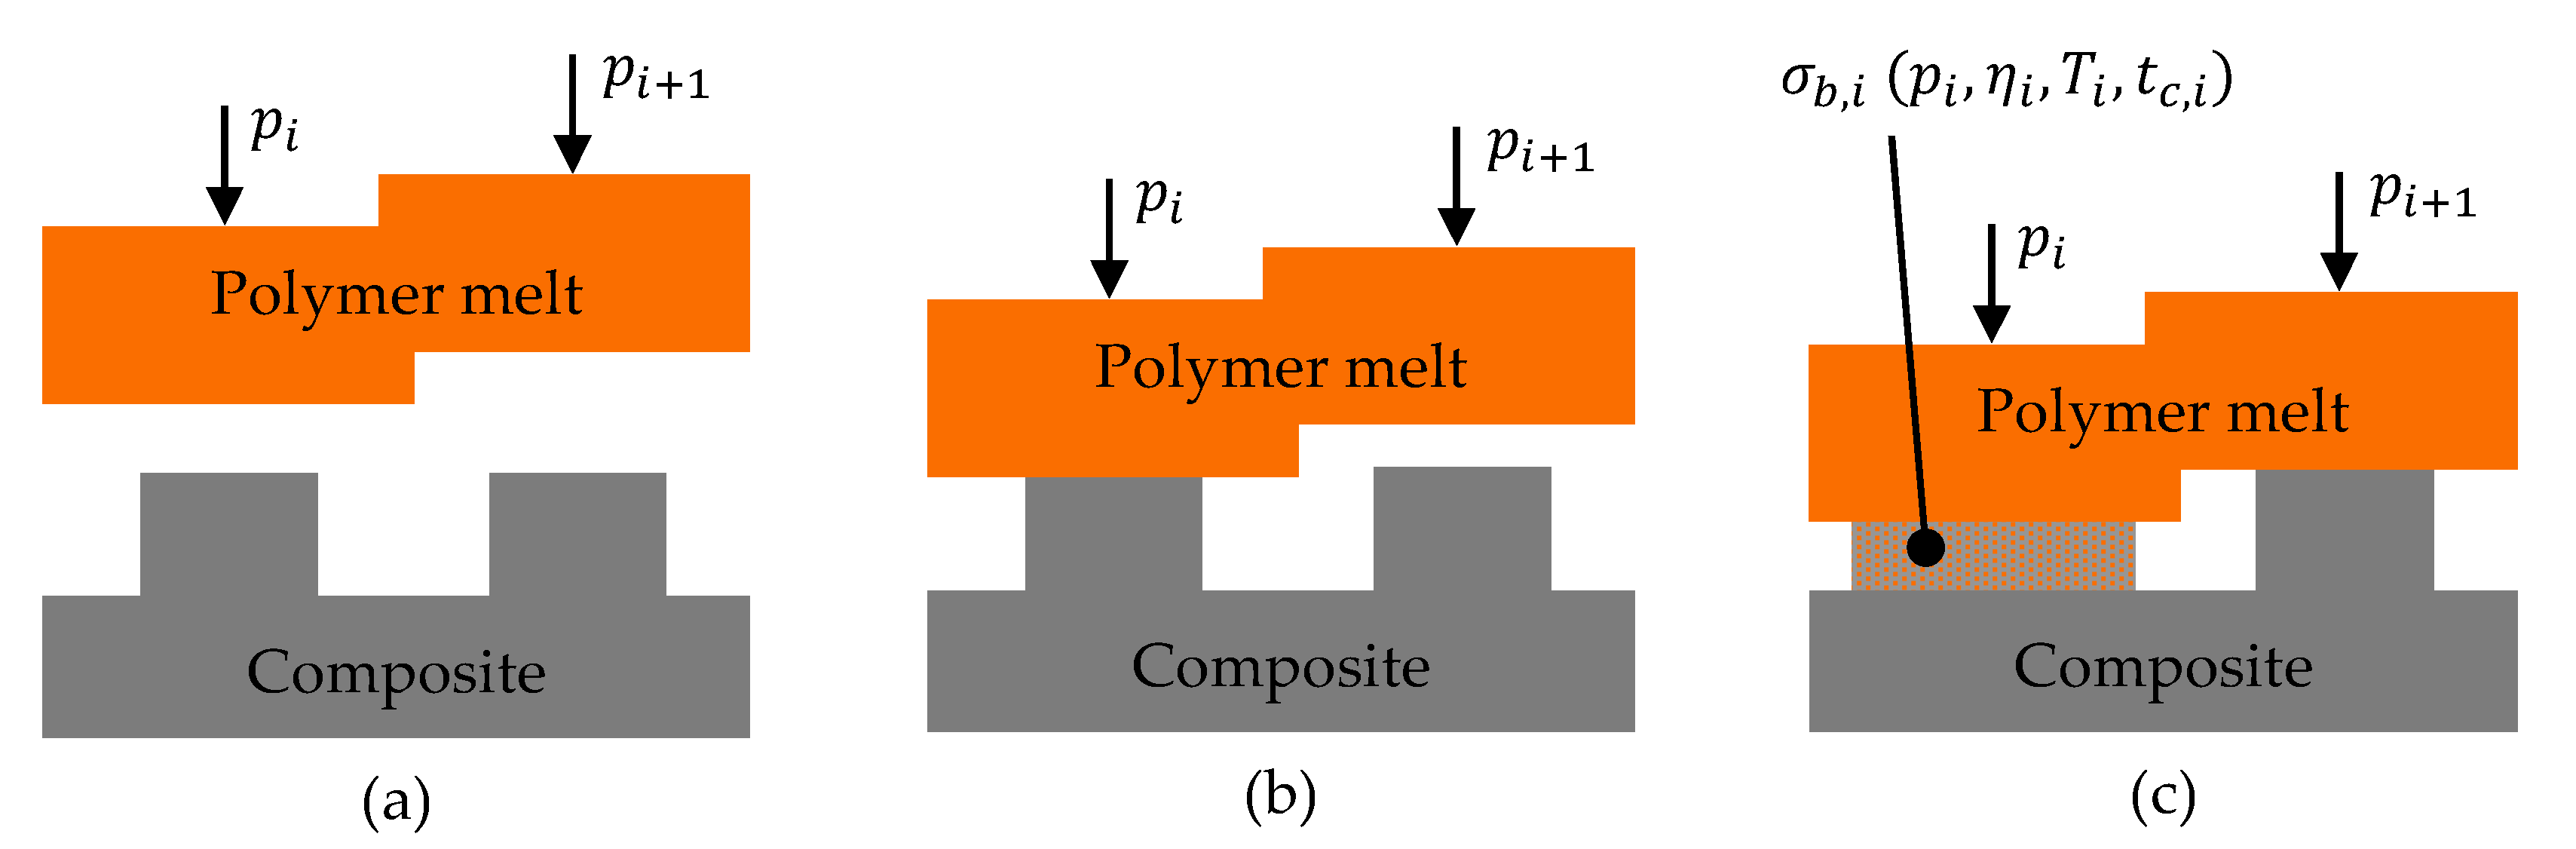
2.4. Bond Strength Modelling Approach

The model development carried out in this study is based on a consolidation approach that is derived from thermoplastic tape placement processes. This approach of Dara und Loos [20] is used to describe the bonding mechanisms during the processing of thermoplastics, for example, the processing of semicrystalline thermoplastic matrix composites [21], hot pressing [22,23], fusion bonding [24], and resistance welding [25]. In general, the influence of the process parameters pressure, temperature, and time on the bonding quality are quantitatively described. For this purpose, a special type of bonding between two subsequent interfaces, called autohesion, is considered. The autohesion is defined as self-diffusion, which occurs when two chemically identical polymers get in contact above their recrystallisation temperature and results in the formation of a strong bond at the interface [26]. Accordingly, two coupled sub models were introduced. The subdivision of the process steps is depicted in Figure 5.
At the beginning of the process, two identical thermoplastics are present, but are not in contact with each other (Figure 5a). In this context, Mantell and Springer [22] divide the plastic surfaces into uniform rectangles ( a 0 b 0 ) with uniform distances w 0 , representing its imperfections or roughness, respectively. After the pressure p is applied, the thermoplastic surfaces get into intimate contact with each other (Figure 5b). Under pressure and at temperatures above the recrystallization temperature of the matrix material, the rectangles are subsequently compressed and the distance w between the rectangles is reduced. However, due to the law of volume constancy, the newly set geometry ( a b ) is continuously determined. Depending on the geometry of the rectangle and the process parameters, the degree of intimate contact:
D ic = b w o + b 0 , 0 D ic 1
can be computed for each point at any time. Whereas the degree of contact describes the temporary state of the surface or the interface respectively, the chemical bonding of the polymer chains is decisive for the formation of the bond strength. This process can be described by the degree of autohesion (Figure 5c). First models have been formulated by Wool and O’Connor [27,28] in the context of crack healing in thermoplastic structures. Later, Lee, and Springer [21] approximated the degree of autohesion:
D au = t w ( T ) · t c 1 4 , 0 D au 1
as a function of contact time   t c and welding time t w . By means of the Arrhenius relation:
t w ( T ) = A × exp ( E R × T )
the welding time is related to melt temperature T , activation energy E , material specific constant A , and universal gas constant R . According to [29], the welding time is directly related to the molecular relaxation time in the polymer melt. The relaxation time represents the time needed for the disentanglement of the polymer chains, which indicates the onset point of the chain mobility or t w , respectively. To obtain the temperature dependent welding time, the Carreau Fluid Model (Figure 6a) was used to determine the transition point at which the fluid behaviour changes from Newtonian fluid to shear-thinning. This procedure was conducted for the melt temperatures listed in Table 2, giving the grid points for the Arrhenius function (Figure 6b).
The coefficients A and E of the Arrhenius Equation (3) can be determined by means of an Arrhenius graph. For this purpose, the logarithm of the variable t w is plotted against the reciprocal of the temperature. Thus, their relationship can be described with an Arrhenius equation that is represented as a linear graph. The slope of the linear graph
m = E R
is defined as the ratio of activation energy E to the gas constant R . The material-specific coefficient A can be calculated by inserting a grid point for t w (known from Table 2) and the activation energy determined from Equation (4) into Equation (3). Accordingly, the functional relationship between the welding time
t w ( T ) = 7.65 e 5 × exp ( 30 , 420.47 R × T )
and the melt temperature for the applied polypropylene can be represented. Based on these fundamentals, in this study, a thermo-mechanical approach to determine the local bond strength between the organo sheet and the polymer melt is being developed. In the first step, the intimate contact model is used to describe the contact between the surfaces. According to Mantell and Springer [22], the degree of intimate contact from Equation (1) can be specified as a function of the contact time t c , applied pressure p , and temperature-dependent viscosity of the matrix material η ( T ) , resulting in
D ic = g × [ 0 t c p η ( T ) dt ] 1 5 ,
where g is summarised as a geometric parameter for the consideration of the influence of the surface conditions in the degree of contact, which approximates the interaction of the geometrical surface parameters to a 0 , b 0 and w 0 (cf. Figure 5a). The influence of the geometrical parameter g can be investigated by comparing the measured and computed bond strength. From this, conclusions can be drawn about the relevance of the degree of contact on the bond strength, compared to the degree of autohesion. The product of the degree of intimate contact and the degree of autohesion defines the total degree of bonding [29]:
D b = D ic × D au , 0 D b 1
whereby a maximum possible value of D b = 1 implies a 100% fusion to a quasi-homogeneous material. Tierney and Gillespie [30] were able to validate the correlation between the development of the bond strength and the parameters’ degree of intimate contact and autohesion, both experimentally and numerically using different approaches. Within the scope of this study it is assumed that the degree of bonding
D b = σ b σ max
describes the ratio of the current bond strength σ b to the maximum strength of the matrix material σ max , which is 33 MPa for polypropylene. By inserting Equations (2), (3), (6) and (7) in (8), the final computation equation for determining the bond strength
σ b = σ max × ( A × exp ( E R × T ) × t c 1 4 × g × [ 0 t c p η ( T ) dt ] 1 5 )
is obtained. Based on this equation, a further development for the application case of overmoulding a thermoplastic composite, in particular an organo sheet, is proposed and illustrated in Figure 7.
In order to use the model in numerical simulation, the bond surfaces have to be discretised. Accordingly, the surfaces are subdivided into finite elements. Starting with no contact (Figure 7a), two identical thermoplastic matrix materials are present. The polymer melt will begin to flow on the surface of the composite, with defined process parameters. Depending on the time passed, only certain elements, i.e., nodes, along the flow path are in intimate contact (Figure 7b). Due to local autohesion (Figure 7c), an element-based bond zone is developed. In addition, different pressures and temperatures have an effect on the degree of contact at each element as a function of time. With the discretisation of the bond surfaces, the varying distribution of the extruded material along the composite surface is taken into account. By means of the numerical simulation, a bond strength
σ b , i = σ max × ( A × exp ( E R × T i ) × t c , i 1 4 × g × [ 0 t c , i p i η ( T i ) dt ] 1 5 )
can be computed by numerical integration for each node i of the interface, depending on the local process parameters. To determine the bond strength in a specific area (for example, interface at the rib base) for n nodes, the mean value of all nodes, which are in intimate contact is computed as:
σ b = 1 n × i = 1 n σ b , i
Using the Delaunay triangulation algorithm, a mesh is generated and the nodal values are averaged over the element, which are later compared with the experimental values.

3. Results and Discussion

In this section, the results of the experimental and numerical investigations are presented and discussed. First, the bond strength values determined in the cross tension-test are analysed with regard to different manufacturing settings. Afterwards, the numerical results and the model based computed values for autohesion, intimate contact, and bond strength are compared to the experimental results.

3.1. Cross-Tension Test

The cross-tension tests provided findings on the relevant factors influencing the bond strength in relation to the parameter variation in the overmoulding process. In Figure 8, the normalised percentage increase in bond strength is shown for various process parameters.
Each parameter type was split into two values, except for the preheating temperature of the organo sheet, which was split into three values. The measured bond strength, which was achieved by manufacturing with a lower parameter, was set to 100%. Therefore, the potential increase in bond strength when increasing the different process parameters is shown. It is apparent that the pre-heating temperature of the organo sheet is the most influencing factor on bond strength. An increase in pre-heating temperature from 50 °C to 80 °C already results in an average increase in bond strength of 55%. A further increase from 80 °C to 160 °C pre-heating temperature leads to a nonlinear increase in bond strength of 158%. This is due to the significantly higher potential for autohesion between the molten organo sheet surface and the overflowing melt compared to non-molten organo sheet surfaces.
A higher potential for autohesion is also achieved by higher melt temperatures, causing an average increase in bond strength of 47%. The tool temperature only indirectly influences the interface conditions. However, the cooling of the part is slowed down, probably leading to a longer time period during which autohesion can take place. Thus, the bond strength increased by 25% on average. With an increase of 22%, the holding pressure has the least impact on the bond strength. Nevertheless, the holding pressure promotes the intimate contact between the organo sheet and the polymer, which can be decisive for a sufficient bond strength, especially at low interface temperatures.
All observed effects can be attributed to different local conditions at the interface. Considering the manufacturing of large-scale overmoulded structures, significantly different local bond strengths can develop. Particularly in the case of complex-shaped composites or overmoulded rib structures with long melt flow paths, the flow front as well as the organo sheet surface cool down for a certain long period before the overflow of the melt happens. As a result, the overall interface temperature is correspondingly low. In addition, the local pressure distribution at the interface decreases as the flow path increases, i.e., in areas far from the injection location. This poor temperature and pressure supply results in lower bond strengths than in areas close to the injection location. In the investigations carried out here, these effects were achieved on the one hand by the design of the cross-tension test specimen with its meandering flow path, and on the other hand by varying the process control. In order to analyse the influence of the process parameters on the bond strength of overmoulded composites, it is crucial that not only the machine and system parameters are taken into account, but also that the local interface parameters are actually analysed, as these differ significantly from the process setting values. Due to the overmoulding process in closed moulds and the difficult use of sensors in the interface, this can only be determined with the help of simulations. Hence, a process simulation is a suitable tool to determine the local process parameters, allowing a precise temporally and spatially resolved analysis of the conditions at the interface [31].

3.2. Numerical Results

In this section, the numerical results of the injection moulding simulation (Section 2.2) are presented. The results of the simulation are used to compute the autohesion, intimate contact, and bond strength (According to Section 2.4).

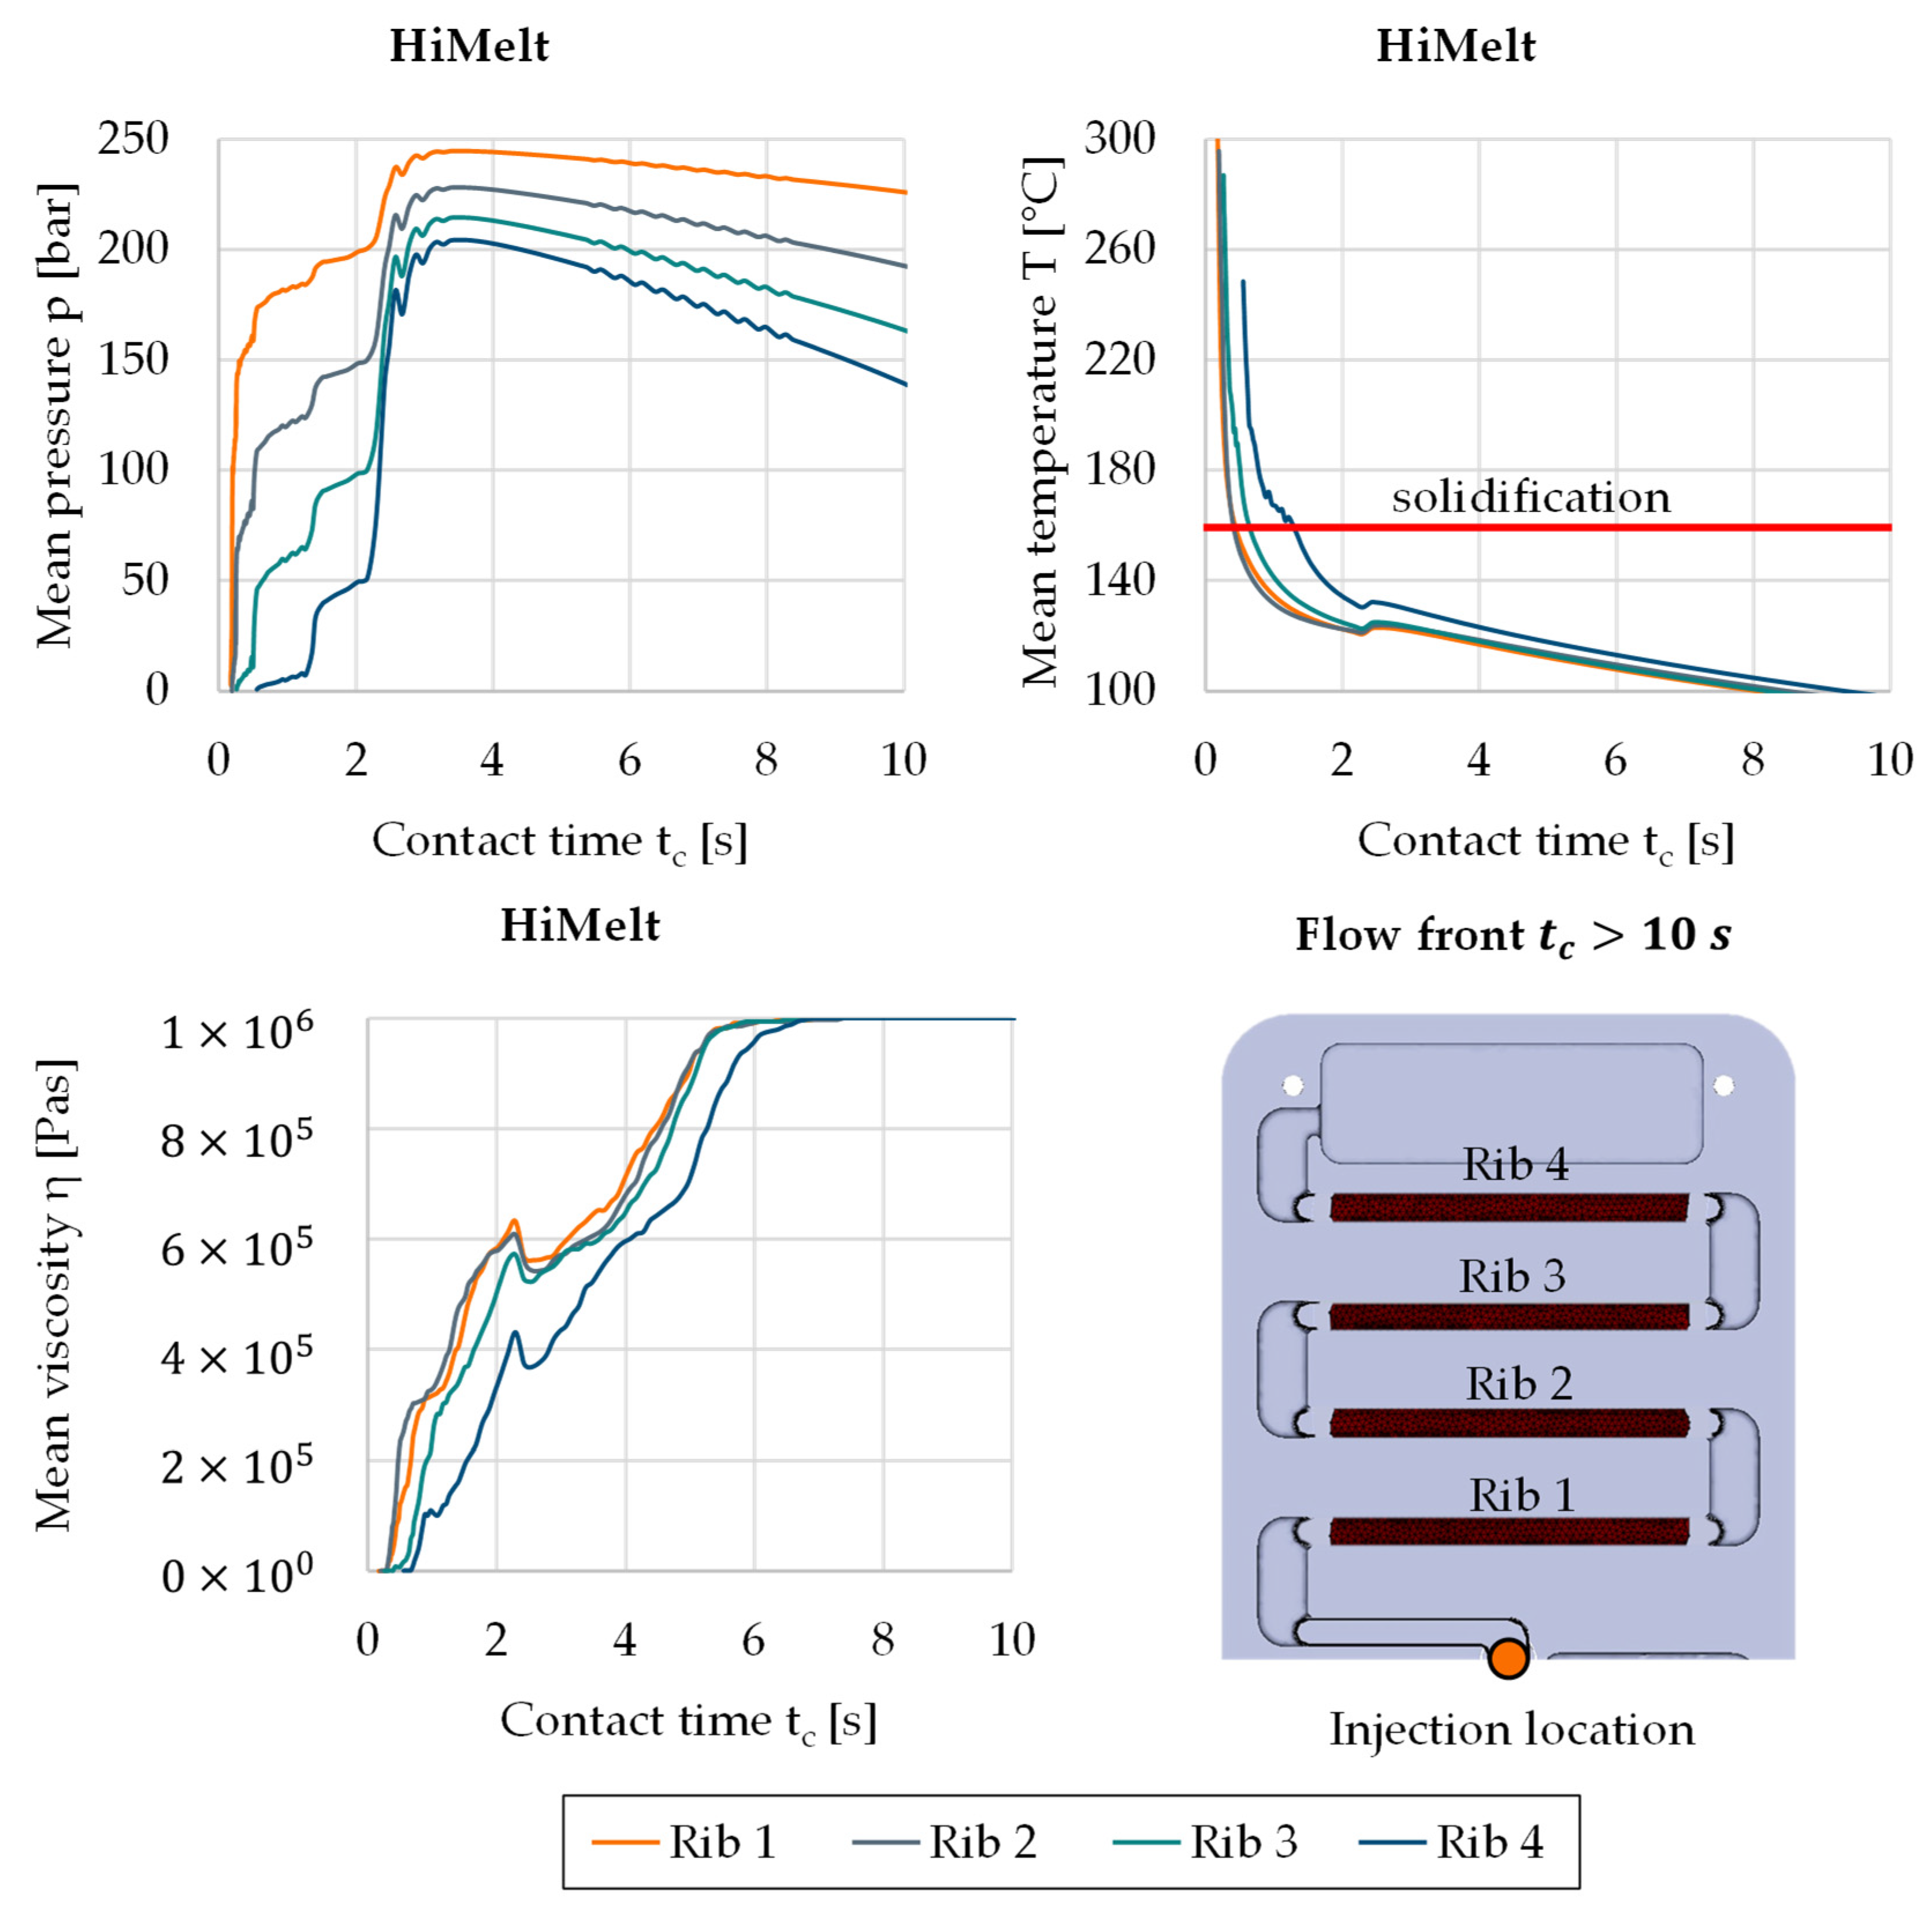
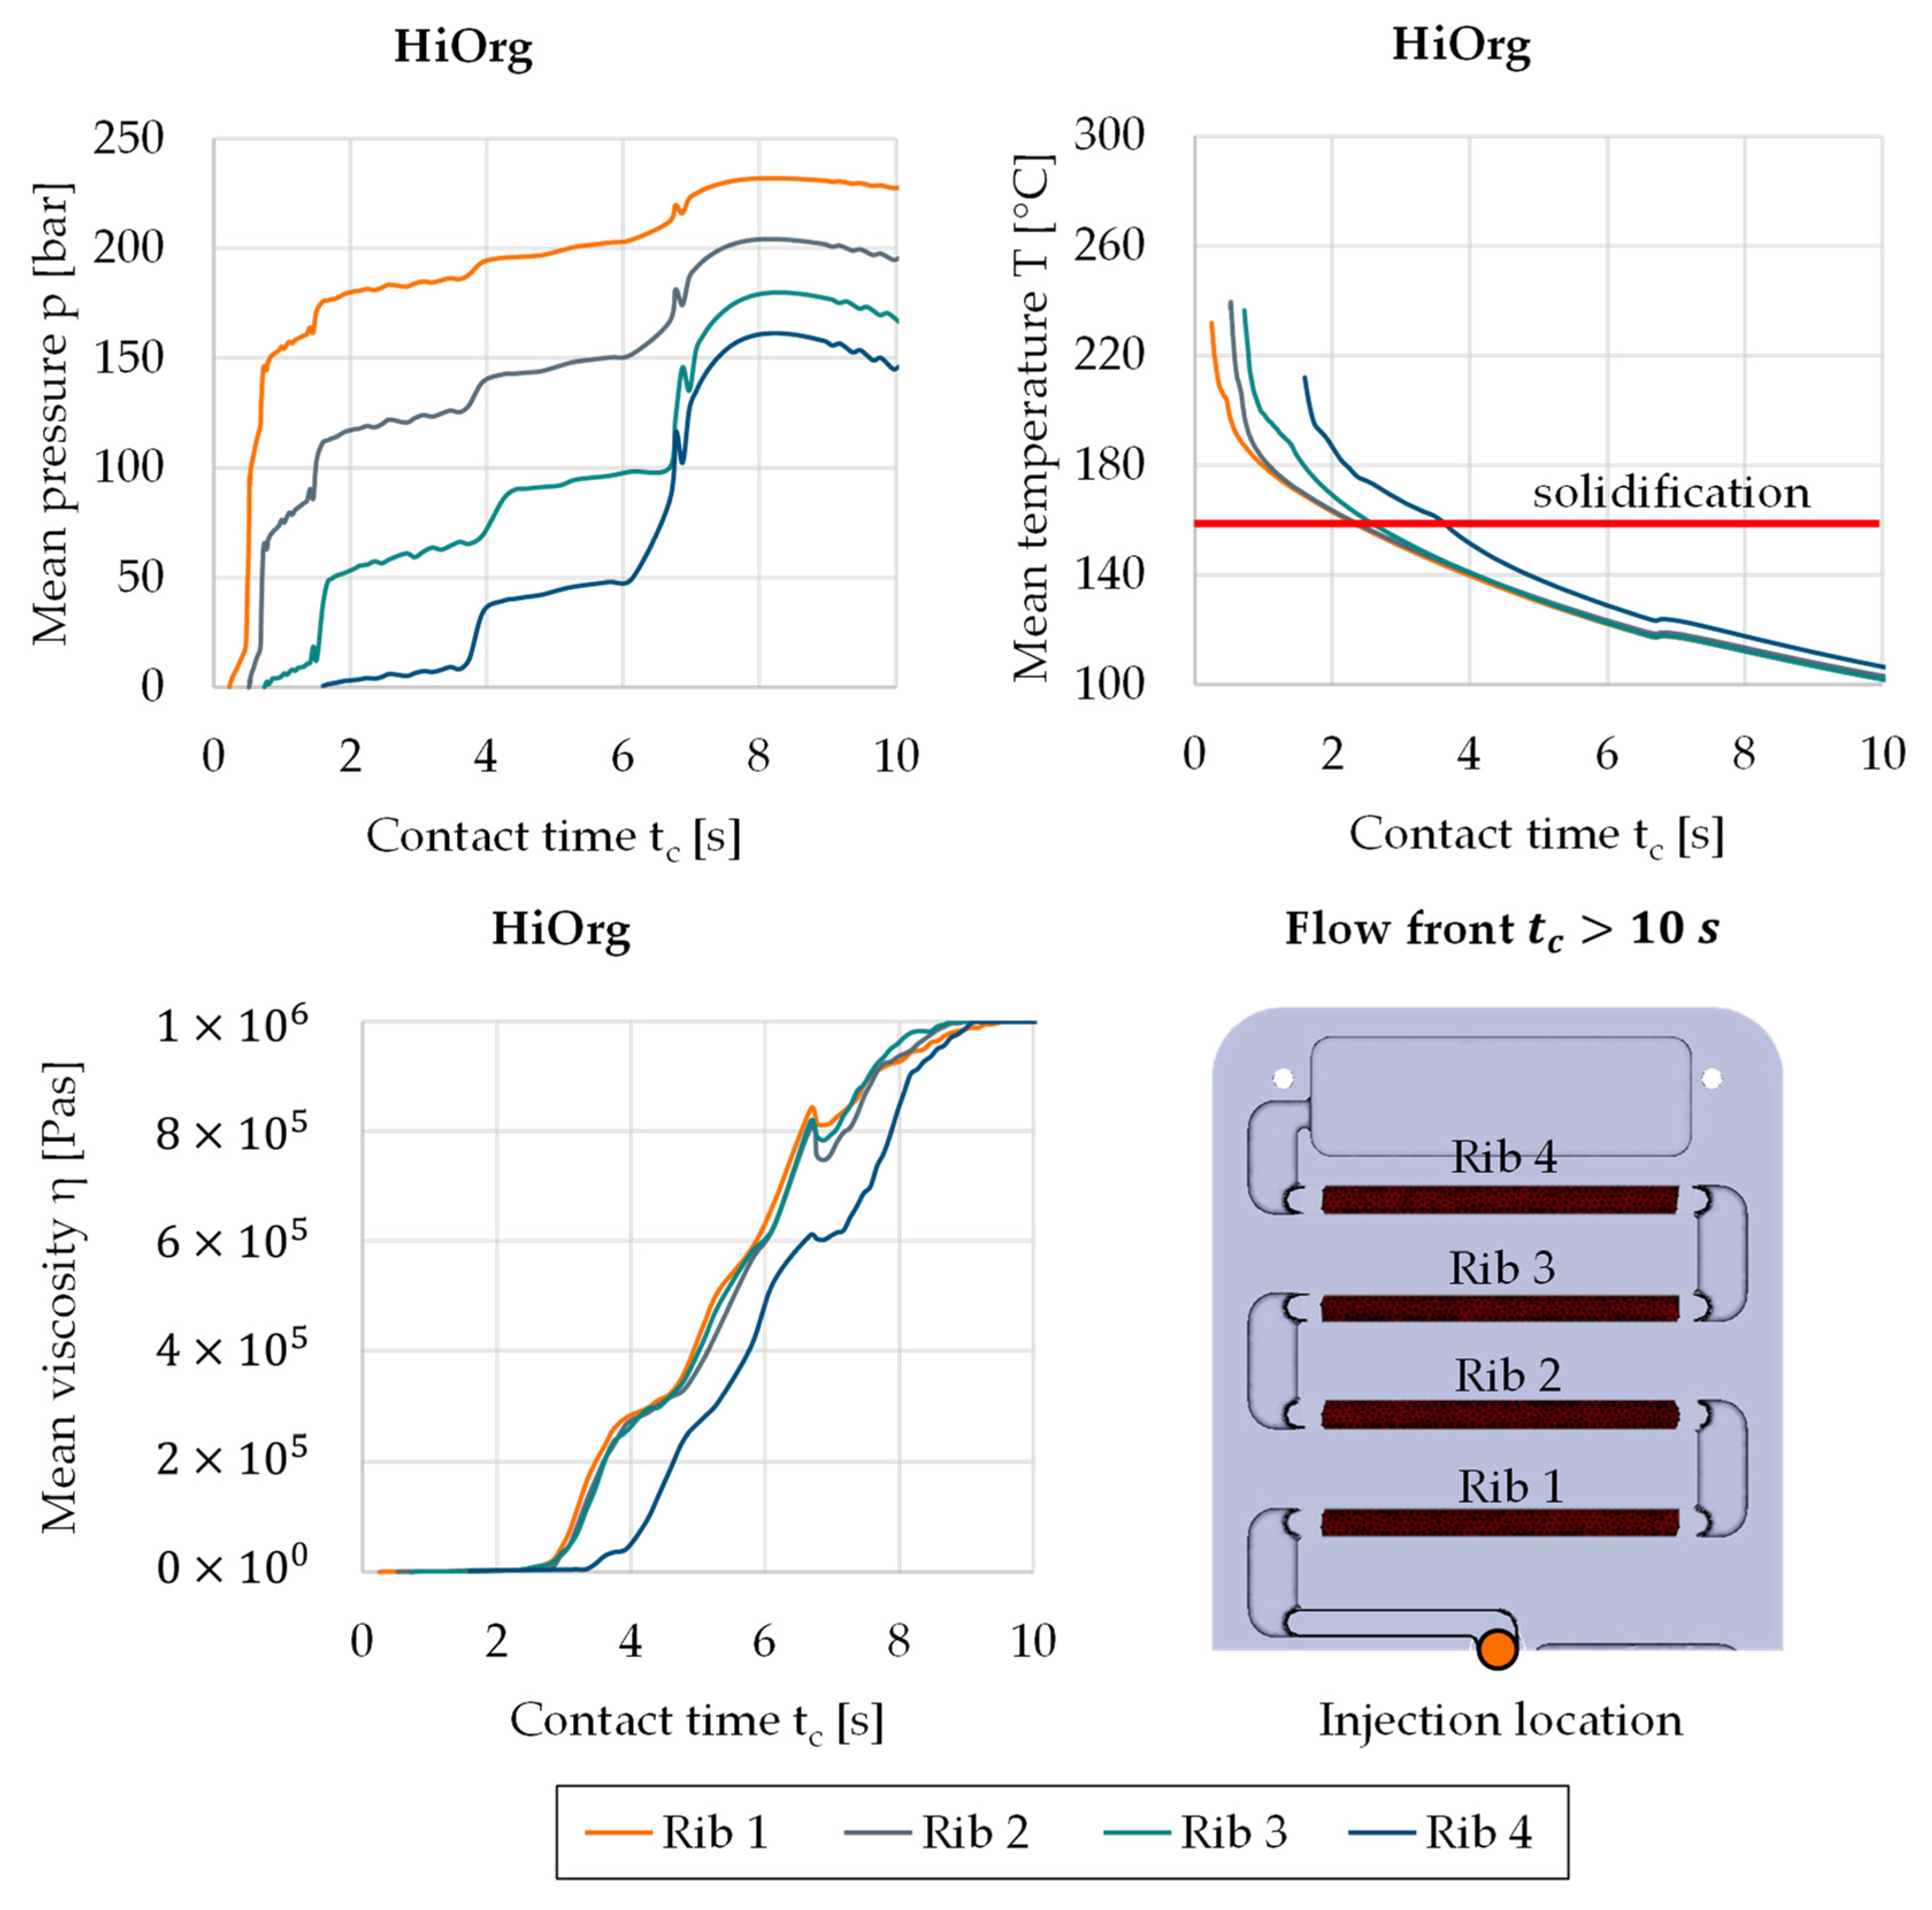
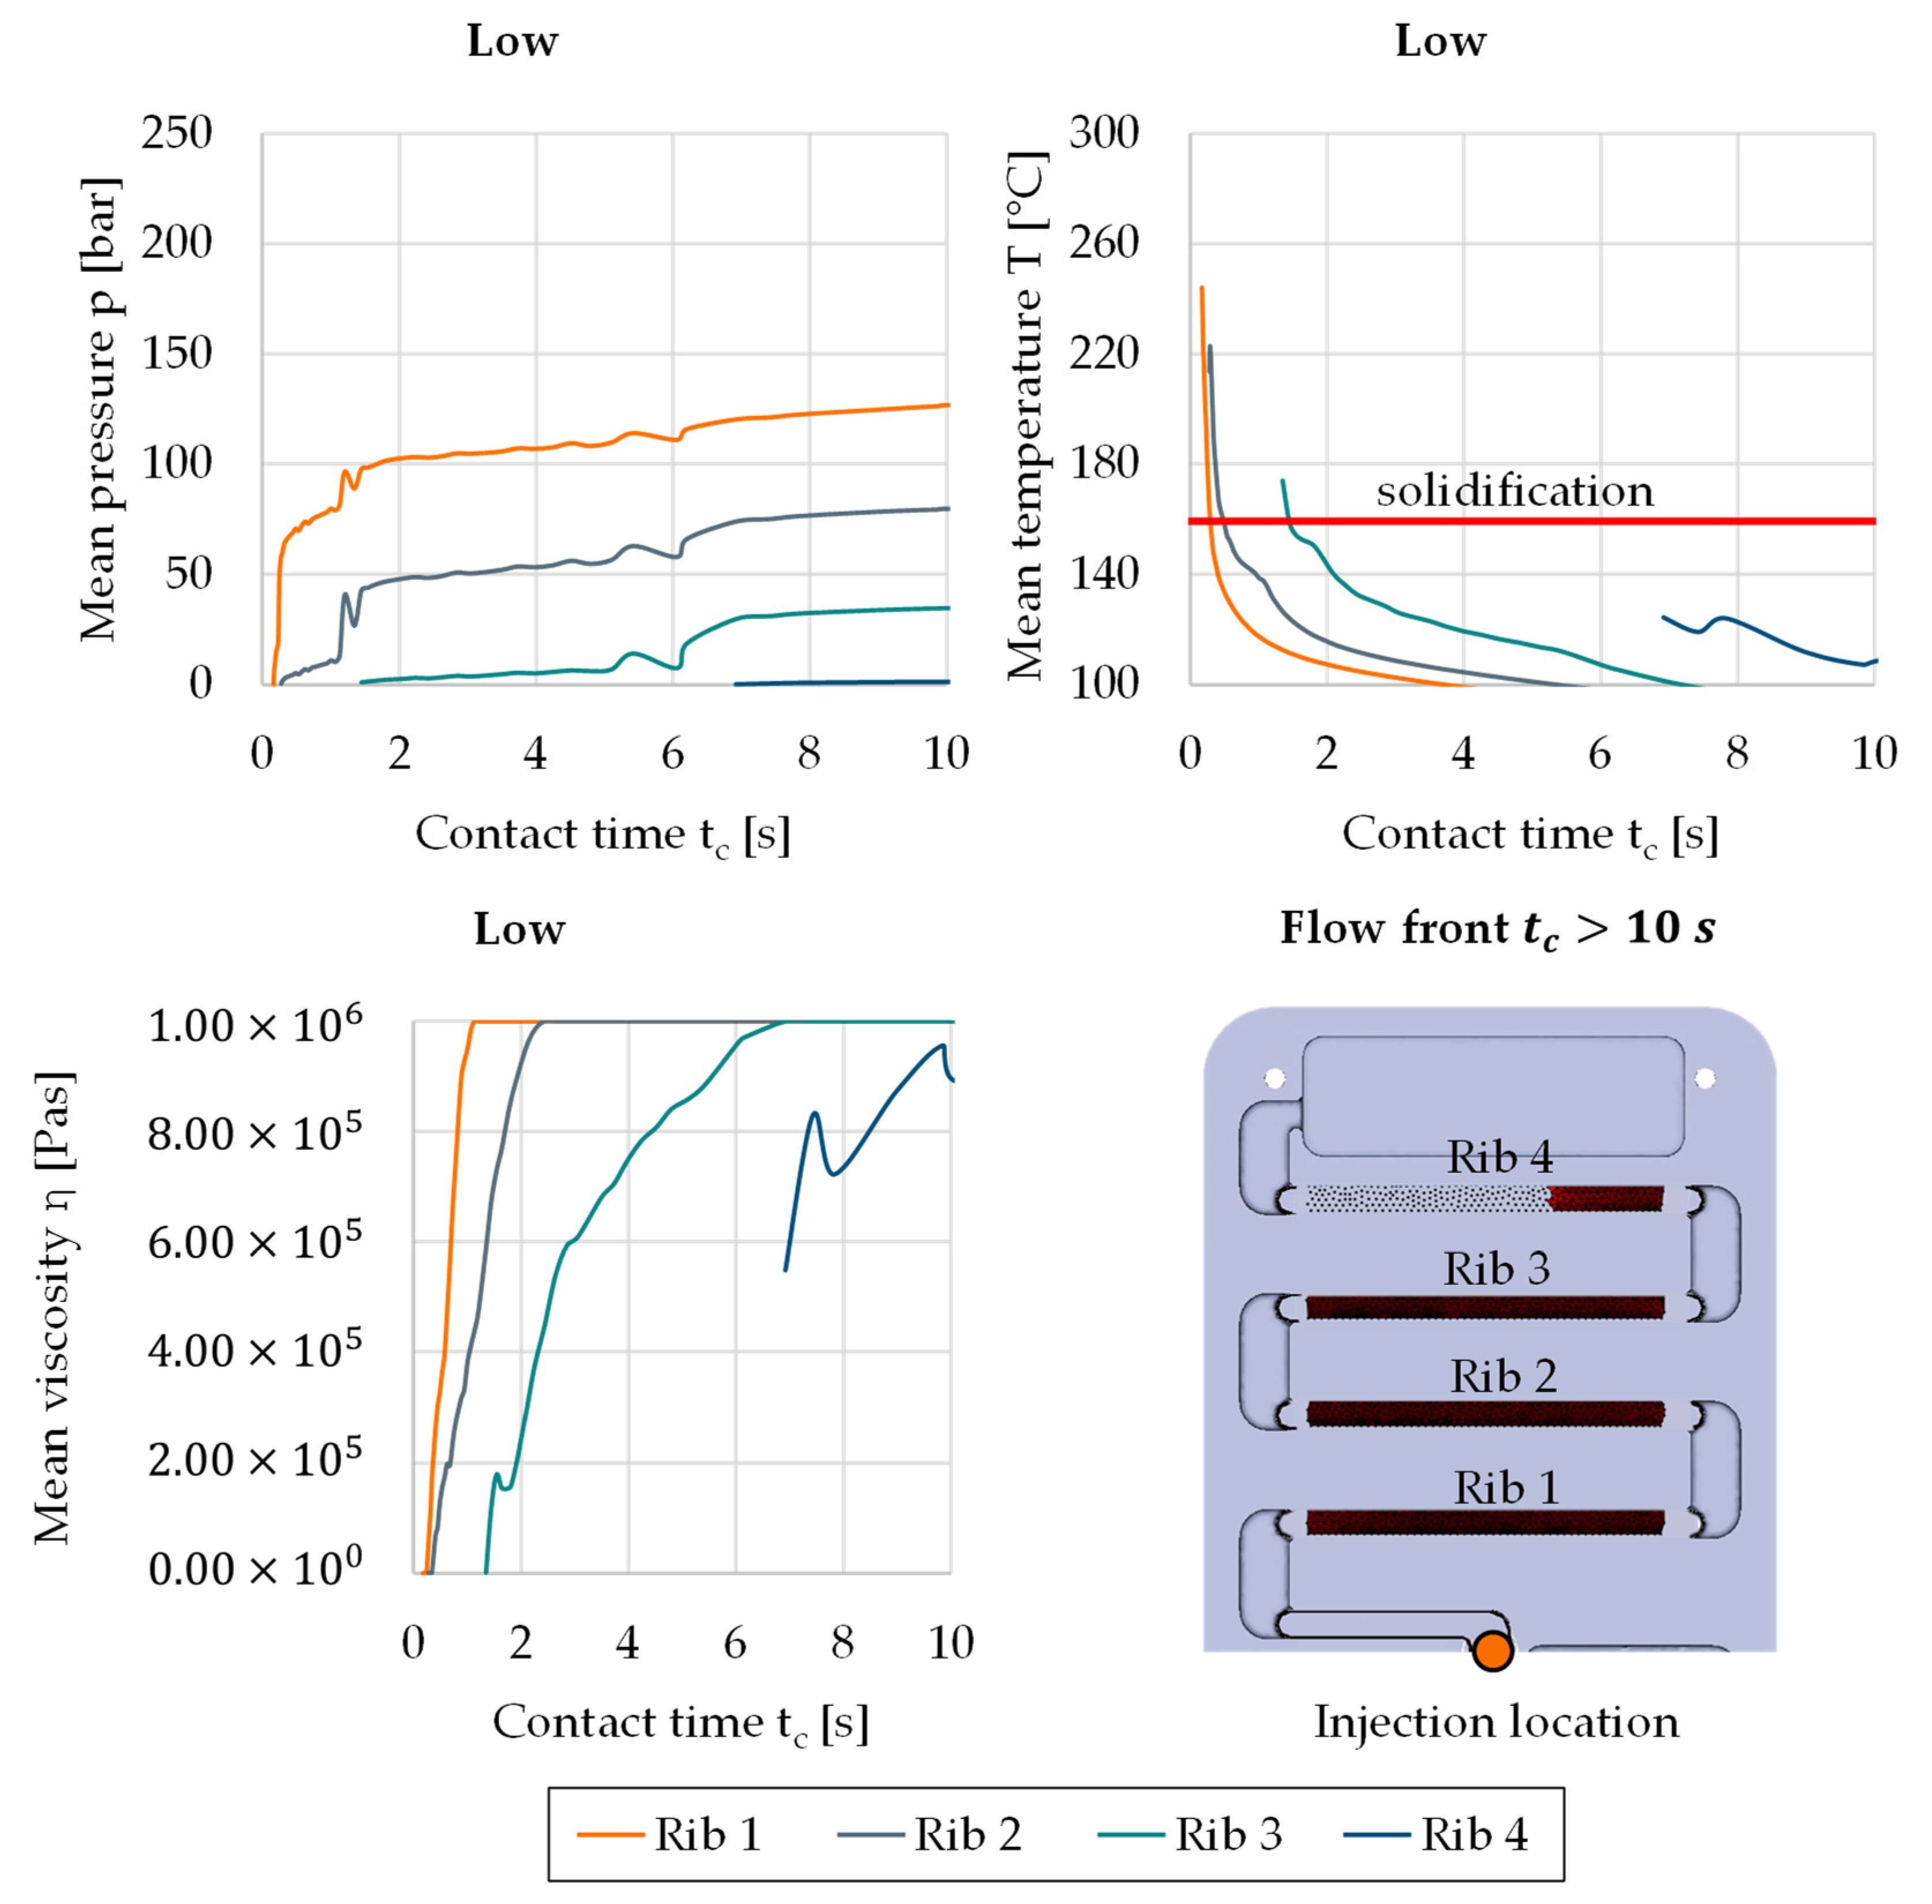
3.2.1. Simulation of Injection Moulding
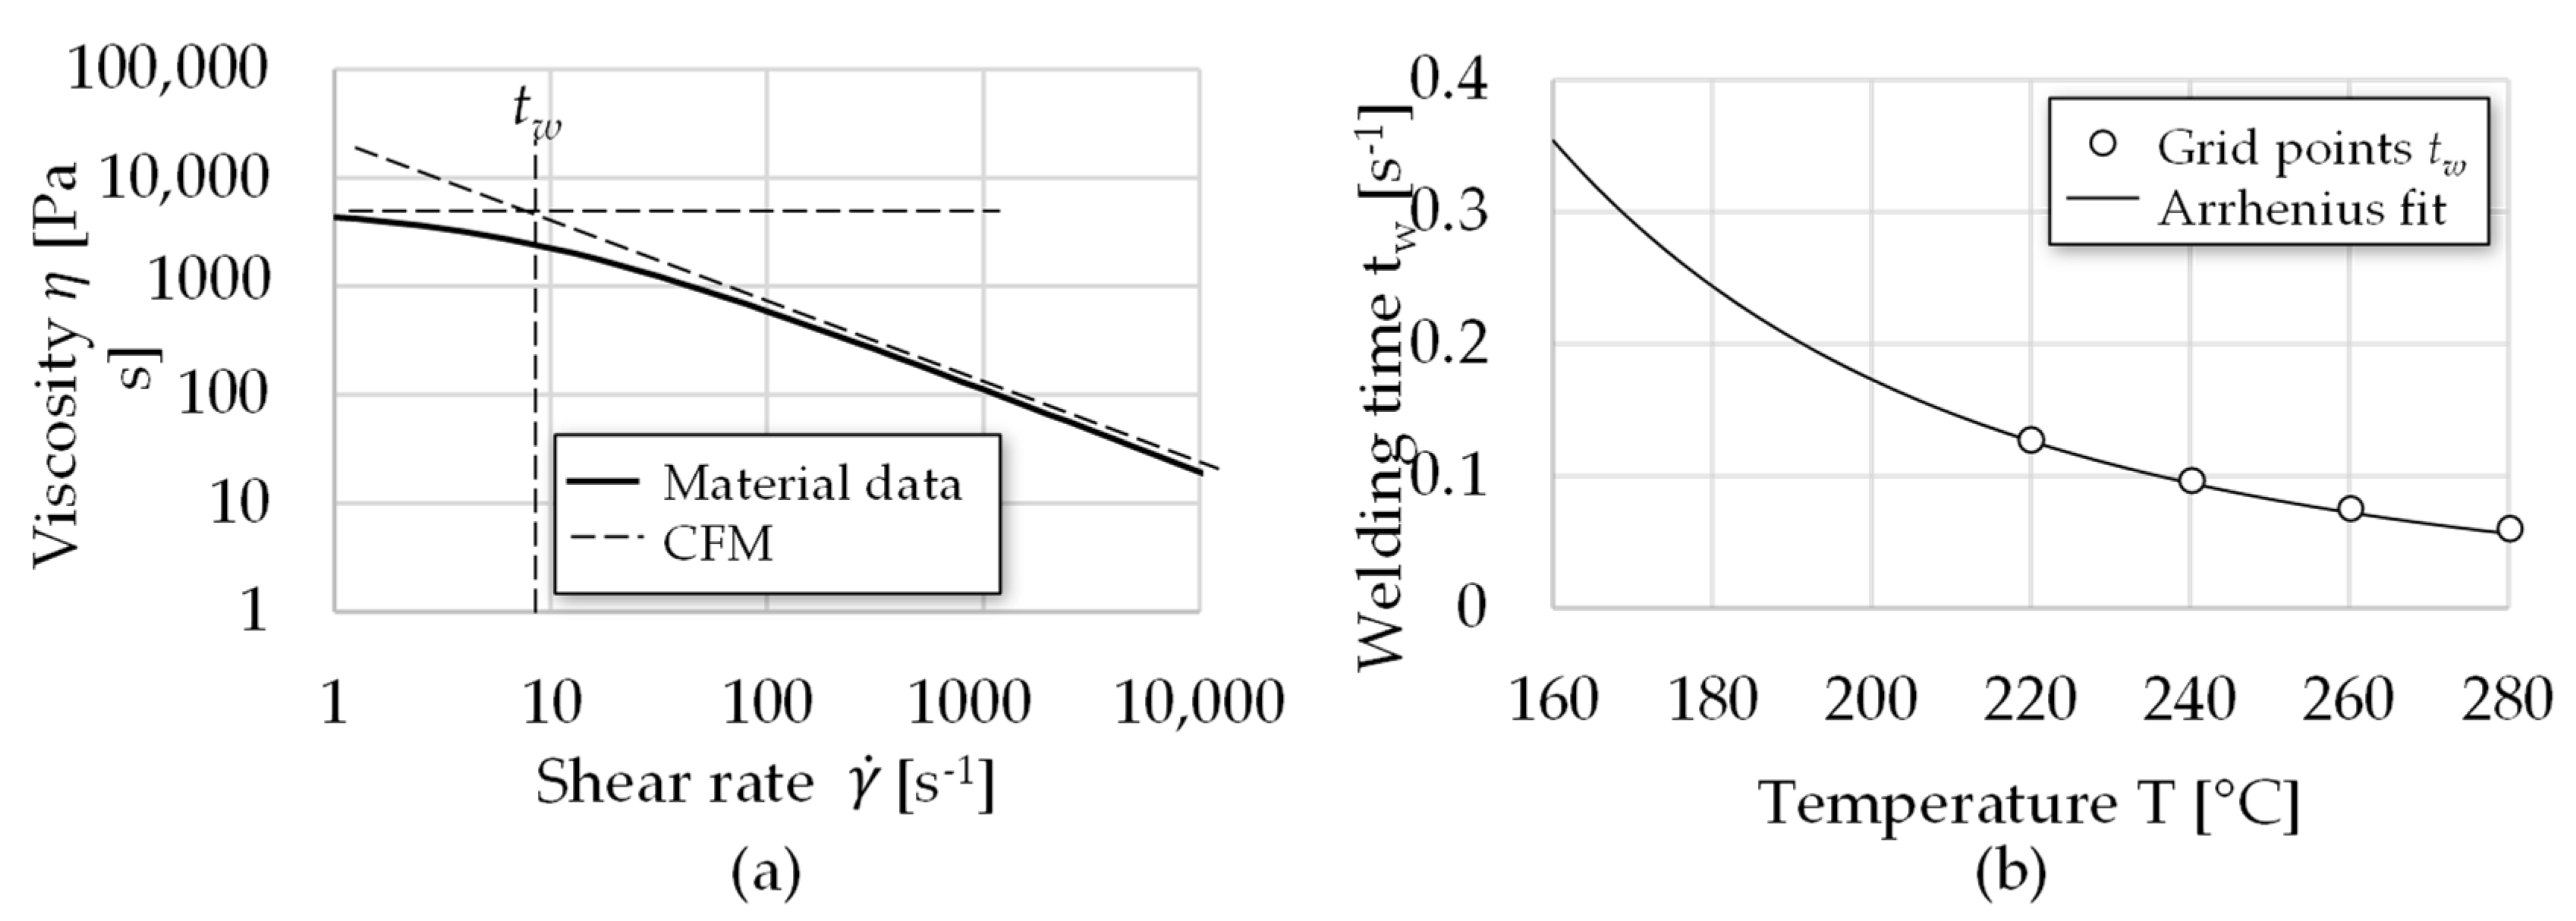
As a result of the FE-simulation, the process parameters pressure, temperature, and viscosity were recorded for each node in the interface as a function of time. The data will be used as input for the computation of the nodal bond strength according to Equation (10). In order to draw conclusions about the computed values of the following sections, the results of the injection moulding simulation are exemplarily shown in Figure 9. In particular, the mean values of all nodes that are located in the individual rib areas for the process parameter set “Low” are displayed. The results show that the mean temperatures at the interface of the ribs drop rapidly below the solidification temperature after the first contact of the melt with the cold organo sheet surface. Accordingly, the time for developing a bond is very limited. In the case of rib 3, it can be assumed that some nodes do not reach the melting temperature at all, as the mean value is only very slightly above the solidification line. The mean temperature of rib 4 is underneath the solidification line, which leads to the conclusion that the rib interface is not covered, or only slightly covered by the melt. Rapidly decreasing interface temperatures lead to a quick solidification of the melt. Therefore, the pressure, as well as the viscosity, are increasing. The input parameters of the other parameter sets are listed in Appendix A. Due to different thermal boundary conditions (cf. Table 1), there are deviations in the initial temperatures. Figure A1 (increase of melt temperature) shows the configuration “HiMelt” with similarly strong drops in the mean temperature curves compared to set “Low”. When increasing the initial temperature of the organo sheet, the temperature decreases more slowly. Thus, the contact time, in which the interface temperature is above the solidification temperature, extends from set “HiMelt” to set ”HiOrg”. For both sets, pressure and viscosity rise corresponding to the decrease in temperature. The influence of a higher initial organo sheet temperature leads to interface temperatures remaining above the solidification temperature for a long period, resulting in a low melt viscosity. With respect to the bond strength model (Equation (10)), it is evident that both the degree of autohesion and the degree of contact are facilitated by these interfacial conditions and therefore high bond strengths can be expected.

3.2.2. Autohesion

The autohesion process describes the thermoplastic fusion process based on the interdiffusion of the polymer chains. The degree of autohesion describes this process quantitatively. For the three parameter sets “Low”, “HiMelt”, and “HiOrg” (cf. Table 1), the degree of autohesion is determined based on the nodal parameters from the overmoulding simulation. Thus, conclusions can be drawn about how effectively the polymer melt diffuses into the organic sheet. By means of Equations (2) and (5) (cf. Section 2.4), it was possible to compute the degree of autohesion as a function of temperature and contact time for each node of the interface. As a result, the temporal course of the autohesion could be determined based on the simulation data for the parameter sets “Low”, “HiMelt”, and “HiOrg”. Figure 10 illustrates the mean degree of autohesion for each individual rib interface of the three process parameter sets. Depending on the different boundary conditions according to Table 1, very different characteristics of the degree of autohesion can be observed. Low process parameters (“Low”) show the smallest values of D au , which can be explained by the low organo sheet and melt temperatures in the process compared to the other sets. In rib 4 of set “Low”, no autohesion takes place because no temperature above the melt temperature (160 °C) was reached at any of the interface nodes.
When using a high melt temperature (“HiMelt”), an increase of the degree of autohesion, especially for the ribs 3 and 4, can be observed. The higher melt temperature benefits a fast filling of the cavity and causes the temperature in ribs 3 and 4 to remain at a high level for a relatively long time (Appendix A, Figure A1). The highest values of D au have been achieved within the parameter configuration with the highest organo sheet pre-heating temperature (“HiOrg”). Here, the difference between the organo sheet and melt temperature is the least and the interface temperature is about 2.5 s (rib 4) to 3.5 s (rib 1) above the solidification temperature (Appendix A, Figure A2), showing a longer time in which the autohesion process can take place. In general, high temperatures and long periods during which the interface temperature is above the solidification temperature lead to higher degrees of autohesion.

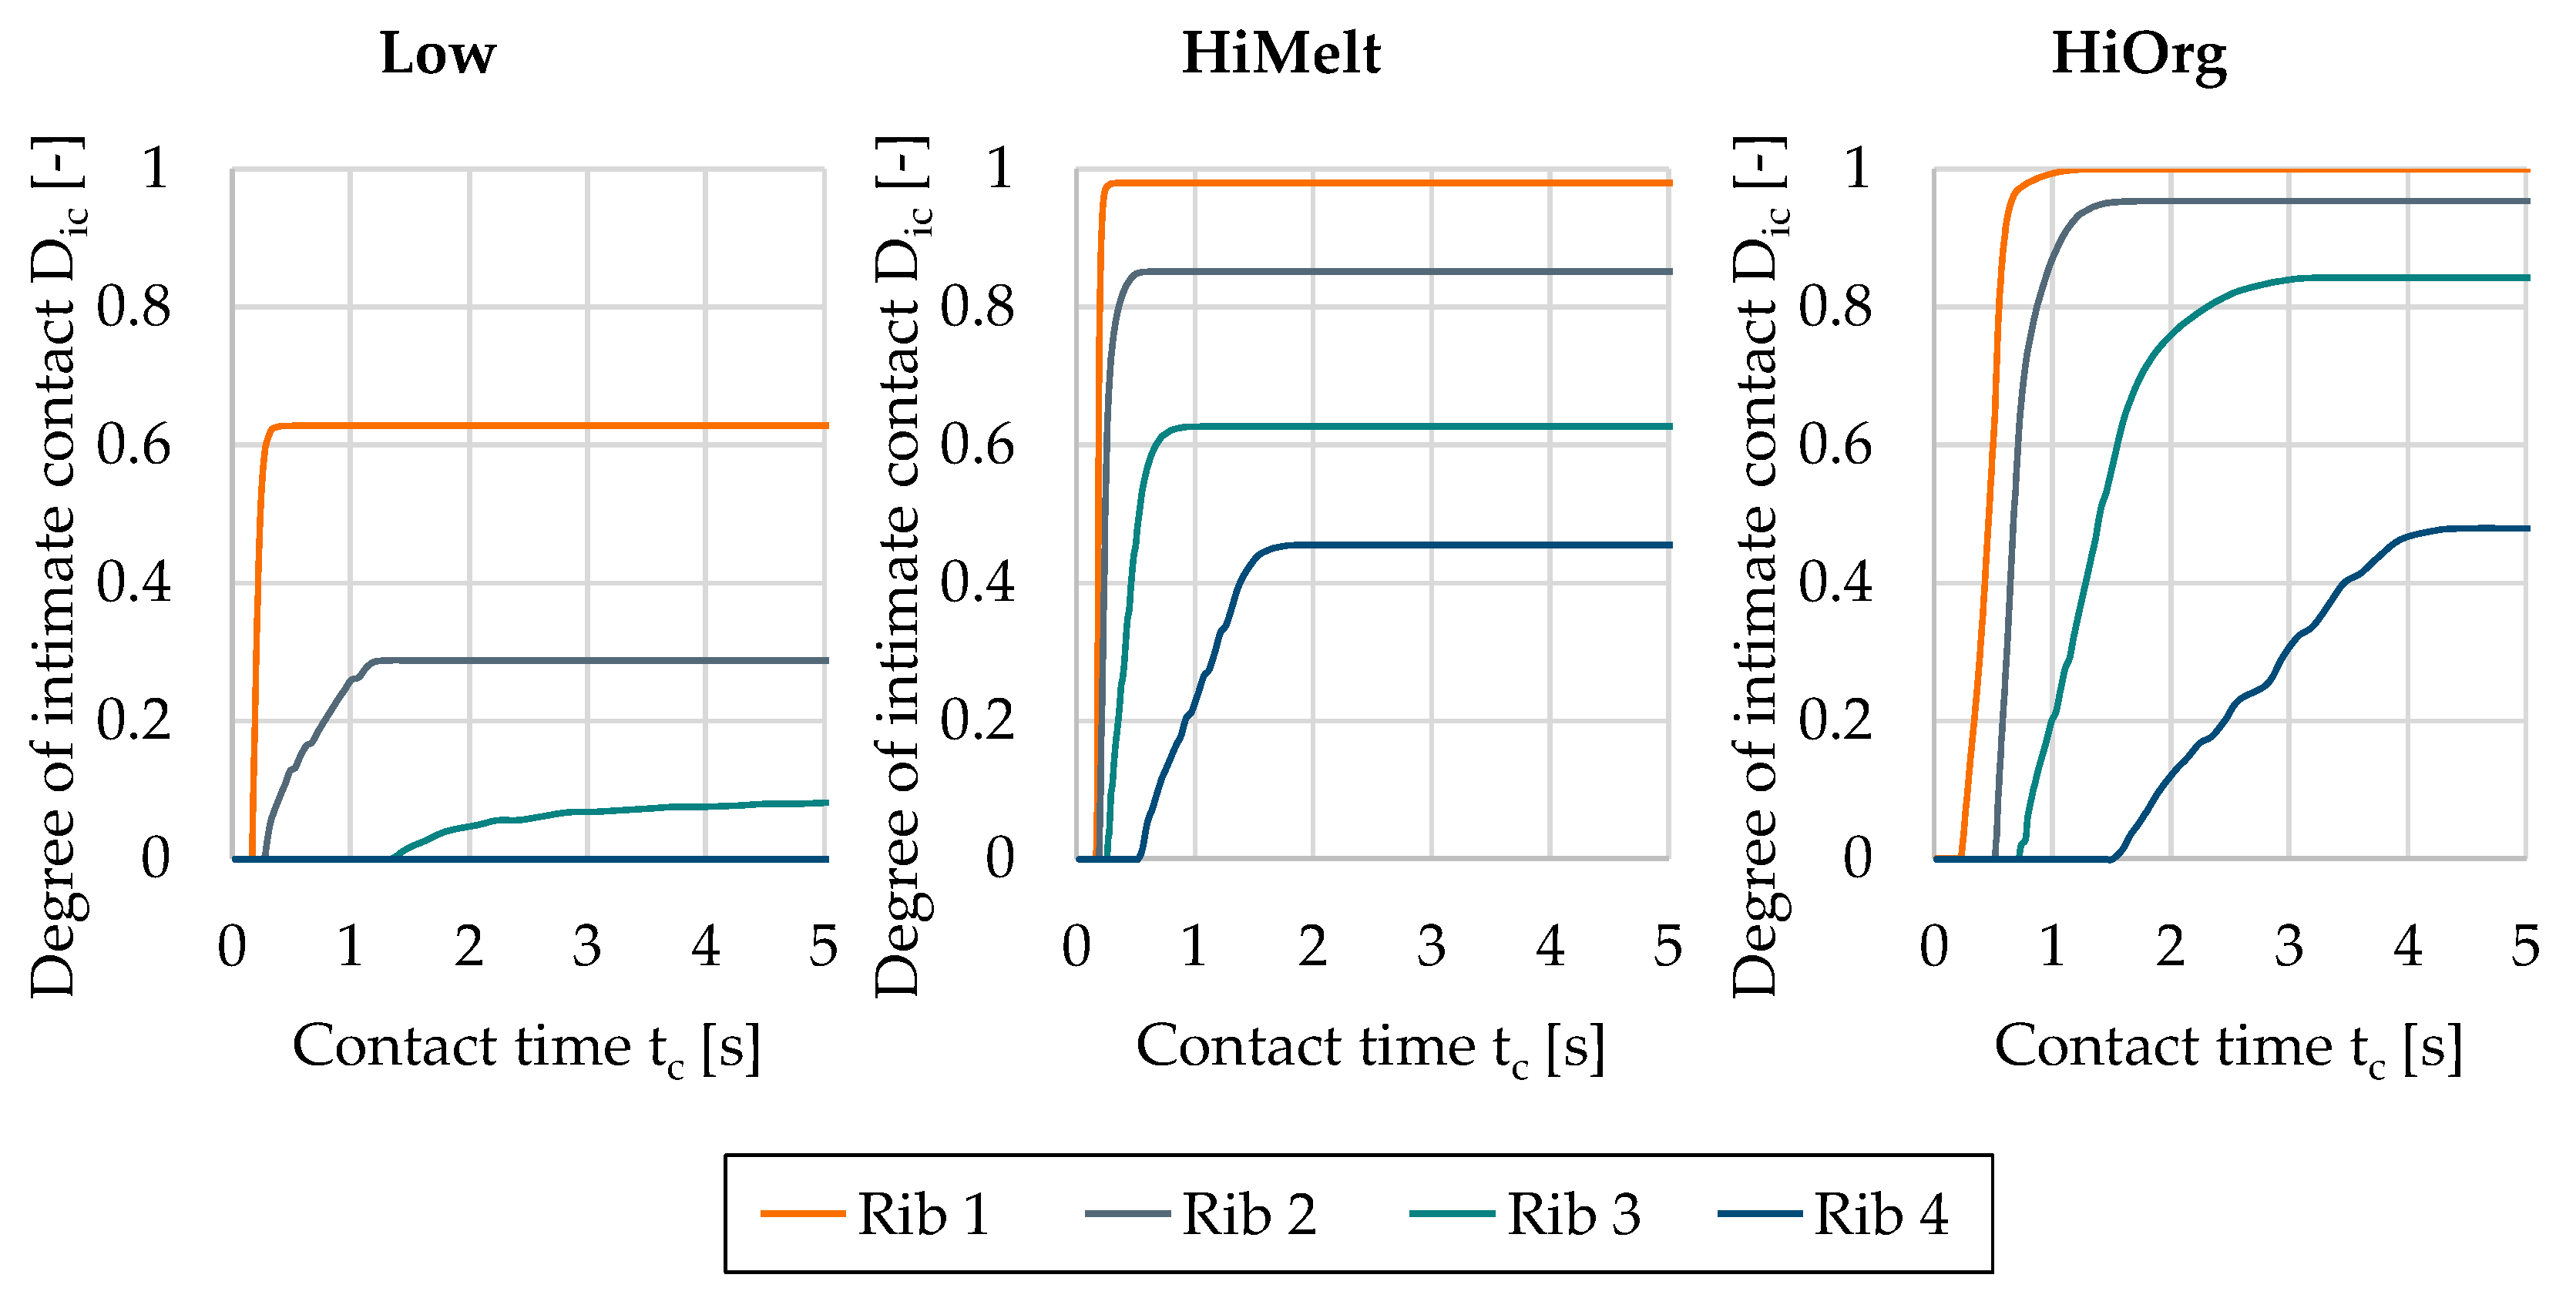
3.2.3. Intimate Contact

The degree of intimate contact, which is implemented as the second term in the bond strength model, describes the physical conditions at the interface. In detail, it accounts for the pressure of the melt applied locally in the interface relative to the viscosity. Accordingly, a high local pressure with a low viscosity facilitates the bonding of the polymers. In this section, the degree of intimate contact is determined for the three parameter sets “Low”, “HiMelt”, and “HiOrg” (cf. Table 1). The degree of contact is defined as a function of the geometry factor g, considering the local surface geometry according to the model (Figure 7). Due to the closed manufacturing process, an analysis of the local surface geometry just before the polymer melt overflows the organo sheet was not possible. Hence, a fitting geometry factor based on the experimental validation data is pursued. The purpose is to define a geometry factor that shows a minimum deviation between the experimental and numerical bond strength for all test series, considering statistical uncertainties of the surface geometry. This should enable the prediction of a bond strength based only on the interface parameters from the FE simulation.
As part of the computation of the degree of intimate contact D ic , a sensitivity study was carried out to quantify the influence of the variation of the geometry factor g on the different parameter sets (cf. Table 1). For this purpose, the geometry factor was varied between 0.15 g 0.2 with a step size of g = 0.01 . Previous investigations have shown that geometry factors outside this interval lead to high deviations between computation and experiment. For each geometry factor, both the degree of intimate contact and the resulting bond strength of all experimental parameter sets (cf. Table 1) were computed. Afterwards, the numerical bond strengths were compared with the experimental values. The influence is to be shown exemplarily at rib 1 and 2 of the lowest process parameter set (“Low”) in Figure 11.
The degree of intimate contact is proportionally increasing with the geometry factor g . Even a small change in the geometry factor leads to a significant change of the D ic . Thus, a difference of D ic = 0.19 is shown in the range of the maximum value of g = 0.2 and minimum value of g = 0.15 for rib 1. The level of the curve is changing at equal distances. The same behaviour can be observed with rib 2. However, the influence of the change of g is less than for the first rib due to generally lower values. With the different degrees of intimate contact, the numerical bond strengths for all test series (cf. Table 1) were computed according to Section 2.4 and compared with the experimental results. An illustrative comparison as well as a general overview of the deviation in percent between all experimental and numerical results is shown in Figure 12. The aim is to determine an optimum geometry factor g that provides the best results for all parameter sets.
The parameter set “HiMelt” illustrates that even small changes in the geometry factor g decide if the numerically predicted bond strength is within the deviation of the experimental results. For example, the bond strength of rib 1 is slightly overestimated with a value of g = 0.2 . For rib 4, on the other hand, the values g = 0.16 and g = 0.15 lead to an underestimation of the bond strength. The deviation was subsequently evaluated for each parameter set and each rib and is summarised as a percentage in the box chart (Figure 12 right). The total number of samples shows a variance between the experiment and the model. The red crosses indicate the median values of each box plot. In summary, the results of the model with a geometry factor of g = 0.17 correspond the best with the entire test series. Therefore, all further results of the study refer only to this calibrated geometry factor. Figure 13 shows the final degrees of intimate contact for the three parameter sets “Low”, “HiMelt”, and “HiOrg” (cf. Table 1).
Depending on the flow path, the degree of intimate contact decreases with increasing distance of the rib from the injection location. As the flow path increases, the pressure supply from the injection location decreases. For set “Low”, the melt cools down before it covers the fourth rib, resulting in D ic = 0 . By increasing the melt temperature (“HiMelt”), the intimate contact is promoted, because a complete covering of all rib interfaces was possible. Especially for the areas close to the injection location (interface rib 1), the intimate contact develops almost instantly. This can be attributed to the high flow front temperature right after the injection phase begins. The high temperatures and corresponding low viscosities enable the quick formation of intimate contact up to 100% ( D ic = 1 ) for sets “HiMelt” and “HiOrg”. The rib interfaces with a larger distance to the injection location exhibit a lower pressure, which has a negative effect on the degree of contact (cf. Equation (6)). In addition, the flow usually cools down with an increasing flow path, which leads to a higher melt viscosity and thus inhibits the development of intimate contact.

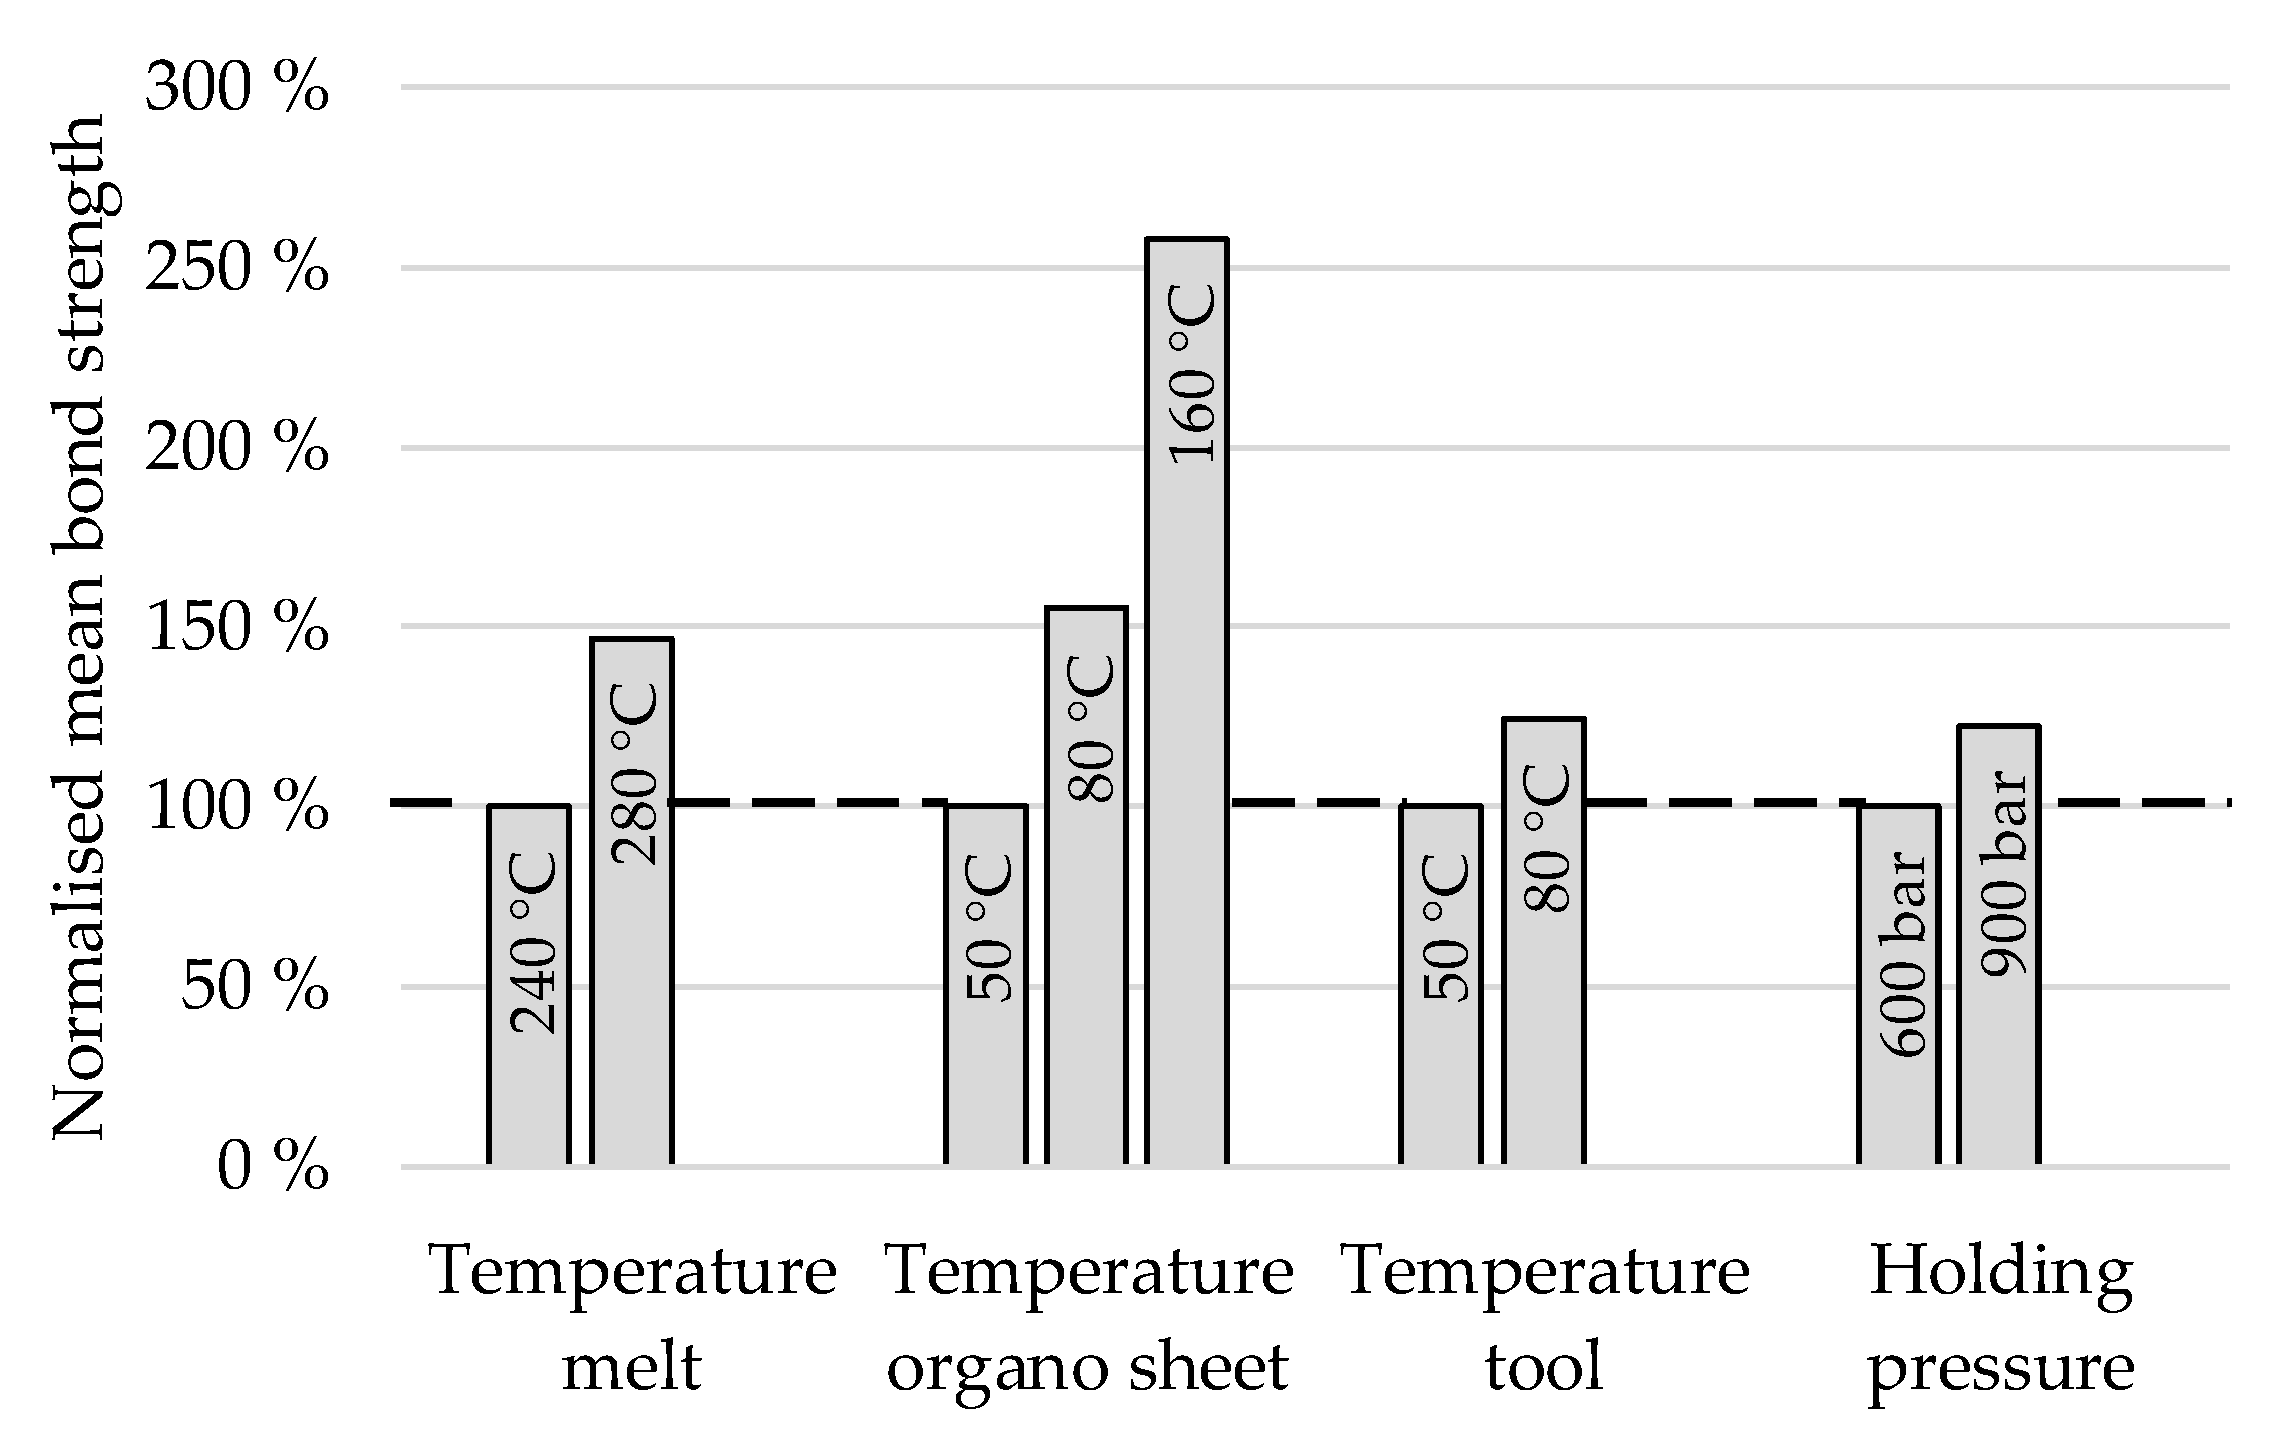
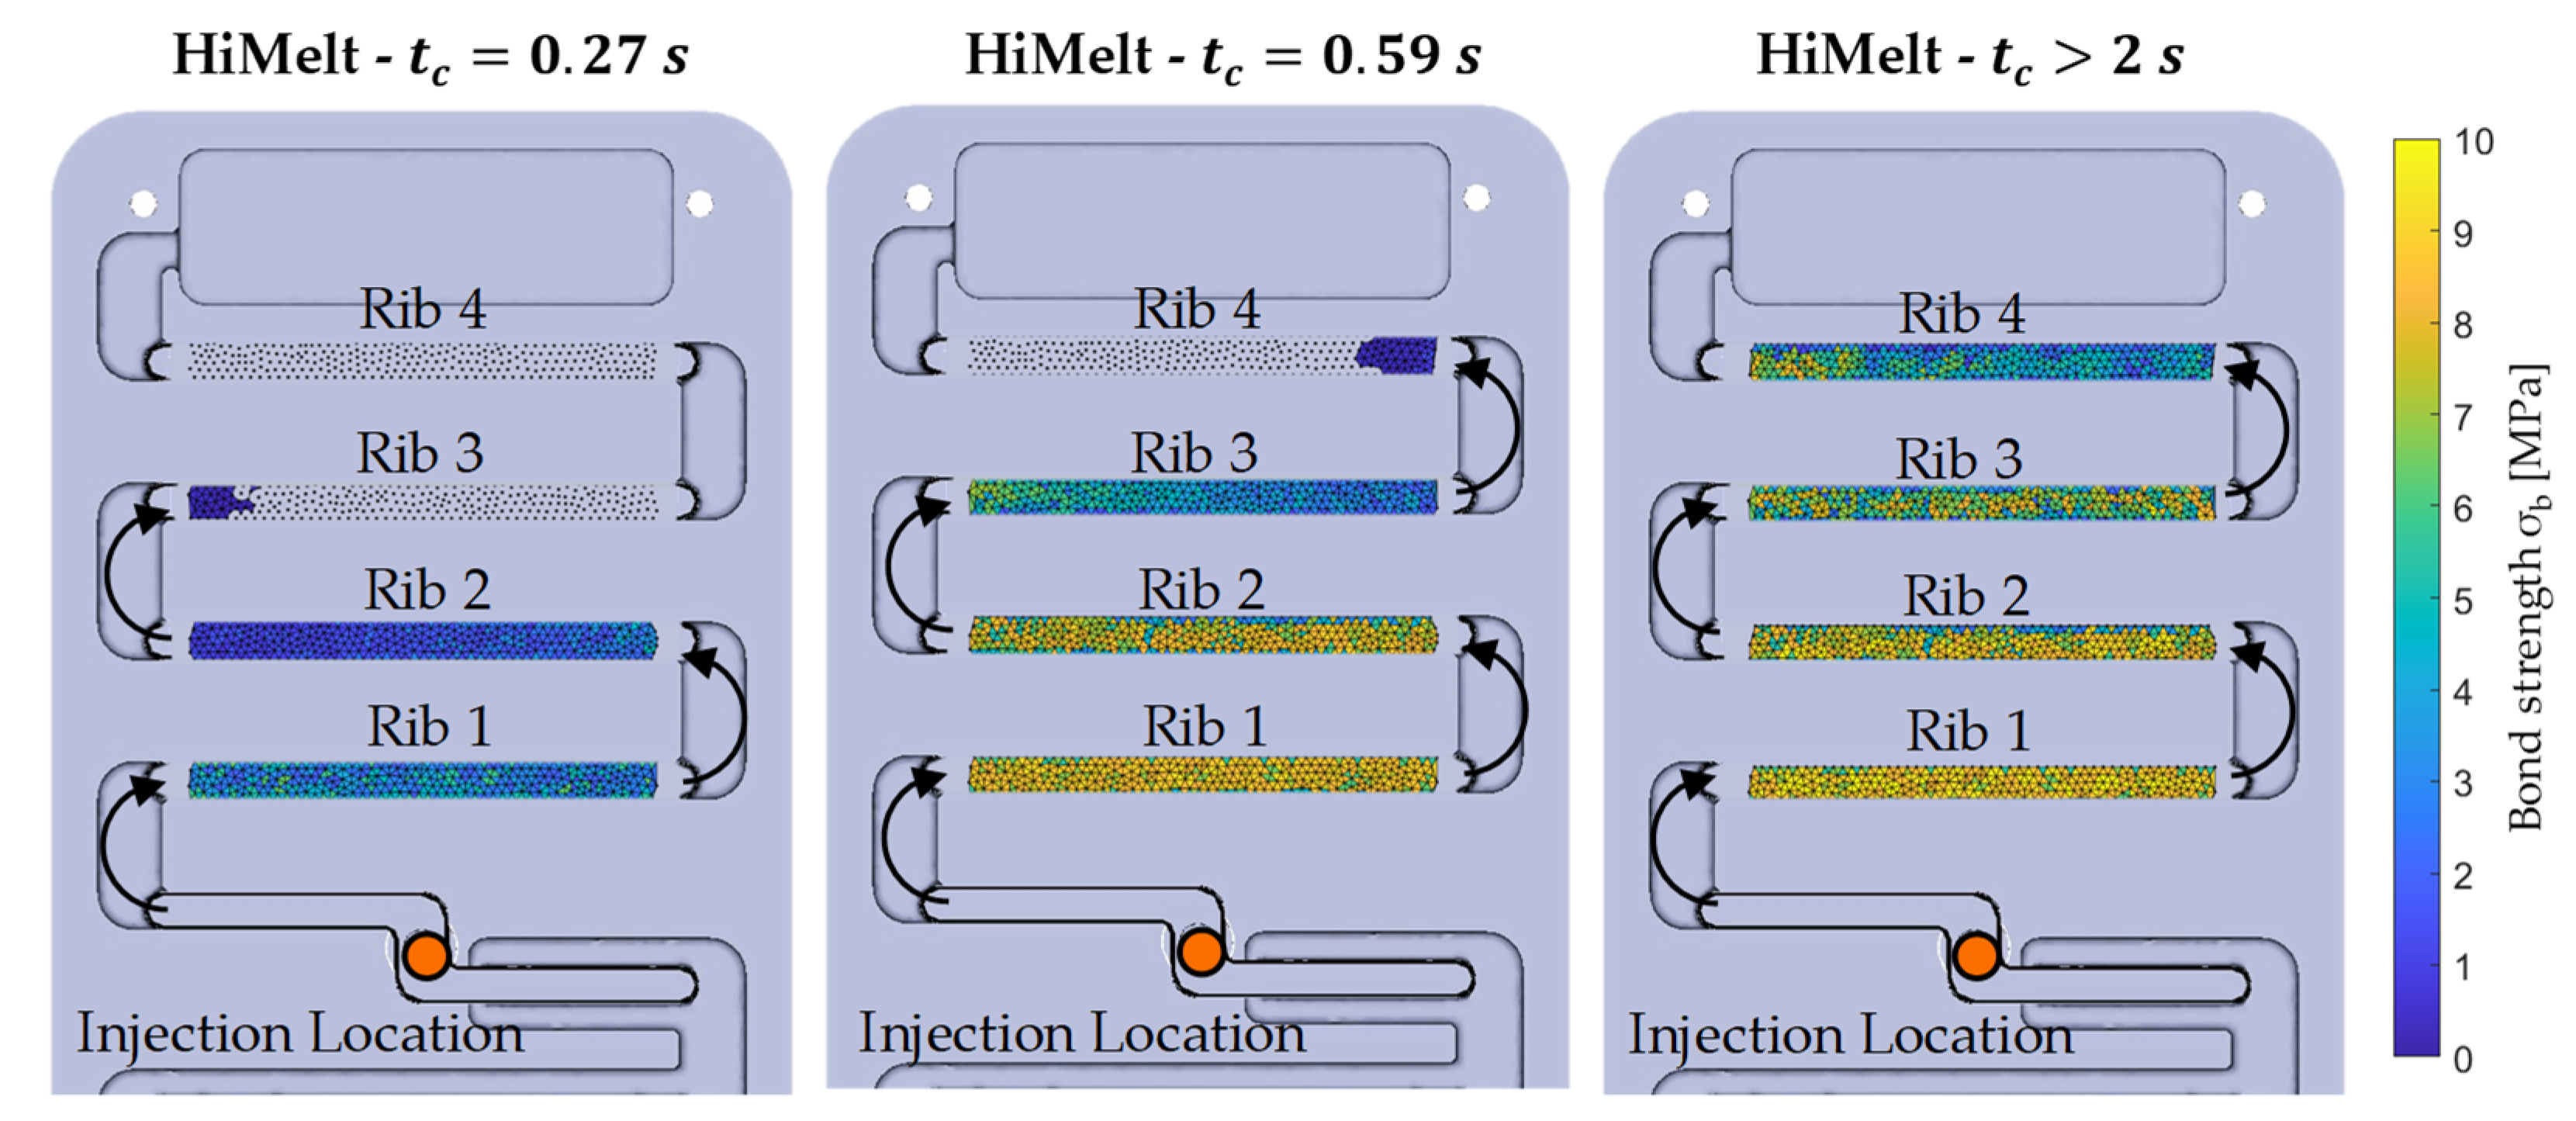
3.2.4. Bond Strength

By using the results from the previous sections, the bond strength can be determined. Based on Equation (10), the final bond strengths were computed for each node of the FE-mesh in the interface. The mean bond strengths of the individual parameter sets are shown in Figure 14.
The previously analysed correlations of the degrees of autohesion and intimate contact are reflected in the resulting bond strength. Consequently, the bond strength rises with increasing contact time above the solidification temperature. Depending on the contact time, there is a longer time for autohesion, resulting in a stronger bond. Higher process temperatures lead to higher bond strengths. In particular, a higher organo sheet temperature (“HiOrg”) has a greater effect on the bond strength than a higher melt temperature (“HiMelt”). In addition, the contact time dominates mean temperature. With a high melt temperature (“HiMelt”), the higher initial mean temperature drops faster below the solidification temperature. Hence, in this case, a lower bond strength is developed. Due to a higher organo sheet temperature (“HiOrg”), the mean temperature remains above the solidification temperature for a longer contact time, so that the maximum bond strength increases. Figure 15 shows an example of the process progress for a high melt temperature (“HiMelt”) at different contact times.
Matlab was used for the post-processing and visualisation of bond strength values. The bond strengths are calculated for each node of the FE-mesh at each time step of the simulation. By means of Delaunay triangulation algorithm, a mesh is generated and the nodal values are averaged over the element. It is found that with increasing contact time, a higher bond strength is developed. On the other hand, the bond strength decreases depending on the flow path due to cooling of the interface. With the help of the visualisation, the developing bond at the interface can be analysed. Thus, unsuitable process parameter settings can be avoided and settings can be optimised in an early phase of the process design. In addition, the experimental effort within the product and process development can be decreased. In Figure 16, the maximum experimental and numerical bond strengths are compared. Furthermore, the states at the end of the injection moulding process are visualised, from which the global bond strength is computed.
Overall, the results of the experiment and model are in a good agreement. The best prediction was achieved with parameter set “HiMelt”. The trend of reducing bond strength with increasing flow path is correctly reproduced and even the case of no bond (set “Low”-rib 4) can be predicted. Due to the large number of variables of the bond strength model, deviations of computed and measured bond strength values can be observed, for example, at low process temperatures (“Low”)-rib 2. For high organo sheet temperatures “HiOrg”, the differences between experiment and model are the greatest. As a result, the bond strength of ribs 1 to 3 is overestimated. However, the decreasing trend in the maximum bond strength matches very well. The misinterpretation can be related to incorrect input data from the FE-simulation, since these are conducted under ideal thermal boundary conditions. A high potential to improve the proposed modelling approach is given by the geometry factor g . In this study, g was assumed as a constant value for all test series. Furthermore, it can be determined that heating the organo sheet from 50 °C (”Low”) to 160 °C (”HiOrg”) develops a stronger bond strength than heating the melt from 240 °C (”Low”) to 280 °C (”HiMelt”). In terms of energy efficiency, only the heat source of the organo sheet needs to be optimised because it has the biggest influence on the interface temperature.

4. Conclusions

Within the scope of the study, a model for the computation of the bond strength in overmoulded thermoplastic composites, based on FE simulations, was developed. Therefore, a consolidation model for thermoplastic composites [20,21] was adapted and applied for the use case of overmoulded composites. This novel modelling approach takes into account both, the chemical autohesion processes as well as the physical contact conditions at the interface.
To validate the computed bond strength values, cross-tension specimen, consisting of a thermoplastic organo sheet and overmoulded ribs based on polypropylene, were produced and the local apparent bond strength was determined by means of cross-tension tests. It was found that the experimental results corresponded to the hypotheses on the influence of the process parameters on the bond strengths. The same trends could be predicted by process simulation. By adjusting the geometry factor g to a constant value of 0.17 , a good consensus could be achieved between the experimentally determined and model based calculated bond strength values within a deviation range of <10%. As a conclusion, a sufficiently high interfacial temperature over a long time leads to the highest bond strength values of approximately 11 MPa. The preheating temperature of the organo sheet was identified as the most relevant parameter, leading to a potential increase in bond strength by a factor of 2.5 .
In order to improve the modelling accuracy, analyses of the surface topography should be carried out directly before overmoulding in order to obtain a more precise definition of the geometric factors, which depend on the material configuration and the process control. Especially if the thermoplastic organo sheet is deformed in a thermoforming process prior to injection moulding, the local configuration of the material with respect to fibre and matrix distribution can vary significantly, leading to different local contact conditions at the interface compared to a non-deformed organo sheet. Here, further investigations will be carried out analysing the influence on the resulting bond strength in the overmoulded thermoplastic composite.
With the presented modelling approach, this study provides a resource-efficient solution, which allows for a virtual prediction of the bond strength, with only small experimental effort in material characterisation, if this data is not provided by common databases. Thus, the part and process design of overmoulded thermoplastic composites can be significantly improved by identifying suitable manufacturing parameter ranges aiming for a sufficiently high bond strength.

Author Contributions

Conceptualization, A.H. and R.L.; methodology, A.H., T.O. and R.L.; validation, T.O. and R.L.; formal analysis, R.L.; experimental investigation, T.O.; writing—original draft preparation, T.O. and R.L.; writing—review and editing, K.D., B.-A.B., K.B., A.H. and H.W.; visualization, T.O. and R.L.; supervision, K.D., B.-A.B. and K.B.; project administration, K.D., B.-A.B., A.H. and H.W.; funding acquisition, K.D., B.-A.B., A.H. and R.L. All authors have read and agreed to the published version of the manuscript.

Funding

The IGF-Project “Integrated process simulation of thermoforming and injection moulding” of the European Research Association for Sheet Metal Working (EFB e.V.) was funded by the Federal Ministry of Economics and Energy (BMWi) under the funding number 20524N of the German Federation of Industrial Research Associations (AiF) on the basis of a decision by the German Bundestag. The authors are thankful for this financial support.

Institutional Review Board Statement

Not applicable.

Data Availability Statement

Not applicable.

Conflicts of Interest

The authors declare no conflict of interest.

Appendix A

Figure A1. Results of the injection moulding simulation by means of process parameter set “HiMelt” for individual ribs of the cross-tension test specimen and final flow front after the overmoulding process.
Jcs 05 00164 g0a1
Figure A2. Results of the injection moulding simulation by means of process parameter set “HiOrg” for individual ribs of the cross-tension test specimen and final flow front after the overmoulding process.
Jcs 05 00164 g0a2

References

  1. Verein Deutscher Ingenieure e.V. Werkstoffinnovationen für Nachhaltige Mobilität und Energieversorgung; Verein Deutscher Ingenieure: Düsseldorf, Germany, 2014. [Google Scholar]
  2. Siebenpfeiffer, W. Leichtbau-Technologien im Automobilbau. Werkstoffe-Fertigung-Konzepte; Springer (ATZ/MTZ-Fachbuch): Wiesbaden, Germany, 2014. [Google Scholar] [CrossRef]
  3. Gude, M.; Just, G.; Kaufhold, J.; Müller, M.; Stegelmann, M.; Meschut, G.; Gerkens, M.; Zäh, M.F.; Hofmann, D.; Greitemann, J.; et al. Chancen und Herausforderungen im Ressourceneffizienten Leichtbau für Die Elektromobilität. Forelstudie; Institut für Leichtbau und Kunststofftechnik (ILK) Technische Universität Dresden: Dresden, Germany, 2015; Available online: http://edok01.tib.uni-hannover.de/edoks/e01fb17/883204193.pdf (accessed on 7 May 2021).
  4. Akkerman, R.; Bouwman, M.; Wijskamp, S. Analysis of the Thermoplastic Composite Overmolding Process: Interface Strength. Front. Mater. 2020, 7. [Google Scholar] [CrossRef]
  5. Valverde, M.A.; Kupfer, R.; Wollmann, T.; Kawashita, L.F.; Gude, M.; Hallett, S.R. Influence of component design on features and properties in thermoplastic overmoulded composites. Compos. Part A Appl. Sci. Manuf. 2020, 132, 105823. [Google Scholar] [CrossRef]
  6. Geiger, M.; Ehrenstein, G.W. Werkstoff- und Prozessoptimierte Herstellung Flächiger Kunststoff-Kunststoff und Kunststoff-Metall-Verbundbauteile. Robuste, Verkürzte Prozessketten für Flächige Leichtbauteile; Lehrstuhl für Kunststofftechnik und Lehrstuhl für Mustererkennung; Meisenbach: Bamberg, Germany, 2003. [Google Scholar]
  7. Schijve, W.; Francato, G. New thermoplastic composite solutions for automotive lightweighting. JEC Compos. Mag. 2016, 103, 96–98. [Google Scholar]
  8. Behrens, B.A.; Bohne, F.; Lorenz, R.; Arndt, H.; Hübner, S.; Micke-Camuz, M. Numerical and Experimental Investigation of GMT Compression Molding and Fiber Displacement of UD-Tape Inserts. Procedia Manuf. 2020, 47, 11–16. [Google Scholar] [CrossRef]
  9. Behrens, B.A.; Raatz, A.; Hübner, S.; Bonk, C.; Bohne, F.; Bruns, C.; Micke-Camuz, M. Automated Stamp Forming of Continuous Fiber Reinforced Thermoplastics for Complex Shell Geometries. Procedia CIRP 2017, 66, 113–118. [Google Scholar] [CrossRef] [Green Version]
  10. Hopmann, C.; Michaeli, W. Einführung in die Kunststoffverarbeitung; 7. Aufl. s.l.; Carl Hanser Fachbuchverlag: München, Germany, 2015. [Google Scholar]
  11. Behrens, B.A.; Hübner, S.; Chugreev, A.; Neumann, A.; Grbic, N.; Schulze, H.; Lorenz, R.; Micke, M.; Bohne, F. Development and numerical validation of combined forming processes for production of hybrid parts. In Technologies for Economical and Functional Lightweight Design; Dröder, K., Vietor, T., Eds.; Springer Vieweg: Berlin, Germany, 2018. [Google Scholar]
  12. Bonefeld, D.; Giehl, S.; Haspel, J.; Jäschke, A.; Lahr, R.; Obermann, C.; Schmeer, S.; Schmuck, M.; Würtele, M. Kombination von Thermoplast-Spritzguss und Thermoformen kontinuierlich faserverstärkter Thermoplaste für Crashelemente (SpriForm). In BMBF-Forschungsbericht; Bundesministerium für Bildung und Forschung (BMBF): Berlin, Germany, 2011. [Google Scholar]
  13. Ye, L.; Ageorges, C. Engineering Materials and Processes. In Fusion Bonding of Polymer Composites; Springer Ltd.: London, UK, 2002. [Google Scholar]
  14. Hummel, S.; Knorr, L.; Karlinger, P.; Schemme, M. Eine Frage der Haftung. In Kunststoffe; Carl Hanser Verlag GmbH & Co. KG: München, Germany, 2017. [Google Scholar]
  15. Al-Sheyyab, A.; Müller, T.; Kühnert, I.; Schmachtenberg, E. Kurzer Prozess bei hybriden Strukturen. In Kunststoffe; Carl Hanser Verlag GmbH & Co. KG: München, Germany, 2007. [Google Scholar]
  16. Liebsch, A.; Koshukow, W.; Gebauer, J.; Kupfer, R.; Gude, M. Overmoulding of consolidated fibre-reinforced thermoplastics-increasing the bonding strength by physical surface pre-treatments. Procedia CIRP 2019, 85, 212–217. [Google Scholar] [CrossRef]
  17. Hürkamp, A.; Gellrich, S.; Ossowski, T.; Beuscher, J.; Thiede, S.; Herrmann, C.; Dröder, K. Combining Simulation and Machine Learning as Digital Twin for the Manufacturing of Overmolded Thermoplastic Composites. JMMP 2020, 4, 92. [Google Scholar] [CrossRef]
  18. Giusti, R.; Lucchetta, G. Analysis of the welding strength in hybrid polypropylene composites as a function of the forming and overmolding parameters. Polym. Eng. Sci. 2018, 58, 592–600. [Google Scholar] [CrossRef]
  19. Beuscher, J.P.; Schnurr, R.; Gabriel, F.; Kühn, M.; Dröder, K. Mould-integrated heating technology for efficient and appropriate processing of fibre-reinforced thermoplastics. Procedia CIRP 2019, 85, 133–140. [Google Scholar] [CrossRef]
  20. Loos, A.C.; Dara, P.H. Processing of Thermoplastic Matrix Composites. In Review of Progress in Quantitative Nondestructive Evaluation; Thompson, D.O., Chimenti, D.E., Eds.; Review of Progress in Quantitative Nondestructive Evaluation; Springer: Boston, MA, USA, 1987; pp. 1257–1265. [Google Scholar]
  21. Lee, W.I.; Springer, G.S. A Model of the Manufacturing Process of Thermoplastic Matrix Composites. J. Compos. Mater. 1987, 21, 1017–1055. [Google Scholar] [CrossRef]
  22. Mantell, S.C.; Springer, G.S. Manufacturing Process Models for Thermoplastic Composites. J. Compos. Mater. 1992, 26, 2348–2377. [Google Scholar] [CrossRef]
  23. Loos, A.C.; Li, M.C. Non-Isothermal Autohesion Model for Amorphous Thermoplastic Composites. J. Thermoplast. Compos. Mater. 1994, 7, 280–310. [Google Scholar] [CrossRef]
  24. Chao, M.; Gillespie, J.W., Jr. The Influence of Healing and Bondline Thickness on the Mechanical Performance of Fusion-Bonded Thermoplastic Composite Joints. Mov. Forw. 50 Years Leadersh. Adv. Mater. 1994, 39, 2023–2037. [Google Scholar]
  25. Shi, H.; Villegas, I.F.; Bersee, H.E.N. Modelling of heat transfer and consolidation for thermoplastic composites resistance welding. In Proceedings of the 18th International Conference on Composites Materials, Jeju, Korea, 21–26 August 2011. [Google Scholar]
  26. Großmann, J. Einfluß von Plasmabehandlungen auf die Haftfestigkeit vakuumtechnisch hergestellter Polymer-Metall-Verbunde. Ph.D. Thesis, Friedrich-Alexander-Universität Erlangen-Nürnberg, Erlangen, Germany, 2009. [Google Scholar]
  27. Wool, R.P.; O’Connor, K.M. A theory crack healing in polymers. J. Appl. Phys. 1981, 52, 5953–5963. [Google Scholar] [CrossRef]
  28. Wool, R.P.; O’Connor, K.M. Time dependence of crack healing. J. Polym. Sci. B Polym. Lett. Ed. 1982, 20, 7–16. [Google Scholar] [CrossRef]
  29. Khan, M.A.; Mitschang, P.; Schledjewski, R. Identification of some optimal parameters to achieve higher laminate quality through tape placement process. Adv. Polym. Technol. 2010, 29, 98–111. [Google Scholar] [CrossRef]
  30. Tierney, J.; Gillespie, J.W., Jr. Modeling of In Situ Strength Development for the Thermoplastic Composite Tow Placement Process. J. Compos. Mater. 2006, 40, 1487–1506. [Google Scholar] [CrossRef]
  31. Hürkamp, A.; Gellrich, S.; Dér, A.; Herrmann, C.; Dröder, K.; Thiede, S. Machine learning and simulation-based surrogate modeling for improved process chain operation. Int. J. Adv. Manuf. Technol. 2021. [Google Scholar] [CrossRef]
Figure 1. Cross-tension test specimen: rib type A with small base and rib type B with wide base according to [17] (all dimensions in mm).
Jcs 05 00164 g001
Figure 2. Cross-tension test setup with rib type B.
Jcs 05 00164 g002
Figure 3. Temperature distribution from the overmoulding simulation (parameter set 6 “HiOrg”, timestep 0.36   s ) and cross-section view of rib A1 with exemplary temperature values.
Jcs 05 00164 g003
Figure 4. Overview of the workflow for determining the bond strength in OTC.
Jcs 05 00164 g004
Figure 5. Schematic illustration of the consolidation model of thermoplastics, based on [22] with the process steps: no contact (a), intimate contact (b) and autohesion (c).
Jcs 05 00164 g005
Figure 6. Carreau Fluid Model (CFM) for a melt temperature of 220 °C (a) and Arrhenius relation of the temperature dependent welding time t w (b).
Jcs 05 00164 g006
Figure 7. Modified approach for determining the local bond strength as a function of pressure, temperature and contact time with the process steps: no contact (a), local intimate contact (b) and local autohesion (c).
Jcs 05 00164 g007
Figure 8. Influence of the process parameters on the potential increase in bond strength.
Jcs 05 00164 g008
Figure 9. Results of the injection moulding simulation for the process parameter set “Low” for individual ribs of the cross-tension test specimen and final flow front after overmoulding process.
Jcs 05 00164 g009
Figure 10. Degree of autohesion vs. contact time for the individual ribs depending on low process temperatures (“Low”), a high melt temperature “HiMelt”, and a high organo sheet temperature “HiOrg” (cf. Table 1).
Jcs 05 00164 g010
Figure 11. Influence of the geometry factor on the degree of intimate contact exemplary shown for the first and second rib of the lowest process parameter (“Low”).
Jcs 05 00164 g011
Figure 12. Deviation between experimental and numerical bond strengths exemplary for parameter set with a high melt temperature (“HiMelt”) as well as over the entire test series.
Jcs 05 00164 g012
Figure 13. Degree of intimate contact vs. contact time for the individual ribs depending on low process temperatures (“Low”), a high melt temperature “HiMelt”, and a high organo sheet temperature “HiOrg” (cf. Table 1).
Jcs 05 00164 g013
Figure 14. Bond strength vs. contact time for the individual ribs depending on low process temperatures (“Low”), a high melt temperature “HiMelt”, and a high organo sheet temperature “HiOrg” (cf. Table 1).
Jcs 05 00164 g014
Figure 15. Demonstration of the developing bond strength during specific contact times shown as an example for a high melt temperature “HiMelt” (cf. Table 1).
Jcs 05 00164 g015
Figure 16. Comparison of the experimental and numerical bond strength for the individual ribs depending on low process temperatures (“Low”), a high melt temperature “HiMelt”, and a high organo sheet temperature “HiOrg” (cf. Table 1) and the corresponding final process states.
Jcs 05 00164 g016
Table 1. Process parameter sets for injection moulding of cross-tension test specimen and FE-simulation.
Variable ParametersSet 1
“Low”
Set 2
“Ref1”
Set 3
“HiMelt”
Set 4
“Ref2”
Set 5
“Ref3”
Set 6
“HiOrg”
Temperature
of organo sheet
[ ° C ] 5050508080160
Temperature melt [ ° C ] 240240280240280240
Tool temperature [ ° C ] 505050808050
Holding pressure[bar]600900900900900900
Constant parameters
Pressure-switchover[%]90
Holding time[s]10
Injection speed[cm3s−1]50
Cooling time[s]30
Table 2. Welding time of polypropylene (Moplen HP501H) at different temperatures.
Temperature   T
220 °C240 °C260 °C280 °C
Welding time t w 0.1268   s 0.0941   s 0.0733   s 0.0563   s
Publisher’s Note: MDPI stays neutral with regard to jurisdictional claims in published maps and institutional affiliations.

