Article

Study of the Effect of the A206/1.0 wt. % γAl2O3 Nanocomposites Content on the Portevin-Le Chatelier Phenomenon in Al/0.5 wt. % Mg Alloys

by
David Florián-Algarín
1,
Xiaochun Li
2,
Hongseok Choi
3 and
Oscar Marcelo Suárez
4,*
1
Department of Civil Engineering, University of Puerto Rico-Mayagüez, Mayagüez, PR 00681, USA
2
Department of Mechanical and Aerospace Engineering, University of California-Los Angeles, Los Angeles, CA 90095-1597, USA
3
Department of Mechanical Engineering, Clemson University, Clemson, SC 29634, USA
4
Department of Engineering Science and Materials, University of Puerto Rico-Mayagüez, Mayagüez, PR 00681, USA
*
Author to whom correspondence should be addressed.
J. Compos. Sci. 2021, 5(6), 163; https://doi.org/10.3390/jcs5060163
Submission received: 13 May 2021 / Revised: 12 June 2021 / Accepted: 16 June 2021 / Published: 21 June 2021

Abstract

:
The Portevin-Le Chatelier (PLC) phenomenon or dynamic strain aging in Al–0.5 wt. % Mg alloys was investigated at different strain rates. This research also examined the effect of γAl2O3 nanoparticles on the PLC phenomenon. A nanocomposite made of A206/1.0 wt. % γAl2O3 was manufactured to this purpose and then, added to an Al–0.5 wt. % Mg melt to obtain ingots of Al–0.5 wt. % Mg–20 wt. % A206/1.0 wt. % γAl2O3 and Al–0.5 wt. % Mg–10 wt. % A206/1.0 wt. % γAl2O3 with 6 mm diameter. Cold deformation allowed manufacturing 1 mm diameter wires using the 6 mm diameter ingots. A 300 °C solution treatment, followed by rapid cooling in ice water permitted to retain Mg atoms in solid solution. The tensile tests performed on the wires revealed the PLC phenomenon upon the tensile stress vs. strain plastic zone. The phenomenon was quantified using MatLab™ and statistical analysis. The results demonstrated how the alumina nanoparticles can diminish the serration amplitude of the PLC phenomenon.

1. Introduction

Commercial Al-Mg alloys are among the most commonly used metallic materials due to their low density and superior mechanical properties. Nonetheless, manufacturing parts made of these alloys by plastic deformation may be affected by the occurrence of the Portevin-Le Chatelier (PLC) phenomenon [1]. This problem could hinder the utilization of the said alloys in specific applications as the PLC serration occurs upon forming a part at room temperature. Such a serration effect presents itself as rough marks on the finished surface and can be characterized through stress-strain tensile curves. The PLC phenomenon can result in structural problems and affect the alloy’s final mechanical properties. Therefore, the structure or part can fail under service loads, whereas the combination of these effects added to environmental conditions can make the part susceptible to corrosion [2]. Usually, the serrations in the PLC phenomenon are sorted as A, B, and C. Typically, the bands sorted as A are generated at high strain rates. At the same time, type B and C are observed at medium strain rates and low strain rates. The PLC phenomenon is also affected by the material surface, the texture, and the sample geometry [1,2,3]. More specifically, the PLC effect generates superficial and structural problems in aluminum alloys. PLC also can cause part failure under service loads, as aforementioned [4].
Among other variables, PLC research focused on evaluating cross-sectional area reduction and the amount of cold work on the ensuing strain hardening. The authors acknowledge the wealth of information available on the PLC phenomenon, but opted, for the sake of brevity, to focus on those variables pertinent to the goal of the present investigation. In the said literature, it was found that the flow instability rises proportionally to the cross-sectional area of the samples [5]. In cylindrical specimens, Zhang found that the bandwidth has a linear relationship with the diameter of the samples, with the proportionality constant being between 0.50–0.67 [6].
The literature reports that the addition of homogeneously distributed particles in the samples modifies the conditions required for the appearance of the Portevin-Le Chatelier phenomenon [7] since the movement of the mobile dislocations is hindered by the particles [8]. Further, the influence of the added particles depends on their quantity and their distribution within the test specimens [7].
Zhao has reported that grain refinement in Al-Mg alloys delays the appearance of the PLC effect but amplifies the serrated flow [9]. Similar results (i.e, an increase in critical strain is reported) were obtained with the surface nano-crystallization of 5182 Al alloys using the mechanical surface wear treatment [10]. Additionally, Lebedkina obtained results opposite to those reported by Zhao, as he notes that extreme grain refinement can cause suppression of the PLC phenomenon [11]. Further, the temperature of the sample also affects the serration type, critical strain, yield strength, and ultimate strength [12]. Xu reports that the PLC effect was only present within the 223–323 K temperature range. The tensile tests were performed at temperatures from 173–333 K. This author observed that the critical strain decreased with rising temperature (223–310 K). For tensile tests performed between 310 and 323 K, higher temperatures led to higher critical strains. This behavior was reported in 5456 Al alloys [13].
The experimental works reported, as well as the ensuing numerical modeling, focused on evaluating the different variables that could affect the PLC phenomenon or eliminate it. In that respect, we argue that there is still room for more explorations related to the effective means to control the PLC serrations. Therefore, to advance the understanding of the phenomenon, the present research intends to reduce or remove the amplitude of said serrations upon plastic deformation of Al-Mg-based alloys via the insertion of γAl2O3 nanoparticles and thermal treatments of the inoculated alloys. To facilitate the mechanical testing of the material, the test pieces were cold-drawn wires.

2. Materials and Methods

The first stage of the wire production was manufacturing the master nanocomposites, made of an A206 alloy matrix with 1 wt. % γAl2O3 nanoparticles [14,15]. The master A206/1.0 wt. % γAl2O3 nanocomposites allowed inoculating an Al–0.5 wt. % Mg melt to obtain a composite treated with γAl2O3 nanoparticles. The last stage was manufacturing the wires by cold-rolling and drawing, followed by their corresponding characterization.

2.1. Fabrication of A206/1.0 wt. % γAl2O3 Nanocomposites

To assure the nanoparticles addition to the alloy, an A206/1.0 wt. % γAl2O3 nanocomposite was fabricated by melting the A206 at 630 °C alloy in an Ar atmosphere. An axial impeller at 500 rpm generated a vortex into which γAl2O3 nanoparticles was added. Then, we raised the velocity to 1200 rpm for 40 s. To enhance the dispersion of the nanoparticles the tip of a niobium (C-103) ultrasonic probe was inserted into the melt, which generated a 20 kHz ultrasonic vibration (Sonicator 3000, Misonix Inc., Farmingdale, NY, USA). After that, the melt was cast into the molds. The complete ultrasonic processing procedure is described in prior research [14,15].

2.2. Manufacturing Procedure of the Al-Mg-A206/γAl2O3 Wires

The A206/1.0 wt. % γAl2O3 nanocomposites were added to an Al–0.5 wt. % Mg melt to prepare Al–0.5 wt. % Mg–20 wt. % A206/1.0 wt. % γAl2O3 and Al–0.5 wt. % Mg–10 wt. % A206/1.0 wt. % γAl2O3 samples by dilution. Preparing an Al–0.5 wt. % Mg–10 wt. % A206 and an Al–0.5 wt. % Mg–20 wt. % A206 alloy permitted to differentiate between the effect of the γAl2O3 nanoparticles and the amount of A206 alloy in the samples. To set up the material, pure aluminum (99.5%), an Al–25 wt. % Mg master alloy, and the A206/1.0 wt. % γAl2O3 nanocomposite were melted at 760 °C as the melt was mechanically stirred. The melt was poured into a cylindrical mold with a 6 mm diameter. The resulting ingots underwent 400 °C full annealing for 5 h to soften the material before cold work. First, the ingots were cold deformed to render 3 mm diameter wires. To prepare the final specimens, i.e., 1 mm diameter wires, another 400 °C full annealing for 5 h was required. Finally, to guarantee a circular cross-sectional area with a diameter of 1 mm, the wires were cold-drawn. A similar procedure, we used it in previous research [14]. Finally, the wires underwent a 300 °C solution treatment for 30 min, followed by ice-water quenching. Afterward, each wire sample was sectioned in three parts whit 250 mm from working length to perform tensile tests at strain rates of 0.500 mm/min, 0.250 mm/min, and 0.125 mm/min, in an Instron® (model 5944, Norwood, MA, USA) low force universal testing machine, following the ASTM B557 standard [16]. Wire specimens were cut and polished to observe their microstructure in an Epiphot 200 optical microscope (Nikon, Melville, NY, USA) at each manufacturing stage.

3. Results

The heat treatments allowed cold forming the as-cast ingots in stages to obtain the wires. As aforementioned, these wires underwent tensile tests, and the results were evaluated using MatLab™ (Mathworks, Natick, MA, USA). The following section shows a detailed analysis of the said results.

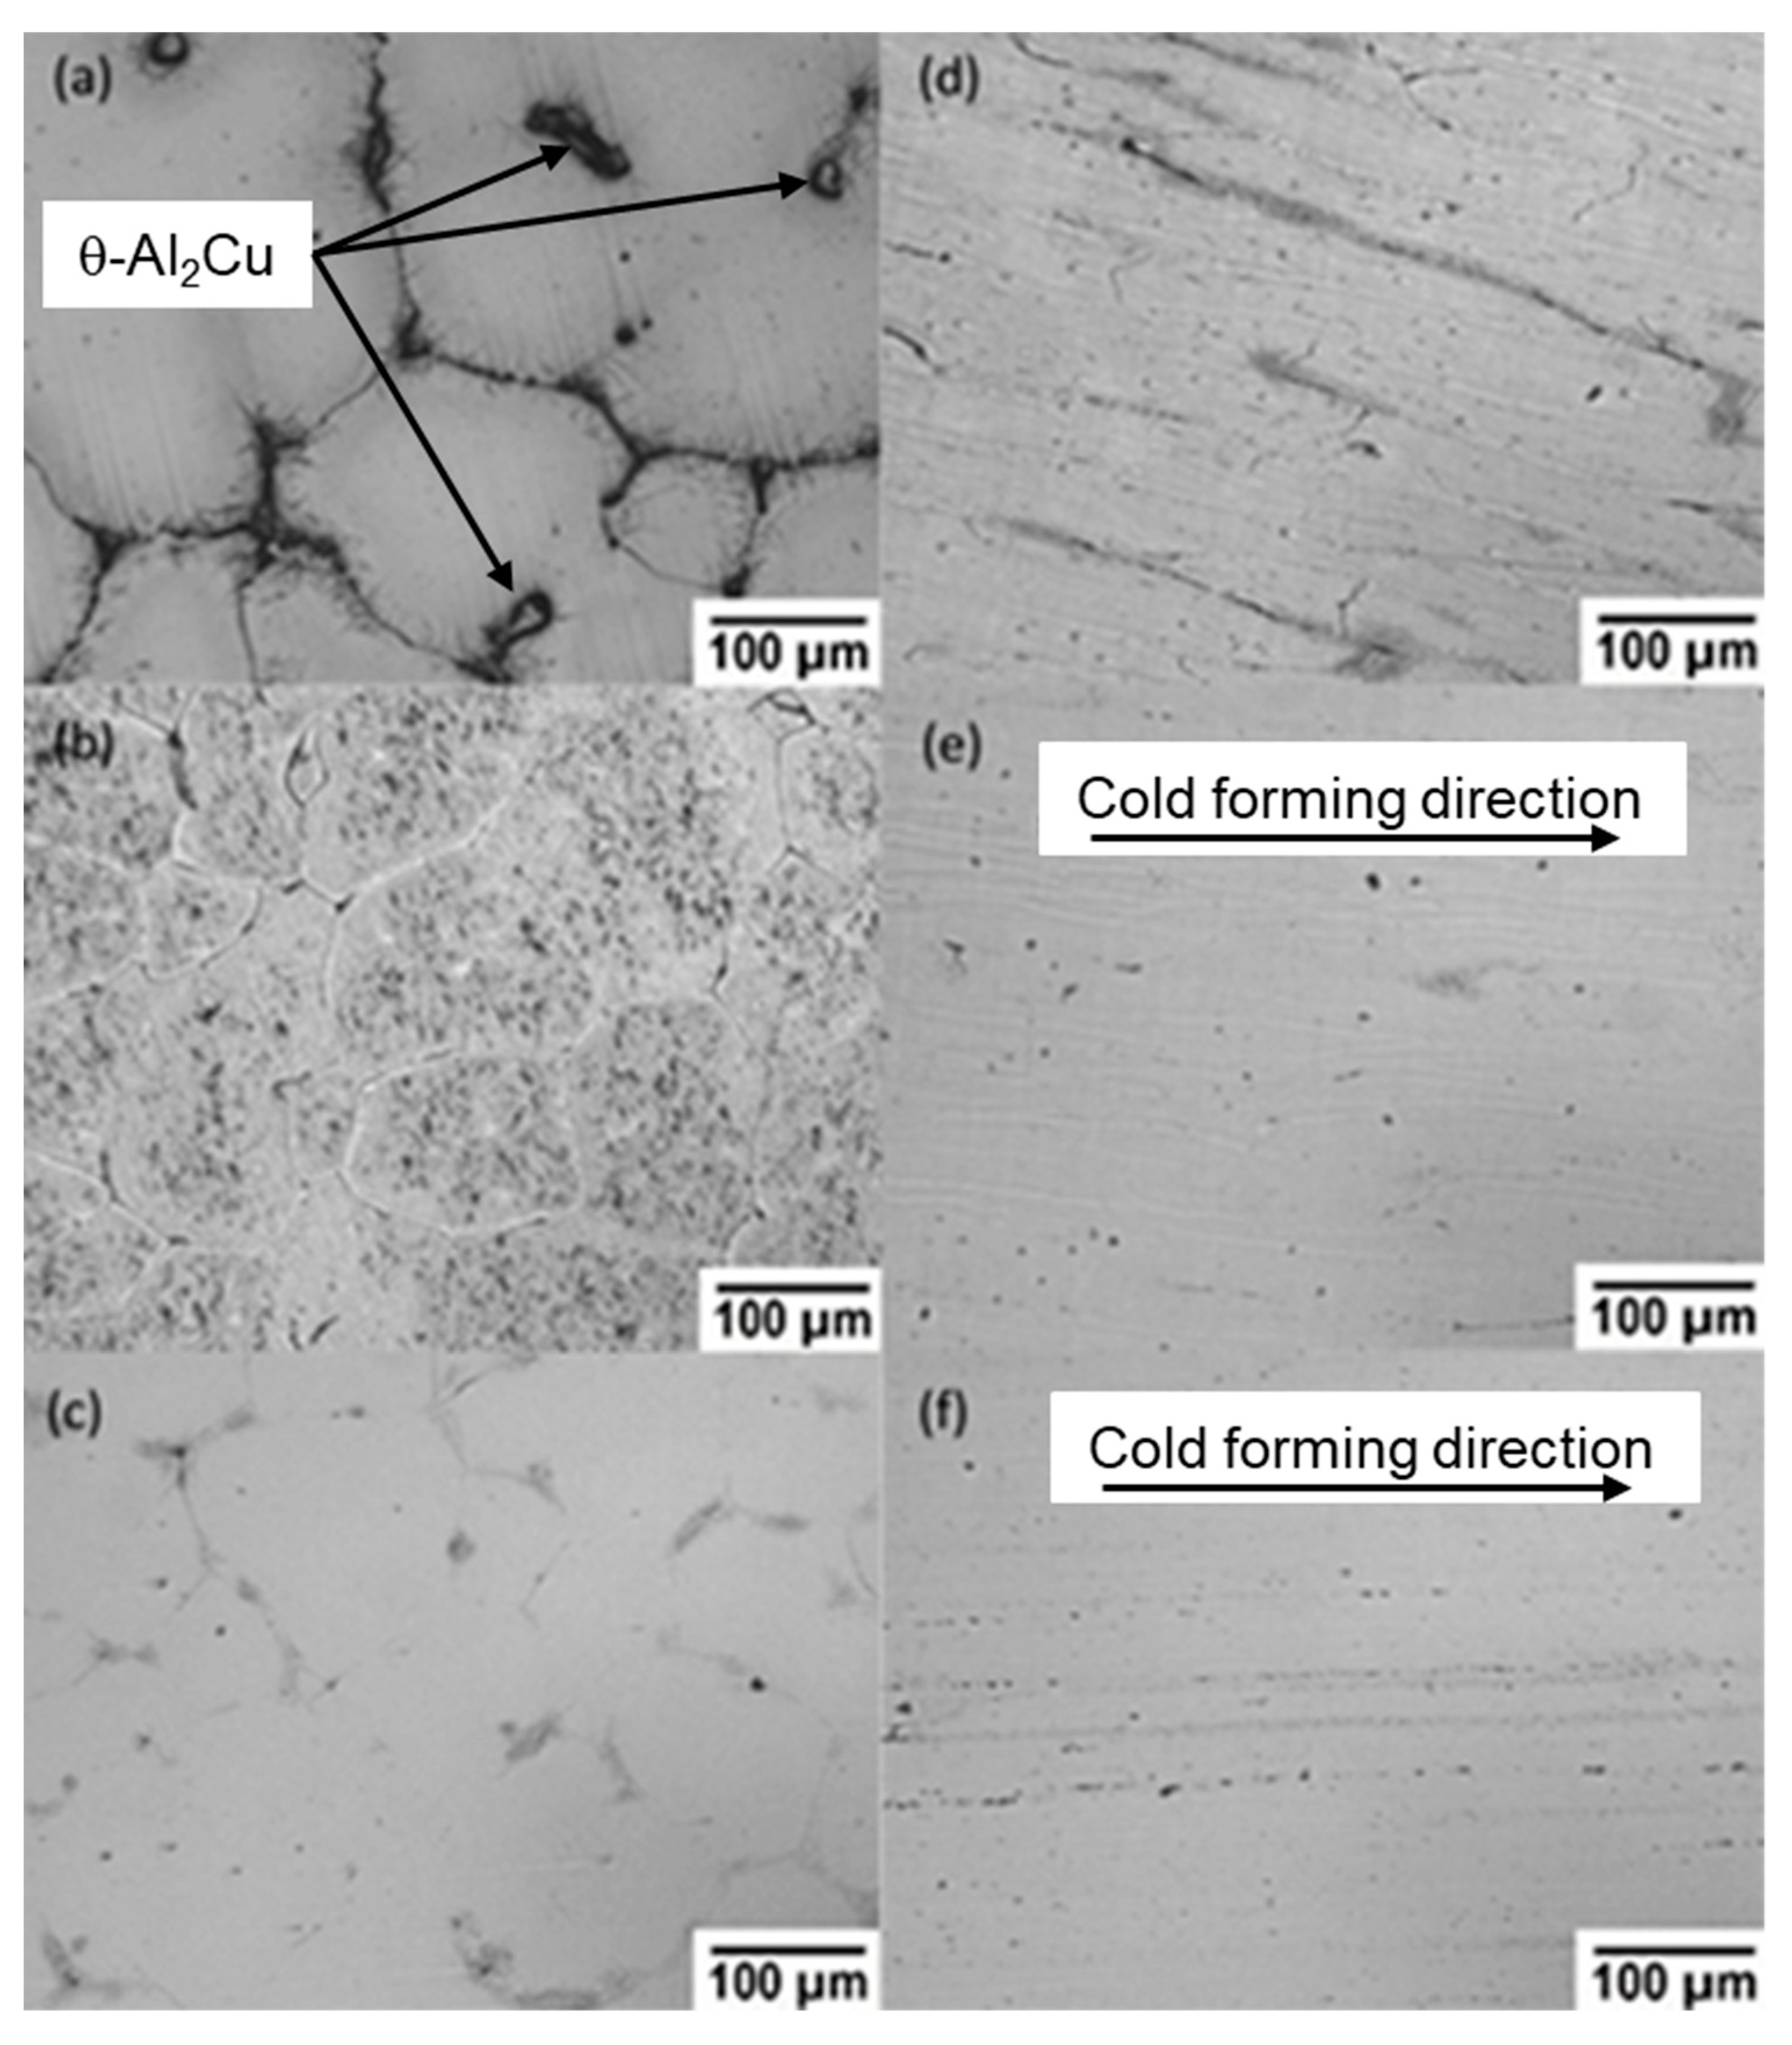
3.1. Optical Micrographs

The microphotographs in Figure 1 show the microstructure of the wires during the manufacturing process. Naturally, through the process, the grains are elongated due to the cold rolling and the cross-section area reduction.

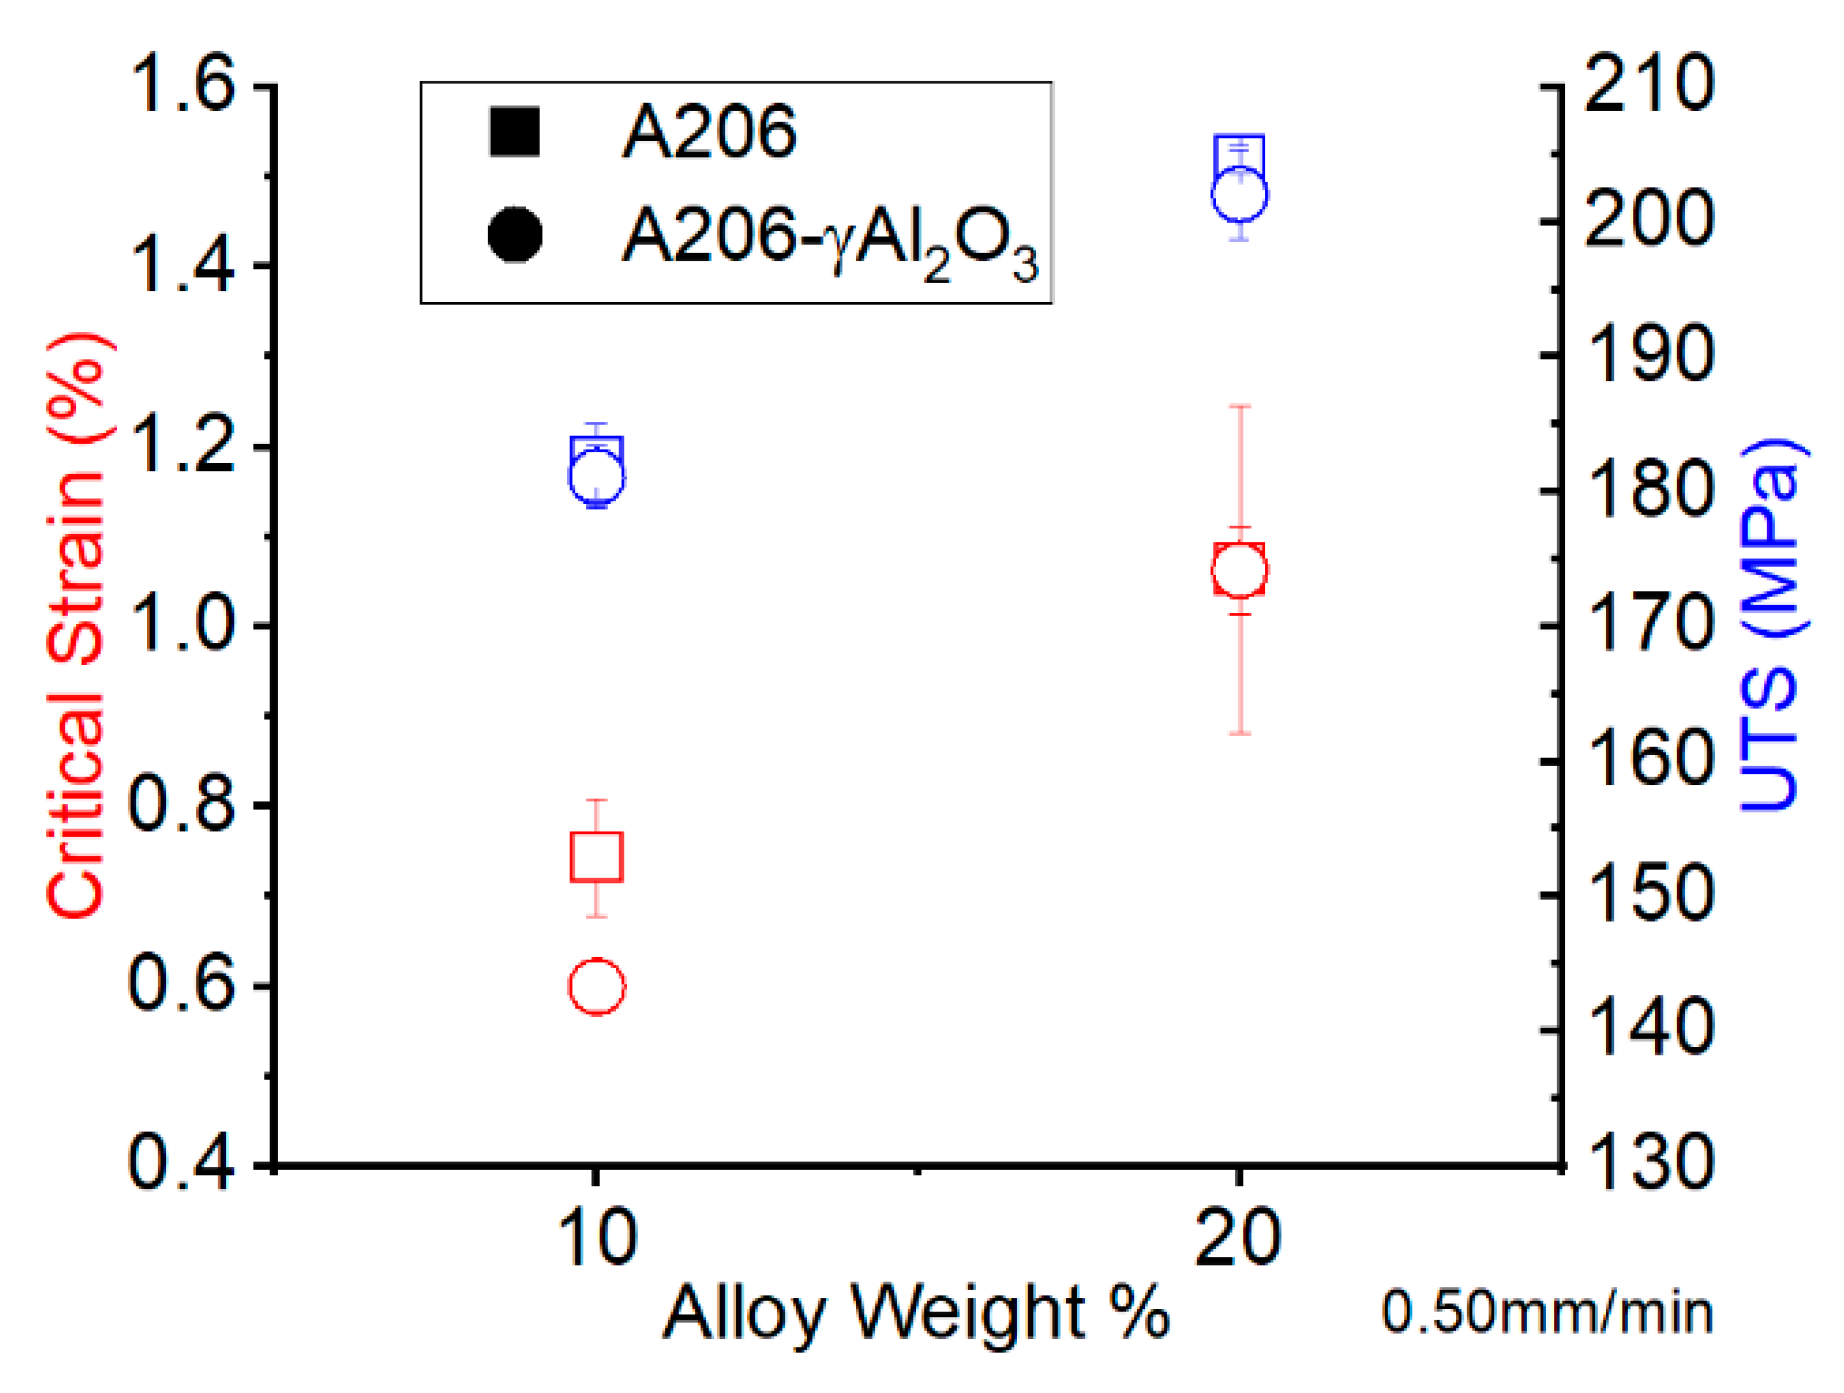
3.2. Ultimate Tensile Strength and Critical Strain

The tensile tests were performed on specimens obtained from each of the three sections at different strain rates. The strain rates used were 0.500 mm/min, 0.250 mm/min, and 0.125 mm/min, in our Instron® (model 5944) low force universal testing machine. The critical strain was measured on the stress–strain curve and is defined as the strain value at which the PLC phenomenon starts occurring.
Figure 2, Figure 3 and Figure 4 present the measured critical strain and the ultimate tensile strength (UTS) at different strain rates. Higher critical strains for higher strain rates are referred to as ‘normal’ behavior, while the opposite is referred to as inverse behavior [17]. No significant nanoparticles’ effect on the recorded UTS and critical strain values is apparent. On the other hand, the addition of the A206 alloy did affect the UTS and critical strain, which is a possible consequence of the presence of copper, the primary alloying element in the A206 alloy [18]. Similarly, higher UTS values occurred as copper content increased.

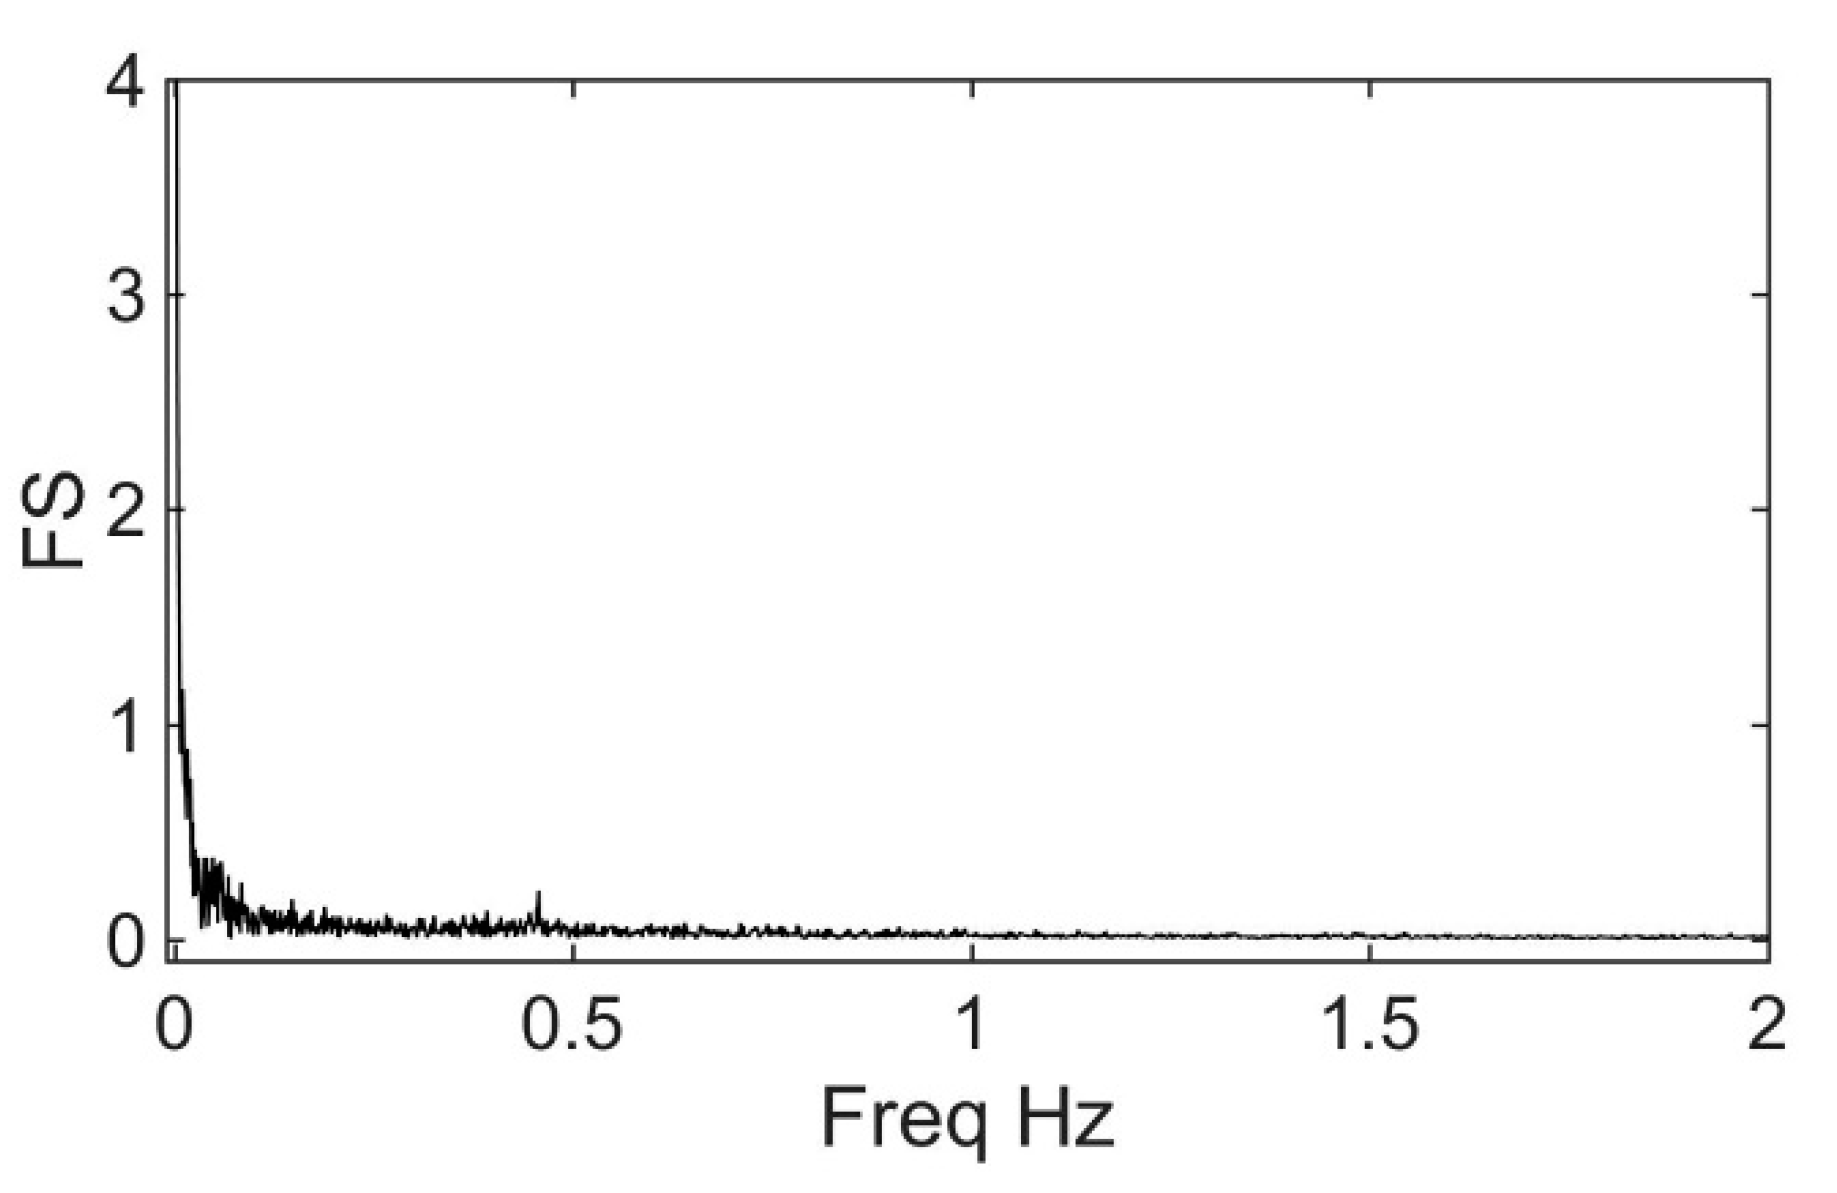
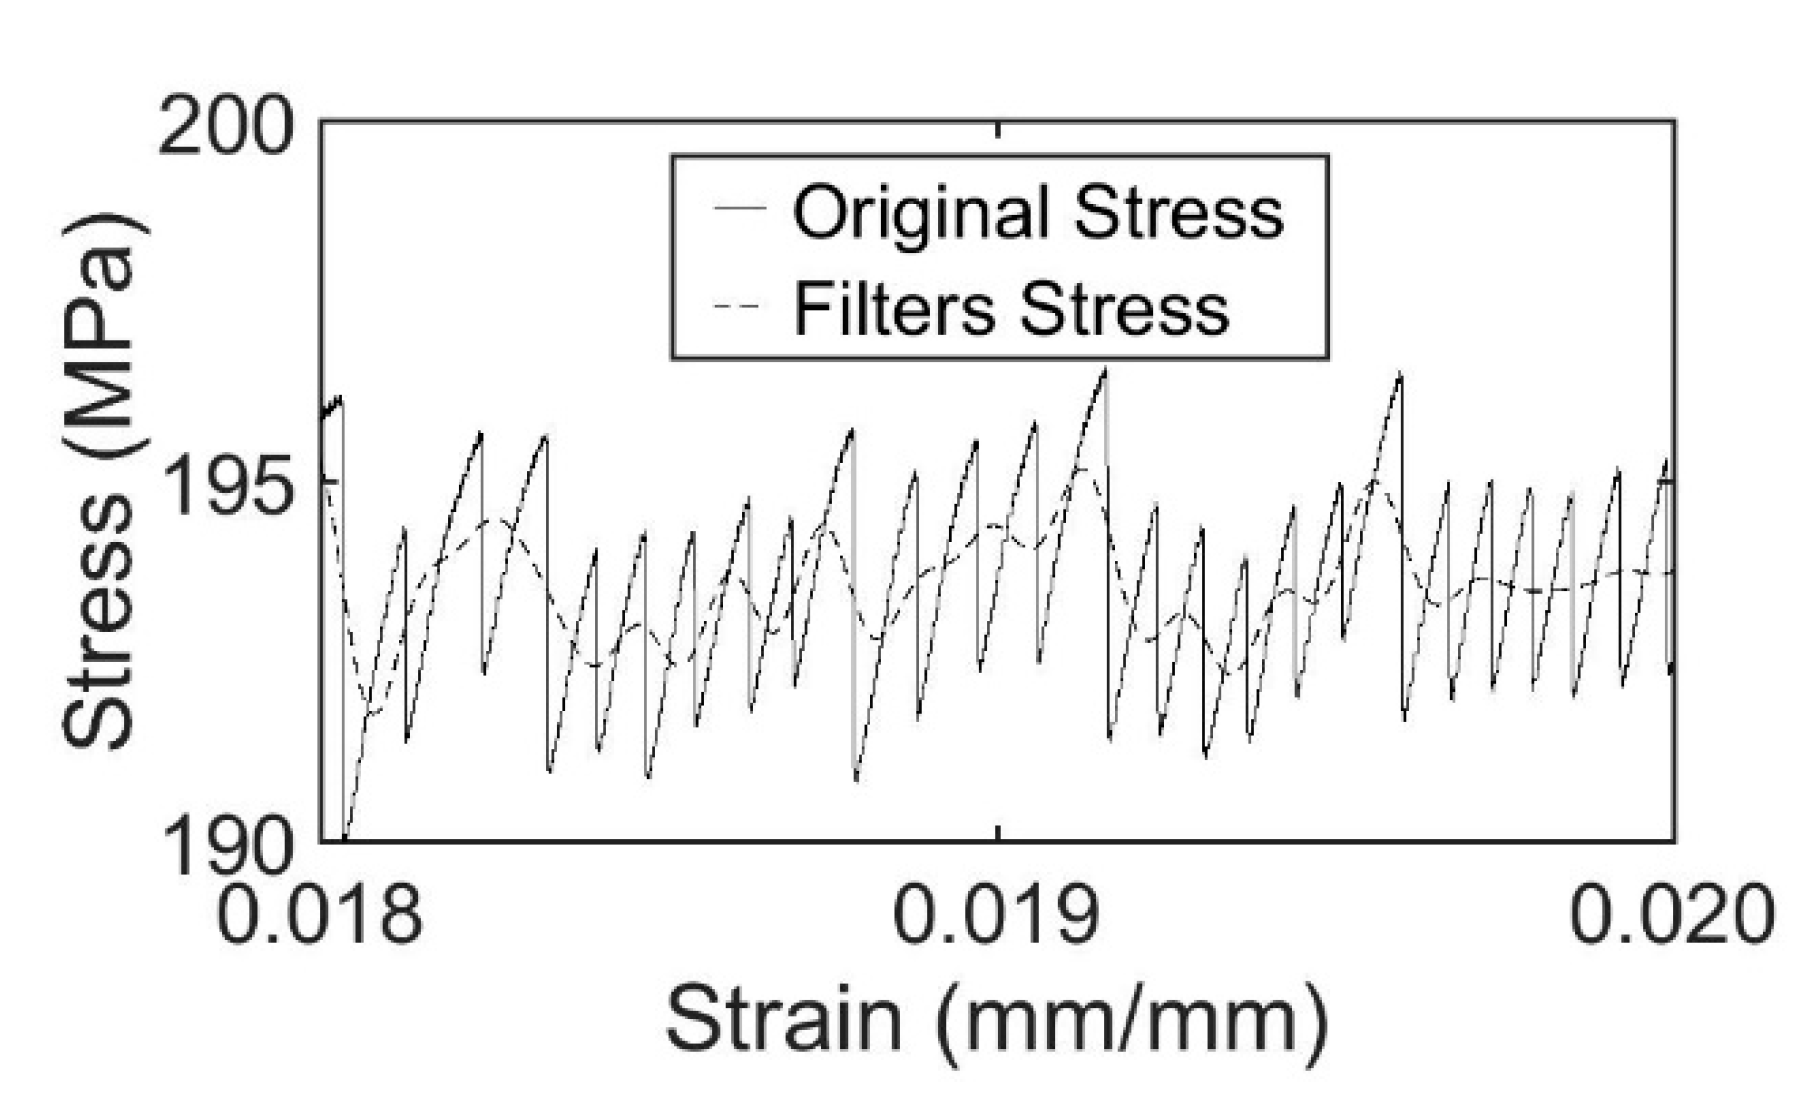
3.3. Analysis of Portevin-Le Chatelier Effect with Fast Fourier Transform Using MatLab™

Figure 5 displays a tensile curve with the PLC phenomenon in one of the studied alloys after removing the initial par. This means that this is the curve up to the proof stress for 0.2% plastic strain, i.e., YS (offset = 0.2%), which was obtained [19] using MatLab™. For convenience in the subsequent analysis, we used the stress vs. time data instead of the stress vs. strain curve.
The frequency of the tensile curve was sorted using a fast Fourier transform (FFT) so that one can compute the frequency of each component (PLC signal and environmental noise or vibrations introduced by the equipment). To this purpose, a group of pure aluminum samples were manufactured and underwent tensile tests under the same conditions as the wires bearing the PLC effect. This FFT analysis of the data pertaining to the tensile curve (stress vs. strain) of the pure aluminum wires revealed peaks at frequencies below 0.2 Hz, 0.1 Hz, and 0.07 Hz in the tests carried out at 0.500 mm/min (3.33·10−5 s−1 corresponds to the strain rate divided by the samples length in s−1), 0.250 mm/min (1.66·10−5 s−1), and 0.125 mm/min (8.33·10−6 s−1). As mentioned, these frequencies were associated with the environmental noise or vibrations of the equipment (artifacts). Figure 6 presents the FFT of the plastic region of the tensile stress-time curve of the aluminum wires tested at 0.500 mm/min.
FFT evaluation of the tensile curve pertaining to the Al-Mg-A206/1 wt. % γAl2O3 composite samples revealed peaks in frequencies higher than 0.2, 0.1 and 0.07 Hz in the tests carried out at 0.500 mm/min (3.33·10−5 s−1), 0.250 mm/min (1.66·10−5 s−1), and 0.125 mm/min (8.33·10−6 s−1), respectively (Figure 7). We attributed them to the Portevin-Le Chatelier phenomenon. Then, these high frequencies due to the PLC phenomenon were equaled to zero to obtain the curve without the PLC effect (filtered curves).
Figure 8 shows the original and filtered curves. Likewise, the curve resulting from the subtraction of the original and filtered curve is in Figure 9. Subsequently, we computed the absolute value of the resulting signal, which is depicted in Figure 10. We integrated the said obtained signal (i.e., Figure 10) to determine the area under the curve; the result was then divided over the strain to normalize the stress vector and obtain the amplitude of the PLC phenomenon. The results are shown in Section 3.5. A similar analysis was used in previous investigations [20].

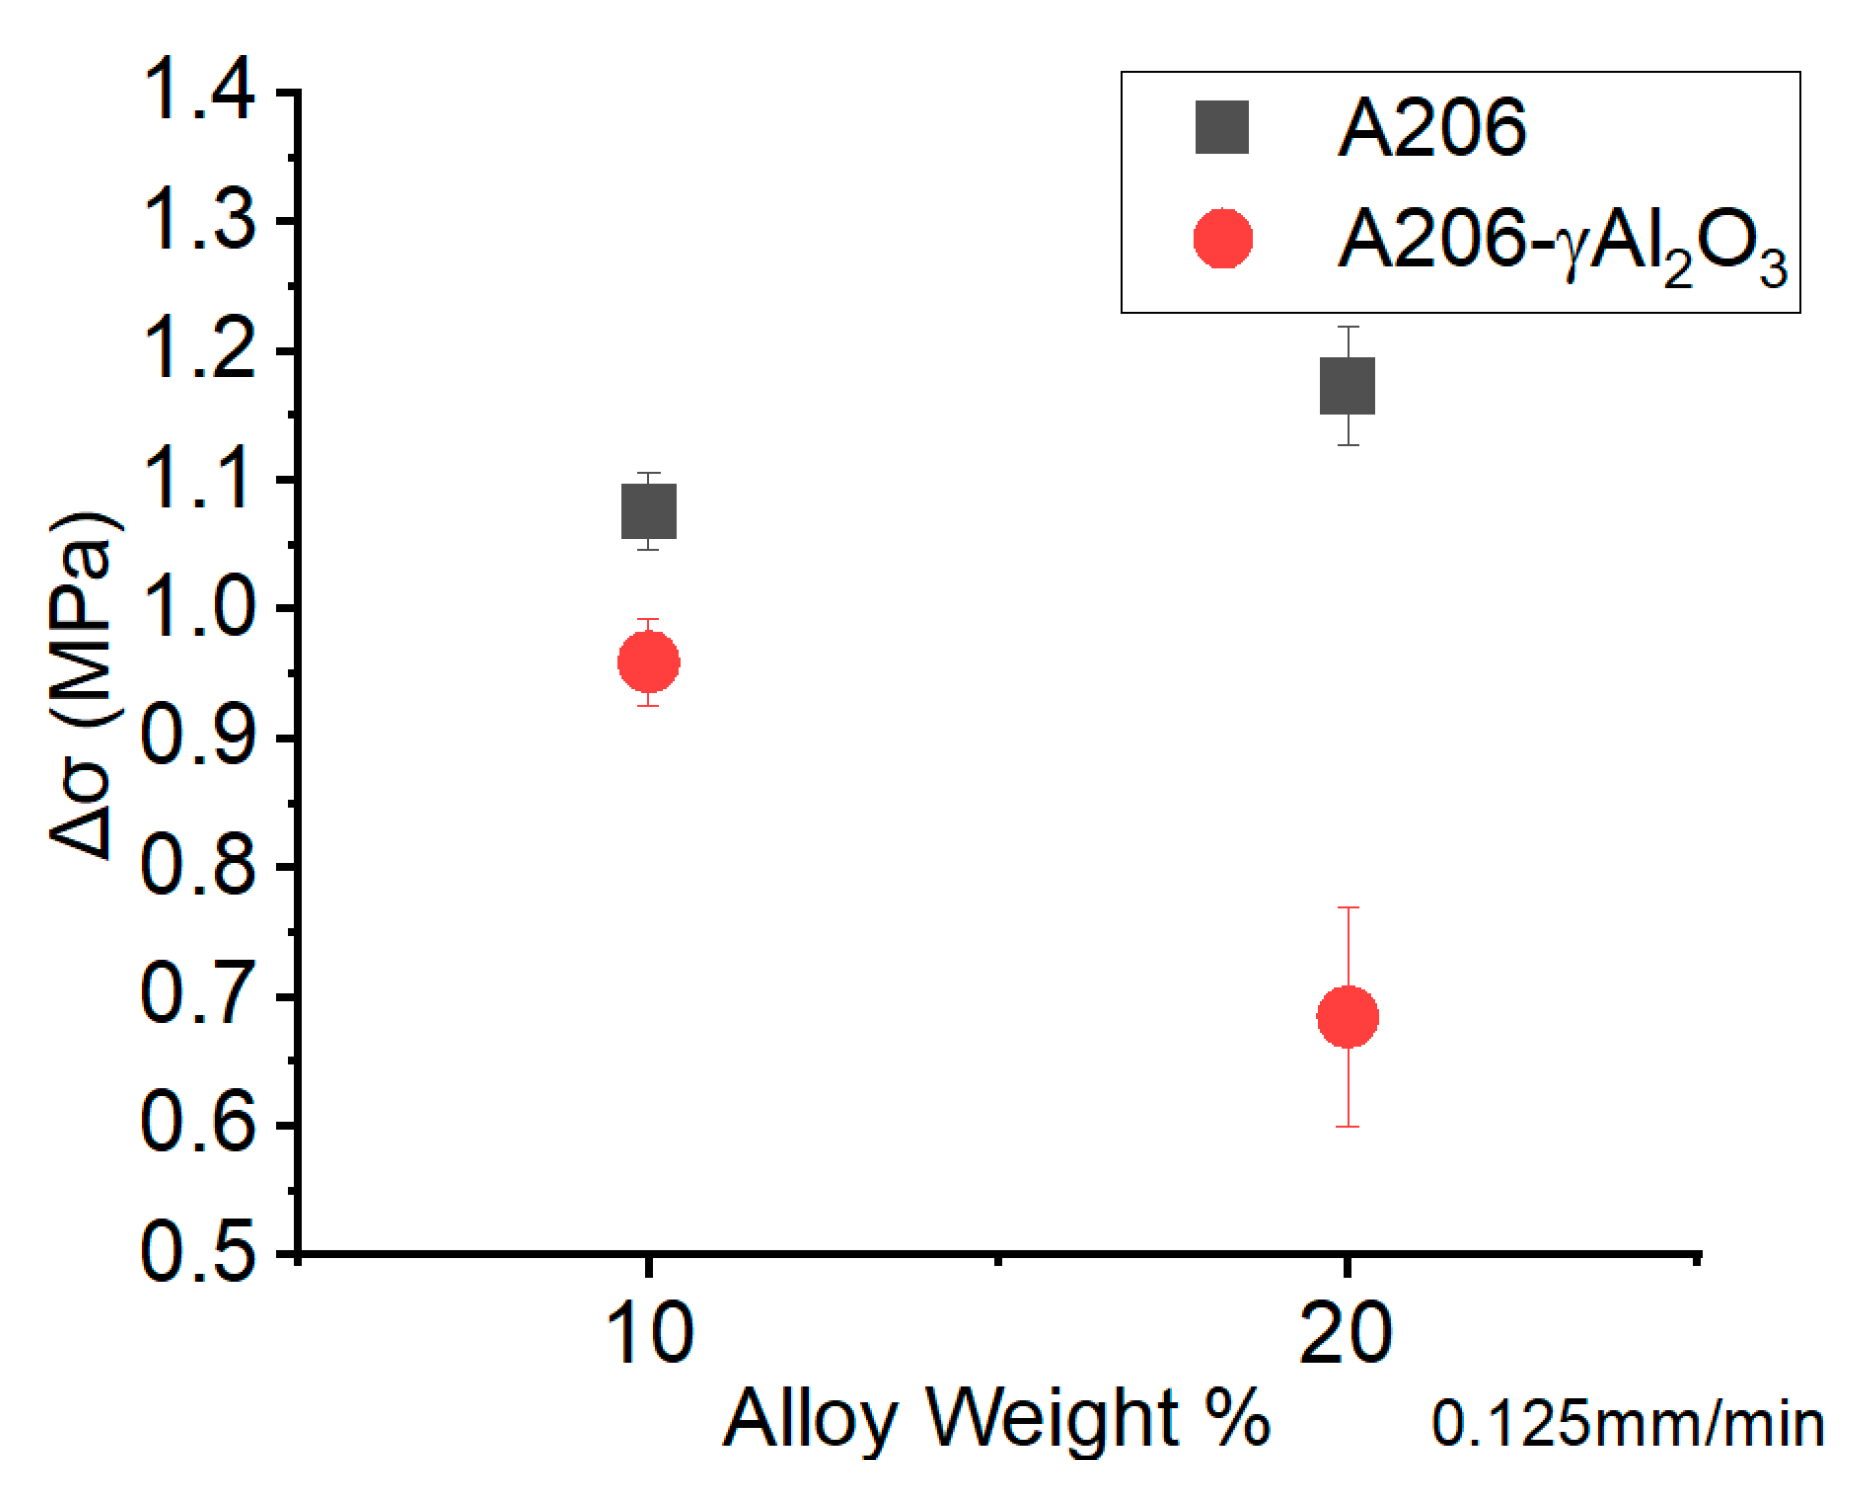
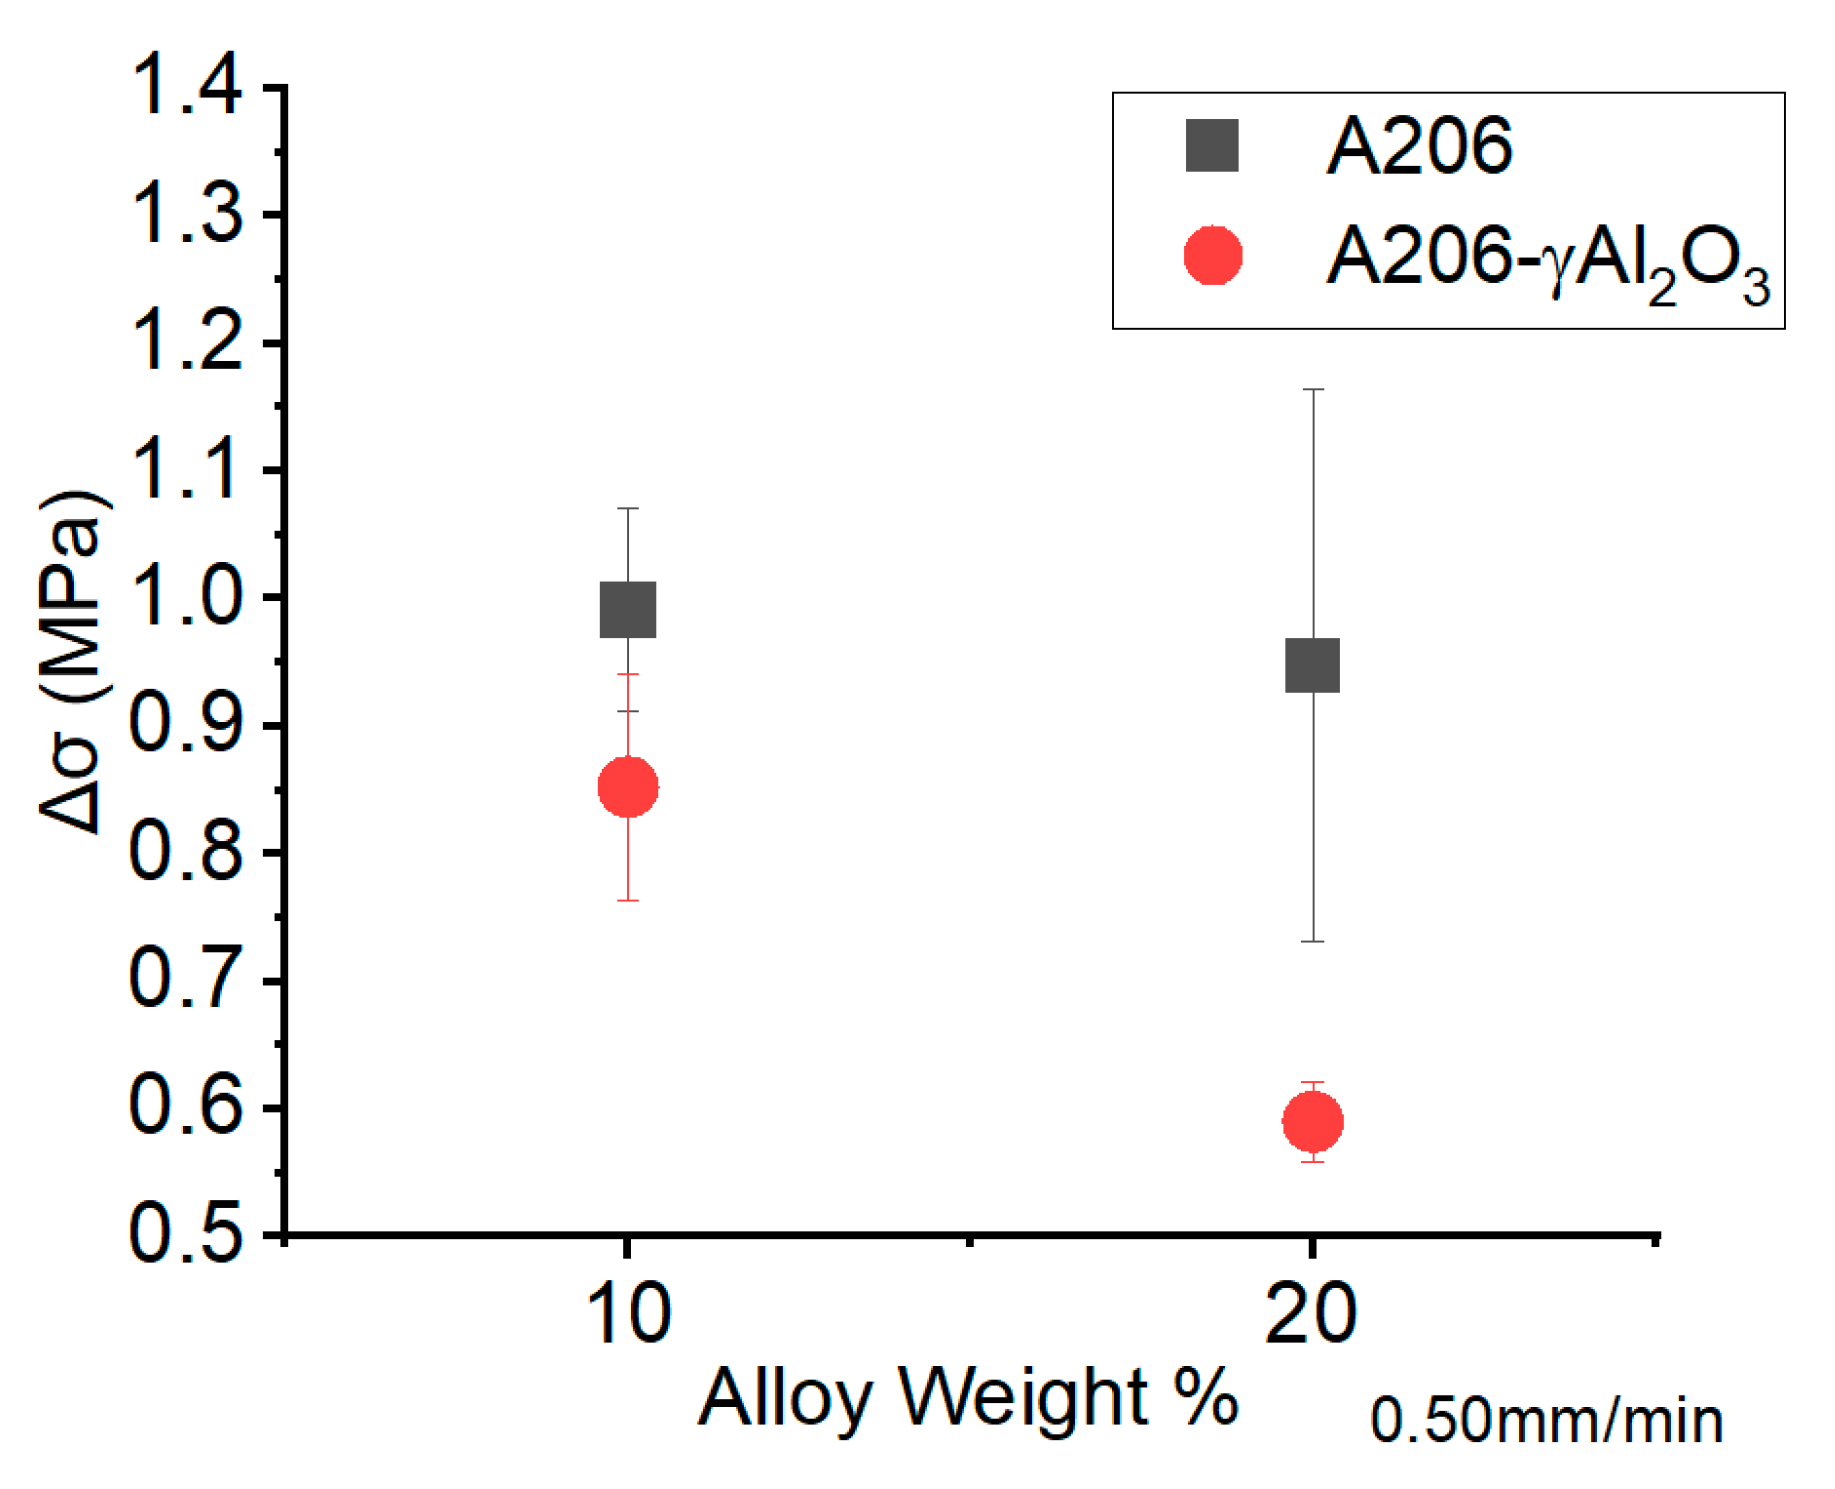
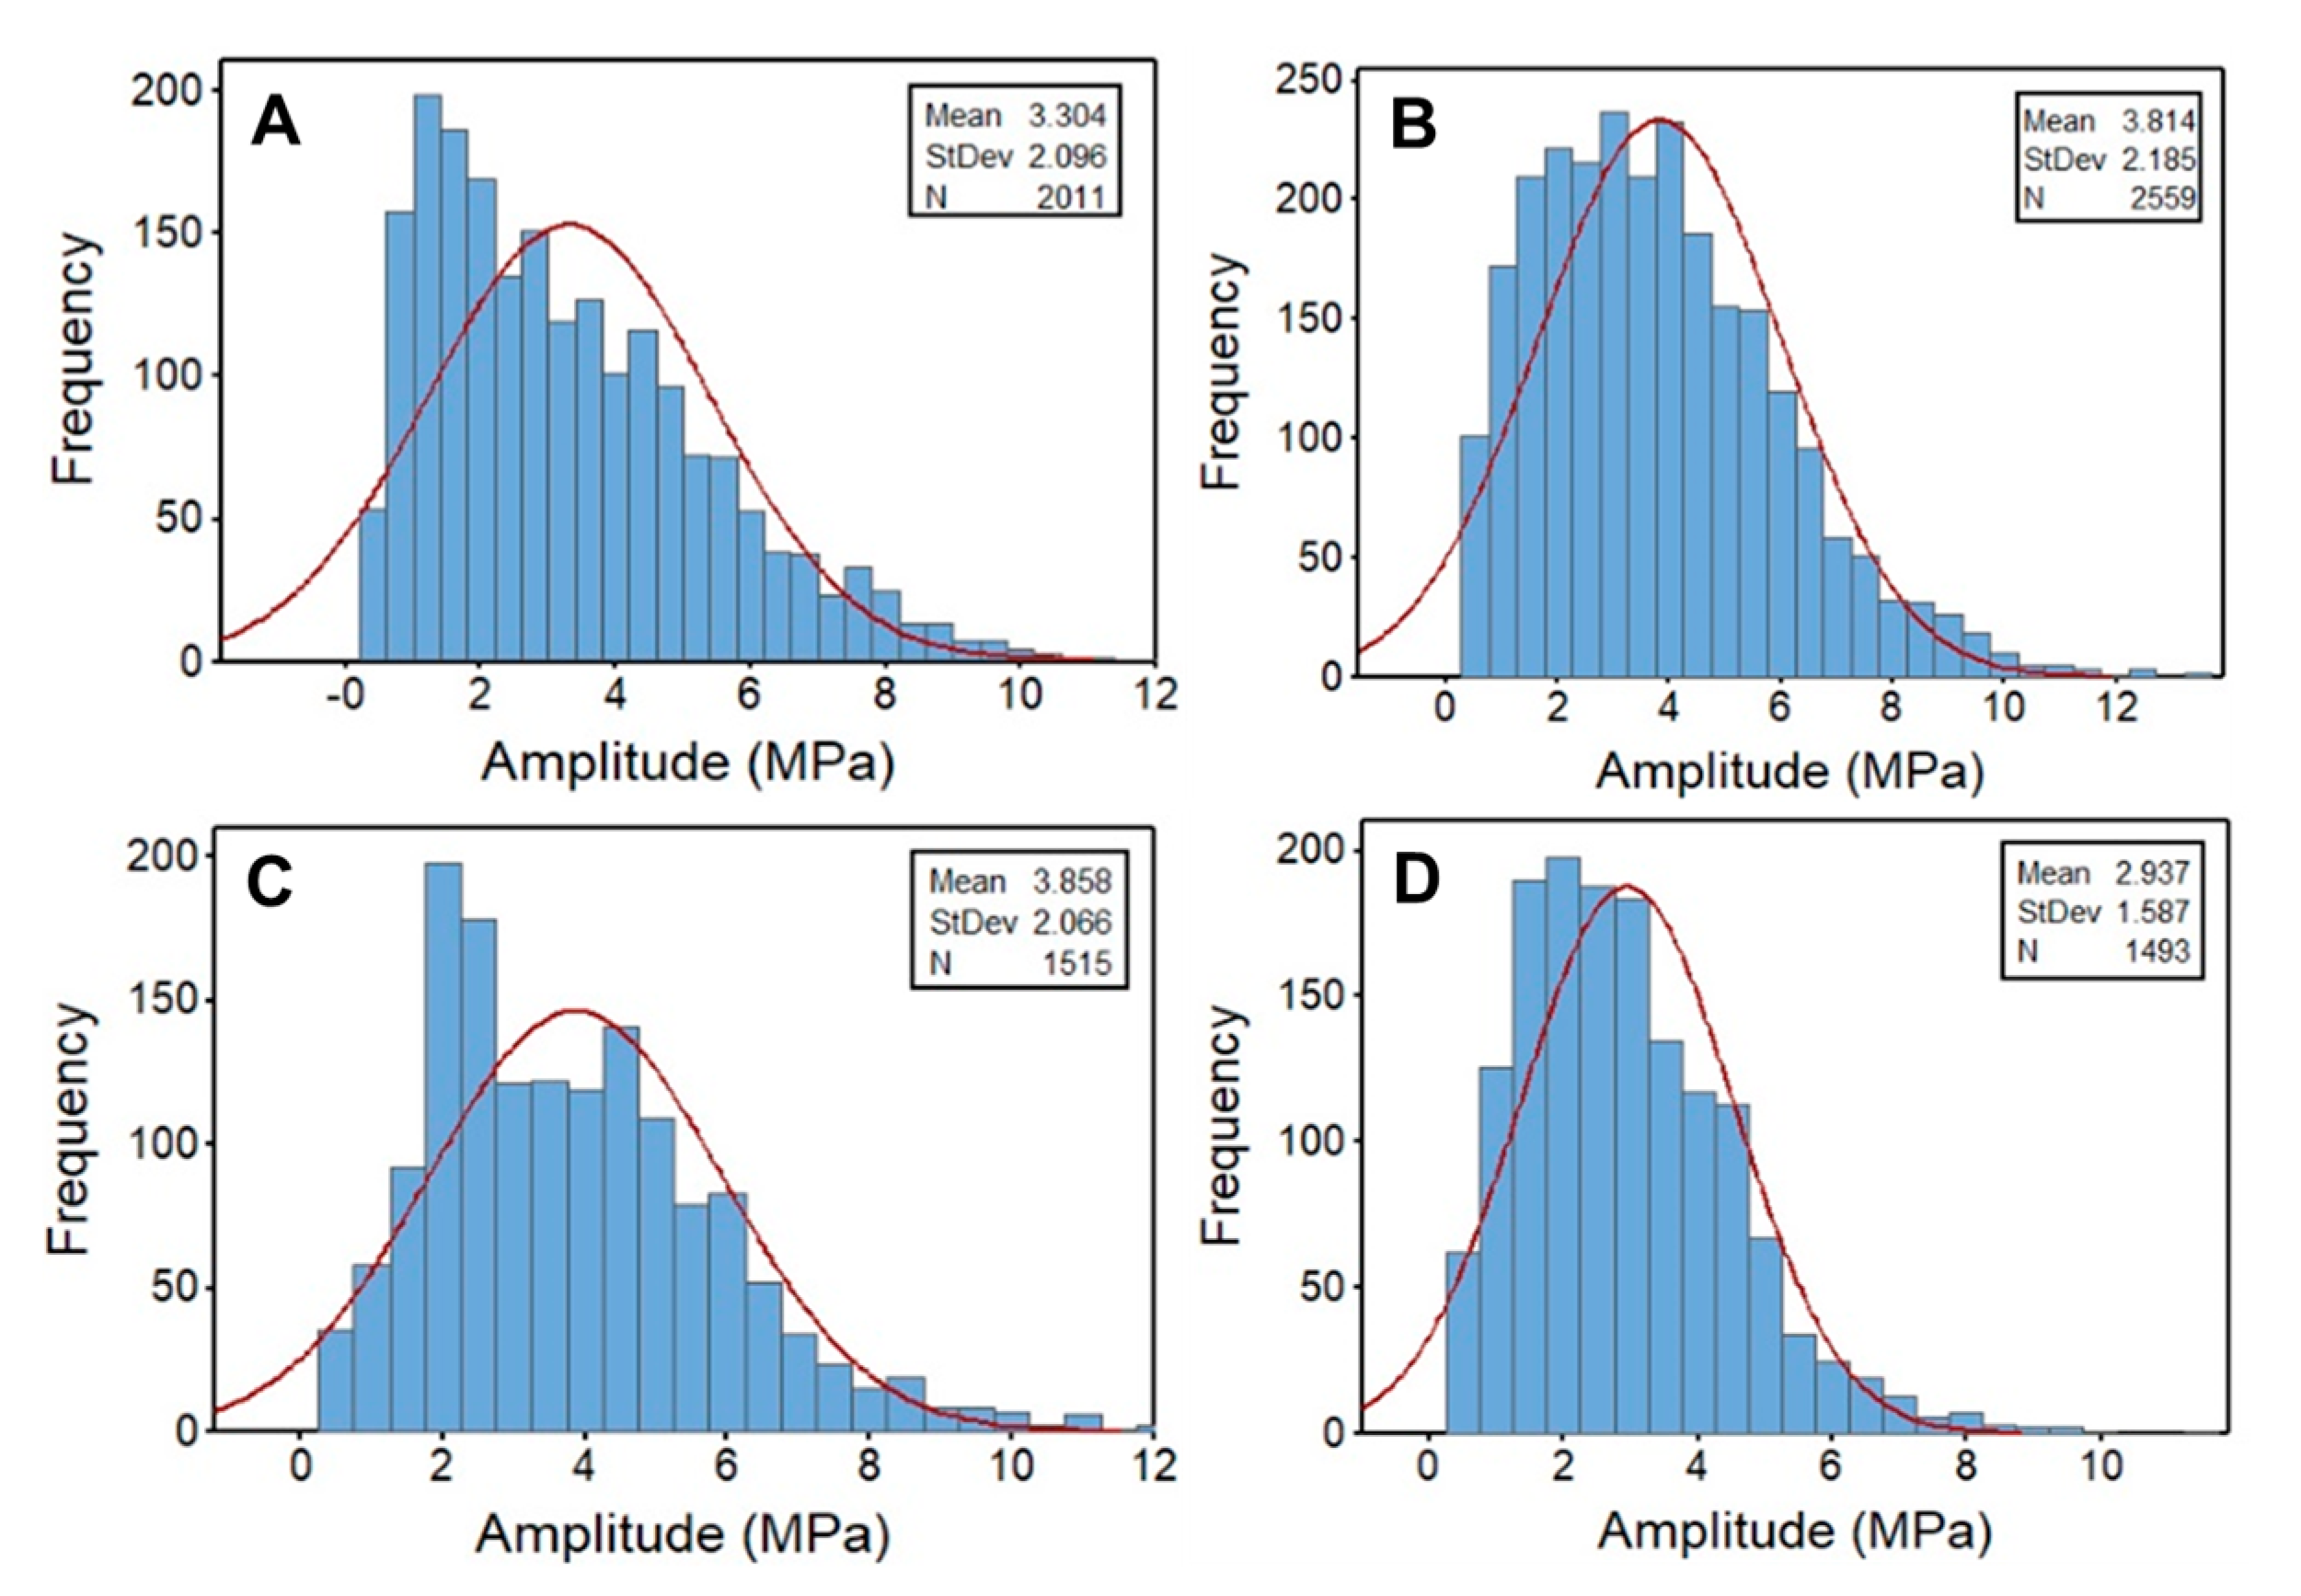
3.4. Amplitude of the PLC Signal Using Fast Fourier Transform

Using the code shown in Section 3.3, one can determine the PLC signal amplitude at different strain rates. The PLC phenomenon was present in all the studied alloys (i.e., after solution treatment and quenching). The 20% A206/1 wt. % γAl2O3 specimens showed a smaller serration effect at all strain rates. Figure 11, Figure 12 and Figure 13 show the signal amplitude as a function of the nanocomposite composition. A significant strain rate effect is apparent in the signal amplitude. In effect, the amplitude was smaller at a 0.500 mm/min strain rate. On the other hand, the control sample that has only the A206 alloy added (i.e., alloying copper) displays a different behavior when compared with the wires containing nanoparticles. In effect, as one raises the amount of A206 alloy, a heightened PLC signal amplitude comes forth.

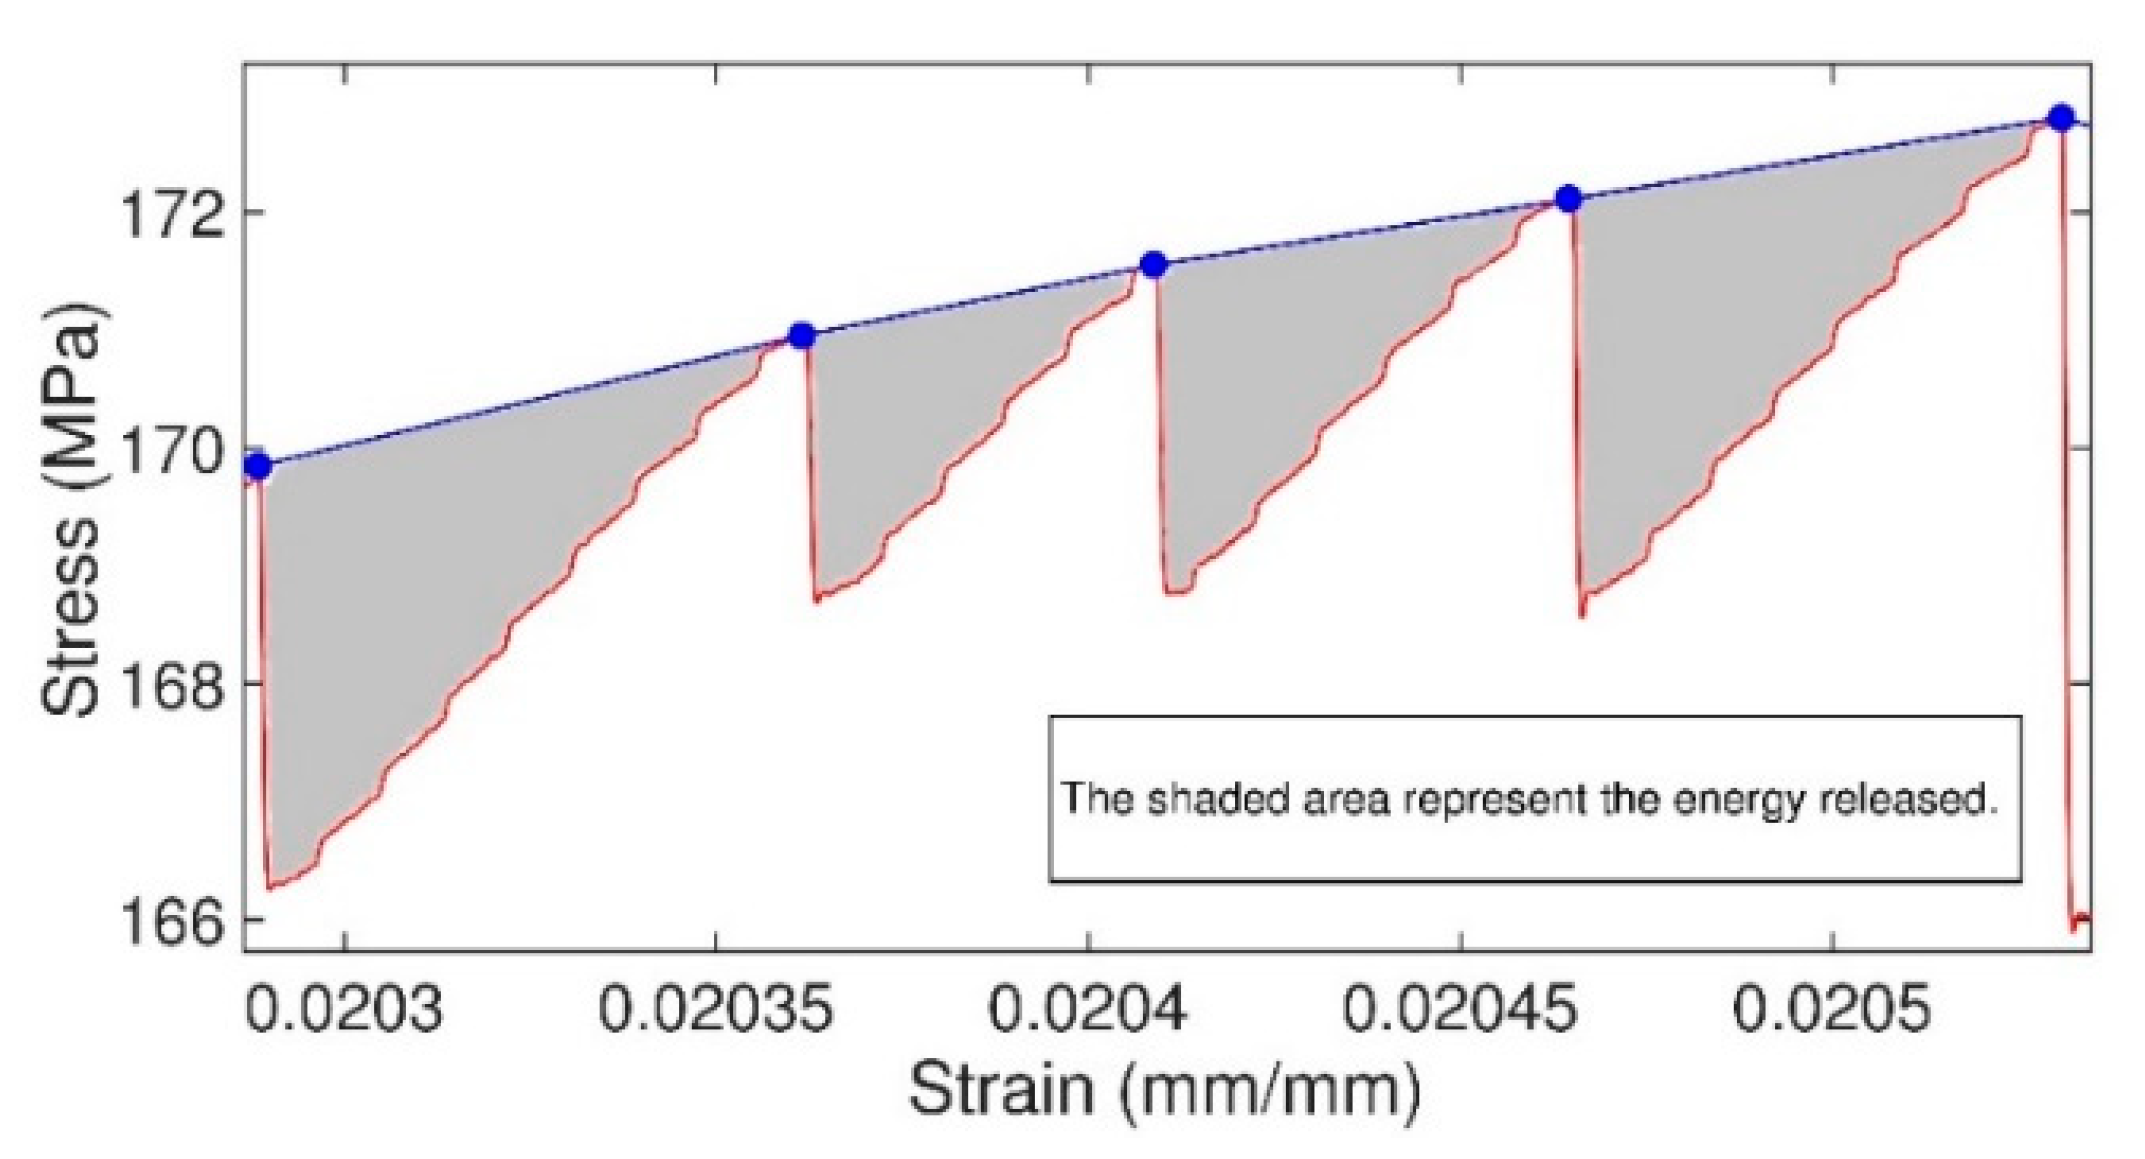
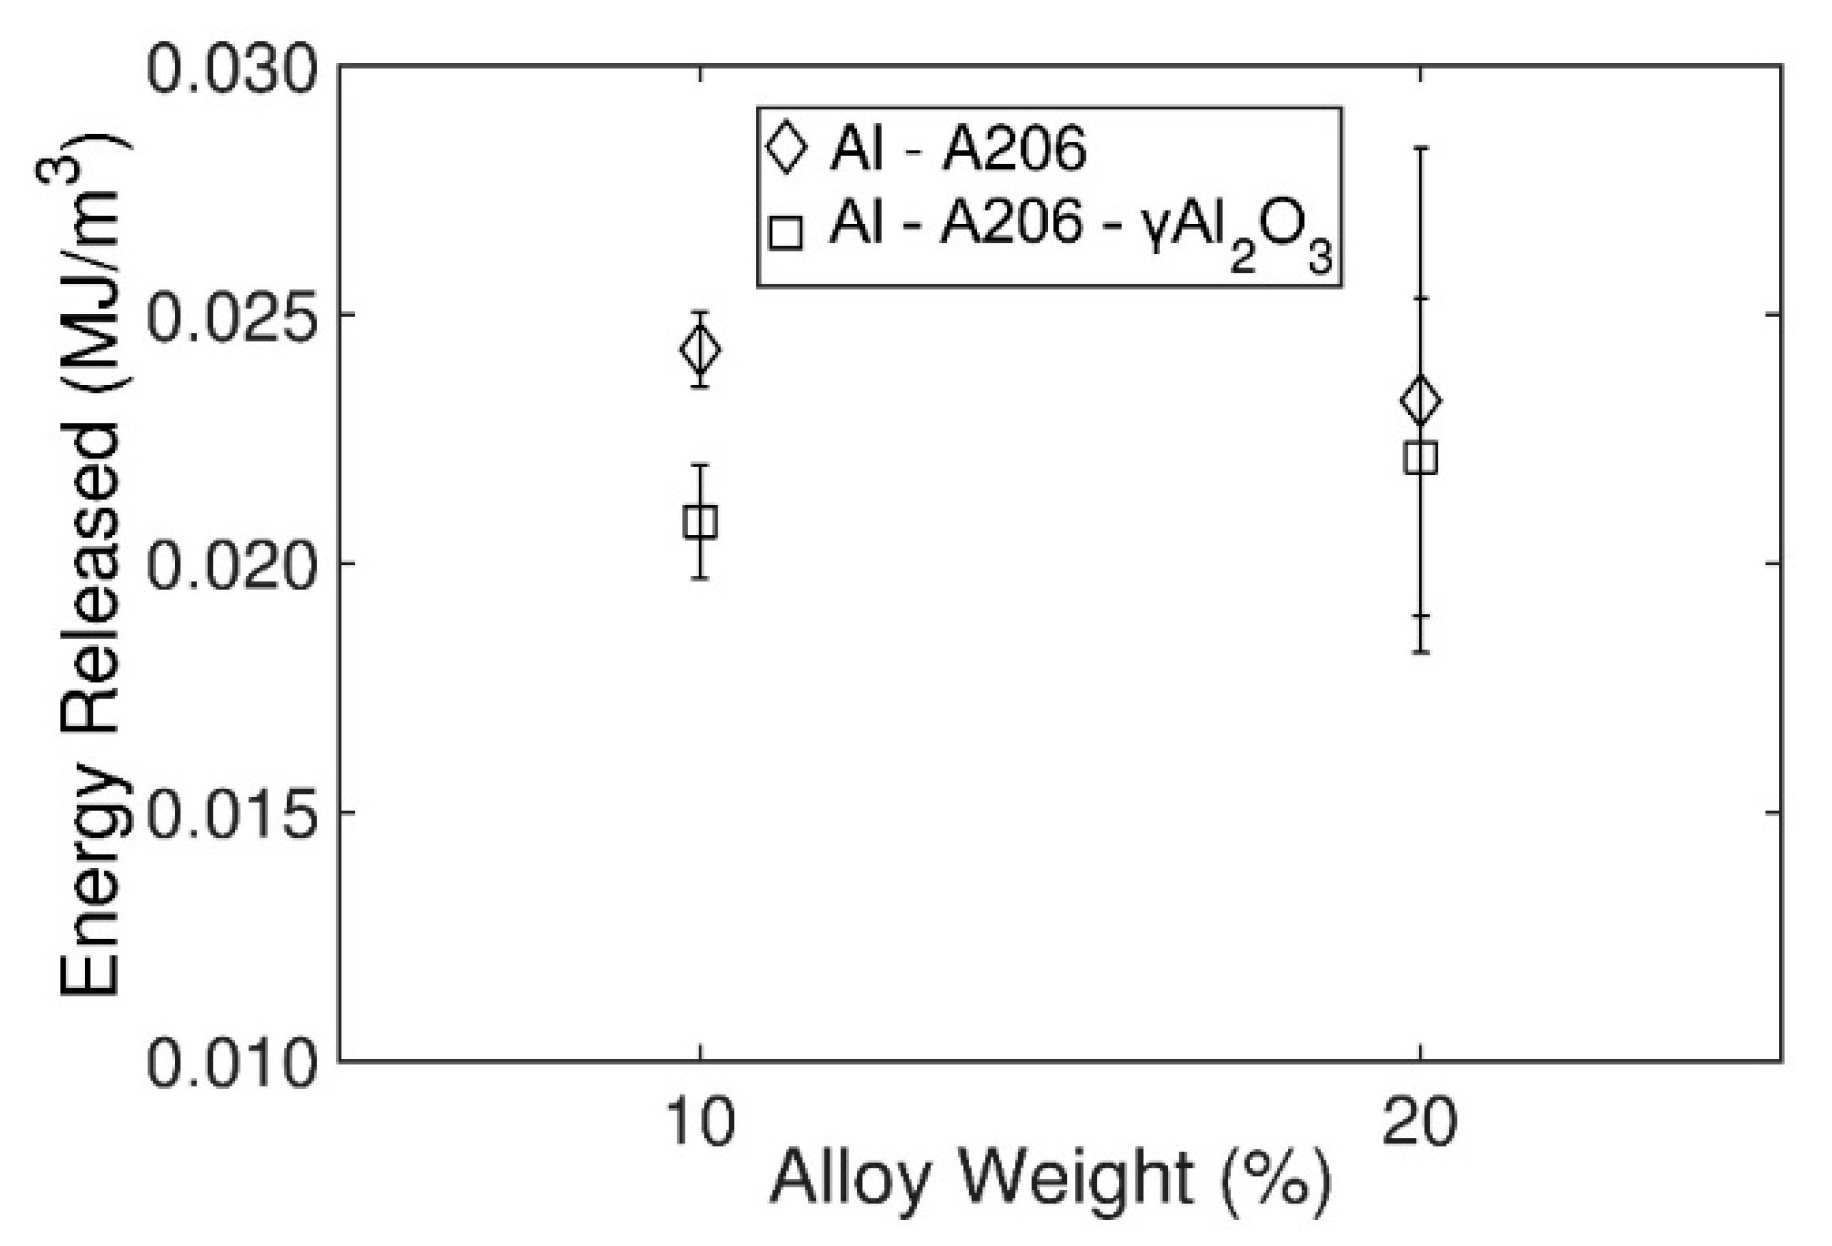
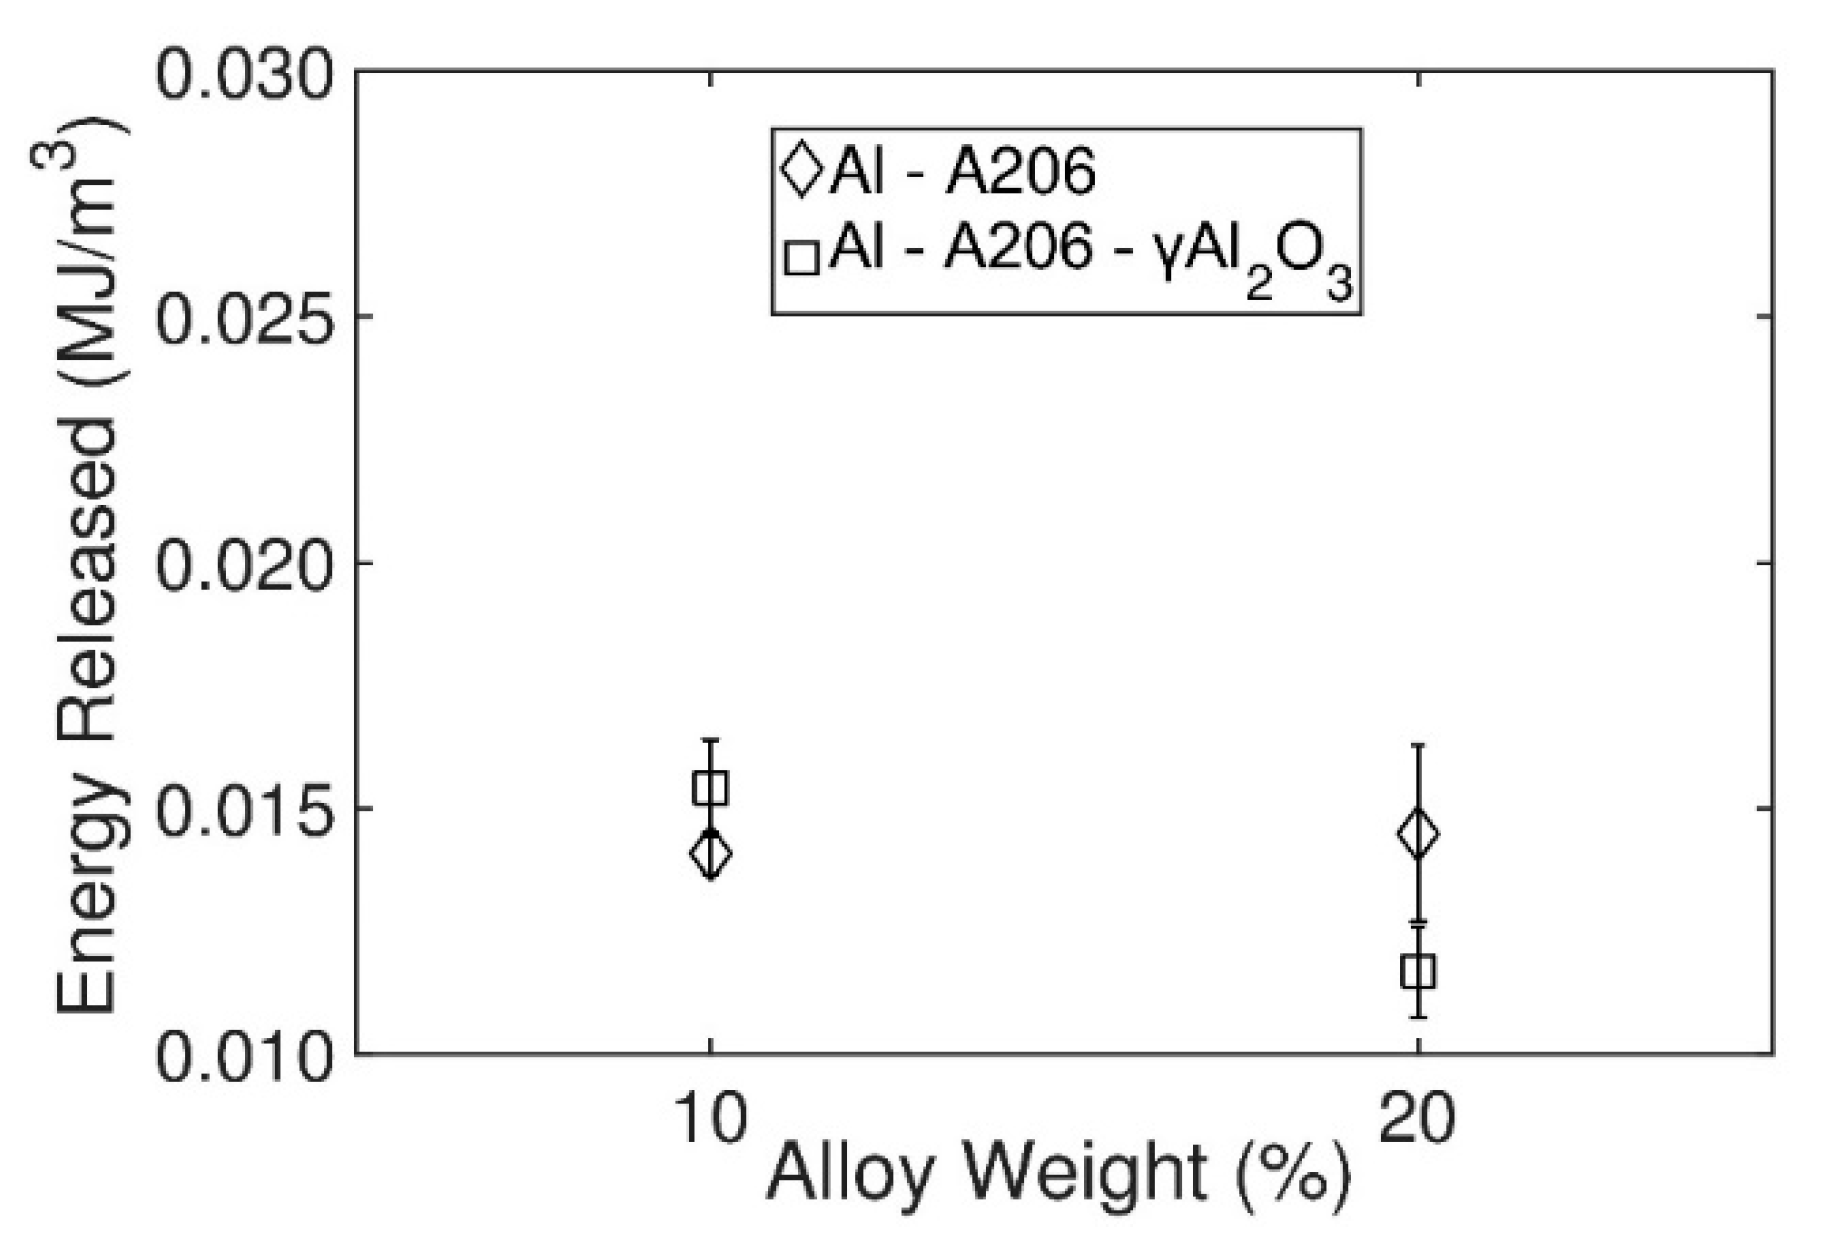
3.5. Energy Released druing the PLC Phenomenon

To determine the energy released as the PLC phenomenon took place, we registered the maximum peaks of the PLC signal using MatLab™. Then, a linear regression (Figure 14) line was fitted to the maximum peaks, according to Figure 14. Subsequently, the difference between the area under the blue line and the area under the red line (stress-strain curve) was computed. The resulting (shaded) area corresponds to the energy released as a result of the PLC phenomenon.
Figure 15, Figure 16 and Figure 17 present the energy released during the PLC phenomenon in the wires as a function of the A206 and A206/1 wt. % γAl2O3 content and the strain rate. The 20% A206/1 wt. % γAl2O3 specimens showed a smaller energy released during the PLC phenomenon at strain rates of 0.250 mm/min and 0.500 mm/min. Also, a significant decrease of the energy released during the PLC phenomenon is apparent at a high strain rate (i.e., 0.500 mm/min). Moreover, as the added amount of the A206 alloy raises in the control sample, a heightened energy released during the PLC phenomenon comes forth at strain rates of 0.250 mm/min and 0.500 mm/min.

3.6. Statistical Analysis of Al-Mg-A206/γAl2O3 and Al-Mg-A206 Samples

To validate the effect of the γAl2O3 nanoparticle amounts on the PLC phenomenon, we completed a statistical analysis using the amplitude of each peak of the PLC serrated signal (stress-strain curve). For each peak, we determine the maximum and minimum values. The signal amplitude was computed after obtaining the maximum and minimum peaks using MatLab ™, After subtracting the minimum peaks of the maximum peaks, we obtained the amplitude of the PCL signal. This statistical data analysis was performed using Minitab™ (State College, PA, USA).
The amplitude results show a left-skewed distribution (Figure 18). To obtain a normal distribution, the output was transformed (Figure 19) using the power function in Equation (1), where TA represents the transformed amplitude and A is the computed amplitude. Minitab™ was used to compute the transformation parameter λ that normalized the response. Equation (1) shows the power function used to yield the data’s normal distribution. Minitab™ computed λ by iteration; this was estimated as 0.27, 0.30, and 0.20 for the wires tested at 0.125 mm/min, 0.250 mm/min, and 0.500 mm/min, respectively.
TA = Aλ
Figure 20 depicts the transformed amplitude for the Al–0.5 wt. % Mg–A206/γAl2O3 and Al–0.5 wt. % Mg–A206 wires at different strain rates. In this analysis, our data shows a similar behavior as in the prior analyses. Figure 20 corresponds to the signal’s transformed amplitude, where a significant effect of the strain rate is apparent in the PLC amplitude in all samples. Finally, the samples containing 20% nanocomposite produced a smaller transformed amplitude at strain rates of 0.250 mm/min and 0.500 mm/min.

4. Discussion

Figure 2, Figure 3 and Figure 4 show the critical strain and the UTS for all the samples at different strain rates. The Al–0.5 wt. % Mg–20% A206 and Al–0.5 wt. % Mg–10% A206/1 wt. % γAl2O3 samples had higher critical strains at 0.250 mm/min strain rate, concerning the value of the critical strain registered at 0.125 mm/min; it decreases for faster strain rates (0.500 mm/min). The Al–0.5 wt. % Mg–10% A206 sample shows a critical strain with an inverse behavior at low strain rates, followed by normal behavior at high strain rates (0.500 mm/min). The Al–0.5 wt. % Mg–20% A206/1 wt. % γAl2O3 sample shows a critical strain with normal behavior. This inverse behavior is explained in detail by Jarfors et al. [21]. Balik et al. suggest that increasing the initial density of mobile dislocations might turn an inverse behavior into a normal behavior or vice-versa; this theory can explain the behavior of our wires because all our samples were cold-rolled to obtain wires with 1 mm diameter. Similar results were published by Chihab [17].
Figure 11, Figure 12 and Figure 13 show the Portevin-Le Chatelier phenomenon signal amplitude of the wires as a function of the A206 and A206/1 wt. % γAl2O3 content and the strain rate. The 20% A206/1 wt. % γAl2O3 specimens displayed less serration at all strain rates. In addition, the more significant amounts of the A206 alloy (i.e., with alloying copper) amplifies the amplitude of the PLC signal. Therefore, we can affirm that the addition of the alumina nanoparticles decreased the PCL effect, and copper (unlike nanoparticles) augments the PLC amplitude.
Furthermore, there is an effect of the strain rate on the signal amplitude. The higher the strain rate, the smaller the amplitude. In effect, the 0.500 mm/min strain rate results rendered a smaller amplitude. Figure 15, Figure 16 and Figure 17 present the energy released by the Portevin-Le Chatelier phenomenon occurring in the Al–0.5 wt. % Mg wires as a function of the A206 and A206/1 wt. % γAl2O3 added and the tensile strain rate. The released energy shows a behavior like the behavior obtained when analyzing the signal’s amplitude under study.
The A206 alloy addition to the specimens expanded the PLC signal amplitude. One should recall that the primary alloying element of A206 alloys is copper. Thus, the presence of copper in the samples can explain the increase in the signal amplitude. In effect, the PCL phenomenon, in this case resulting from the combined effect of Cu and Mg solute atoms, made it easier to pin dislocations before the dynamic precipitation (abrupt load drop). Accordingly, the literature reports that the PCL phenomenon is also present in aluminum-copper alloys [2,22].
All things considered, this research presents an alternative to assess the Portevin-Le Chatelier phenomenon quantitatively using computational and statistical tools. Notwithstanding, we must underscore that with our proposed method using FFT, the Fourier spectra could differ for different types of serrations (i.e., A, B, and C). Those differences call for a detailed investigation that would allow discriminating the dominant type of serration in the stress-strain curve.
The amplitude of the PLC phenomenon can be somewhat controlled in the Al–0.5 wt. % Mg samples with the addition of the A206/1 wt. % γAl2O3 nanocomposite. The PLC phenomenon affect aluminum alloys used in soldering techniques. Such control of the PLC phenomenon can have application in the aerospace and automotive industries, among others. Therefore, this work presents an alternative to control the phenomenon in the Al-Mg alloy produced by deformation and heating of the element to be joined.

5. Conclusions

The present manuscript adds to a growing corpus of research on the Portevin-Le Chatelier phenomenon in Al-Mg alloys. By treating the said alloys with γAl2O3, the ensuing data analysis leads to the following conclusions:
  • The PLC phenomenon is present in all the solution-treated Al-Mg wires.
  • MatLab™ codes developed for the present research permitted the quantification of the PLC signal using Fast Fourier Transform that helped shed light on the nanoparticles effect on the stress serration upon tensile testing.
  • Because of the non-normality of the residuals upon statistical evaluation of the results, a transformation of amplitude λ was required to further the analysis.
  • The wires treated with the 20 wt. % A206/1 wt. % γAl2O3 nanocomposite presented the highest reduction in the serration amplitude upon the tensile stress-strain curves.
  • The critical strain is affected by the amount of A 206 added as well as the presence of the Al2O3 nanoparticles.
The feasibility of controlling the serration in the PLC phenomenon of Al-Mg alloys using alumina nanoparticles opens the door to future work on cold work manufacturing of parts made of the said material.

Author Contributions

X.L. and H.C. manufactured the A206/1 wt. % Al2O3 master nanocomposites. D.F.-A. designed and carried out the manufacturing of the aluminum wires, analyzed and interpreted the information obtained from the tensile tests and characterization of the samples, developed the MatLab™ code and wrote a large part of the article. O.M.S. directs the Nanotechnology Center that finances this research and contributed to the drafting and completion of the article. All authors have read and agreed to the published version of the manuscript.

Funding

This material is based upon work supported by the US National Science Foundation under grant No. HRD 1345156 (CREST program).

Data Availability Statement

The data presented in this study are available on request from the corresponding author. The complete data are not publicly available as it may be used in an ensuing publication in the near future.

Acknowledgments

The authors would like to thank the Materials Research Laboratory technician, Boris Renteria, and the student Monica A Diaz Pares for their assistance in the completion of this research. The tensile test machine was acquired a grant provided by the Solid Waste Management Authority of Puerto Rico.

Conflicts of Interest

The authors declare no conflict of interest.

References

  1. Maj, P.; Zdunek, J.; Gizynski, M.; Mizera, J.; Kurzydlowski, K.J. Statistical analysis of the Portevin-Le Chatelier effect in Inconel 718 at high temperature. Mater. Sci. Eng. A 2014, 619, 158–164. [Google Scholar] [CrossRef]
  2. Ranc, N.; Wagner, D. Experimental study by pyrometry of Portevin-Le Chatelier plastic instabilities-Type A to type B transition. Mater. Sci. Eng. A 2008, 474, 188–196. [Google Scholar] [CrossRef] [Green Version]
  3. Sarkar, A.; Webber, C.L.; Barat, P.; Mukherjee, P. Recurrence analysis of the Portevin-Le Chatelier effect. Phys. Lett. Sect. A Gen. At. Solid State Phys. 2008, 372, 1101–1105. [Google Scholar] [CrossRef] [Green Version]
  4. Yilmaz, A. The Portevin–Le Chatelier effect: A review of experimental findings. Sci. Technol. Adv. Mater. 2011, 12, 1–16. [Google Scholar] [CrossRef] [PubMed]
  5. Zdunek, J.; Spychalski, W.L.; Mizera, J.; Kurzydłowski, K.J. The influence of specimens geometry on the PLC effect in Al-Mg-Mn (5182) alloy. Mater. Charact. 2007, 58, 46–50. [Google Scholar] [CrossRef]
  6. Jiang, Z.; Zhang, Q.; Jiang, H.; Chen, Z.; Wu, X. Spatial characteristics of the Portevin-Le Chatelier deformation bands in Al-4 at%Cu polycrystals. Mater. Sci. Eng. A 2005, 403, 154–164. [Google Scholar] [CrossRef]
  7. Estrin, Y.; Lebyodkin, M.A. The influence of dispersion particles on the Portevin-Le Chatelier effect: From average particle characteristics to particle arrangement. Mater. Sci. Eng. A 2004, 387–389, 195–198. [Google Scholar] [CrossRef]
  8. Wu, J.; Zhou, Z.; Ma, M.; Zhang, Z.; Chen, Z.; Zhao, Y.; Pi, J. Serrated flow and ZrB2 nanoparticle agglomerations of in-situ AA6061 alloy matrix composites. J. Alloys Compd. 2020, 846, 1–7. [Google Scholar] [CrossRef]
  9. Zhao, S.; Meng, C.; Mao, F.; Hu, W. Influence of severe plastic deformation on dynamic strain aging of ultrafine grained Al-Mg alloys. Acta Mater. 2014, 76, 54–67. [Google Scholar] [CrossRef]
  10. Meng, X.; Liu, B.; Luo, L.; Ding, Y.; Rao, X.; Hu, B.; Liu, Y.; Lu, J. The Portevin-Le Châtelier effect of gradient nanostructured 5182 aluminum alloy by surface mechanical attrition treatment. J. Mater. Sci. Technol. 2018, 34, 2307–2315. [Google Scholar] [CrossRef]
  11. Lebedkina, T.A.; Lebyodkin, M.A.; Lamark, T.T.; Janeček, M.; Estrin, Y. Effect of equal channel angular pressing on the Portevin–Le Chatelier effect in an Al3Mg alloy. Mater. Sci. Eng. A 2014, 615, 7–13. [Google Scholar] [CrossRef]
  12. Yuan, L.; Gao, X.; Zhang, X.; Yang, Y. Mechanical properties and Portevin-Le Chatelier effect of a Ni-Cr-Mo alloy containing ordered phase with Pt2Mo-type structure at elevated temperature. Mater. Sci. Eng. A 2017, 680, 115–120. [Google Scholar] [CrossRef]
  13. Xu, J.; Chen, G.; Fu, S. Complexity analysis of the Portevin-Le Chatelier in an Al alloy at different temperatures. Theor. Appl. Mech. Lett. 2021, 100–233. [Google Scholar] [CrossRef]
  14. Florián-Algarín, D.; Marrero, R.; Li, X.; Choi, H.; Suárez, O.M. Strengthening of aluminum wires treated with A206/alumina nanocomposites. Materials 2018, 11, 413. [Google Scholar] [CrossRef] [PubMed] [Green Version]
  15. Wu, J.; Zhou, S.; Li, X. Ultrasonic Attenuation Based Inspection Method for Scale-up Production of A206-Al2O3 Metal Matrix Nanocomposites. J. Manuf. Sci. Eng. 2014, 137, 1–10. [Google Scholar] [CrossRef]
  16. ASTM Committee B557-06. Standard Test Methods for Tension Testing Wrought and Cast Aluminum-and Magnesium-Alloy Products; ASTM International: West Conshohocken, PA, USA, 2010; pp. 1–15. [Google Scholar]
  17. Chihab, K.; Fressengeas, C. Time distribution of stress drops, critical strain and crossover in the dynamics of jerky flow. Mater. Sci. Eng. 2003, 356, 102–107. [Google Scholar] [CrossRef]
  18. ASM Handbook. Volume 2: Properties and Selection: Nonferrous Alloys and Special-Purpose Materials, 10th ed.; ASM International: Geauga County, OH, USA, 1990; Volume 2. [Google Scholar]
  19. ASTM Committee E8/E8M-9. Standard Test Methods for Tension Testing of Metallic Materials; ASTM International: West Conshohocken, PA, USA, 2013; pp. 1–27. [Google Scholar]
  20. Florián-Algarín, D.; Marrero-García, M.; Martínez-Santos, J.J.; Montejo Valencia, L.; Suárez, O.M. Al/Niobium Diboride Nanocomposite’s Effect on the Portevin-Le Chatelier Phenomenon in Al-Mg Alloys. J. Compos. Sci. 2019, 3, 70. [Google Scholar] [CrossRef] [Green Version]
  21. Bali, J.; Luka, P. Inverse critical strains for jerky flow in Al-Mg alloys. Scr. Mater. 2000, 42, 465–471. [Google Scholar] [CrossRef]
  22. Jarfors, A.E.W.; Andersson, N.; Bogdanoff, T.; Payandeh, M.; Seifeddine, S.; Leickt, A.; Tapper, A. The Portevin-Le Chatelier effect in a Rheocast Al-Si-Cu alloy. Light Met. 2015, 321–325. [Google Scholar] [CrossRef]
Figure 1. (a) A206 master alloy; (b) Al–0.5 wt. % Mg–20 wt. % A206; (c) Al–0.5 wt. % Mg–20 wt. % A206 after full annealing; (d) Al–0.5 wt. % Mg–20 wt. % A206 after cold rolling to 3 mm diameter; (e) Al–0.5 wt. % Mg–20 wt. % A206 after second full annealing; and (f) final sample of Al–0.5 wt. % Mg–20 wt. % A206 wires with 1 mm diameter.
Jcs 05 00163 g001
Figure 2. Measured critical strain and UTS at 0.125 mm/min strain rate.
Jcs 05 00163 g002
Figure 3. Measured critical strain and UTS at 0.250 mm/min strain rate.
Jcs 05 00163 g003
Figure 4. Measured critical strain and UTS at a 0.500 mm/min strain rate.
Jcs 05 00163 g004
Figure 5. Typical plastic region of the stress-time curve observed in the studied specimens.
Jcs 05 00163 g005
Figure 6. FFT of the plastic region of the tensile stress-time curve of the Al wires tested at 0.500 mm/min (3.33·10−5 s−1).
Jcs 05 00163 g006
Figure 7. FFT of the plastic region of the tensile stress-time curve of the Al–0.5 wt. % Mg–20 wt. % A206/1.0 wt. % γAl2O3 wires tested at 0.500 mm/min.
Jcs 05 00163 g007
Figure 8. Part of the stress-strain curve generated by the Al–0.5 wt. % Mg–20 wt. % A206/1.0 wt. % γAl2O3 wires and the stress-strain curve as-filtered.
Jcs 05 00163 g008
Figure 9. Resulting signal after subtracting the original and filtered curve.
Jcs 05 00163 g009
Figure 10. Absolute values of the resulting signal resulting from subtracting the original and filtered curve.
Jcs 05 00163 g010
Figure 11. PLC signal amplitude at a 0.125 mm/min strain rate.
Jcs 05 00163 g011
Figure 12. PLC signal amplitude at a 0.250 mm/min strain rate.
Jcs 05 00163 g012
Figure 13. PLC signal amplitude at a 0.500 mm/min strain rate.
Jcs 05 00163 g013
Figure 14. Determination of the energy released due to the PLC phenomenon.
Jcs 05 00163 g014
Figure 15. Energy released during the PLC phenomenon at a 0.125 mm/min strain rate.
Jcs 05 00163 g015
Figure 16. Energy released during the PLC phenomenon at a 0.250 mm/min strain rate.
Jcs 05 00163 g016
Figure 17. Energy released during the PLC phenomenon at a 0.500 mm/min strain rate.
Jcs 05 00163 g017
Figure 18. Histogram of the obtained amplitude of the PLC signal: (A) Al–0.5wt. % Mg–10wt. % A206 samples, (B) Al–0.5wt. % Mg–10wt. % A206/1 wt. % γAl2O3 samples, (C) Al–0.5wt. % Mg–20wt. % A206 samples, and (D) Al–0.5wt. %Mg–20wt. % A206/1 wt. % γAl2O3 samples.
Jcs 05 00163 g018
Figure 19. Transformed histogram of the obtained amplitude of the PLC signal: (A) Al–0.5wt. % Mg–10wt. % A206 samples, (B) Al–0.5wt. % Mg–10wt. % A206/1 wt. % γAl2O3 samples, (C) Al–0.5wt. % Mg–20wt. % A206 samples, and (D) Al–0.5wt. %Mg–20wt. % A206/1 wt. % γAl2O3 samples.
Jcs 05 00163 g019
Figure 20. The transformed amplitude of the PLC phenomenon at different strain rate: (A) 0.125 mm/min strain rate, (B) 0.250 mm/min strain rate, and (C) 0.500 mm/min strain rate.
Jcs 05 00163 g020
Publisher’s Note: MDPI stays neutral with regard to jurisdictional claims in published maps and institutional affiliations.

