Article

Impact Damage Ascertainment in Composite Plates Using In-Situ Acoustic Emission Signal Signature Identification

Department of Mechanical Engineering, University of South Carolina, Columbia, SC 29208, USA
*
Author to whom correspondence should be addressed.
J. Compos. Sci. 2021, 5(3), 79; https://doi.org/10.3390/jcs5030079
Submission received: 11 November 2020 / Revised: 9 March 2021 / Accepted: 9 March 2021 / Published: 12 March 2021
(This article belongs to the Special Issue Carbon Fiber Composites)

Abstract

:
Barely visible impact damage (BVID) due to low velocity impact events in composite aircraft structures are becoming prevalent. BVID can have an adverse effect on the strength and safety of the structure. During aircraft inspections it can be extremely difficult to visually detect BVID. Moreover, it is also a challenge to ascertain if the BVID has in-fact caused internal damage to the structure or not. This paper describes a method to ascertain whether or not internal damage happened during the impact event by analyzing the high-frequency information contained in the recorded acoustic emission signal signature. Multiple 2 mm quasi-isotropic carbon fiber reinforced polymer (CFRP) composite coupons were impacted using the ASTM D7136 standard in a drop weight impact testing machine to determine the mass, height and energy parameters to obtain approximately 1” impact damage size in the coupons iteratively. For subsequent impact tests, four piezoelectric wafer active sensors (PWAS) were bonded at specific locations on each coupon to record the acoustic emission (AE) signals during the impact event using the MISTRAS micro-II digital AE system. Impact tests were conducted on these instrumented 2 mm coupons using previously calculated energies that would create either no damage or 1” impact damage in the coupons. The obtained AE waveforms and their frequency spectrums were analyzed to distinguish between different AE signatures. From the analysis of the recorded AE signals, it was verified if the structure had indeed been damaged due to the impact event or not. Using our proposed structural health monitoring technique, it could be possible to rapidly identify impact events that cause damage to the structure in real-time and distinguish them from impact events that do not cause damage to the structure. An invention disclosure describing our acoustic emission structural health monitoring technique has been filed and is in the process of becoming a provisional patent.

1. Introduction

1.1. Background and Motivation

Recent advances in manufacturing technologies have led to the increasing usage of composite materials being used in aerospace primary and secondary structures due to their high strength to weight ratio and lightweight. Structures manufactured using composite materials, whether thermosets or thermoplastics, must be made in a nearly perfect state such that they do not introduce any dangerous risks during the operational lifetime of the aerospace structure. The manufacturing process of composite structures can introduce significant manufacturing flaws and operational damage during its service life. These types of defects may lead to catastrophic failures if they are not detected at the earliest stages of development using efficient structural health monitoring techniques.
Barely visible impact damage (BVID) is a type of damage that occurs most often in composite structures. It can occur during the manufacturing stages or during the operational lifetime of the composite structure. During BVID causing impact event, the debris (impactor) may lead to internal damage within the composite structure such as complex delaminations, matrix cracks, fiber fracture and a combination of all three. BVID comprises of surface indentations, which are not clearly visible due to the coating of paint during aircraft inspections done visually. If gone unnoticed, the internal damage can grow and propagate leading to catastrophic failures.
The damage tolerance concepts introduced around 20–30 years ago paved the way for understanding BVID and how it led to complicated damage in composites [1,2]. Following these developments, inspection standards needed to be developed for the inspection of composite structures where BVID became an important aspect and needed to be distinguished from visible impact damage (VID). A damage is characterized as BVID if it is visible at a distance of less than 1.5 m using regular vision. Similarly, a damage is characterized as VID if it is visible at a distance of 1.5 m or greater [3]. Depending on how a damage is characterized (as BVID or VID), important decisions regarding repairs to be conducted on composite in the areas where impact events occur, are taken. VID’s need to be repaired immediately based on this understanding. However, there may be a situation when the damage is characterized as BVID based on visually conducted inspections but may in fact have an impact damage size of 1” (25 mm) or greater which could significantly aggravate the strength of the composite part (see Figure 1). Since this damage is now characterized as BVID, it may get ignored from being repaired. Figure 1 clearly demonstrates that 1” impact damage diameter can seriously reduce the strength of a composite structure compared to any other damage type (delamination, porosity, open hole), having the same size. This clearly demonstrates the seriousness and significance detecting and monitoring impact damage having a diameter of 1” or greater [4,5].
Nondestructive evaluation (NDE) and structural health monitoring (SHM) methodologies needed to be developed to effectively detect and monitor impact damage due to the increasing occurrences of BVID in composite structures. Ultrasonic NDE was one of the first few methods to be used for impact damage detection [6,7,8]. Ultrasonic guided wave (GW) propagation methodologies in composite laminates have been extensively used to observe how different wave modes interact with impact damage in composites [9,10,11,12]. In recent years, Innovative eddy current testing (ECT) methods have been explored extensively by researchers to detect different types of manufacturing flaws in CFRP composites [13,14,15]. These methods can be extended to detect impact damage in conductive fiber reinforced composite materials. Microwave nondestructive evaluation (MNDE) techniques have also been investigated by researchers to detect low velocity and high velocity impact damage in composites due to environmental effects such as hail stone impact and bird hits [16,17,18,19]. Advanced NDE methods based on heat dissipation such as Infrared thermography are also being explored by scientists as a viable option of detecting impact damage in a non-contact, rapid manner [20,21,22]. X-ray micro computed tomography is also being developed to give a 3D visualization of impact damage in composite structures through multiple B-scans and C-scans that can be observed at different orientations [23,24]. The authors of this paper are also exploring advanced guided wave propagation methods [25,26,27,28] for and long-distance propagation of the guided waves in the composite structure which will enable large area examination of the composite structures subjected to controlled impact damage creation.
In recent years extensive work has been done to understand effective acoustic emission methods for structural health monitoring of impact damage in composite materials. Prosser et al. [29] analyzed AE signals created by impact sources in thin aluminum structures and graphite/epoxy composites subjected to low and high-velocity impacts. Rosa et al. [30,31] have primarily focused on the post-impact behavior of natural fiber composites and hybrid composites using acoustic emission methods. Other researchers [32,33] used acoustic emission sensor networks to reconstruct the force-time history to better understand the loading phenomena from the impact event and compare it to the experimental force-time history. The uniqueness in our research is to use existing PWAS sensors to record AE signals in real-time during impact events and ascertain if a sizable damage has occurred or not. This will greatly reduce system downtime and ensure that necessary composite repairs are conducted.

1.2. Objectives of This Paper

In this paper, the authors have described an AE based structural health monitoring method [34] that can analyze the AE signal signatures obtained from an impact event and can ascertain if the impact event has indeed caused an extensive damage inside the composite structure or not. To do this, preliminary drop weight impact tests were conducted on various 2 mm thick quasi-isotropic CFRP composite coupons conforming to the ASTM D7136 standard for drop weight impact testing [35]. These preliminary experiments were useful in estimating the mass, height and energy combination to obtain a certain size (approximately 1” damage diameter) of impact damage in the composite coupon iteratively.
After estimating the mass, height and energy combination for creating approximately 1” impact damage diameter in a 2 mm thick composite coupon, subsequent impact tests were conducted on AE instrumented composite coupons on which four PWAS were bonded at specific locations based on the fiber orientation angles in the composite coupons. The drop weight impact testing system along with the AE signal capture using the MISTRAS AE system is displayed in Figure 2. Two sets of experiments were conducted–one experiment with low energy (1 J) impact that created no damage in an instrumented composite coupon and the second test with a higher energy (16 J) impact which created approximately 1” impact damage size. AE signal analysis and mode separation study were performed to understand both the impact events and clearly differentiate between a catastrophic impact that creates sizable damage and a benign impact that creates no damage.

2. Manufacturing Process and Experimental Setup

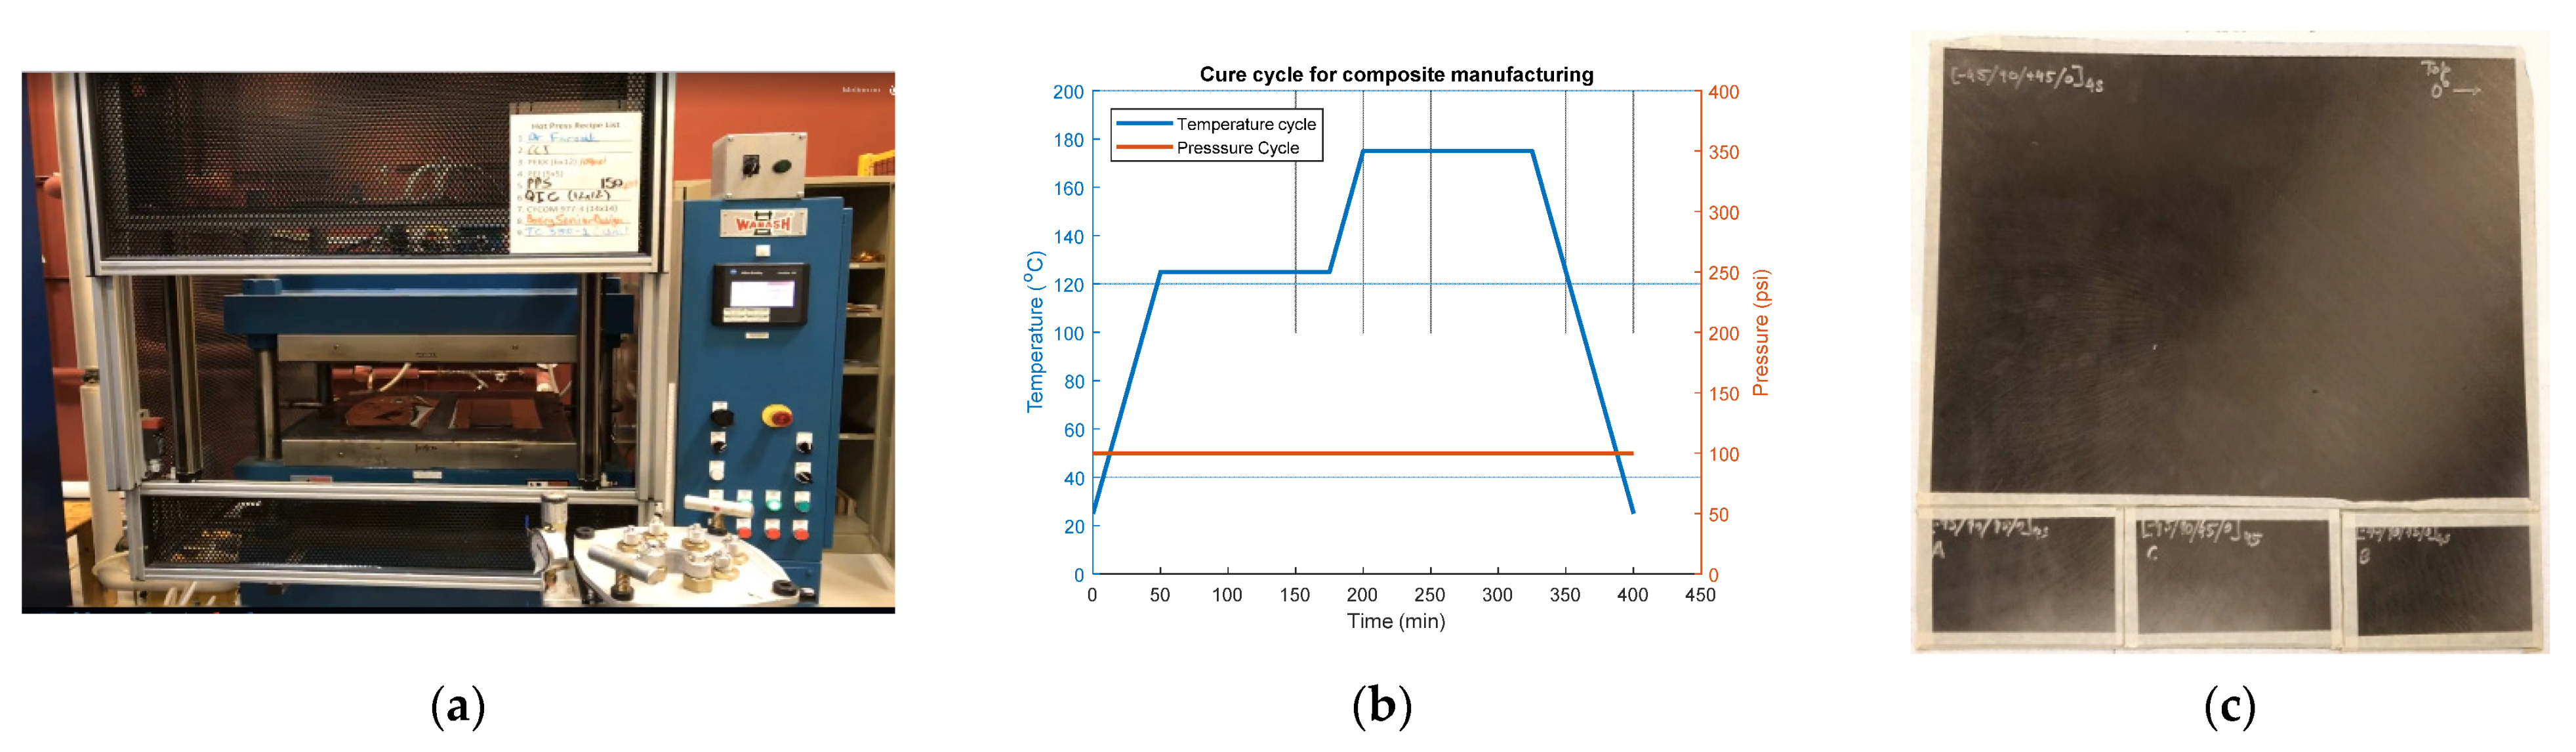
2.1. Manufacturing of CFRP Composite Laminates

CFRP Composite laminates were fabricated using the CYCOM® 5320-1 epoxy resin system with the Hexcel IM7 12K fiber in a Wabash hot press using the cure cycle provided by the manufacturer of the prepreg. To manufacture quasi-isotropic composite plates with the correct thicknesses, a stacking sequence with the appropriate number of layers had to be chosen [36,37,38]. A [−45/90/+45/0]2S stack up was chosen for fabricating the composite laminate with 16 layers having a nominal thickness of approximately 2 mm. From the cured composite laminate, 6” × 4” coupons were cut out for conducting standardized impact tests [35]. The Wabash hot press machine, cure cycle and the cured composite plate with the 6” × 4” cut-outs is displayed in Figure 3.

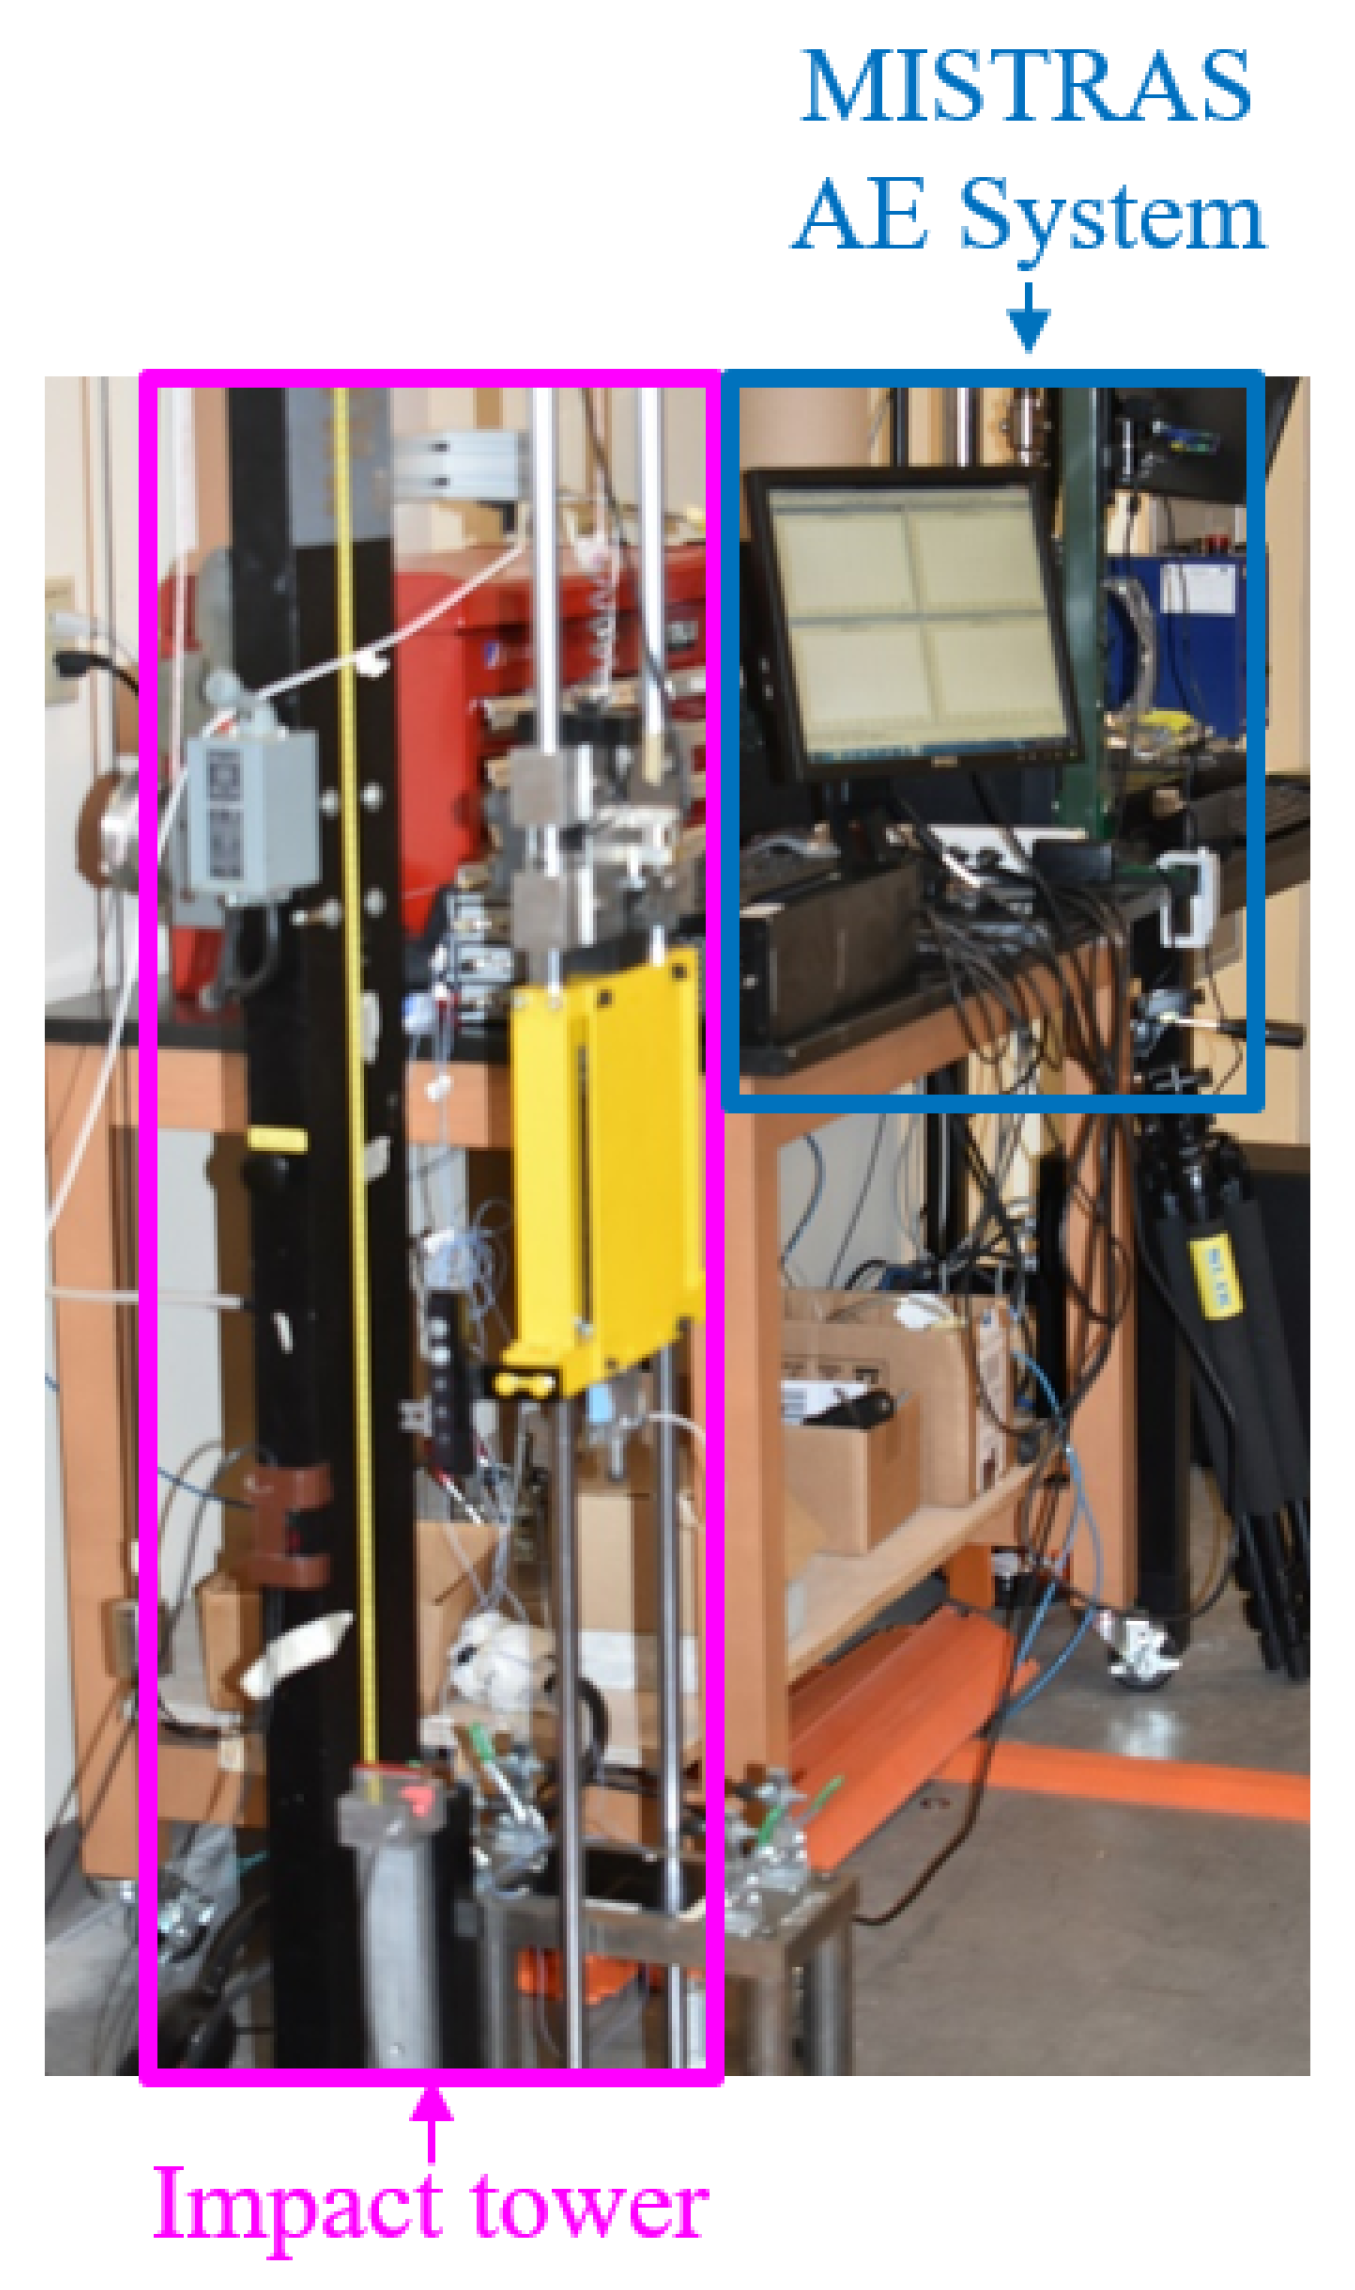
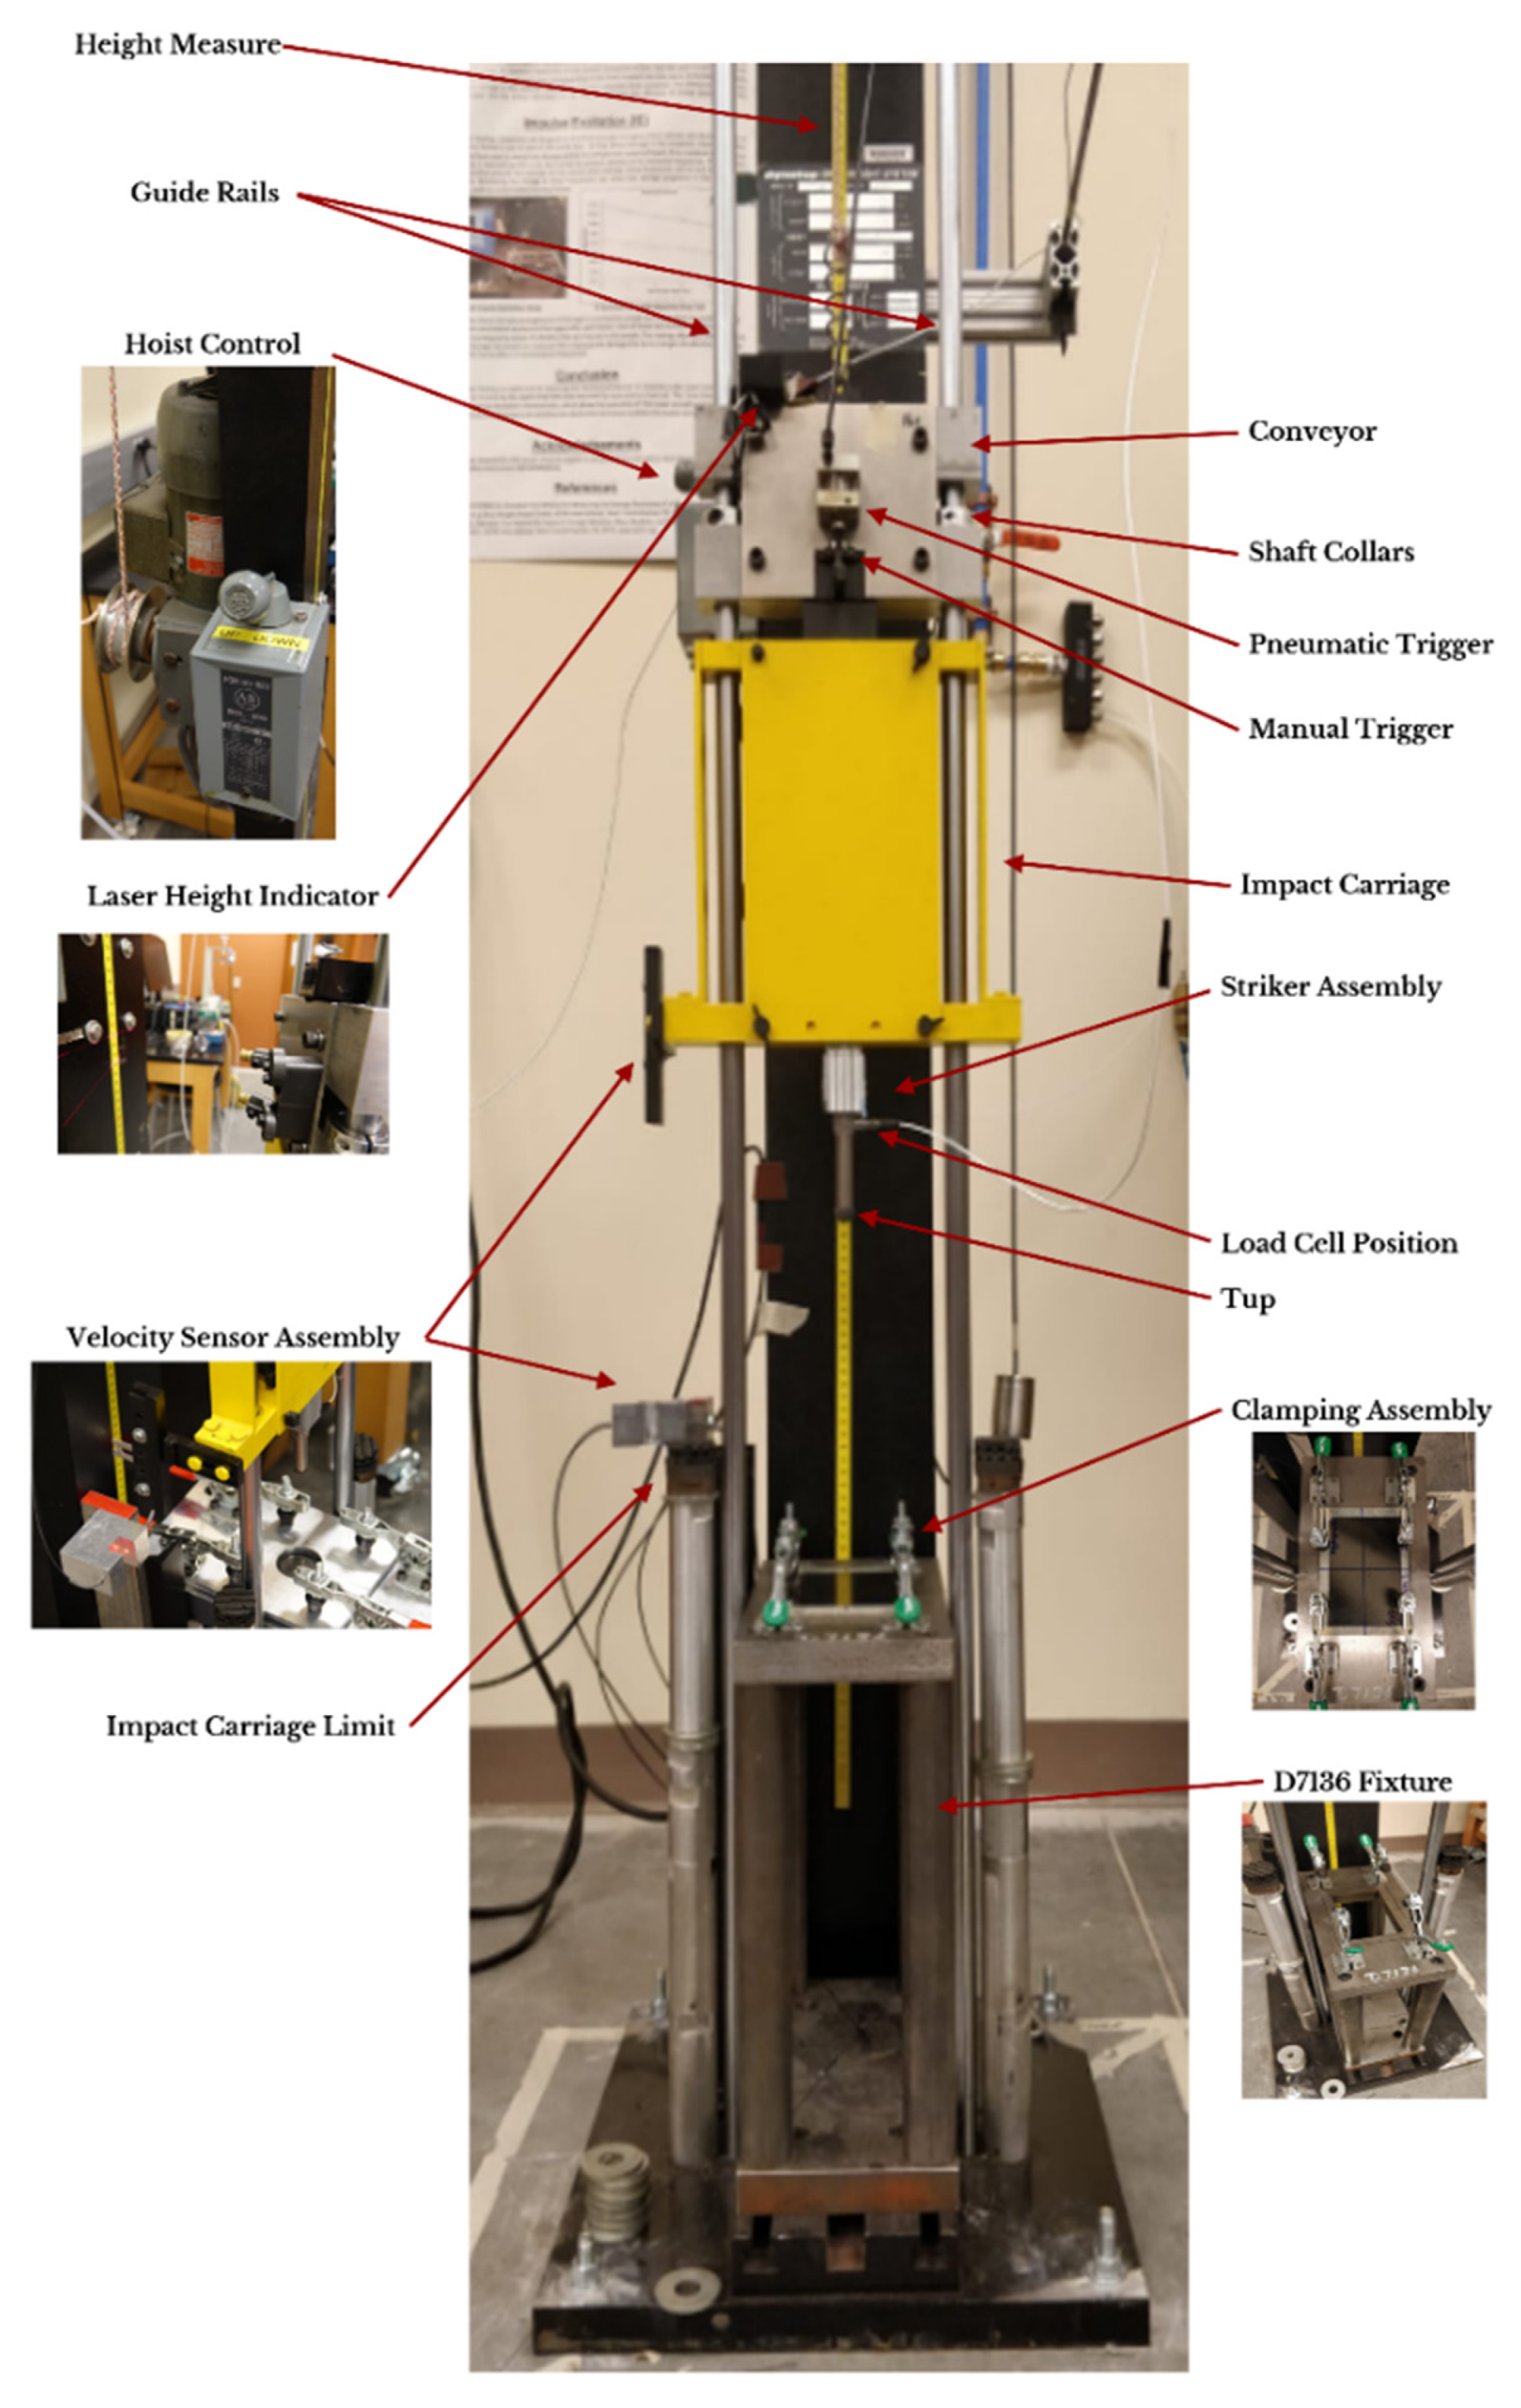
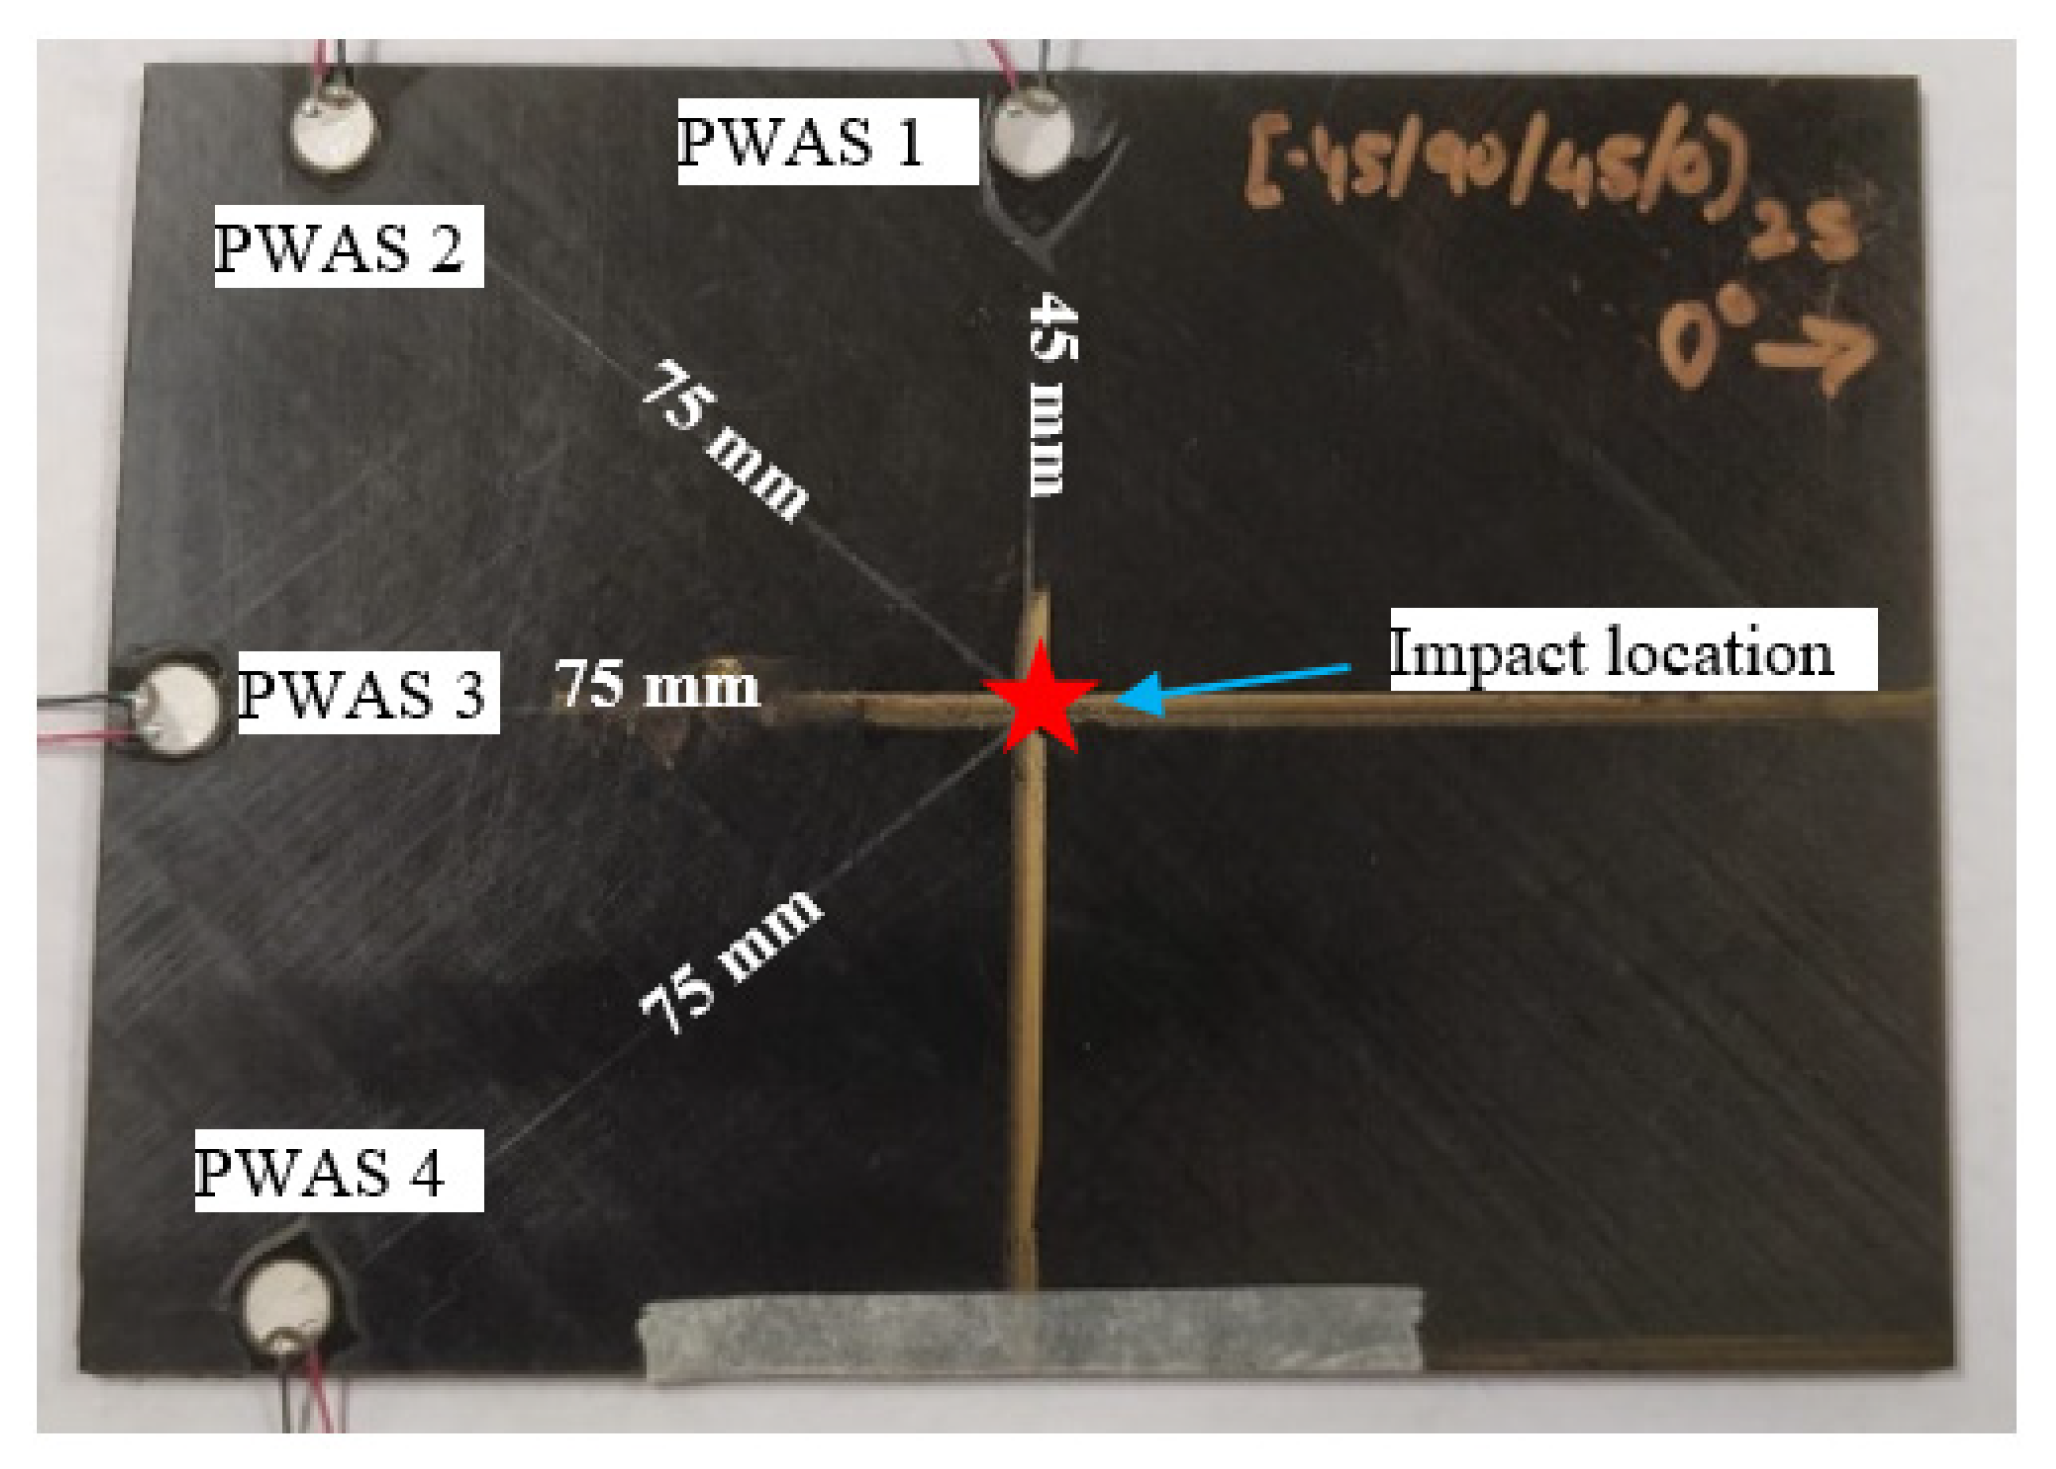
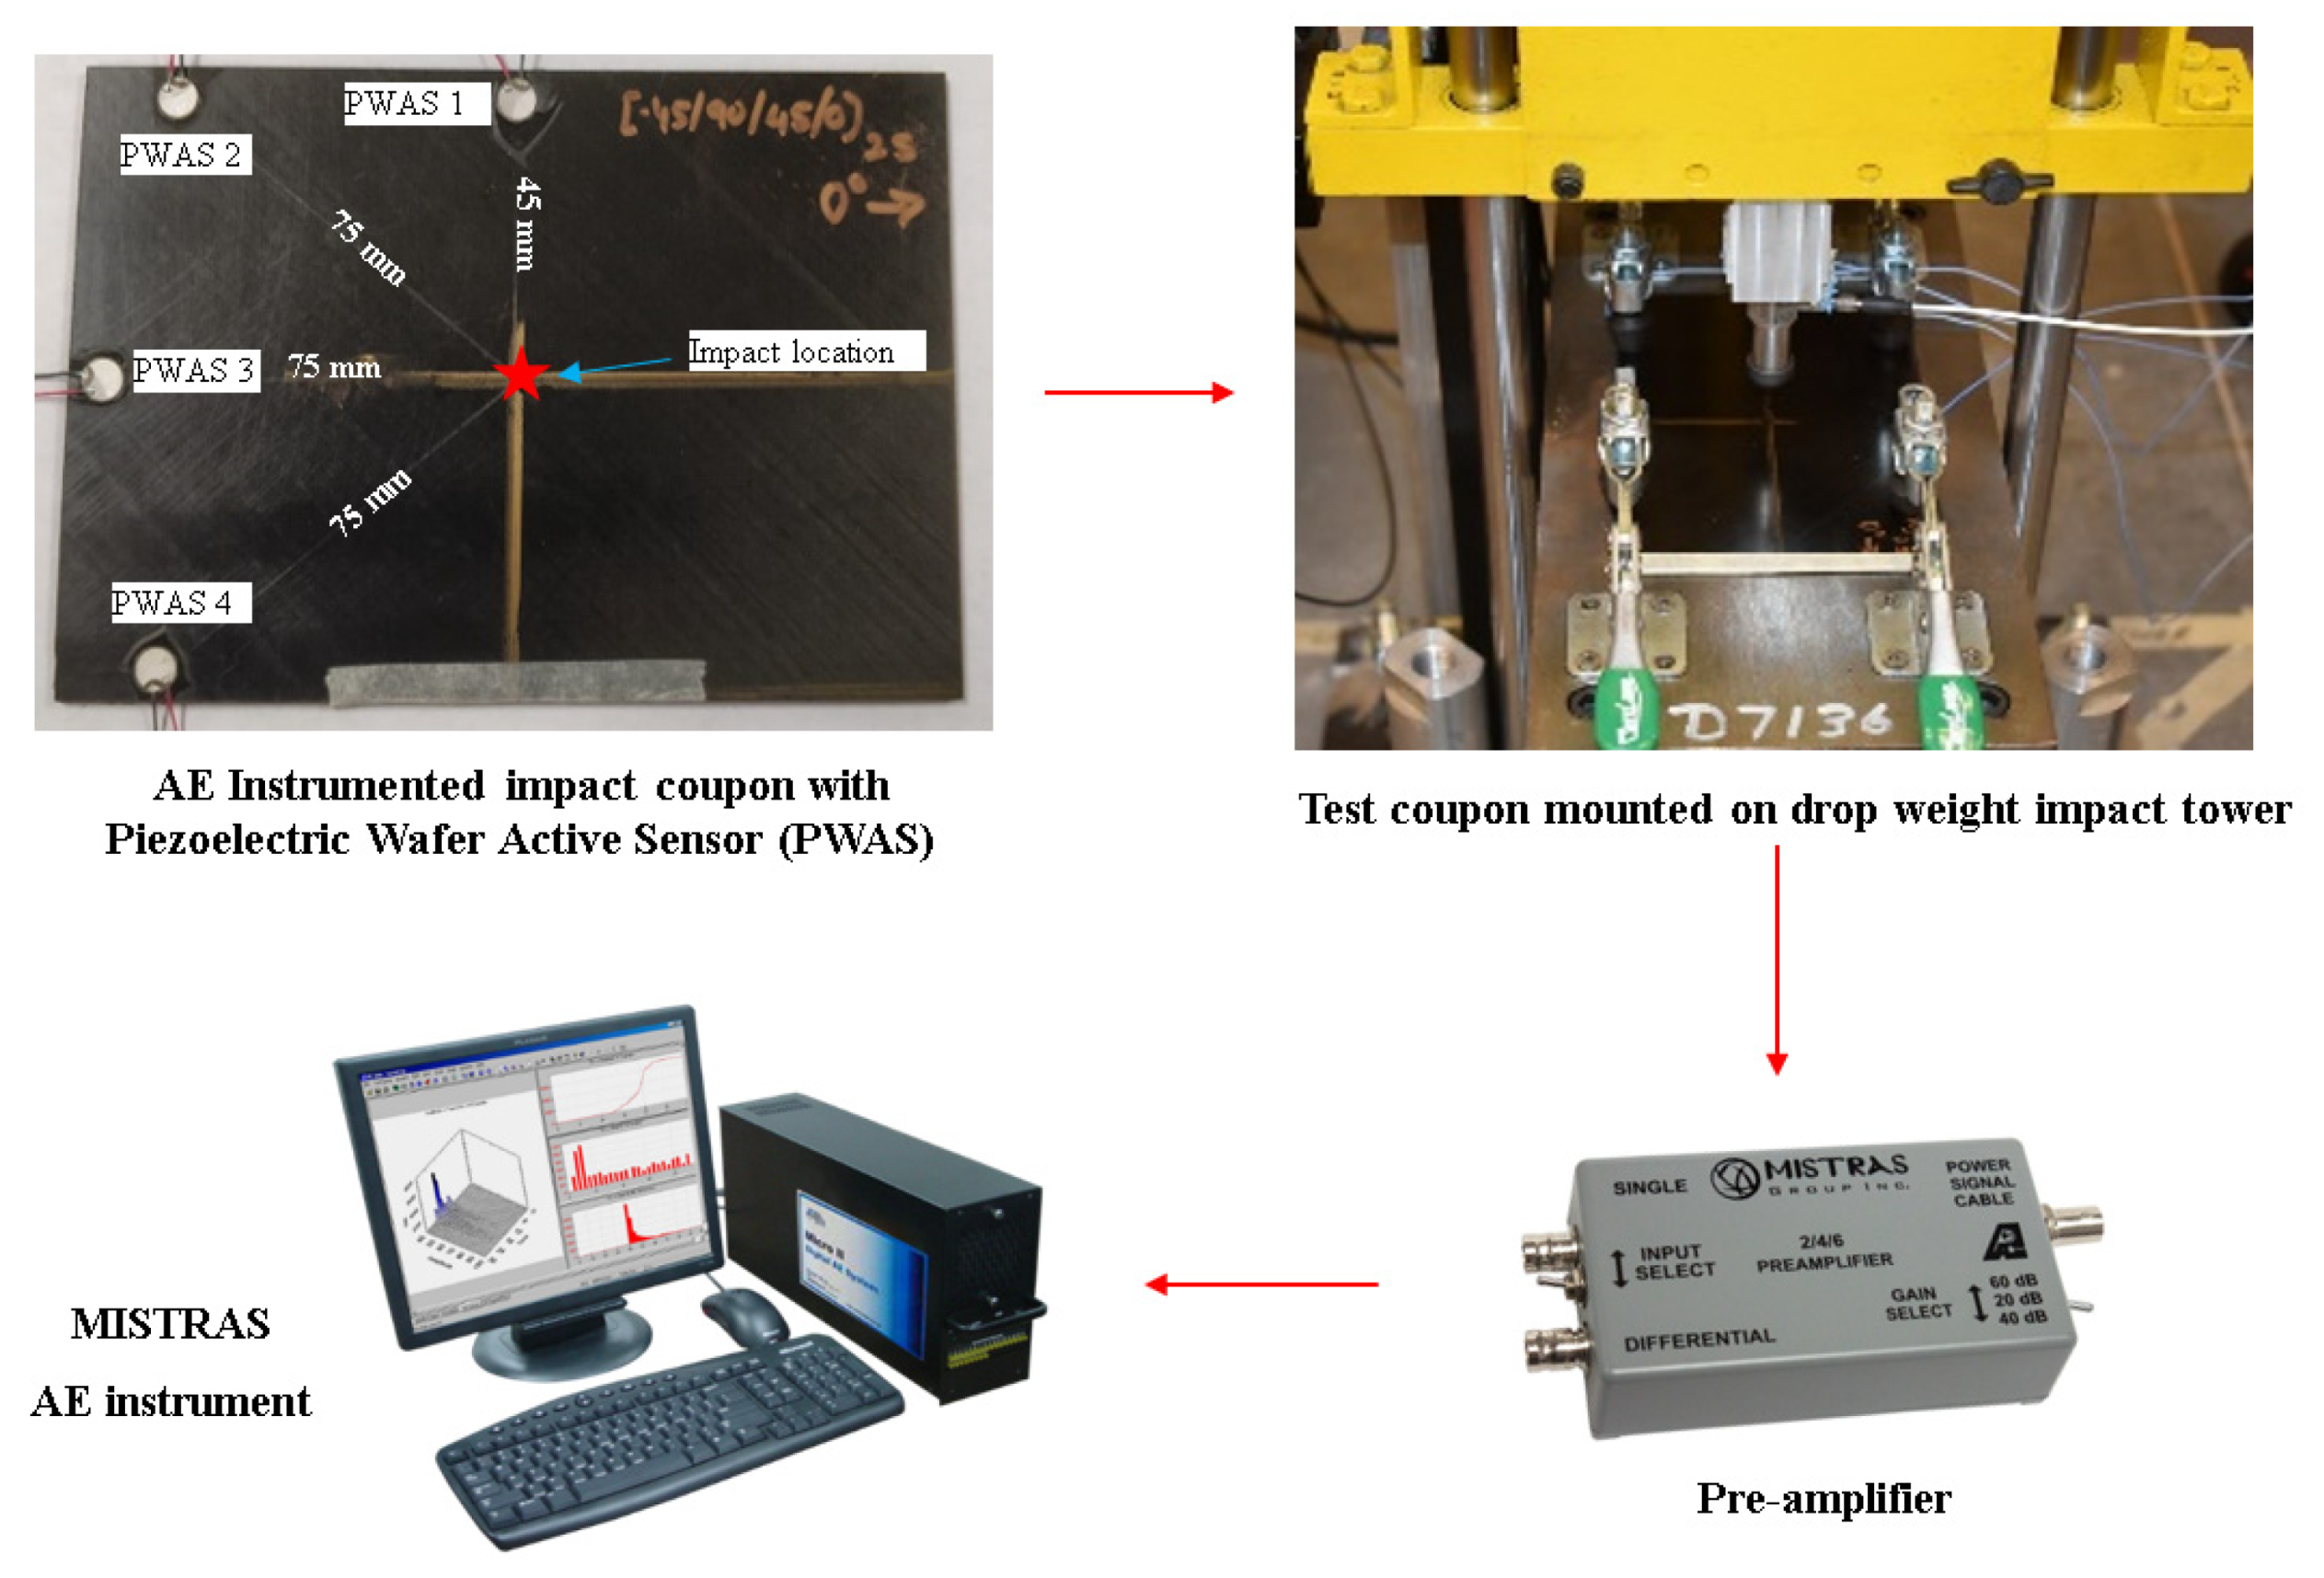
2.2. Experimental Setup for Acoustic Emission Recording of Impacted Composite Coupon

Preliminary drop weight impact experiments were conducted on numerous 2 mm 6” × 4” quasi-isotropic CFRP composite coupons [5] to determine the mass, height and energy combination to obtain a certain size of impact damage. These impact tests were conducted on a drop weight impact tower conforming to the ASTM D7136 standard as displayed in Figure 4. After this, real-time acoustic emission experiments were supposed to be carried out on more 2 mm 6” × 4” quasi-isotropic CFRP composite coupons. In order to do this, four piezoelectric wafer active sensors (PWAS), 7-mm in diameter and 0.5-mm in thickness, were bonded on each composite coupon at different locations corresponding to fiber orientation angles in the stacking sequence of the composite. PWAS 1 was bonded 45-mm from the impact location in the 90-degree fiber direction. PWAS 2 was bonded 75-mm away from the impact location was installed in the −45-degree fiber direction. PWAS 3 was bonded 75-mm away from the impact location in the 0-degree fiber direction. PWAS 4 was bonded 75-mm away from the impact location in the 45-degree fiber direction as can be observed in Figure 5. In this way the impact coupons were instrumented to carry out real-time acoustic emission recording of impact tests to be conducted on them.
To conduct the real-time acoustic emission experiment, the instrumented coupon with the four PWAS was clamped on the ASTM D7136 fixture on the drop weight impact testing machine. The wires from the four PWAS were connected to a pre-amplifier and the connections from the pre-amplifier were connected to the MISTRAS AE system for capturing the AE signals during the drop weight impact testing experiment so that all the signals associated with the impact event using the four PWAS bonded in the different fiber orientation angles could be analyzed. The acoustic preamplifier is a bandpass filter, which can filter out signals between 30 kHz to 700 kHz. Provided with 20/40/60 dB gain (can be selected using a switch), this preamplifier operates with either a single-ended or differential sensor. In the present experiment, 40 dB gain was selected. The preamplifier was connected to the MISTRAS AE system. A sampling frequency of 10 MHz was chosen to capture any high-frequency AE signals. The timing parameters set for the MISTRAS system were: peak definition time (PDT) = 200 µs, hit definition time (HDT) = 800 µs, and hit lockout time (HLT) = 1000 µs. This complete experimental setup with the AE instrumentation used is displayed in Figure 6.

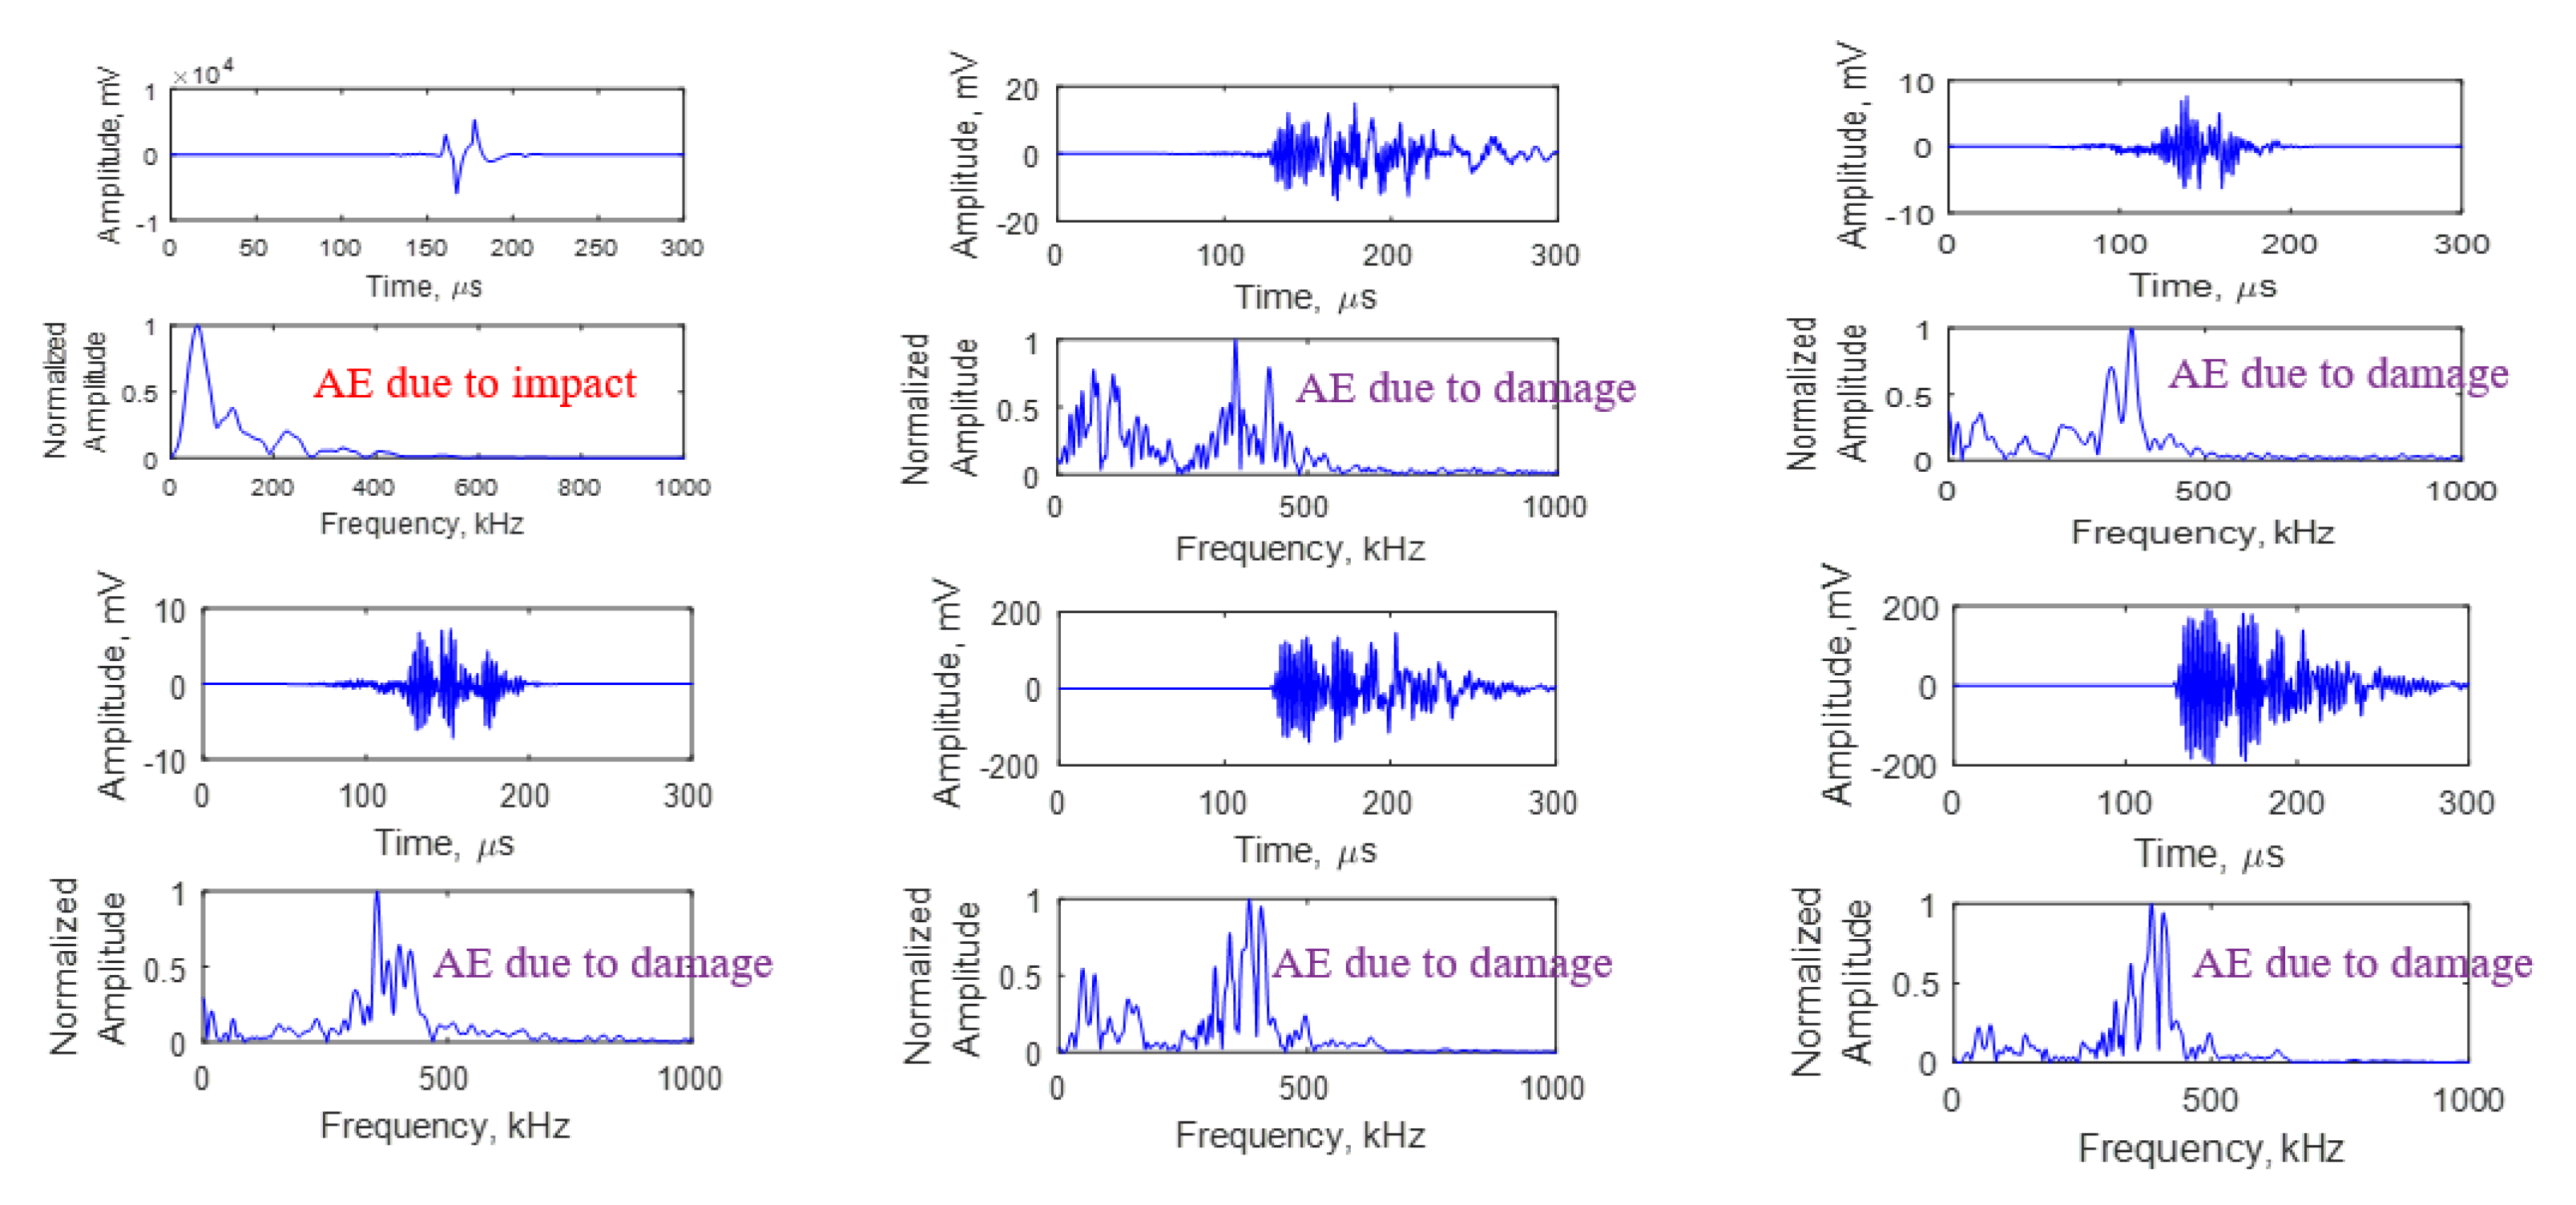
3. AE Signal Analysis from Instrumented Impact Tests

3.1. 1 J Impact Test on AE Instrumented 2 mm Composite Coupon–No Damage

The first instrumented impact test conducted on a 2 mm composite coupon is a low energy impact i.e., about 1 J impact that produces no damage in the composite coupon. To conduct this impact test, the instrumented coupon displayed in Figure 5 was clamped on the ASTM D7136 fixture and the real-time AE signal hit were acquired by all the four PWAS using the MISTRAS AE system as displayed in the experimental setup given in Figure 6. Since the impact energy is only 1 J, the height from which the impactor is dropped on the composite coupon is only a few centimeters. In such a scenario, it becomes very difficult to avoid a rebounding or secondary impact on the composite coupon after the first impact. The AE hits acquired at all the four PWAS for this 1 J impact event is displayed in Figure 7.
In Figure 7 there are two successive AE impact hits due to the rebound of the impactor on the composite coupon. These two hits are obtained by all the four PWAS and are clearly separated from other low amplitude hits which could consist of background noise or boundary reflections from the edges of the composite coupon, since we are assuming that this low energy of approximately 1 J did not create any damage in the composite coupon.
After this, the waveforms of the impact hits were extracted from the MISTRAS AE system. The waveforms of the 1st and 2nd impact hits and their FFT’s are presented in Figure 8 and Figure 9. We can clearly observe that the signals from these two successive impact hits had a major frequency content in the low-frequency range below 200 kHz which indicates low-frequency flexural modes in the composite coupon. We can also observe that the signal amplitude for the 1st impact hit was higher at PWAS 1 which was in the 90-degree direction and PWAS 3, which was in the 0-degree direction.

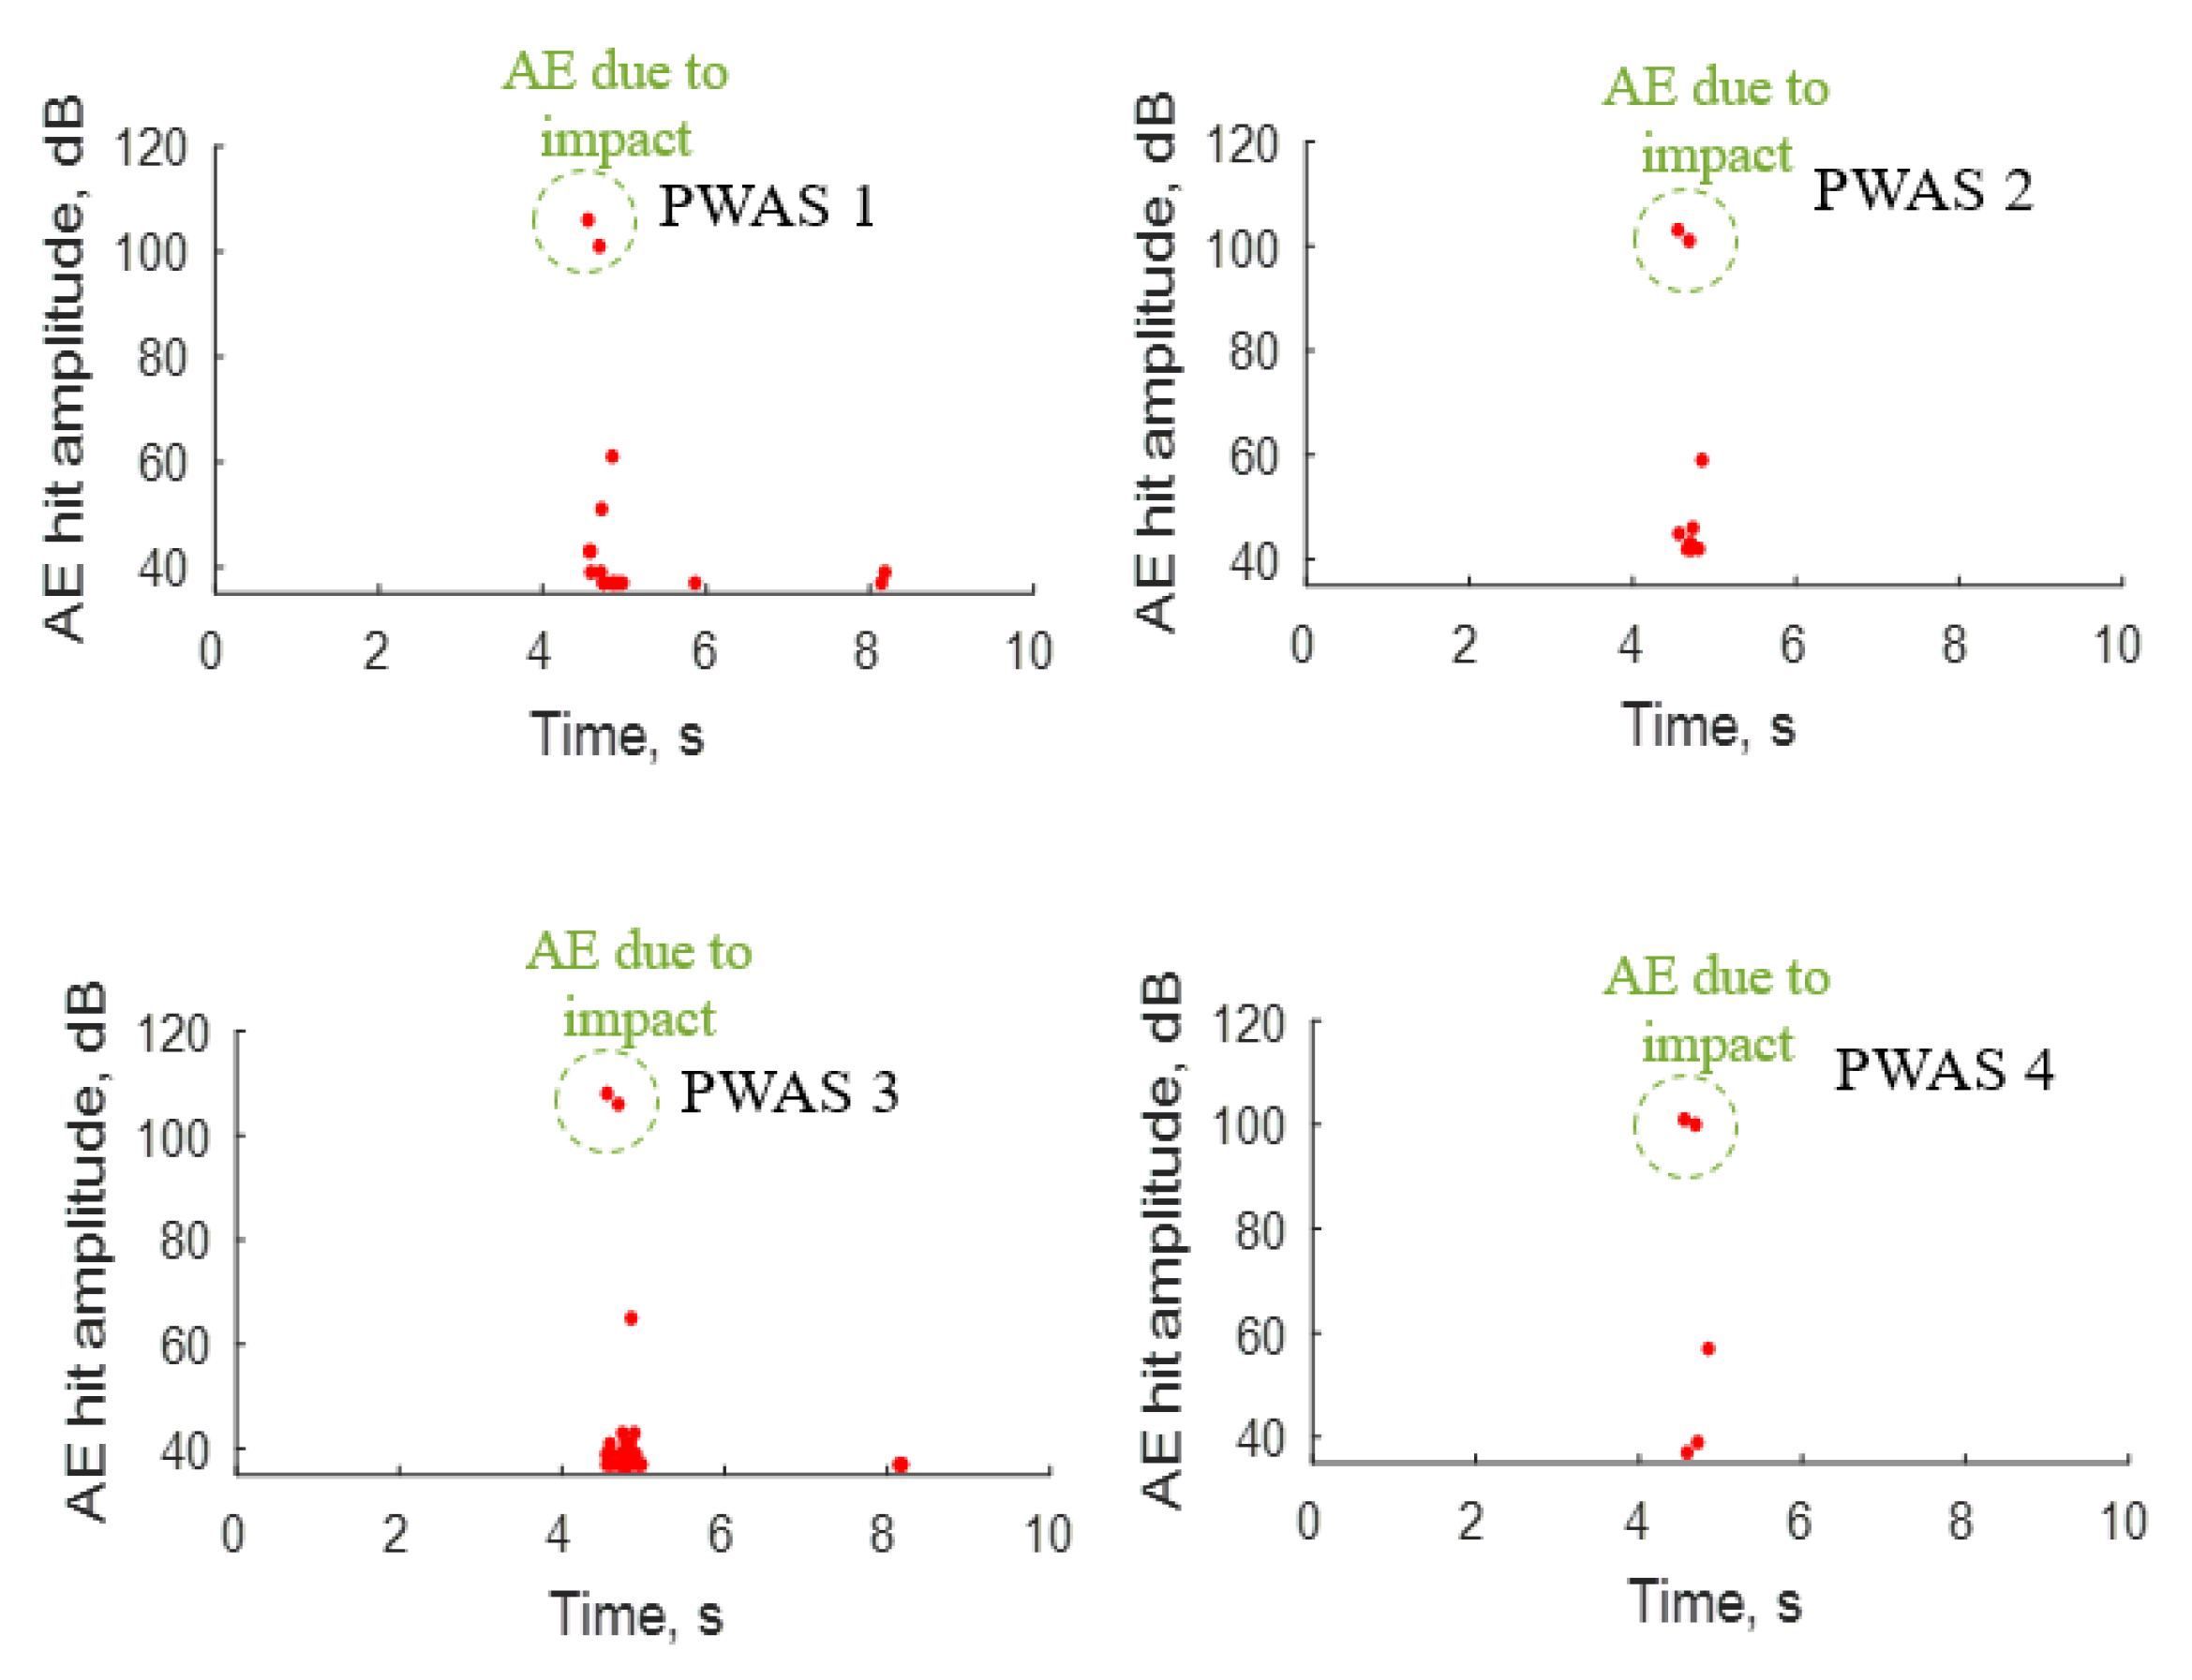
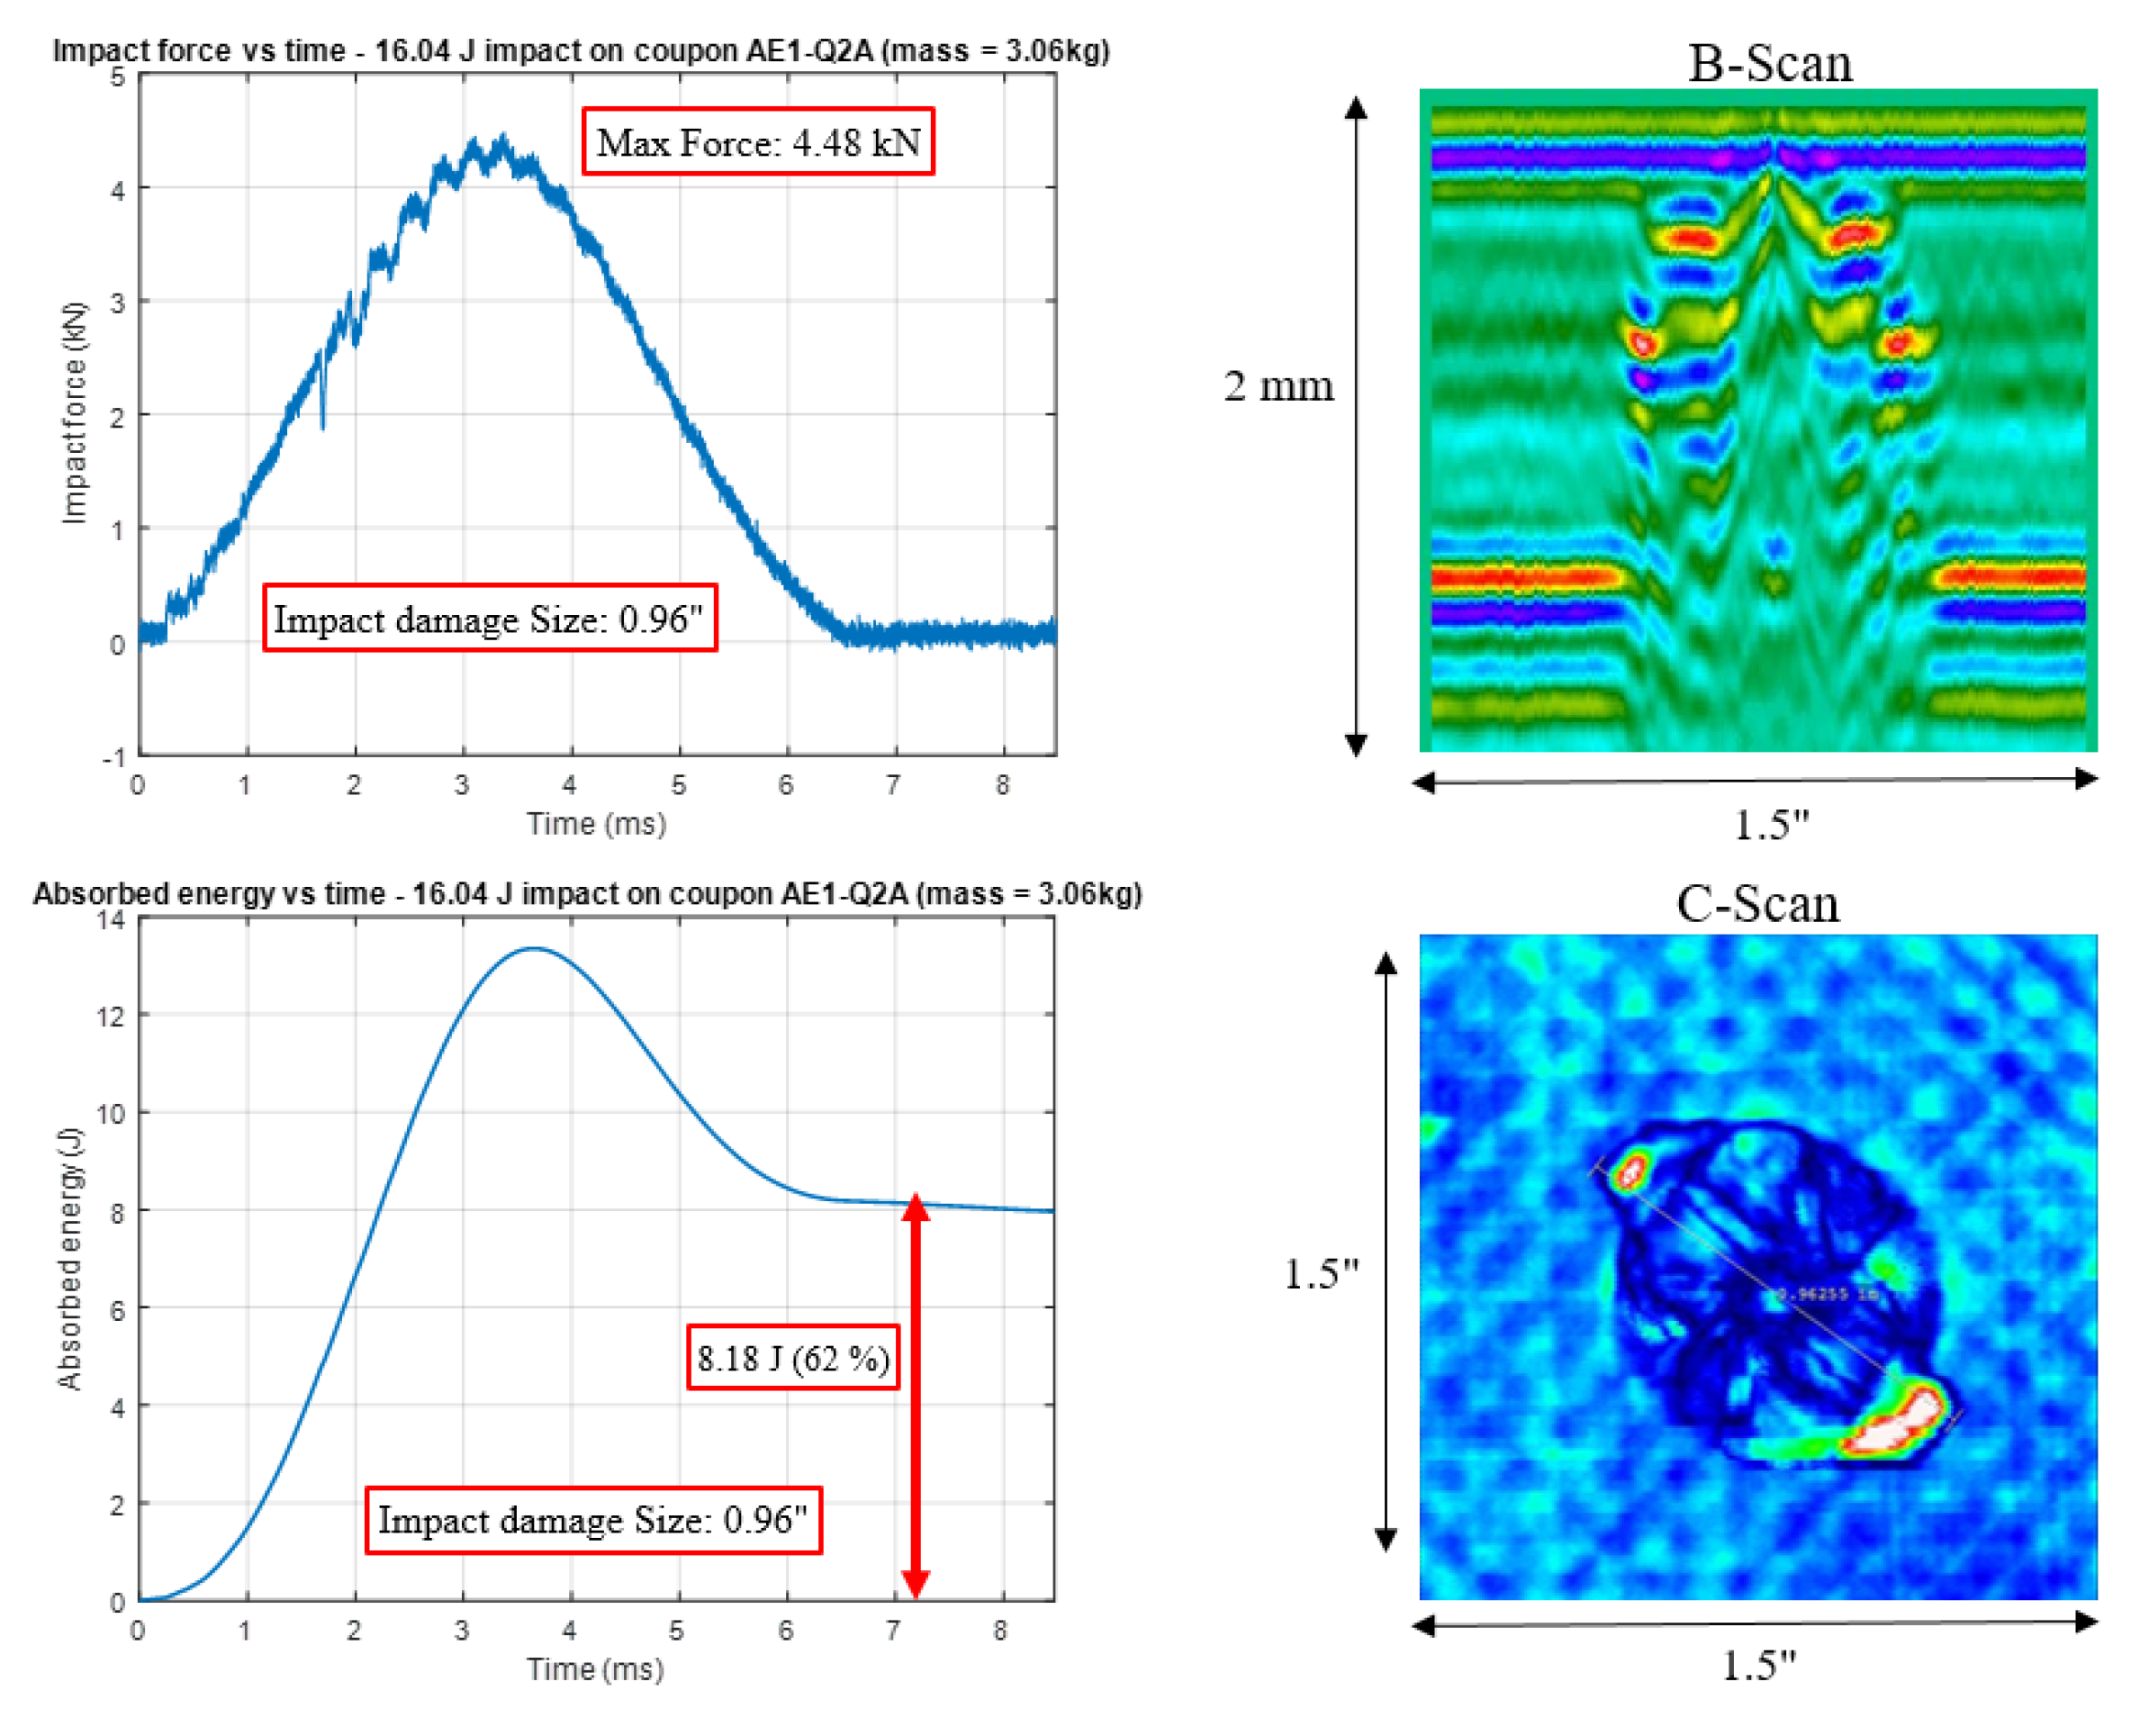
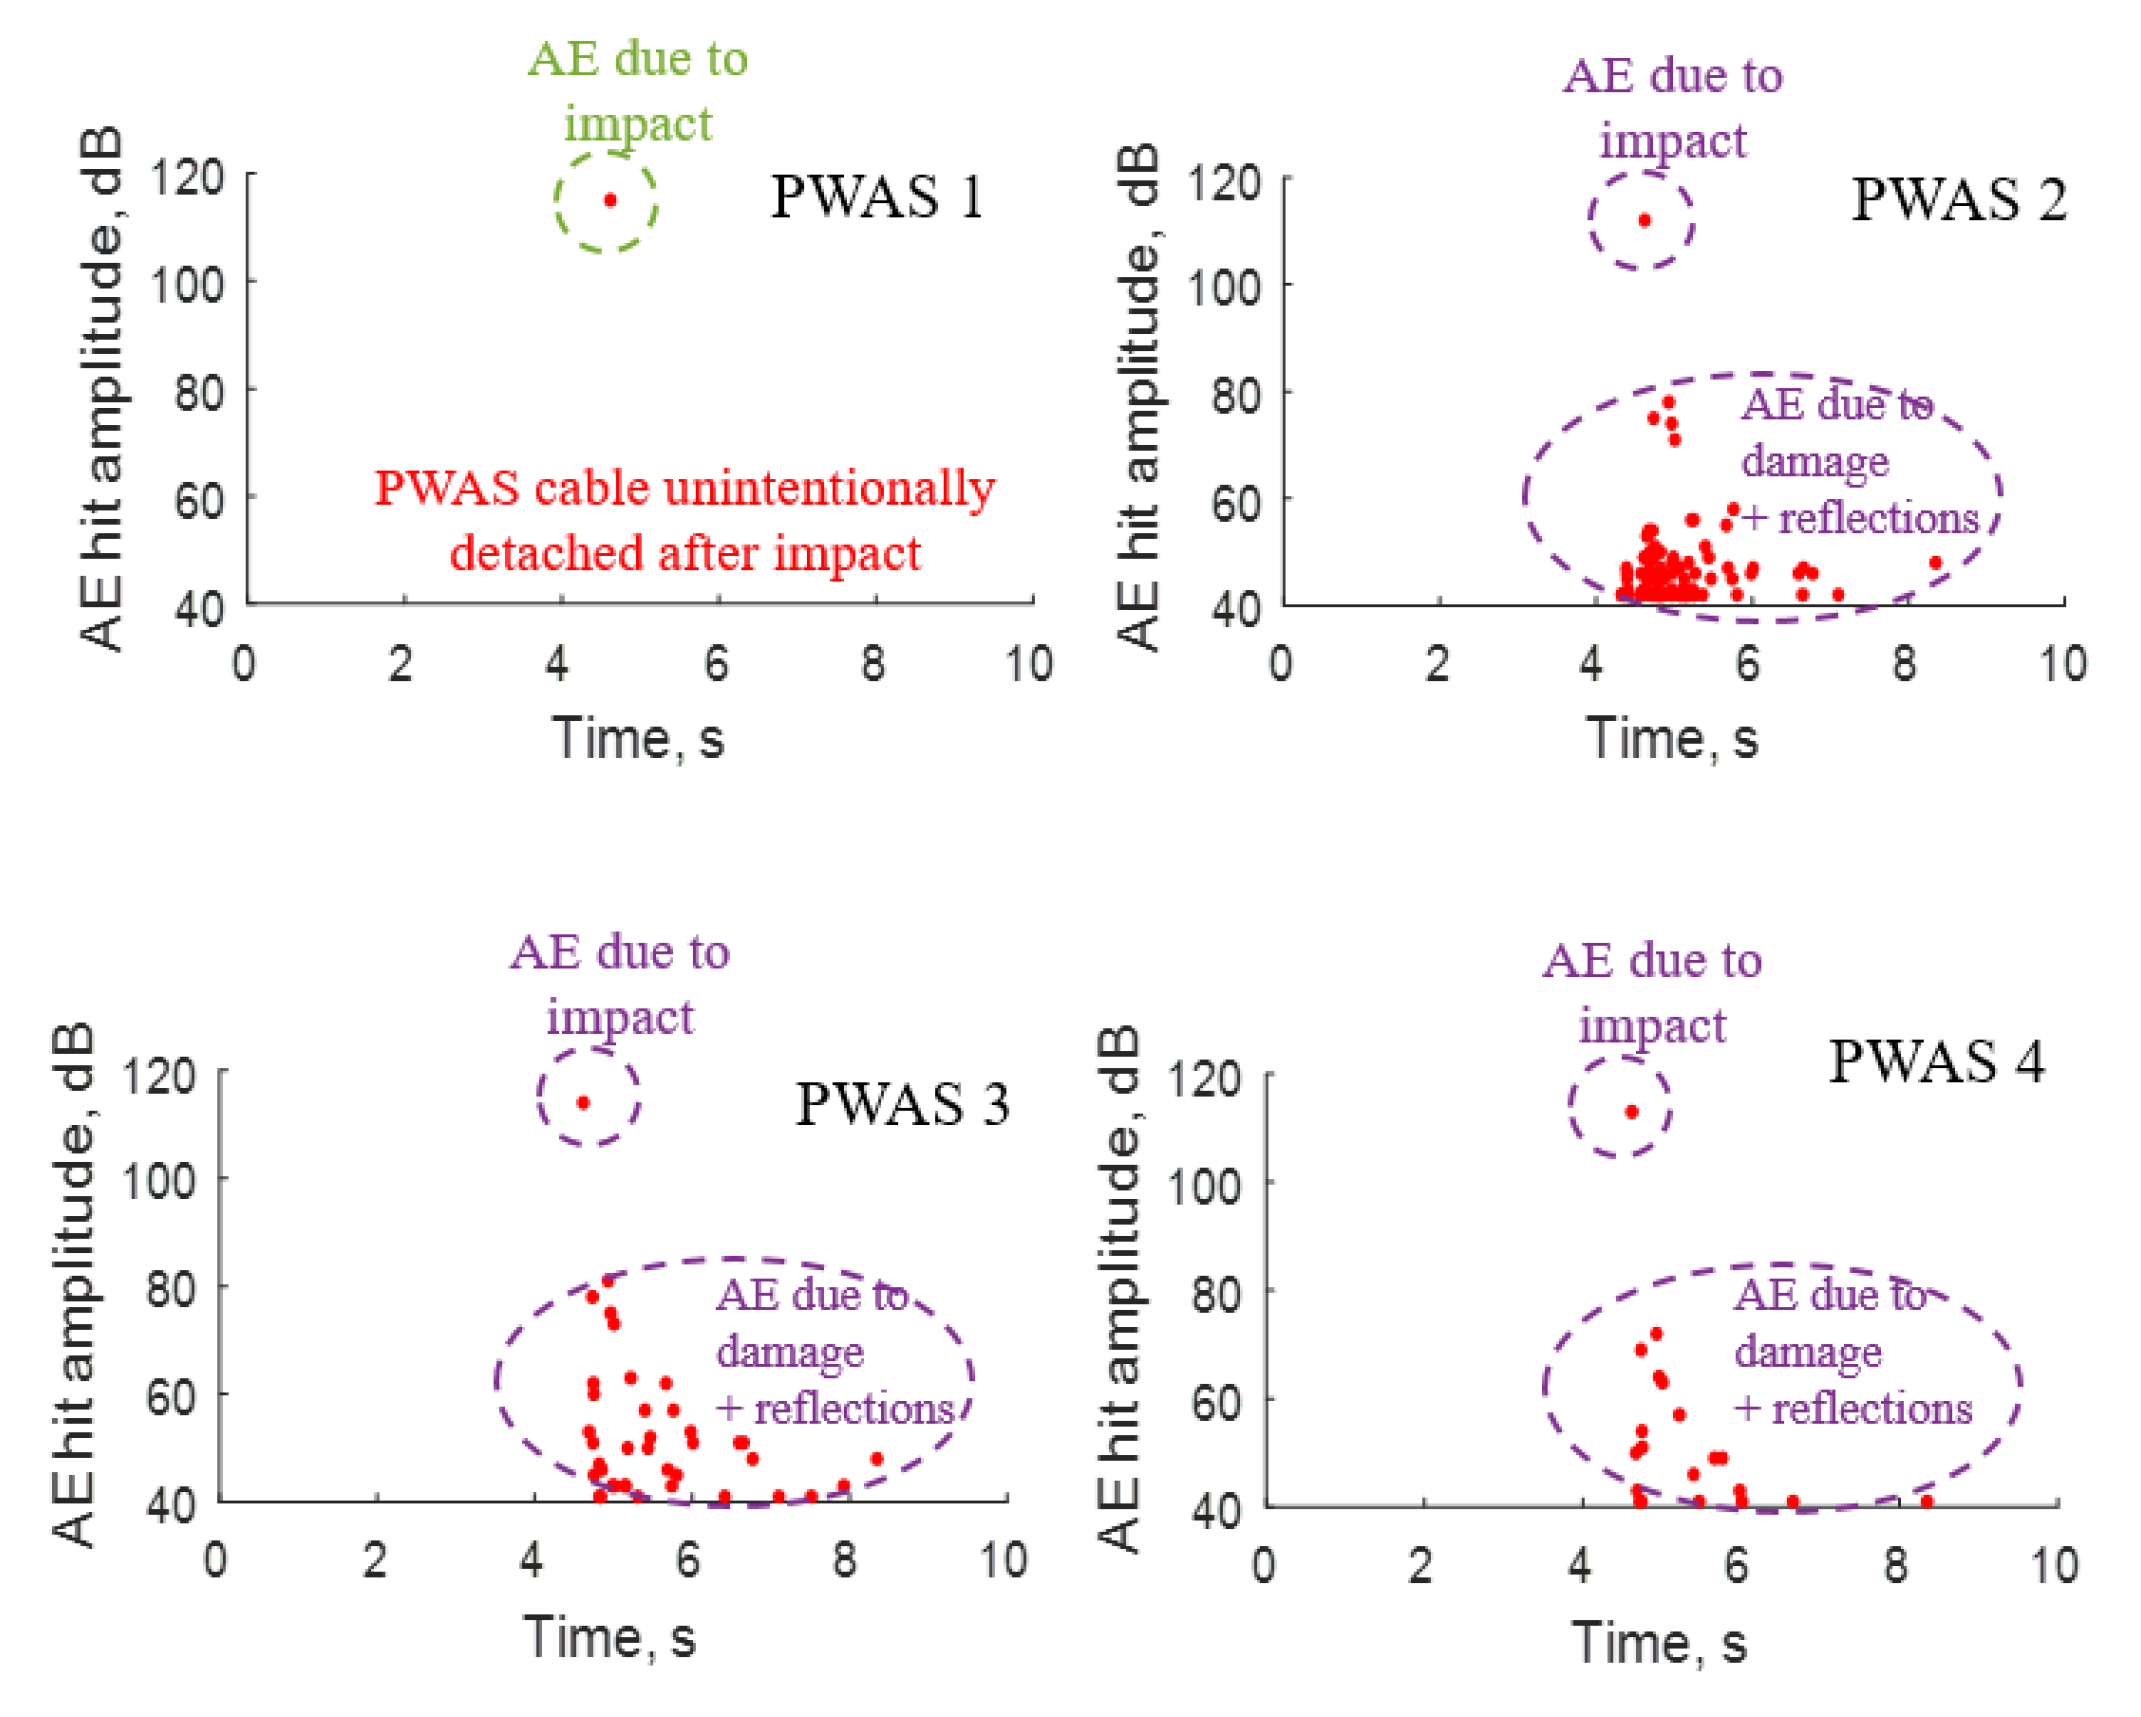
3.2. 16 J Impact Test on AE Instrumented 2 mm Composite Coupon–1” Impact Damage

The second instrumented impact test conducted on a 2 mm composite coupon is a 16 J energy impact based on the preliminary impact tests conducted on various 2 mm composite coupons, as described in a previous work [5]. The energy of 16 J was chosen such that it produces an impact damage size of approximately 1” in the 2 mm composite coupon. To conduct this impact test, the instrumented coupon labeled AE1-Q2A similar to the coupon displayed in Figure 5 was clamped on the ASTM D7136 fixture and the real-time AE signals during the impact event were acquired by all the four PWAS using the MISTRAS AE system as displayed in the experimental setup given in Figure 6. Since the impact energy for this impact event was 16 J, the height from which the impactor is dropped on the composite coupon is higher than the previous impact test and it was easily possible to catch the impact cart with weights after the 1st impact to avoid a secondary or rebound impact on the composite coupon. The AE hits were acquired at all the four PWAS for this 16 J impact event. The force-time history for this impact event was acquired by the dynamic load cell attached to the impactor and the energy-time was deduced using the force-time history data and the impact velocity measured by the velocity sensor.
Figure 10 shows four plots related to coupon AE1-Q2A, displaying the force-time plot, the energy-time plot, the B-scan and C-scan from ultrasonic testing (UT). The force-time plot is parabolic in shape and shows a peak at a certain maximum load of approximately 4.48 kN. Anomalies in the parabolic shape of the force-time plot indicate that the coupon has undergone extensive damage when undergoing impact.
The energy-time plot clearly demonstrates the energy absorbed (62%) by the coupon during the impact event to create the irreversible process of a 1” impact damage diameter in coupon AE1-Q2A. From the B-scan, it can be seen, that although the center of the damaged area undergoes permanent deformation similar to a dent, it does not have a delamination, since a clear back wall reflection from the center of the damage can be seen in the B-scan. From the C-scan, we can clearly see the fiber break and push out in the −45° fiber direction and this can be physically seen by looking at the rear surface of the impacted coupon as well. It can be observed that bonding the four PWAS on the AE1-Q2A composite coupon had little to no change in its impact characteristics.
Next, we analyze the AE signals received at all four PWAS. We can clearly observe in Figure 11 that the impact hit i.e., the hit which is received at the four PWAS when the first contact is made between the impactor and the composite coupon, can be clearly separated from the remaining hits received by the four PWAS. The other low amplitude hits consist of hits obtained due to the damage propagation within the composite coupon mixed with background noise and boundary reflections from the edges of the composite coupon. It is also important to note that at the PWAS 1, only the impact hit was received and after that no more hits were received by PWAS 1. This issue occurred at PWAS 1 because at the moment of impact, one of the cables connected to the PWAS 1 got unintentionally or accidentally detached from the PWAS 1 after the high amplitude flexural wave was experienced at the location where PWAS 1 was bonded to the composite coupon. Due to the detachment of the cable from PWAS 1 it was only able to capture the impact hit and was not able to capture any of the other low amplitude hits which could have valuable information about the impact damage propagation. In future experiments, all the cables will be properly reinforced so that signals at all PWAS can be received in an uninterrupted manner.
If we separate the time domain signals and their FFT’s, received at all four PWAS from the impact hit as observed in Figure 12, we can clearly observe that the signals from the impact hit has a major frequency content in the low-frequency range below 200 kHz with a large amplitude which indicates low-frequency flexural modes in the composite coupon.
If we separate the time domain signals and their FFT’s, received at all four PWAS from a hit that corresponds to damage propagation in the composite as observed in Figure 13, we can clearly observe that the signals from this hit at all the PWAS has a major frequency content in the frequency range between 300 and 500 kHz with a much lower amplitude in comparison to the impact hit. It is also important to note that there is no signal correspondence at PWAS 1 for a hit that corresponds to damage growth since no AE hits were received by PWAS 1 other than the impact hit, as stated earlier.
As observed from the C-scan in the quad plot displayed in Figure 10, we can clearly see that the maximum extent of damage due to the impact event occurs at the −45 degree direction. Therefore, we take a closer look at the signals obtained from some of the hits at PWAS 2 which is bonded in the −45-degree direction in Figure 14. We can clearly separate the high amplitude, low-frequency impact hit and its signal from some other hits and their signals that correspond to damage propagation. Within the class of hits and their signals that correspond to damage, there are subtle differences in the signals because they may represent different types of damage such as matrix cracking, fiber break, and delamination growth. One of the goals in future experiments will be to separate the damage signals from different types of damage experienced by the composite coupon upon impact.

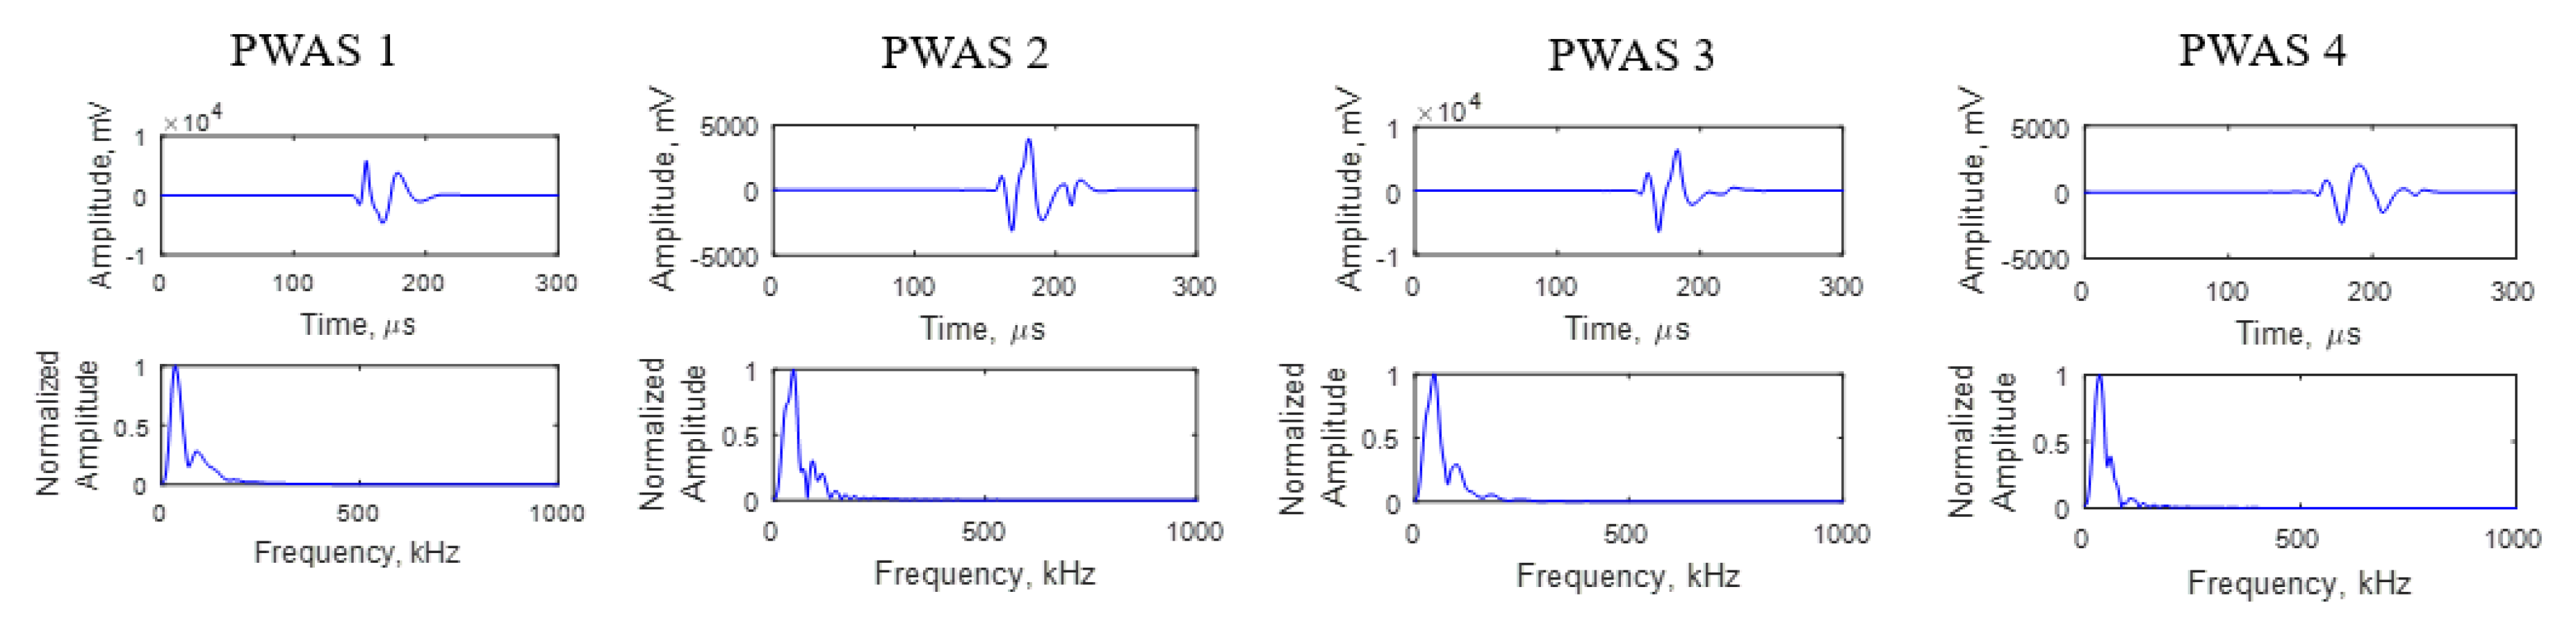
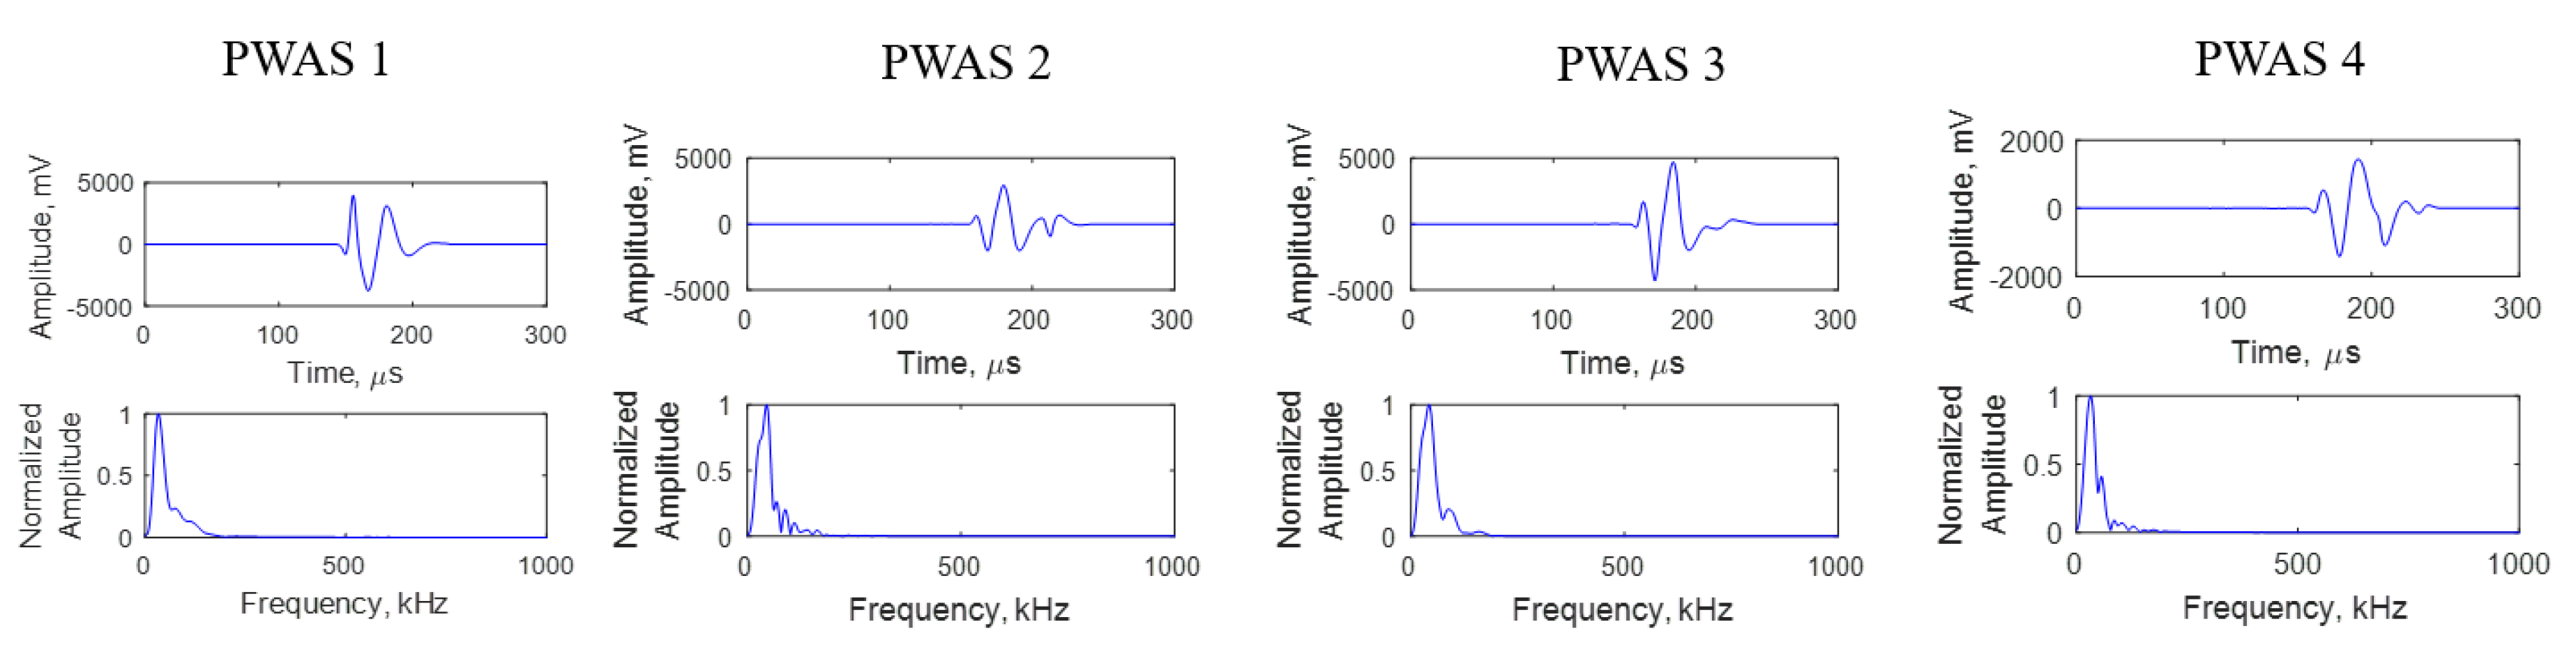
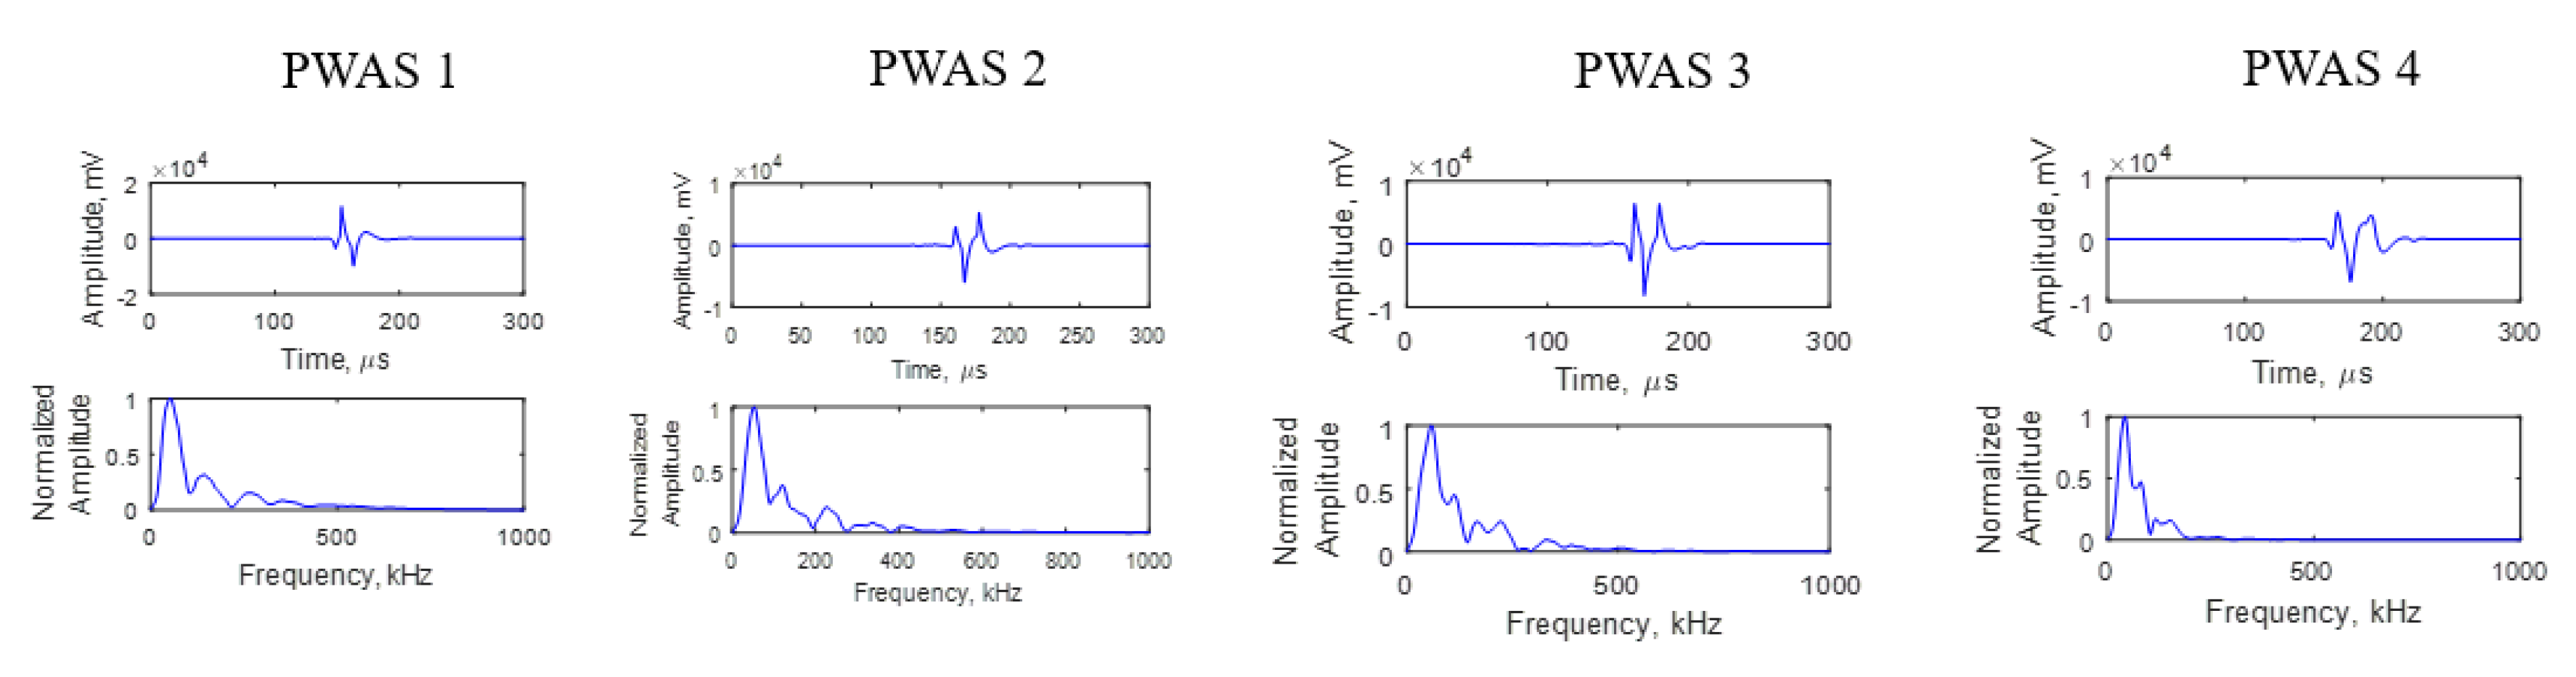
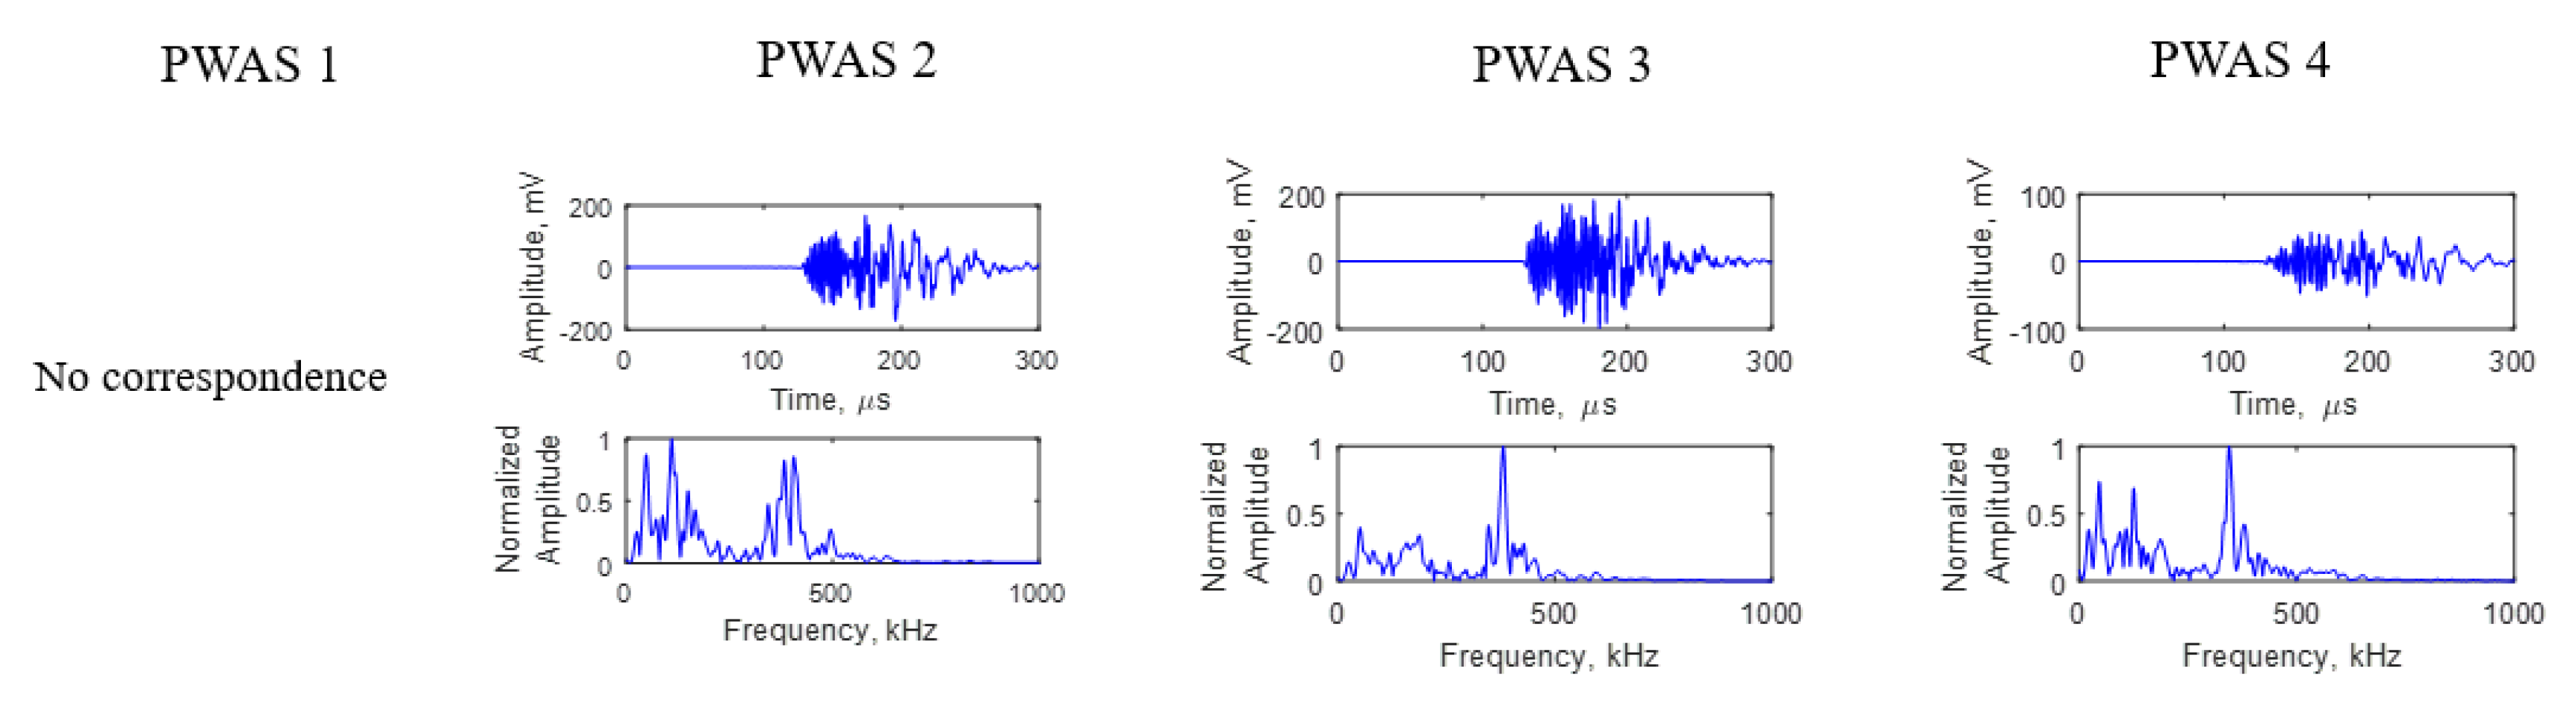
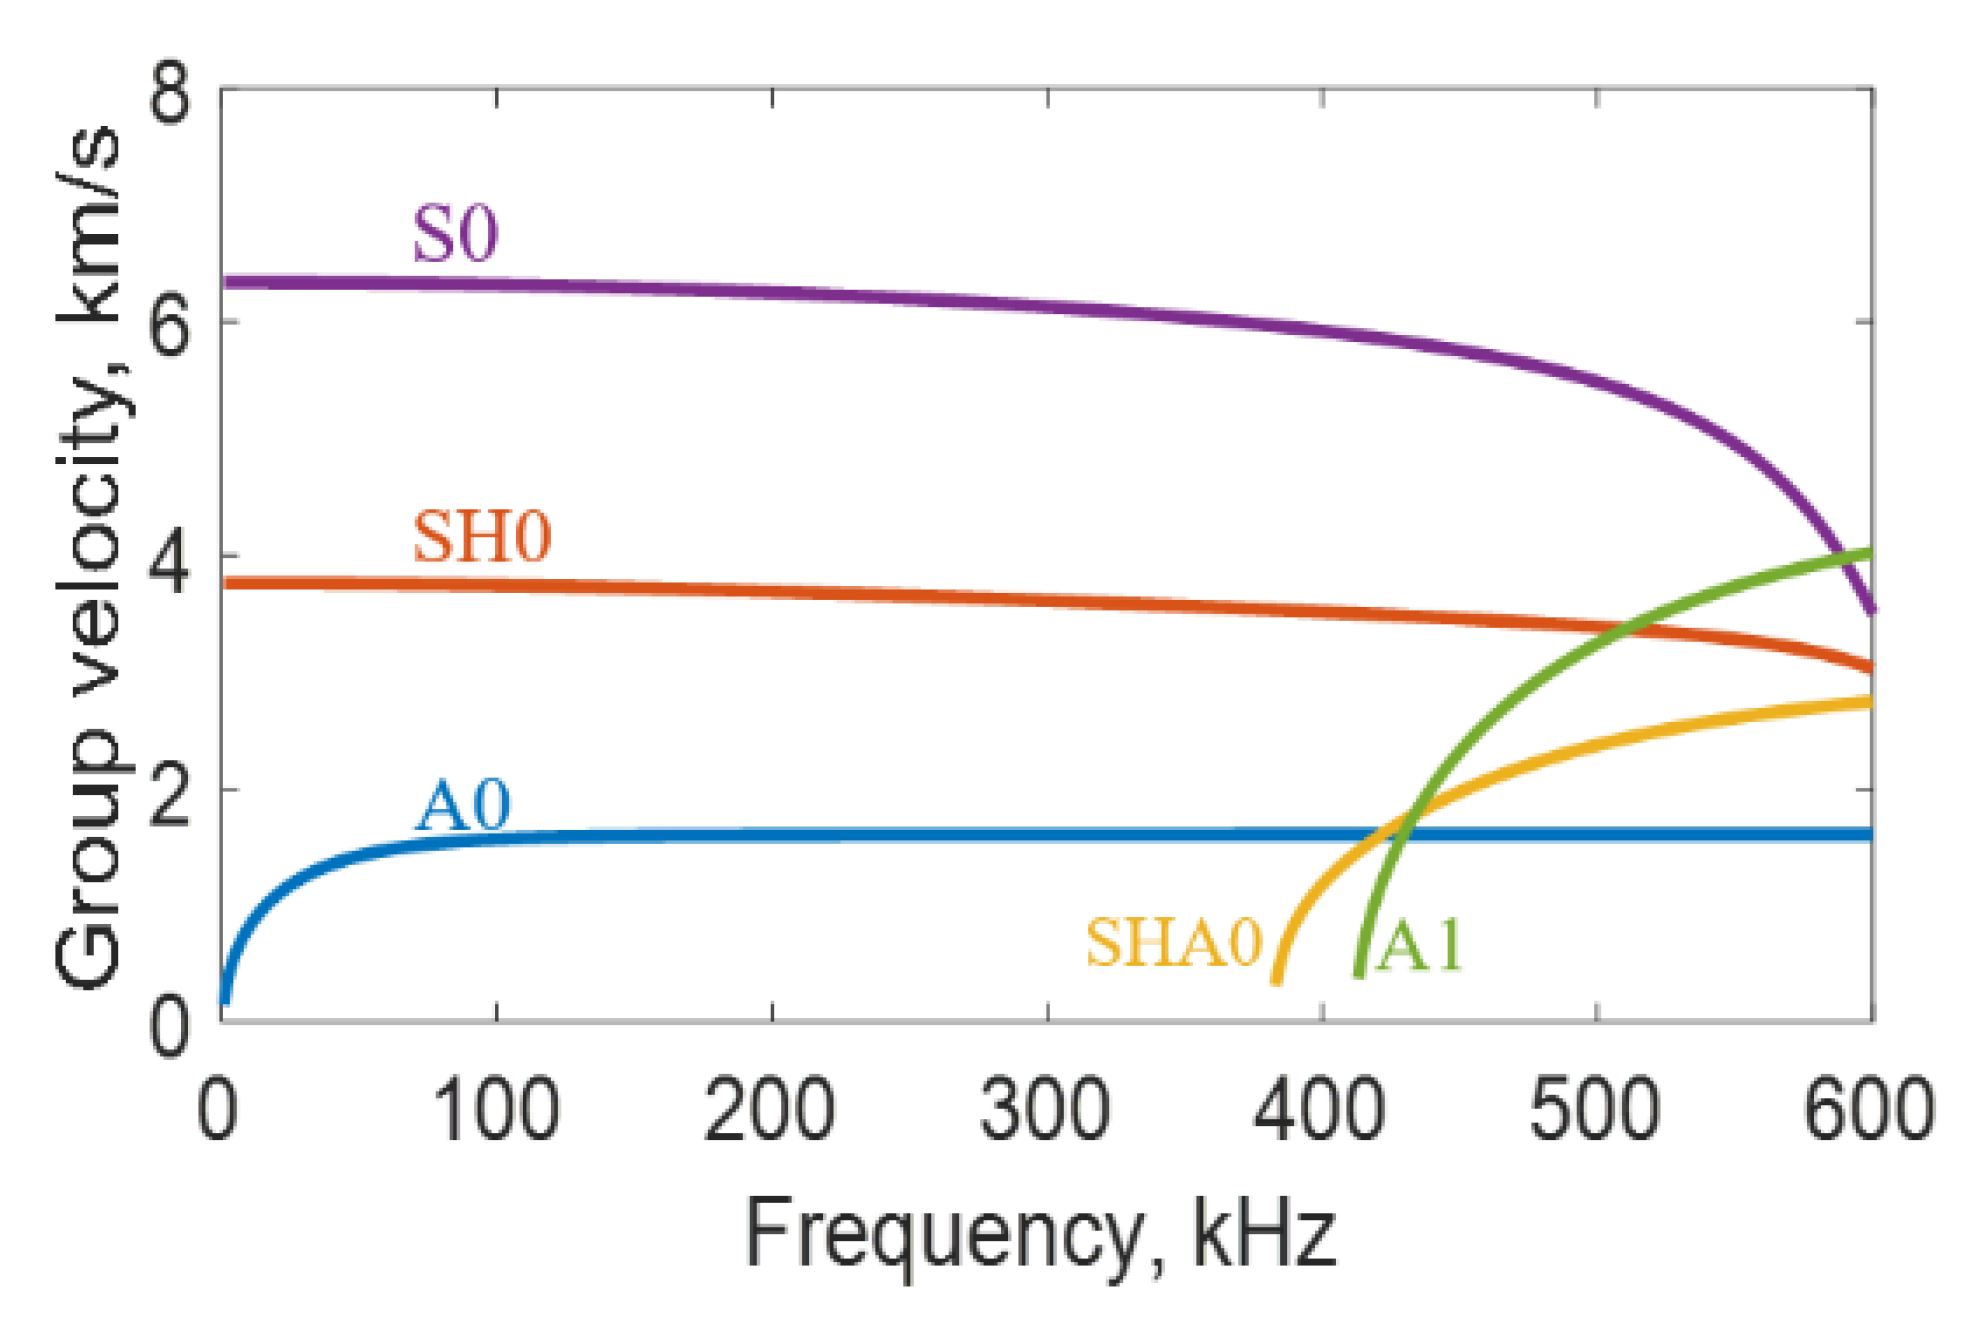
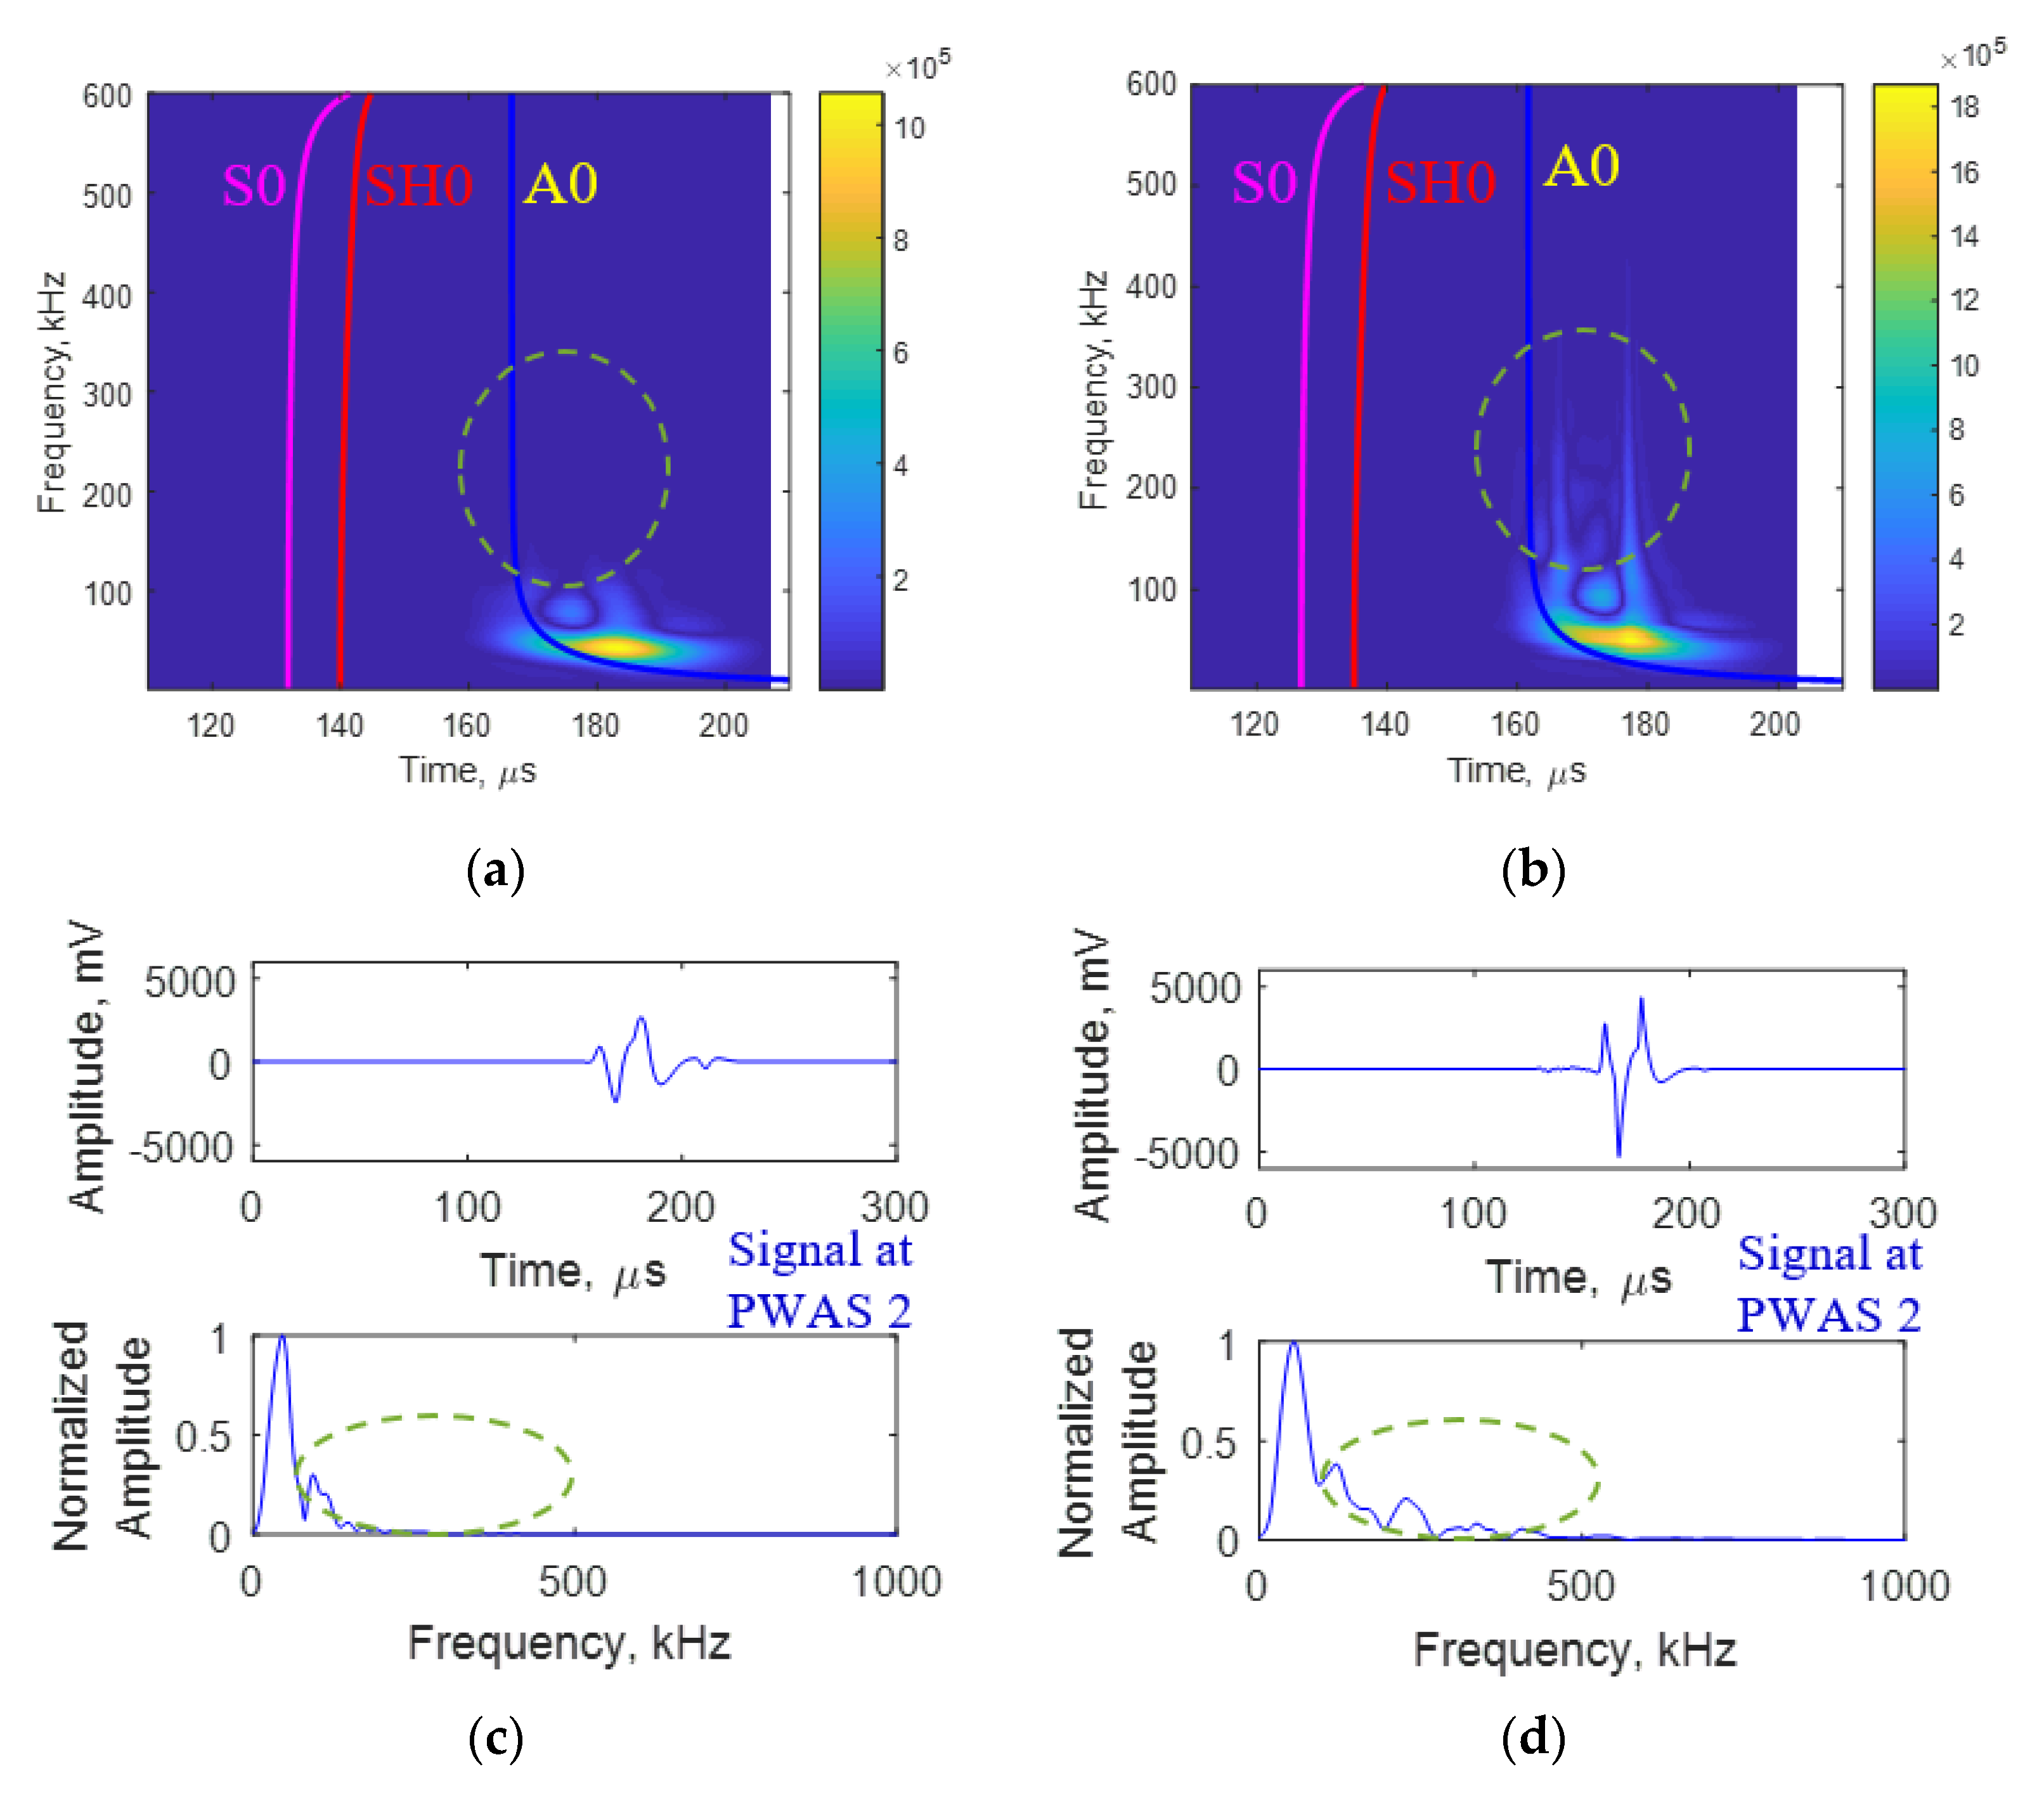
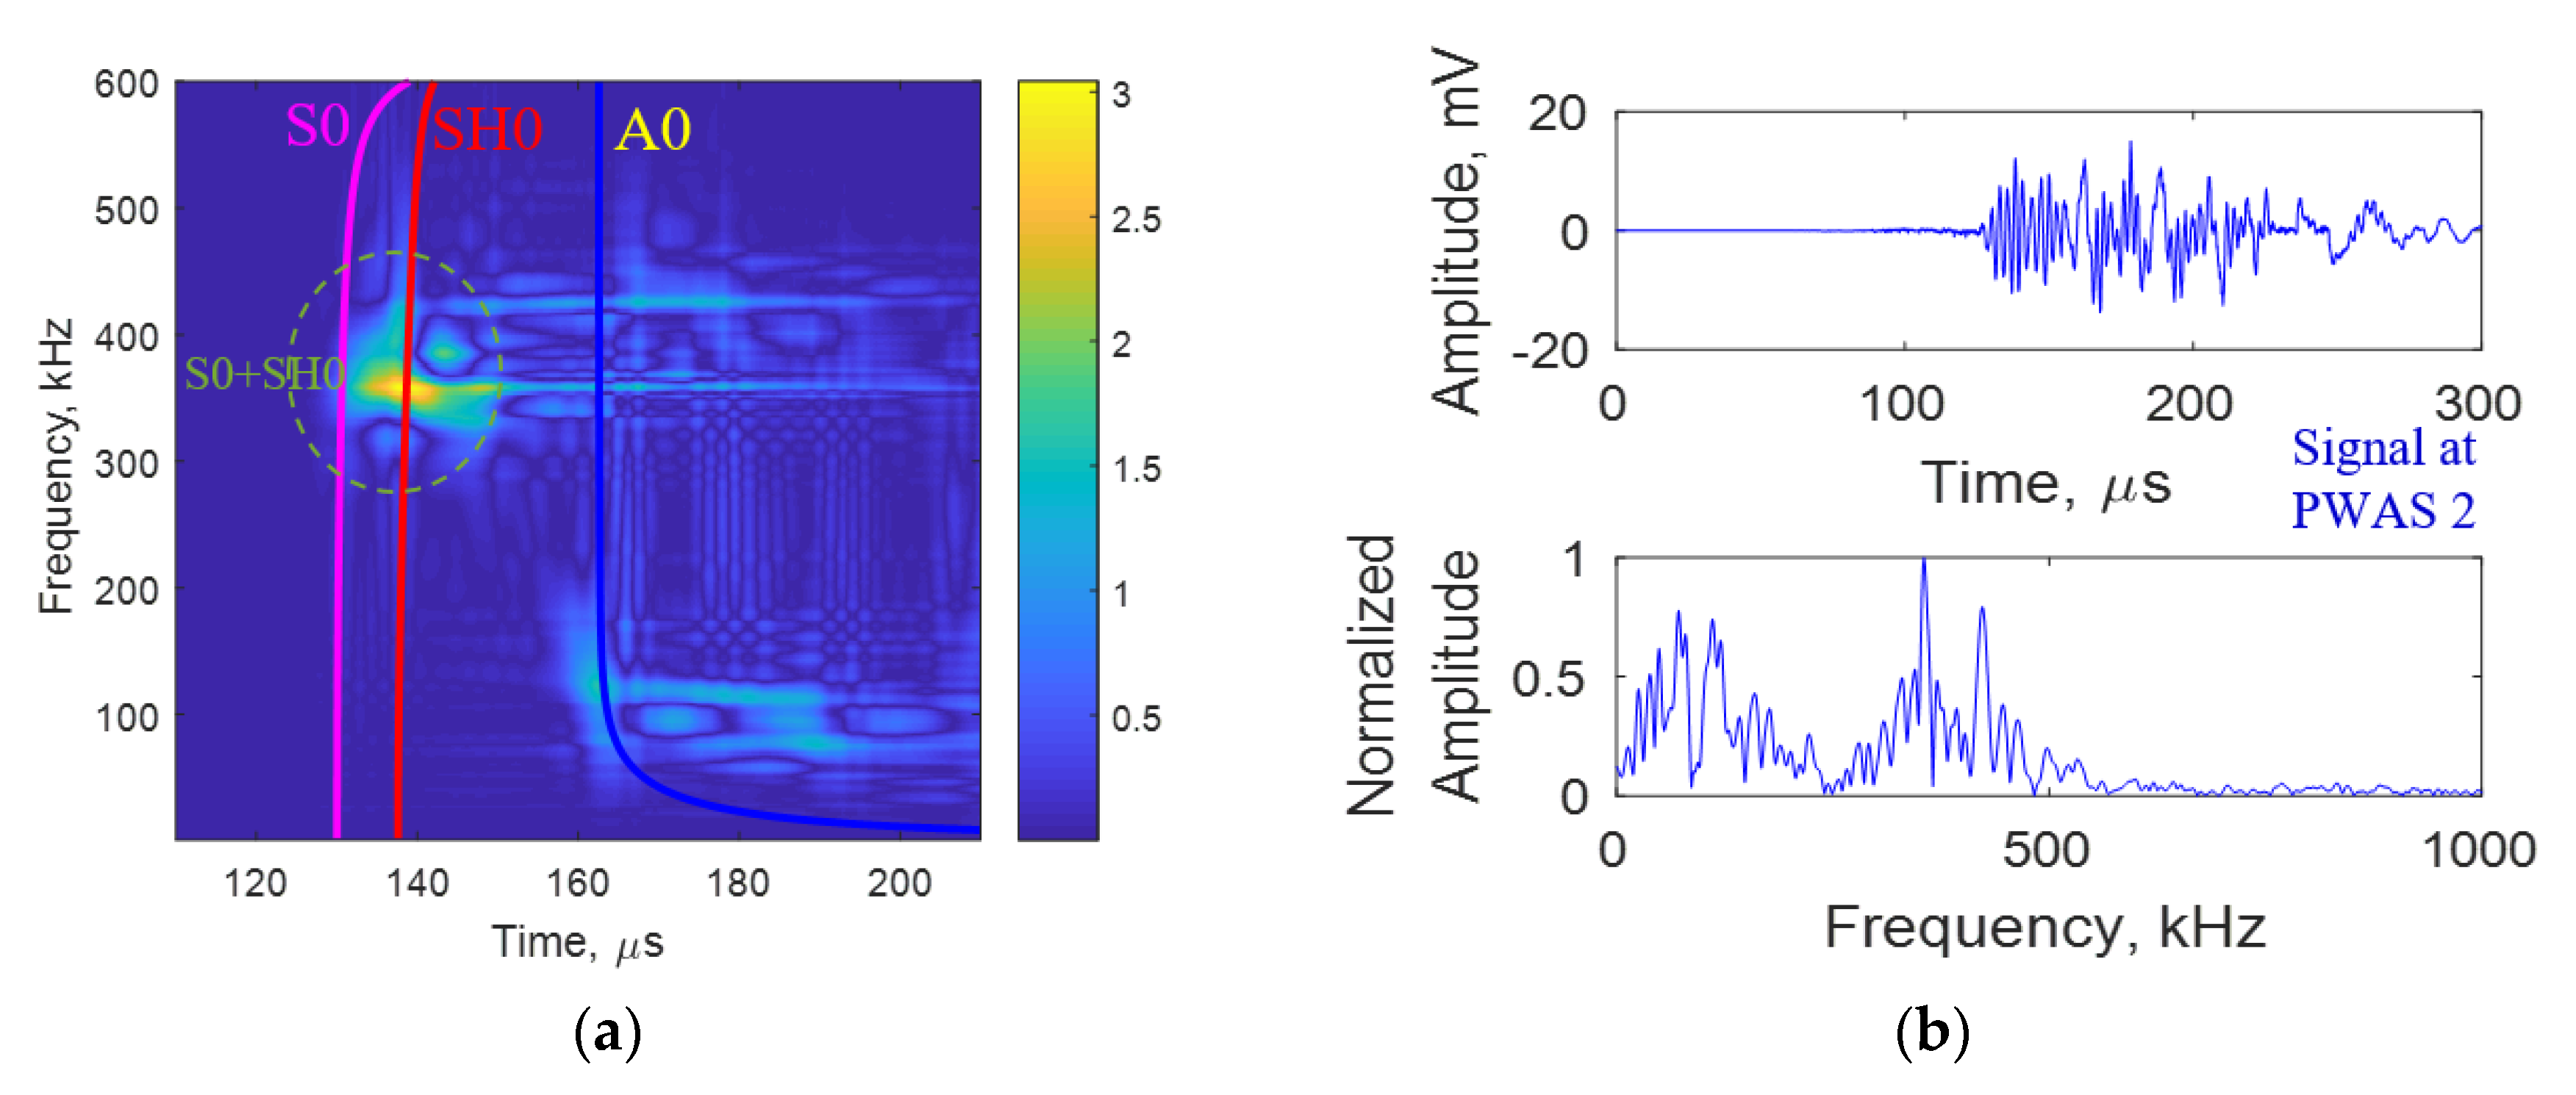
3.3. Mode Separation Study of AE Signals Due to Impact Event

After acquiring all the AE hits and performing the signal analysis from the AE hits, time-frequency analysis of the AE signals was also performed. The analysis aimed to study the Lamb wave mode content in the AE signals recorded. To do this, we first use the Semi-Analytical Finite Element (SAFE) method to obtain the group velocity dispersion curve for the 2 mm composite coupon with a stacking sequence of [−45/90/+45/0]2S as displayed in Figure 15.
To perform the mode separation study for the AE due to the impact event, we first analyze the impact hits from the 1 J impact hit that caused no damage in a 2 mm composite coupon, and the 16 J impact hit that caused a 1” impact damage in a composite coupon. We conduct the time-frequency analysis for both the impact hits and superimpose it with the group velocity dispersion curve of the 2 mm composite coupon. These plots can be observed in Figure 16a,b. If we compare these two plots, we can clearly observe that the strong A0 mode can be observed due to the impact hit in both the plots. We can also observe that 16 J impact hit has a stronger A0 content. We can also see the signals obtained at PWAS 2 for both impact hits in Figure 16c,d. Upon comparing these two plots we can observe that the 16 J impact hit has an additional higher frequency content between 200 kHz and 400 kHz due to a higher energy impact of 16 J compared to a lower energy impact of 1 J.
To perform the mode separation study for the AE due to damage growth, we analyze an AE hit that corresponds to damage growth from the 16 J impact event that caused a 1” impact damage in the composite coupon. We conduct the time-frequency analysis of the signal and superimpose it with the group velocity dispersion curve of the 2 mm composite coupon. This plot can be observed in Figure 17a. We can also observe the signal due to the damage growth obtained at PWAS 2 displayed in Figure 17b. From these plots we can clearly observe that the damage growth has a strong S0 and SH0 mode between 300 kHz and 500 kHz. We can also see that the damage growth has weak A0 mode along with many boundary reflections. If we were do conduct a preliminary inspection, we can see that SH0 mode is found stronger than the S0 mode. Previous work [25,26,27,28] has also indicated that SH0 mode is very sensitive to impact damage and can be used to detect impact damage.

4. Summary, Conclusions and Future Work

4.1. Summary

In this paper, the AE signal signature identification was used to ascertain if an impact event creates a sizable damage in a composite coupon or not. This was done by modifying the existing standardized test method for drop weight impact testing by introducing an instrumented composite coupon to acquire real-time AE signals.
Using the mass, height and energy combinations from the preliminary impact tests [5], four PWAS were bonded on two composite coupons at locations corresponding to fiber orientation angles and then drop weight impact tests conforming to ASTM D7136 standard on these instrumented composite coupons was conducted. On the first instrumented coupon a 1 J impact that creates no damage, was conducted and on the second instrumented coupon a 16 J impact that creates 1” impact damage diameter was conducted. We found that we could separate the impact AE hit from an AE hit corresponding to damage growth and perform a mode separation study.

4.2. Conclusions

Preliminary impact tests conducted on 2 mm quasi-isotropic coupons were used to estimate the mass, height and energy combinations to obtain approximately 1” impact damage size using incremental energy impacts on various test coupons and post-impact data analysis to estimate force-time histories and energy-time histories. UT scans enabled us to characterize the impact damage size, shape and location.
Impact tests conducted on AE instrumented 2 mm composite coupons showed similar impact characteristics despite bonding four PWAS to acquire real-time AE signals. AE signals corresponding to the impact hits were identified clearly and separated from the AE signals that corresponded to internal damage growth in the composite coupons. It was observed that the AE due to impact hit has a stronger low-frequency content with high amplitude at a region below 200 kHz. It was also observed that the AE signals due to the irreversible process of damage has a stronger high –frequency content in the range of 300 to 500 kHz.
Upon performing the mode separation study on the impact hits, it was observed that the impact hit has a strong A0 mode content depending on the energy of the impact. The mode separation study on the AE hit corresponding to damage growth indicated that it has a strong S0 mode and SH0 mode content where the SH0 mode seems to be the dominant mode and more sensitive to the impact damage.
An invention disclosure [39] covering our novel findings has been prepared and is in the process of becoming a provisional patent.

4.3. Future Work

Further controlled impact tests will be conducted on AE instrumented 2 mm composite coupons using the mass, height and energy combinations estimated from the preliminary impact experiments to obtain multiple impact damage sizes for a comparative study. A deviation from the ASTM D7136 standard for drop weight impact testing will be employed to use larger size coupons (12” × 6”) to use-non reflective boundary and receive clean signals from the impact tests which are free from boundary reflections. AE signal analysis will be used to investigate the separation of AE signals from different types of damages processes (matrix crack, fiber break and delamination) that occur during an impact event.
Further work could be performed towards the practical application of the research results presented in this paper by exploring the possibility of using PWAS for real-time AE structural health monitoring of impact events in composites to make sure if the impact has indeed created damage inside the composite. Estimating the size, location, shape and extent of the impact damage by analyzing the AE signals received by a network of PWAS will be of paramount interest. Computer simulations and equipment development could be conducted independently or in collaboration with an industrial partner.

Author Contributions

In this article, the experiments, calculations, and analysis were done by R.J., and R.P.J. with advice and inspiration from V.G. The details methodology was provided by R.J., R.P.J., and V.G. The original draft was prepared by R.J. The review and editing were done by R.J., R.P.J., and V.G. All authors have read and agreed to the published version of the manuscript.

Funding

This work was supported by the Air Force Office of Scientific Research (AFOSR) grant number FA9550-16-1-0401 and the Office of Naval Research (ONR) grant number N00014-17-1-2829.

Acknowledgments

The authors would like to thank the Ronald E. McNair Center for Aerospace Innovation and Research for providing them the manufacturing facilities to manufacture the composite coupons. The authors would also like to thank Xinyu Huang for providing the drop-weight impact tower for conducting the ASTM D7136 impact tests.

Conflicts of Interest

The authors declare no conflict of interest.

References

  1. Davis, M.J.; Jones, R.T. Damage Tolerance of Fibre Composite Laminates. In Fracture Mechanics Technology Applied to Material Evaluation and Structure Design; Springer: Dordrecht, The Netherlands, 1983; pp. 635–655. [Google Scholar]
  2. Anderson, B. Factors affecting the design of military aircraft structures in carbon fibre reinforced composites. In Fracture 84; Pergamon: New Delhi, India, 1984; pp. 607–622. [Google Scholar]
  3. MIL-HDBK-17-3F. Composite Materials Handbook; Chapter 7; US Department of Defense: Arlington, VA, USA, 2002; Volume 3, pp. 7–29.
  4. James, R.; Giurgiutiu, V.; Flores, M.; Mei, H.; Haider, M.F. Challenges of generating controlled one-inch impact damage in thick CFRP composites. In Proceedings of the AIAA Scitech 2020 Forum, Orlando, FL, USA, 6–10 January 2020; p. 0723. [Google Scholar]
  5. James, R.; Giurgiutiu, V. Towards the generation of controlled one-inch impact damage in thick CFRP composites for SHM and NDE validation. Compos. Part B Eng. 2020, 203, 108463. [Google Scholar] [CrossRef]
  6. Cantwell, W.; Morton, J. Detection of impact damage in CFRP laminates. Compos. Struct. 1985, 3, 241–257. [Google Scholar] [CrossRef]
  7. Bar-Cohen, Y.; Crane, R.L. Washington, DC: U.S. Patent and Trademark Office. U.S. Patent No. 4,457,174, 3 July 1984. [Google Scholar]
  8. Aymerich, F.; Meili, S. Ultrasonic evaluation of matrix damage in impacted composite laminates. Compos. Part B Eng. 2000, 31, 1–6. [Google Scholar] [CrossRef]
  9. Gresil, M.; Giurgiutiu, V. Guided wave propagation in composite laminates using piezoelectric wafer active sensors. Aeronaut. J. 2013, 117, 971–995. [Google Scholar] [CrossRef] [Green Version]
  10. Santos, M.; Santos, J.; Amaro, A.; Neto, M.A. Low velocity impact damage evaluation in fiber glass composite plates using PZT sensors. Compos. Part B Eng. 2013, 55, 269–276. [Google Scholar] [CrossRef]
  11. Rogge, M.D.; Leckey, C.A. Characterization of impact damage in composite laminates using guided wavefield imaging and local wavenumber domain analysis. Ultrasonics 2013, 53, 1217–1226. [Google Scholar] [CrossRef]
  12. Tai, S.; Kotobuki, F.; Wang, L.; Mal, A. Modeling Ultrasonic Elastic Waves in Fiber-Metal Laminate Structures in Presence of Sources and Defects. J. Nondestruct. Eval. Diagn. Progn. Eng. Syst. 2020, 3, 1–42. [Google Scholar] [CrossRef]
  13. James, R.; Haider, M.F.; Giurgiutiu, V.; Lilienthal, D. A simulative and experimental approach towards eddy current non-destructive evaluation of manufacturing flaws and operational damage in CFRP composites. J. Nondestruct. Eval. Diagn. Progn. Eng. Syst. 2019, 3, 1–14. [Google Scholar] [CrossRef]
  14. Liang, T.; Ren, W.; Tian, G.Y.; Elradi, M.; Gao, Y. Low energy impact damage detection in CFRP using eddy current pulsed thermography. Compos. Struct. 2016, 143, 352–361. [Google Scholar] [CrossRef] [Green Version]
  15. He, Y.; Tian, G.; Pan, M.; Chen, D. Impact evaluation in carbon fiber reinforced plastic (CFRP) laminates using eddy current pulsed thermography. Compos. Struct. 2014, 109, 1–7. [Google Scholar] [CrossRef] [Green Version]
  16. Narayanan, R.M.; James, R. Microwave nondestructive testing of galvanic corrosion and impact damage in carbon fiber reinforced polymer composites. Int. J. Microw. Appl. 2018, 7, 1–15. [Google Scholar] [CrossRef]
  17. Greenawald, E.C.; Levenberry, L.J.; Qaddoumi, N.; McHardy, A.; Zoughi, R.; Poranski, C.F., Jr. Microwave NDE of impact damaged fiberglass and elastomer layered composites. In AIP Conference Proceedings; American Institute of Physics: Melville, NY, USA, 2000; Volume 509, pp. 1263–1268. [Google Scholar]
  18. Li, Z.; Haigh, A.D.; Soutis, C.; Gibson, A.A.P. Simulation for the impact damage detection in composites by using the near-field microwave waveguide imaging. In NDT 2014—53rd Annual Conference of the British Institute of Non-Destructive Testing; British Institute of Non-Destructive Testing: Northampton, UK, 2014. [Google Scholar]
  19. Li, Z.; Soutis, C.; Haigh, A.; Sloan, R.; Gibson, A. Application of an electromagnetic sensor for detection of impact damage in aircraft composites. In Proceedings of the 2016 21st International Conference on Microwave, Radar and Wireless Communications, MIKON 2016, Krakow, Poland, 9–11 May 2016. [Google Scholar]
  20. Meola, C.; Carlomagno, G.M. Impact damage in GFRP: New insights with infrared thermography. Compos. Part A Appl. Sci. Manuf. 2010, 41, 1839–1847. [Google Scholar] [CrossRef]
  21. Tan, K.; Watanabe, N.; Iwahori, Y. X-ray radiography and micro-computed tomography examination of damage characteristics in stitched composites subjected to impact loading. Compos. Part B Eng. 2011, 42, 874–884. [Google Scholar] [CrossRef]
  22. Meola, C.; Carlomagno, G.M. Infrared thermography to evaluate impact damage in glass/epoxy with manufacturing defects. Int. J. Impact Eng. 2014, 67, 1–11. [Google Scholar] [CrossRef]
  23. Bull, D.; Helfen, L.; Sinclair, I.; Spearing, S.; Baumbach, T. A comparison of multi-scale 3D X-ray tomographic inspection techniques for assessing carbon fibre composite impact damage. Compos. Sci. Technol. 2013, 75, 55–61. [Google Scholar] [CrossRef] [Green Version]
  24. Schilling, P.J.; Karedla, B.R.; Tatiparthi, A.K.; Verges, M.A.; Herrington, P.D. X-ray computed microtomography of internal damage in fiber reinforced polymer matrix composites. Compos. Sci. Technol. 2005, 65, 2071–2078. [Google Scholar] [CrossRef]
  25. Mei, H.; Haider, M.F.; James, R.; Giurgiutiu, V. Pure S0 and SH0 detections of various damage types in aerospace composites. Compos. Part B Eng. 2020, 189, 107906. [Google Scholar] [CrossRef]
  26. James, R.; Mei, H.; Giurgiutiu, V. SH-mode guided-wave impact damage detection in thick quasi-isotropic composites. In Proceedings of the Health Monitoring of Structural and Biological Systems IX, Houston, TX, USA, 10–13 February 2020; Volume 11381, p. 113810R. [Google Scholar]
  27. Mei, H.; James, R.; Giurgiutiu, V. Damage detection in laminated composites using pure SH guided wave excited by angle beam transducer. In Proceedings of the Health Monitoring of Structural and Biological Systems IX, Houston, TX, USA, 10–13 February 2020; Volume 11381, p. 113810P. [Google Scholar]
  28. Mei, H.; James, R.; Haider, M.F.; Giurgiutiu, V. Multimode Guided Wave Detection for Various Composite Damage Types. Appl. Sci. 2020, 10, 484. [Google Scholar] [CrossRef] [Green Version]
  29. Prosser, W.H.; Gorman, M.R.; Humes, D.H. Acoustic Emission Signals in Thin Plates Produced by Impact Damage; Journal of Acoustic Emission, Acoustic Emission Working Group: Houston TX, USA, 1999. [Google Scholar]
  30. De Rosa, I.M.; Santulli, C.; Sarasini, F.; Valente, M. Post-impact damage characterization of hybrid configurations of jute/glass polyester laminates using acoustic emission and IR thermography. Compos. Sci. Technol. 2009, 69, 1142–1150. [Google Scholar] [CrossRef]
  31. De Rosa, I.M.; Santulli, C.; Sarasini, F. Acoustic emission for monitoring the mechanical behaviour of natural fibre composites: A literature review. Compos. Part A Appl. Sci. Manuf. 2009, 40, 1456–1469. [Google Scholar] [CrossRef]
  32. Choi, I.; Hong, C. Low-velocity impact response of composite laminates considering higher-order shear deformation and large deflection. Mech. Compos. Mater. Struct. 1994, 1, 157–170. [Google Scholar] [CrossRef]
  33. Park, J.-M.; Kong, J.-W.; Kim, J.-W.; Yoon, D.-J. Interfacial evaluation of electrodeposited single carbon fiber/epoxy composites by fiber fracture source location using fragmentation test and acoustic emission. Compos. Sci. Technol. 2004, 64, 983–999. [Google Scholar] [CrossRef]
  34. James, R.; Joseph, R.; Giurgiutiu, V. Impact damage detection in composite plates using acoustic emission signal signature identification (Conference Presentation). In Proceedings of the Active and Passive Smart Structures and Integrated Systems IX, Houston, TX, USA, 10–13 February 2020; Volume 11376, p. 113760K. [Google Scholar]
  35. ASTM D7136/D7136M-15. Standard Test Method for Measuring the Damage Resistance of a Fiber-Reinforced Polymer Matrix Composite to a Drop-Weight. Impact Event ASTM Int. 2015, 15, 1–7. [Google Scholar]
  36. Caputo, F.; De Luca, A.; Lamanna, G.; Borrelli, R.; Mercurio, U. Numerical study for the structural analysis of composite laminates subjected to low velocity impact. Compos. Part B Eng. 2014, 67, 296–302. [Google Scholar] [CrossRef]
  37. Flores, M.; Mollenhauer, D.; Runatunga, V.; Beberniss, T.; Rapking, D.; Pankow, M. High-speed 3D digital image correlation of low-velocity impacts on composite plates. Compos. Part B Eng. 2017, 131, 153–164. [Google Scholar] [CrossRef]
  38. Wallentine, S.M.; Uchic, M.D. A study on ground truth data for impact damaged polymer matrix composites. In AIP Conference Proceedings; AIP Publishing LLC: Melville, NY, USA, 2018; Volume 1949, p. 120002. [Google Scholar]
  39. Giurgiutiu, V.; James, R.; Joseph, R. Acoustic emission method to ascertain damage occurrence in impacted composites. USC-IPMO 2019, 1448. [Google Scholar]
Figure 1. Remaining composite strength as a function of impact damage diameter [3].
Jcs 05 00079 g001
Figure 2. Drop weight impact testing with AE signal capture.
Jcs 05 00079 g002
Figure 3. Manufacturing of composite coupons for impact testing: (a) Wabash hot press machine; (b) Manufacturing cure-cycle; (c) Cured composite laminate with 6” × 4” cut-outs.
Jcs 05 00079 g003
Figure 4. Dynatup 8200 drop weight impact testing machine instrumented with load cell and velocity sensor.
Jcs 05 00079 g004
Figure 5. Location of four PWAS with respect to impact location on composite coupon.
Jcs 05 00079 g005
Figure 6. Experimental setup of ASTM drop weight impact test on AE instrumented coupon.
Jcs 05 00079 g006
Figure 7. AE hits observed at the four PWAS due to 1 J impact event.
Jcs 05 00079 g007
Figure 8. Signal correspondence at all four PWAS due to the 1st impact hit.
Jcs 05 00079 g008
Figure 9. Signal correspondence at all four PWAS due to the 2nd impact hit.
Jcs 05 00079 g009
Figure 10. Impact results of 2 mm coupon AE1-Q2A consisting of force-time plot, energy-time plot, B-scan and C-scan from UT.
Jcs 05 00079 g010
Figure 11. AE hits observed at the four PWAS due to 16 J impact event.
Jcs 05 00079 g011
Figure 12. Signal correspondence at all four PWAS due to the 1st impact hit.
Jcs 05 00079 g012
Figure 13. Signal correspondence at all four PWAS due to a hit corresponding to damage formation.
Jcs 05 00079 g013
Figure 14. Various signals observed at PWAS2 due to the 16 J impact event.
Jcs 05 00079 g014
Figure 15. Group velocity dispersion curve for 2 mm composite coupon having a stacking sequence of [−45/90/+45/0]2S.
Jcs 05 00079 g015
Figure 16. (a) Time-frequency plot from 1 J impact hit signal (b) Time-frequency plot from 16 J impact hit signal (c) AE signal at PWAS 2 due to 1 J impact hit and frequency spectrum (d) AE signal at PWAS 2 due to 16 J impact hit and frequency spectrum.
Jcs 05 00079 g016
Figure 17. (a) Time-frequency plot from 16 J damage hit (b) Signal at PWAS 2 and the frequency spectrum due to 16 J damage hit.
Jcs 05 00079 g017
Publisher’s Note: MDPI stays neutral with regard to jurisdictional claims in published maps and institutional affiliations.

