Article

Effect of Surface Polishing on Nano-Hardness and Elastic Modulus of Different Resin Composites after Immersion in Alcoholic Medium

1
Restorative and Prosthodontic Department, Almikhawah Dental Center, Al-Baha 65553, Saudi Arabia
2
Department of Operative Dentistry, Batterjee Medical College, Jeddah 21442, Saudi Arabia
3
Dental Health Department, Faculty of Applied Medical Sciences, Al-Baha University, Al-Baha 65731, Saudi Arabia
4
Department of Regenerative Dental Medicine, Graduate School of Biomedical Sciences, Tokushima University, 3-18-15, Kuramotocho, Tokushima 770-8504, Japan
*
Author to whom correspondence should be addressed.
J. Compos. Sci. 2021, 5(12), 327; https://doi.org/10.3390/jcs5120327
Submission received: 21 October 2021 / Revised: 12 December 2021 / Accepted: 16 December 2021 / Published: 18 December 2021

Abstract

:
There has been a great tendency toward using resin composite in dentistry and exploring nano-hardness, elastic modulus, and effect of polishing on its mechanical properties after its artificial ageing. This study aimed to evaluate the effect of surface polishing of four different resin composites on their nano-hardness and elastic modulus. This effect was tested right after light curing of composite resin and after its artificial ageing (immersion in alcoholic medium). Nanoindentation test preparations, surface roughness, surface hardness, and scanning electron microscope were conducted across the four different resin composites: Clearfil AP-X (APX), Estelite Sigma Quick (ESQ), Beautifil II (BE2), and FiltekTM Supreme Ultra Universal restorative (FSU). We found that difference in fillers load and particle size are amongst the factors influencing hardness and modulus of elasticity. The APX is the highest in term of hardness due to fillers load and size while the ESQ is the lowest because all fillers in nano size and distributed homogenously. The significance of surface polishing of the studied resin composite restorations was highlighted. Future research may focus on exploring survival rate of polished and non-polished composite surfaces with emphasis on measuring degree of conversion and impacts of polished and non-polished surfaces on the individuals’ oral health quality of life.

1. Introduction

In the recent years, composite resin has become an important cosmetic substitute for amalgam fillings as the restorative material of choice for discolored, fractured, chipped, and decayed teeth [1,2]. Composite resin consists of a mixture of resin medium with glass or quartz fillers, which provides it with a tooth-colored feature that improves dental aesthetics [2]. From a dental public health stance, composite resins in the oral cavity ought to provide not only dental aesthetics and functions; but also improving the individuals’ oral health quality of life. Thus, the impact of dental restorations on the individuals’ oral health quality of life and the survival rate of those restorations may play a vital role on planning successful dental care [3].
The hardness and resistance of composite resin against occlusal forces are of utmost importance. One of the key techniques of measuring the hardness and resistance of composite resin is the Nanoindentation technique [4]. This technique is a fundamental in determining whether the substance can be deformed or have permanent resistance against these forces at the nanoscale level. Nanoindentation technique is also useful in understanding the mechanical properties of dental materials, apart from familiarity with chemical, biological, pathophysiological, and physical principles that contribute vitally to developing successful dental treatments [4,5]. This technique hence is applicable and imperative especially in defining the viability of applying composite resins in dental fillings.
Nanoindentation is a non-destructive process with high accuracy due to the measurement of occlusal forces at µN range [6,7]. The Nanoindentation technique can be combined with relevant software applications to calculate additional properties such as yield strength and recovery rate, which may be improbable with conventional methods [5,8]. The technique mainly measures hardness (H) and elasticity modulus (E), where H refers to the resistance of composite resins to penetration and indentation, while E describes the stretch ability and relative stiffness of the material without resulting in deformation under constant loading [9,10]. Nanoindentation is appropriate for measuring these properties since resin composites have filler materials whose size range from 0.04 µm to 5 µm [11]. Consequently, this can help understanding and explaining the functions of these materials in diverse operational conditions in the oral environment. Nanoindentation can also help to define the wear resistance that composite resins have against occlusion loading and forces depending on their level of hardness. This practice can also support determine elastic and plastic deformations of composite resins. Elastic deformation refers to the ability of a material to regain its normal shape and size after retrieval of a force, while plastic deformation means the permanent distortion of material upon application of a force beyond its elastic limit [12].
The dental literature has revealed that degradation of dental composites is not only affected by physical forces, but also by ageing in solutions simulating oral conditions. Although these conditions are variable and dynamic, but different solutions as artificial saliva, mouth washes, distilled water, sodium hydroxide and ethanol solutions have been used. In this study, 25% ethanol solution was used for ageing. It was reported that Alcohol can easily penetrate dental matrix, causing elution of residual unreacted monomers, increasing wear, and decreasing hardness of resin composite. This mainly attributed to the huge amount of unreacted monomers and oligomers which diffuse out of the composite resin leading to acceleration of the hydrolysis process followed by resin/matrix interfacial failure [13]. Moreover, A recent systematic review has shown that multistep polishing technique of composite resin in dentistry is effective. Surface polishing of composite resin facilitates oral hygiene and provides not only a greater aesthetic and comfort to the patient; but also reduces bacterial adhesion, tissue inflammation, discoloration, and biofilm retention [14]. However, improving the clinical fabrication of composite resins may play a key role in understanding their viability and longevity as dental fillings. The aim of this study therefore was to evaluate the effect of surface polishing of four different resin composites on their nano-hardness and elastic modulus. This effect was tested right after light curing of composite resin and after its artificial ageing (immersion in alcoholic medium). The null hypothesis is that the elastic modulus and hardness will show same results in all tested composite before and after polishing and its artificial ageing.

2. Materials and Methods
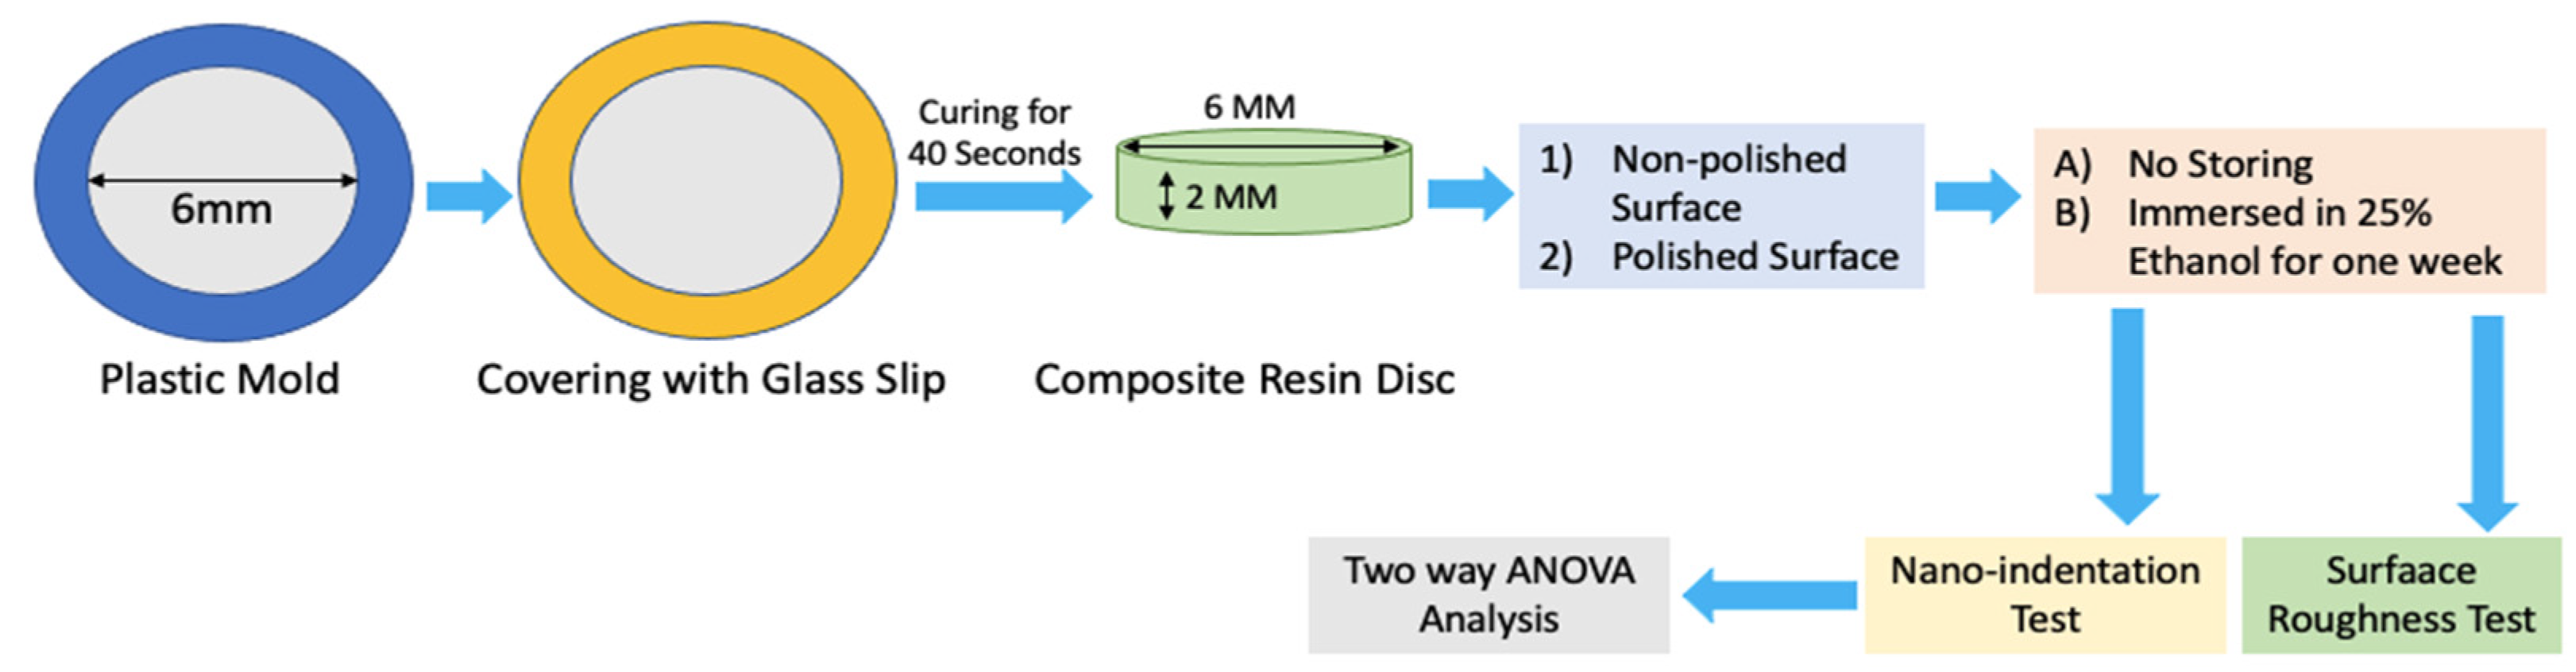
2.1. An Overview

Four resin composites, Filtek Supreme Ultra (FSU; Shade A2, 3M, St. Paul, MN, USA), Estelite Sigma Quick (ESQ; Shade A2, Tokuyama Dental, Tokyo, Japan), Beautifil II (BE2; Shade A2, Shofu, Kyoto, Japan), and Clearfil AP-X (APX; Shade A2, Kuraray Noritake Dental, Tokyo, Japan) were used in this study. Table 1 describes the compositions of the four resin campsites used in the study.

2.2. Nanoindentation Test Preparations

A total of 16 discs of each brand of resin composite were prepared in this study. A transparent plastic matrix strip (Hawe Striproll Transparent 10 mm, KerrHawe, Bioggio, Switzerland) was placed on the glass slide, and a round-shaped mold (6 mm in diameter and 2 mm in thick) was set on it. The molds were accordingly carefully filled with each resin composite and covered with a second plastic matrix strip and compressed with a thin glass cover slip (0.1 mm thick) to obtain a flat surface after light curing. The resin composite was then light-cured for 40 s with a halogen light-curing unit (Optilux 501, Kerr, Orange, CA, USA), which had a light output greater than 600 mW cm−2.
The covering glass slip, and plastic strip were removed, and all the polymerized resin composite specimens were carefully removed from the molds and divided into two composite surface treatment groups as follows: (Group 1) no surface polishing; (Group 2) surface fine polished by Silicon Carbide (SiC) papers and diamond pastes down to a particle size of 25 nm to produce a smooth surface suitable for nanoindentation. Then each group was subdivided into two groups: (A) no storing; (B) immersed in 25% ethanol for a week in incubator 37 °C.
All specimens were next subjected to nanoindentation hardness at a maximum force of 50 mN reached at 1 mN/s loading rate at 20 N increments by a Berkovich indenter attached to the nanoindentation device (ENT-1100a, Elionix, Tokyo, Japan). Hardness was calculated by dividing maximum force on projected area as previously shown study [13]. The number of indentations was 10 for each disc and 0.5 mm apart from each other. Figure 1 shows schematically how the specimens were prepared.
Elastic modulus was calculated as following: the reaction force of the specimen was applied to the indenter and then measured continuously throughout the test. Response of the system was accordingly recorded in the form of the load-displacement curve. The system response was then used to investigate the mechanical properties of the material, including hardness and the elastic modulus.

2.3. Surface Roughness (Sa)

Four discs from each resin composite were fabricated. Two discs without polishing and two discs were ground with #600-grit SiC paper (Sankyo Rikaga ku, Okegawa, Saitama, Japan) under running water in order to expose fillers by removing fillers free resin matrix that was cured under the plastic strip then measured each disc four times using a laser scanning confocal microscope CLSM (VK-X150, KEYENCE Co., Ltd., Osaka, Japan) before immersion in solution. The same discs measured again after immersion then typical 3D surface topography images and quantification of the 3D surface roughness parameter Sa (arithmetic mean deviation) were obtained [15].

2.4. Scanning Electron Microscope (SEM)

The Scanning Electron Microscope (SEM) images were obtained for two specimens from each of the non-polished groups before and after immersion, to evaluate the effect of storing on the resin surface. Discs were fabricated and cured without a covering matrix then moved to 99% ethanol sonication for five minutes before SEM to obtain a clear view of fillers content.

2.5. Statistical Analysis

Data were analyzed using the Statistical Package for Statistical Science (SPSS) version 20.0. Two-way analysis of variance was applied to detect any difference between groups, with nanoindentation and surface roughness as the dependent variable, the type of surface treatment (polishing/no polishing) and exposure to the alcoholic medium as the independent factors. Multiple comparisons were made by Bonferroni post-hoc test to determine whether groups are significantly different includes resin composite type.

3. Results

3.1. Hardness

In before storing group, polishing had significantly increased the hardness of the resin surfaces of BE2 and ESQ, whereas there was no significant change after polishing in APX and FSU. Results of APX resin surface was the highest among all tested groups (1.74 ± 0.1; p < 0.05). After storage, all groups showed a significant drop except in the polished surface groups of APX. ESQ hardness values were all <0.8 in all conditions that were exposed to.

3.2. Elastic Modulus

The elasticity results were not influenced by polishing. The APX results was the highest across all materials (46.4 ± 1.3) while ESQ (20.8 ± 0.7) was the lowest. Storage caused significant drop in all non polished groups, while its effect on polished groups was nonsignificant. There was no significant difference between BE2 and FSU in all conditions.

3.3. Surface Roughness

Roughness value of FSU resin surface seems to be the highest among all composite groups with an average (0.64 ± 0.01) before and after storing in the solution. For the polished surfaces no significant differences found between BE2 and the rest of measured groups even after storing in the solution for 1 week, only ESQ has dropped significantly (p < 0.05). Moreover, the results of nanoindentation hardness, elastic modulus, and surface roughness tests before and after 25% ethanol exposure in polished and non-polished surfaces are described in Table 2.

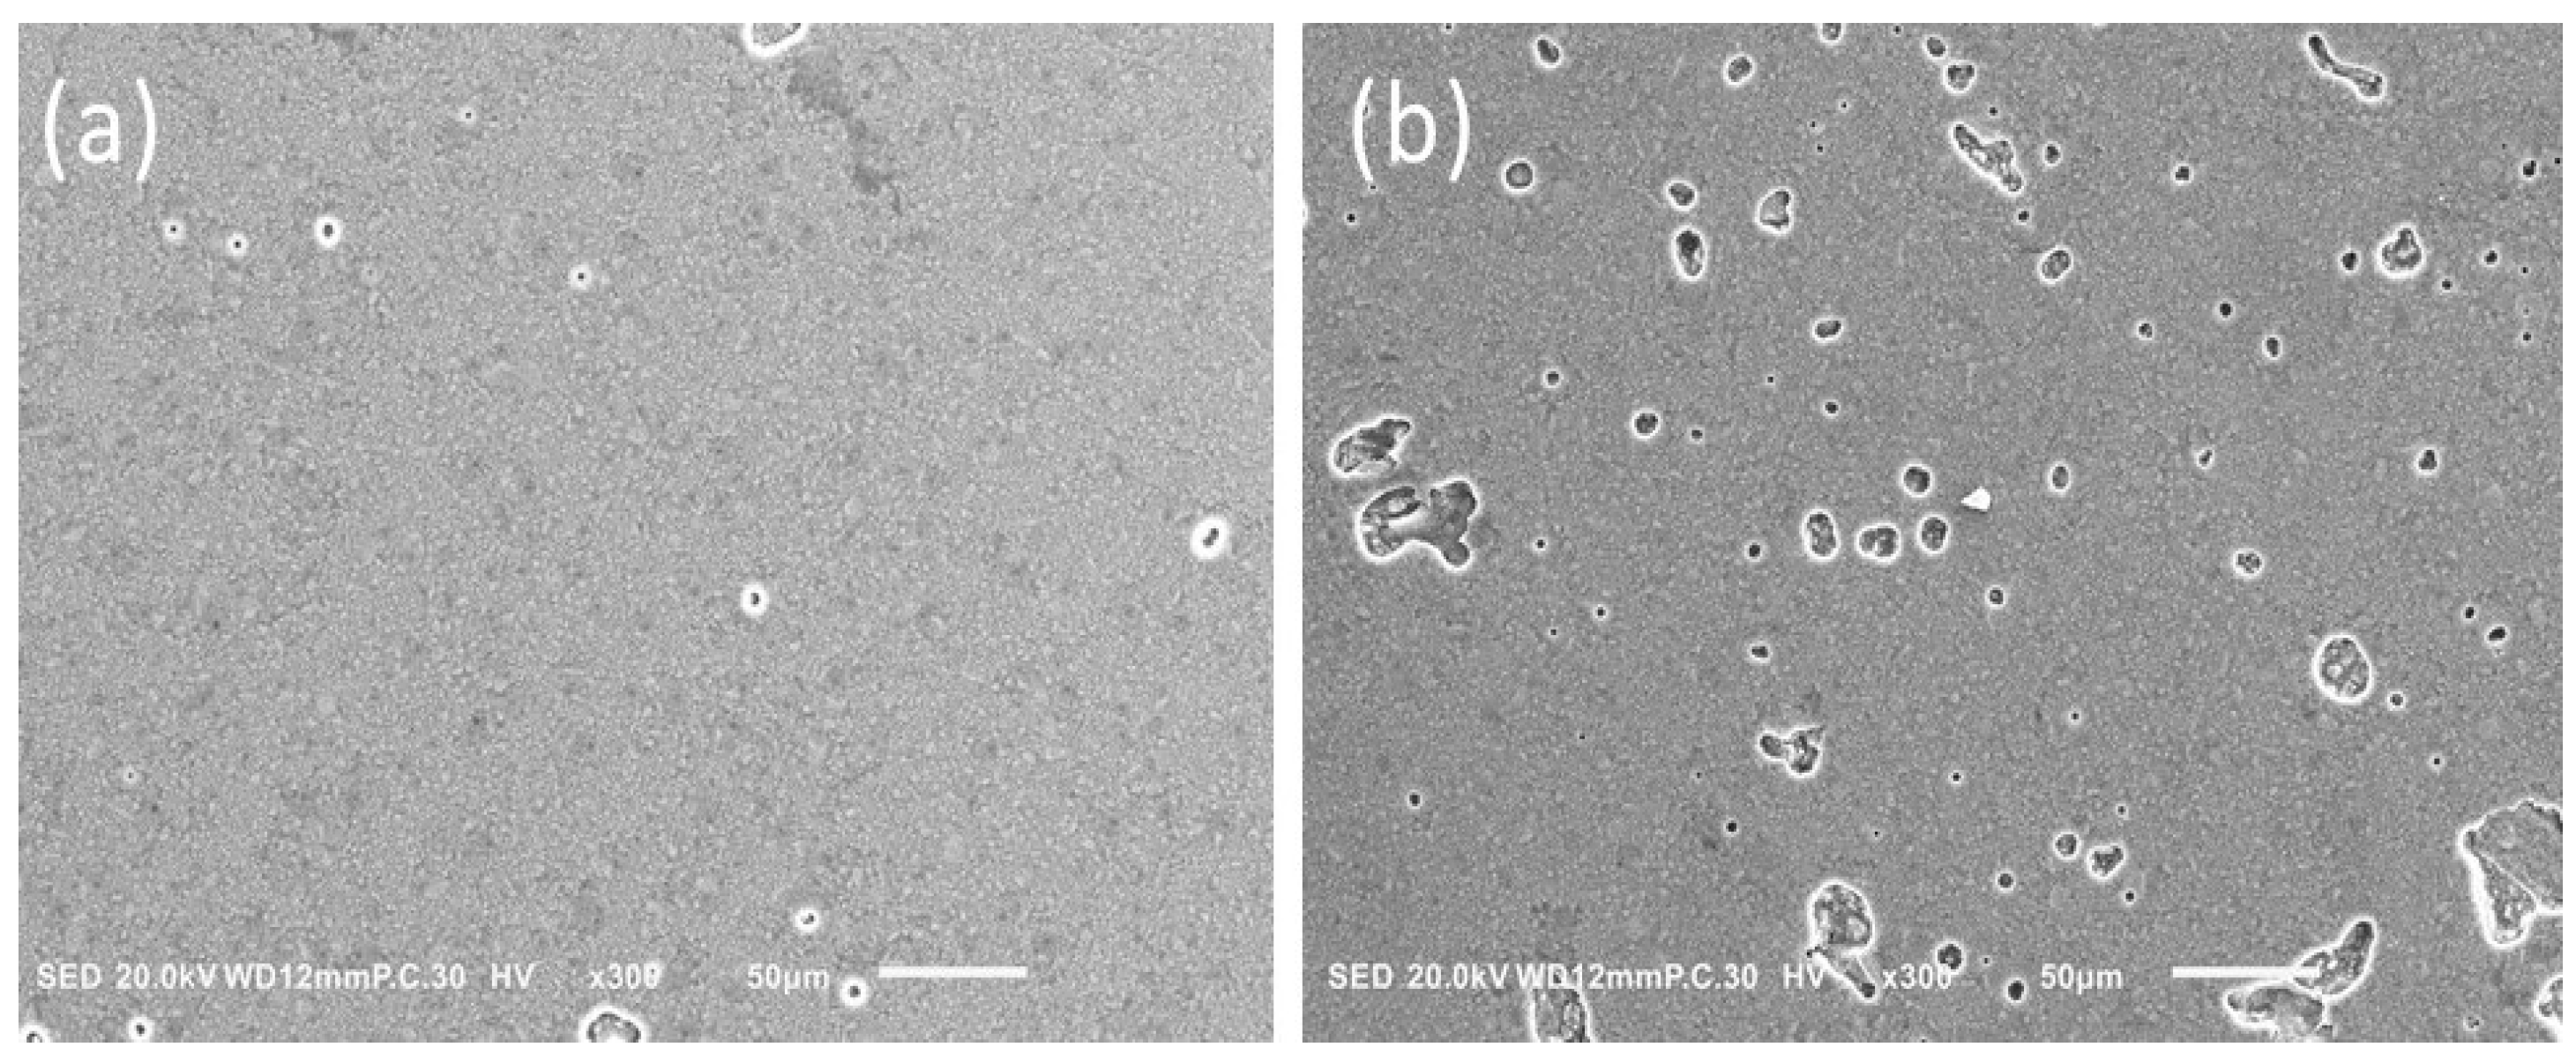
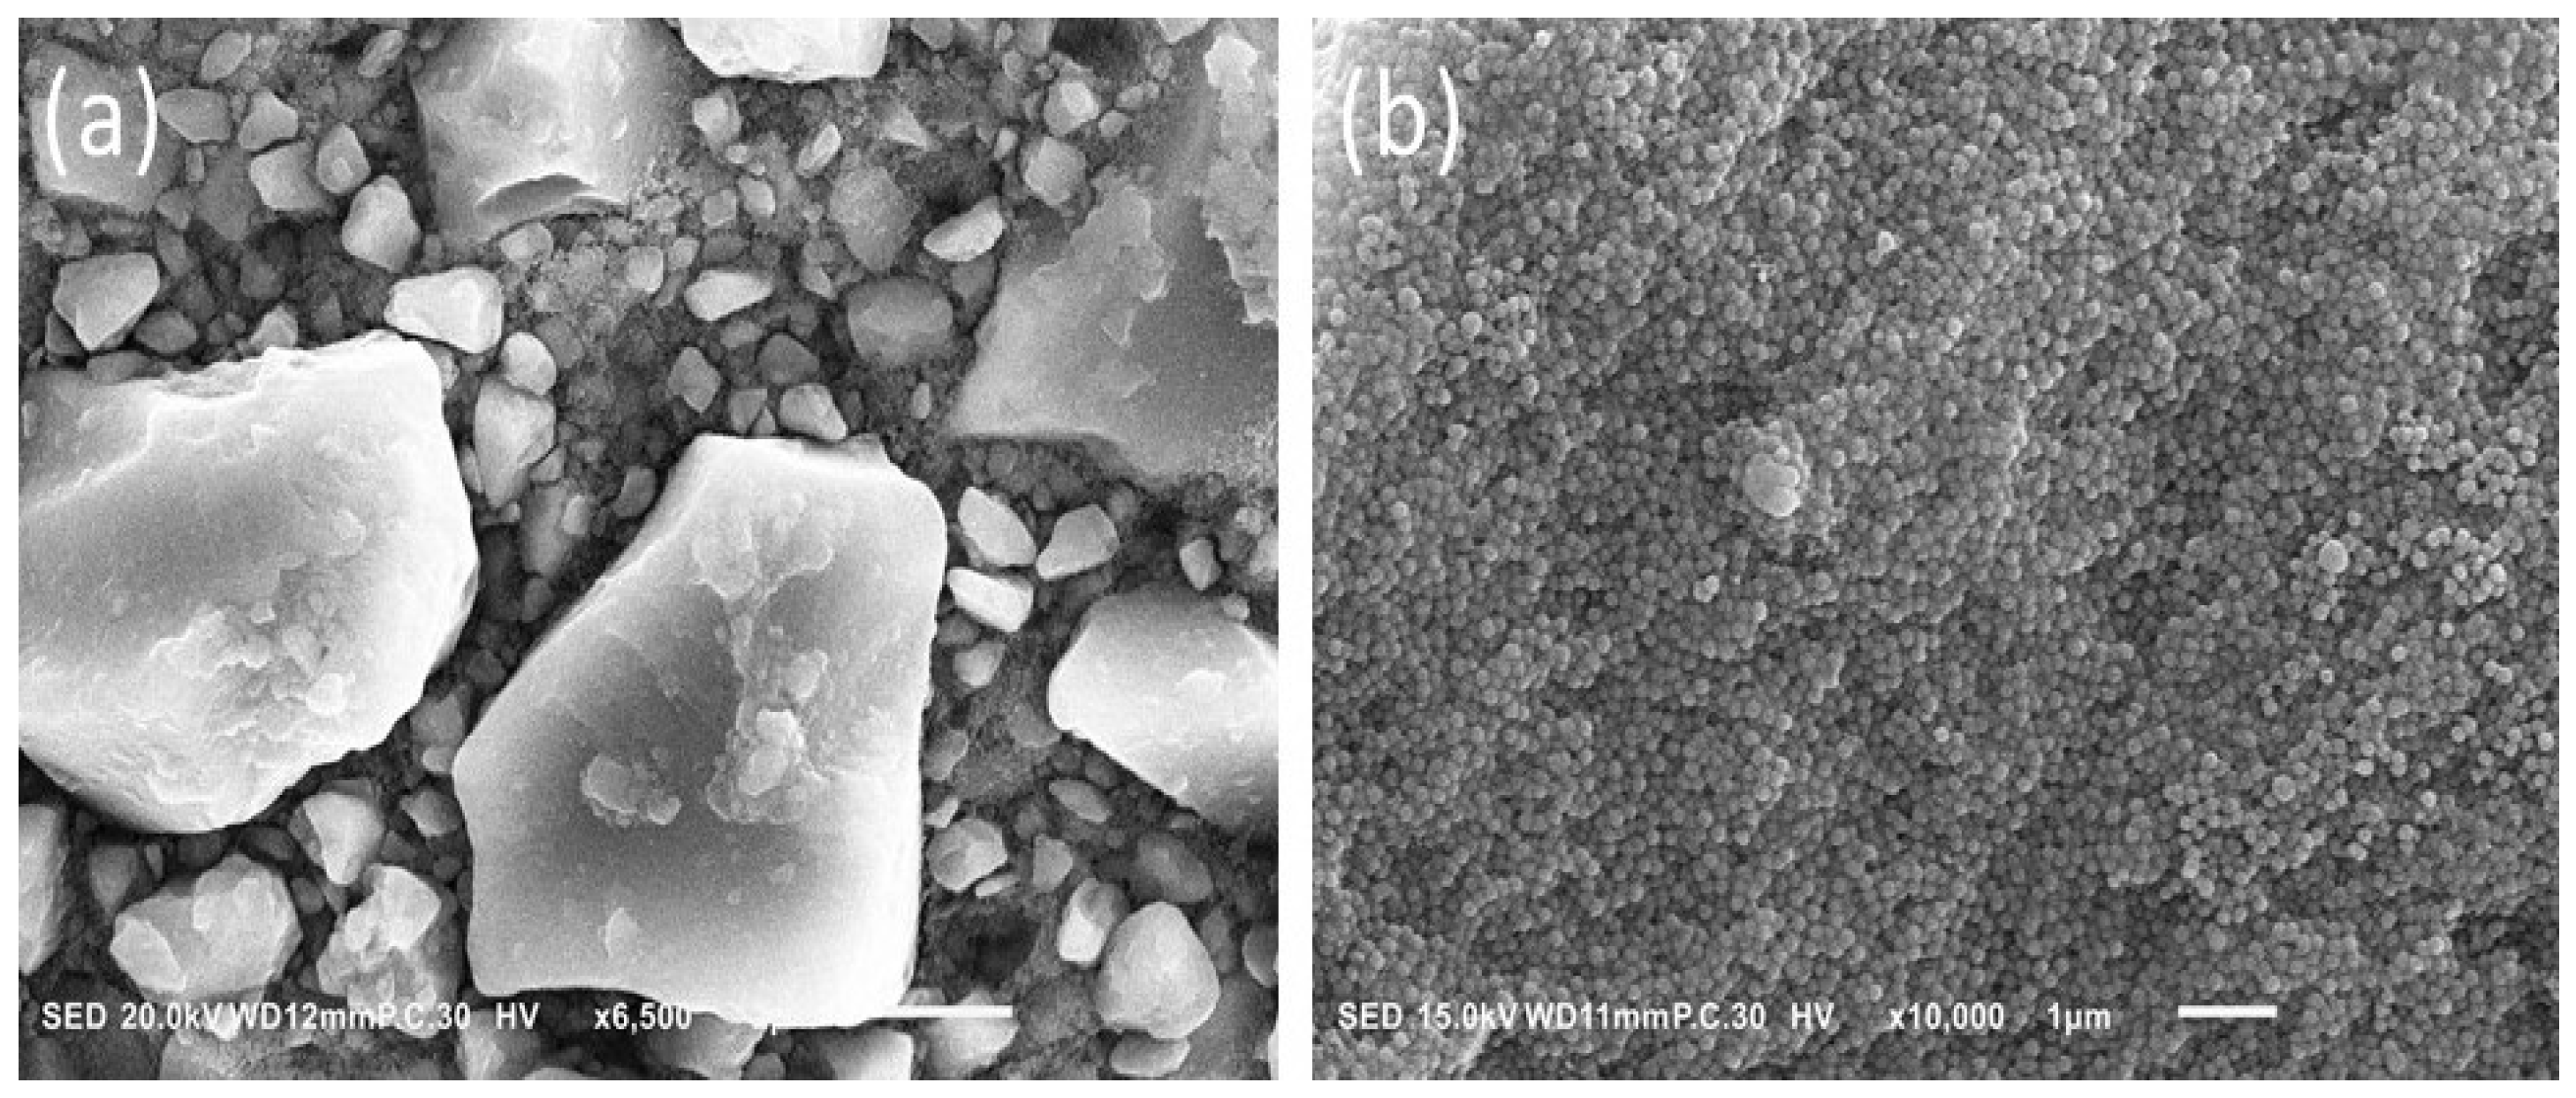
3.4. The SEM Analysis

The difference in the APX surface before and after immersion in the solution for one week is shown in Figure 2. This figure indicates plenty of micro holes were formed on the surface due to solvent action of the alcoholic medium. While Figure 3 illustrates the difference in fillers’ shape and size between APX and ESQ. ESQ fillers are spherical in shape and submicron size in contrary to the APX ones, which have an irregular shape and bigger size. Note that APX needed a ×6500 magnification whereas the ESQ required at least ×10,000 to clarify its fillers shape and size.

4. Discussion

The null hypothesis is mostly rejected since all tested materials showed significant differences between them except between FSU and BE2 there was no significant difference in elastic of modulus results. The hardness results in this study have been influenced by polishing in all composites especially before storing in the alcoholic medium. These findings were consistent with previous studies conducted by Park et al. (2000) and Michelle et al. (2006) [16,17]. Yet, the differences in hardness values before and after polishing could be attributed to the weak organic resin matrix that remained on the surface.
The variance in nanoindentation generally between each composite resin might be attributed to the fillers load and content that the resin formed on the surface is still influenced by the type of fillers lying underneath. The efforts to improve restorative materials have also focused on the impact of filler load on hardness. Tchorz et al. (2011) noted that both the filler size and load could change both the chemical and physical properties like reduced polymerization shrinkage and increased hardness [18]. However, the effect of the filler load on hardness occurs only up to a certain level and depends on the type of material under consideration [19]. Moreover, evidence has demonstrated that the filler size determine the hardness of resin composites and influence its mechanical properties [20,21]. Nevertheless, APX in the present study has shown the highest results in hardness and that could be attributed to the fillers load (86% weight). This has made the resin formed on the top beneath the glass slide during curing time subsequently thin and does not really play a major role in the surface hardness when removed by polishing prior to nanoindentation test.
The SEM findings illustrate the irregular shape of the APX micro hybrid fillers and the size ranges from 0.2 µm to 15 µm. The large size of APX fillers provided it with the superiority in term of mechanical properties. To explain this further, if the probe tip of the nano indenter hits a margin or a very small particle, the particle could break; whereas, if it strikes a large size particle, with respect to width and height, it obtains a more realistic measure of the particles’ properties [22]. On the other hand, the supra-nano size and spherical shape of ESQ fillers contribute to a noticeable filler load and smooth surface. However, the ESQ demonstrated the lowest level of surface hardness and elasticity in all conditions applied. Rastelli et al. (2012) reported that Filtek TMZ-250 had the highest hardness valued followed by FiltekTM Supreme, XT, and TPH. The difference in hardness was attributed to the filler size and the resin matrix content in each composite [21]. Nonetheless, it could be emphasized that the current study did not focus on the resin monomers differences due to the lack of the actual percentage of Bisphenol-A Glycidyl Methacrylate (Bis-GMA) and Tri-Ethylene Glycol Di-Methacrylate (TEGDMA) in the resin composites which had been held by manufacturers as trade secrets.
The water sorption level has considered a further aspect that may influence the hardness of resin composites depending on the morphology and composition of the materials. Studies examining the physical properties of different dental composites have shown that water sorption also varied with temperature, as well as the filler/matrix adhesion [21]. Furthermore, a negative association between water sorption and hardness has been reported. The resin composites with high sorption levels have been linked to lower hardness value. However, the duration in which the materials are kept on water will also affect the association between the two variables [23]. Moreover, other variables related to composites including resin matrix content as well as the filler size in the material under consideration were associated with water sorption. In this respect, Nagano et al. (2018) discussed the water sorption and solubility of the same tested materials. They found that the FSU = 27.5 was the highest resin composite in term of water sorption whereas the APX was the lowest = 13.5 [24]. These results were quite like the findings of our study with a slight difference centered on the fact that we used a 25% ethanol to mimic the oral conditions and helps to accelerate the composite deterioration monomers extraction (Figure 2). However, a recent critical review has demonstrated that water ageing tests could only present a determinate glance of the clinical performance of dental composite resin. While fatigue and thermal cycling tests could reproduce dynamic changes in stress and are considered valuable to mimic composite resin clinical performance [25]. This led to increase surface pores of the same composite after one week immersion resulting in increased surface roughness which consequently affected the hardness level if the tip of indentator hits this area. Yet, Zhang et al. (2002) proved that the rougher the indented surface, the more the energy scattered during the plastic deformation [26]. In the present study, the hardness and elastic of modulus values had changed after immersion in the medium specially in resin surface groups. In polished groups, some of the materials did not change in behavior after storing such as APX that due to the limited effect of the resin monomers content in this material on the nanoindentation measurements.
The dental literature has revealed mixed findings on the relationship between the degree of conversion and the composite hardness. Abuelenain et al. (2017) reported that the surface hardness of the resin-based composites depends on the filler type and size, the nature of monomers used and the degree of conversion [27]. However, in other work no significant correlation between the surface hardness of the composite resin and the degree of conversion [28]. Based on our previous research conducted on the same materials used in this present study, the ESQ showed the highest degree of conversion, but it showed the lowest values in elastic modulus and hardness which reflects a negative relationship between degree of conversion and hardness values of the material [29]. Therefore, further investigations and tests are required to explore the link between hardness and the degree of conversion with emphasis on examining how other parameters such as the filler size may influence the correlation between hardness and the degree of conversion. A further research direction might focus on exploring the survival rate of the resin composites with polished and non-polished resin composites’ surfaces and the impacts of these two surfaces on the individuals’ oral health quality of life.
A key limitation of this study is the fact that the resin monomers differences were not examined due to the lack of the actual percentage of the Bis-GMA and the TEGDMA in the resin composites which had been held by manufacturers as trade secrets. However, the present study provides insight into hardness and elastic modulus of four different resin composites with emphasis on the significance of surface’s polishing before insertion into the oral cavity. A second limitation of this study was that the SEM findings of polished samples before and after ageing were not described. Yet, future research may focus on exploring the SEM analysis of both polished and non-polished samples before and after ageing.

5. Conclusions

Hardness and elastic modulus depend on the fillers load and particle size. The APX is the highest in term of hardness due to the fillers load and size while the ESQ is the lowest because all fillers in nano size and distributed homogenously. The clinical implication of the present study highlights the importance of surface polishing of every resin composite restoration placed in the oral cavity. Some clinicians advocate maintaining the resin surface for a glossy appearance and less biofilm attachment to this smooth surface especially in the area that does not require a recontouring or reshaping; yet the physical properties in this case will be affected if the polishing process has not been performed. Evaluating the effects of polished surface of other types of composite resin and examining their mechanical and physical properties to confirm the findings of this study may be recommended.

Author Contributions

Conceptualization, D.A., A.A., A.S., A.A.H.A. and K.H.; methodology, D.A., A.A., A.S., A.A.H.A. and K.H.; software, D.A., A.A., A.S., A.A.H.A. and K.H.; validation, D.A., A.A., A.S., A.A.H.A. and K.H.; formal analysis, D.A., A.A. and A.A.H.A.; investigation, D.A., A.A., A.S., A.A.H.A. and K.H.; resources, D.A. and K.H.; data curation, D.A., A.A.H.A. and K.H.; writing—original draft preparation, D.A., A.A., A.S., A.A.H.A. and K.H.; writing—review and editing, D.A., A.A. and A.A.H.A.; visualization, D.A., A.A., A.S., A.A.H.A. and K.H.; supervision, D.A.; project administration, D.A. All authors have read and agreed to the published version of the manuscript.

Funding

This article did not receive any specific grant from funding agencies in the public, commercial, or not-for-profit sectors.

Institutional Review Board Statement

Not applicable.

Informed Consent Statement

Not applicable.

Data Availability Statement

The data supporting the findings of the article is available upon request form the main author Dhaifallah Alqarni ([email protected]).

Acknowledgments

We would like to acknowledge the Cariology and Operative Dentistry Laboratories at the Tokyo Medical and Dental University, Japan, for their technical supports and facilitation of conducting this experiment.

Conflicts of Interest

The authors report no conflict and/or competing of interest.

References

  1. Rasines Alcaraz, M.G.; Veitz-Keenan, A.; Sahrmann, P.; Schmidlin, P.R.; Davis, D.; Iheozor-Ejiofor, Z. Direct composite resin fillings versus amalgam fillings for permanent or adult posterior teeth. Cochrane Database Syst. Rev. 2014, 3, 14–27. [Google Scholar] [CrossRef] [Green Version]
  2. Habib, E.; Wang, R.; Wang, Y.; Zhu, M.; Zhu, X. Inorganic fillers for dental resin composites—Present and future. ACS Biomater. Sci. Eng. 2015, 2, 1–11. [Google Scholar] [CrossRef] [PubMed]
  3. Farsi, N.J.; Farsi, D.J.; Aldajani, M.B.; Farsi, N.M.; El-Housseiny, A.A. Sustainability of Improvement in Oral Health-Related Quality of Life in Children After Dental Treatment. Patient Prefer. Adherence 2021, 15, 271–281. [Google Scholar] [CrossRef]
  4. Guillonneau, G.; Kermouche, G.; Bec, S.; Loubet, J. Determination of mechanical properties by nanoindentation independently of indentation depth measurement. J. Mater. Res. 2012, 27, 2551–2560. [Google Scholar] [CrossRef] [Green Version]
  5. Peskersoy, C.; Culha, O. Comparative evaluation of mechanical properties of dental nanomaterials. J. Nanomater. 2017, 8, 6171578. [Google Scholar] [CrossRef]
  6. El-Safty, S.; Akhtar, R.; Silikas, N.; Watts, D.C. Nanomechanical properties of dental resin-composites. Dent. Mater. 2012, 28, 1292–1300. [Google Scholar] [CrossRef]
  7. Sauro, S.; Osorio, R.; Watson, T.F.; Toledano, M. Assessment of the quality of resin-dentin bonded interfaces: An AFM nano-indentation, muTBS and confocal ultramorphology study. Dent. Mater. 2012, 28, 622–631. [Google Scholar] [CrossRef]
  8. Wang, Z.; Volinsky, A.A.; Gallant, N.D. Nanoindentation study of polydimethylsiloxane elastic modulus using berkovich and flat punch tips. J. Appl. Polym. Sci. 2015, 132, 1–7. [Google Scholar] [CrossRef] [Green Version]
  9. Alrobeigy, N. Mechanical properties of contemporary resin composites determined by nanoindentation. Tanta Dent. J. 2017, 14, 129–138. [Google Scholar] [CrossRef]
  10. Salerno, M.; Derchi, G.; Thorat, S.; Ceseracciu, L.; Ruffilli, R.; Barone, A.C. Surface morphology and mechanical properties of new-generation flowable resin composites for dental restoration. Dent. Mater. 2011, 27, 1221–1228. [Google Scholar] [CrossRef] [PubMed]
  11. Lohbauer, U.; Belli, R.; Ferracane, J.L. Factors involved in mechanical fatigue degradation of dental resin composites. J. Dent. Res. 2013, 92, 584–591. [Google Scholar] [CrossRef] [Green Version]
  12. Patel, D.K.; Kalidindi, S.R. Correlation of spherical nanoindentation stress-strain curves to simple compression stress-strain curves for elastic-plastic isotropic materials using finite element models. Acta Mater. 2016, 112, 295–302. [Google Scholar] [CrossRef] [Green Version]
  13. De Moraes Porto, I.C.; Das Neves, L.E.; De Souza, C.K.; Parolia, A.; Barbosa dos Santos, N. A comparative effect of mouthwashes with different alcohol concentrations on surface hardness, sorption and solubility of composite resins. Oral Health Dent. Manag. 2014, 13, 502–506. [Google Scholar]
  14. Jaramillo-Cartagena, R.; López-Galeano, E.J.; Latorre-Correa, F.; Agudelo-Suárez, A.A. Effect of Polishing Systems on the Surface Roughness of Nano-Hybrid and Nano-Filling Composite Resins: A Systematic Review. Dent. J. 2021, 9, 95–112. [Google Scholar] [CrossRef]
  15. Cho, E.; Sadr, A.; Inai, N.; Tagami, J. Evaluation of resin composite polymerization by three dimensional micro-CT imaging and nanoindentation. Dent. Mater. 2011, 27, 1070–1078. [Google Scholar] [CrossRef] [PubMed]
  16. Park, S.H.; Krejci, I.; Lutz, F. Hardness of celluloid strip-finished or polished composite surfaces with time. J. Prosthet Dent. 2000, 83, 660–663. [Google Scholar] [CrossRef] [PubMed] [Green Version]
  17. Chinelatti, M.A.; Chimello, D.T.; Ramos, R.P.; Palma-Dibb, R.G. Evaluation of the surface hardness of composite resins before and after polishing at different times. J. Appl. Oral Sci. 2006, 14, 188–192. [Google Scholar] [CrossRef] [Green Version]
  18. Tchorz, J.P.; Doll, R.; Wolkewitz, M.; Hellwig, E.; Hannig, C. Microhardness of composite materials with different organic phases in deep class II cavities: An in vitro study. Oper. Dent. 2011, 36, 502–511. [Google Scholar] [CrossRef]
  19. Lindberg, A. Resin Composites: Sandwich Restorations and Curing Techniques. Ph.D. Thesis, University Odontological Dissertations, Umeå, Sweden, 2005; Volume 1; pp. 1–65.
  20. García-Contreras, R.; Scougall-Vilchis, R.; Acosta-Torres, L.; Arenas-Arrocena, C.; García-Garduño, R.; de la Fuente-Hernández, J. Vickers microhardness comparison of 4 composite resins with different types of filler. J. Oral Res. 2015, 4, 313–320. [Google Scholar] [CrossRef]
  21. Rastelli, A.N.; Jacomassi, D.P.; Faloni, A.P.; Queiroz, T.P.; Rojas, S.S.; Bernardi, M.I.B.; Bagnato, V.S.; Hernandes, A.C. The filler content of the dental composite resins and their influence on different properties. Microsc. Res. Tech. 2012, 75, 758–765. [Google Scholar] [CrossRef] [PubMed]
  22. Drummond, J.L. Nanoindentation of dental composites. J. Biomed. Mater. Res. B Appl. Biomater. 2006, 78, 27–34. [Google Scholar] [CrossRef]
  23. Erdemir, U.; Yildiz, E.; Eren, M.M.; Ozel, S. Surface hardness evaluation of different composite resin materials: Influence of sports and energy drinks immersion after a short-term period. J. Appl. Oral Sci. 2013, 21, 124–131. [Google Scholar] [CrossRef] [Green Version]
  24. Nagano, D.; Nakajima, M.; Takahashi, M.; Ikeda, M.; Hosaka, K.; Sato, K.; Prasansuttipom, T.; Foxton, R.M.; Tagami, J. Effect of water aging of adherend composite on repair bond strength of nanofilled composites. J. Adhes Dent. 2018, 20, 425–433. [Google Scholar] [CrossRef]
  25. Szczesio-Wlodarczyk, A.; Sokolowski, J.; Kleczewska, J.; Bociong, K. Ageing of Dental Composites Based on Methacrylate Resins—A Critical Review of the Causes and Method of Assessment. Polymers 2020, 12, 882. [Google Scholar] [CrossRef] [PubMed]
  26. Zhang, T.; Xu, W. Surface effects on nanoindentation. J. Mater. Res. 2002, 17, 1715–1720. [Google Scholar] [CrossRef] [Green Version]
  27. Abuelenain, D.; Abou Neel, E.; Al-Dharrab, A. Surface characterization and mechanical behavior of bulk fill versus incremental dental composites. Tanta Dent. J. 2017, 14, 56–61. [Google Scholar] [CrossRef]
  28. Abed, Y.A.; Sabry, H.A.; Alrobeigy, N.A. Degree of conversion and surface hardness of bulk-fill composite versus incremental-fill composite. Tanta Dent. J. 2015, 12, 71–80. [Google Scholar] [CrossRef]
  29. Alqarni, D.; Nakajima, M.; Hosaka, K.; Ide, K.; Nagano, D.; Wada, T.; Ikeda, M.; Mamanee, T.; Thanatvarakorn, O.; Prasansuttiporn, T.; et al. The repair bond strength to resin matrix in cured resin composites after water aging. Dent. Mater. J. 2019, 38, 233–240. [Google Scholar] [CrossRef] [Green Version]
Figure 1. Schematical Specimens Preparation.
Jcs 05 00327 g001
Figure 2. Difference in APX surface before (a) and after (b) immersion in solution for one week.
Jcs 05 00327 g002
Figure 3. Difference in fillers’ shape and size between APX (a) and ESQ (b).
Jcs 05 00327 g003
Table 1. Compositions of the four resin composites used in this study.
MaterialManufacturerCompositions
Clearfil AP-X (APX)Kuraray Noritake Dental Corp., Tokyo, JapanBarium glass filler, colloidal silica fillers, filler load 85 wt% (71 vol%), bis-GMA, TEGDMA
Beautifil II (BE2)Shofu Inc., Kyoto, JapanAluminofluoro-borosilicate glass, S-PRG fillers, filler load 83.3 wt% (68.6 vol%), bis-GMA, TEGDMA
Estelite Sigma Quick (ESQ)Tokuyama Dental Corp., Tokyo, JapanSilica–zirconia fillers, Silica–titania fillers, filler load 82 wt% (71 vol%), bis-GMA, TEGDMA
FiltekTM Supreme Ultra Universal restorative (FSU)3M, St. Paul, MN, USANon-agglomerated/non-aggregated zirconia, silica, Aggregated zirconia/silica clusters, filler load 78.5 wt% (63.3 vol%), biGMA, UDMA, TEGDMA, bisEMA, PEGDMA
10-MDP: 10-Methacryloyloxydecyl dihydrogen phosphate; HEMA: 2-hydroxyethyl methacrylate; Bis-GMA: bisphenol A-glycidyl methacrylate; TEGDMA: triethyleneglycol dimethacrylate; PEGDMA: Poly (ethylene glycol) dimethacrylate; BisEMA: Ethoxylated bisphenol-A-glycol dimethacrylate; UDMA: urethane dimethacrylate; MMA: methyl methacrylate; S-PRG: Surface pre-reacted glass.
Table 2. Nanoindentation hardness, elastic modulus, and surface roughness tests before and after 25% ethanol exposure in polished and non-polished surfaces.
Storing ConditionSurface ConditionBeautifil II(BE2)Clearfil AP-X (APX)Filtek Supreme Ultra (FSU)Estelite Sigma Quick (ESQ)
Hardness (GPa)
Before storingNon-polished1.13 ± 0.08 a1.74 ± 0.1 A1.16 ± 0.05 FHa0.7 ± 0.03 I
Polished1.24 ± 0.04 c1.77 ± 0.7 ABCbc1.39 ± 0.5 EFGb0.8 ± 0.02
After one week storingNon-polished0.85 ± 0.031.51 ± 0.07 B0.68 ± 0.07 E0.4 ± 0.03
Polished1.02 ± 0.2 df1.21 ± 0.38 Cde0.99 ± 0.2 GHef0.6 ± 0.1 I
Elastic Modulus (GPa)
Before storingNon-polished29.5 ± 0.08 Aa46.4 ± 1.3 E28.5 ± 0.7 IKa20.8 ± 0.7 L
Polished29.8 ± 7.0 ABCb48.2 ± 14.5 EFG29.7 ± 9.4 IJb18.9 ± 3.6 L
After one week storingNon-polished23.2 ± 0.9 BDc40.9 ± 1.3 FH19.1 ± 1.2 c13.3 ± 0.3
Polished27.0 ± 4.0 CDd36.4 ± 8.3 GH24.5 ± 4.7 JKd16.2 ± 2.3
Surface Roughness (µm)
Before storingNon-polished0.37 ± 0.01 A0.13 ± 0.020.64 ± 0.010.27 ± 0.01
Polished1.7 ± 0.58 Babc1.2 ± 0.21 aC1.5 ± 0.09 bD1.96 ± 0.24 c
After one week storingNon-polished0.38 ± 0.01 Ad0.35 ± 0.01 e0.71 ± 0.030.47 ± 0.19 de
Polished1.29 ± 0.1 Bf1.09 ± 0.09 C1.63 ± 0.17 D1.27 ± 0.1 f
Values are mean ± SD (standard deviation). Uppercase letters refer to column. Lowercase letters refer to row. Same superscript letters indicate no statistically significant differences in rows and columns (p < 0.05).
Publisher’s Note: MDPI stays neutral with regard to jurisdictional claims in published maps and institutional affiliations.

