Article

Solid-State Hydrogen Fuel by PSII–Chitin Composite and Application to Biofuel Cell

Faculty of Science & Engineering, Setsunan University, Ikeda-Nakamachi, Neyagawa 572-8508, Japan
*
Author to whom correspondence should be addressed.
J. Compos. Sci. 2021, 5(12), 317; https://doi.org/10.3390/jcs5120317
Submission received: 11 November 2021 / Revised: 28 November 2021 / Accepted: 29 November 2021 / Published: 1 December 2021
(This article belongs to the Special Issue Feature Papers in Journal of Composites Science in 2021)

Abstract

:
Biomaterials attract a lot of attention as next-generation materials. Especially in the energy field, fuel cells based on biomaterials can further develop clean next-generation energy and are focused on with great interest. In this study, solid-state hydrogen fuel (PSII–chitin composite) composed of the photosystem II (PSII) and hydrated chitin composite was successfully created. Moreover, a biofuel cell consisting of the electrolyte of chitin and the hydrogen fuel using the PSII–chitin composite was fabricated, and its characteristic feature was investigated. We found that proton conductivity in the PSII–chitin composite increases by light irradiation. This result indicates that protons generate in the PSII–chitin composite by light irradiation. It was also found that the biofuel cell using the PSII–chitin composite hydrogen fuel and the chitin electrolyte exhibits the maximum power density of 0.19 mW/cm2. In addition, this biofuel cell can drive an LED lamp. These results indicate that the solid-state biofuel cell based on the bioelectrolyte “chitin” and biofuel “the PSII–chitin composite” can be realized. This novel solid-state fuel cell will be helpful to the fabrication of next-generation energy.

1. Introduction

As is well known, environmentally friendly energies are strongly required as next-generation energy. In particular, hydrogen energy, which reduces CO2 emissions during power generation, is focused on as next-generation clean energy [1,2,3]. However, in general, hydrogen gases are artificially produced from fossil fuels [4,5,6,7,8]. Therefore, a method to generate hydrogen gas without using fossil fuels is also significantly important. Fuel cells are the most common way to obtain energy from hydrogen. It is known that energy generation using a fuel cell is achieved by a simple reaction of H2 +1/2O2 → H2O [9]. Therefore, the efficiency of power generation becomes high. Concerning the materials contributing to the hydrogen energy, the biomaterial is focused. Biomaterials have the ability to transport and produce hydrogen ions and are expected to be used as fuels and electrolytes for fuel cells. For example, materials such as DNA, collagen, chitin, and chitosan exhibit relatively high-proton conductivity by hydration and can be used as the fuel-cell electrolyte [10,11,12,13,14,15,16,17,18]. Furthermore, many studies were conducted on hydrogen production using biomaterials, such as enzyme reactions, microbial electrolysis-cell reactions, fermentative reactions, and reactions using the anaerobic environment of the algae [19,20,21,22,23,24,25,26,27]. In addition to these reactions, hydrogen ions are produced in the process of photosynthesis reaction, which proceeds on the Thylakoid membrane. The Thylakoid membrane includes the membrane protein complexes such as photosystem I (PSI) and photosystem II (PSII), and the manganese (Mn) cluster in PSII deprotonates water molecules [28,29,30]. Therefore, proton and electron transfers and water-splitting reactions are achieved by the light absorption of PSII [31,32,33]. In the general photosynthetic reaction, the generated electrons are used in the NADPH reaction at PSI, and the generated hydrogen ions are passed to ATP synthase. However, if we can extract PSII independently, we can directly use hydrogen ions and electrons generated by light irradiation as a fuel. Miyao, Shen, and Enami reported that PSII could be extracted by the surfactant [34,35]. Therefore, using this method, we can extract PSII using surfactants and obtain hydrogen ions. We recently investigated the hydrogen generation of the PSII solution by light irradiation and fabricated the biofuel cell using the fuel of the PSII solution and the collagen electrolyte [36]. As a result, we found that by controlling the non-ionic surfactant concentration in the PSII solution, the hydrogen can be generated from the PSII solution by light irradiation. Further, it was also found that the PSII solution becomes the fuel of the fuel cells based on collagen electrolytes. Thus, in the previous works, we successfully fabricated the biofuel cell composed of the hydrogen fuel of the PSII solution and collagen electrolyte, concerning electrolyte and fuel, which are important elements in the fuel cell. However, the problem of the fuel being liquid has not been solved yet. By solidifying hydrogen fuel, there are a lot of advantages; for example, convenient to carry, corrosion-proof, no leakage of PSII solution, etc. In particular, the fact that the PSII solution does not leak during transportation will significantly improve the convenience of energy use. For this purpose, it is necessary to change the material from liquid to solid. Therefore, in this study, we attempted to convert PSII hydrogen fuel into solid form and fabricated the biofuel cell based on the solid-state PSII hydrogen fuel and chitin electrolyte. By realization of the solidification of hydrogen fuel, rapid progress for the fuel cell will be realized. In addition, this work will help facilitate the study of new environmentally friendly hydrogen-energy sources.

2. Materials and Methods

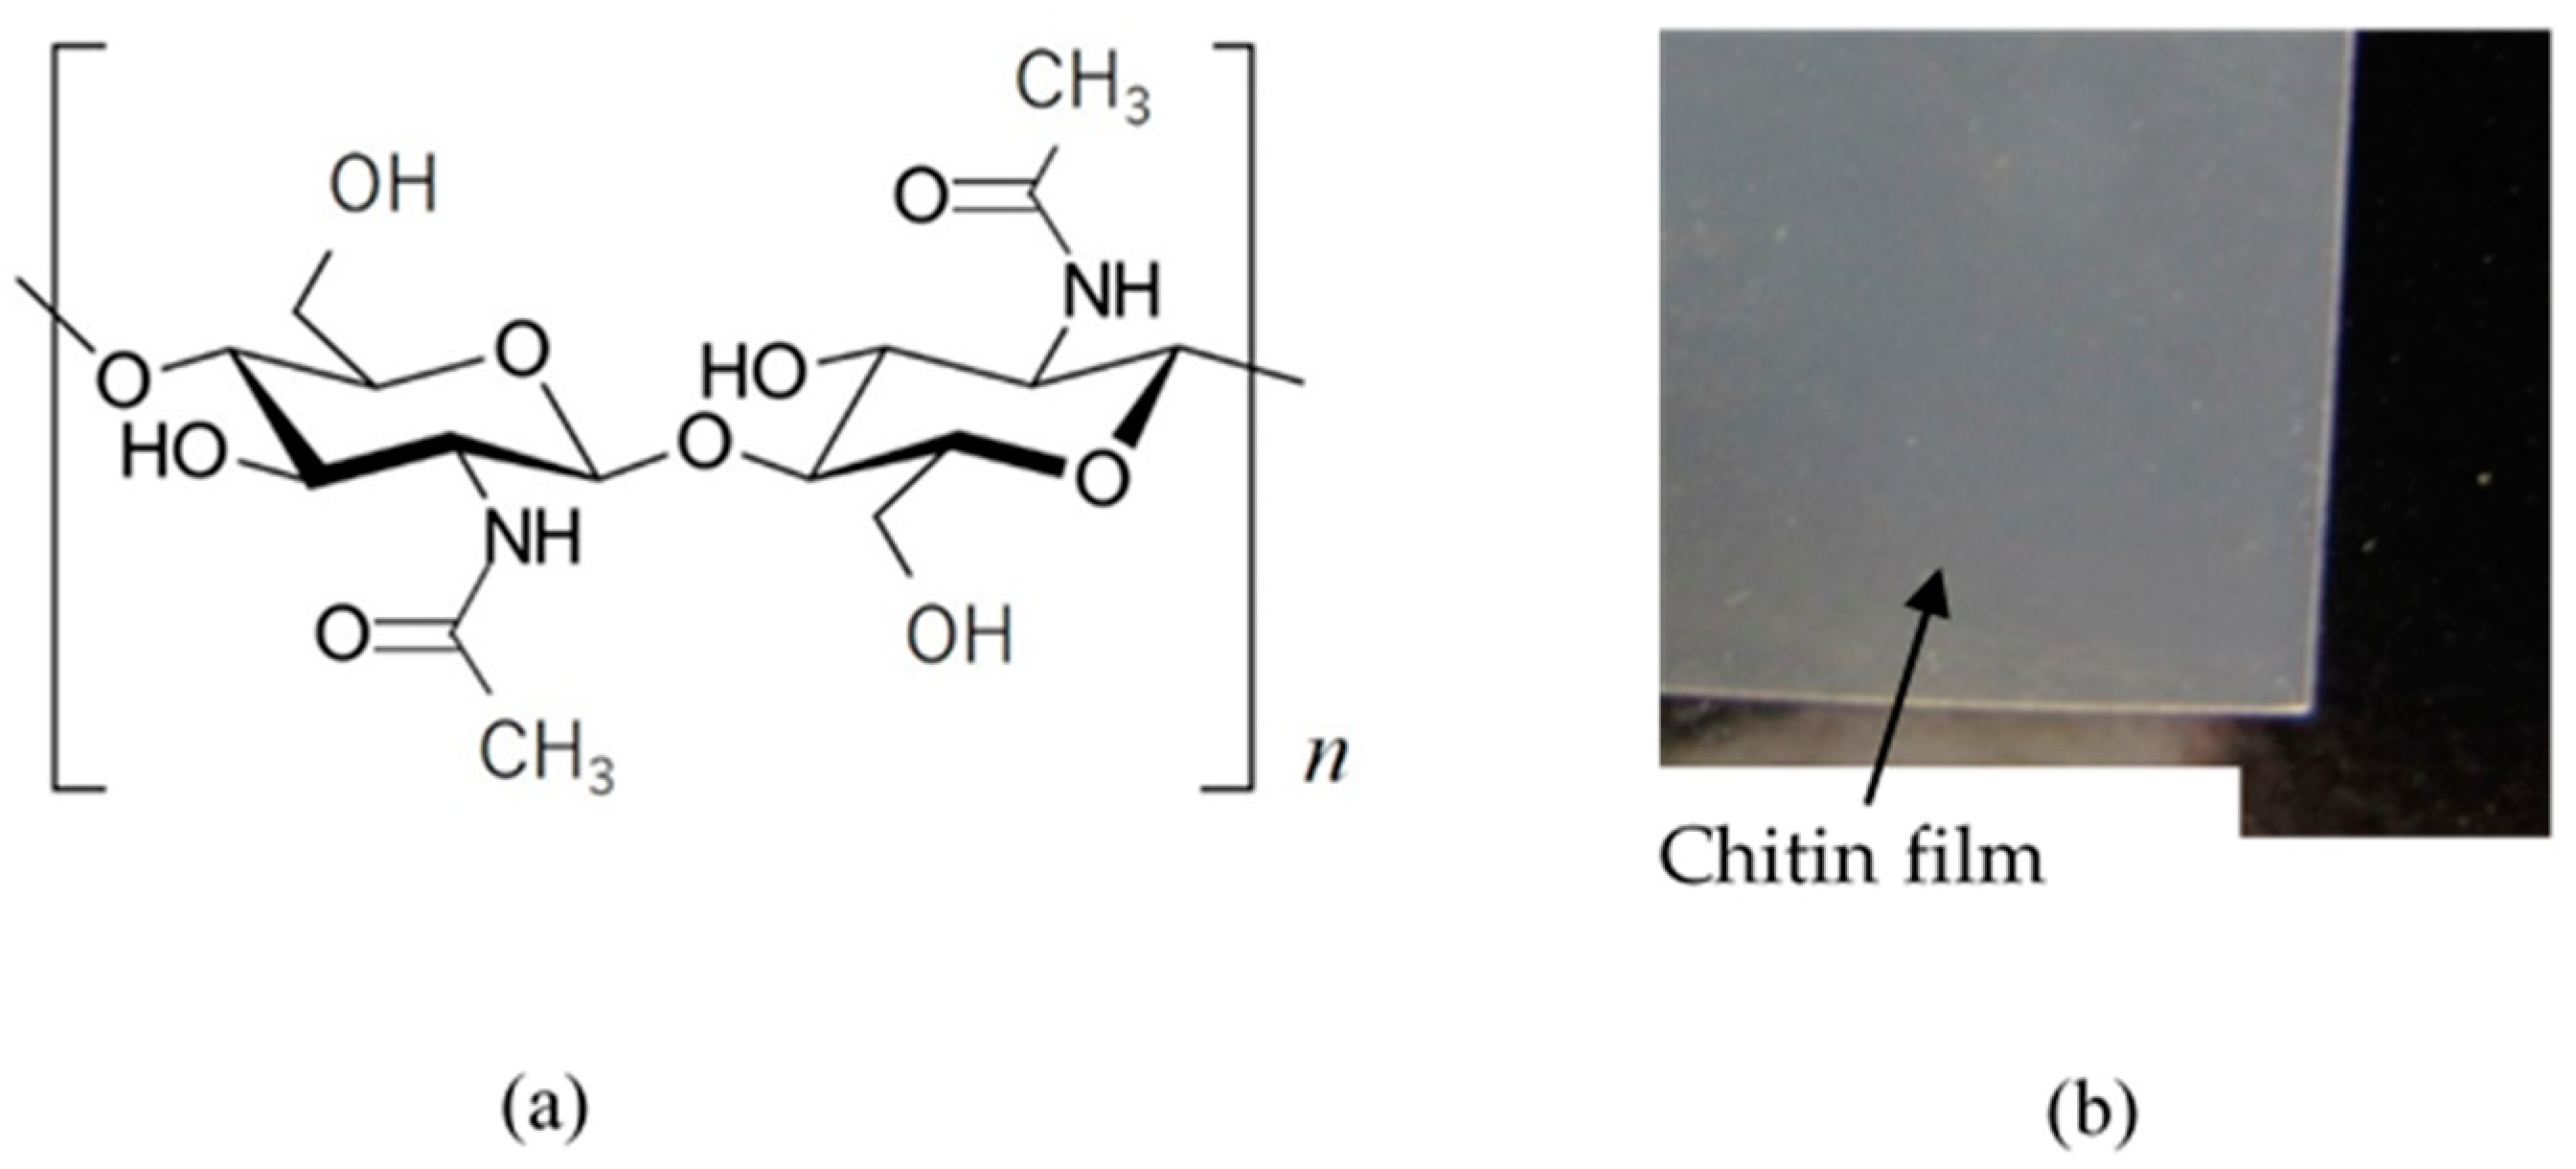
2.1. Bioelectrolyte “Chitin”

Chitin is the chemical formula of (C8H13O5N)n and consists of a long-chain polymer of N-acetyl-glucosamine. Figure 1 shows the chemical formula and photograph of the chitin film. In the present study, the purified chitin slurry (Sugino Machine Limited, Uozu, Japan) was used to prepare the chitin film. The purified chitin slurry was sufficiently dispersed in distilled water, and the chitin films were grown by suction filtration at room temperature. In suction filtration, the PTFE hydrophilic filter with a hole of 0.2 μm diameter was used. The film thickness was adjusted to approximately 80 μm.

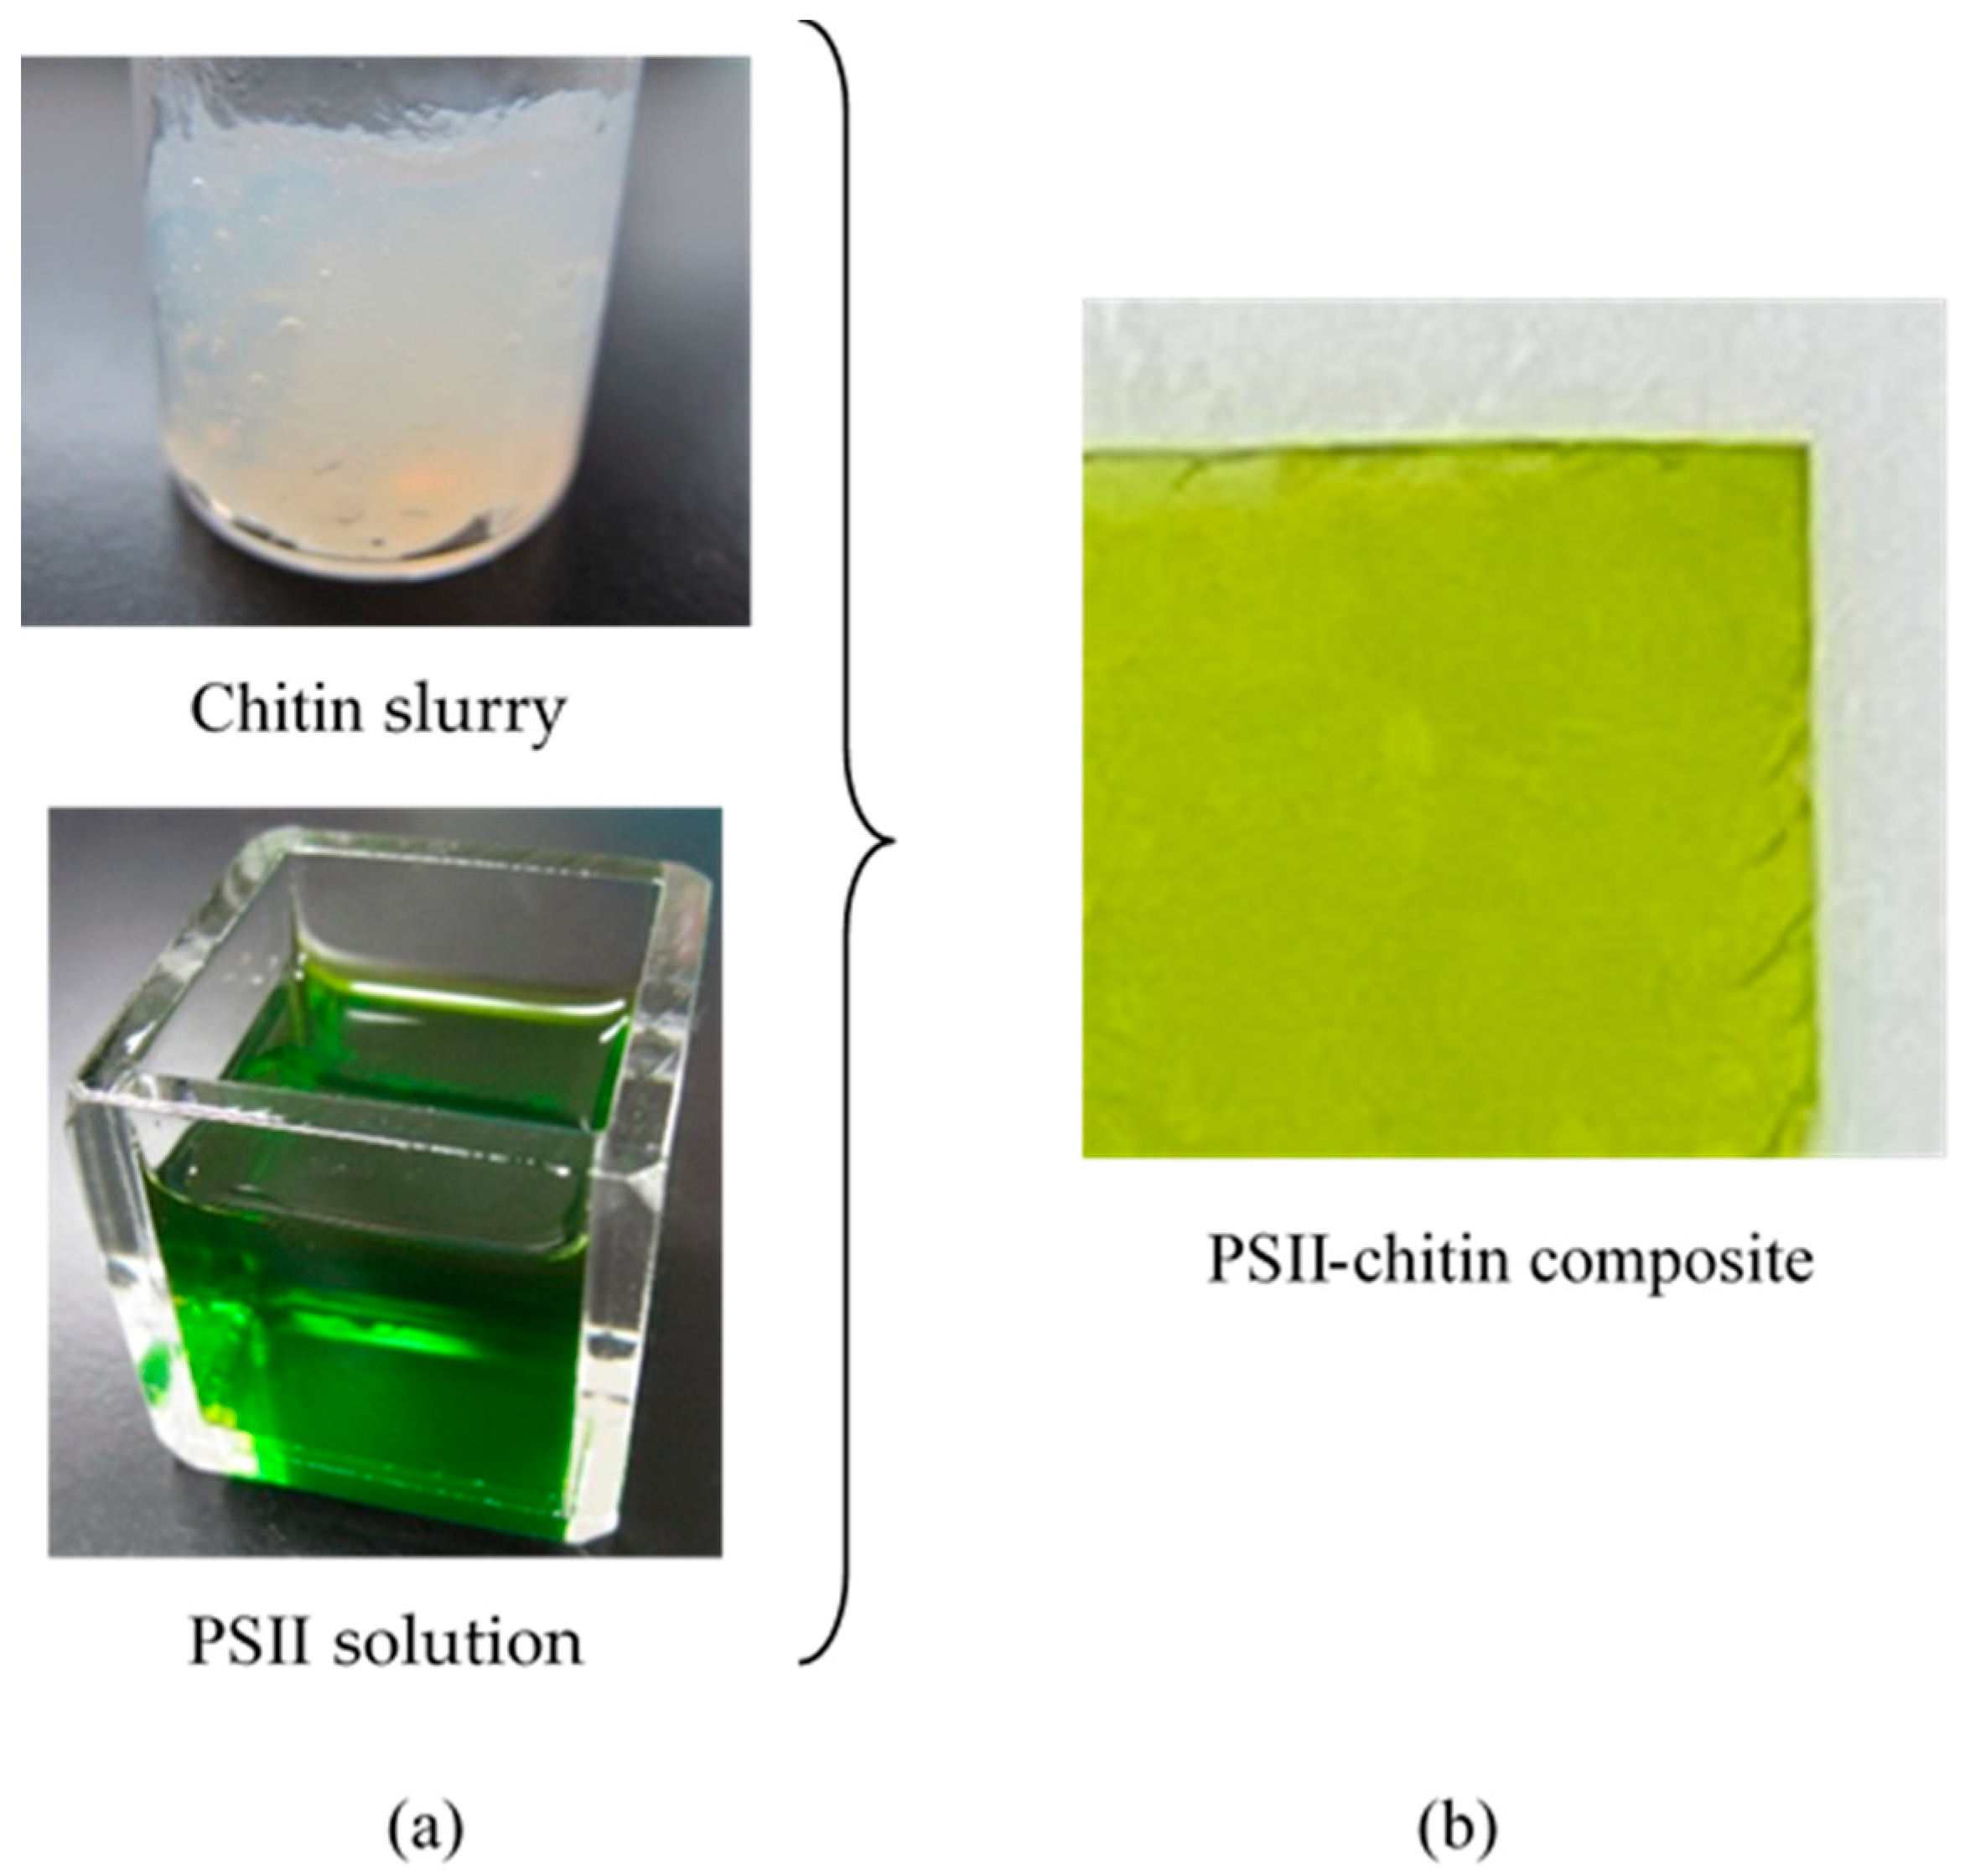
2.2. Preparation of PSII Containing Solution

The PSII solution was obtained from the spinach leaves. The spinach leaves were crushed in a disrupted suspension, consisting of distilled water and pH 7.4 phosphate buffer solution, and were filtrated. The filtrated solution of green color was centrifuged at 6000 rpm for 15 min. Then, the residue was suspended in the disrupted suspension. The obtained solution was centrifuged at 6000 rpm for 15 min again, and the supernatant was removed. Then, the obtained precipitate was suspended in the pH 6.8 buffer solution to satisfy the 2 mg/mL condition. The extracted solution was solved by the 20 w/v% surfactants (Triton X-100: Nacalai tesque Inc., Kyoto, Japan) diluted with distilled water. Moreover, the obtained PSII containing solution was centrifuged at 12,000 rpm for 60 min. Then, the precipitate was extracted to eliminate the PSI complex. Finally, the precipitate was suspended in the distilled water, and the obtained solution was centrifuged twice at 12,000 rpm for 60 min, and the PSII solution was obtained. Then, the obtained PSII solution was mixed with the chitin slurry, as shown in Figure 2a. The chitin and the PSII solution were sufficiently mixed for 30 min in the ratio of 2:1 by weight. The obtained PSII–chitin composite was then dried and molded in a desiccator using the diphosphorus pentaoxide as a drying agent. As a result, we obtained the PSII–chitin mixed composite, as shown in Figure 2b. As shown in Figure 2b, the color of the PSII–chitin composite becomes green. This PSII–chitin composite was used as the hydrogen fuel film by containing the water in this composite.

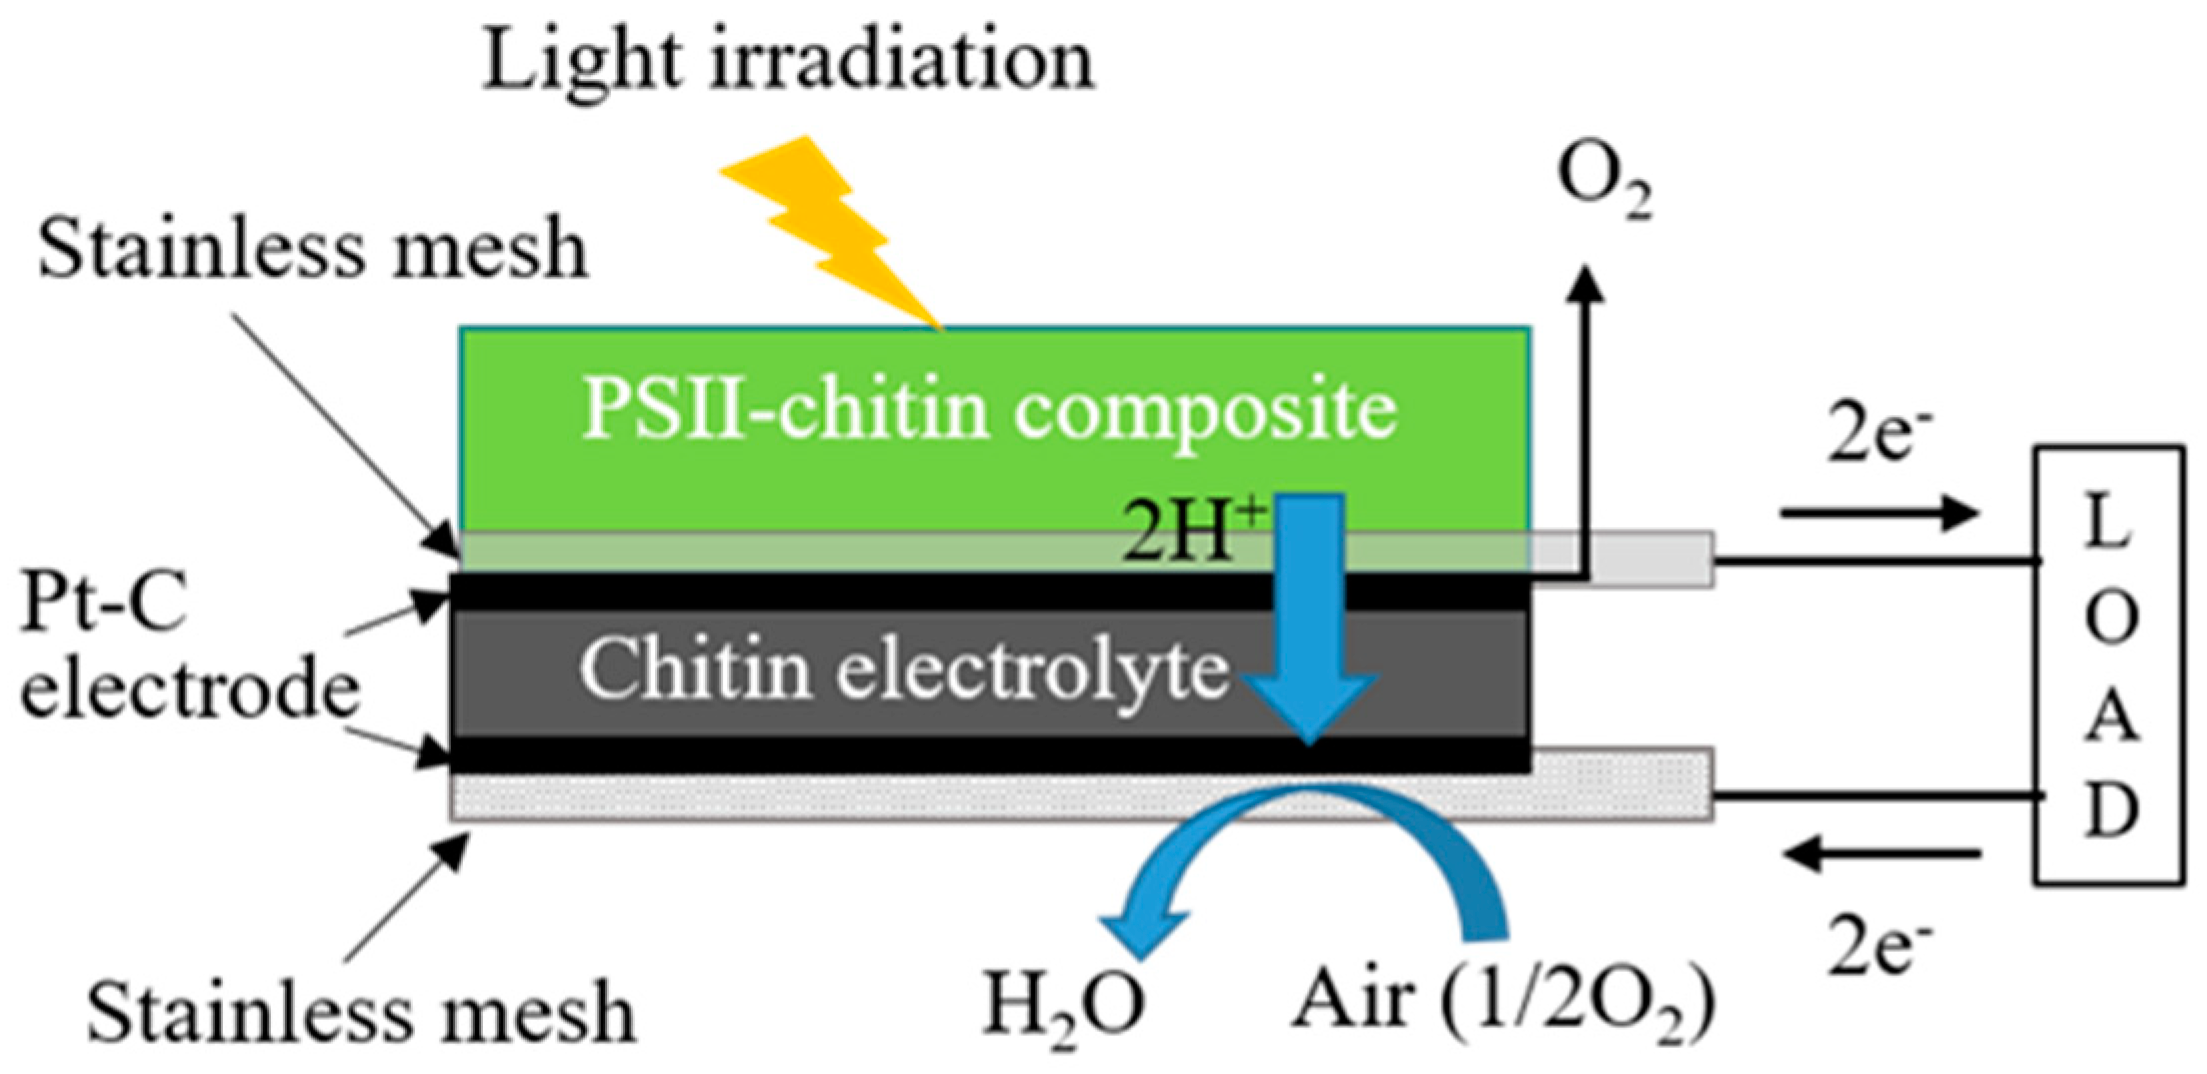
2.3. Preparation of Biofuel Cell Using Bioelectrolyte and Hydrogen Fuel Composed from the PSII–Chitin Composite

Figure 3 shows the schematic diagram of the biofuel cell using bioelectrolyte and the PSII–chitin composite hydrogen fuel. As shown in Figure 3, the biofuel cell is composed of hydrogen fuel using the PSII–chitin composite, Pt-C catalysts, stainless mesh plates, and the bioelectrolyte. In the present work, the chitin film was used as the bioelectrolyte. The thickness of the chitin film was typically 80 μm. The chitin film was sandwiched between a cathode and an anode. In the electrodes of the cathode and the anode, carbon sheets of 4.5 mm diameter were used. The chitin electrolyte and these electrodes were bonded using the ethanol solution, including Pt-C powder, to realize a three-phase interface. Here, the concentration of the ethanol solutions, including the Pt-C powder, was 1 g/mL. The electron-collecting electrode composed of a stainless mesh of 100 mesh/cm2 was mounted on Pt-C electrodes in order to collect electrons produced at the anode of the fuel cell.
The collected electrons at the anode go through the external circuit and reach the cathode electrode and the electrons at the cathode electrodes bond to the oxygen and protons via the electrolyte. As a result, H2O is produced, and the energy is obtained as electricity from the fuel cell. In order to obtain this energy from the fuel cell, hydrogen and oxygen gases must be supplied to the anode and the cathode, respectively. Usually, the prepared fuel gases (hydrogen and oxygen gases) are used in energy production by the fuel cell. In this work, the hydrogen ions were directly introduced to the anode electrode from the PSII–chitin composite, while oxygen fuel gases were introduced to the cathode from the air. The hydrogen ions introduced at the anode pass through the chitin electrolyte, react at the cathode with oxygen in the air, and generate energy.

2.4. Measurement of FT-IR, Impedance, and Fuel Cell Characteristics

The infrared (IR) absorbance spectra for 1200–1700 cm−1 were measured in the chitin, PSII solution, and PSII–chitin composite using an FT-IR spectrometer (iS-5, Thermo Fisher Scientific, Waltham, MA, USA). Proton conductivity in the PSII–chitin composite was measured using the precision LCR meter (E4980A: Agilent technology, Santa Clara, CA, USA). The relation between current density i versus cell voltage V in the biofuel cell was measured using the homemade iV measurement system with the electronic voltmeter (keythley2100 and 2000) with the high-impedance input resistance. The values of i and V were captured by the data acquisition system using the computer. The relation between i and power density P in the biofuel cell was also calculated by the data of the iV characteristics with the relation of P = iV. In the present work, the measurement under light irradiation was carried out using the white light of the average light intensity of 0.5 mW/cm2.

3. Results

In the fuel cell, the electrolyte and hydrogen fuel are extremely important parts of power generation. In particular, the mechanical stability of the electrolyte is necessary for power generation. In order to investigate the mechanical stability of the hydrated chitin electrolyte film, we measured the relationship between stress and strain. Figure 4 shows the result for the hydrated chitin electrolyte film with a thickness of 80 μm. As shown in Figure 4, the strain linearly increases with increasing stress until 2.70 MPa. From this result, the Young’s modulus of the prepared hydrated chitin film can be determined to be 0.134 GPa. This Young’s modulus is larger than that (~0.06 MPa) of the hydrated Nafion 117 film, which is used as the fuel cell electrolyte [37]. This result indicates that the hydrated chitin film has sufficient mechanical stability as the fuel-cell electrolyte.
Furthermore, we reported that the hydrated chitin films become a proton conductor in the previous paper [17,18]. Figure 5 shows the relation between the number of hydration n0 and proton conductivity σ0 in the hydrated chitin film. Here, n0 was obtained from the weight change in the hydration.
It is evident that proton conductivity monotonously increases with increasing n0 and becomes 7.8 × 10⁻² S/m at n0 = 2. In this way, the chitin film becomes a proton conductor by hydration and can be used as the fuel cell electrolyte. Actually, the chitin film becomes the fuel cell electrolyte using hydrogen gas as a fuel gas [17].
Figure 6a–c show the IR spectra in the chitin, the PSII solution, and the PSII–chitin composite film, respectively. The absorption bands observed at 1621 and 1656 cm−1 in Figure 6a are assigned as amides I [38]. In contrast, the N–H bending band of the amid II is uniquely observed at 1556 cm−1 [38]. In this way, the IR spectrum is the same as that of chitin as well known. In Figure 6c, the solid line shows the measured spectrum in the PSII–chitin composite, and the dotted line exhibits the simple superposition of the IR spectra of the chitin film (Figure 6a) and the PSII solution (Figure 6b). As shown in Figure 6c, the IR spectrum of the PSII–chitin composite film is in good agreement with the simple superposed spectrum by the IR spectra of the chitin film and PSII solution. Therefore, the structures of the chitin and PSII do not change by mixing. It is deduced from these results that the PSII–chitin composite is a simple complex with PSII of proton generator and the chitin of proton transporter. These results indicate that PSII is successfully confined in the chitin film.
Figure 7 shows the example of the Nyquist plot in the PSII–chitin composite film in the dark and under the light irradiation at nc = 0.80, where nc is the hydration number of the PSII–chitin composite for one chitin molecule. As shown in Figure 7, the relationship between the real part Zre and the imaginary part Zim becomes a semi-circle one. This result indicates that the PSII–chitin composite is expressed by the parallel equivalent circuit of resistance R and capacitance C, and Zre and Zim are shown in the following equations:
Z re = R 1 + ( ω C R ) 2 ,   Z im = ω C R 2 1 + ( ω C R ) 2
As shown in Equation (1), by approaching ω to 0, Zre and Zim become R and 0, respectively. Thus, we can obtain bulk DC proton conductivity of the PSII–chitin composite film from the value of Zre extrapolated to ω → 0, considering that the measured impedance for low angular frequency mainly results from the existence of the double-layer capacitance near electrodes.
In order to visualize the change in the impedance spectrum by irradiating light, we show the enlarged spectra near Zre = 120 kΩ in the inset of Figure 7. As shown in this figure, the DC resistance R, which is the intersection of the Zre-axis and the semi-circle described by Equation (1), decreases by light irradiation. Considering that the resistance in the chitin film is no change by the light irradiation, this result indicates that the decrease in the resistance by the light irradiation is the characteristic feature of the PSII–chitin composite film.
Figure 8 shows the relation between the hydration number nc and the value Δσ of proton-conductivity change by irradiating the light obtained by the analyses of Figure 7. Here, proton conductivity σ in the dark (or under the light irradiation) can be calculated using the equation of σ = l/RS, where S and l are the area of the electrode and the length between electrodes, respectively. As shown in Figure 8, proton conductivity increases by the light irradiation in all nc. In addition, it is noted that Δσ increases with the increase in nc. Considering that the proton mobility of the generated protons by the light irradiation will increase due to the increase in proton-transfer path accompanied by the increase in hydration, the rise of Δσ by increasing nc is reasonable.
Figure 9 shows the iV characteristics under the white light irradiation of 0.5 mW/cm2 at nc = 2.0 for the fuel cell based on the chitin electrolyte and the hydrogen fuel using the PSII–chitin composite as shown in Figure 3.
It is evident that the relation between i and V is the typical iV characteristics of the fuel cell. Further, the open-circuit voltage becomes 0.75 V. This value is the typical value (~0.8 V) using the bioelectrolyte [13,17,36]. These results are consistent that the hydrated PSII–chitin composite operates as the fuel of the fuel cell. Thus, the hydrated PSII–chitin composite generates the hydrogen ions and electrons by light irradiation and provides the hydrogen fuel to the fuel cell. In the present fuel cell, the maximum power density becomes 0.19 mW/cm2, as shown in Figure 9.
Figure 10 shows the LED lighting of the present fuel cell using the chitin electrolyte and the hydrogen fuel of the hydrated PSII–chitin composite under the white light of 0.5 mW/cm2. In this demonstration, the three fuel cells are connected in series. As shown in Figure 10 actually, the green LED lamp is driven by the present fuel cells. This result is evidence that the PSII–chitin composite becomes the hydrogen fuel of the fuel cell.

4. Discussion

The present study investigates the possibility of the solid-state hydrogen fuel using the PSII–chitin composite, which generates proton by the light irradiation, and reports the fabrication of the biofuel cell using the chitin electrolyte and the PSII–chitin composite hydrogen fuel. These realized results are already shown in Section 3. In this section, we discuss the consistency of the proton generation by the irradiation to the PSII–chitin composite and exhibit the schematic figure of proton transport in the PSII–chitin composite.
In Figure 8, we found that light irradiation increases proton conductivity. It is noted that the value of Δσ at nc = 2.0 becomes 0.35 × 10⁻³ S/m. It is well-known that proton conductivity σ is generally expressed as “σ = neμ” using the elementary charge e, the number of mobile proton n and the mobility of proton μ. In addition, we obtained the result from the measurement of proton conductivity in chitin by the light irradiation that proton conductivity of chitin is no change by the light irradiation. Therefore, the number and mobility of mobile protons in the chitin are not changed by light irradiation. By considering these results, the increase in proton conductivity by the light irradiation in the PSII–chitin composite is mainly caused by the number Δn of protons generated by the light irradiation. Therefore, the increase in proton conductivity caused by the generated protons Δn with the light irradiation is described as “Δσ = Δneμ”. It is well-known that the mobility of protons by the Grotthuss mechanism is ~3.6 × 10⁻³ cm2/sV [39]. By using the values of the mobility of 4.3 × 10⁻³ cm2/sV in hydrated maleic chitosan [40], which has a similar molecular structure with the main chain of chitin, and the elemental charge of 1.6 × 10⁻¹⁹ C, Δn is calculated to be 5.1 × 1015 cm−3 at nc = 2.0. On the other hand, we can roughly estimate the generated hydrogen number from the iV characteristic of the fuel cell, as shown in Figure 9 using Faraday’s second law of electrolysis. Faraday’s second law is described as “imax = znF/NA”. Here, n and z are the hydrogen molecular number per unit time and the total charge number of the hydrogen molecule, respectively. The symbols of NA and F are the Avogadro constant and the Faraday constant, respectively. In the case of the present work, n corresponds to Δn with z = 1. From Figure 9, the maximum current is calculated to be 0.37 mA with an electrode area of 0.28 cm2. By using this value, we can obtain the number Δn of protons to be 2.3 × 1015 cm−3. This value is the same order as Δn calculated from Δσ in spite of the rough estimation using the different measurements. In this way, it is consistent that protons generated by the light irradiation in the PSII–chitin composite play a role in the hydrogen fuel of the fuel cell.
Finally, we would like to exhibit the schematic figure of proton transport in the PSII–chitin composite in Figure 11. As shown in Figure 11, the light irradiation excites the electron in chlorophyll and yields the deprotonation of H2O by the catalytic reaction of the Mn cluster in PSII. The generated protons yield the oxonium ions at the side chain of the hydrated chitin. Considering that the proton transfer is caused by the proton transfer with the breaking and rearrangement of the hydrated water bonded with the sidechain of the chitin, the oxonium ions produced by the protons injected in the chitin are successively rearranged by the proton transfer. Thus, the protons in the PSII–chitin composite are transported to the chitin electrolyte of the fuel cell. On the other hand, the generated electrons are caught at the anode electrode and are transported to the cathode electrode via the external circuit. By this reaction, the fuel cell in the present work drives the LED light, as shown in Figure 10.
In the present work, we used the white light of 0.5 mW/cm2 for the light irradiation to the PSII–chitin composite, and we obtained a power density of 0.19 mW/cm2. As shown in previous work [36], the hydrogen generation in the PSII solution depends on the light wavelength, and the hydrogen generation is mainly realized by the red or blue light irradiation. Therefore, in the PSII–chitin composite, it is also important to investigate the wavelength dependence of power density. Currently, we plan to investigate the optimum condition to obtain the maximum power density in the present type of fuel cell. These results will appear in future issues.

5. Conclusions

This study provides the possibility of a new type of solid-state hydrogen fuel using the PSII–chitin composite and the fabrication of the biofuel cell using the chitin electrolyte and the hydrogen fuel by the PSII–chitin composite. It was found that the light irradiation to the PSII–chitin composite yields an increase in proton conductivity due to the proton generation in the PSII–chitin composite. Further, the biofuel cell fabricated using the chitin electrolyte and the PSII–chitin composite hydrogen fuel exhibits the maximum power density of 0.19 mW/cm2 and drove LED by three single cells. Therefore, in this work, we indicated that the PSII–chitin composite becomes the new type of solid-state hydrogen fuel and, by using this biofuel and bioelectrolyte chitin, a new type of solid-state biofuel cell can be realized.

Author Contributions

Conceptualization, H.K. and Y.M.; methodology, Y.M., Y.T. and A.I.; validation, A.I., Y.T. and Y.M.; formal analysis, Y.T., A.I. and Y.M.; investigation, Y.T., A.I., Y.M. and H.K.; data curation, A.I., Y.T. and Y.M.; writing—original draft preparation, Y.T, H.K. and Y.M.; writing—review and editing, H.K. and Y.M.; visualization, H.K. and Y.M.; supervision, H.K. and Y.M.; project administration, Y.T., H.K. and Y.M.; funding acquisition, Y.M. and H.K. All authors have read and agreed to the published version of the manuscript.

Funding

This research was funded by Yashima Environment Technology Foundation.

Acknowledgments

The authors would like to acknowledge Takeru Tsutsumi and Aoi Sugiyama for the support of experiments.

Conflicts of Interest

The authors declare no conflict of interest.

References

  1. Andrews, J.; Shabani, B. Where Does Hydrogen Fit in a Sustainable Energy Economy? Procedia Eng. 2012, 49, 15–25. [Google Scholar] [CrossRef] [Green Version]
  2. Viktorsson, L.; Heinonen, J.T.; Skulason, J.B.; Unnthorsson, R.A. Step towards the Hydrogen Economy–A Life Cycle Cost Analysis of a Hydrogen Refueling Station. Energies 2017, 10, 763. [Google Scholar] [CrossRef]
  3. Ball, M.; Weeda, M. The Hydrogen Economy—Vision or reality? Int. J. Hydrog. Energy 2015, 40, 7903–7919. [Google Scholar] [CrossRef]
  4. Paulmier, T.; Fulcheri, L. Use of non-thermal plasma for hydrocarbon reforming. Chem. Eng. J. 2005, 106, 59–71. [Google Scholar] [CrossRef]
  5. Konieczny, A.; Mondal, K.; Wiltowski, T.; Dydo, P. Catalyst development for thermocatalytic decomposition of methane to hydrogen. Int. J. Hydrog. Energy 2008, 33, 264–272. [Google Scholar] [CrossRef]
  6. Nikolaidis, P.; Poullikkas, A. A comparative overview of hydrogen processes. Renew. Sustain. Energy Rev. 2017, 67, 597–611. [Google Scholar] [CrossRef]
  7. Balat, M.; Balat, M. Political, economic and environmental impacts of biomass-based hydrogen. Int. J. Hydrog. Energy 2009, 34, 3589–3603. [Google Scholar] [CrossRef]
  8. Holladay, J.D.; Hu, J.; King, D.L.; Wang, Y. An overview of hydrogen production technologies. Catal. Today 2009, 139, 244–260. [Google Scholar] [CrossRef]
  9. Norby, T. The Promise of Protonics. Nature 2001, 410, 877–878. [Google Scholar] [CrossRef]
  10. Matsuo, Y.; Kumasaka, G.; Saito, K.; Ikehata, S. Fabrication of solid-state fuel cell based on DNA film. Solid State Commun. 2005, 133, 61–64. [Google Scholar] [CrossRef]
  11. Matsuo, Y.; Hatori, J.; Yoshida, Y.; Ikehata, S. Humidity Dependence of Proton Conductivity in DNA Film Studied by NMR and AC Conductivity. J. Phys. Soc. Jpn. 2014, 79, 12–14. [Google Scholar] [CrossRef] [Green Version]
  12. Matsuo, Y.; Hatori, J. Fuel Cell Based on Natural Sausage Casing. J. Biobased Mater. Bioenergy 2011, 5, 562–564. [Google Scholar] [CrossRef]
  13. Matsuo, Y.; Ikeda, H.; Kawabata, T.; Hatori, J.; Oyama, H. Collagen-based fuel cell and its proton transfer. Mat. Sci. Appl. 2017, 8, 747–756. [Google Scholar] [CrossRef] [Green Version]
  14. Matsuo, Y. Bio-Fuel Cell Based on Biopolymer Electrolyte. J. Fuel Cell Technol. 2014, 13, 60–64. [Google Scholar]
  15. Freier, E.; Wolf, S.; Gerwert, K. Proton transfer via a transient linear water-molecule chain in a membrane protein. Proc. Natl. Acad. Sci. USA 2011, 108, 11435–11439. [Google Scholar] [CrossRef] [PubMed] [Green Version]
  16. Ordinario, D.D.; Phan, L.; Wlkup IV, W.G.; Jocson, J.M.; Karshalev, E.; Hüsken, N.; Gorodetsky, A.A. Bulk protonic conductivity in a cephalopod structural protein. Nat. Chem. 2014, 6, 596–602. [Google Scholar] [CrossRef] [PubMed]
  17. Kawabata, T.; Matsuo, Y. Chitin Based Fuel Cell and Its Proton Conductivity. Mat. Sci. Appl. 2018, 9, 779–789. [Google Scholar] [CrossRef] [Green Version]
  18. Kawabata, T.; Matsuo, Y. Role of acetyl group on proton conductivity in chitin system. J. Mater. 2019, 5, 258–263. [Google Scholar] [CrossRef]
  19. Akhlaghi, N.; Najafpour-Darzi, G. A comprehensive review on biological. hydrogen production. Int. J. Hydrog. Energy 2020, 45, 22492–22512. [Google Scholar] [CrossRef]
  20. Wang, J.; Wan, W. Effect of temperature on fermentative hydrogen production by mixed cultures. Int. J. Hydrog. Energy 2008, 33, 5392–5397. [Google Scholar] [CrossRef]
  21. Zhang, J.; Bai, Y.; Fan, Y.; Hou, H. Improved bio-hydrogen production from glucose by adding a specific methane inhibitor to microbial electrolysis cells with a double anode arrangement. J Biosci. Bioeng. 2016, 16, 1389–1723. [Google Scholar] [CrossRef] [PubMed]
  22. Jiang, Y.; Ulrich, A.C.; Liu, Y. Coupling bioelectricity generation and oil sands tailings treatment using microbial fuel cells. Bioresour. Technol. 2013, 139, 349–354. [Google Scholar] [CrossRef]
  23. Choi, J.; Liu, Y. Power generation and oil sands process-affected water treatment in microbial fuel cells. Bioresour. Technol. 2014, 169, 581–587. [Google Scholar] [CrossRef] [PubMed]
  24. Batyrova, K.A.; Tsygankov, A.A.; Kosourov, S.N. Sustained hydrogen photo production by phosphorus-deprived Chlamydomonas reinhardtii cultures. Int. J. Hydrog. Energy 2012, 37, 8834–8839. [Google Scholar] [CrossRef]
  25. Sambusitia, C.; Bellucci, M.; Zabaniotou, A.; Beneduce, L.; Monlaua, F. Algae as promising feedstocks for fermentative biohydrogen production according to a biorefinery approach: A comprehensive review. Renew. Sustain. Energy Rev. 2015, 44, 20–36. [Google Scholar] [CrossRef]
  26. Khan, A.M.; Ngo, H.H.; Guo, W.; Liu, Y.; Zhang, X.; Guo, J.; Chang, W.S.; Nguyen, D.D.; Wang, J. Biohydrogen production from anaerobic digestion and its potential as renewable energy. Renew. Energy 2018, 129, 754–768. [Google Scholar] [CrossRef]
  27. Meher Kotay, S.; Das, D. Biohydrogen as a renewable energy resource prospects and potentials. Int. J. Hydrog. Energy 2008, 33, 258–263. [Google Scholar] [CrossRef]
  28. Nagashima, H.; Asada, M.; Mino, H. Magnetic structure of manganese cluster in photosystem II investigated by electron paramagnetic resonance. Biophys. Phys. 2018, 15, 45–50. [Google Scholar] [CrossRef] [Green Version]
  29. Zhang, B.; Sun, L. Why nature chose the Mn4CaO5 cluster as water-splitting catalyst in photosystem II: A new hypothesis for the mechanism of O–O bond formation. Dalton Trans. 2018, 41, 14381–14387. [Google Scholar] [CrossRef] [PubMed] [Green Version]
  30. Zouni, A.; Witt, H.-T.; Kern, J.; Fromme, P.; Krauss, N.; Saenger, W.; Orth, P. Crystal structure of photosystem II from Synechococcus elongatus at 3.8 Å resolution. Nature 2001, 409, 739–743. [Google Scholar] [CrossRef] [PubMed]
  31. Nugent, J.H.A.; Rich, A.M.; Evans, A.M. Photosynthetic water oxidation: Towards a mechanism. Biochim. Biophys. Acta 2001, 1503, 138–146. [Google Scholar] [CrossRef] [Green Version]
  32. Johnson, M.P. Photosynthesis. Essays Biochem. 2016, 60, 255–273. [Google Scholar] [CrossRef] [PubMed]
  33. Ort, D.R.; Yocum, C.F. Light reactions of oxygenic photosynthesis. In Oxygenic Photosynthesis; Ort, D.R., Yocum, C.F., Eds.; Kluwer Academic Publishers: Dordrecht, The Netherlands, 1996. [Google Scholar]
  34. Shen, J.-R.; Enami, I. Isolation of photosystem II. Low Temp. Sci. 2009, 67, 275–283. [Google Scholar]
  35. Miyao, M. Isolation of intact chloroplasts, thylakoids and photosystem II membranes from higher plants. Low Temp. Sci. 2009, 67, 197–203. [Google Scholar]
  36. Iwahashi, A.; Yamada, T.; Matsuo, Y.; Kawakami, H. Novel biofuel cell using hydrogen generation of photosynthesis. J. Funct. Biomater. 2020, 11, 81. [Google Scholar] [CrossRef]
  37. Ishida, T.; Kasai, Y.; Urayama, K.; Takizawa, T. Structure and mechanical properties of Nafion membranes. J. Soc. Mater. Sci. Jpn. 2007, 56, 1005–1009. [Google Scholar] [CrossRef]
  38. Rinaudo, M. Chitin and chitosan: Properties and applications. Prog. Polym. Sci. 2006, 31, 603–632. [Google Scholar] [CrossRef]
  39. Bard, A.J.; Faulkner, L.R. Electrochemical Methods: Fundamentals and Applications, 2nd ed.; Wiley: New York, NY, USA, 2001. [Google Scholar]
  40. Miyake, T.; Rolandi, M. Grotthuss mechanisms: From proton transport in proton wires to bioprotonic devices. J. Phys. Condens. Matter. 2016, 28, 023001. [Google Scholar] [CrossRef]
Figure 1. Molecular formula of chitin (a) and photograph of chitin film (b).
Jcs 05 00317 g001
Figure 2. Chitin slurry and PSII solution (a), and photograph of the PSII–chitin composite (b).
Jcs 05 00317 g002
Figure 3. Structure of the biofuel cell using the chitin electrolyte and the PSII–chitin composite hydrogen fuel.
Jcs 05 00317 g003
Figure 4. Stress–strain curve of the chitin film.
Jcs 05 00317 g004
Figure 5. Relation between DC proton conductivity σ0 and hydration number n0 in the chitin film.
Jcs 05 00317 g005
Figure 6. IR spectra in chitin film (a), PSII solution (b), and the PSII–chitin composite film (c).
Jcs 05 00317 g006
Figure 7. Example of Nyquist plot in the PSII–chitin composite film in the dark (open circle) and under the light irradiation (solid circle). Inset is the enlarged spectra near Zre = 120 kΩ.
Jcs 05 00317 g007
Figure 8. Relation between the hydration number nc and the value Δσ of proton-conductivity change by irradiating the light.
Jcs 05 00317 g008
Figure 9. i-V characteristics of the fuel cell based on the chitin electrolyte and the hydrogen fuel using the PSII–chitin composite.
Jcs 05 00317 g009
Figure 10. Photograph of the driving of the green LED lamp using the fuel cell based on the chitin electrolyte and the hydrogen fuel of the PSII–chitin composite.
Jcs 05 00317 g010
Figure 11. Schematic diagram of proton generation by the light irradiation and proton transfer in the PSII–chitin composite.
Jcs 05 00317 g011
Publisher’s Note: MDPI stays neutral with regard to jurisdictional claims in published maps and institutional affiliations.

