Abstract
This paper studies the influence of factors such as heating rate, atomic number, temperature, and annealing time on the structure and the crystallization process of NiAu alloy. Increasing the heating rate leads to the moving process from the crystalline state to the amorphous state; increasing the temperature (T) also leads to a changing process into the liquid state; when the atomic number (N), and t increase, it leads to an increased crystalline process. As a result, the dependence between size (l) and atomic number (N), the total energy of the system (Etot) with N as l~N−1/3, and −Etot always creates a linear function of N, glass temperature (Tg) of the NiAu alloy, which is Tg = 600 K. During the study, the number of the structural units was determined by the Common Neighborhood Analysis (CNA) method, radial distribution function (RDF), size (l), and Etot. The result shows that the influencing factors to the structure of NiAu alloy are considerable.
1. Introduction
Today, the alloys PtAu [1], PdAu [2], NiAu [3] are receiving great attention from theoretical and experimental scientists [4,5] because they have many special properties compared to pure materials [6,7]. In particular, NiAu alloy is synthesized by two metals, Ni and Au, and applied in many fields of science, technology, and life such as magnetism [8,9,10], photocatalyst [11,12], DNA markers [13,14], or cancer treatment [15] as the agent in cell separation [16,17], and biological processing [18,19] which increase contrast and biological agents [20]. The properties of alloys such as ionization, optics, and magnetism [21] depend on the shape and the concentration of doping [22].
There are a lot of methods to research and manufacture NiAu alloy, such as experimental, theoretical, and simulated. The experimental method includes mechanical grinding [23], electric arc [24], deposition [25,26], electrochemical [27], hydrothermal [28], Sol-Gel [29], mechanics [30], micro-emulsion [31], and colloidal solution [32].
These methods can change the size and shape of the alloy in normal conditions and do not require an environment of pressure (P) and high temperature (T) [33]. Theoretical methods include initial principles, Ab initio model [34], and methods of Molecular Dynamics (MD) simulation [35,36,37] combined with different interaction potentials such as Finnis–Sinclair (FS) [38], and Sutton–Chen (SC) [39,40]. In particular, the method of MD simulation is considered as the most preeminent method today with low research costs, capable of researching at the atomic level and providing a huge amount of information o the structure and explaining relevant physical mechanisms [41,42].
The result of research of Ni, Au metal and NiAu alloy in the liquid state, crystalline state, an amorphous state [43,44,45] shows that at the temperature (T), T = 300 K, pure Ni, Au metals do not change the structure transition process when being combined to form NiAl alloy; their electronic mobility is in ranges from 5% to 99% depending on the impurity concentration [46] that leads to the crystallize processes, and the structural transitions occurring quickly [47]. They use NiAu alloys as catalysts for clean water [48,49,50] by using Au atoms in combination with Ni atoms to ionize water atoms. However, to meet below phase diagram, the study and synthesis of NiAu alloy [51] are being performed by electrolysis, the results showing an irregularly distributed shape and a medium particle size, which is 25 nm [52].
Recently, researchers have proposed a method using low temperature [53,54] and reduction as a way to synthesize NiAu alloy [55]. Vasquez et al. [56] also used this method to synthesize Au3Fe, Au3Co, and Au3Ni alloys. With this one, the shape and size of NiAu alloy are better controlled, and it has carried out more research in recent years [57,58,59,60,61]. With these obtained results [3], at high pressure [62,63] and Morse potential interaction, we can measure accurately the elastic modulus of AuNi. Lecadre et al. [64] studied the scattering and diffusion mechanism in Au-Ni alloys with Au3Ni and Au3Ni2 ratios. Berendsen et al. [65] have identified the transition temperature (Tm) of NiAu ranges from Tm = 1100 K to Tm = 1300 K with Au impurity concentration of 58% [66]. Combined with our recent results as Al [67], FeNi [68], AlNi [69], Ni1−x Fex [70], Ni1−xCux [71], Ni [72,73], these results show that the transition temperature (Tm) of Ni material; Tm is always proportional with atom number (N), N−1/3 [74,75], and the electronic structure of AuCu [76] and AgAu [77]. The phase transition of Ni material can be determined by stress or temperature [78,79,80,81], and the bonding length of Ni-Ni determined by the experimental method is r = 2.43 Å [82], while the simulation method of Dung, N.T is r = 2.45 Å [73], and P.H. Kien is r = 2.52 Å [72]. Meanwhile, Ni and Au both have significant differences in atomic radius (R) sizes such as: Ni is R = 1.245 Å, Au is R = 1.44 Å, and surface energy (E) of Ni is E = 149 meVÅ−2, Au is E = 96.8 meVÅ−2 [83], which lead to the diffusion of Au atoms in the crust and Ni atoms in the core layer [84]. So, what processes were happened to NiAu alloy when there was a change in heating rate, atomic number, and temperature? To answer this question, we focus on studying the factors that affect the structure and crystallization process of NiAu alloys.
2. Method of Calculation
Initially, the ratio between NiAu alloy and Ni:Au is 1:1, as in 2048 NiAu atoms, there are 1024 Ni atoms, 1024 Au atoms (NiAu2048), 2916 atoms (NiAu2916), 4000 atoms (NiAu4000), 5324 atoms (NiAu5324), 6912 atoms (NiAu6912); all samples are studied by molecular dynamics (MD) simulation method [85,86,87,88,89,90,91,92,93,94,95] with embedded Sutton–Chen (SC) interaction [39,96,97,98,99] and boundary conditions recirculating with the Equation (1):
The parameters of the NiAu alloy (Table 1) are shown below.

Table 1.
Parameters of NiAu alloy.
The parameters of the alloy are determined by the mathematical Formula (2):
At all samples, there is an increase in temperature (T) from T = 0.0 K to T = 2000 K to NiAu alloy at the liquid state. From the liquid state, the temperature of the samples was reduced from T = 2000 K to T = 300 K to change from a liquid state to a crystalline one. After getting NiAu alloy, NiAu6912 alloys are run MD with a heating speed of 4 × 10¹¹ K/s, 4 × 10¹² K/s, 4 × 10¹³ K/s, 4 × 10¹⁴ K/s at (T), T = 300 K. After determining the heating speed of 4 × 10¹² K/s to be appropriate, the effects of NiAu2048, NiAu2916, NiAu4000, NiAu5324, NiAu6912 at T = 300 K; NiAu6912 at T = 300 K, 400 K, 500 K, 600 K, 700 K, 900 K, 1100 K are studied. All given samples are structurally studied through shape, size (l) as (3),
radial distribution function (RDF) as (4):
In it: , , r, N, ni(r), V, g(r) is the size, density, radial distance, the number of atoms, the coordinates, the volume, the probability of finding an atom in the distance from r to r + Δr. To determine the number of structural units, are applied the Common Neighborhood Analysis (CNA) method [100,101,102,103]. The crystallizing process is carried out based on the laws of Nosé el [104] and Hoover el [105] and uses the techniques of particle size analysis, atomic composition, and configuration [106].
3. Results and Discussion
3.1. Effect of Heating Rate
The factors that affect the heating rate 4 × 10¹² K/s, 2 × 10¹³ K/s, 4 × 10¹³ K/s, 2 × 10¹⁴ K/s, and 4 × 10¹⁴ K/s on the structural characteristics and crystallization process of NiAu5324 alloy at temperature (T), T = 300 K, are shown in Figure 1.
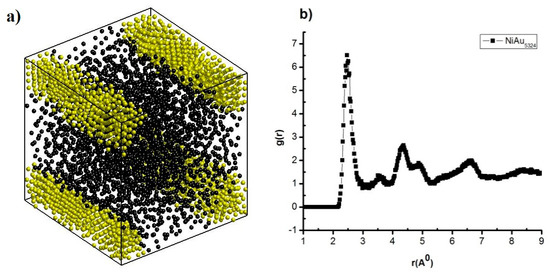
Figure 1.
The shape (a), g(r) of NiAu5324 alloy (b) at T = 300 K, and heating rate 4 × 10¹² K/s.
The result shows that when NiAu5324 alloy at T = 300 K with the heating rate of 4 × 10¹² K/s, it has a cube shape, made by two atoms: Ni shown in black and Au in yellow (Figure 1a), and has structural features such as r of radial distribution function (RDF) = 2.47 Å; the height of RDF is g(r) = 6.51, size (l), l = 10.16 nm, Etot = −446.09 eV (Figure 1b). That increasing heating rate from 4 × 10¹² K/s to 2 × 10¹³ K/s, 4 × 10¹³ K/s, 2 × 10¹⁴ K/s, and 4 × 10¹⁴ K/s leads to r decreases from r = 2.47 Å to r = 2.43 Å and g(r) decreases from g(r) = 6.51 to g(r) = 6.05, l negligibly changes from l = 9.71 nm to l = 10.76 nm, and Etot negligibly changes from Etot = −440.25 eV to Etot = −447.18 eV (Table 2). These results show that increasing the heating rate leads to NiAu5324 alloy change, the state from crystalline to amorphous. To study the process of structural transition, the CNA method was used and the results are shown in Figure 2.

Table 2.
The structural features such as r, g(r) of the radial distribution function, l, and Etot with t different heating rates.

Figure 2.
The structural unit number shape includes FCC structure (a), HCP structure (b), Amor structure (c) of NiAu alloy.
The result shows that NiAu5324 alloy at the heating rate of 4 × 10¹² K/s has structural shapes (Figure 3a) corresponding with 03 links Ni-Ni, Au-Au: Ni- Ni is r = 2.47 Å, Ni-Au is r = 2.47 Å, Au-Au is r = 3.17 Å (Figure 3b), and expresses through structural unit number FCC (Figure 2a), HCP (Figure 2b), Amor (Figure 2c). The obtained results are consistent with the results of Ni-Ni by experimental methods r = 2.43 Å [82], and R = 1.245 Å, with the simulation method r = 2.45 Å [73], r = 2.52 Å [72], for Au-Au, only X-ray diffraction results in an atomic radius value R = 1.44 Å [83,84]. Increasing heating rate from 4 × 10¹² K/s to 2 × 10¹³ K/s, 4 × 10¹³ K/s, 2 × 10¹⁴ K/s, and 4 × 10¹⁴ K/s leads to r of link Ni-Ni, Ni-Au, Au-Au change values. Besides, when Ni-Ni changes from r = 2.47 Å to r = 2.41 Å, Ni-Au decreases from r = 2.47 Å to r = 2.43 Å, Au-Au decreases from r = 3.17 Å to r = 3.09 Å, corresponding to the change of g(r) and structural unit number FCC, HCP, Amor; as FCC decreases from 802 to 0.0 FCC, HCP decreases from 811 HCP to 13 HCP, Amor increases from 3711 Amor to 5311 Amor (Table 3). That confirms that there is an increase in the heating rate when the crystallization process decreases.
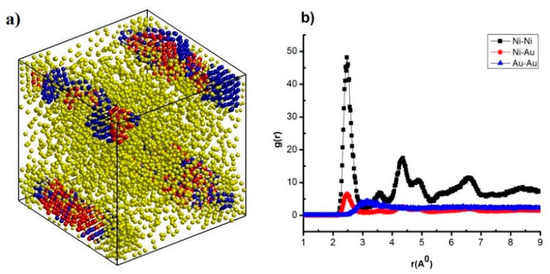
Figure 3.
The structural shape (a), radial distribution function (b) of NiAu5324 alloy at heating rates of 4 × 10¹² K/s.

Table 3.
The structural features such as links Ni-Ni, Ni-Au, Au-Au include r and g(r) with a different atomic number (N).
3.2. Effect of Atomic Number
Similarly, with the influence of atomic numbers NiAu2048, NiAu2916, NiAu4000, NiAu5324, and NiAu6912 on structural characteristics, results are shown in Figure 4.

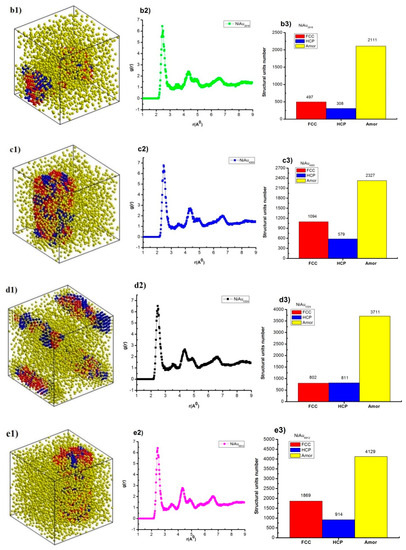
Figure 4.
The structural shape (a1,b1,c1,d1,e1), radial distribution function (RDF) (a2,b2,c2,d2,e2), structural unit number (a3,b3,c3,d3,e3) of NiAu alloy with different N.
The results indicate that NiAu2048 alloy at T = 300 K has structural shape and l = 7.34 nm, Etot = −173.85 eV (Figure 4(a1)), together with the radial distribution function, has r = 2.49 Å, g(r) = 6.47 (Figure 4(a2)), and the structural unit numbers are 312 FCC, 443 HCP, 1293 Amor (Figure 4(a3)). When increasing atoms number from NiAu2048 to NiAu2916, NiAu4000, NiAu5324, NiAu6912, then structural shape changes, size (l) increases from l = 7.34 nm to l = 10.89 nm, Etot decreases from Etot = −173.85 eV to Etot = −580.35 eV (Figure 4(b1,c1,d1,e1)); r changes from r = 2.49 Å to r = 2.45 Å, g(r) changes from g(r) = 6.43 to g(r) = 6.77 (Figure 4(b2,c2,d2,e2)); and the structural unit number change corresponding to FCC about from 312 FCC to 1869 FCC, HCP about from 308 HCP to 914 HCP, Amor increases from 1293 Amor to 4129 Amor (Figure 4(b3,c3,d3,e3)). The given result indicates that increasing N leads to l increase and Etot decrease. As a result, there is a relationship between l, N, and Etot, N. To confirm the defining relationships between size, atom number, and between Etot, atom number of NiAu alloy, the results are shown in Figure 5.
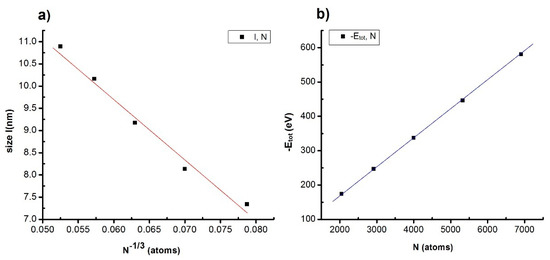
Figure 5.
The relationship between characteristic quantities such as structures as dependence between l, N (a); −Etot, N (b) of the NiAu alloy with different N.
The given result shows that increasing N leads to l increase, and satisfy the formula: l = 18.021 − 138.153N−1/3, corresponding to l~N−1/3 (Figure 5a) and −Etot proportional to N (Figure 5b). The results are consistent with the results of crystallizing process temperature (Tm) proportional with N−1/3 [74,75] and size (l or D) proportional with N−1/3 [67,68,69,70,71,72,73]. This proves that increasing atom number leads to crystalline atoms number FCC, HCP increase, Amor decrease, size increase, the total energy of system decrease; and the relationship with l~N−1/3 is an important result for future experimental implementation.
3.3. Influence of Temperature
The research results of the effect of temperature, T = 300 K, 400 K, 500 K, 600 K, 700 K, 900 K, 1100 K 1300 K, and 1500 K, on the structural characteristics are shown in Figure 6.
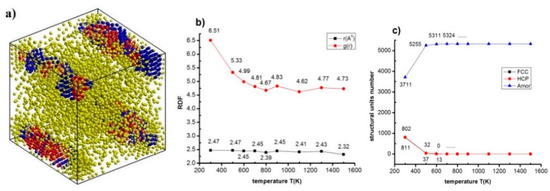
Figure 6.
The structural characteristics as structural shape (a) of NiAu5324 alloy at T = 300 K; RDF (b) and structural unit number (c) at different T.
The results indicate at T = 300 K, NiAu5324 alloy has structural shape, r = 2.47 Å, g(r) = 6.51, 802 FCC, 811 HCP, 3711 Amor (Figure 6a). When increasing T from T = 300 K to T = 1500 K, r decreases from r = 2.47Å to r = 2.32 Å, g(r) changes from g(r) = 6.51 to g(r) = 4.62 (Figure 6b), FCC decreases rapidly from 802 FCC to 0.0 FCC, HCP decreases dramatically from 811 HCP to 0.0 HCP, Amor increases from 3711 HCP to 5324 HCP, at T = 700 K Amor state maximum increases (Figure 6c). This proves that with T < 700 K, NiAu alloy is in the crystalline state, T > 700 K, and NiAu alloy is in the liquid state, thereby, this is a crystallizing process between the crystallization and liquid states of NiAu alloy. The results of phase transition from crystalline state to a liquid state by type 1 phase transition theory, for each value of temperature (T), will correspond to a total energy value of the system (Etot). To confirm that, a study of the relationship between T and Etot was carried out and the obtained results are shown in Figure 7.
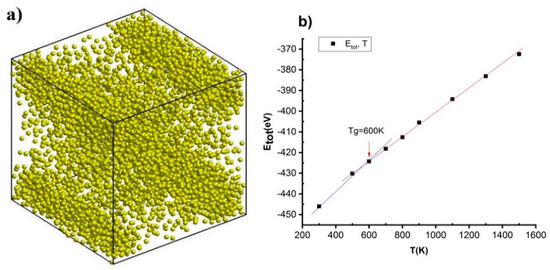
Figure 7.
The structural shape of NiAu5324 alloy at temperatures 700 K (a), phase transition (b) of NiAu5324 alloy at different temperatures.
Increasing T from T = 300 K to T = 400 K, 500 K, 600 K, 700 K, 900 K, 1100 K, 1300 K, and 1500 K leads to l insignificant change range l = 7.34 nm to l = 7.35 nm and Etot increase from Etot = −446.0 eV to Etot = −430.2 eV, −424.3 eV, −418.2 eV, −415.6 eV, −405.5 eV, −394.2 eV, −383.1 eV, and −372.4 eV. In it, the structural shape of NiAu alloy at T = 700 K (Figure 7a) and an interrupting point at T = 600 K then corresponds with Etot = −418.2 eV observed at glass temperature (Tg), Tg = 600 K (Figure 7b). The results obtained show that, with T < 600 K, NiAu5324 alloy exists in the crystalline state and T > 600 K is in a liquid state, this result is completely consistent with the results obtained in on and are considered as the basis for future empirical research.
3.4. Influence of Annealing Time
The crystallization process of NiAu5324 alloy is carried out after the tempering period and shown in Figure 8, Table 4.
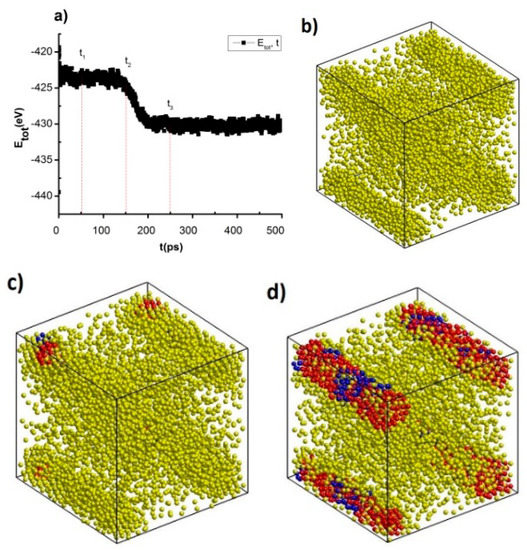
Figure 8.
The crystallization process of NiAu5324 alloy after different annealing time (a), the shape of NiAu alloy at t1 = 50 ps (b), t2 = 150 ps (c), t3 = 250 ps (d).

Table 4.
The structural characteristics and number of structural units of NiAu5324 alloy after different annealing times.
The result shows that after incubation period, t = 50 ps, 150 ps, 250 ps, Etot decreases from Etot = −425 eV to Etot = −430 eV (Figure 8a), the structural shape at t1 = 50 ps (Figure 8b), t2 = 150 ps (Figure 8c), t3 = 250 ps (Figure 8d) corresponding with the link length, the height of the RDF Ni-Au varies greatly from r = 2.45 Å to r = 2.49 Å, g(r) = 5.26 to g(r) = 5.88 and structural unit number FCC increases from 0.0 FCC to 1463 FCC, HCP increases from 0.0 HCP to 368 HCP, and Amor decreases from 5324 Amor to 3493 Amor (Table 4). The results obtained show that NiAu5324 alloy at Tg = 600 K after the annealing time t = 250 ps, the crystallization process increases, proving that NiAu5324 alloy is easy to crystallize at the temperature Tg and results obtained are consistent with the results of the previous alloys such as AlNi [69], NiCu [71], FeNi [68,70].
When increasing heating rate, the temperature leads to r, g(r) decreases, l, Etot increase, FCC, HCP decrease and Amor increase and vice versa with increasing atomic number and the incubation time at Tg = 600 K. This is a very useful result for the process of implementing experimental results in the future.
4. Conclusions
After studying the effect of factors on the structure and crystallize process, we got the following results: The relationship between size (l) and atomic number (N) is determined according to the formula is l~N−1/3; the total energy of the system (−Etot) always depends on N by function, the result is consistent with results [67,68,69,70,71,72,73,74,75] when the glass temperature (Tg), Tg = 600 K. With NiAu5324, when increasing the heating rate from 4 × 10¹² K/s to 2 × 10¹³ K/s, 4 × 10¹³ K/s, 2 × 10¹⁴ K/s, and 4 × 10¹⁴ K/s leads to r decrease from r = 2.47Å to r = 2.43 Å, and g(r) decrease from g(r) = 6.51 to g(r) = 6.05, corresponding to the change of g(r) and structural unit number. FCC, HCP, Amor FCC decreases from 802 FCC to 0.0 FCC, HCP decreases from 811 HCP to 13 HCP, Amor increases from 3711 Amor to 5311 Amor. When increasing atom number from NiAu2048 to NiAu2916, NiAu4000, NiAu5324, NiAu6912, first peak position (r) of RDF changes values from r = 2.49 Å to r = 2.45 Å, g(r) changes from g(r) = 6.43 to g(r) = 6.77, the structural unit number changes corresponding to FCC increases from 312 FCC to 1869 FCC, HCP increases from 308 HCP to 914 HCP, Amor increases from 1293 Amor to 4129 Amor. Similarly, with NiAu5324 when increasing T from T = 300 K to T = 1500 K, r decreases from r = 2.47 Å to r = 2.32 Å, g(r) changes in the range from g(r) = 6.51 to g(r) = 4.62, FCC decreases rapidly from 802 FCC to 0.0 FCC, HCP decreases rapidly from 811 HCP to 0.0 HCP, Amor increases from 3711 HCP to 5324 HCP, Amor state maximum increases. When increasing in annealing times at Tg = 600 K leads to the structural unit number FCC, HCP increases, Amor decreases. It indicates that the heating rate increase leads to the NiAu alloy change from crystallizing state to the amorphous state; increasing atomic number, annealing times leads to crystallization process increase; increasing temperature leads to process change from a crystallization state to a liquid state. This is a very essential factor and a basis for future empirical research.
Author Contributions
D.N.T.: conceptualization, methodology, validation, investigation, writing—original draft preparation. V.C.L.: data curation. Ş.Ţ.: writing—review and editing. All authors have read and agreed to the published version of the manuscript.
Funding
This research received no external funding.
Data Availability Statement
The data that support the findings of this study are available from the corresponding author upon reasonable request.
Conflicts of Interest
The authors declare no conflict of interest.
References
- Liu, H.B.; Pal, U.; Ascencio, J.A. Thermodynamic stability and melting mechanism of bimetallic Au−Pt nanoparticles. J. Phys. Chem. C 2008, 112, 19173–19177. [Google Scholar] [CrossRef]
- Mejía-Rosales, S.J.; Fernández-Navarro, C.; Pérez-Tijerina, E.; Montejano-Carrizales, J.M.; José-Yacamán, M. Two-Stage Melting of Au−Pd Nanoparticles. J. Phys. Chem. B 2006, 110, 12884–12889. [Google Scholar] [CrossRef] [PubMed]
- Davoodi, J.; Katouzi, F. High pressure molecular dynamics simulation of Au-x%Ni alloys. J. Appl. Phys. 2014, 115, 094905. [Google Scholar] [CrossRef]
- Link, S.; Wang, Z.L.; El-Sayed, M.A. Alloy formation of gold-silver nanoparticles and the dependence of the plasmon ab-sorption on their composition. J. Phys. Chem. B 1999, 103, 3529–3533. [Google Scholar] [CrossRef]
- Wu, M.-L.; Chen, D.-H.; Huang, T.-C. Synthesis of Au/Pd bimetallic nanoparticles in reverse micelles. Langmuir 2001, 17, 3877–3883. [Google Scholar] [CrossRef]
- Lee, C.C.; Chen, D.H. Large-scale synthesis of Ni–Ag core–shell nanoparticles with magnetic, optical and antioxidation properties. Nanotechnology 2006, 17, 3094–3099. [Google Scholar] [CrossRef]
- De, G.; Rao, C.N.R. Au–Pt alloy nanocrystals incorporated in silica films. J. Mater. Chem. 2005, 15, 891–894. [Google Scholar] [CrossRef]
- Duan, S.; Wang, R. Bimetallic nanostructures with magnetic and noble metals and their physicochemical applications. Prog. Nat. Sci. Mater. Int. 2013, 23, 113–126. [Google Scholar] [CrossRef]
- Ziaei-azad, H.; Yin, C.X.; Shen, J.; Hu, Y.; Karpuzov, D.; Semagina, N. Size- and structure-controlled mono- and bimetallic Ir-Pd nanoparticles in selective ring opening of indan. J. Catal. 2013, 300, 113–124. [Google Scholar] [CrossRef]
- Brullot, W.; Valev, V.K.; Verbiest, T. Magnetic-plasmonic nanoparticles for the life sciences: Calculated optical properties of hybrid structures. Nanomed. Nanotechnol. Biol. Med. 2012, 8, 559–568. [Google Scholar] [CrossRef]
- Wang, X.; Sun, S.; Huong, Z.; Zhong, H.; Zhong, S. Preparation and catalytic activity of PVP-protected Au/Ni bimetallic nanoparticles for hydrogen generation from hydrolysis of basic NaBH4 solution. Int. J. Hydrogen Energy 2014, 39, 905–916. [Google Scholar] [CrossRef]
- Chen, D.H.; Liao, M.H. Preparation and characterization of YADH-bound magnetic nanoparticles. J. Mol. Catal. B-Enzym. 2002, 16, 283–291. [Google Scholar] [CrossRef]
- Stoeva, S.I.; Huo, F.; Lee, J.-S.; Mirkin, C.A. Three-layer composite magnetic nanoparticle probes for DNA. J. Am. Chem. Soc. 2005, 127, 15362–15363. [Google Scholar] [CrossRef]
- Weizmann, Y.; Patolsky, F.; Katz, E.; Willner, I. Amplified DNA sensing and immunosensing by the rotation of functional magnetic particles. J. Am. Chem. Soc. 2003, 125, 3452–3454. [Google Scholar] [CrossRef] [PubMed]
- Weizmann, Y.; Patolsky, F.; Katz, E.; Willner, I. Amplified telomerase analysis by using rotating magnetic particles: The rapid and sensitive detection of cancer cells. ChemBioChem 2004, 5, 943–948. [Google Scholar] [CrossRef] [PubMed]
- Gu, H.; Xu, K.; Xu, C.; Xu, B. Biofunctional magnetic nanoparticles for protein separation and pathogen detection. Chem. Commun. 2006, 941–949. [Google Scholar] [CrossRef] [PubMed]
- Lee, W.; Kim, M.G.; Choi, J.; Park, J.-I.; Ko, S.J.; Oh, S.J.; Cheon, J. Redox−transmetalation process as a generalized synthetic strategy for core−shell magnetic nanoparticles. J. Am. Chem. Soc. 2005, 127, 16090–16097. [Google Scholar] [CrossRef] [PubMed]
- Alikhani, S.; Tajalli, H.; Koushki, E. Third order optical nonlinearity and diffraction pattern of Ni nanoparticles prepared by laser ablation. Opt. Commun. 2013, 286, 318–321. [Google Scholar] [CrossRef]
- Mafune, F.; Okamoto, T.; Ito, M. Surfactant-free small Ni nanoparticles trapped on silica nanoparticles prepared by pulsed laser ablation in liquid. Chem. Phys. Lett. 2014, 591, 193–196. [Google Scholar] [CrossRef]
- Perez, J.M.; Simeone, F.J.; Saeki, Y.; Josephson, L.; Weissleder, R. Viral-induced self-assembly of magnetic nanoparticles allows the detection of viral particles in biological media. J. Am. Chem. Soc. 2003, 125, 10192–10193. [Google Scholar] [CrossRef]
- Parks, E.K.; Kerns, K.P.; Riley, S.J. The structure of nickel-iron clusters probed by adsorption of molecular nitrogen. Chem. Phys. 2000, 262, 151–167. [Google Scholar] [CrossRef]
- Chiang, I.C.; Chen, Y.T.; Chen, D.H. Synthesis of NiAu colloidal nanocrystals with kinetically tunable properties. J. Alloys Compd. 2009, 468, 237–245. [Google Scholar] [CrossRef]
- Ban, I.; Stergar, J.; Drofenik, M.; Ferk, G.; Makovec, D. Synthesis of copper–nickel nanoparticles prepared by mechanical mill-ing for use in magnetic hyperthermia. J. Magn. Magn. Mater. 2011, 323, 2254–2258. [Google Scholar] [CrossRef]
- Song, A.J.; Ma, M.Z.; Zhang, W.G.; Zong, H.T.; Liang, S.X.; Hao, Q.H.; Zhou, R.Z.; Jing, Q.; Liu, R.P. Preparation and growth of Ni–Cu alloy nanoparticles prepared by arc plasma evaporation. Mater. Lett. 2010, 64, 1229–1231. [Google Scholar] [CrossRef]
- Sarac, U.; Baykul, M.C. Morphological and microstructural properties of two-phase Ni–Cu films electrodeposited at different electrolyte temperatures. J. Alloys Compd. 2013, 552, 195–201. [Google Scholar] [CrossRef]
- Alper, M.; Kockar, H.; Safak, M.; Baykul, M.C. Comparison of Ni–Cu alloy films electrodeposited at low and high pH levels. J. Alloys Compd. 2008, 453, 15–19. [Google Scholar] [CrossRef]
- Qiu, R.; Zhang, X.L.; Qiao, R.; Li, Y.; Kim, Y.I.; Kang, Y.S. CuNi dendritic material: Synthesis, mechanism discussion, and application as glucose sensor. Chem. Mater. 2007, 19, 4174–4180. [Google Scholar] [CrossRef]
- Mohamed Saeed, G.H.; Radiman, S.; Gasaymeh, S.S.; Lim, H.N.; Huang, N.M. Mild hydrothermal synthesis of Ni-Cu nanoparticles. J. Nanomater. 2010, 2010, 184137. [Google Scholar] [CrossRef]
- Pramanik, S.; Pal, S.; Bysakh, G.D. Cu-Ni alloy nanoparticles embedded SiO2 films: Synthesis and structure. J. Nanopart. Res. 2011, 13, 321–329. [Google Scholar] [CrossRef]
- Durivault, L.; Brylev, O.; Reyter, D.; Sarrazin, M.; Bélanger, D.; Roué, L. Cu-Ni materials prepared by mechanical milling: Their properties and electrocatalytic activity towards nitrate reduction in alkaline medium. J. Alloys Compd. 2007, 432, 323–332. [Google Scholar] [CrossRef]
- Feng, J.; Zhang, C.H.P. Preparation of Cu-Ni alloy nanocrystallites in water-in-oil microemulsions. J. Colloid Interface Sci. 2006, 293, 414–420. [Google Scholar] [CrossRef] [PubMed]
- Yan, Z.; Chrisey, D.B. Pulsed laser ablation in liquid for micro-/nanostructure generation. J. Photochem. Photobiol. C Photochem. Rev. 2012, 13, 204–223. [Google Scholar] [CrossRef]
- Sukhov, I.A.; Shafeev, G.A.; Voronov, V.V.; Sygletou, M.; Stratakis, E.; Fotakis, C. Generation of nanoparticles of bronze and brass by laser ablation in liquid. Appl. Surf. Sci. 2014, 302, 79–82. [Google Scholar] [CrossRef]
- Caprion, D.; Schober, H.R. Computer simulation of liquid and amorphous selenium. J. Non-Cryst. Solids 2003, 326–327, 369–373. [Google Scholar] [CrossRef]
- Marqués, L.A.; Pelaz, L.; Aboy, M.; Lopez, P.; Barbolla, J. Atomistic modeling of dopant implantation and annealing in Si: Damage evolution, dopant diffusion and activation. Comput. Mater. Sci. 2005, 33, 92–105. [Google Scholar]
- Shao, Y.; Clapp, P.C.; Rifkin, J.A. Molecular dynamics simulation of martensitic transformations in NiAI. Metall. Mater. Trans. A 1996, 27, 1477–1489. [Google Scholar] [CrossRef]
- Erkoc, S. Empirical many-body potential energy functions used in computer simulations of condensed matter properties. Phys. Rep. 1997, 278, 79–105. [Google Scholar] [CrossRef]
- Finnis, M.W.; Sinclair, J.E. A simple empirical N-body potential for transition metals. Philos. Mag. A 1984, 50, 45–55. [Google Scholar] [CrossRef]
- Sutton, A.P.; Chen, J. Long-range Finnis–Sinclair potentials. Philos. Mag. Lett. 1990, 61, 139–146. [Google Scholar] [CrossRef]
- Rapallo, A.; Olmos-Asar, J.A.; Oviedo, O.A.; Ludueña, M.; Ferrando, R.; Mariscal, M.M. Thermal properties of Co/Au nanoalloys and comparison of different computer simulation techniques. J. Phys. Chem. C 2012, 116, 17210–17218. [Google Scholar] [CrossRef]
- Barnard, A.S. Modelling of nanoparticles: Approaches to morphology and evolution. Rep. Prog. Phys. 2010, 73, 086502. [Google Scholar] [CrossRef]
- Jiang, S.; Zhang, Y.W.; Gan, Y.; Chen, Z.; Peng, H. Molecular dynamics study of neck growth in laser sintering of hollow silver nanoparticles with different heating rates. J. Phys. D Appl. Phys. 2013, 46, 335302. [Google Scholar] [CrossRef]
- Shim, J.H.; Lee, S.C.; Lee, B.J.; Suh, J.Y.; Cho, Y.W. Molecular dynamics simulation of the crystallization of a liquid gold nanoparticle. J. Cryst. Growth 2003, 250, 558–564. [Google Scholar] [CrossRef]
- Chen, K.; Sha, X.; Zhang, X.; Li, Y. Rapid solidification of Cu 25at.% Ni alloy: Molecular dynamics simulations using embedded atom method. Mater. Sci. Eng. A 1996, 214, 139–145. [Google Scholar]
- Brown, T.M.; Adams, J.B. EAM calculations of the thermodynamics of amorphous copper. J. Non-Cryst. Solids 1995, 180, 275–284. [Google Scholar] [CrossRef]
- Hultgren, R.; Orr, R.L.; Anderson, P.D.; Kelley, K.K. Selected Values of Thermodynamic Properties of Metals and Alloys; John Wiley & Sons Inc.: New York, NY, USA, 1963. [Google Scholar]
- Yuan, G.; Louis, C.; Delannoy, L.; Keane, M.A. Silica- and titania-supported Ni–Au: Application in catalytic hydrodechlorination. J. Catal. 2007, 247, 256–268. [Google Scholar] [CrossRef]
- Triantafyllopoulos, N.C.; Neophytides, S.G. Dissociative adsorption of CH4 on NiAu/YSZ: The nature of adsorbed carbonaceous species and the inhibition of graphitic C formation. J. Catal. 2006, 239, 187–199. [Google Scholar] [CrossRef]
- Chin, Y.H.; King, D.L.; Roh, H.S.; Wang, Y.; Heald, S.M. Structure and reactivity investigations on supported bimetallic Au-Ni catalysts used for hydrocarbon steam reforming. J. Catal. 2006, 244, 153–162. [Google Scholar] [CrossRef]
- Lv, H.; Xi, Z.; Chen, Z.z.; Guo, S.; Yu, Y.; Zhu, W.; Li, Q.; Zhang, X.; Pan, M.; Lu, G.; et al. A New Core/Shell NiAu/Au Nanoparticle Catalyst with Pt-like Activity for Hydrogen Evolution Reaction. J. Am. Chem. Soc. 2015, 137, 5859–5862. [Google Scholar] [CrossRef]
- Wang, J.H.; Lu, X.G.; Sundman, B.; Su, X.P. Thermodynamic assessment of the Au–Ni system. Calphad 2005, 29, 263–268. [Google Scholar] [CrossRef]
- Lu, D.L.; Domen, K.; Tanaka, K. Electrodeposited Au−Fe, Au−Ni, and Au−Co alloy nanoparticles from aqueous electrolytes. Langmuir 2002, 18, 3226–3232. [Google Scholar] [CrossRef]
- Schaak, R.E.; Sra, A.K.; Leonard, B.M.; Cable, R.E.; Bauer, J.C.; Han, Y.F.; Means, J.; Teizer, W.; Vasquez, Y.; Funck, E.S. Metallurgy in a beaker: nanoparticle toolkit for the rapid low-temperature solution synthesis of functional multimetallic solid-state materials. J. Am. Chem. Soc. 2005, 127, 3506–3515. [Google Scholar] [CrossRef] [PubMed]
- Leonard, B.M.; Bhuvanesh, N.S.P.; Schaak, R.E. Low-temperature polyol synthesis of AuCuSn2 and AuNiSn2: Using solution chemistry to access ternary intermetallic compounds as nanocrystals. J. Am. Chem. Soc. 2005, 127, 7326–7327. [Google Scholar] [CrossRef] [PubMed]
- Zhou, S.H.; Yin, H.F.; Schwartz, V.; Wu, Z.L.; Mullins, D.R.; Eichhorn, B.; Overbury, S.H.; Dai, S. In situ phase separation of NiAu bulk nanoparticles for preparing highly active Au/NiO CO oxidation catalysts. Chem. Phys. Chem. 2008, 9, 2475–2479. [Google Scholar] [CrossRef] [PubMed]
- Vasquez, Y.; Luo, Z.P.; Schaak, R.E. Low-temperature solution synthesis of the non-equilibrium ordered intermetallic compounds Au3Fe, Au3Co, and Au3Ni as nanocrystals. J. Am. Chem. Soc. 2008, 130, 11866–11867. [Google Scholar] [CrossRef] [PubMed]
- Haruta, M.; Date, M. Advances in the catalysis of Au nanoparticles. Appl. Catal. A 2001, 222, 427–437. [Google Scholar] [CrossRef]
- Choudhary, T.V.; Goodman, D.W. Oxidation catalysis by supported gold nano-clusters. Top. Catal. 2002, 21, 25–34. [Google Scholar] [CrossRef]
- Bond, G.C.; Louis, C.; Thompson, D.T. Catalysis by Gold; Imperial College Press: London, UK, 2006. [Google Scholar]
- Kung, M.C.; Davis, R.J.; Kung, H.H. Understanding Au-catalyzed low-temperature co oxidation. J. Phys. Chem. C 2007, 111, 11767–11775. [Google Scholar] [CrossRef]
- Corti, C.W.; Holliday, R.J.; Thompson, D.T. Progress towards the commercial application of gold catalysts. Top. Catal. 2007, 44, 331–343. [Google Scholar] [CrossRef]
- Haile, J.M. Molecular Dynamics Simulation: Elementary Methods; John Wiley & Sons: New York, NY, USA, 1992. [Google Scholar]
- Kart, H.H.; Tomak, M.; Uludogan, M.; Cagin, T. Thermodynamical and mechanical properties of Pd–Ag alloys. Comput. Mater. Sci. 2005, 32, 107–117. [Google Scholar] [CrossRef]
- Lecadre, F.; Maroun, F.; Braems, I.; Berthier, F.; Goyhenex, C.; Allongue, P. AuNi alloy monolayer films electrodeposited on Au (111): An in situ STM study. Surf. Sci. 2013, 607, 25–32. [Google Scholar] [CrossRef]
- Berendsen, H.J.C.; Postma, J.P.M.; van Gunsteren, W.F.; DiNola, A.; Haak, J.R. Molecular dynamics with coupling to an external bath. J. Chem. Phys. 1984, 81, 3684–3690. [Google Scholar] [CrossRef]
- Li, B.; Xing, G.; Wang, H.; Wang, R. Tailoring characteristic thermal stability of Ni-Au binary nanocrystals via structure and composition engineering: Theoretical insights into structural evolution and atomic in-ter-diffusion. AIP Adv. 2014, 4, 117132. [Google Scholar] [CrossRef]
- Quoc, T.T.; Trong, D.N. Molecular dynamics factors affecting on the structure, crystallize process of Al bulk. Phys. B Condens. Matter 2019, 570, 116–121. [Google Scholar] [CrossRef]
- Nguyen-Trong, D.; Pham-Huu, K.; Nguyen-Tri, P. Simulation on the factors affecting the crystallization process of FeNi alloy by Molecular Dynamics. ACS Omega 2019, 4, 14605–14612. [Google Scholar] [CrossRef]
- Dung, N.-T.; Phuong, N.-T. Factors affecting the structure, crystallize process and crystallization process of AlNi nanoparticles. J. Alloys Compd. 2020, 812, 152133. [Google Scholar]
- Dung, N.T. Influence of impurity concentration, atomic number, temperature and tempering time on microstructure and phase transformation of Ni1-xFex (x = 0.1, 0.3, 0.5) nanoparticles. Mod. Phys. Lett. B 2018, 32, 1850204. [Google Scholar] [CrossRef]
- Tuan, T.Q.; Dung, N.T. Effect of heating rate, impurity concentration of Cu, atomic number, temperatures, time annealing temperature on the structure, crystallization temperature and crystallization process of Ni1−xCux bulk; x = 0:1, 0.3, 0.5, 0.7. Int. J. Mod. Phys. B 2018, 32, 1830009. [Google Scholar] [CrossRef]
- Kien, P.H. Study of structural transition of nickel metal under temperature. Phase Transit. 2017, 90, 732–741. [Google Scholar]
- Nguyen, T.D.; Nguyen, C.C.; Tran, V.H. Molecular dynamics study of microscopic structures, crystallize processs and dynamic crystallization in Ni nanoparticles. RSC Adv. 2017, 7, 25406–25413. [Google Scholar] [CrossRef]
- Qi, Y.; Çagin, T.; Johnson, W.L.; Goddard, W.A., III. Melting and crystallization in Ni nanoclusters: The mesoscale regime. J. Chem. Phys. 2001, 115, 385–394. [Google Scholar] [CrossRef]
- Zhang, Y.; Wang, L.; Wang, W. Thermodynamic, dynamic and structural relaxation in supercooled liquid and glassy Ni below the critical temperature. J. Phys. Condens. Matter 2007, 19, 196106. [Google Scholar] [CrossRef]
- Nguyen-Trong, D.; Nguyen-Chinh, C.; Duong-Quo, V. Study on the effect of doping on lattice constant and elec-tronic structure of bulk AuCu by the density functional theory. J. Multiscale Model. 2020, 11, 2030001. [Google Scholar] [CrossRef]
- Long, V.C.; Quoc, V.D.; Trong, D.N. Ab initio calculations on the structural and electronic properties of AgAu alloys. ACS Omega 2020, 5, 31391–31397. [Google Scholar] [CrossRef]
- Levitas, V.I.; Roy, A.M.; Preston, D.L. Multiple twinning and variant-variant transformations in martensite: Phase-field approach. Phys. Rev. B 2013, 88, 054113. [Google Scholar] [CrossRef]
- Levitas, V.I.; Roy, A.M. Multiphase phase field theory for temperature- and stress-induced phase transformations. Phys. Rev. B 2015, 91, 174109. [Google Scholar] [CrossRef]
- Levitas, V.I.; Roy, A.M. Multiphase phase field theory for temperature-induced phase transformations: Formulation and application to interfacial phases. Acta Mater. 2016, 105, 244–257. [Google Scholar] [CrossRef]
- Roy, A.M. Effects of interfacial stress in phase field approach for martensitic phase transformation in NiAl shape memory alloys. Appl. Phys. A 2020, 126, 576. [Google Scholar] [CrossRef]
- Ichikawa, T. Electron diffraction study of the local atomic arrangement in amorphous Iron and Nickel films. Phys. Status Solidi (a) 1973, 19, 707–716. [Google Scholar] [CrossRef]
- Ferrando, R.; Jellinek, J.; Johnston, R.L. Nanoalloys: from theory to applications of alloy clusters and nanoparticles. Chem. Rev. 2008, 108, 845–910. [Google Scholar] [CrossRef] [PubMed]
- Kim, H.Y.; Kim, H.G.; Ryu, J.H.; Lee, H.M. Preferential segregation of Pd atoms in the Ag-Pd bimetallic cluster: Density functional theory and molecular dynamics simulation. Phys. Rev. B 2007, 75, 212105. [Google Scholar] [CrossRef]
- Chiang, I.C.; Chen, D.H. Synthesis of monodisperse FeAu nanoparticles with tunable magnetic and optical properties. Adv. Funct. Mater. 2007, 17, 1311–1316. [Google Scholar] [CrossRef]
- dos Santos, V.; Kuhnen, C.A. Electronic structure and magnetic properties of Ni/Au and Ni/Cu bilayers. Thin Solid Films 1999, 350, 258–263. [Google Scholar] [CrossRef]
- Togasaki, N.; Okinaka, Y.; Homma, T.; Osaka, T. Preparation and characterization of electroplated amorphous gold–nickel alloy film for electrical contact applications. Electrochim. Acta 2005, 51, 882–887. [Google Scholar] [CrossRef]
- Molenbroek, A.M.; Nørskov, J.K.; Clausen, B.S. Structure and reactivity of Ni−Au nanoparticle catalysts. J. Phys. Chem. B 2001, 105, 5450–5458. [Google Scholar] [CrossRef]
- Antoniak, C.; Gruner, M.E.; Spasova, M.; Trunova, A.V.; Roemer, F.M.; Warland, A.; Krumme, B.; Fauth, K.; Sun, S.; Entel, P.; et al. A guideline for atomistic design and understanding of ultrahard nanomagnets. Nat. Commun. 2011, 2, 528. [Google Scholar] [CrossRef]
- Sun, S.H.; Murray, C.B.; Weller, D.; Folks, L.; Moser, A. Monodisperse FePt nanoparticles and ferromagnetic FePt nanocrystal superlattices. Science 2000, 287, 1989–1992. [Google Scholar] [CrossRef]
- Gao, Y.; Shao, N.; Pei, Y.; Zeng, X.C. Icosahedral crown gold nanocluster Au43Cu12 with high catalytic activity. Nano Lett. 2010, 10, 1055–1062. [Google Scholar] [CrossRef]
- Sun, Q.; Ren, Z.; Wang, R.; Wang, N.; Cao, X. Platinum catalyzed growth of NiPt hollow spheres with an ultrathin shell. J. Mater. Chem. 2011, 21, 1925–1930. [Google Scholar] [CrossRef]
- Wang, R.M.; Zhang, H.Z.; Farle, M.; Kisielowski, C. Structural stability of icosahedral FePt nanoparticles. Nanoscale 2009, 1, 276–279. [Google Scholar] [CrossRef]
- Wang, R.M.; Dmitrieva, O.; Farle, M.; Dumpich, G.; Acet, M.; Mejia-Rosales, S.; Perez-Tijerina, E.; Yacaman, M.J.; Kisielowski, C. FePt icosahedra with magnetic cores and catalytic shells. J. Phys. Chem. C 2009, 113, 4395–4400. [Google Scholar] [CrossRef]
- Green, I.X.; Tang, W.J.; Neurock, M.; Yates, J.T. Spectroscopic observation of dual catalytic sites during oxidation of CO on a Au/TiO2 catalyst. Science 2011, 333, 736–739. [Google Scholar] [CrossRef] [PubMed]
- Rafii-Tabar, H.; Sutton, A.P. Long-range Finnis-Sinclair potentials for f.c.c. metallic alloys. Philos. Mag. Lett. 1991, 63, 217–224. [Google Scholar] [CrossRef]
- Kimura, Y.; Qi, Y.; Cagın, T.; Goddard, W.A. The quantum Sutton-Chen many-body potential for properties of fcc metals. Phys. Rev. 1998. to be submitted. [Google Scholar]
- Doye, J.P.K.; Wales, D.J. Global minima for transition metal clusters described by Sutton-Chen potentials. New J. Chem. 1998, 22, 733–744. [Google Scholar] [CrossRef]
- Qi, Y.; Cagin, T.; Kimura, Y.; Goddard, W.A. Molecular-dynamics simulations of glass formation and crystallization in binary liquid metals: Cu-Ag and Cu-Ni. Phys. Rev. B 1999, 59, 3527. [Google Scholar] [CrossRef]
- Sankaranarayanan, S.K.R.S.; Bhethanabotla, V.R.; Joseph, B. Molecular dynamics simulation study of the melting of Pd-Pt nanoclusters. Phys. Rev. B 2005, 71, 195415. [Google Scholar] [CrossRef]
- Tsuzuki, H.; Branicio, P.S.; Rino, J.P. Structural characterization of deformed crystals by analysis of common atomic neighborhood. Comput. Phys. Commun. 2007, 177, 518–523. [Google Scholar] [CrossRef]
- Honeycutt, J.D.; Andersen, H.C. Molecular dynamics study of melting and freezing of small lennard-jones clusters. J. Phys. Chem. 1987, 91, 4950–4963. [Google Scholar] [CrossRef]
- Radhi, A.; Behdinan, K. Identification of crystal structures in atomistic simulation by predominant common neighborhood analysis. Comput. Mater. Sci. 2017, 126, 182–190. [Google Scholar] [CrossRef]
- Nose, S. A unified formulation of the constant temperature molecular dynamics methods. J. Chem. Phys. 1984, 81, 511–519. [Google Scholar] [CrossRef]
- Hoover, W.G. Canonical dynamics: Equilibrium phase-space distributions. Phys. Rev. A 1985, 31, 1695–1697. [Google Scholar] [CrossRef] [PubMed]
- Xu, Y.H.; Wang, J.P. Direct Gas-phase synthesis of heterostructured nanoparticles through phase separation and surface segregation. Adv. Mater. 2008, 20, 994–999. [Google Scholar] [CrossRef]
Publisher’s Note: MDPI stays neutral with regard to jurisdictional claims in published maps and institutional affiliations. |
© 2021 by the authors. Licensee MDPI, Basel, Switzerland. This article is an open access article distributed under the terms and conditions of the Creative Commons Attribution (CC BY) license (http://creativecommons.org/licenses/by/4.0/).