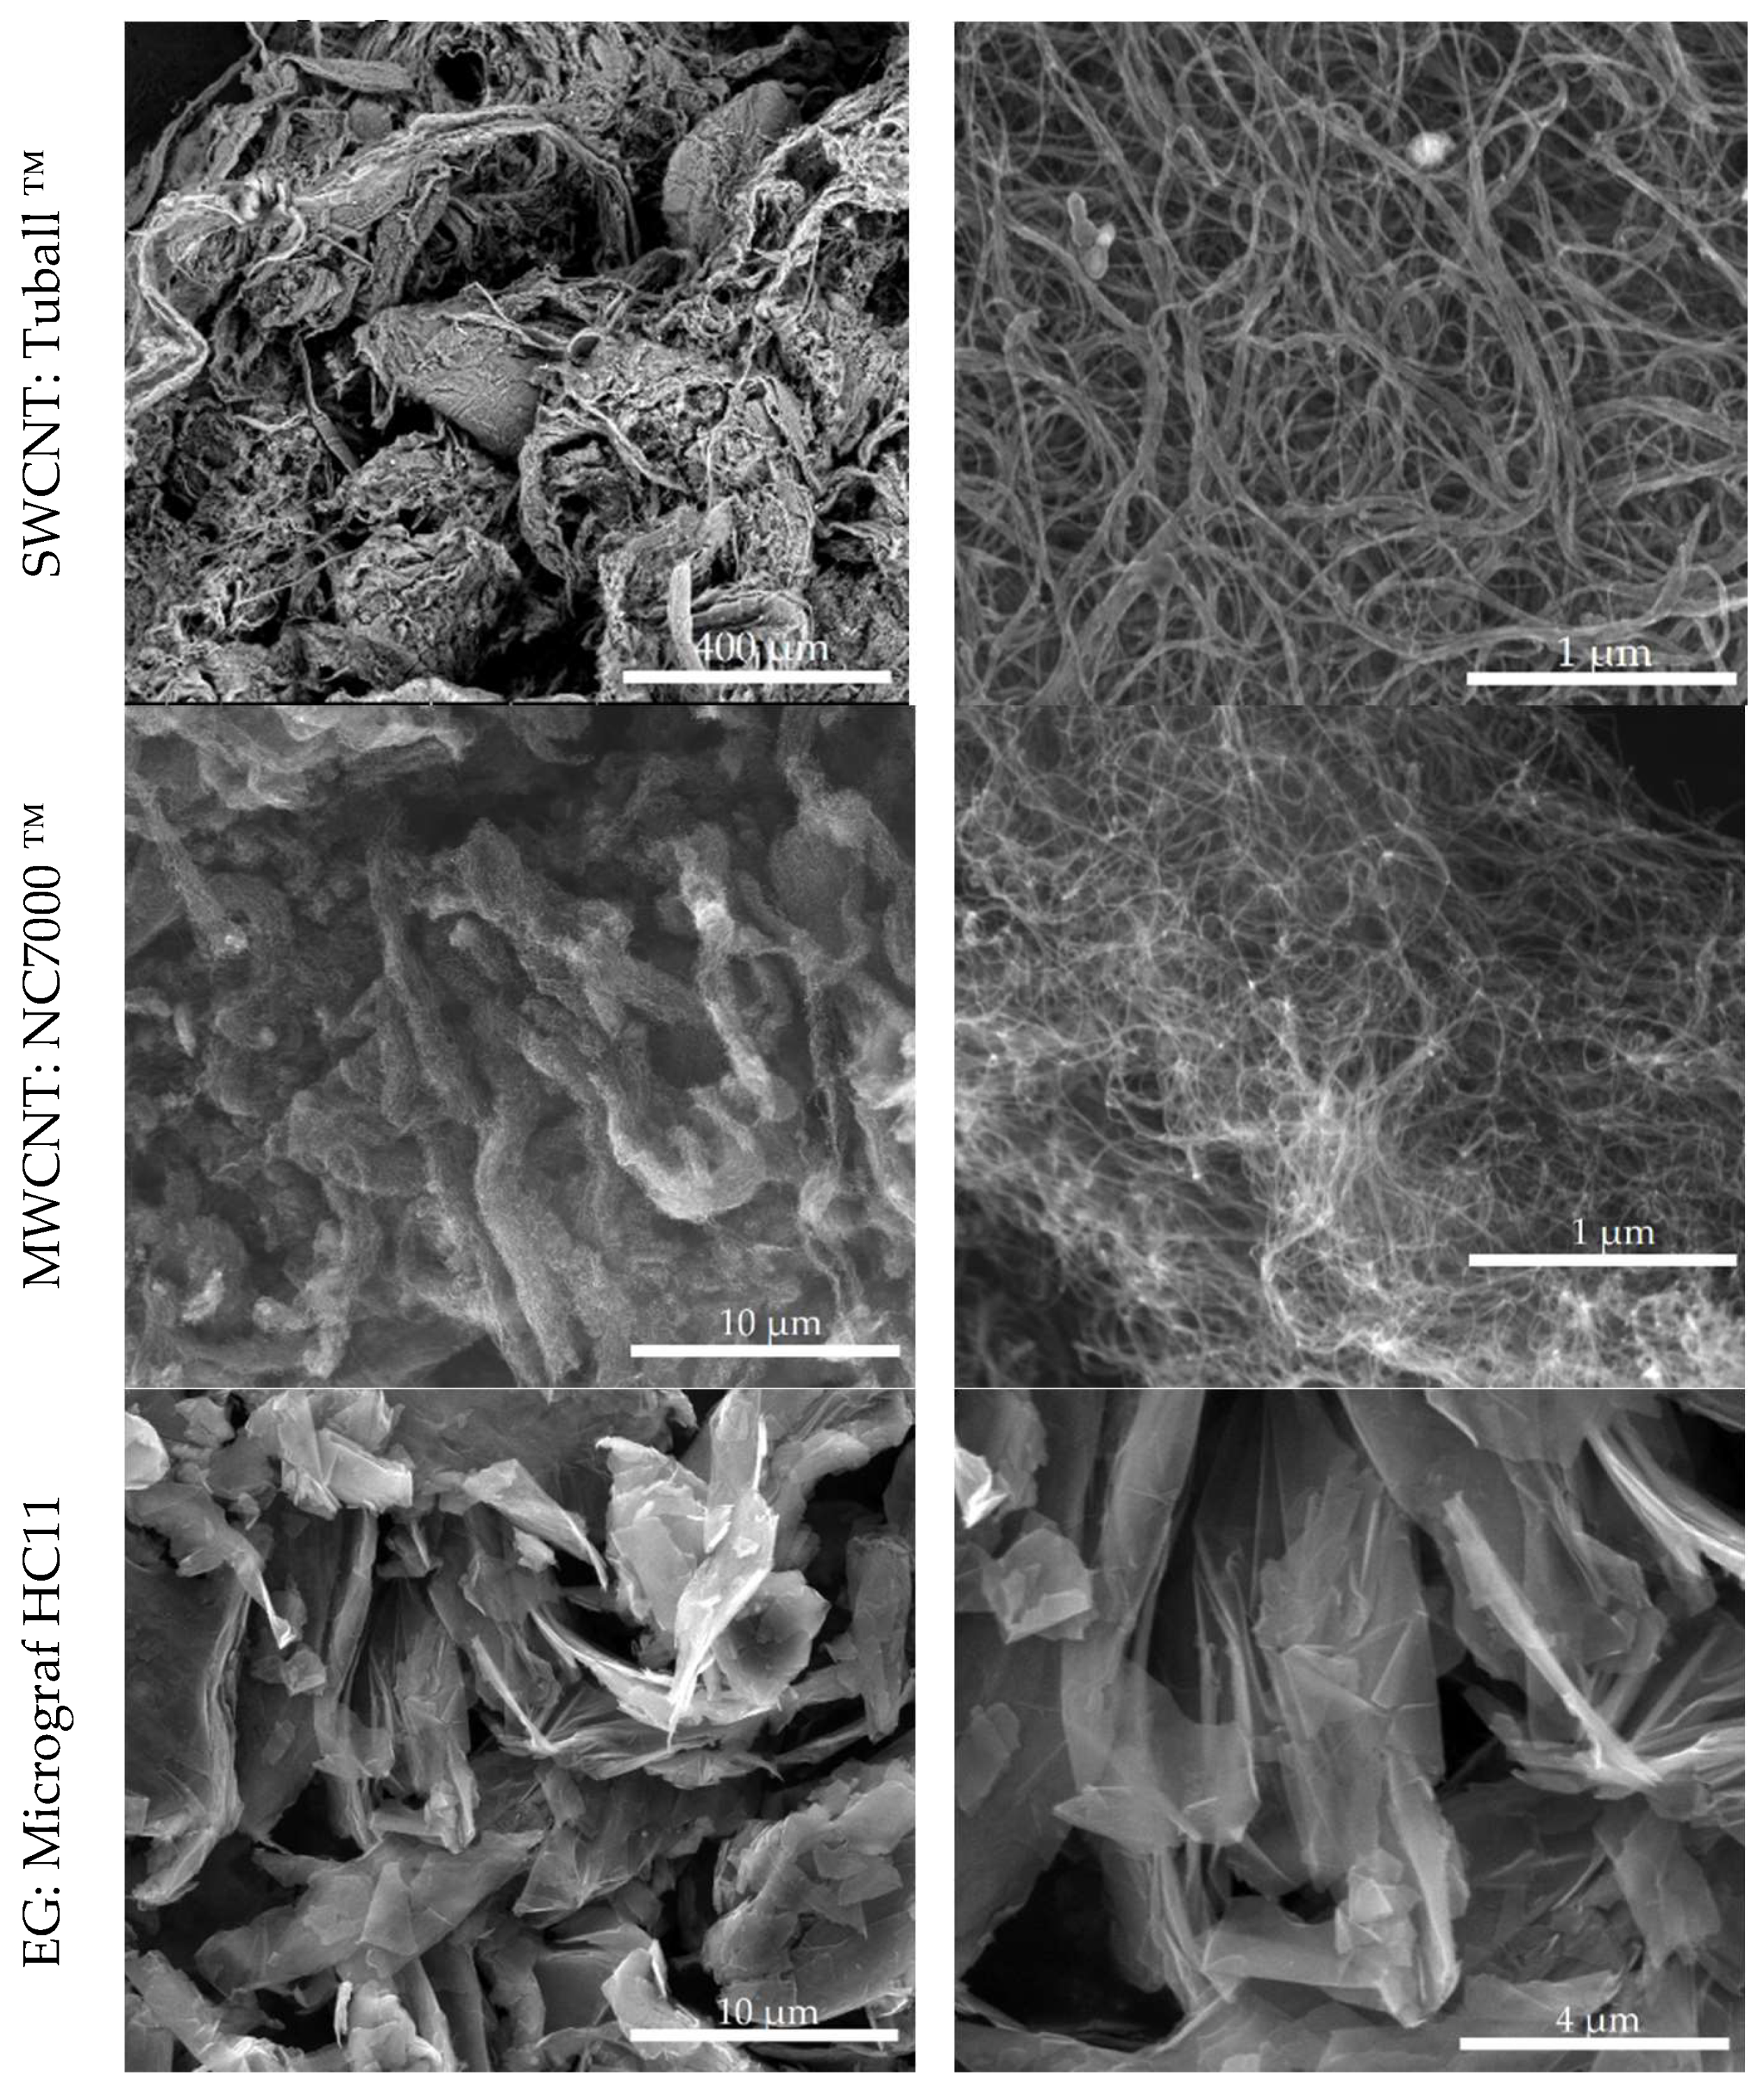
ECAs were prepared with epoxy resin and carbon nanomaterials with different morphology (SWCNT, MWCNT and EG), illustrated in
Figure 3. The SWCNT are observed to form long ropes, each containing a large number of nanotubes bound to each other through Van der Waals forces. The diameter of these ropes can be larger than the average diameter of a MWCNT (approximately 9.5 nm), as observed in
Figure 3 (complementary transmission electron microscopy images are presented in
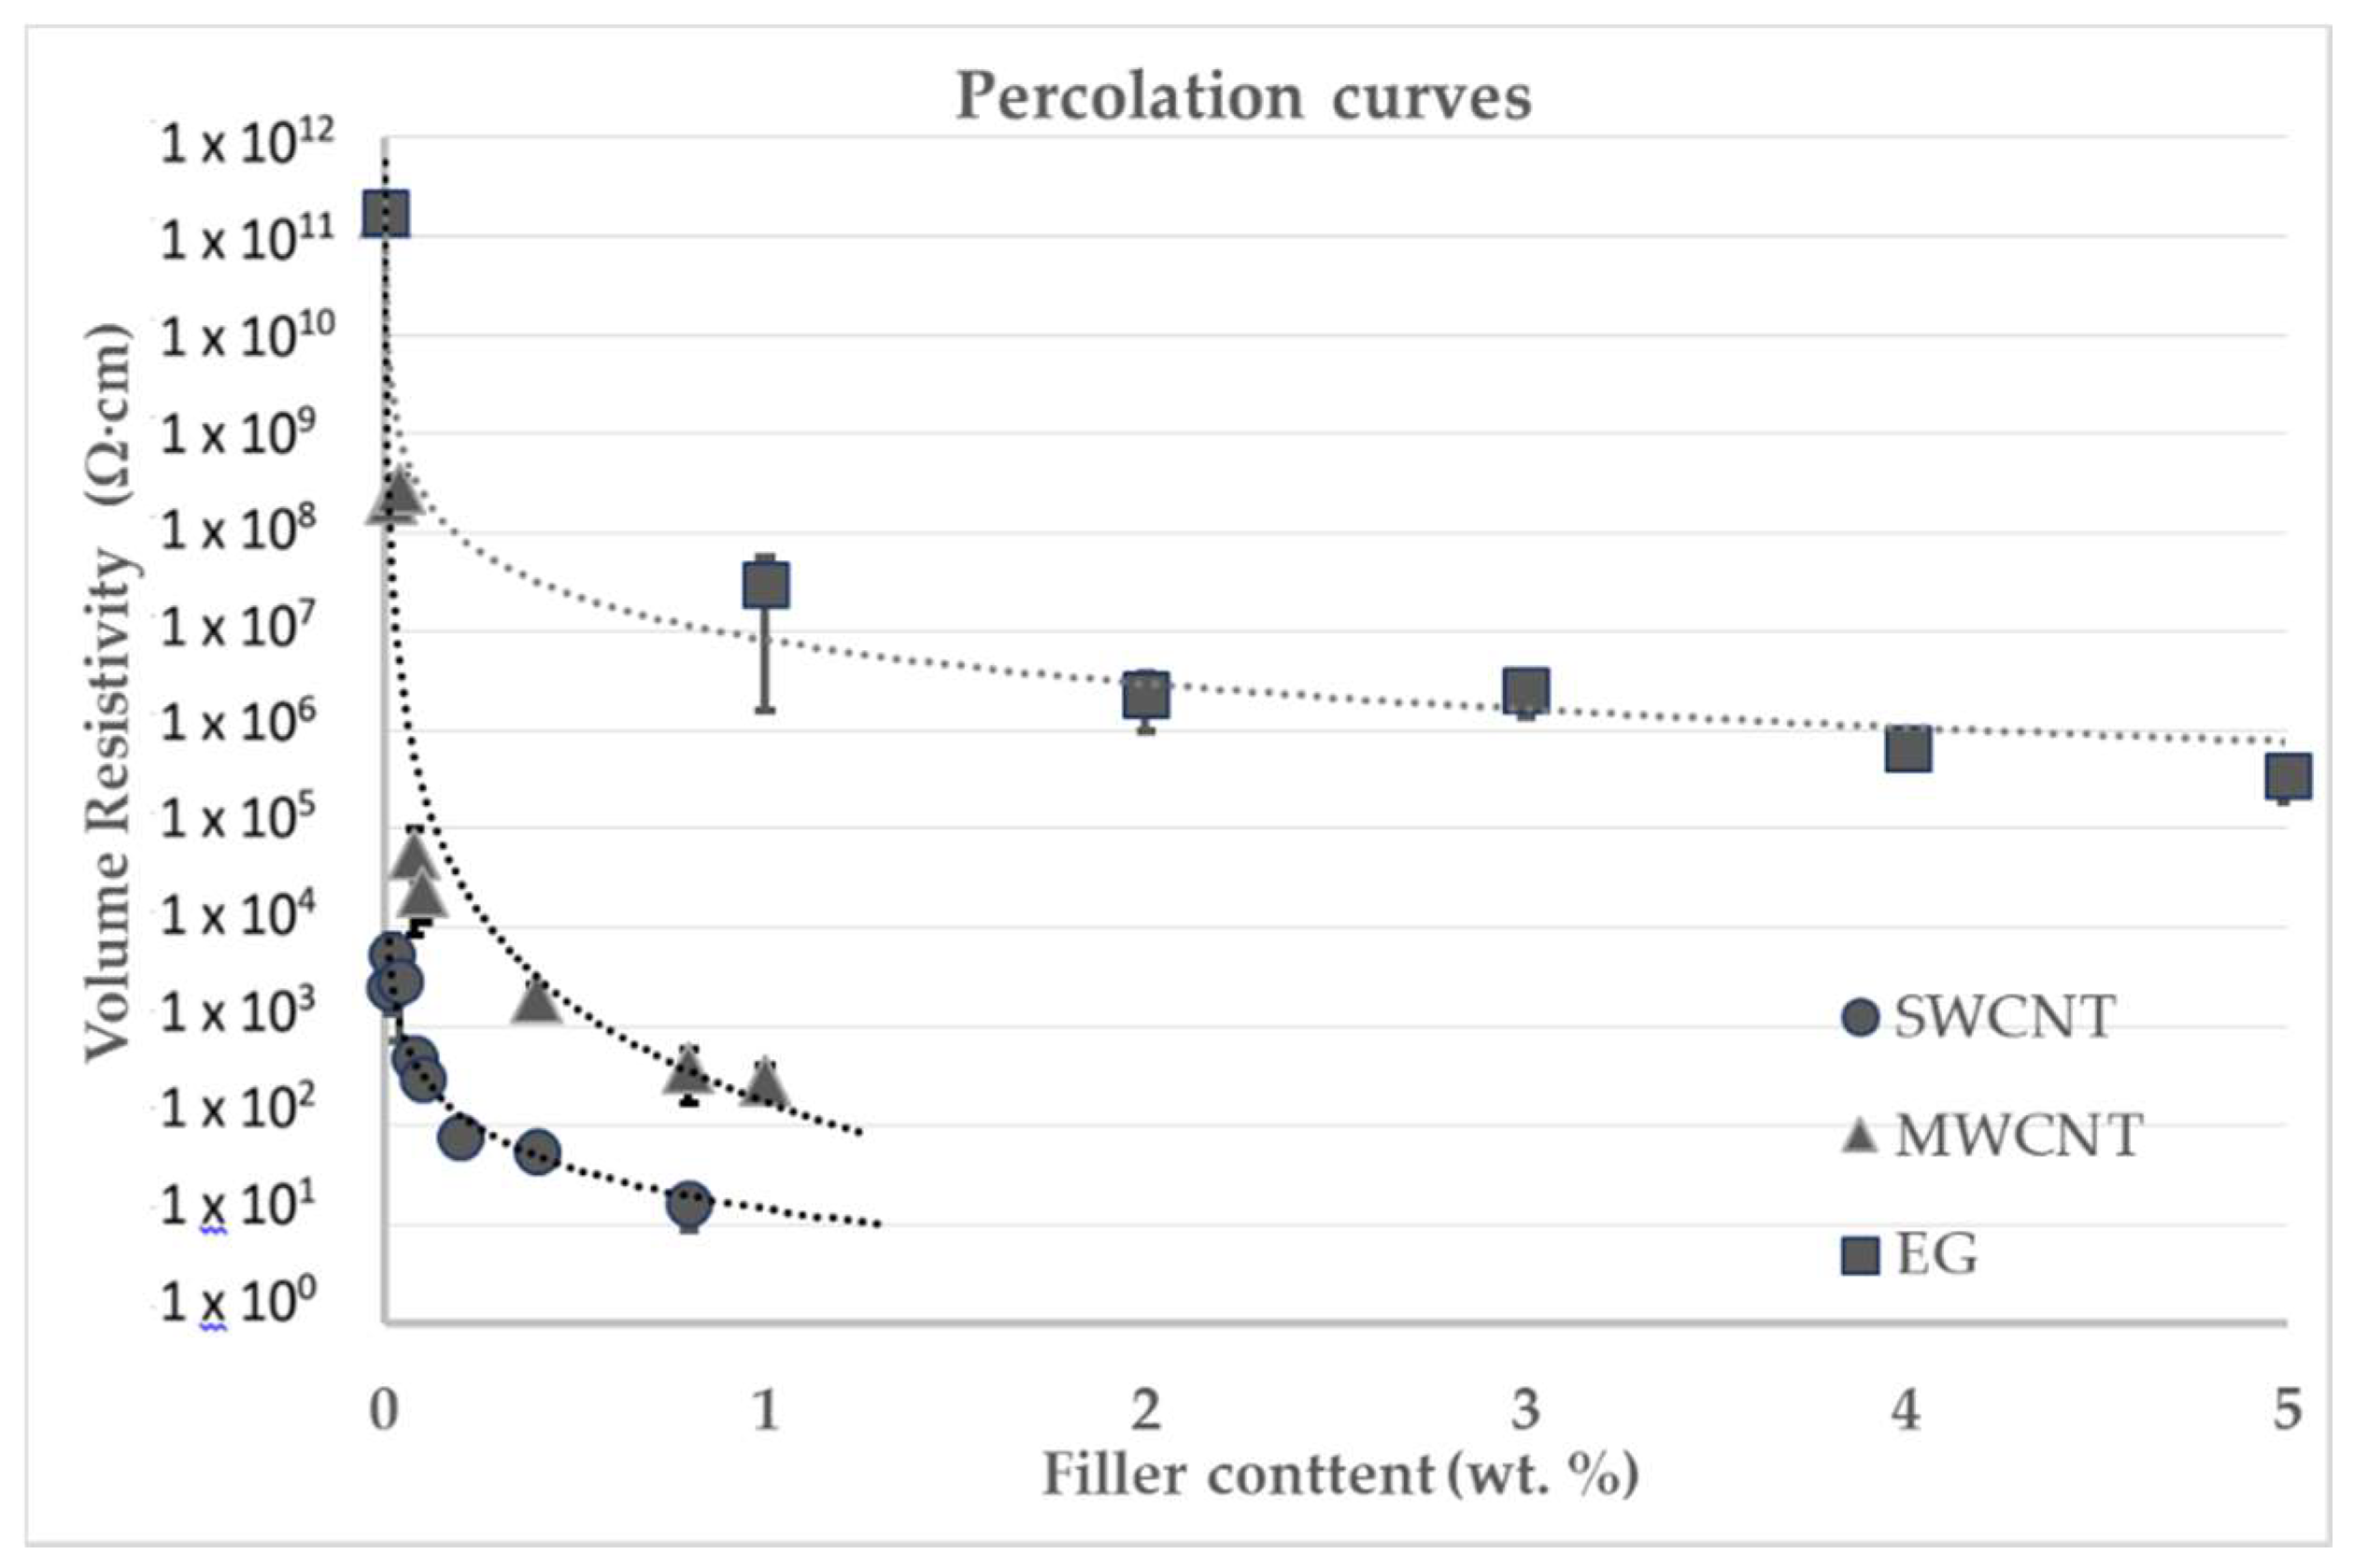
Figure S2). The EG flakes present a flat surface with equivalent diameter typically larger than 10 μm and the thickness in the nanometer range is comparable to the diameter of the nanotubes. Composites were prepared with each single type of nanomaterials to obtain the respective percolation curves and assess the electrical conductivity above the percolation threshold. The percolation curves obtained are represented in
Figure 4 (numerical results available in
Table S2). Based on these results, a set of hybrid compositions containing 1D and 2D nanomaterials was selected and the composites were prepared.
3.1. Morphological and Electrical Characterization of the Nanocomposite Resins
The selected compositions combining SWCNT with EG and MWCNT with EG are listed in
Table 1, as well as the electrical volume resistivity (R
0) of the respective composites.
Figure 5 illustrates the morphology of selected nanocomposites, as observed by SEM.
The effect of the addition of EG on the electrical resistivity of the composites shows some differences for SWCNT or MWCNT. Adding EG to the composite with lower SWCNT concentration increases the electrical resistivity by one order of magnitude while at higher SWCNT contents no major variation is observed. The composites with MWCNT however show a different trend, and the addition of EG at a lower concentration increased the electrical resistivity for all MWCNT contents; however, at a higher EG content, the resistivity decreased considerably. Chandrasekaran et al. report a decrease of electrical conductivity by two orders of magnitude for MWCNT/epoxy composites upon the incorporation of a small concentration of thermally reduced graphene oxide (TRGO) [
14]. The authors relate this effect to the agglomeration of MWCNT at the surface of TRGO, stabilized by π–π interactions, leaving the insulating oxidized regions of TRGO free. In the present work, the EG presents thicker flakes as compared to TRGO, with a smooth surface (
Figure 3 and
Figure 5) and a perfect graphitic structure as demonstrated by its Raman spectrum (
Figure 6), thus contributing to the electrical conductivity of the composite. Adsorption of nanotubes at the EG surface could be detrimental to the electrical conductivity near the percolation threshold, if it leads to a critical decrease of the bulk nanotube concentration. Interestingly, SWCNT seem to be more prone than MWCNT to adsorb at the EG surface, as illustrated in
Figure 5, and the only composite containing SWCNT showing a resistivity increase after EG addition was the one with 0.2 wt.% SWCNT, the composition closer to the percolation threshold.
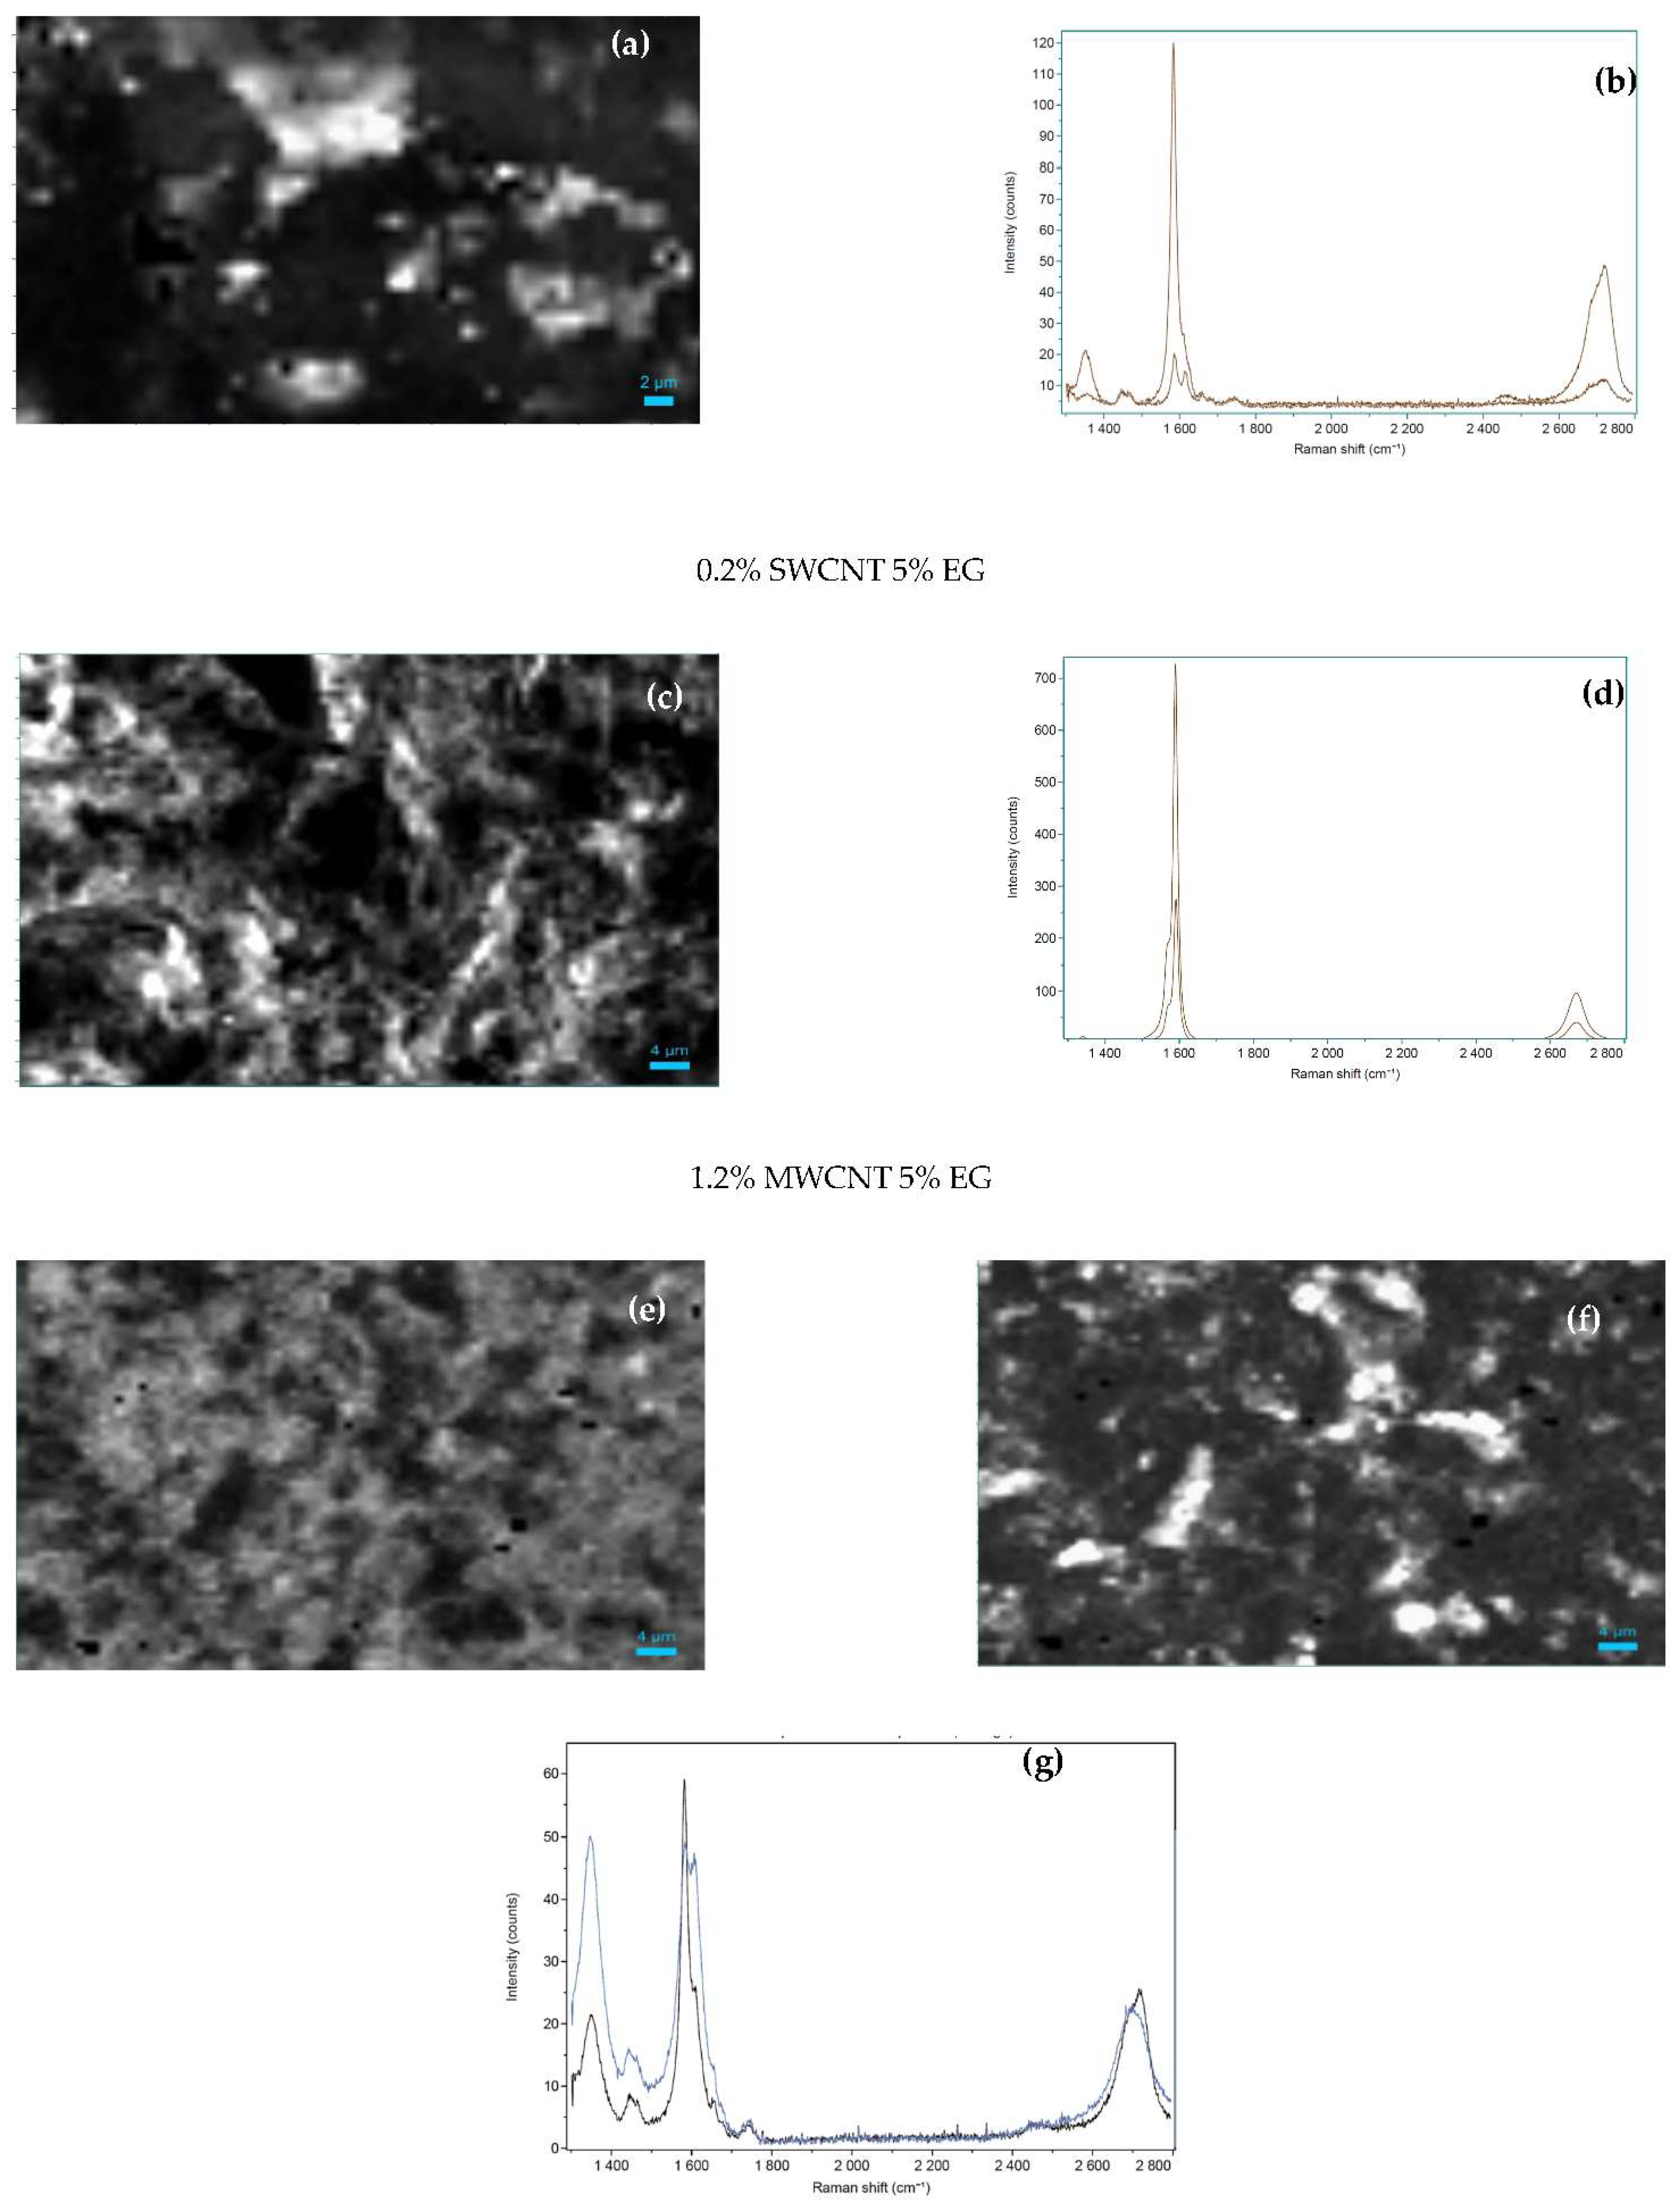
The homogeneous distribution of the carbon nanomaterials throughout the composites was assessed by Raman spectroscopy mapping. The presence of the characteristic Raman bands of SWCNT, MWCNT and EG was monitored and the maps showing their spatial distribution are represented in
Figure 6. Raman mapping shows that the carbon fillers are well distributed within the composites. The intensity of the G band, common to all the fillers, is observed at all acquisition positions. The G band intensity distribution of the composite with 5 wt.% of EG is presented in
Figure 6a), depicting the higher intensity areas in white and the lower intensity in black. The Raman spectra of the regions presenting higher and lower intensity are shown in
Figure 6b) showing a ratio of 1:6 in the G band intensity and a similar ratio for the 2D band. The spectrum corresponding to the lower intensity region of the G peak shows the presence of the Raman signal of the epoxy matrix (see
Figure S3) around 1450 cm
−1 and 1610 cm
−1.
Figure 6c) presents the G band intensity distribution measured for the composite with 0.2% SWCNT and 5 wt.% of EG (higher intensity in white and lower intensity in black). The Raman spectra corresponding to the regions of higher and lower intensities of the G band are represented in
Figure 6d); both spectra are characteristic of SWCNT, presenting an intensity ratio (regions of higher:lower intensities) of 2:1. SWCNT’s present such an intense Raman spectrum, compared to that of EG or MWCNT, that only the Raman signal of SWCNT is observed when mixed composites are analyzed.
Figure 6e) presents the D band intensity distribution of the composite with 1.2 wt.% of MWCNT and 5 wt.% EG. Here, the spectra intensities of MWCNT and EG are comparable (
Figure 6g) showing similar G band intensity for both fillers, but higher D band intensity for the MWCNT (blue line in
Figure 6f) as compared to EG. Thus, the lower D band intensity (darker regions) correspond to the presence of EG.
Figure 6f) illustrates the G to D ratio distribution, where the intensity ratio of the G to D bands is close to one for MWCNT and greater than one for EG. The Raman spectra corresponding to the regions of higher intensity ratio (white color—EG) and lower intensity ratio (black color—MWCNT) of the G to D bands are presented in
Figure 6g) and in both regions the signal of the epoxy matrix can be observed.
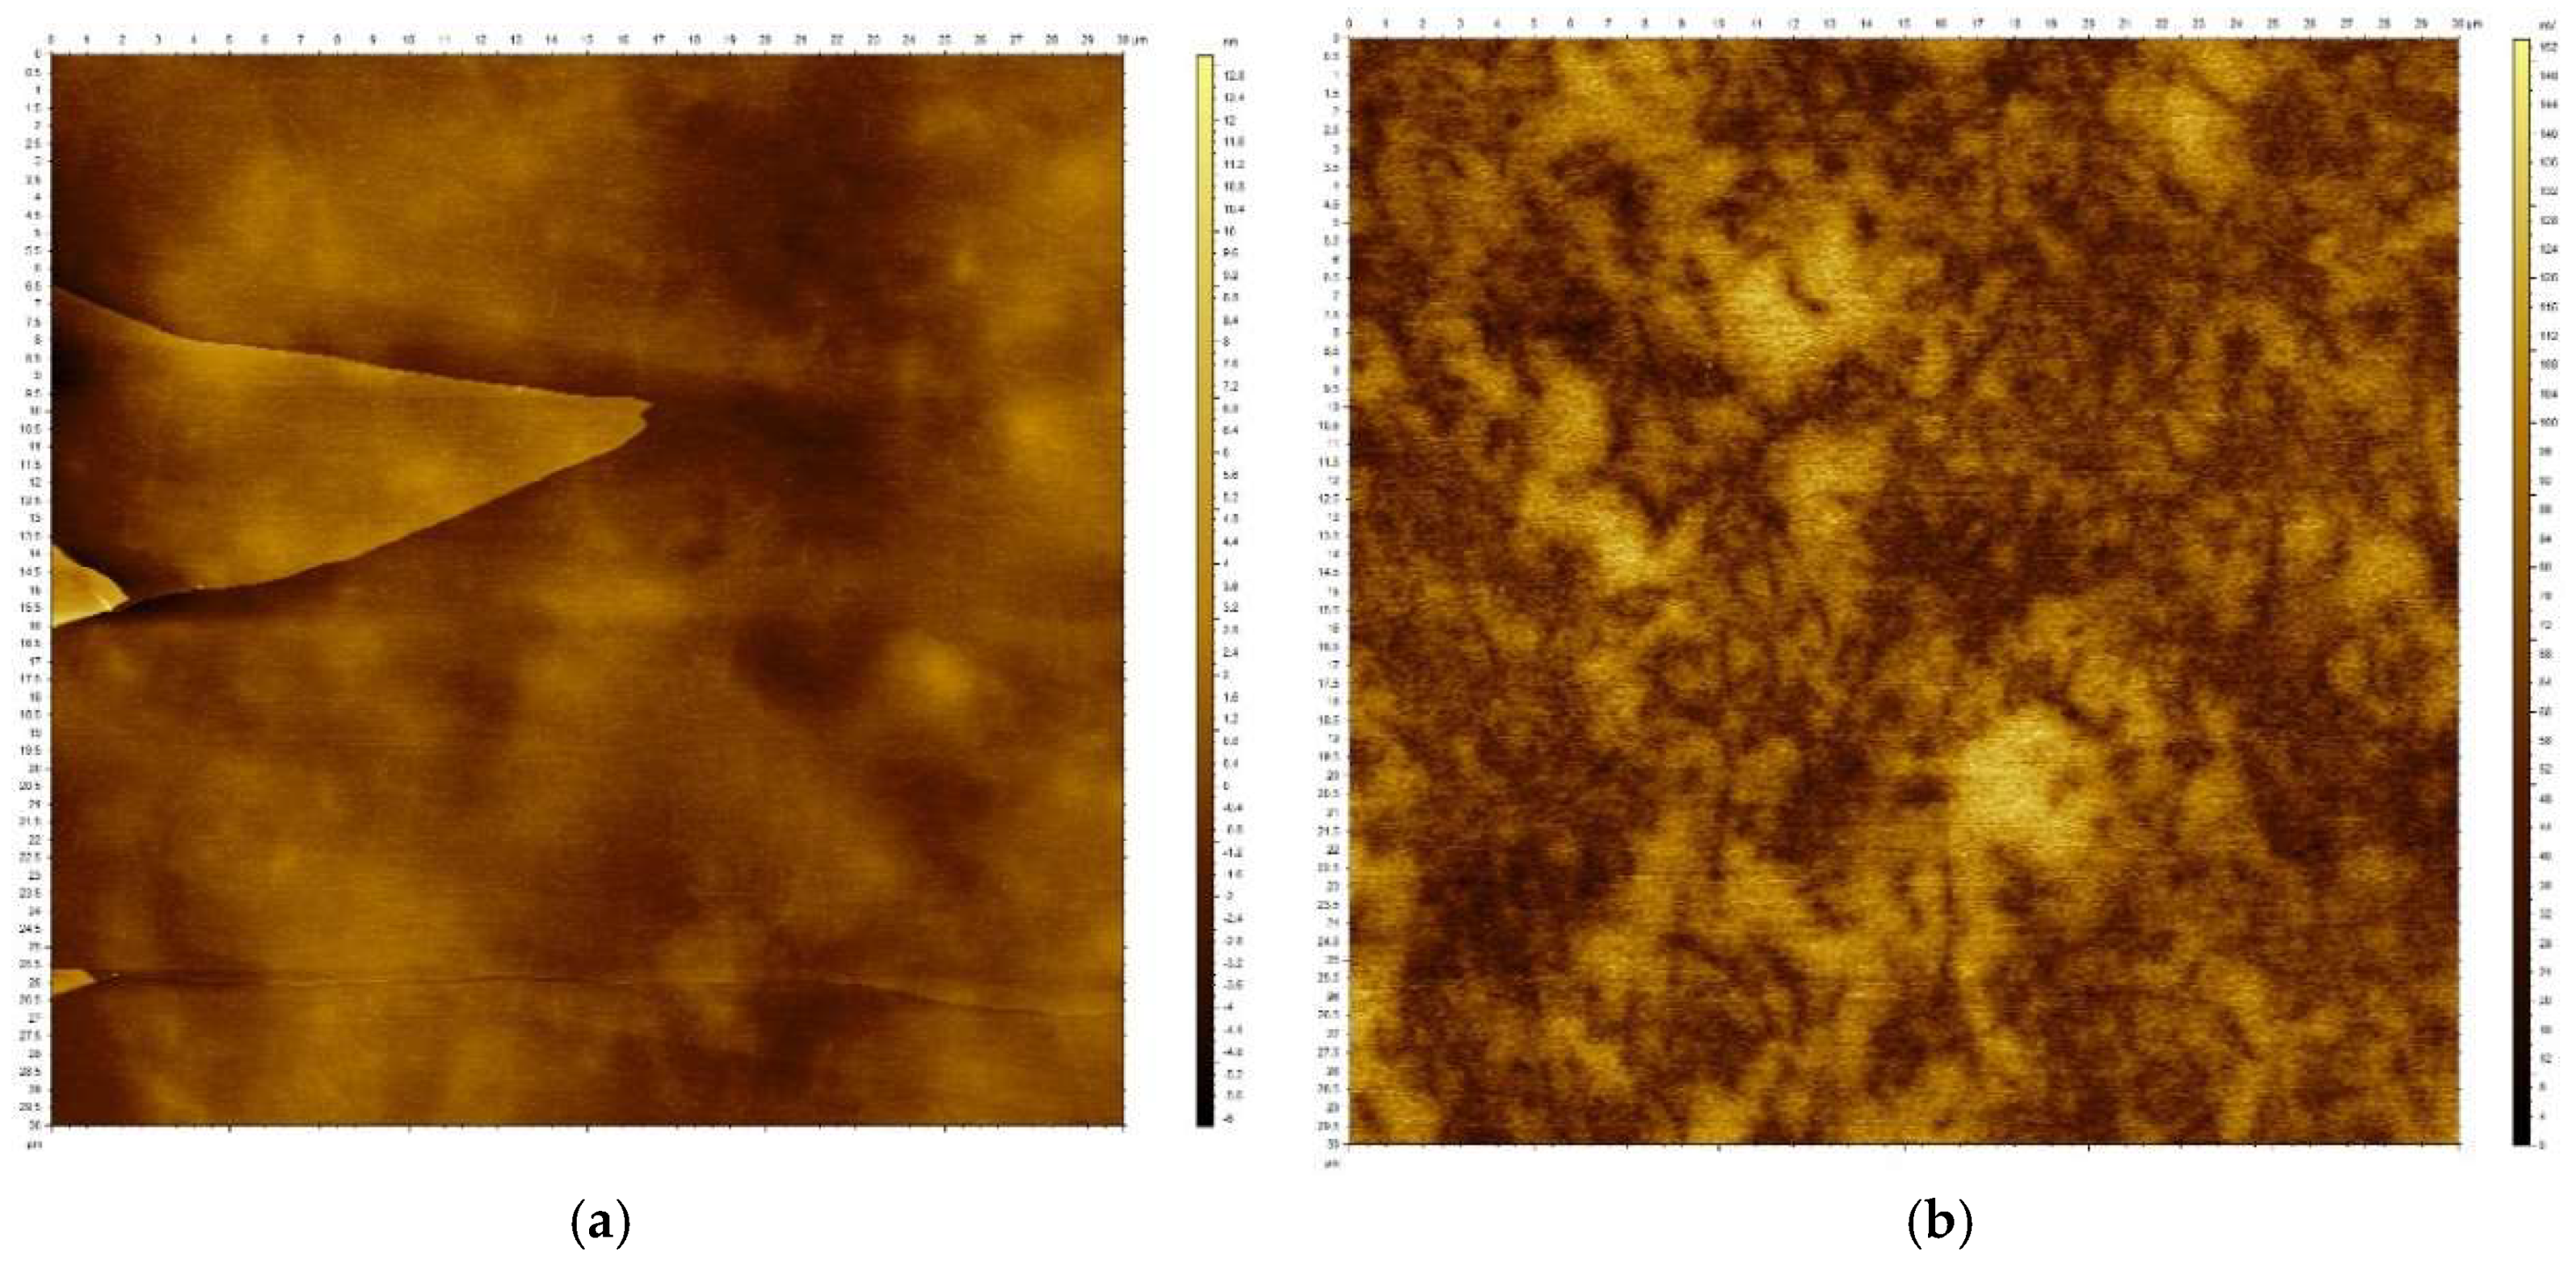
The surface morphology and surface potential mapping were analyzed by AFM. Comparison of the images obtained by topographic and HD-KFM modes provide a clear view of the distribution of the conductive carbon nanomaterials and their morphology, distinguishing CNT and EG. Due to the preparation process, the surfaces analyzed are flat as the composite mimics the flatness of the freshly cleaved mica. However, it also reproduces the presence of any step or atomic terrace on the fresh mica surface, which will remain imprinted on the sample (see
Figure S4). Images on
Figure 7a,b correspond to the topography and surface potential (SP) of a sample of epoxy resin and SWCNT at 1.2 wt.%.
Figure 7a presents a topographic feature imprinted by the preparation process but does not reveal the presence or distribution of the SWCNT, as they are embedded in the epoxy resin. The high-resolution SP image obtained with HD-KFM, depicted in
Figure 7b, shows the distribution of the SWCNT in the epoxy. The SP is an electrostatic interaction with long-range components, allowing the presence of the SWCNT inside the epoxy matrix to be protected. Dark regions in the color scale correspond to the presence of the SWCNT while the light colored regions correspond to the epoxy matrix. Notice that there is no contrast related to the atomic step terrace seen in
Figure 7a as it is only a topographic feature.
Figure 7b shows that the SWCNT forms a uniform network across the whole surface.
Figure 7c,d show both topographic and SP images corresponding to a nanocomposite of epoxy and 5 wt.% of EG prepared with a freshly cleaved mica substrate.
Figure 7c shows a less smooth topography compared to SWCNT composite, with the presence of clusters of different sizes. These clusters correspond to EG flake agglomerates that bulge off the surface. The tendency of EG to form agglomerates is observed in
Figure 2 for the raw material, and in
Figure 6a for the Raman mapping of the EG/epoxy composite. The EG flakes present a lateral size of approximately 9.5 μm and their agglomerates may reach several tens of μm which, associated with the small thickness of the samples prepared for AFM and HD-KFM analysis, may force their protrusion from the surface.
3.2. Rheological Characterization
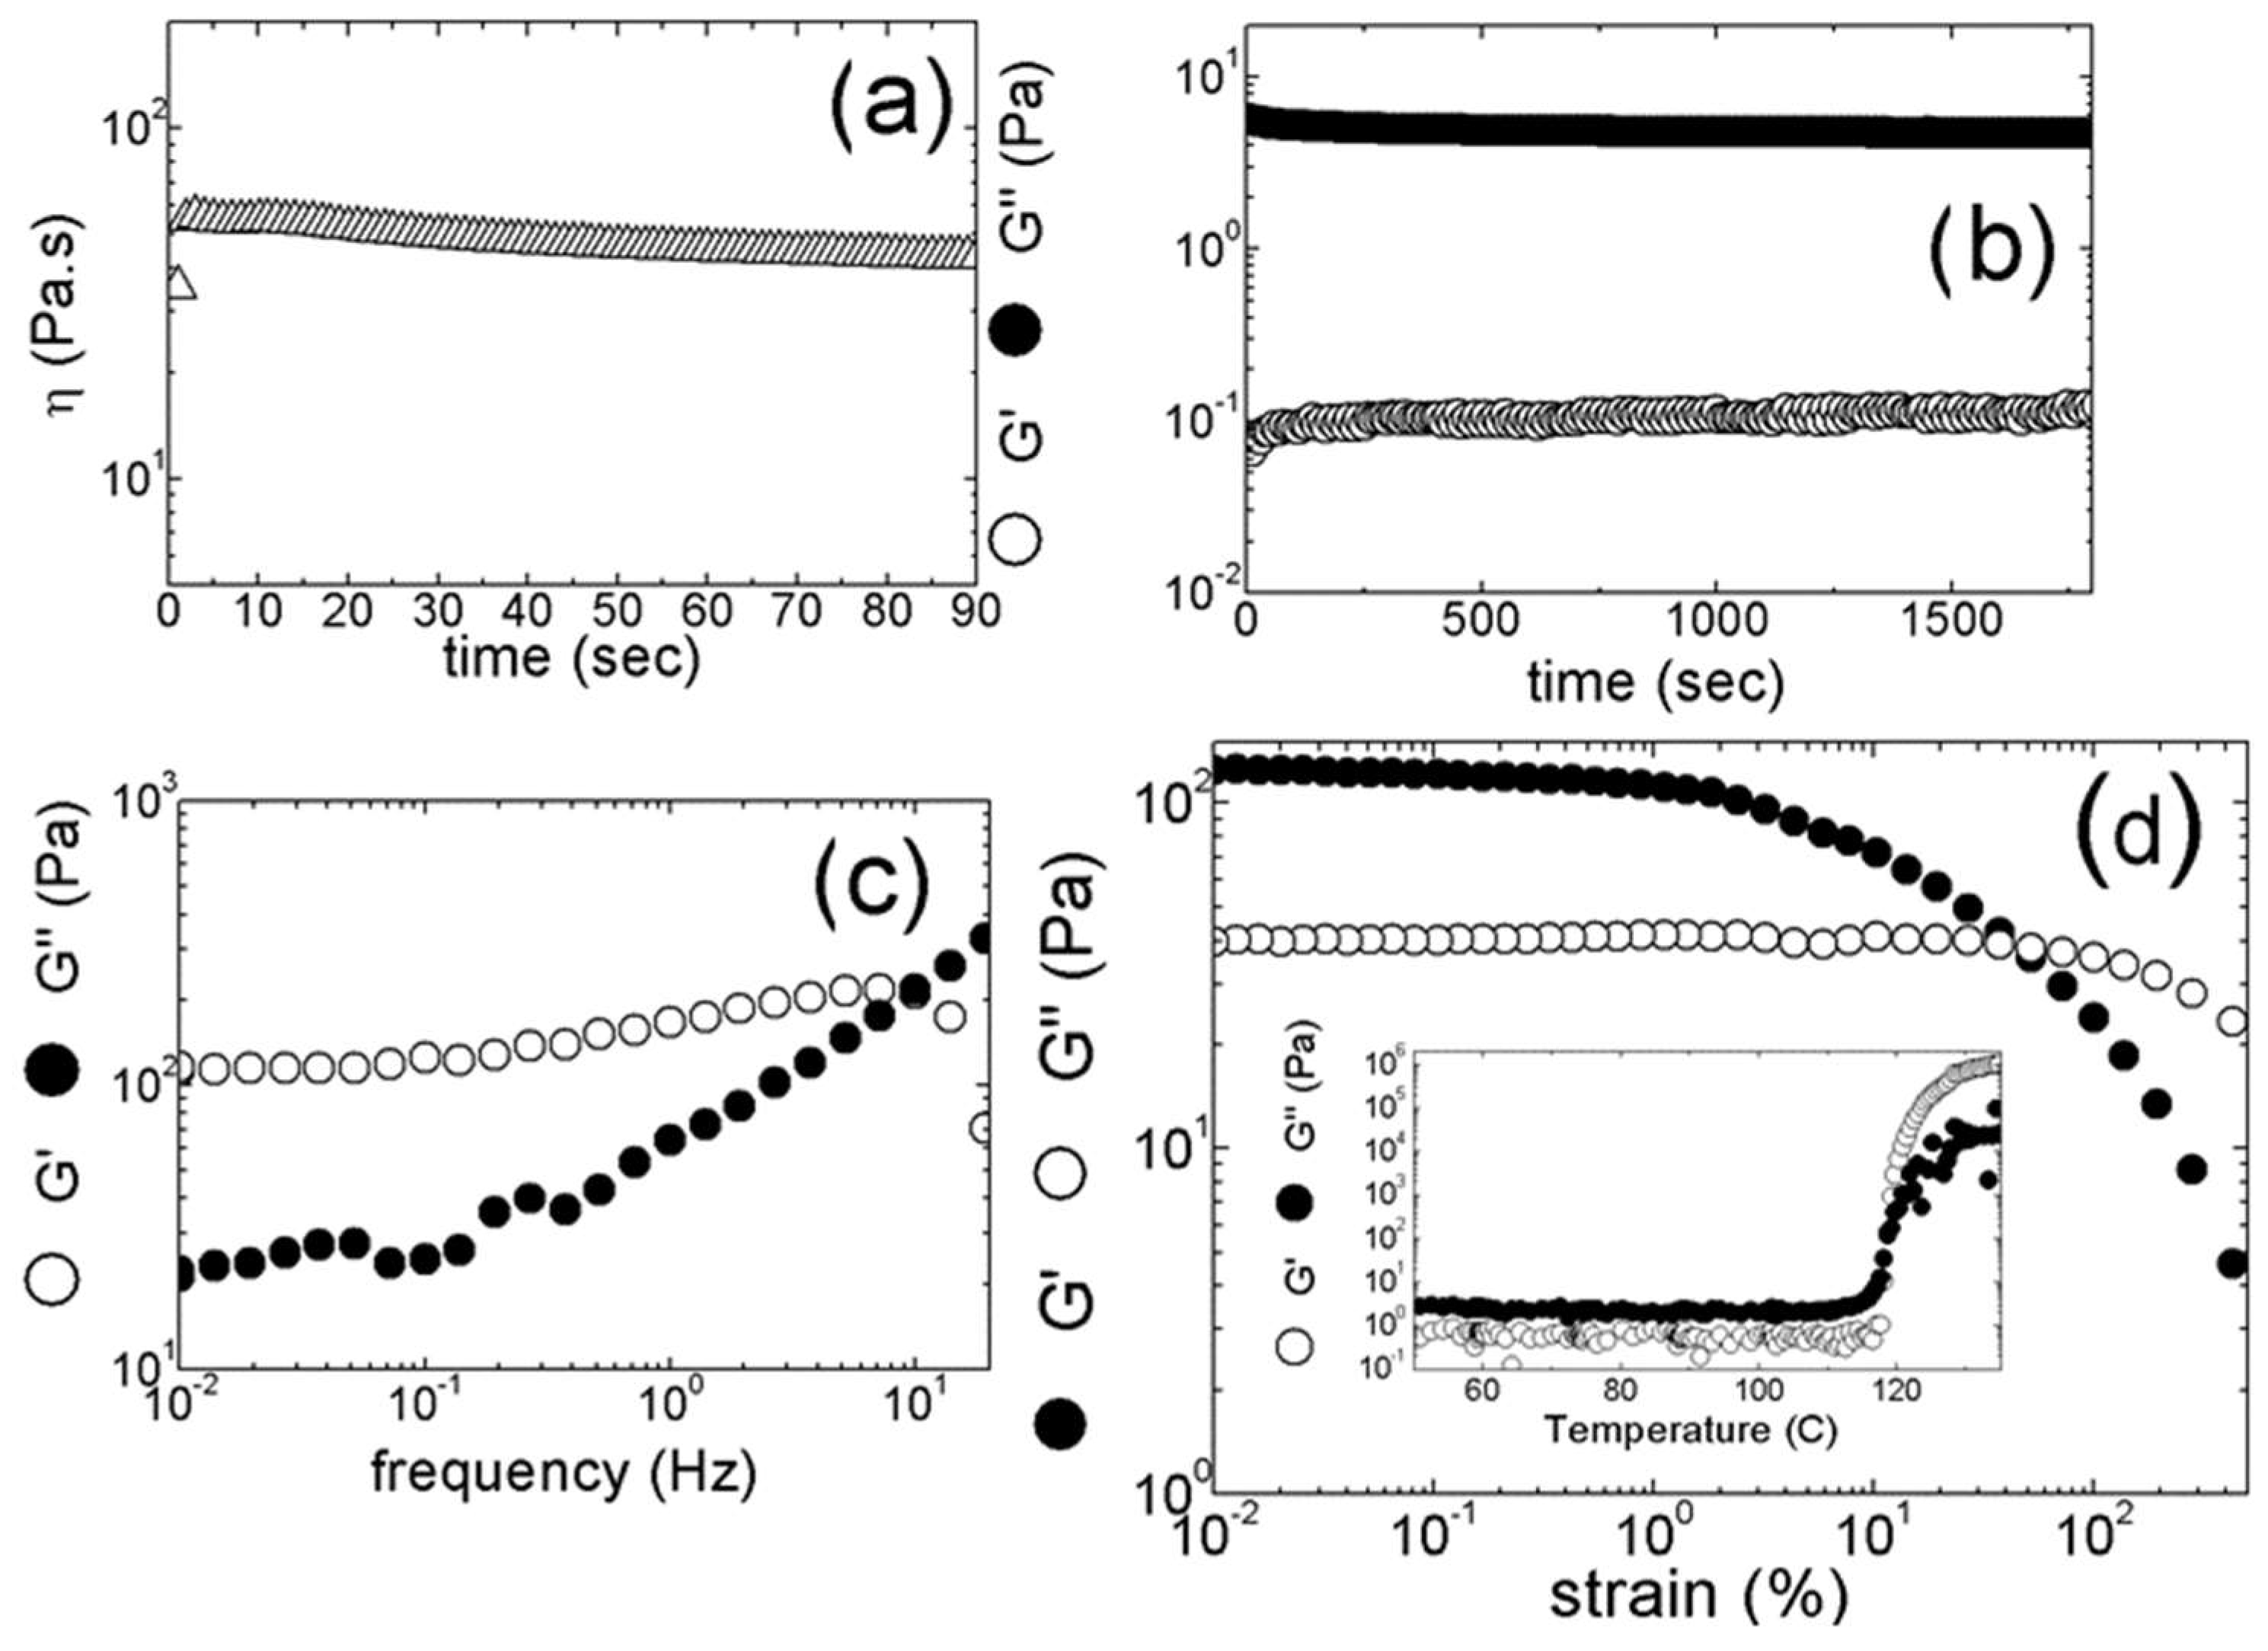
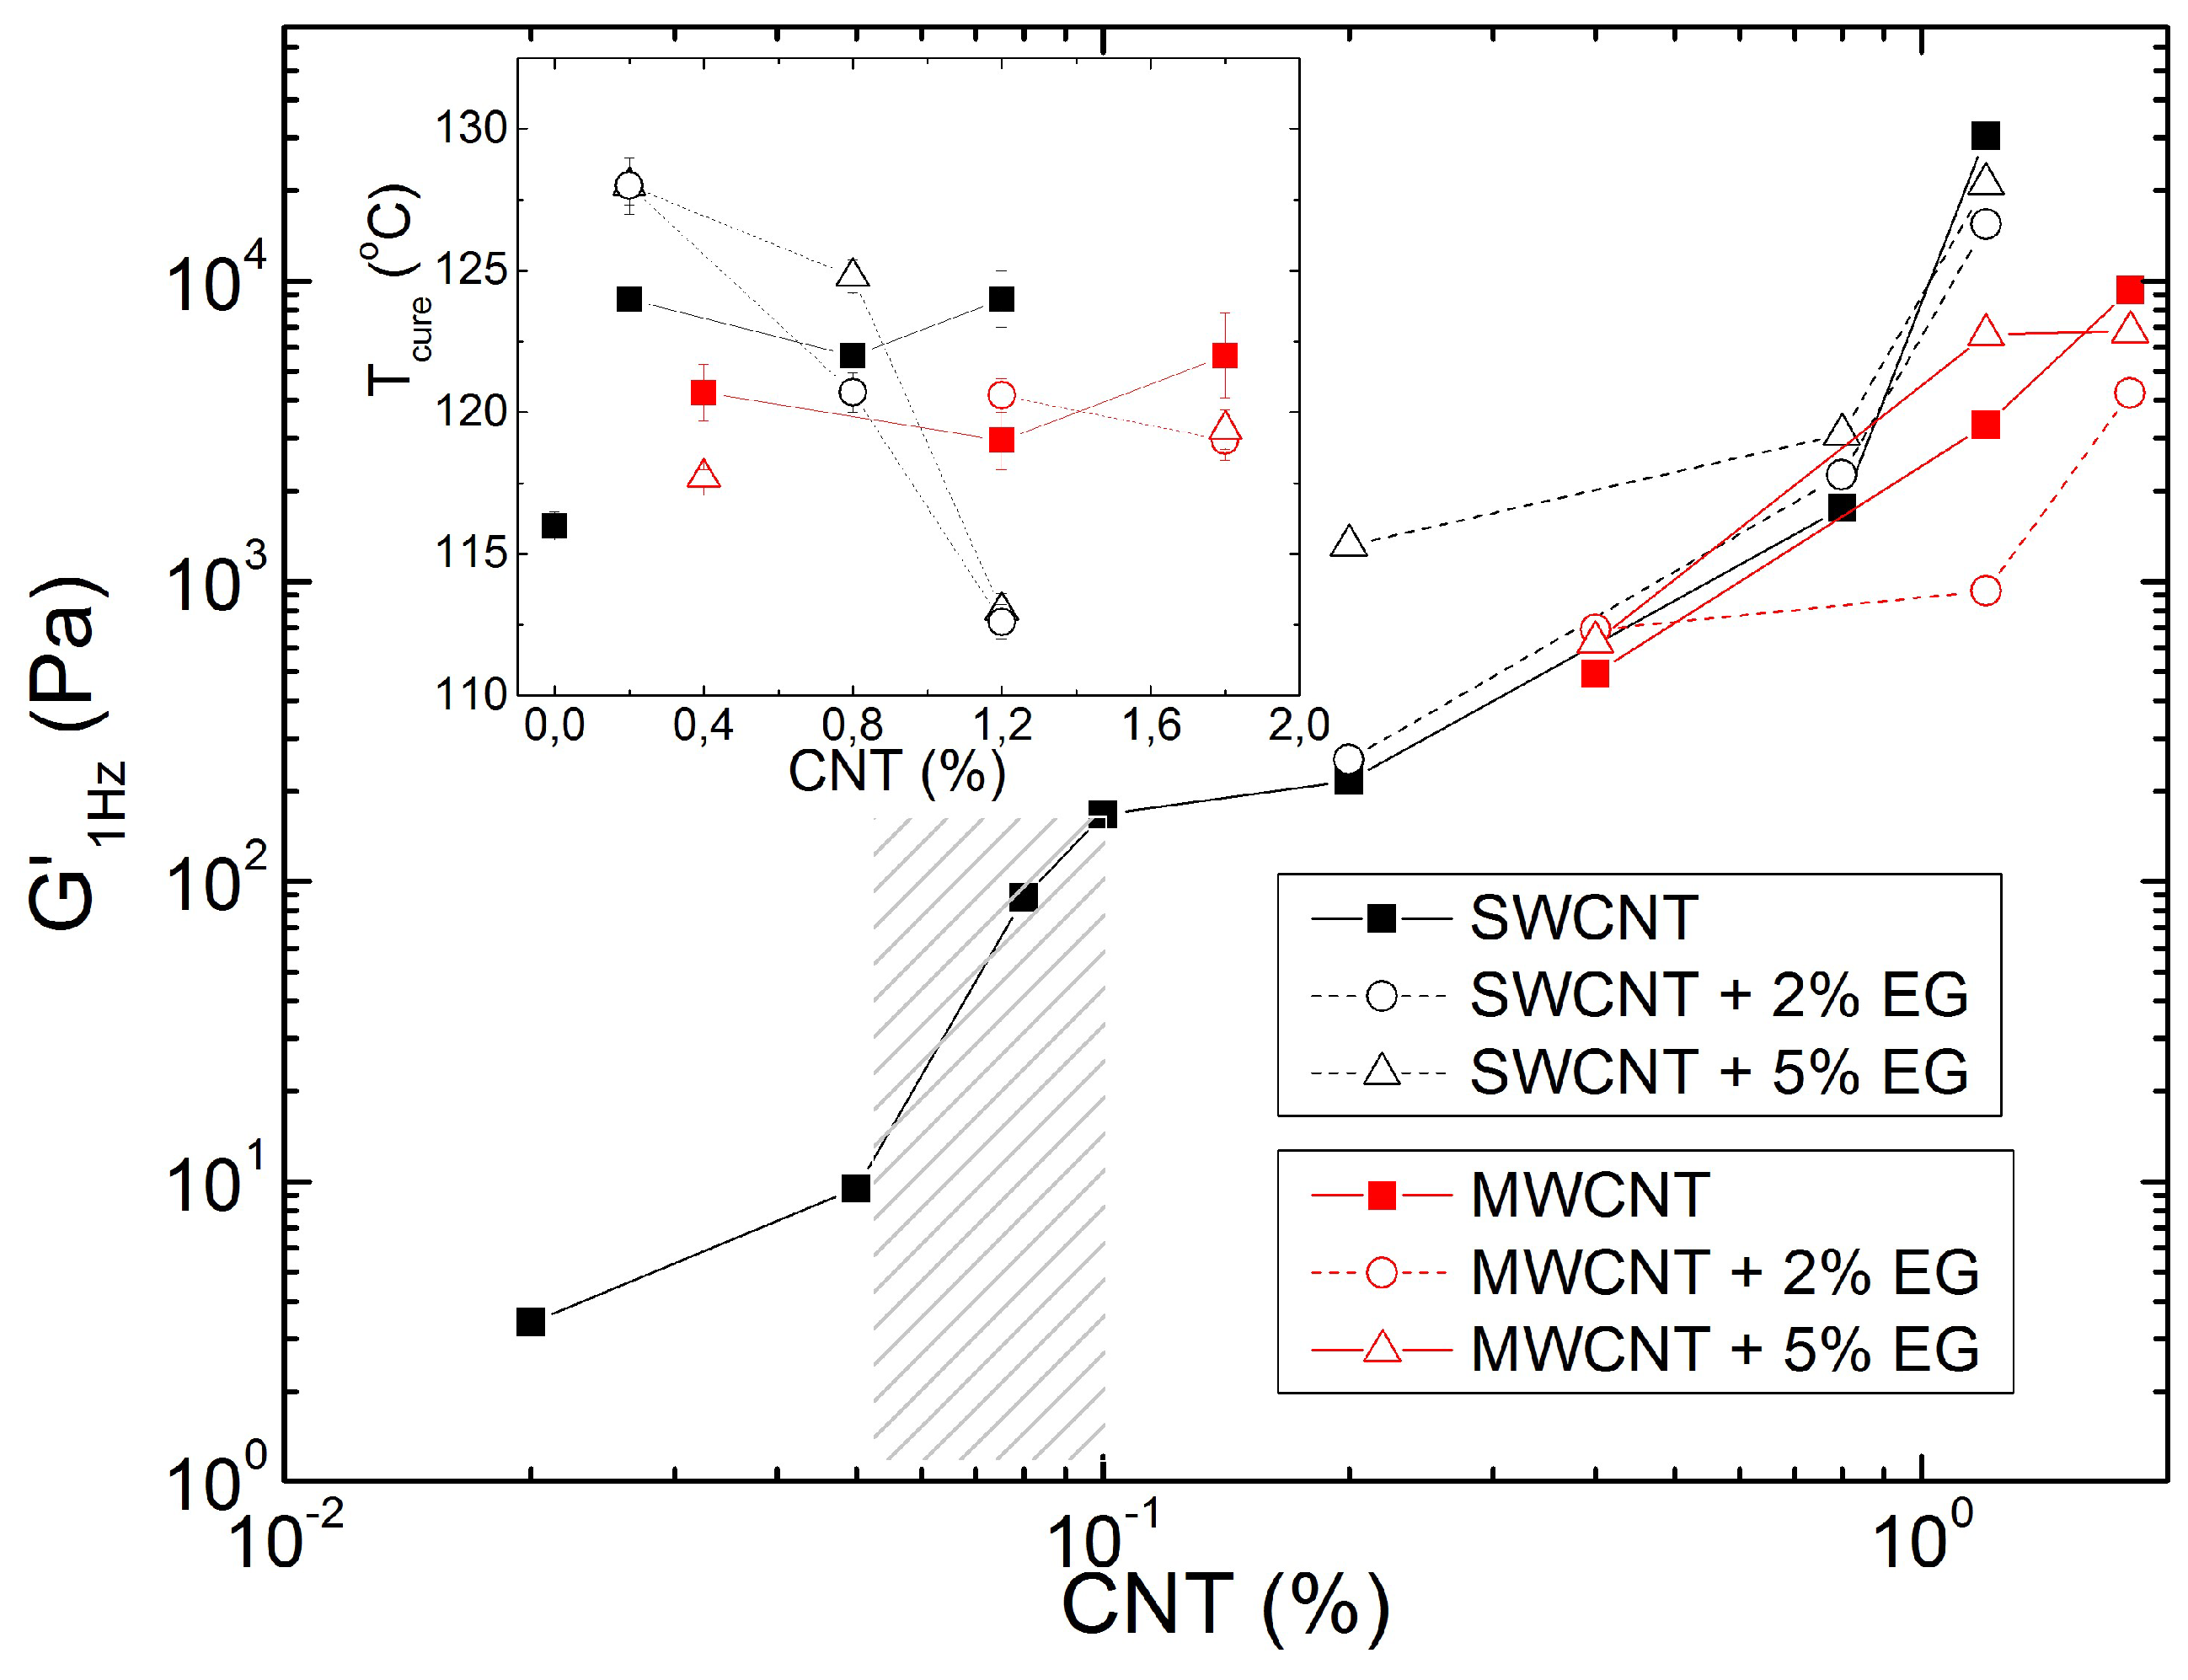
Figure 8 presents the increase in the elastic shear modulus G
1Hz measured at 1 Hz during the record of the mechanical spectra (see
Figure 1c), in dependence on the carbon nanotubes (SWCNT or MWCNT) content added to the resin. A jump in G
1Hz occurs between 0.05 and 0.1 wt.% of SWCNT, which coincides with the emergence of an elastic plateau at lower frequencies in the mechanical spectrum. This plateau is reported in
Figure 1c) for 0.1 wt.% SWCNT, whereas it could not be detected at lower SWCNT contents. Thus, beyond 0.1 wt.% SWCNT, the composites are essentially viscoelastic solids as a percolated network of carbon nanotubes transfers the stress throughout the composite. In the percolated regime, G
1Hz first increases smoothly with SWCNT concentration, and then again jumps to larger values when more SWCNT is added. In contrast to this, the temperature T
cure for the onset of thermal curing, taken as the temperature at which the loss modulus G″ departs from Arrhenius behavior (see inset in
Figure 1d), is not affected by the addition of SWCNT beyond the concentration for reaching percolation. The temperatures T
cure reported in the inset to
Figure 8 for the resins prepared with MWCNT in the same range of carbon nanotube concentration follow the same trend: though T
cure is significantly larger than the curing temperature measured with the sole matrix, the addition of more carbon nanotubes does not change T
cure. Note also that the G
1Hz dependence with the carbon nanotube concentration is larger in the case of SWCNT when compared with MWCNT. This suggests that the SWCNT and MWCNT networks show structural differences. Neglecting any effect associated with differences in the level of carbon nanotube dispersion, and assuming a fractal network with weak links between the flocs of particles building up the network [
15], which is supported by the strain softening reported in
Figure 1d and by the fact that more concentrated samples require a larger strain to yield, one may infer from the data in
Figure 8 that the SWCNT network is more open than the MWCNT network.
As a result, the addition of EG affects the carbon nanotube networks in different ways. Whereas the addition of 5 wt.% EG gives a 10-fold increase in the elasticity of the SWCNT network at lower nanotube concentration, the corresponding addition of EG does not significantly improve the MWCNT network elasticity. This reinforcing trend is reverted for resins prepared with the largest content in carbon nanotubes, as the elasticity of the corresponding networks is reduced upon addition of EG. Thus, large EG amounts are detrimental to the networking of carbon nanotubes and no synergism seems to occur between these two types of nanomaterials in the set of studied samples. The structural differences in SWCNT and MWCNT networks are also mirrored in the differences observed for T
cure upon EG addition. The data in the inset to
Figure 8 show that, whereas the addition of EG does not change T
cure significantly, this temperature is shifted by nearly 5 °C upon EG addition to resins prepared with smaller SWCNT amount. However, for resins containing more SWCNT, T
cure drops dramatically, as curing occurs 12 °C lower for the sample prepared with 1.2 wt.% SWCNT. Note that for both CNT, the loss of network connectivity upon addition of 5 wt.% EG relates to a drop in T
cure.
3.3. Thermal Conductivity of the Nanocomposites
The technological requirements of electronic applications concern not only electrical conductivity but also thermal conductivity. High thermal conductivity helps dissipate the heat generated by current, avoiding heat accumulation and improving the ECAs current carrying capacity.
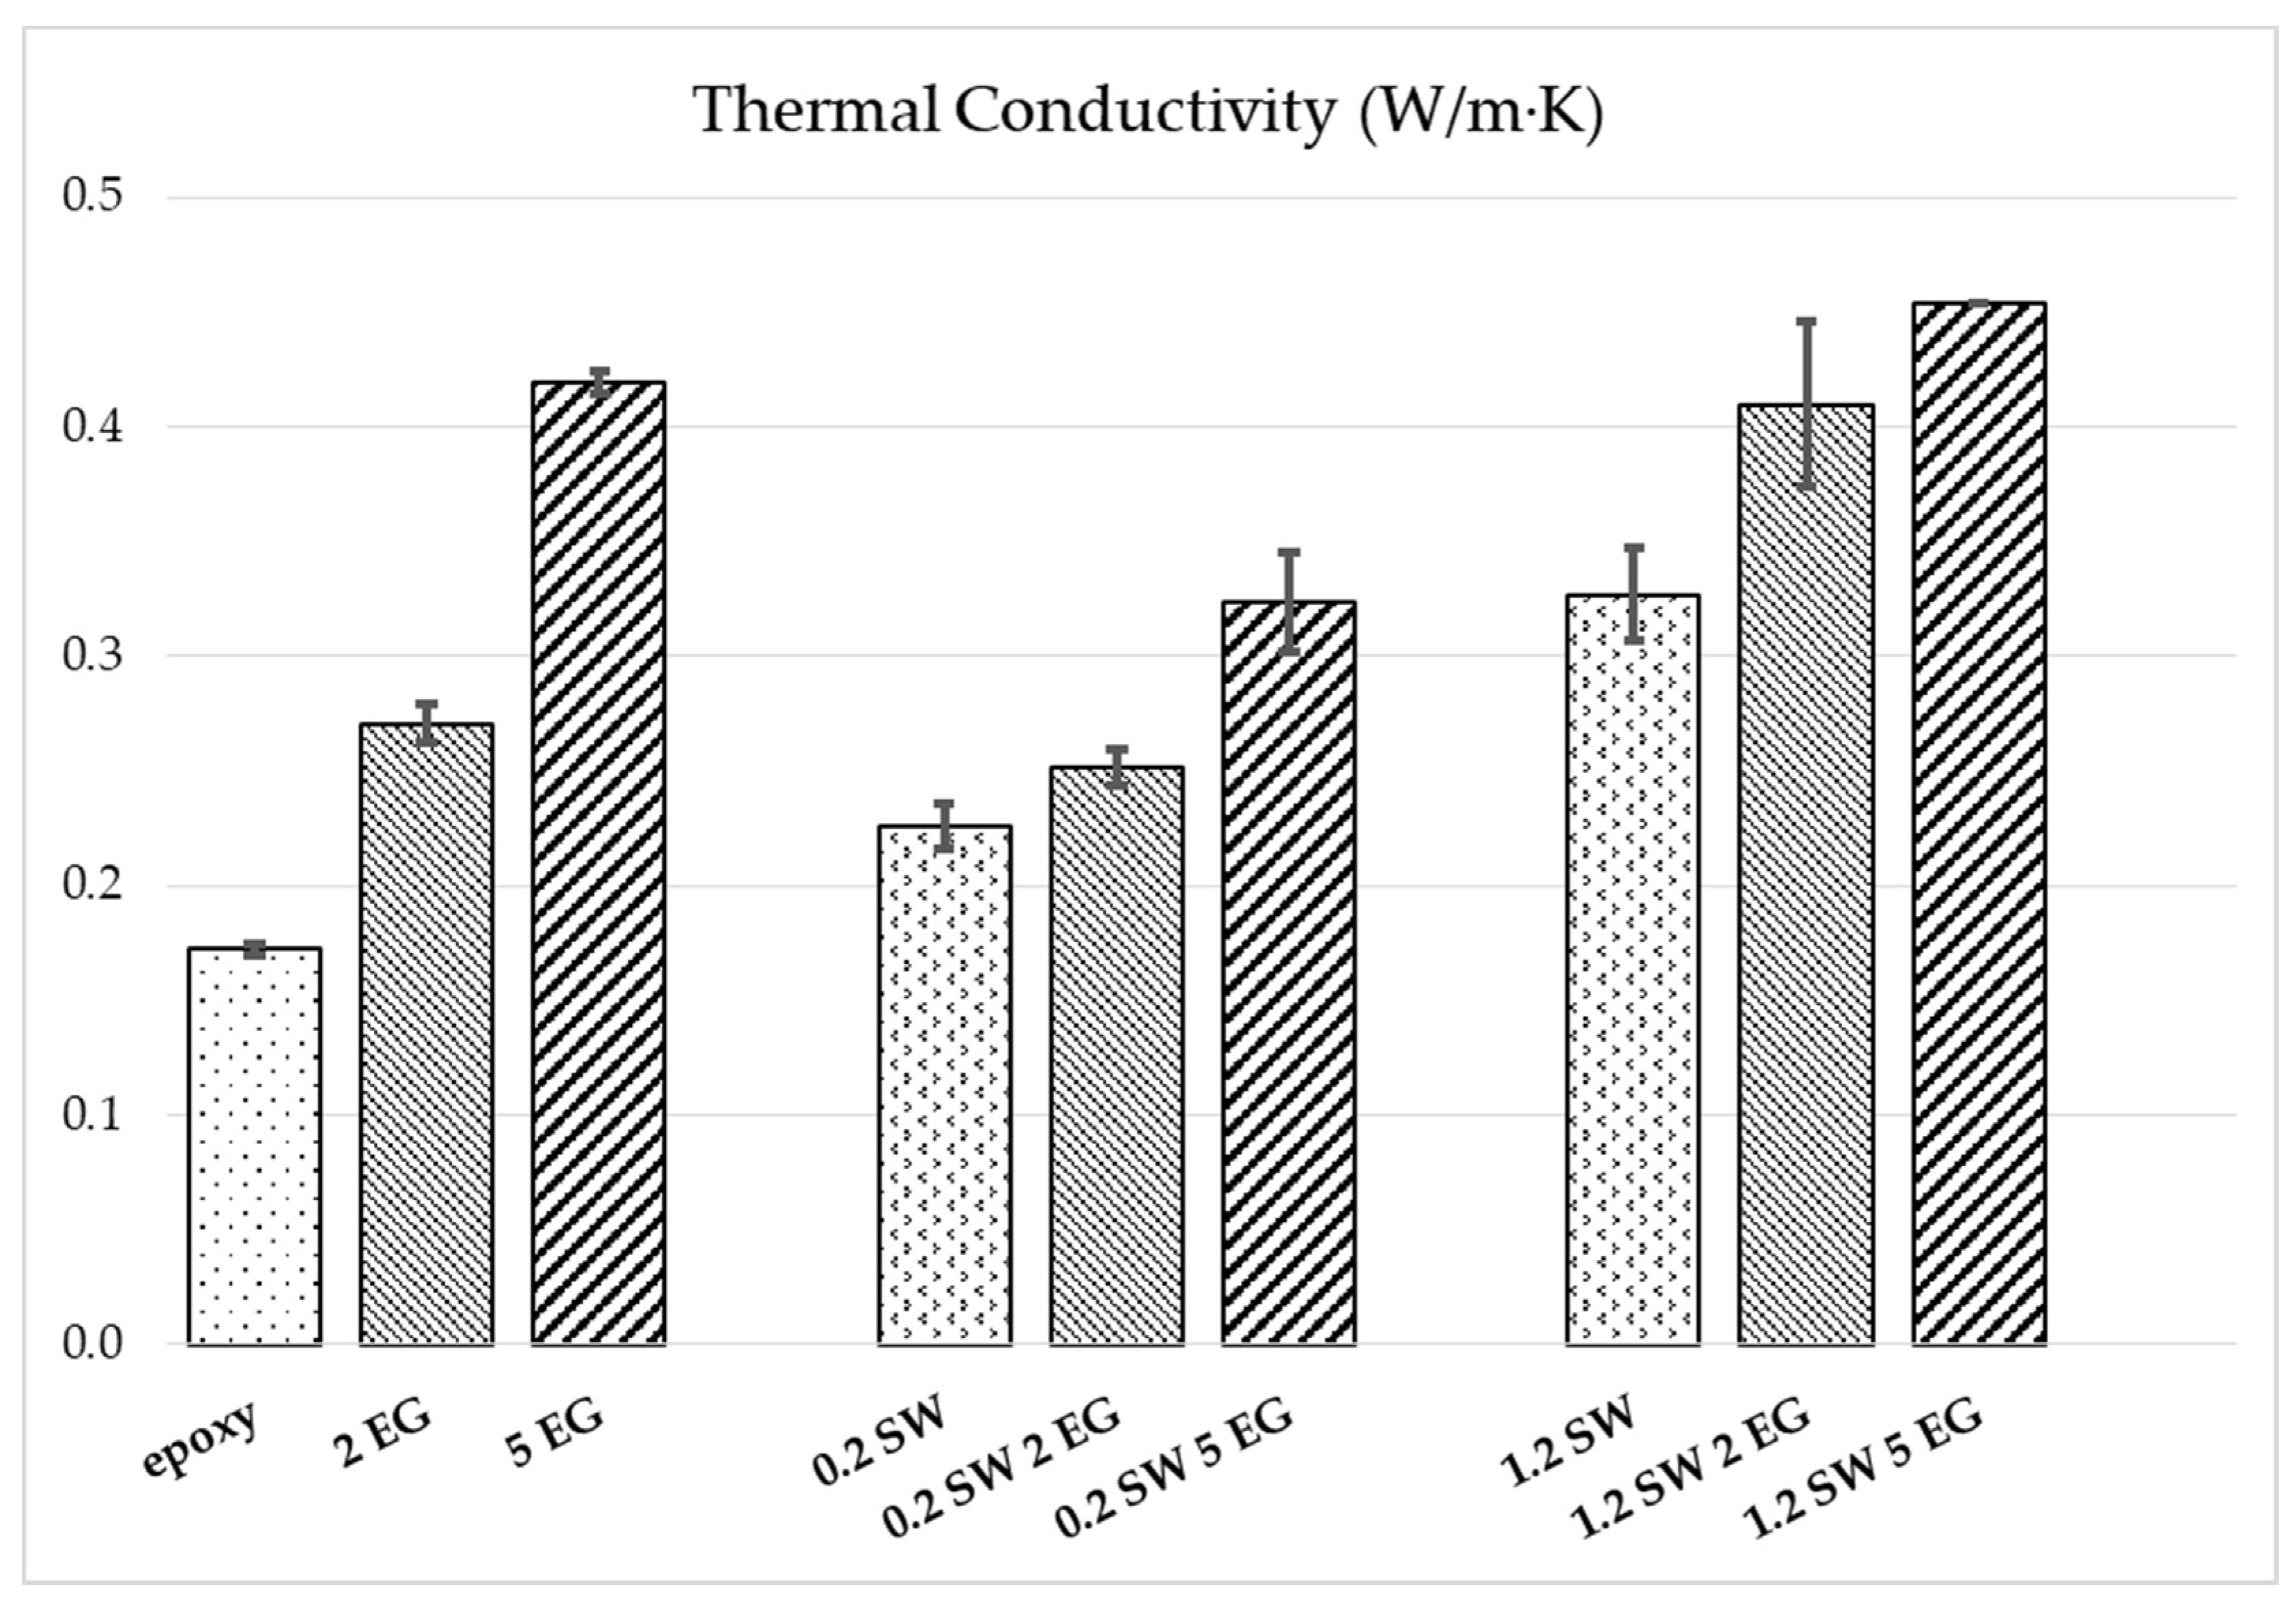
The effect of the addition of carbon nanomaterials to the epoxy resin on its thermal conductivity was evaluated for composites with SWCNT, EG and hybrid compositions. The results are presented in
Figure 9 and
Table S3 in Supplementary Information.
The relatively low thermal conductivity of the epoxy matrix (0.172 W/m∙K) is significantly enhanced when adding carbon-based nanomaterials. The addition of only 0.2 wt.% SWCNT enhances the conductivity by 31% and 1.2 wt.% by 90%. At the studied contents of 2 and 5 wt.% EG, a high increase in the composites’ thermal conductivity of 58% and 144%, respectively, is observed. The contribution of EG is reflected in the mixed filler systems at both SWCNT concentrations; however, higher absolute conductivities are achieved at 1.2 wt.% SWCNT content. Here, 5 wt.% EG addition leads to an improvement by 39% compared to epoxy/1.2 wt.% SWCNT. The highest value of 0.45 W/m∙K is achieved at 1.2 wt.% SWCNT combined with 5 wt.% EG, which represents an increase by 163% compared to the pure epoxy. However, the compositions prepared with the lower SWCNT content and EG present a lower thermal conductivity than the composites with the same composition of EG only. Apparently, the addition of a small concentration of SWCNTs may hinder the good connection of the EG nanoplatelets, which is needed for the phonon transport responsible for thermal conduction.
3.4. Deposition of the Nanocomposite Adhesive on a Printed Circuit Board
Preliminary evaluation of the printing ability of carbon-filled epoxy adhesives was carried out on prototype boards. This procedure allowed a first assessment of the adhesive–PCB interconnection, while granting direct measurement of bulk conductivity through measuring points on the PCB.
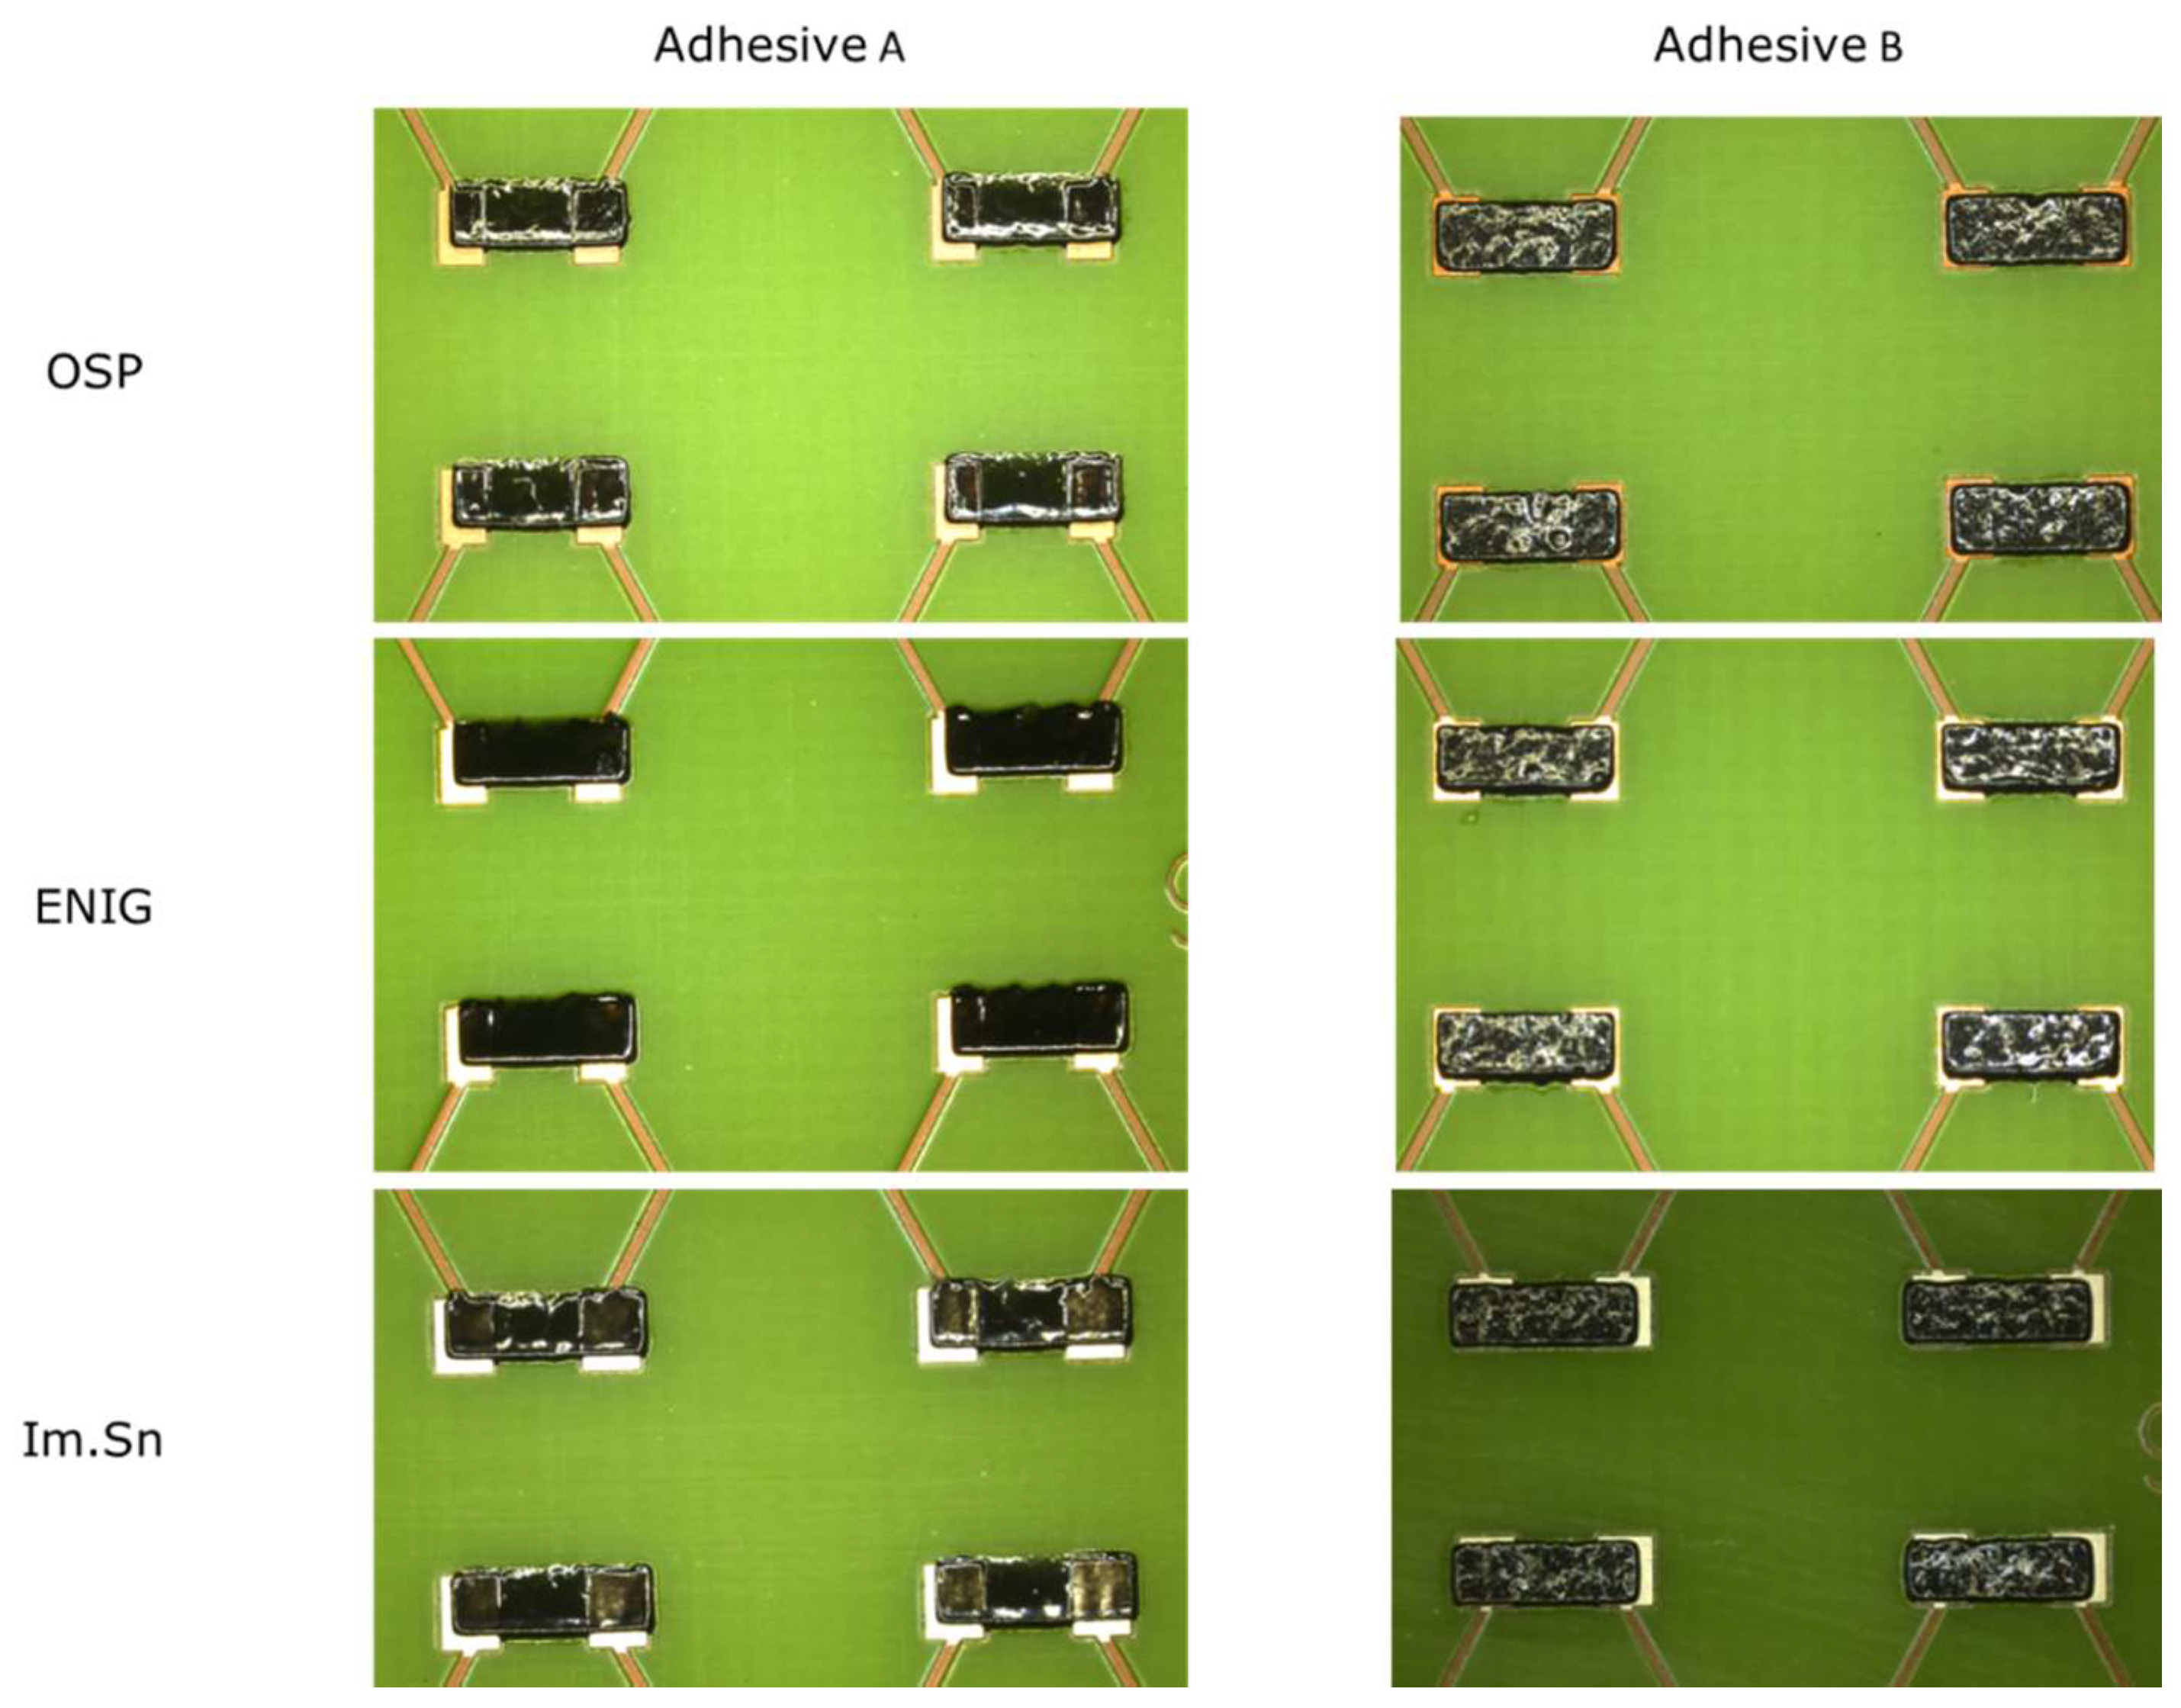
The printing tests were performed using two composites: adhesive A, prepared by dilution of a SWCNT/epoxy masterbatch to form a composite containing approximately 1 wt.% SWCNT, and adhesive B, prepared by direct mixing of 1 wt.% SWCNT in the epoxy. The adhesive prints obtained on the three different boards kept the regular dimensions of the stencil openings without evidence of spreading, as shown in
Figure 10. Minor printing faults may be due to the manual stencil–PCB alignment.
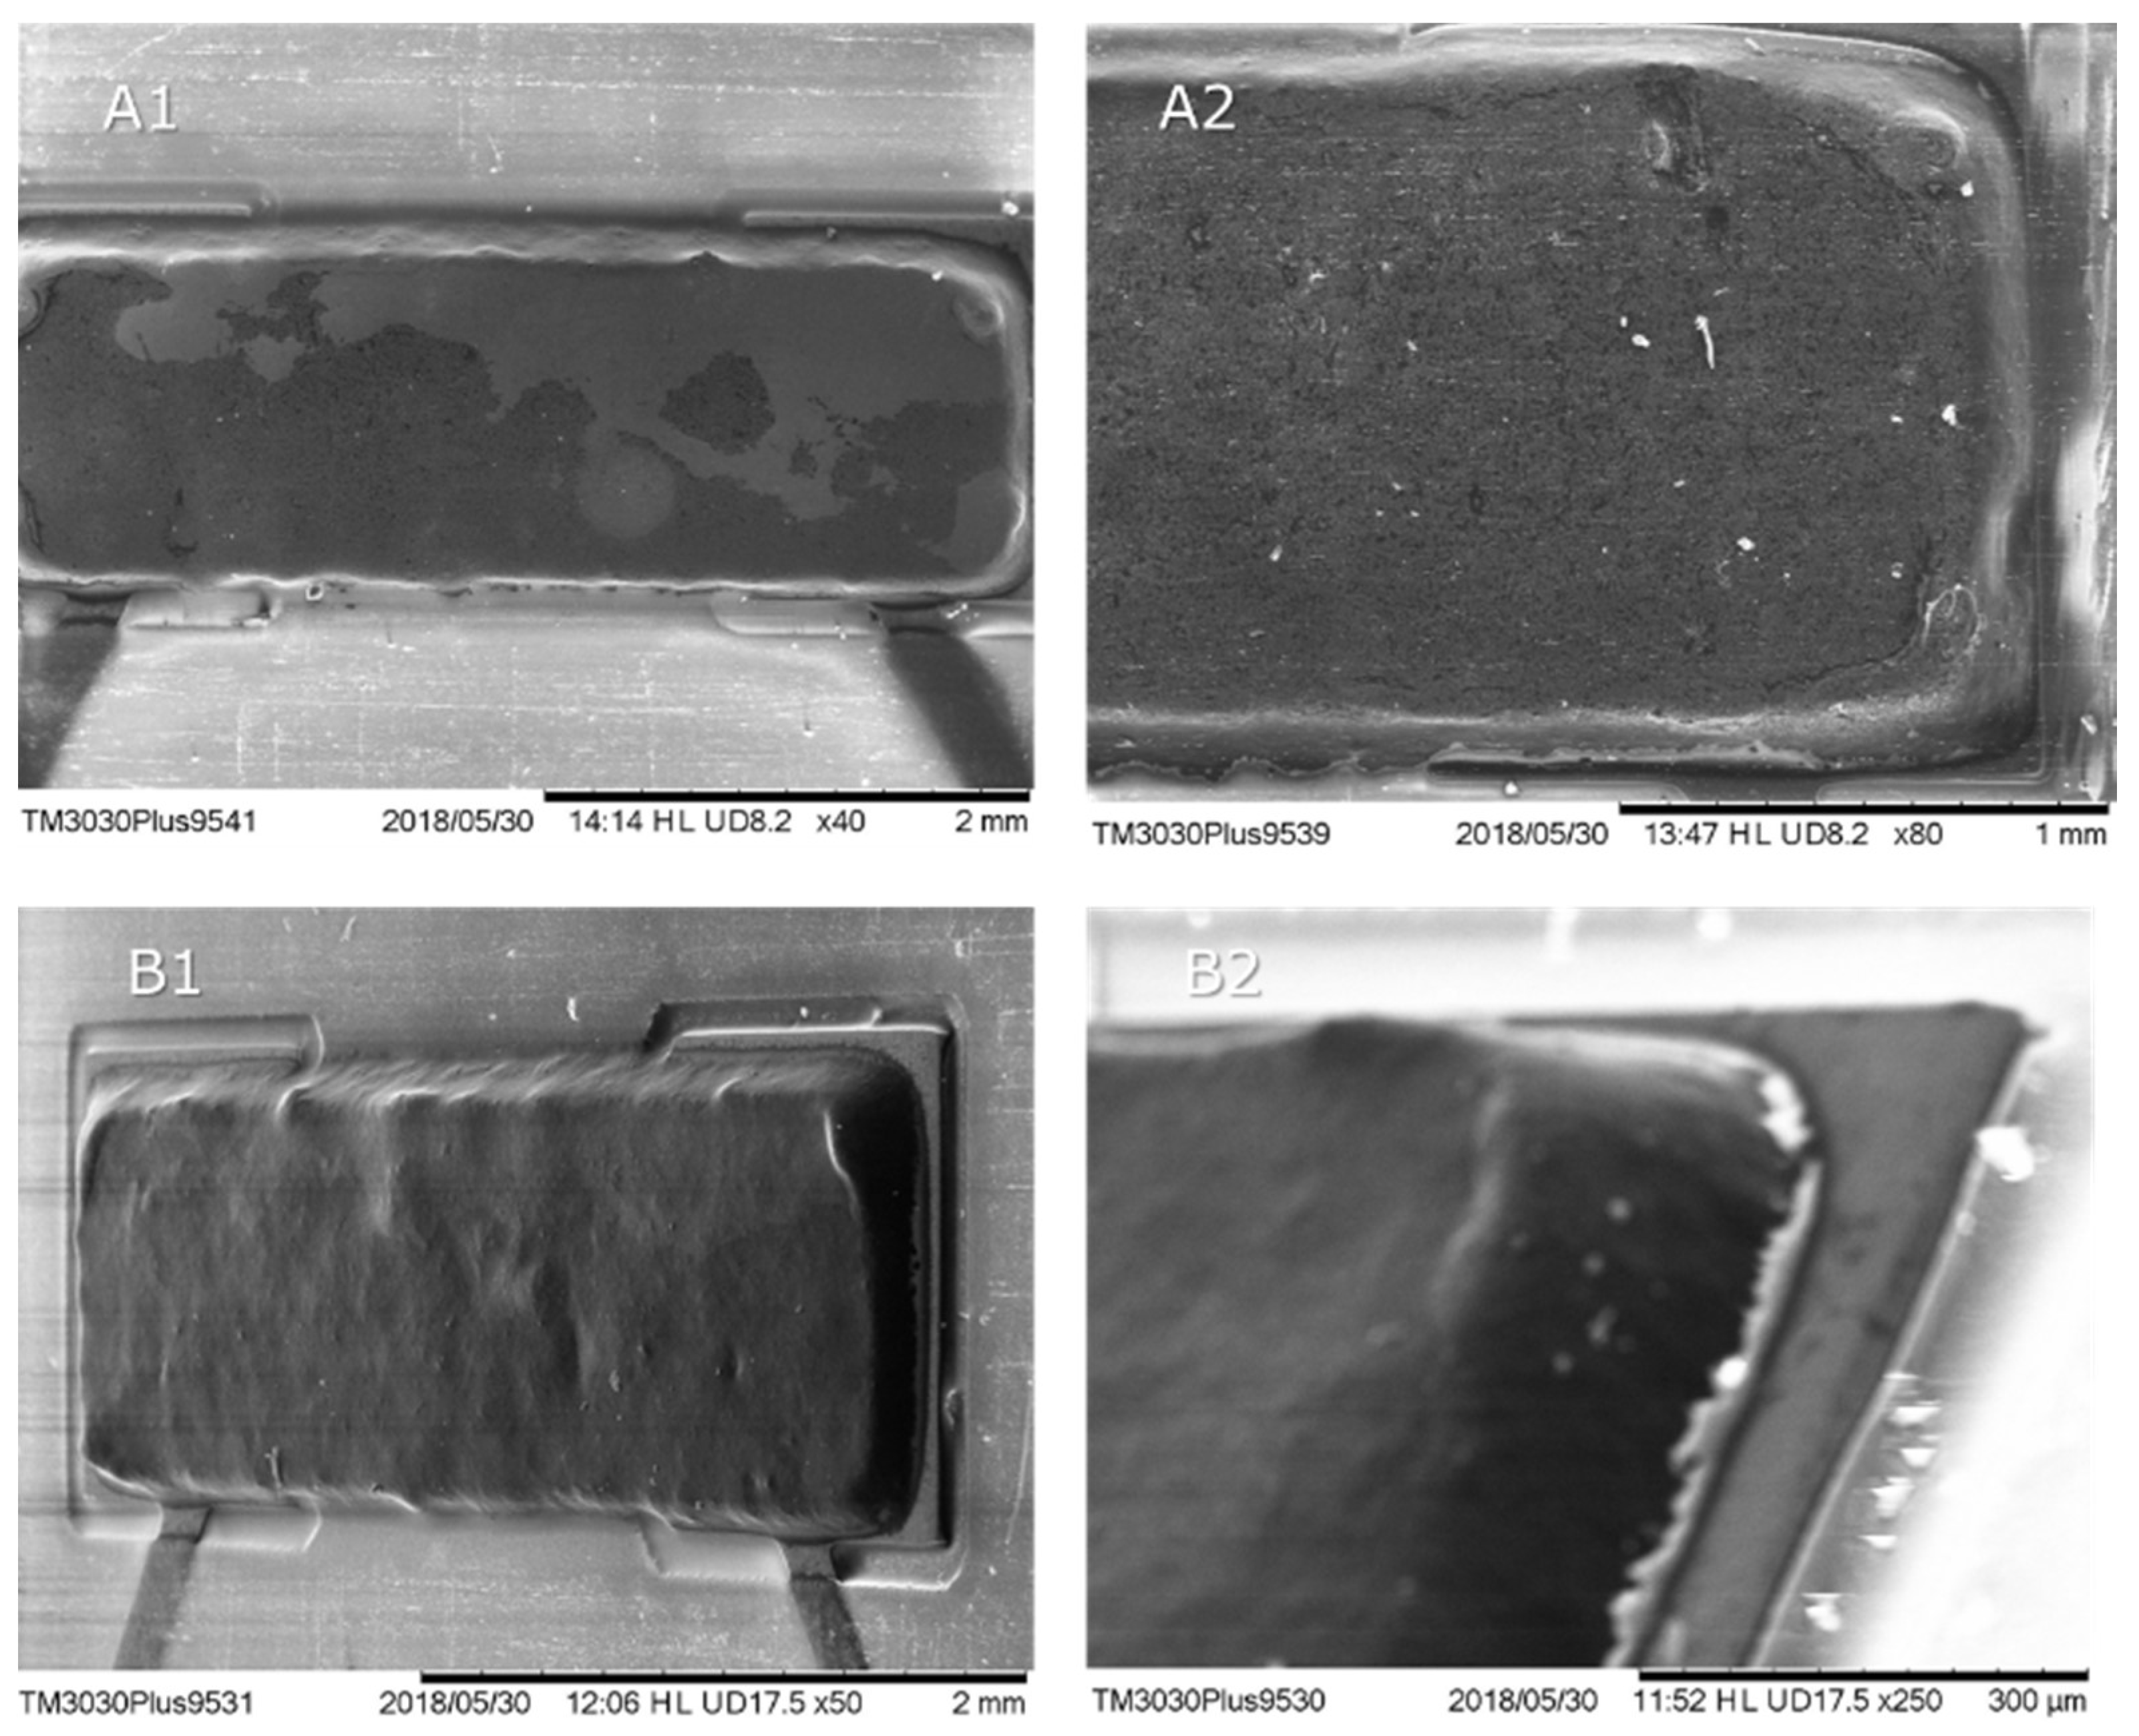
Adhesive A depicts a glassy, polished surface, whereas adhesive B shows some surface roughness. SEM images illustrating the deposited pads of adhesives A and B are presented in
Figure 11, depicting the regular deposition of both adhesives.
Electrical conductivity measurements were performed showing that all the deposited pads presented electrical connectivity. The resistance (two-wire method) between the two most distant measure points (measuring two adhesive joints in series) was measured on all 12 series of adhesive joints of each PCB. Resistance values obtained were higher than expected accounting for the electrical conductivity of the composites produced. However, the adhesives applied could not be degasified before application, which may considerably affect the electrical conductivity.
Table 2 presents the measured resistance values for the printed OSP and Im.Sn boards (two boards of each surface finish were measured). Both adhesives showed comparable average resistance values.
Finally, the electrical characterization of the adhesive bridges was performed on 30-min continuous tests. The Keithley 2450 Sourcemeter was set to supply a continuous voltage of 16 V, similar to the electrical rating for electronic components in automotive electronics. The resulting I and R plots are shown in
Figure 12a. The test was carried out on the OSP board printed with adhesive B, demonstrating a stable resistance after the first 7 min of testing. This may be attributed to the heat dissipation promoted by the high composite resistance, at the initial test stage, after which the temperature stabilization lead to constant conductivity values. Cycle sweeps performed on the OSP board printed with adhesive B, at different times up to 30 min, are presented in
Figure 10 (right) and all show the same behavior.
3.5. Assessment of the Shelf Life of the Nanocomposite Adhesive
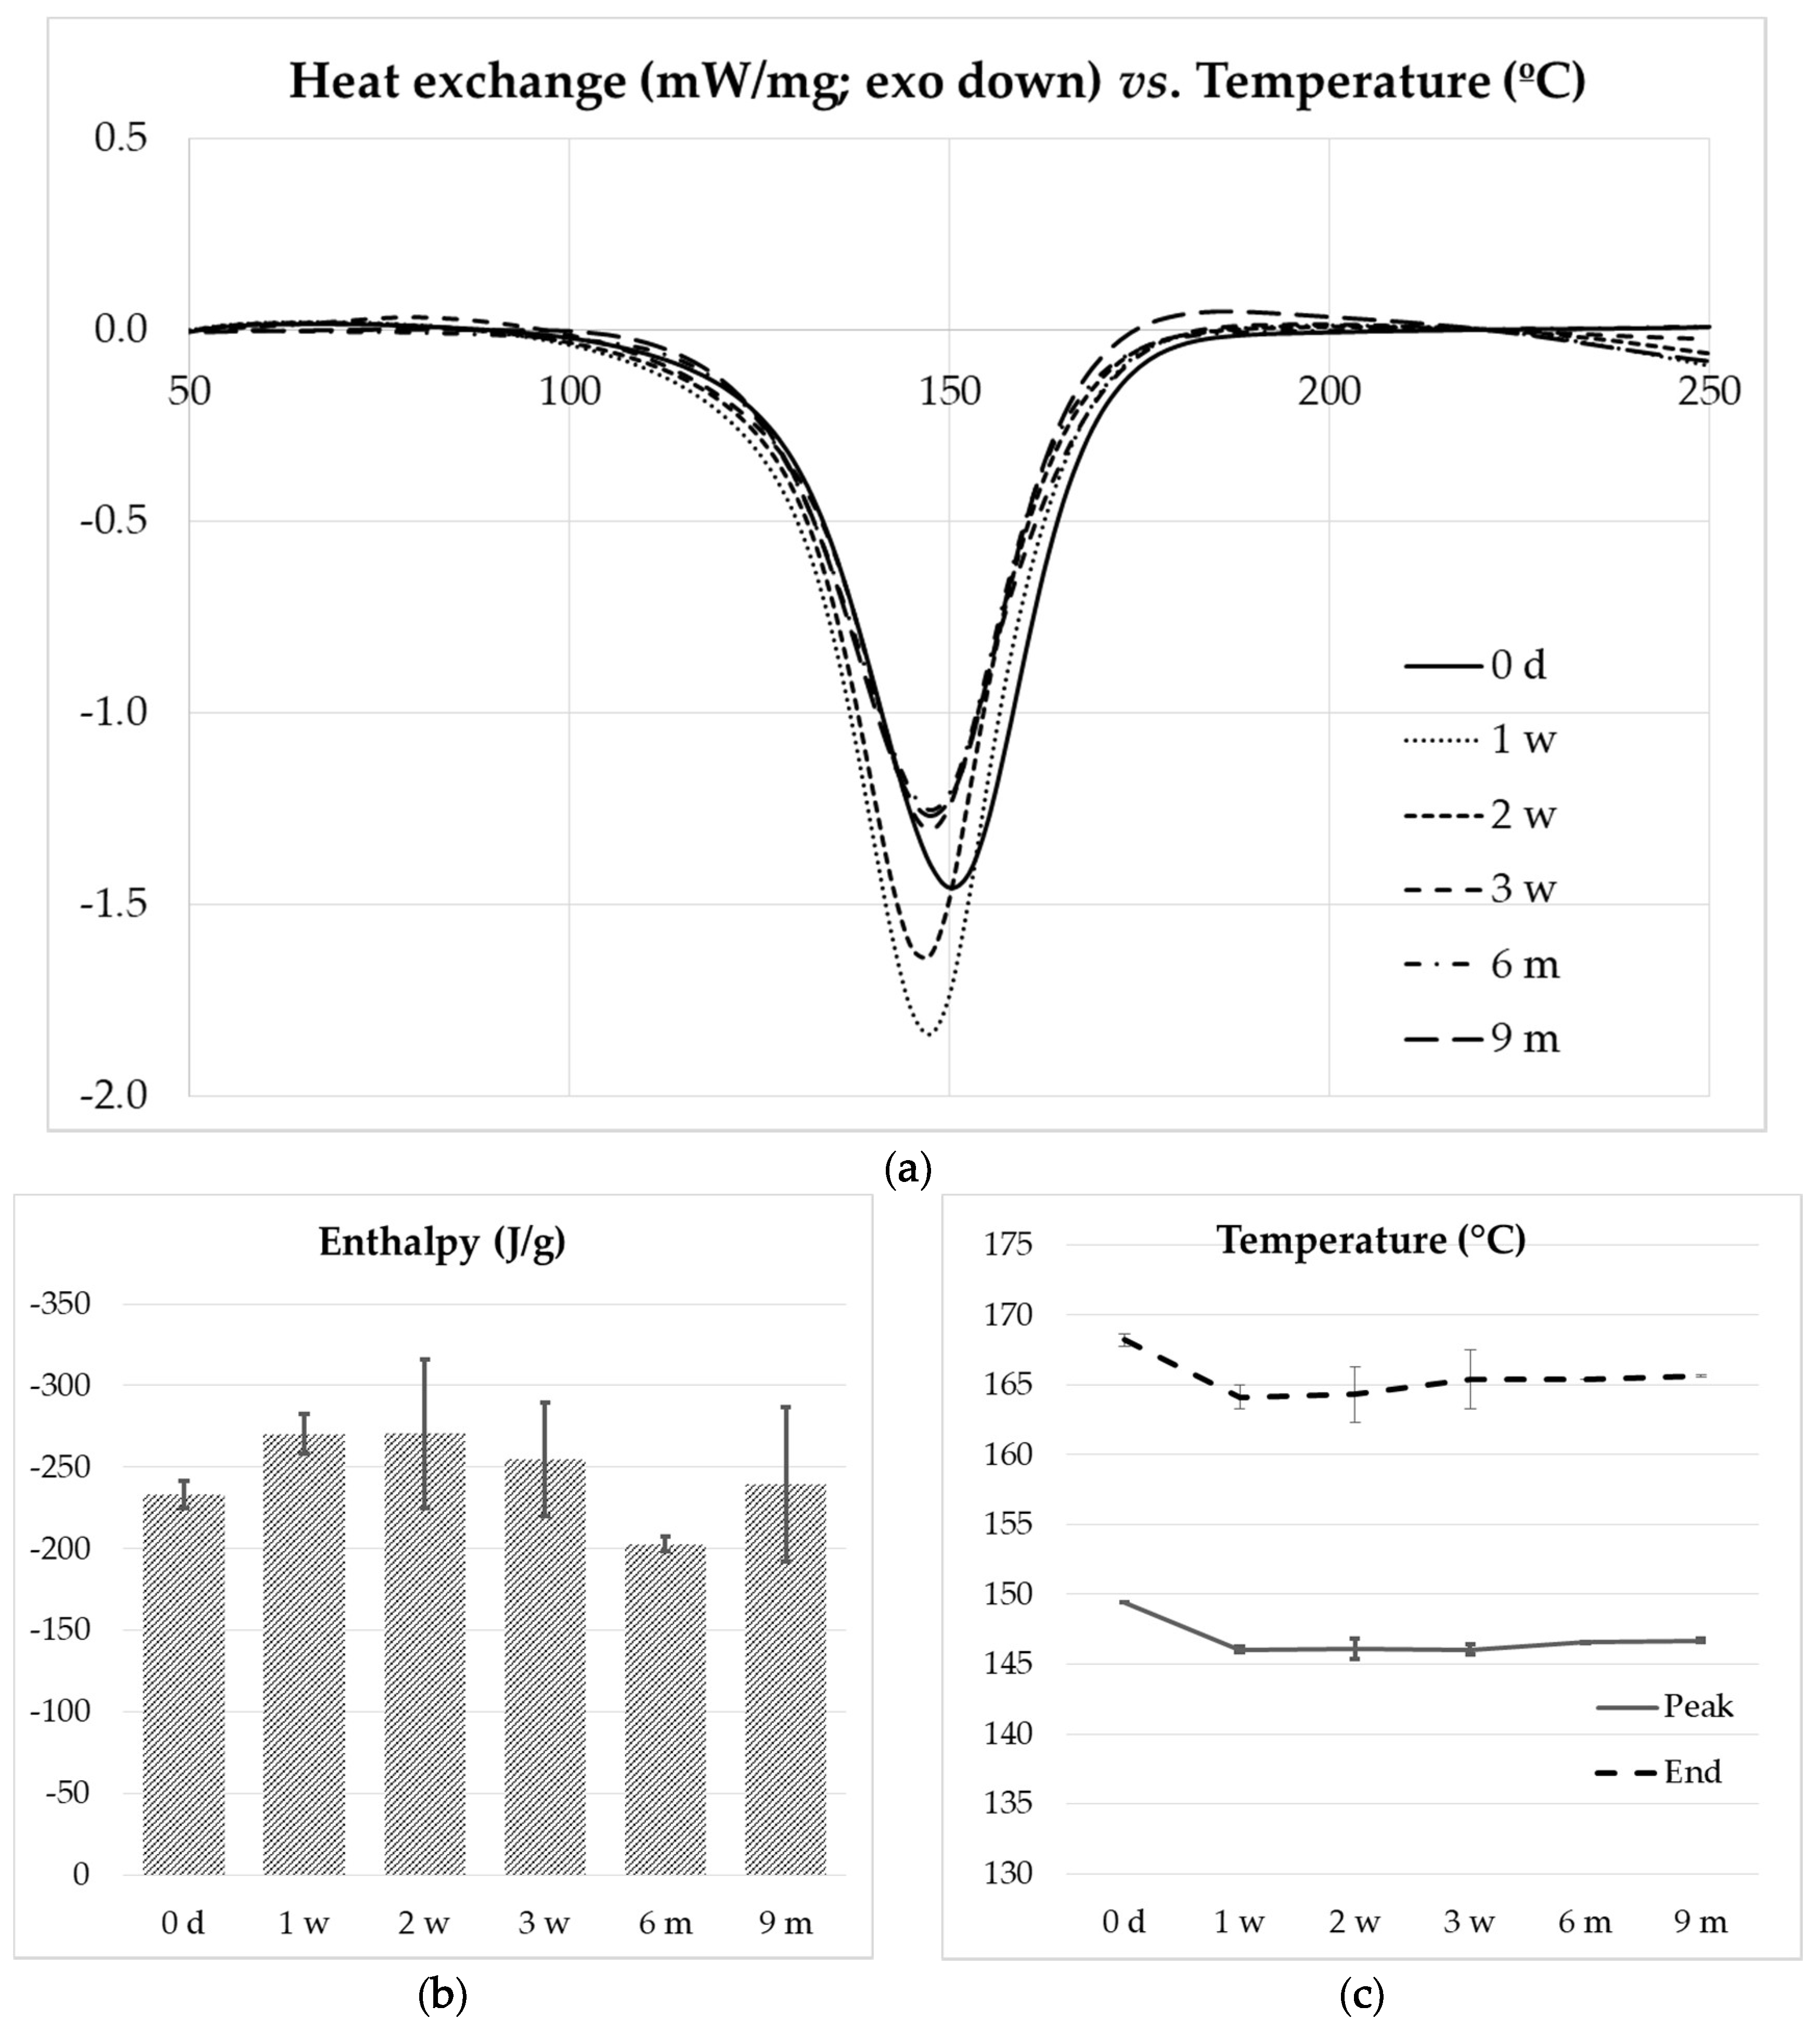
A composite resin was prepared with the complete formulation (epoxy resin, hardener, accelerator and carbon nanofillers) to study its shelf life when stored at −18 °C. The composite selected contained 0.5 wt.% SWCNT + 2 wt.% EG. The pot life of the resin at room temperature was 24 h, according to the manufacturer. Freshly prepared composite samples were stored in the freezer during 1, 2 and 3 weeks, and 6 and 9 months. The cure of the thawed composites and as-prepared samples was studied by DSC.
Figure 13a presents the DSC thermograms obtained by heating the composite resins from 30 to 250 °C at a heating rate of 10 °C/min. No major differences in peak temperature and shape were observed for composites subjected to increasing freezing time. The cure enthalpies, peak temperatures and peak end temperatures are plotted in
Figure 13b,c, showing the similarity of all the samples tested.
The simulation of the cure reaction in the PCB soldering tunnel was performed by heating the composite resins at 60 °C/min from 30 to 220 °C, simulating the temperature profile and residence time in a PCB’s soldering process. The DSC profiles obtained were similar for all the samples, regardless of storage time. The second heating of the cured composites at 10 °C/min originates a flat DSC curve, evidencing the complete cure of the composite resins in the first heating process.
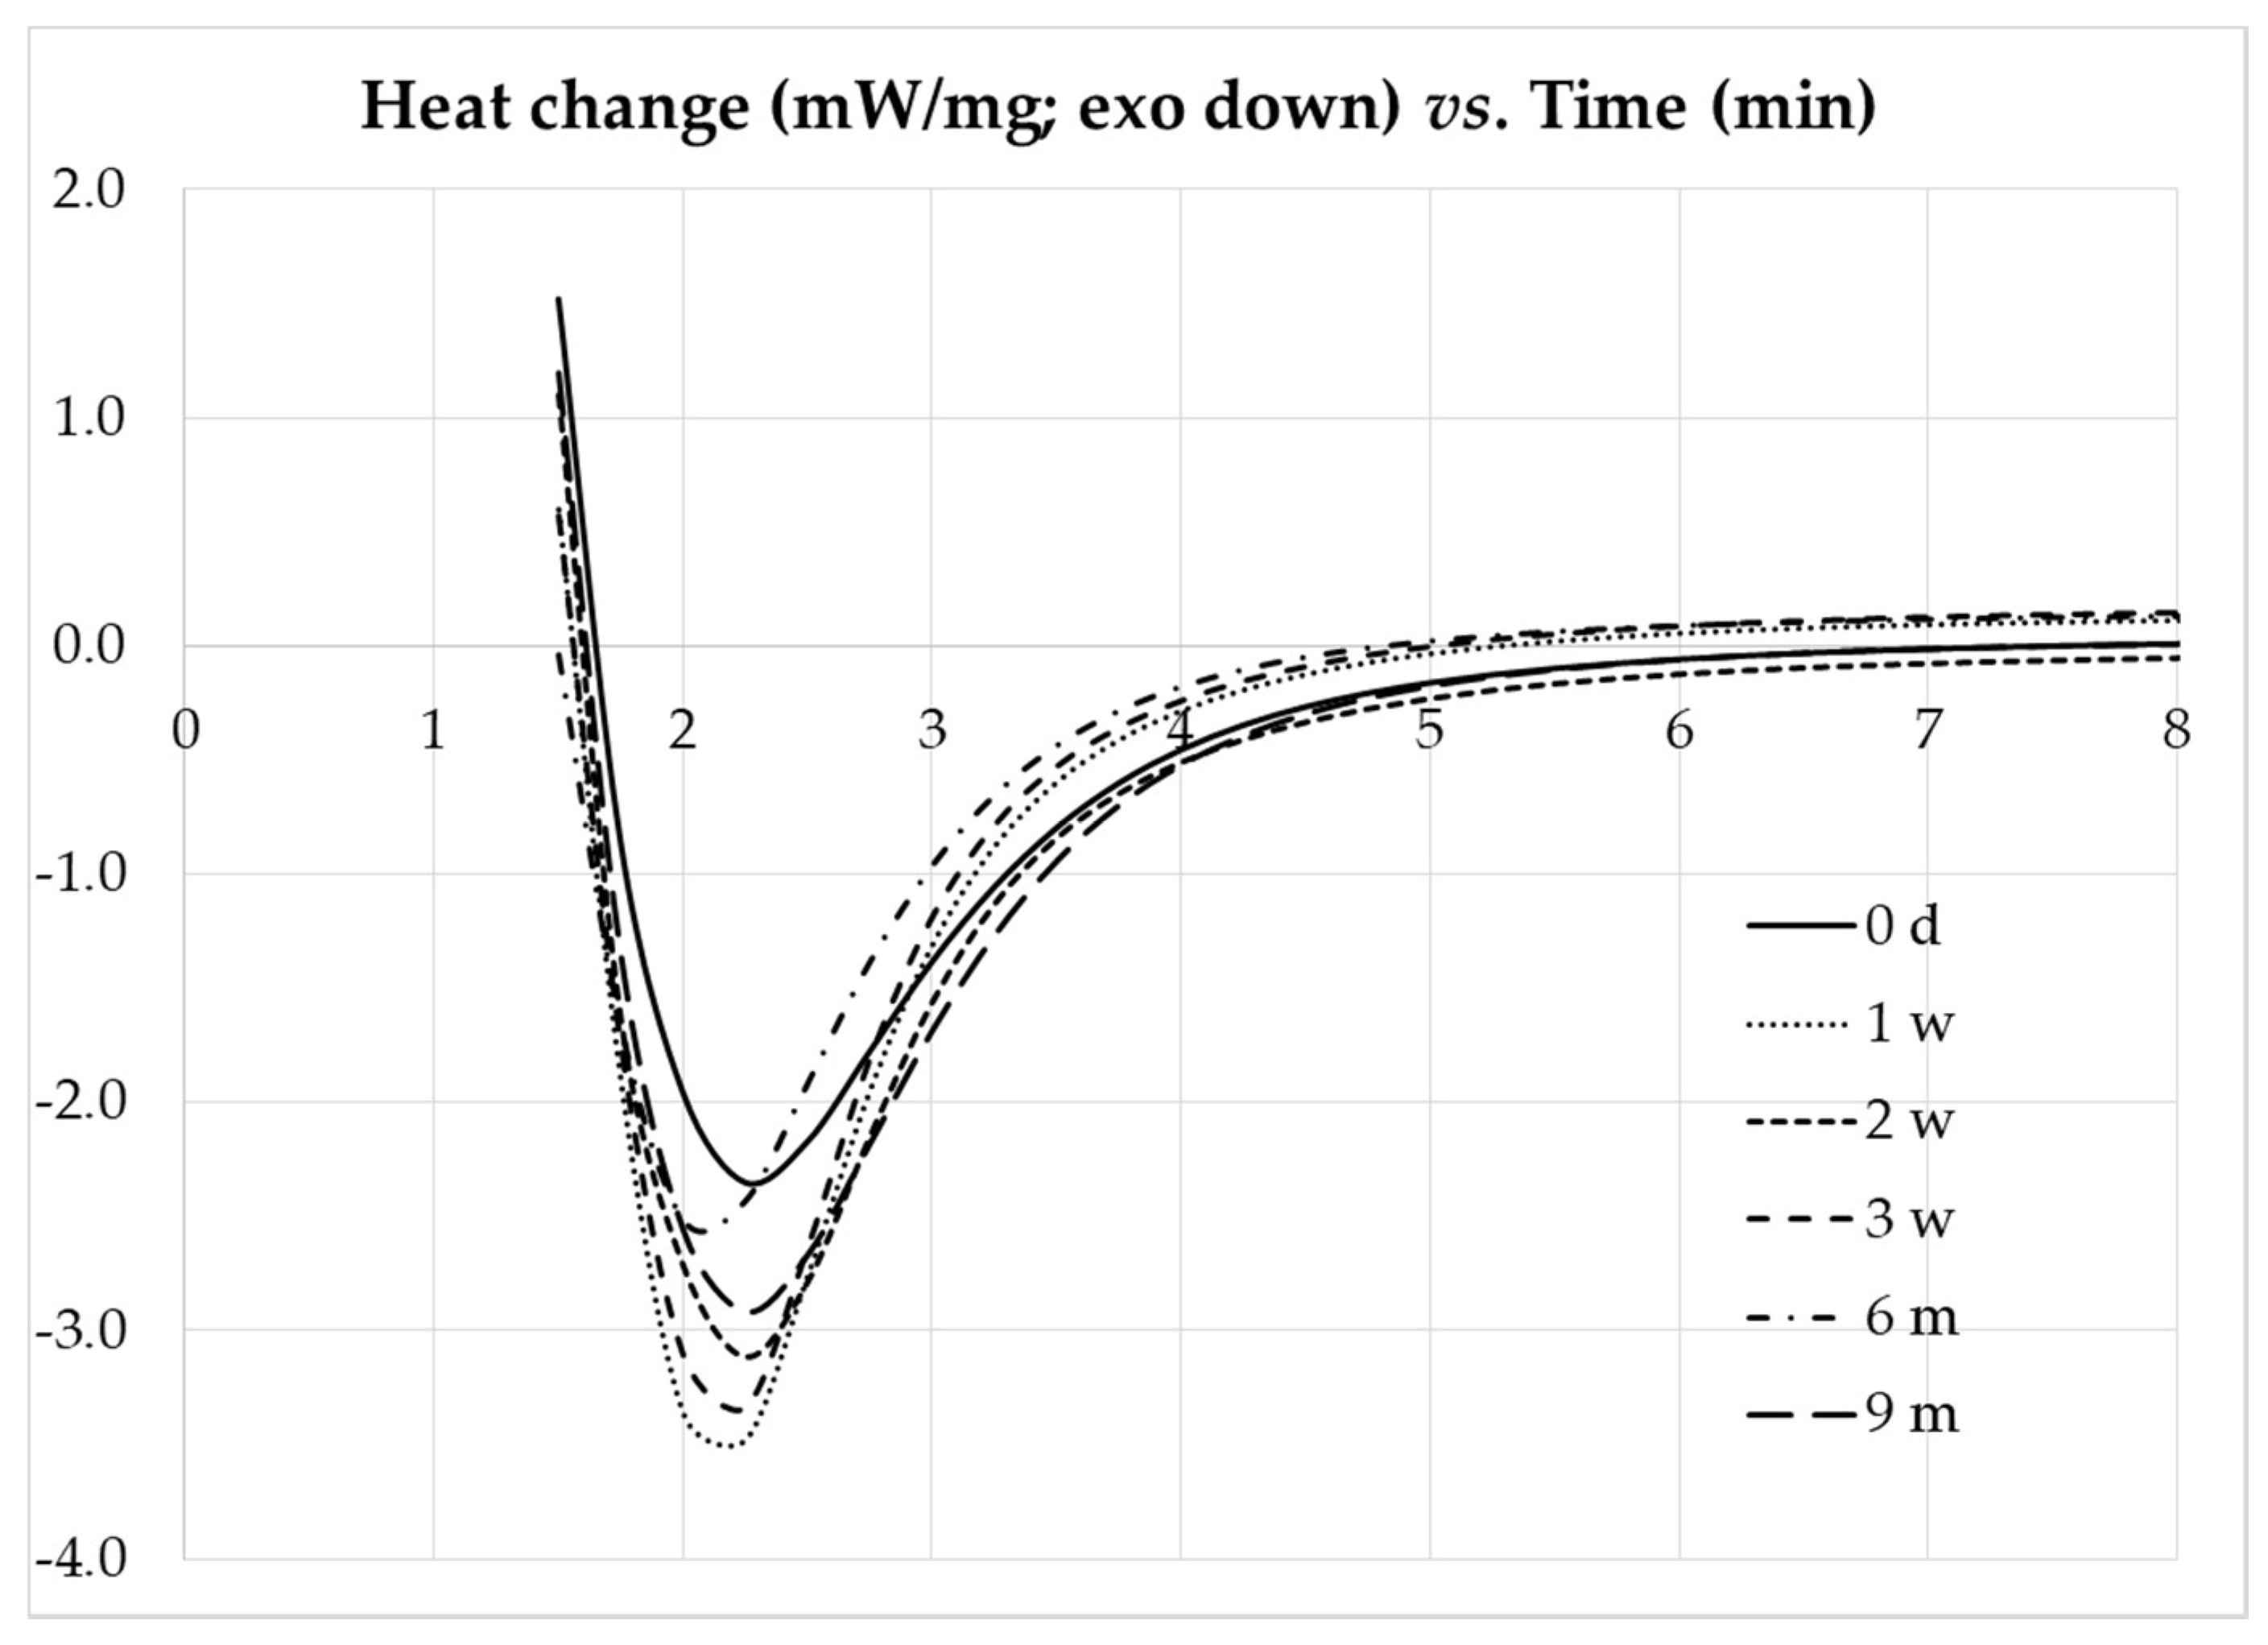
The DSC carried out in isothermal mode at 150 °C for the composites with different freezing storage times are presented in
Figure 14, showing no major differences in the curves. The time elapsed until the isothermal peak was observed, or peak time, is similar for the as-prepared and freeze-thawed composites, ranging from 2.10 to 2.25 min. These results show that the storage conditions used are suitable for long term storage of the composite adhesive, without deterioration of the cure performance.
Considering that currently available resins have a shelf life of up to 6 months at a storage temperature of −40 °C, it was observed that the present formulation can be stored at a higher temperature without affecting the shelf life.
