Article

Mixed Carbon Nanomaterial/Epoxy Resin for Electrically Conductive Adhesives

1
Instituto de Polímeros e Compósitos (IPC), Universidade do Minho, 4804-533 Guimarães, Portugal
2
Leibniz Institute of Polymer Research Dresden (IPF Dresden), Hohe Str 6, D-01069 Dresden, Germany
3
CM/MFT3 Bosch, 4705-820 Braga, Portugal
4
Concept Scientific Instruments (CSI), 1 Terre de Feu, 91940 Les Ulis, France
*
Authors to whom correspondence should be addressed.
J. Compos. Sci. 2020, 4(3), 105; https://doi.org/10.3390/jcs4030105
Submission received: 1 July 2020 / Revised: 24 July 2020 / Accepted: 30 July 2020 / Published: 1 August 2020
(This article belongs to the Special Issue Recent Advances in Carbon Nanotube Composites)

Abstract

:
The increasing complexity of printed circuit boards (PCBs) due to miniaturization, increased the density of electronic components, and demanding thermal management during the assembly triggered the research of innovative solder pastes and electrically conductive adhesives (ECAs). Current commercial ECAs are typically based on epoxy matrices with a high load (>60%) of silver particles, generally in the form of microflakes. The present work reports the production of ECAs based on epoxy/carbon nanomaterials using carbon nanotubes (single and multi-walled) and exfoliated graphite, as well as hybrid compositions, within a range of concentrations. The composites were tested for morphology (dispersion of the conductive nanomaterials), electrical and thermal conductivity, rheological characteristics and deposition on a test PCB. Finally, the ECA’s shelf life was assessed by mixing all the components and conductive nanomaterials, and evaluating the cure of the resin before and after freezing for a time range up to nine months. The ECAs produced could be stored at −18 °C without affecting the cure reaction.

1. Introduction

Electronic packaging industries traditionally use metal solders in the soldering process to enable the electrical connection between the electronic component and the printed circuit board (PCB). Electrically conductive adhesives (ECAs) are polymer-based composite adhesives typically formed by a resin and metal particles, and are an alternative to solder available since the mid-20th century. ECAs offer lightweight and a low environmental impact compared to lead-based solder. Additional advantages are the lower cure temperature conditions, the reduction in the number of processing steps and lower thermo-mechanical residual stress inflicted on the substrate [1,2,3].
Conventional ECAs consist of a thermoset polymer (e.g., epoxy) composite with high content of silver microflakes at typical contents of 60–90 wt.%. Other metallic fillers may be used such as copper, nickel, gold or tin. These adhesives present higher electrical resistivity (10−3–10−4 Ω cm) compared to eutectic lead-based solders (2.9 × 10⁻⁵ Ω cm) [4]. The lower electrical conductivity of conventional commercially available ECAs is associated to failure of silver microflakes to provide metallurgical connections, such as eutectic solders [5], limiting the use of such ECAs to applications where low electrical conductivity is required.
The research on ECAs generally aims at the increase of electrical conductivity, maintaining good mechanical properties, taking as starting point the conventional formulation based on a high content of silver flakes and epoxy resin. This may be achieved by incorporating nano-sized silver particles, or using multiple dimensional materials such as nanowires or nanorods as 1D materials, flakes or microflakes as 2D, and spherical micro or nanoparticles as 3D material. The use of nanoparticles (NPs) jointly with microparticles has been reported to improve electrical properties below the percolation threshold, but to decrease it above the percolation [2,6]. This effect was interpreted in terms of the positive contribution of the nanoparticles for the formation of a percolation network at low filler content, and at high filler content by the increase of the distance between the microflakes (fewer direct contacts at the micro-scale) and by the excess of contact points at the nano-scale, increasing the contact resistance [6].
The development of ECAs based on carbon nanomaterials such as carbon nanotubes (CNTs) and graphene dispersed in epoxy is another interesting approach. The high electrical conductivity of CNTs, their nano-size and high aspect ratio are advantages for the application as conductive fillers. They are able to establish a percolation network at low nanoparticle contents, while enhancing the mechanical properties [7]. Meng et al. [8] reached electrical percolation for epoxy/graphite nanoplatelets (GnP) at approximately 1.2 wt.% GnP, reaching a maximum electrical conductivity of 10−3 S/m and thermal conductivity of 0.33 W/m∙K at approximately 4 wt.% of GnP. Li et al. reported a percolation threshold of 1.2 wt.% for epoxy/functionalized graphene composites [9]. Morishe et al. dispersed NH2- functionalized graphene nanoplates in epoxy and were able to achieve conductivity values of 10−4 S/m at a concentration of 12 wt.% [10]. However, most of the work reported in the literature concerning ECAs still include considerable amounts of metal particles. A review on ECAs recently published by Aradhana, Mohanty and Nayak [11] covers adhesives based on epoxy resins with all types of conductive fillers (such as metal, carbon, ceramic, metal-coated fillers) and various types of inherent conductive polymers (i.e., polypyrroles, polyanilines, polythiophenes, etc.). They report electrical conductivity values reaching 101 S/m and thermal conductivity of 0.45 W/m∙K for ECAs based on epoxy/single wall carbon nanotubes (SWCNT) at a concentration of 8 wt.% [12].
The present work reports the preparation of ECAs based on epoxy/carbon nanomaterials (single and multi-walled carbon nanotubes and exfoliated graphite) within a range of concentrations. The composites were characterized in terms of morphology (dispersion of the conductive nanomaterials), electrical and thermal conductivity and rheology. The deposition of a selected ECA composition on a test PCB was successfully achieved using screen printing. Finally, the ECA’s shelf life was assessed by mixing all the components and conductive nanomaterials, and evaluating the cure of the resin before and after freezing for a time range up to nine months.

2. Materials and Methods

2.1. Materials

The thermoset polymer used as matrix for the preparation of nanocomposites was Biresin CR141, with a viscosity of approximately 8.2 mPa∙s and density of 1.16 g cm−3 at 25 °C; the hardener was Biresin CH141, with a viscosity of approximately 40 mPa.s and density of 1.20 g cm−3 at 25 °C; finally, the accelerator was Biresin CA141, with a viscosity of approximately 200 mPa∙s and density of 0.98 g cm−3 at 25 °C. All components were purchased from Sika (Baar, Switzerland).
The carbon nanomaterials used were: (i) SWCNT Tuball, supplied by OCSiAl (Luxembourg) characterized by a purity above 75%, length ≥ 5 µm and outer mean diameter of 1.8 ± 0.4 nm, as reported by the producer; (ii) multiwall carbon nanotubes NC7000 (MWCNT) with approximately 90% purity, average length of 1.5 μm and average diameter of 9 nm, supplied by Nanocyl (Sambreville, Belgium); (iii) exfoliated graphite Micrograf grade HC11 (EG), with 99.5% purity and average diameter (D50) of 9.5 µm, provided by Nacional de Grafite Ltda (Itapecerica da Serra, Brazil). The morphology and structure of this EG is described in a previous work [13].

2.2. Composite Preparation

The three-component epoxy resin was prepared by mixing the resin Biresin CR141 with the hardener Biresin CH141 and the accelerator Biresin CA141 at a weight ratio of 100:90:2. The mixture presents a viscosity of 600 mPa∙s and a pot life of approximately 24 h at room temperature. For composite preparation, the carbon fillers were all mixed together with the resin in a beaker. After mixing all the components manually, the mixture was processed on a three-roll mill EXAKT 80E (EXAKT Advanced Technologies GmbH, Norderstedt. Germany). The dispersion of the carbon nanofillers was achieved using a six-step program where the distance between the rolls was decreased as their velocity was increased, as described in detail in Supporting Information (Table S1).

2.3. Morphological Characterization

Scanning electron microscopy (SEM) of the carbon nanomaterials’ and their composites’ cross-sections was carried out on a Nano SEM—FEI Nova 200 (FEG/SEM) at high vacuum (resolution of 1.0 nm at 15 kV).
Raman spectroscopy was carried out on a HORIBA LabRAM HR Evolution confocal Raman microscope spectrometer (Horiba Scientific, Piscataway, NJ, USA) using Horiba Scientific’s Labspec 6 Spectroscopy Suite Software for instrument control, data acquisition and processing. The Raman mapping was performed using a laser excitation with 532 nm wavelength, at 25% laser intensity, with a 600-g/mm grating, in the spectral range between 1300–2790 cm−1, with a 100× objective and a 50-µm hole. Acquisition time used was 0.5 s for composites with SWCNT and 2 s for all other composites, with 3 accumulations per point. Maps of 40 × 25 and up to 70 × 50 µm2 where obtained using 0.8-µm steps. For the Raman intensity maps the range 1550–1650 cm−1 was used to detect the G band, and the range 1300–1400 cm−1 for the D band.
Atomic Force Microscopy (AFM) and High Definition Kelvin Force Microscopy (HD-KFM) was used to image the surface of the nanocomposites, in particular to detect the distribution of the conductive carbon nanomaterials at the composite surface using the Kelvin Probe (optimized single pass HD-KFM) which detects the differences in the surface potential between the epoxy matrix and the carbon nanoparticles. Samples were prepared by placing a drop of the composite on the sample holder, covering with a freshly cleaved mica, slightly compressing to ensure the formation of a flat surface, curing, and finally removing the mica to expose the flat surface for analysis. The AFM equipment was the Nano-observer (Concept Scientific Instruments, Paris, France) using a metallic cantilever (ANSCM-PT, Pt/Ir coating, AppNano, San Francisco, CA, USA) with a nominal spring constant of 1.7 (range 1.2–6.4 N/m) operating in HD-KFM mode. The topography of the composites was analyzed with 512 × 512 pixels at line rates of 1 Hz. AFM images with 30 × 30 µm2 or less were acquired. The images were analyzed using Gwyddion software.

2.4. Rheological Characterization

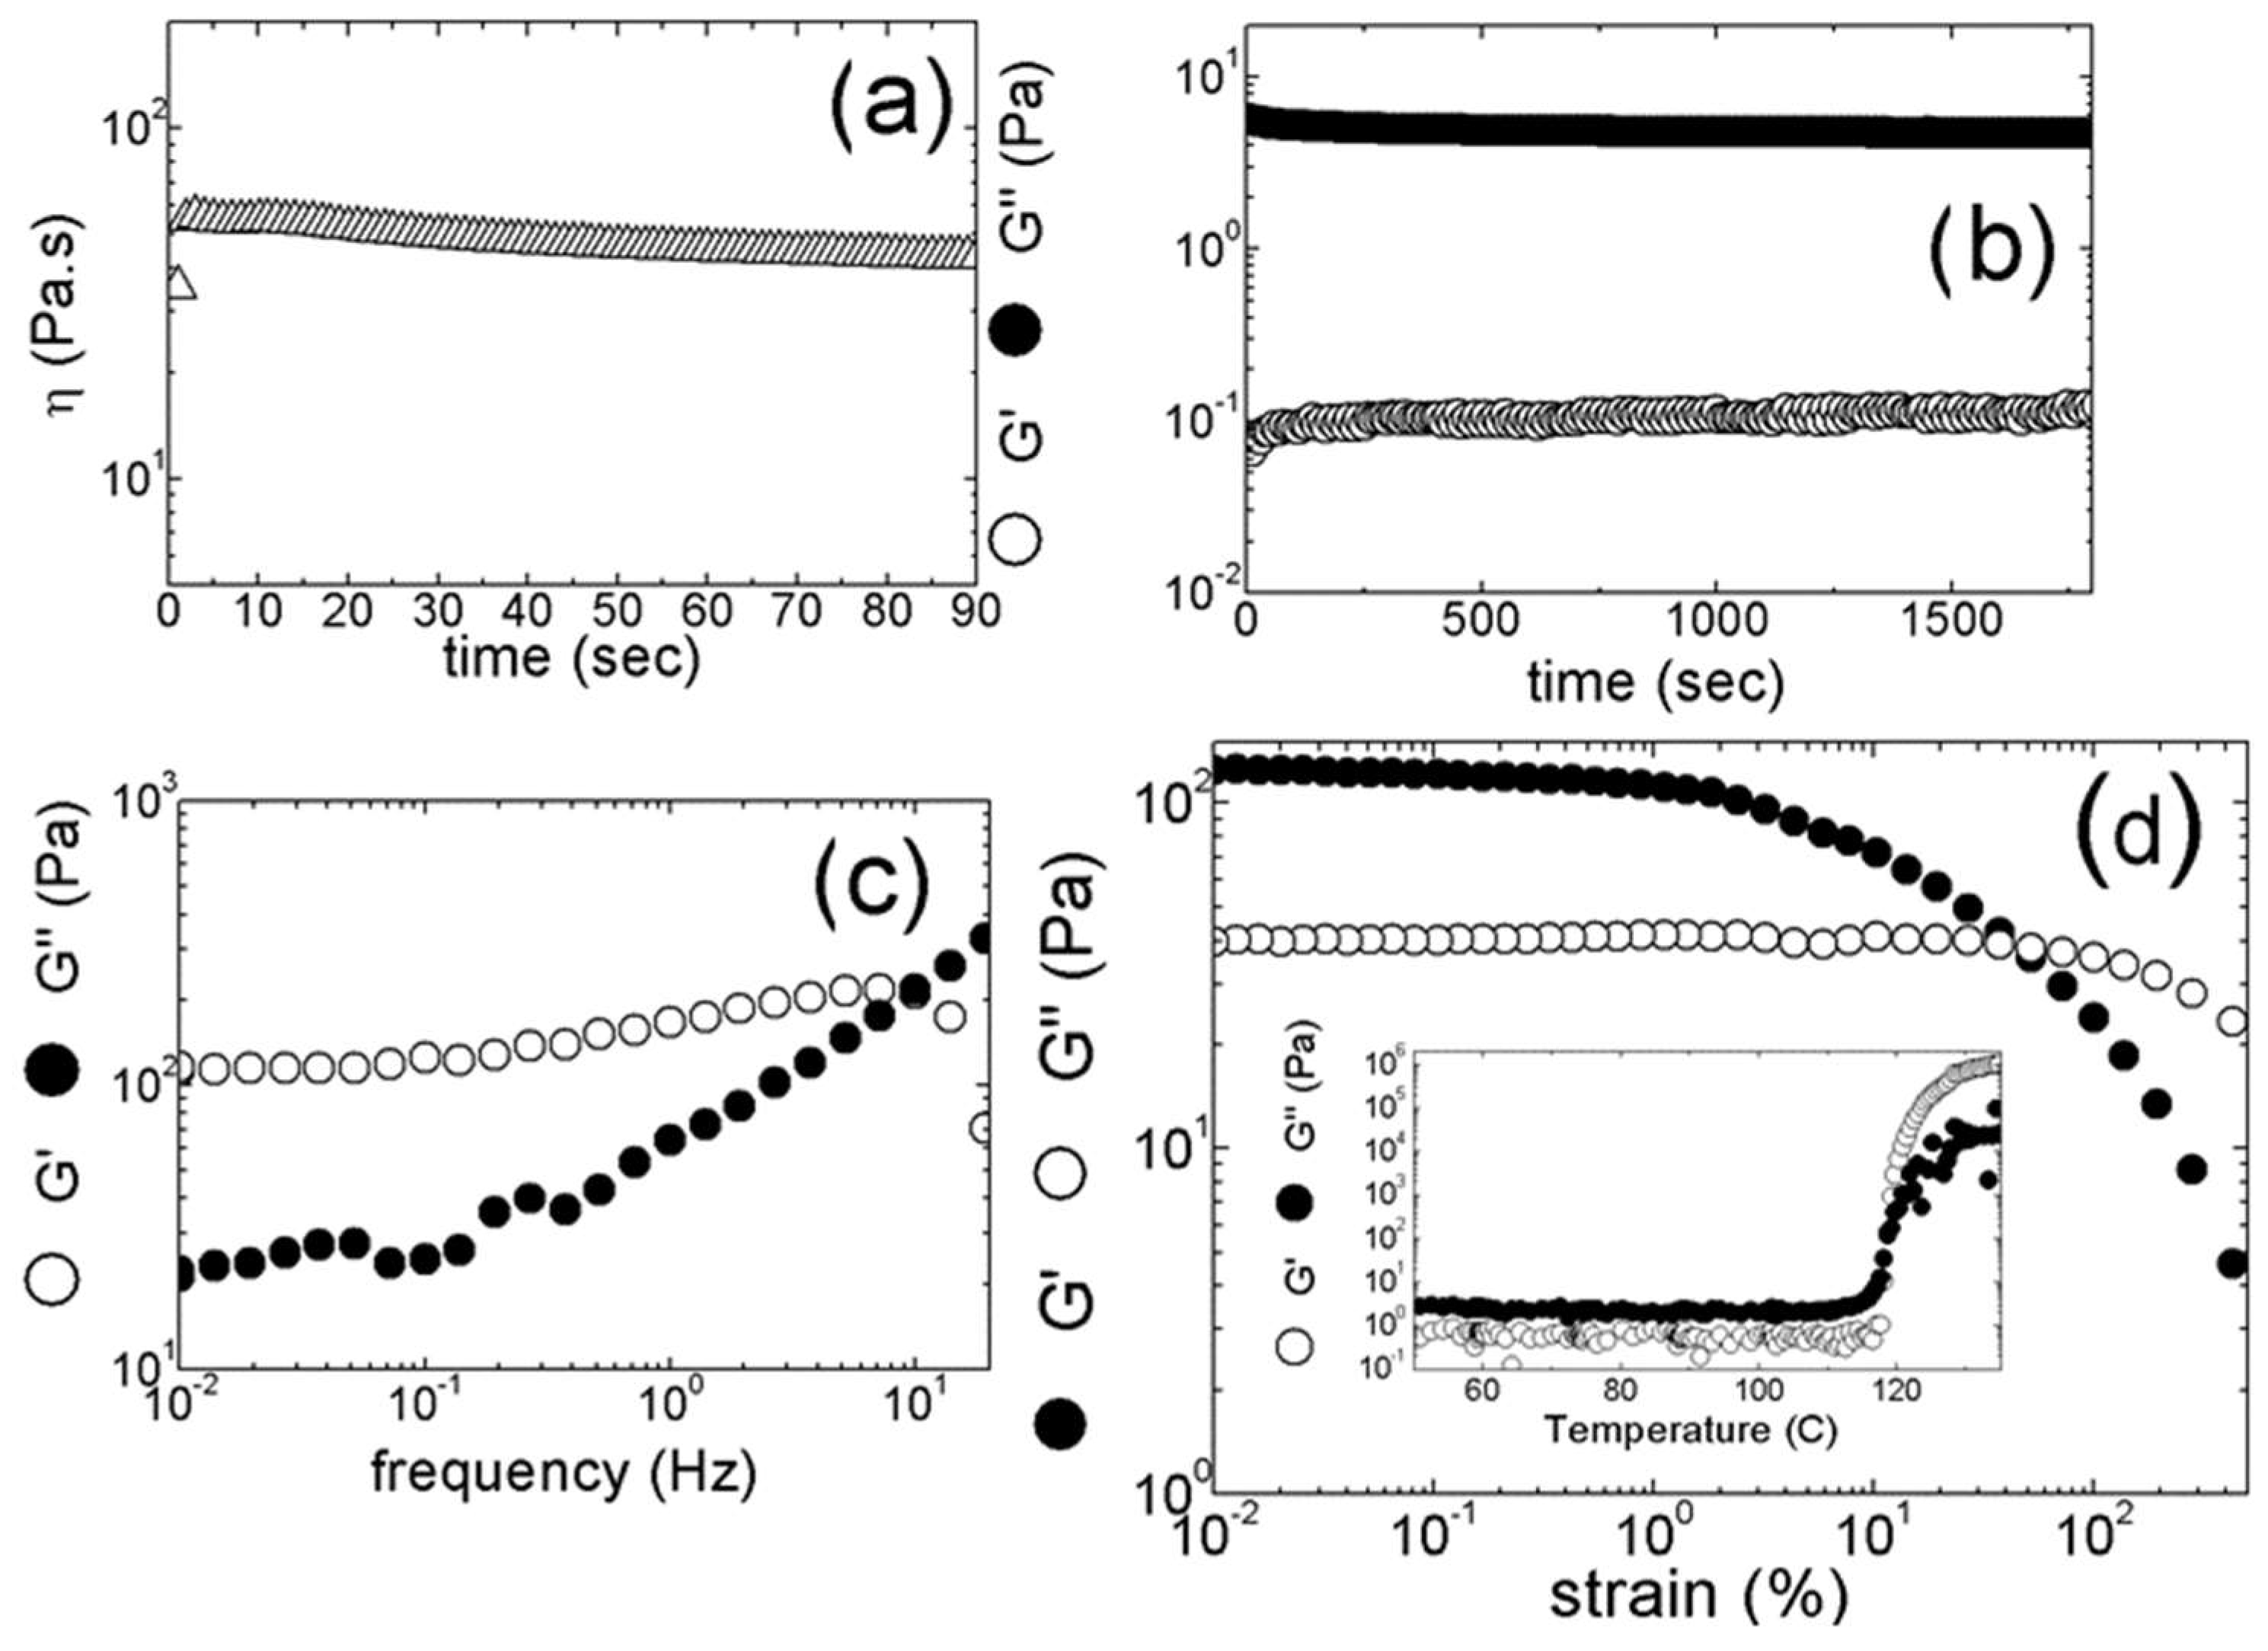
The rheological properties were measured with a controlled stress rotational rheometer ARG2 (TA Instruments, New Castle, DE, USA). The measurements were carried out with disposable aluminum parallel-plates (40 mm diameter) and maintaining the gap between plates in the range of 1500 to 1800 μm. Initially, and in order to understand the influence of the carbon particles on mixtures’ viscosity, the following experimental protocol was followed at 25 °C (see Figure 1). A pre-shear was performed with a shear rate of 1 s−1, in view of erasing any rheological effect associated with the sample loading in the shearing geometry. After reaching steady state, the flow was stopped and the sample structural recovery was monitored by recording the oscillatory linear stress response to an oscillatory shear strain of 0.1%. Once structural equilibrium was reached, a frequency sweep was performed from 100 Hz to 0.01 Hz under the application of a 0.1% shear strain. Finally, a strain sweep from 0.01 to 500% was performed at 1 Hz in order to determine the linear viscoelastic regime. All strains sweeps confirmed that the protocol described above was performed in the linear regime as onset of structural yielding occurred at strains in excess of 1% for all samples tested. As a result of the strain sweeps, some protocols were repeated using larger shear strains to improve the signal over noise ratio whereas keeping a linear stress response to the strain. Alternatively, in lieu of the strain sweep test, the temperature was ramped at rate of 5 °C/min and both storage (G′) and loss (G″) moduli were recorded by applying a 0.1% shear strain at a frequency of 1 Hz, in order to study the cure of the sample.

2.5. Electrical Conductivity

The electrical volume conductivity measurements were carried out using the KEITHLEY SMU 2635B current/voltage source and meter. Silver ink was used as contact between the electrode and the sample, placed at the ends of dog bone shaped composite samples. The composite samples were prepared by casting on a silicon mold and cured in a ventilated oven at 150 °C for 30 min. The test specimens’ geometry was S3A as defined in the DIN 53504 standard. The sample resistivity was calculated from the slope of the I-V curves, current intensity measured while varying the voltage between −10 and +10 V at 0.5V steps, accounting for the geometry of the composite samples. For the electrical characterization of the cured adhesive patches deposited on the PCB’s a Keithley 2450 Sourcemeter was used, connecting the source and measurement probes to the test points connected to the adhesive-bridged pads. Two methods were performed: continuous measurement and continuous cycling. For the continuous cycling analysis, the sweep of test voltages consisted on a linear sweep of voltage between −16 and +16 DCV with steps of 0.5 DCV (two steps per second, for a total sweep time of 16 s). Test sample was a single cured adhesive bridge. For the continuous measurement, test voltage was set at +16 DCV across two adhesive bridges in series and the current recorded for 30 min.

2.6. Thermal Conductivity

The thermal conductivity of the composites is calculated from the product of thermal diffusivity, density and specific heat capacity. The thermal diffusivity is measured on square samples with 12.7 mm side and thickness within 0.45–1.0 mm through the plates using the light flash apparatus (LFA) 447 NanoFlash (Netzsch-Gerätebau GmbH, Selb, Germany) at 25 °C. The specific heat capacity of the composites is calculated by comparing the signal heights between composite and reference Pyroceram 9606 (with known specific heat) using LFA 447 NanoFlash. The density of the composite is determined using a buoyancy method.

2.7. Differential Scanning Calorimetry

The cure of the epoxy resin composites was analyzed by differential scanning calorimetry (DSC) using a Netzsch 200 F3 calorimeter (Netzsch-Gerätebau GmbH, Selb, Germany). Three different types of heating/cooling tests were carried out, corresponding to the following temperature programs: (i) standard DSC profile, heating from 30 to 250 °C at a heating rate of 10 °C/min, to monitor the epoxy cure; (ii) simulation of PCB soldering process, heating from 30 to 220 °C at a heating rate of 60 °C/min, holding for 1 min, cooling to 40 °C at a cooling rate of 60 °C/min, followed by heating from 40 to 250 °C at a heating rate of 10 °C/min; and (iii) an isothermal cure at 150 °C, heating from room temperature to 150 °C at a heating rate of 100 °C/min, and holding for 5 min at that temperature. All measurements were performed using N2 as purge gas.

2.8. Testing the Deposition on a Printed Circuit Board Substrate

The test boards were produced by Elekonta Marek GmbH (Gerlingen, Germany), with layout depicted in Figure 2 (left), and were available with three surface finishes: organic soldering preservative (OSP), electroless nickel gold (ENIG) and immersion tin (Im.Sn). The adhesive deposition was carried out using a stencil printing process. The stencil was manufactured by Laserjob (Bavaria, Germany) from stainless steel, with the underside finish on “Nanowork” coating, which is recommended for the printing of adhesives due to its low surface tension. For the adhesive deposition, the prototype printer was set at the printing speed of 100 mm/s using a single rubber squeegee (printing was performed on one pass). Figure S1 shows a picture of the prototype printer with the tested adhesives. After printing, the test boards were heated in a ventilated oven set at 150 °C for 15 min to allow cure of the adhesive, and then cooled at room temperature.
The prototype boards for conductivity tests were designed to use the large chip 1206 pads that are arranged to connect in series and feature separate testing points for electrical connection. The stencil was designed to connect two pads using the conductive composite (layout depicted in Figure 2, right) allowing a first assessment of the adhesive-PCB interconnection by direct measurement of bulk conductivity through measuring points present on the board.

3. Results and Discussion

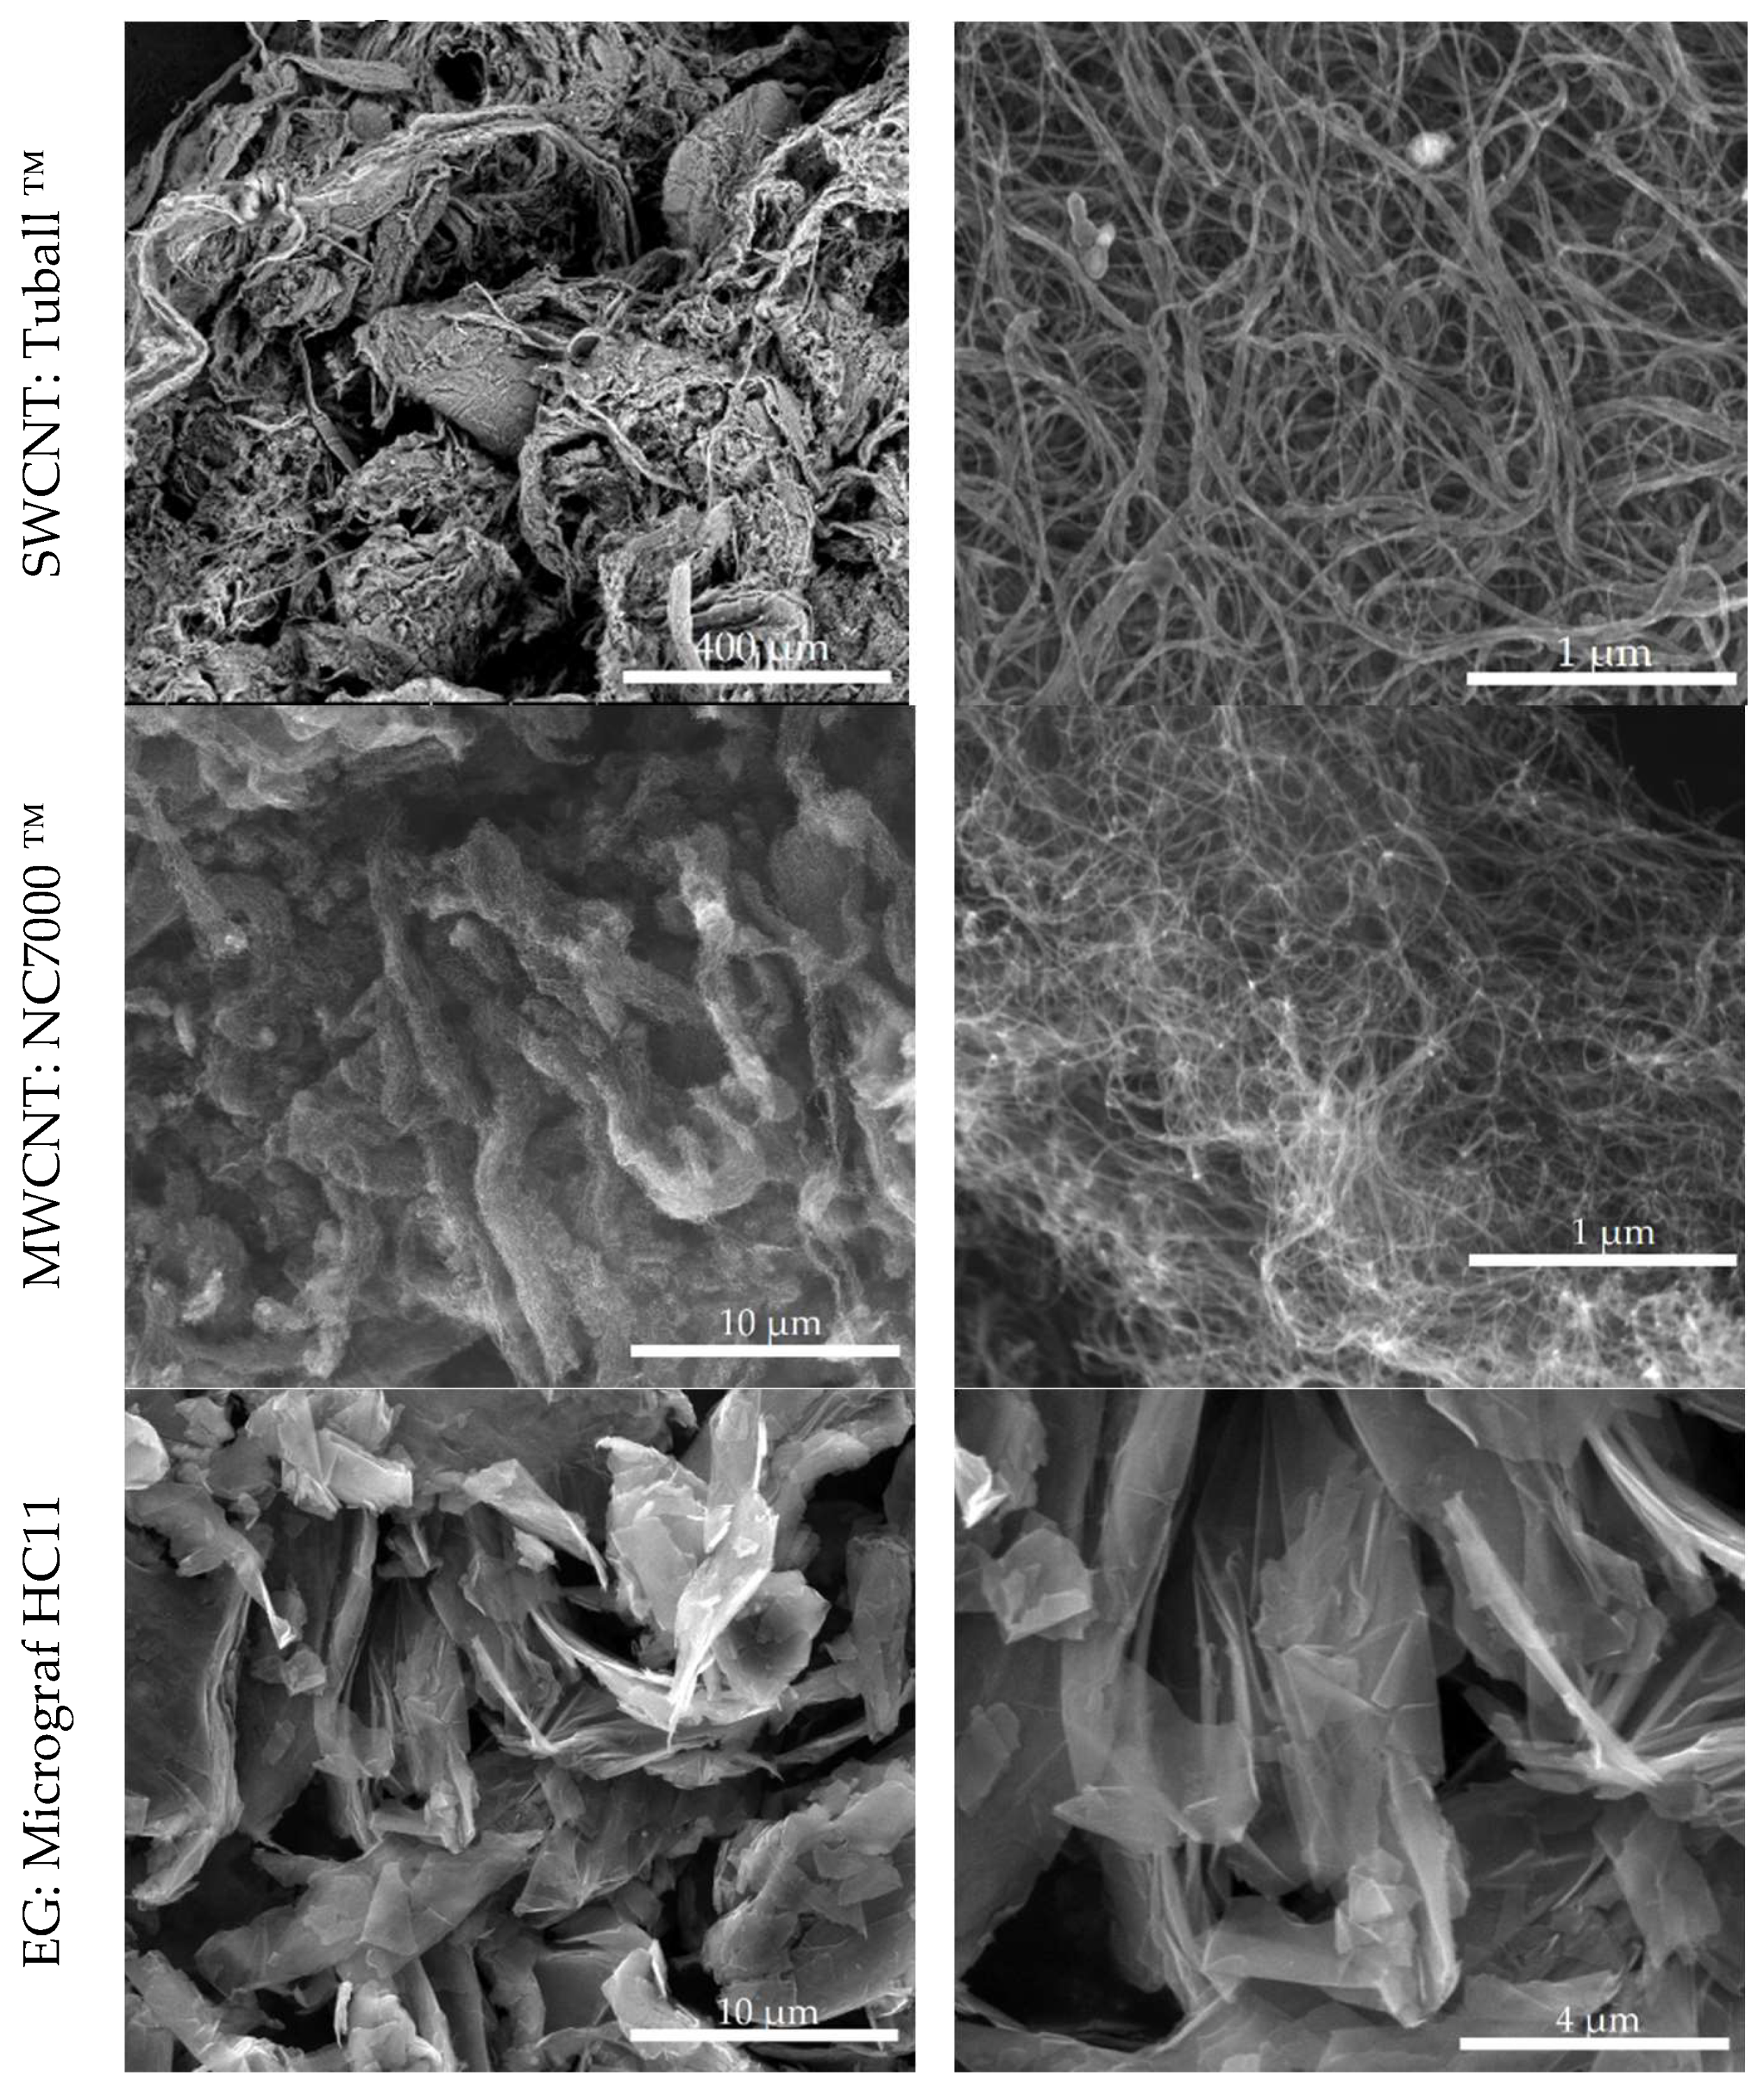
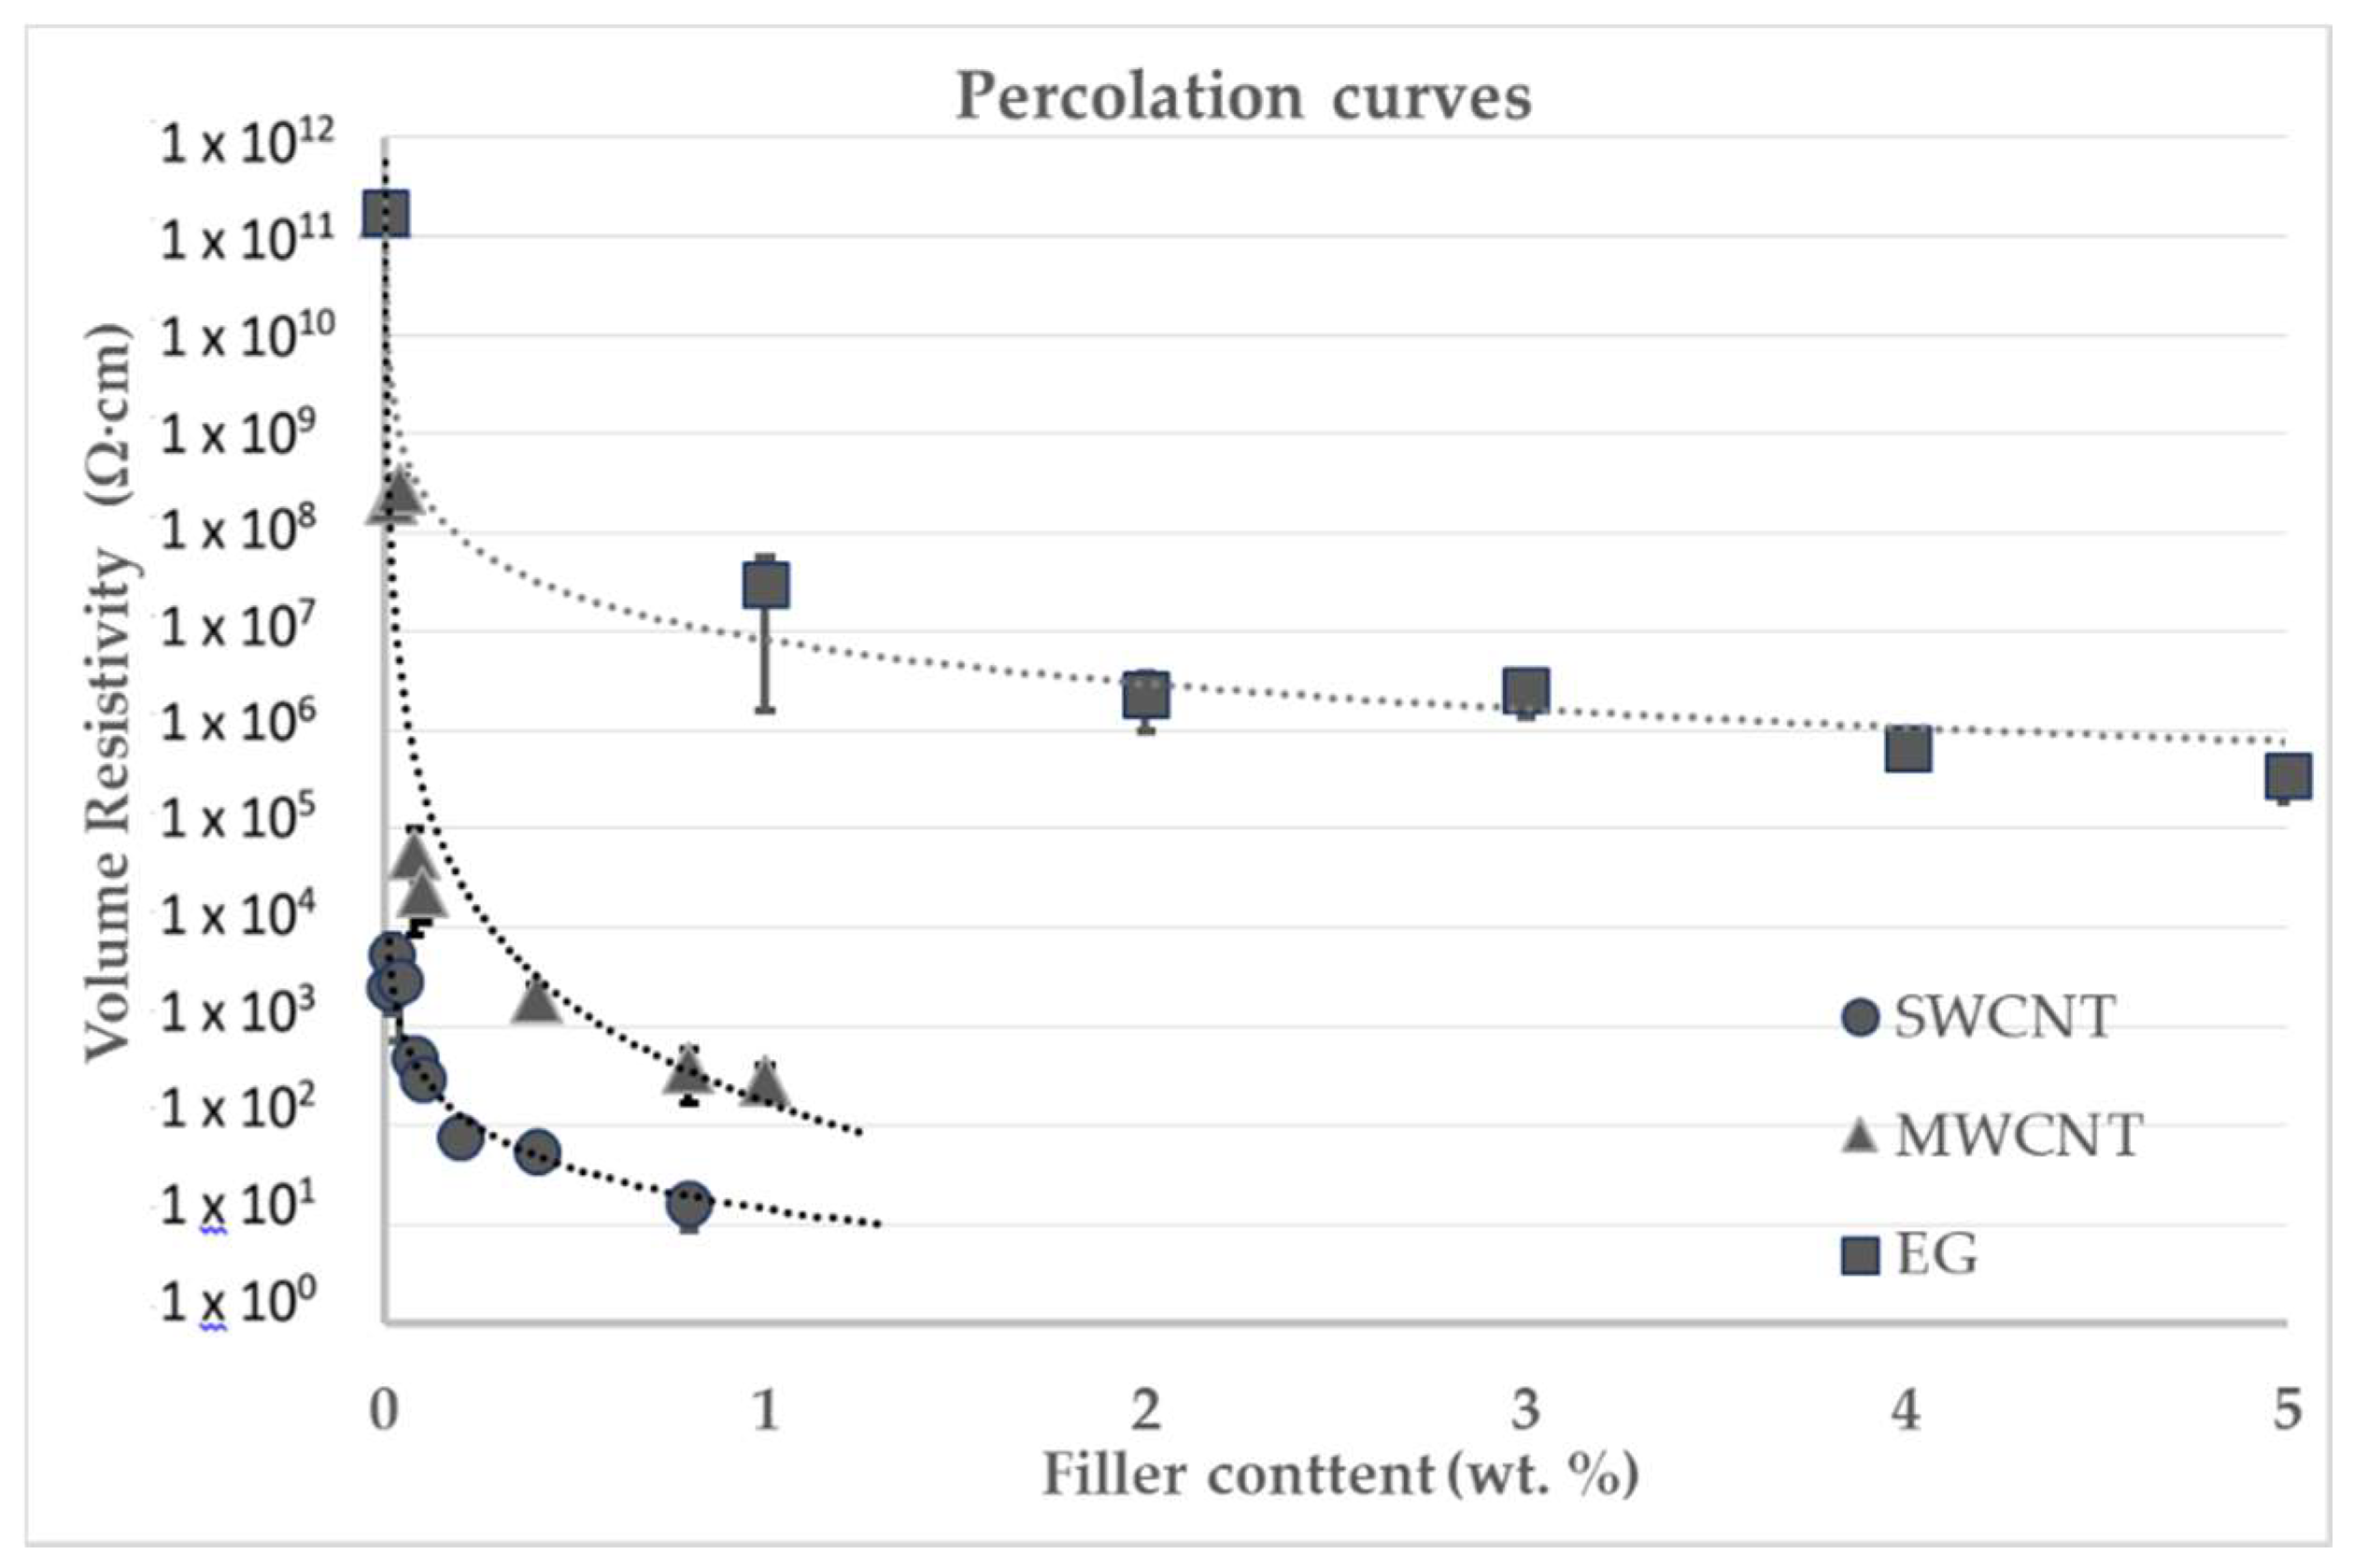
ECAs were prepared with epoxy resin and carbon nanomaterials with different morphology (SWCNT, MWCNT and EG), illustrated in Figure 3. The SWCNT are observed to form long ropes, each containing a large number of nanotubes bound to each other through Van der Waals forces. The diameter of these ropes can be larger than the average diameter of a MWCNT (approximately 9.5 nm), as observed in Figure 3 (complementary transmission electron microscopy images are presented in Figure S2). The EG flakes present a flat surface with equivalent diameter typically larger than 10 μm and the thickness in the nanometer range is comparable to the diameter of the nanotubes. Composites were prepared with each single type of nanomaterials to obtain the respective percolation curves and assess the electrical conductivity above the percolation threshold. The percolation curves obtained are represented in Figure 4 (numerical results available in Table S2). Based on these results, a set of hybrid compositions containing 1D and 2D nanomaterials was selected and the composites were prepared.

3.1. Morphological and Electrical Characterization of the Nanocomposite Resins

The selected compositions combining SWCNT with EG and MWCNT with EG are listed in Table 1, as well as the electrical volume resistivity (R0) of the respective composites. Figure 5 illustrates the morphology of selected nanocomposites, as observed by SEM.
The effect of the addition of EG on the electrical resistivity of the composites shows some differences for SWCNT or MWCNT. Adding EG to the composite with lower SWCNT concentration increases the electrical resistivity by one order of magnitude while at higher SWCNT contents no major variation is observed. The composites with MWCNT however show a different trend, and the addition of EG at a lower concentration increased the electrical resistivity for all MWCNT contents; however, at a higher EG content, the resistivity decreased considerably. Chandrasekaran et al. report a decrease of electrical conductivity by two orders of magnitude for MWCNT/epoxy composites upon the incorporation of a small concentration of thermally reduced graphene oxide (TRGO) [14]. The authors relate this effect to the agglomeration of MWCNT at the surface of TRGO, stabilized by π–π interactions, leaving the insulating oxidized regions of TRGO free. In the present work, the EG presents thicker flakes as compared to TRGO, with a smooth surface (Figure 3 and Figure 5) and a perfect graphitic structure as demonstrated by its Raman spectrum (Figure 6), thus contributing to the electrical conductivity of the composite. Adsorption of nanotubes at the EG surface could be detrimental to the electrical conductivity near the percolation threshold, if it leads to a critical decrease of the bulk nanotube concentration. Interestingly, SWCNT seem to be more prone than MWCNT to adsorb at the EG surface, as illustrated in Figure 5, and the only composite containing SWCNT showing a resistivity increase after EG addition was the one with 0.2 wt.% SWCNT, the composition closer to the percolation threshold.
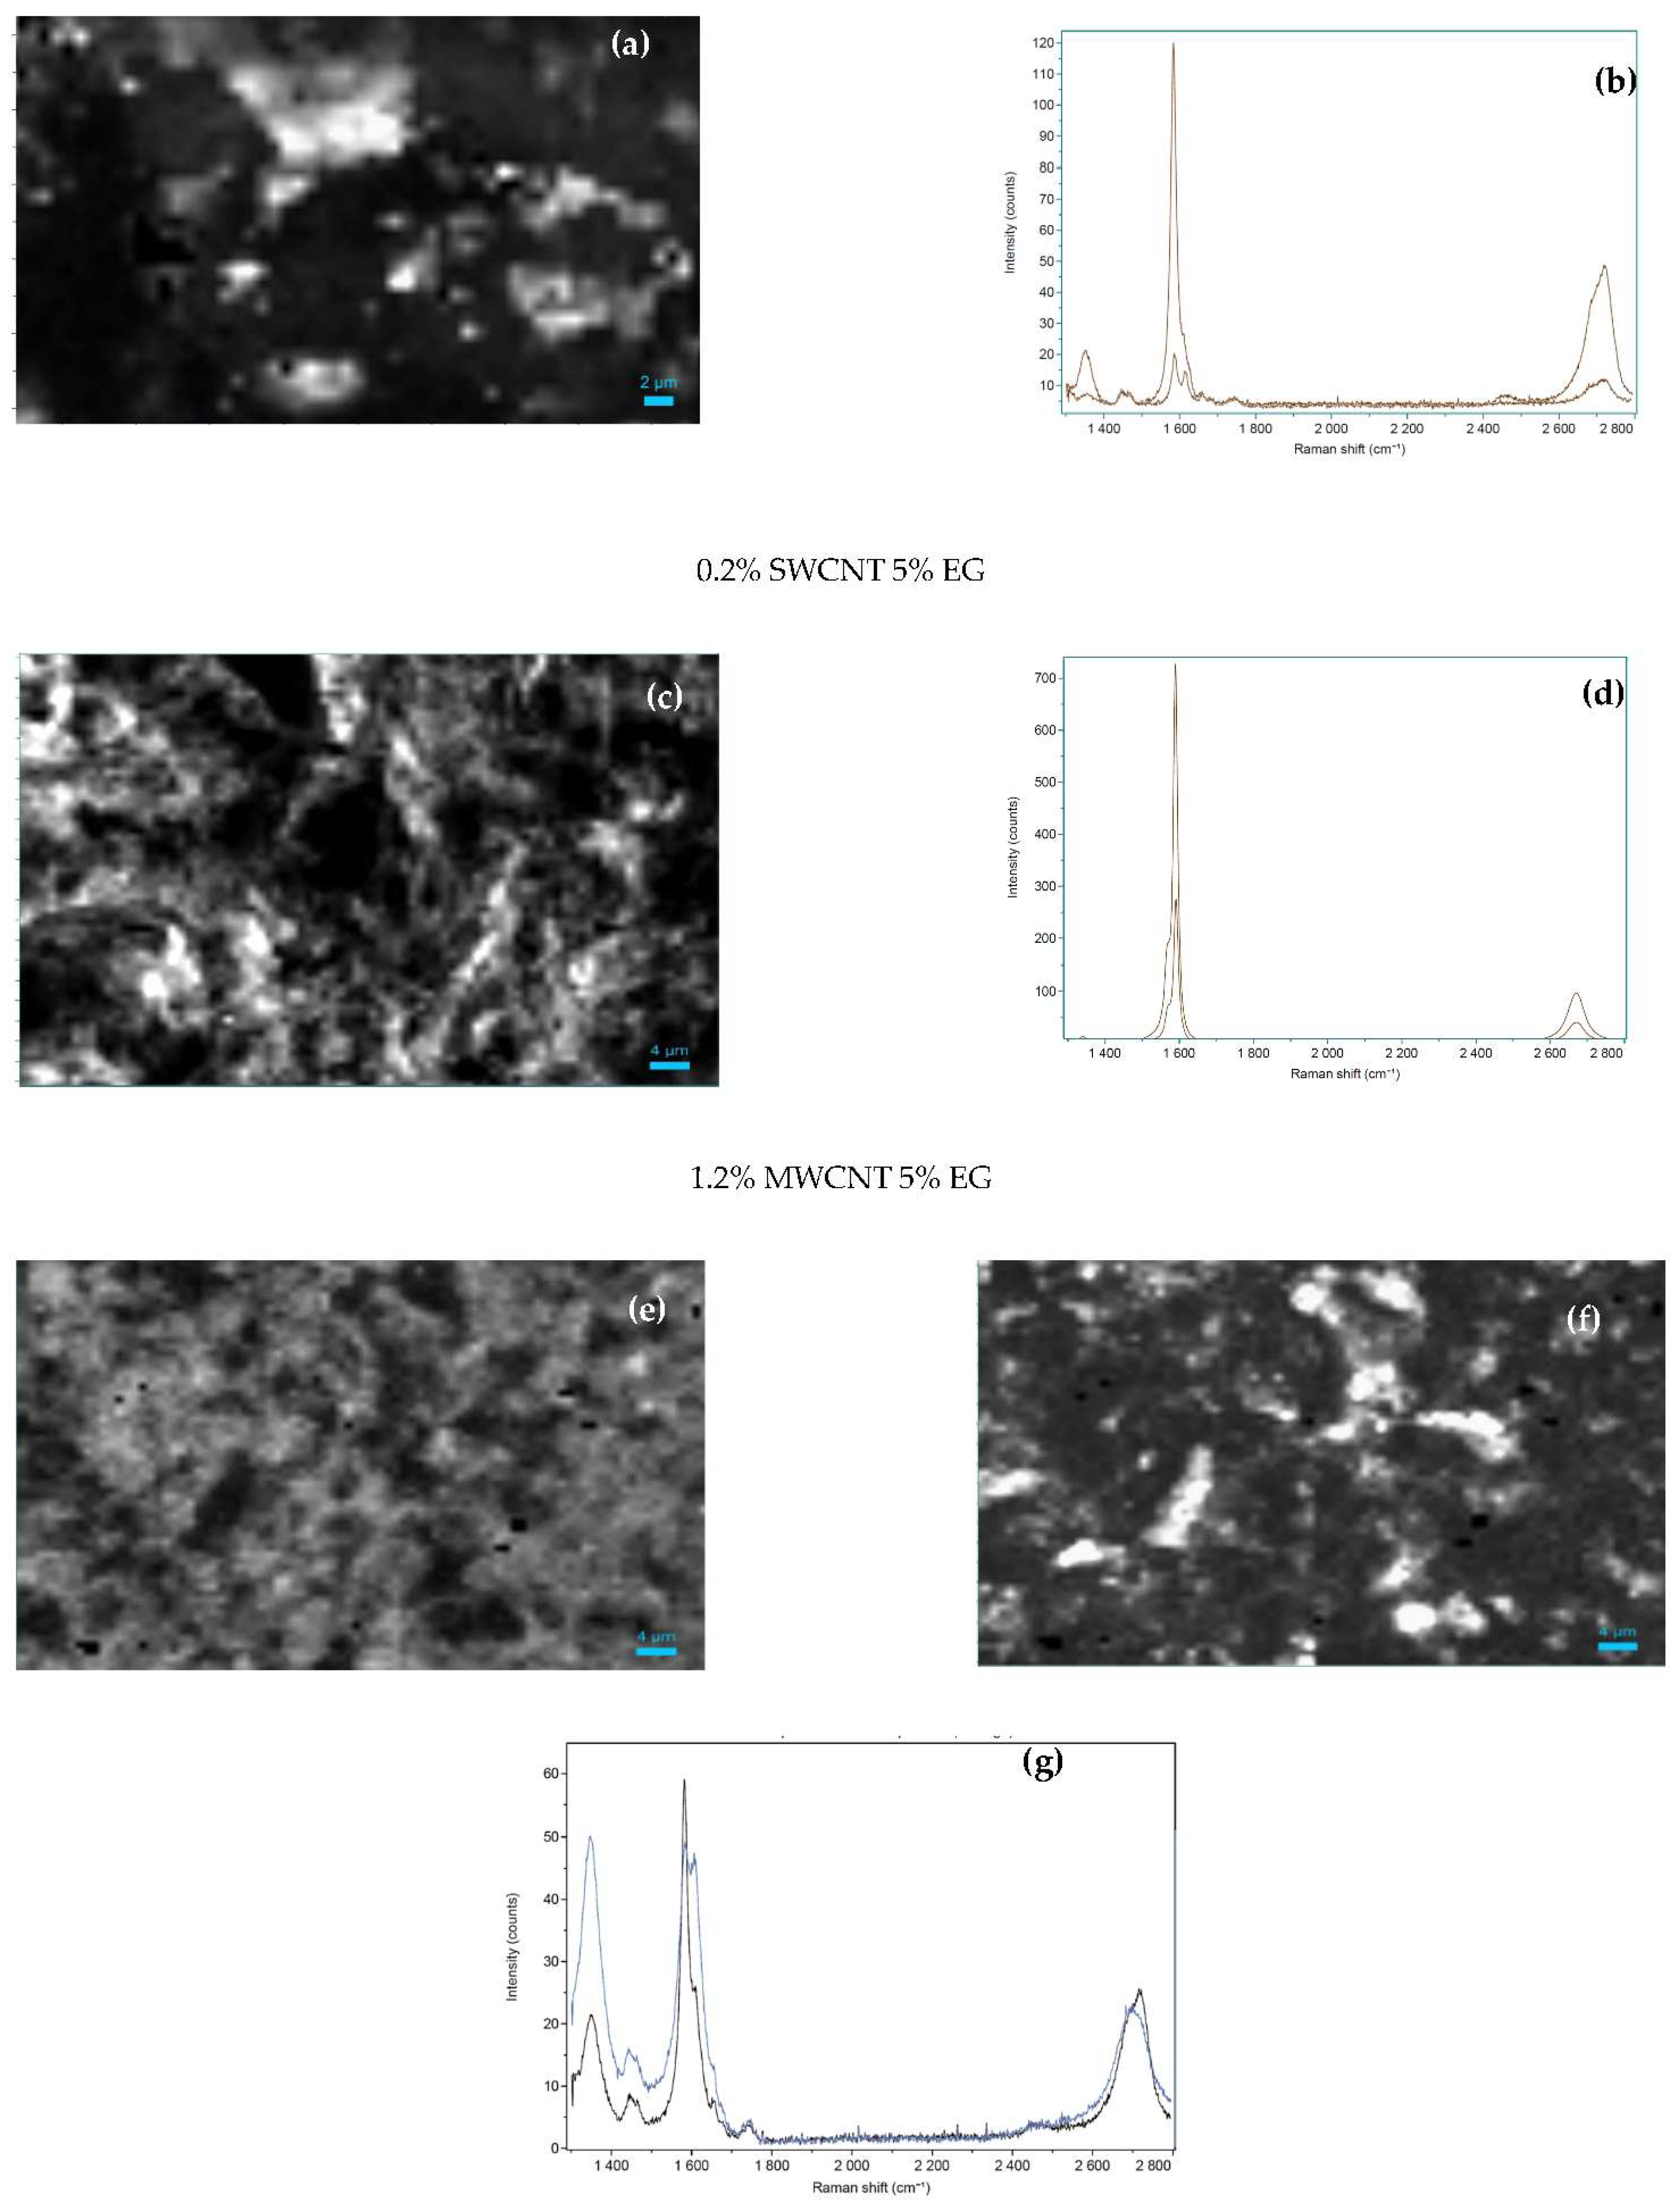
The homogeneous distribution of the carbon nanomaterials throughout the composites was assessed by Raman spectroscopy mapping. The presence of the characteristic Raman bands of SWCNT, MWCNT and EG was monitored and the maps showing their spatial distribution are represented in Figure 6. Raman mapping shows that the carbon fillers are well distributed within the composites. The intensity of the G band, common to all the fillers, is observed at all acquisition positions. The G band intensity distribution of the composite with 5 wt.% of EG is presented in Figure 6a), depicting the higher intensity areas in white and the lower intensity in black. The Raman spectra of the regions presenting higher and lower intensity are shown in Figure 6b) showing a ratio of 1:6 in the G band intensity and a similar ratio for the 2D band. The spectrum corresponding to the lower intensity region of the G peak shows the presence of the Raman signal of the epoxy matrix (see Figure S3) around 1450 cm−1 and 1610 cm−1. Figure 6c) presents the G band intensity distribution measured for the composite with 0.2% SWCNT and 5 wt.% of EG (higher intensity in white and lower intensity in black). The Raman spectra corresponding to the regions of higher and lower intensities of the G band are represented in Figure 6d); both spectra are characteristic of SWCNT, presenting an intensity ratio (regions of higher:lower intensities) of 2:1. SWCNT’s present such an intense Raman spectrum, compared to that of EG or MWCNT, that only the Raman signal of SWCNT is observed when mixed composites are analyzed. Figure 6e) presents the D band intensity distribution of the composite with 1.2 wt.% of MWCNT and 5 wt.% EG. Here, the spectra intensities of MWCNT and EG are comparable (Figure 6g) showing similar G band intensity for both fillers, but higher D band intensity for the MWCNT (blue line in Figure 6f) as compared to EG. Thus, the lower D band intensity (darker regions) correspond to the presence of EG. Figure 6f) illustrates the G to D ratio distribution, where the intensity ratio of the G to D bands is close to one for MWCNT and greater than one for EG. The Raman spectra corresponding to the regions of higher intensity ratio (white color—EG) and lower intensity ratio (black color—MWCNT) of the G to D bands are presented in Figure 6g) and in both regions the signal of the epoxy matrix can be observed.
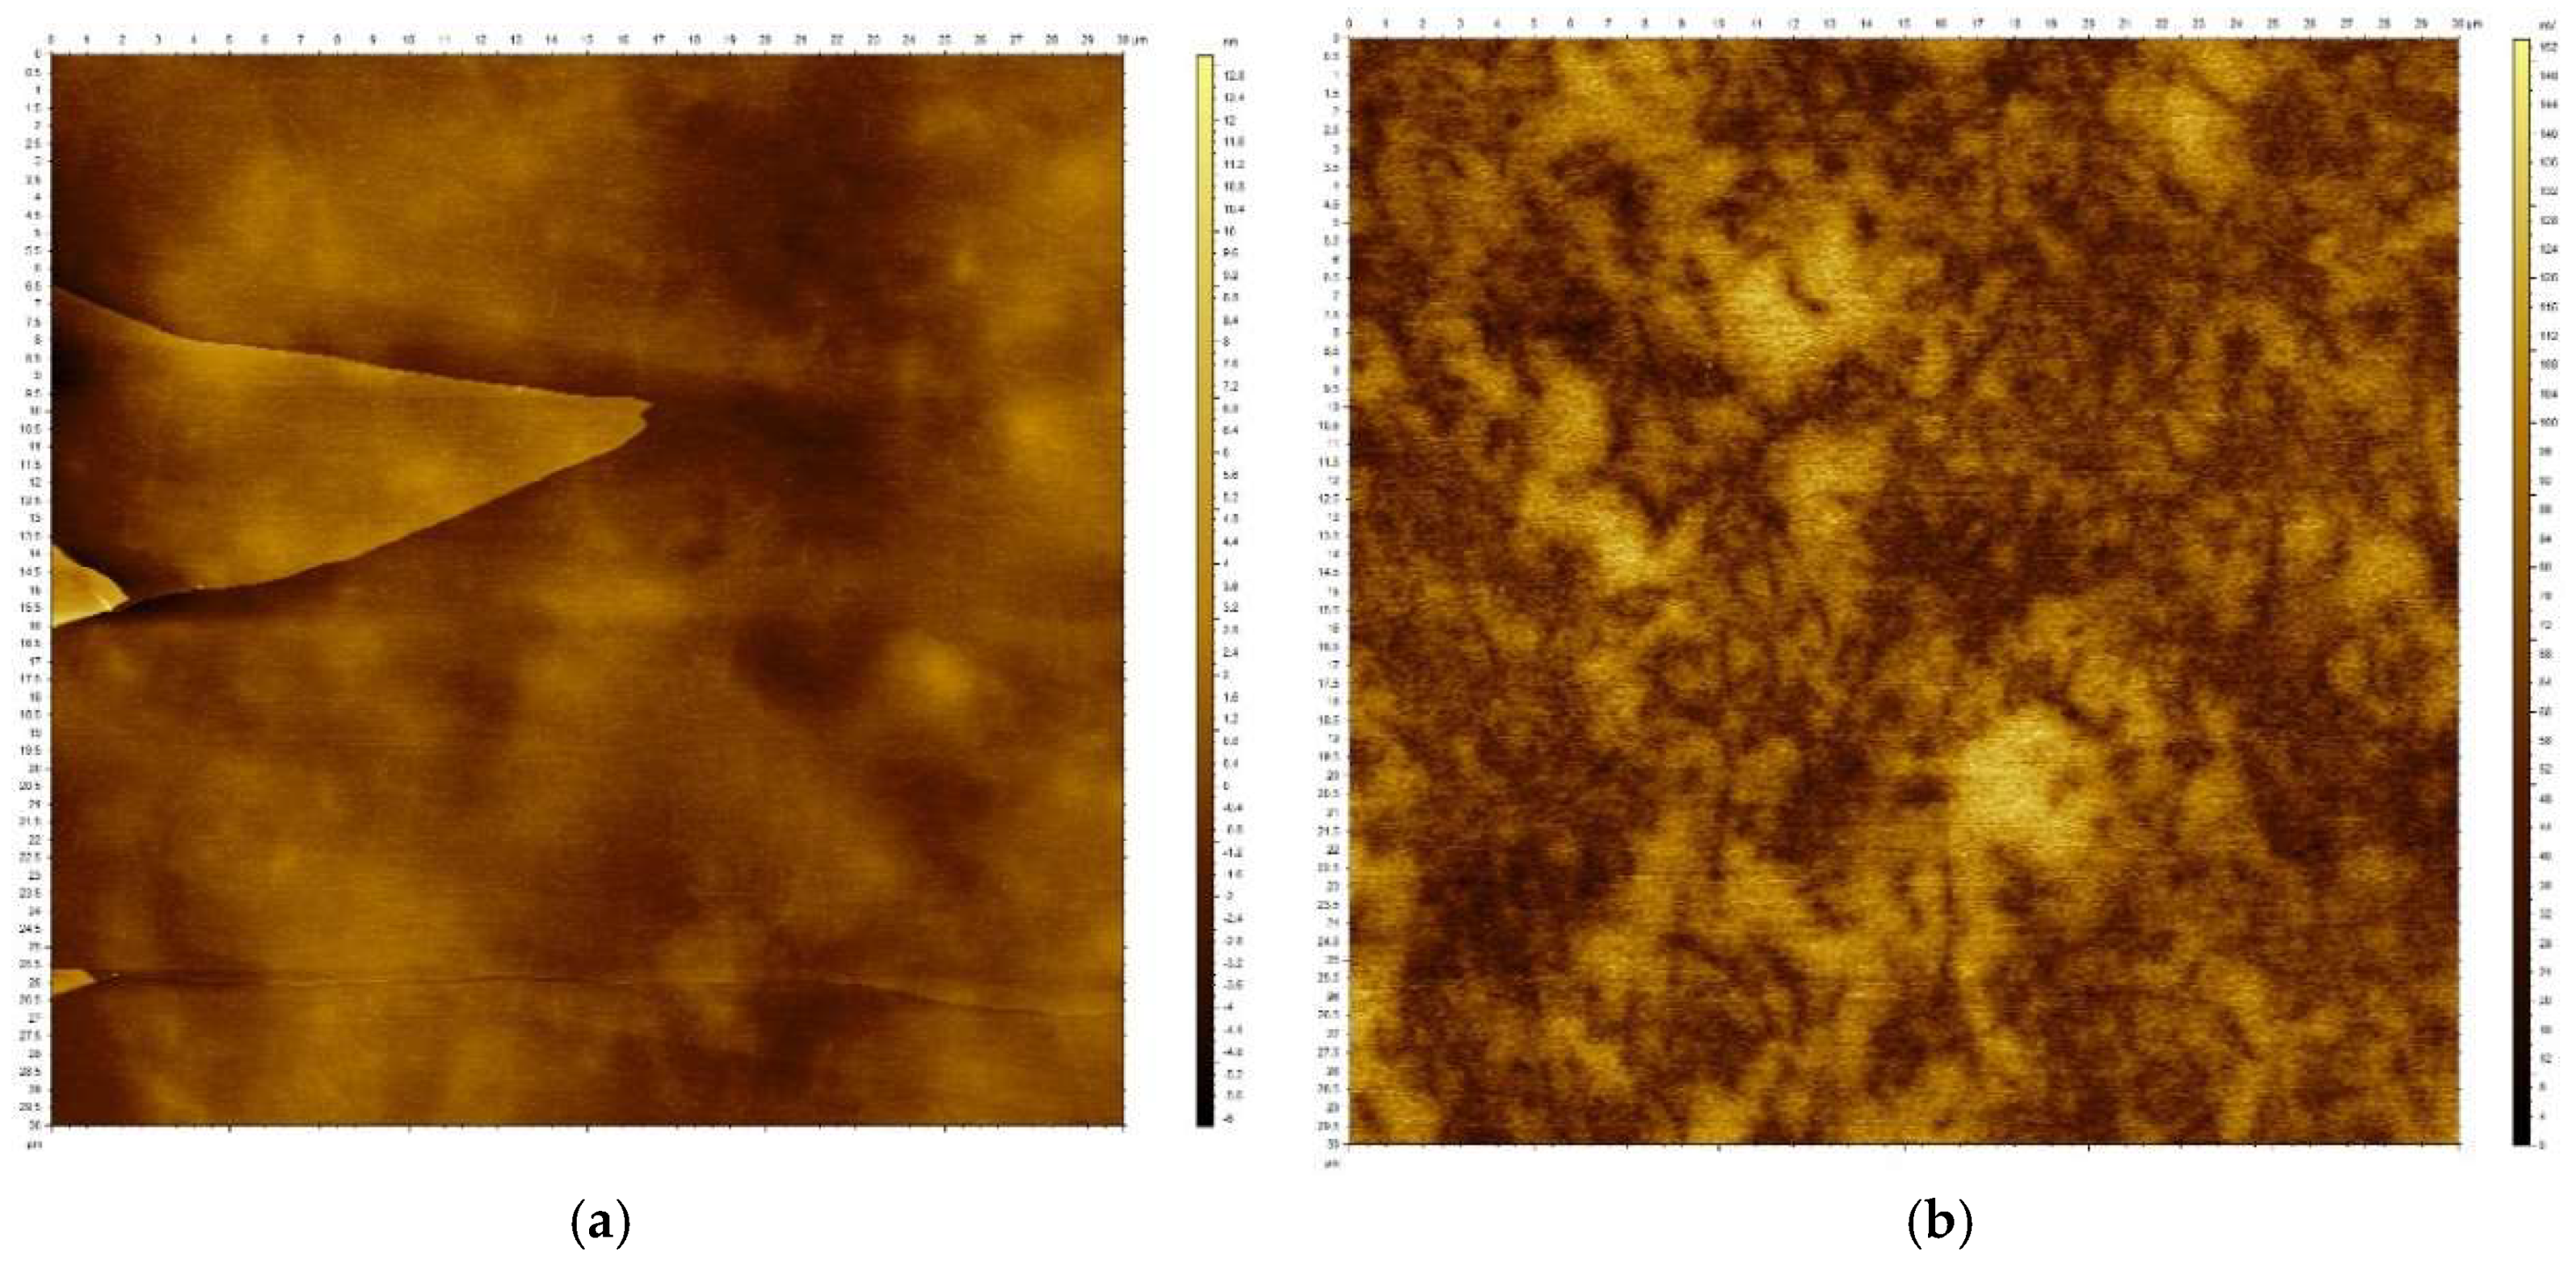
The surface morphology and surface potential mapping were analyzed by AFM. Comparison of the images obtained by topographic and HD-KFM modes provide a clear view of the distribution of the conductive carbon nanomaterials and their morphology, distinguishing CNT and EG. Due to the preparation process, the surfaces analyzed are flat as the composite mimics the flatness of the freshly cleaved mica. However, it also reproduces the presence of any step or atomic terrace on the fresh mica surface, which will remain imprinted on the sample (see Figure S4). Images on Figure 7a,b correspond to the topography and surface potential (SP) of a sample of epoxy resin and SWCNT at 1.2 wt.%. Figure 7a presents a topographic feature imprinted by the preparation process but does not reveal the presence or distribution of the SWCNT, as they are embedded in the epoxy resin. The high-resolution SP image obtained with HD-KFM, depicted in Figure 7b, shows the distribution of the SWCNT in the epoxy. The SP is an electrostatic interaction with long-range components, allowing the presence of the SWCNT inside the epoxy matrix to be protected. Dark regions in the color scale correspond to the presence of the SWCNT while the light colored regions correspond to the epoxy matrix. Notice that there is no contrast related to the atomic step terrace seen in Figure 7a as it is only a topographic feature. Figure 7b shows that the SWCNT forms a uniform network across the whole surface.
Figure 7c,d show both topographic and SP images corresponding to a nanocomposite of epoxy and 5 wt.% of EG prepared with a freshly cleaved mica substrate. Figure 7c shows a less smooth topography compared to SWCNT composite, with the presence of clusters of different sizes. These clusters correspond to EG flake agglomerates that bulge off the surface. The tendency of EG to form agglomerates is observed in Figure 2 for the raw material, and in Figure 6a for the Raman mapping of the EG/epoxy composite. The EG flakes present a lateral size of approximately 9.5 μm and their agglomerates may reach several tens of μm which, associated with the small thickness of the samples prepared for AFM and HD-KFM analysis, may force their protrusion from the surface.

3.2. Rheological Characterization

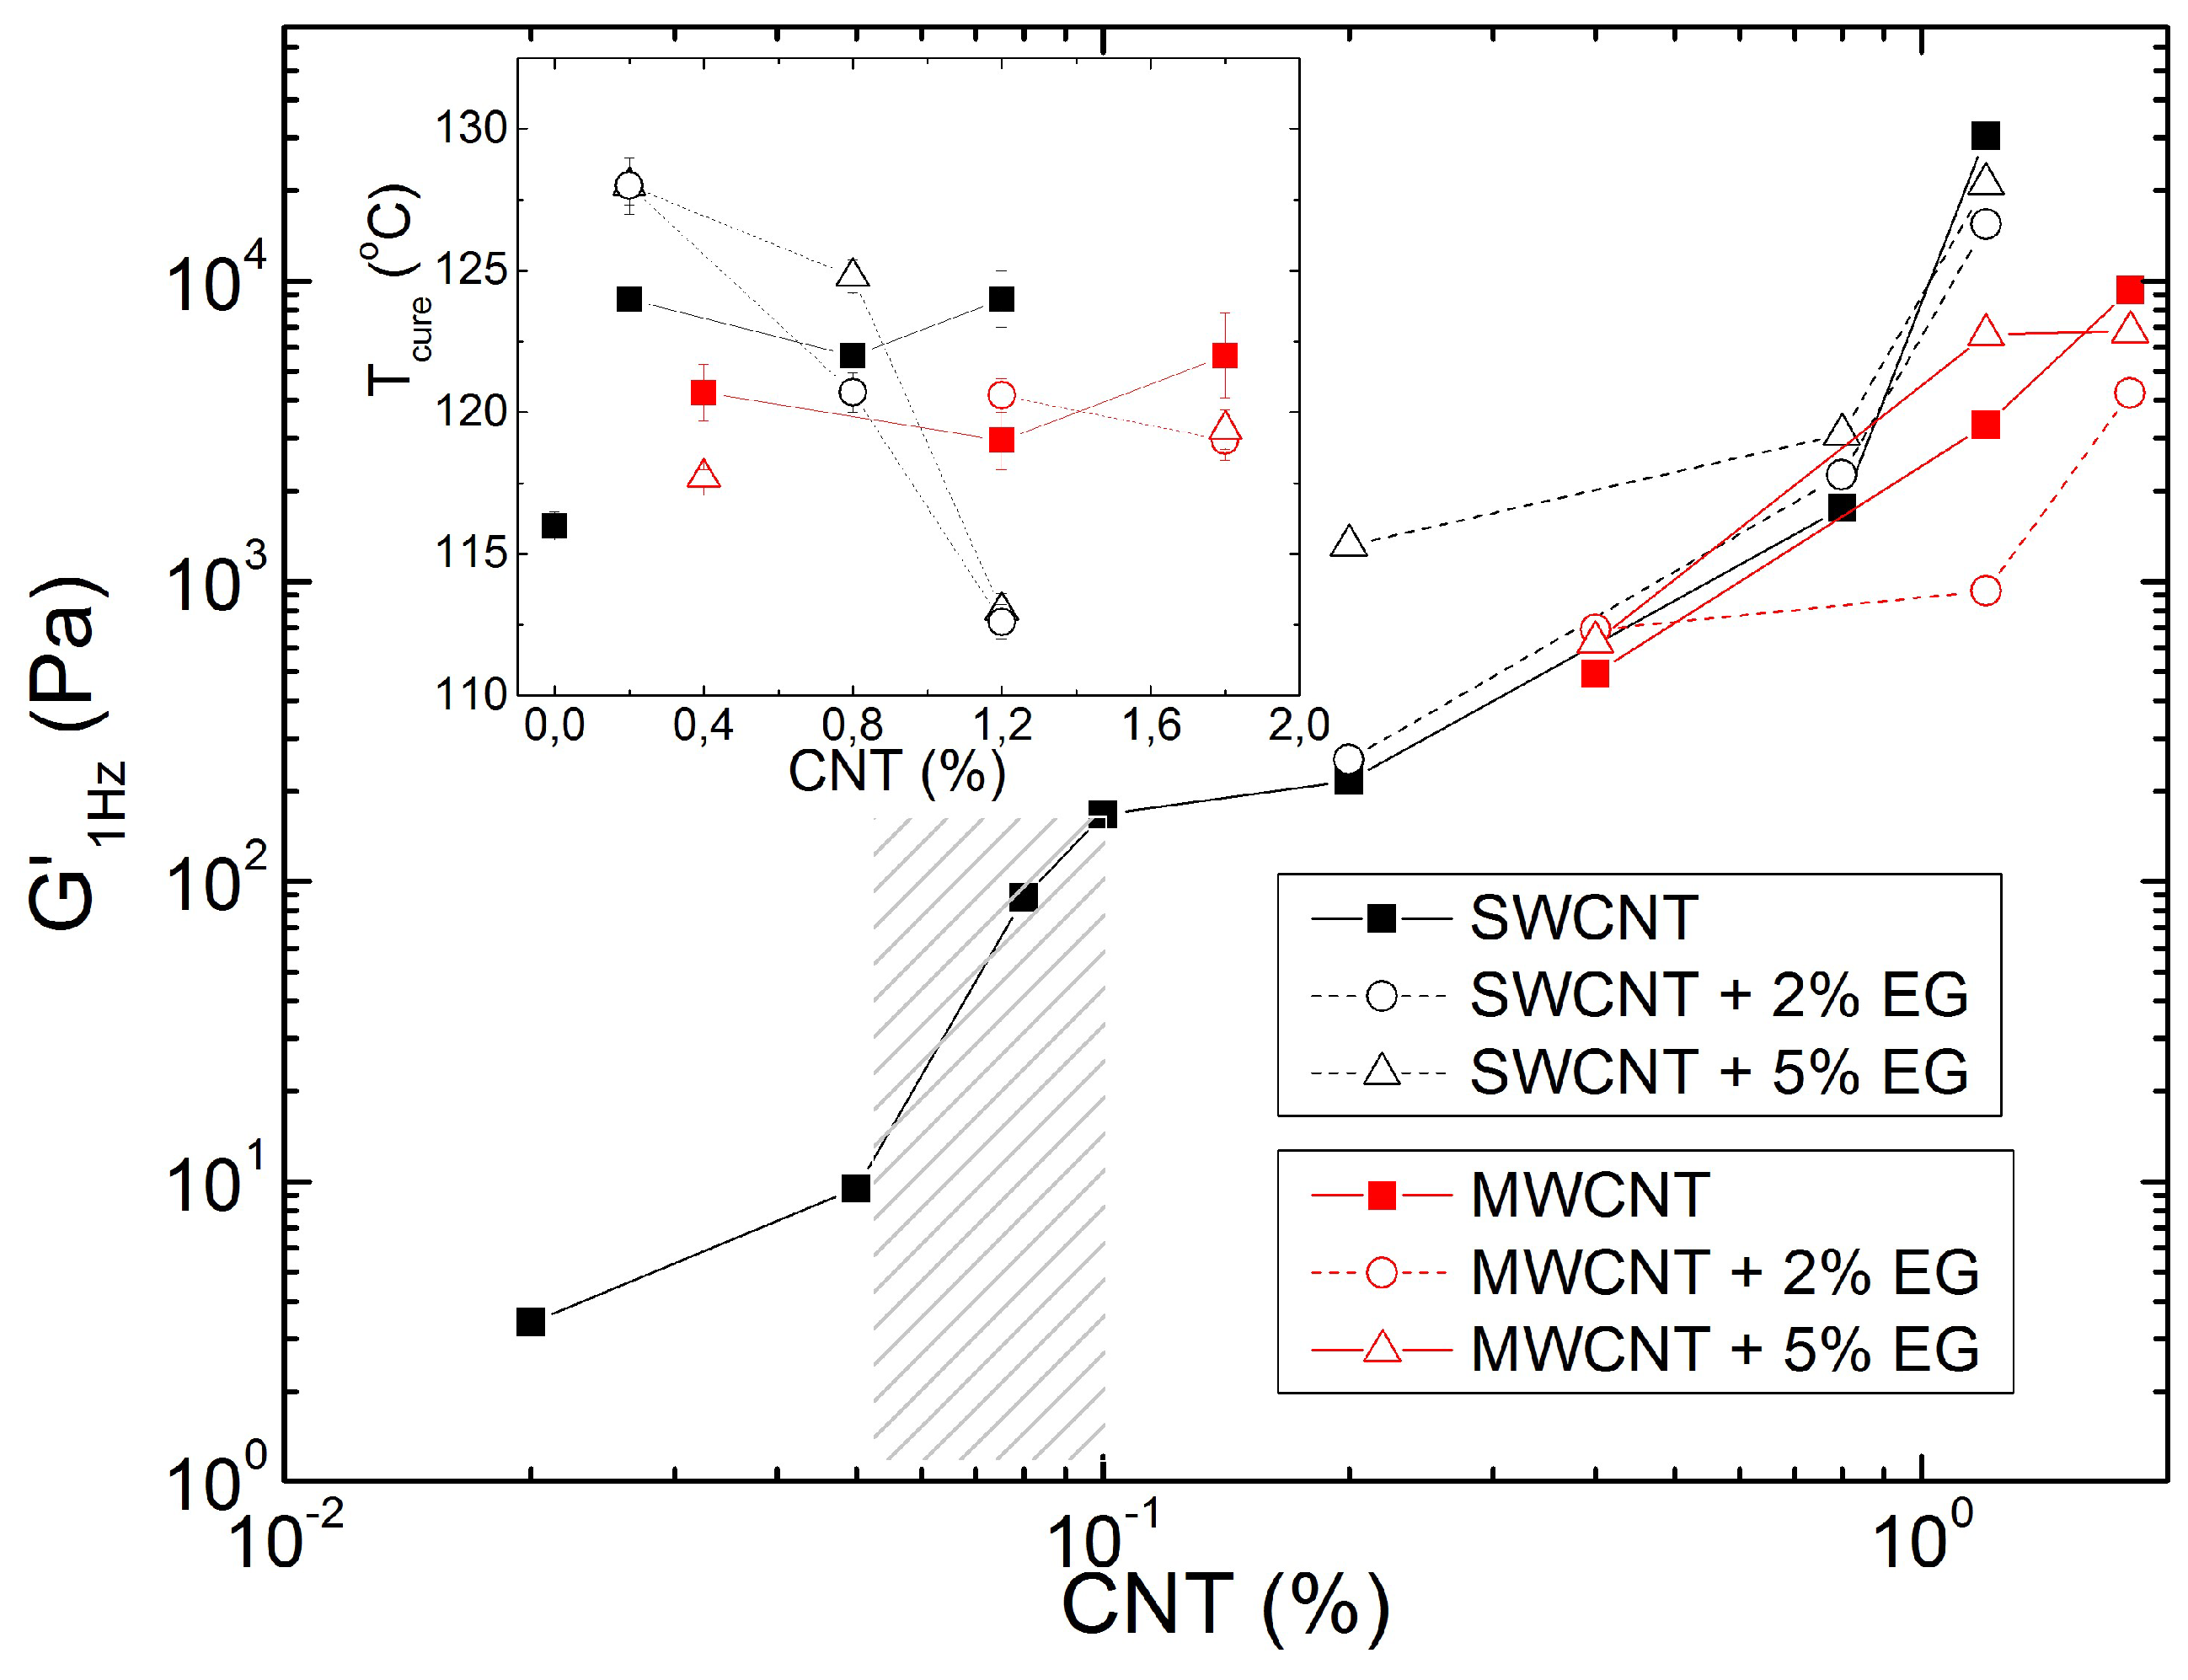
Figure 8 presents the increase in the elastic shear modulus G1Hz measured at 1 Hz during the record of the mechanical spectra (see Figure 1c), in dependence on the carbon nanotubes (SWCNT or MWCNT) content added to the resin. A jump in G1Hz occurs between 0.05 and 0.1 wt.% of SWCNT, which coincides with the emergence of an elastic plateau at lower frequencies in the mechanical spectrum. This plateau is reported in Figure 1c) for 0.1 wt.% SWCNT, whereas it could not be detected at lower SWCNT contents. Thus, beyond 0.1 wt.% SWCNT, the composites are essentially viscoelastic solids as a percolated network of carbon nanotubes transfers the stress throughout the composite. In the percolated regime, G1Hz first increases smoothly with SWCNT concentration, and then again jumps to larger values when more SWCNT is added. In contrast to this, the temperature Tcure for the onset of thermal curing, taken as the temperature at which the loss modulus G″ departs from Arrhenius behavior (see inset in Figure 1d), is not affected by the addition of SWCNT beyond the concentration for reaching percolation. The temperatures Tcure reported in the inset to Figure 8 for the resins prepared with MWCNT in the same range of carbon nanotube concentration follow the same trend: though Tcure is significantly larger than the curing temperature measured with the sole matrix, the addition of more carbon nanotubes does not change Tcure. Note also that the G1Hz dependence with the carbon nanotube concentration is larger in the case of SWCNT when compared with MWCNT. This suggests that the SWCNT and MWCNT networks show structural differences. Neglecting any effect associated with differences in the level of carbon nanotube dispersion, and assuming a fractal network with weak links between the flocs of particles building up the network [15], which is supported by the strain softening reported in Figure 1d and by the fact that more concentrated samples require a larger strain to yield, one may infer from the data in Figure 8 that the SWCNT network is more open than the MWCNT network.
As a result, the addition of EG affects the carbon nanotube networks in different ways. Whereas the addition of 5 wt.% EG gives a 10-fold increase in the elasticity of the SWCNT network at lower nanotube concentration, the corresponding addition of EG does not significantly improve the MWCNT network elasticity. This reinforcing trend is reverted for resins prepared with the largest content in carbon nanotubes, as the elasticity of the corresponding networks is reduced upon addition of EG. Thus, large EG amounts are detrimental to the networking of carbon nanotubes and no synergism seems to occur between these two types of nanomaterials in the set of studied samples. The structural differences in SWCNT and MWCNT networks are also mirrored in the differences observed for Tcure upon EG addition. The data in the inset to Figure 8 show that, whereas the addition of EG does not change Tcure significantly, this temperature is shifted by nearly 5 °C upon EG addition to resins prepared with smaller SWCNT amount. However, for resins containing more SWCNT, Tcure drops dramatically, as curing occurs 12 °C lower for the sample prepared with 1.2 wt.% SWCNT. Note that for both CNT, the loss of network connectivity upon addition of 5 wt.% EG relates to a drop in Tcure.

3.3. Thermal Conductivity of the Nanocomposites

The technological requirements of electronic applications concern not only electrical conductivity but also thermal conductivity. High thermal conductivity helps dissipate the heat generated by current, avoiding heat accumulation and improving the ECAs current carrying capacity.
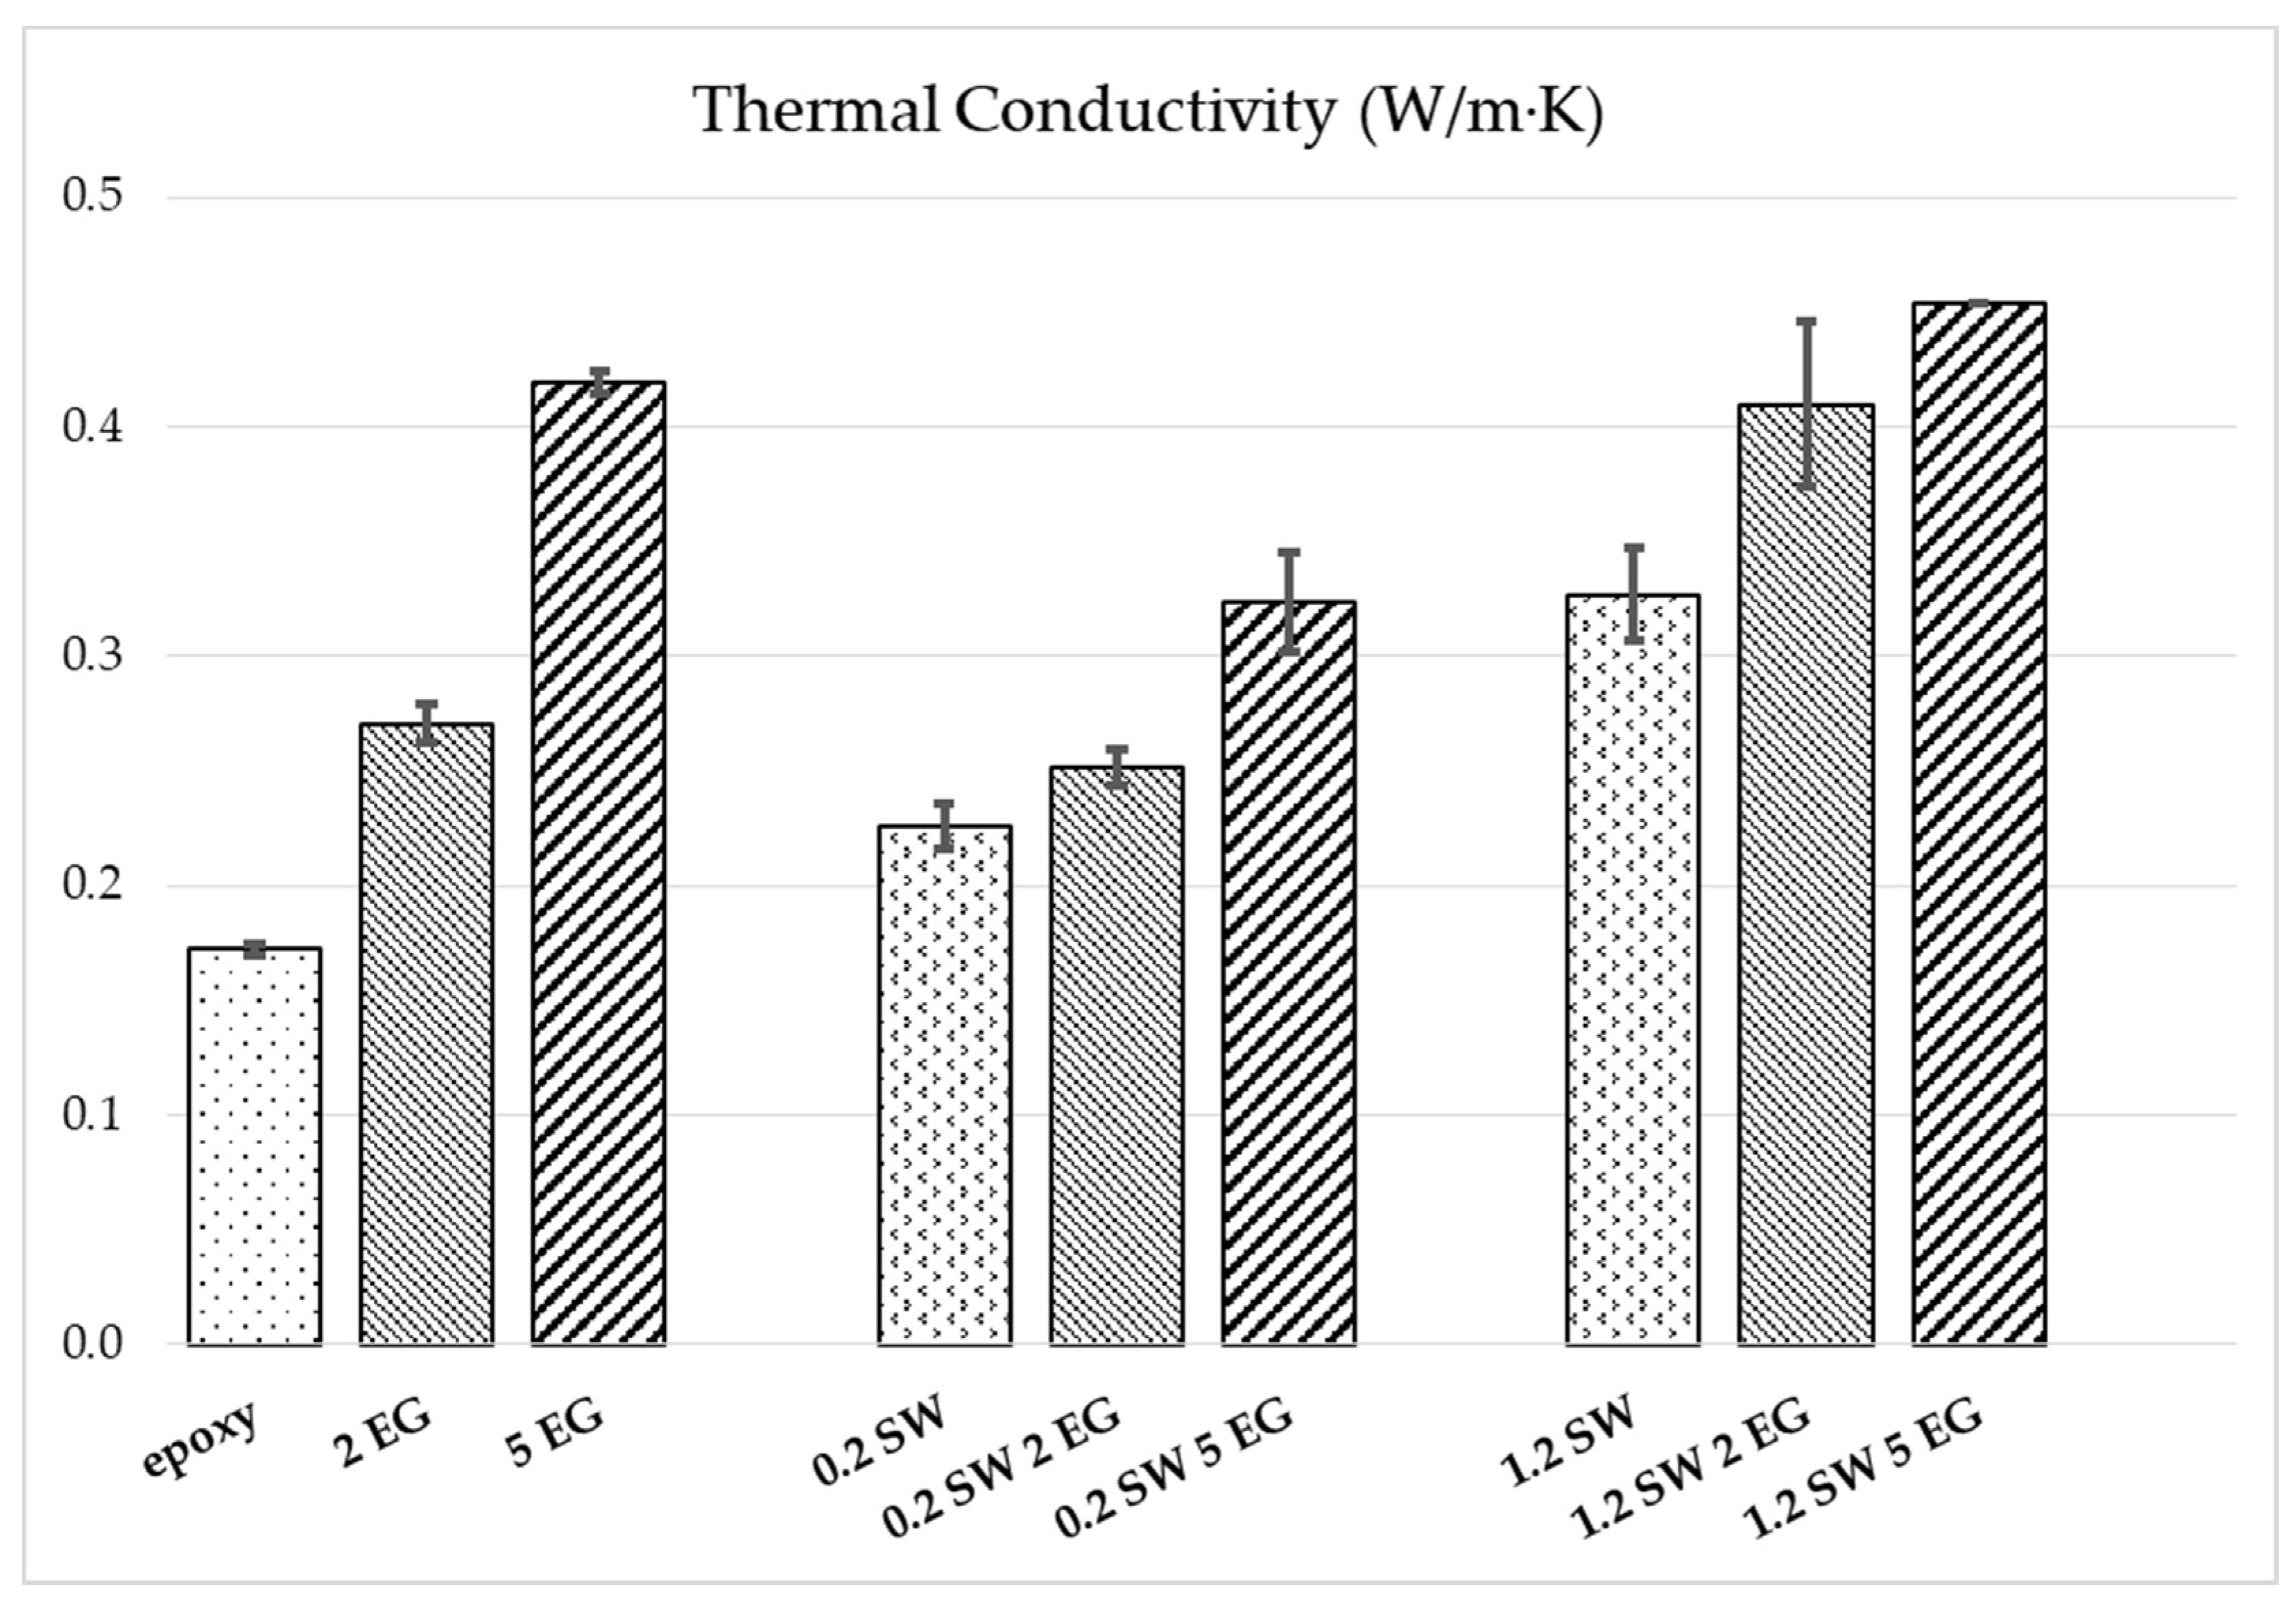
The effect of the addition of carbon nanomaterials to the epoxy resin on its thermal conductivity was evaluated for composites with SWCNT, EG and hybrid compositions. The results are presented in Figure 9 and Table S3 in Supplementary Information.
The relatively low thermal conductivity of the epoxy matrix (0.172 W/m∙K) is significantly enhanced when adding carbon-based nanomaterials. The addition of only 0.2 wt.% SWCNT enhances the conductivity by 31% and 1.2 wt.% by 90%. At the studied contents of 2 and 5 wt.% EG, a high increase in the composites’ thermal conductivity of 58% and 144%, respectively, is observed. The contribution of EG is reflected in the mixed filler systems at both SWCNT concentrations; however, higher absolute conductivities are achieved at 1.2 wt.% SWCNT content. Here, 5 wt.% EG addition leads to an improvement by 39% compared to epoxy/1.2 wt.% SWCNT. The highest value of 0.45 W/m∙K is achieved at 1.2 wt.% SWCNT combined with 5 wt.% EG, which represents an increase by 163% compared to the pure epoxy. However, the compositions prepared with the lower SWCNT content and EG present a lower thermal conductivity than the composites with the same composition of EG only. Apparently, the addition of a small concentration of SWCNTs may hinder the good connection of the EG nanoplatelets, which is needed for the phonon transport responsible for thermal conduction.

3.4. Deposition of the Nanocomposite Adhesive on a Printed Circuit Board

Preliminary evaluation of the printing ability of carbon-filled epoxy adhesives was carried out on prototype boards. This procedure allowed a first assessment of the adhesive–PCB interconnection, while granting direct measurement of bulk conductivity through measuring points on the PCB.
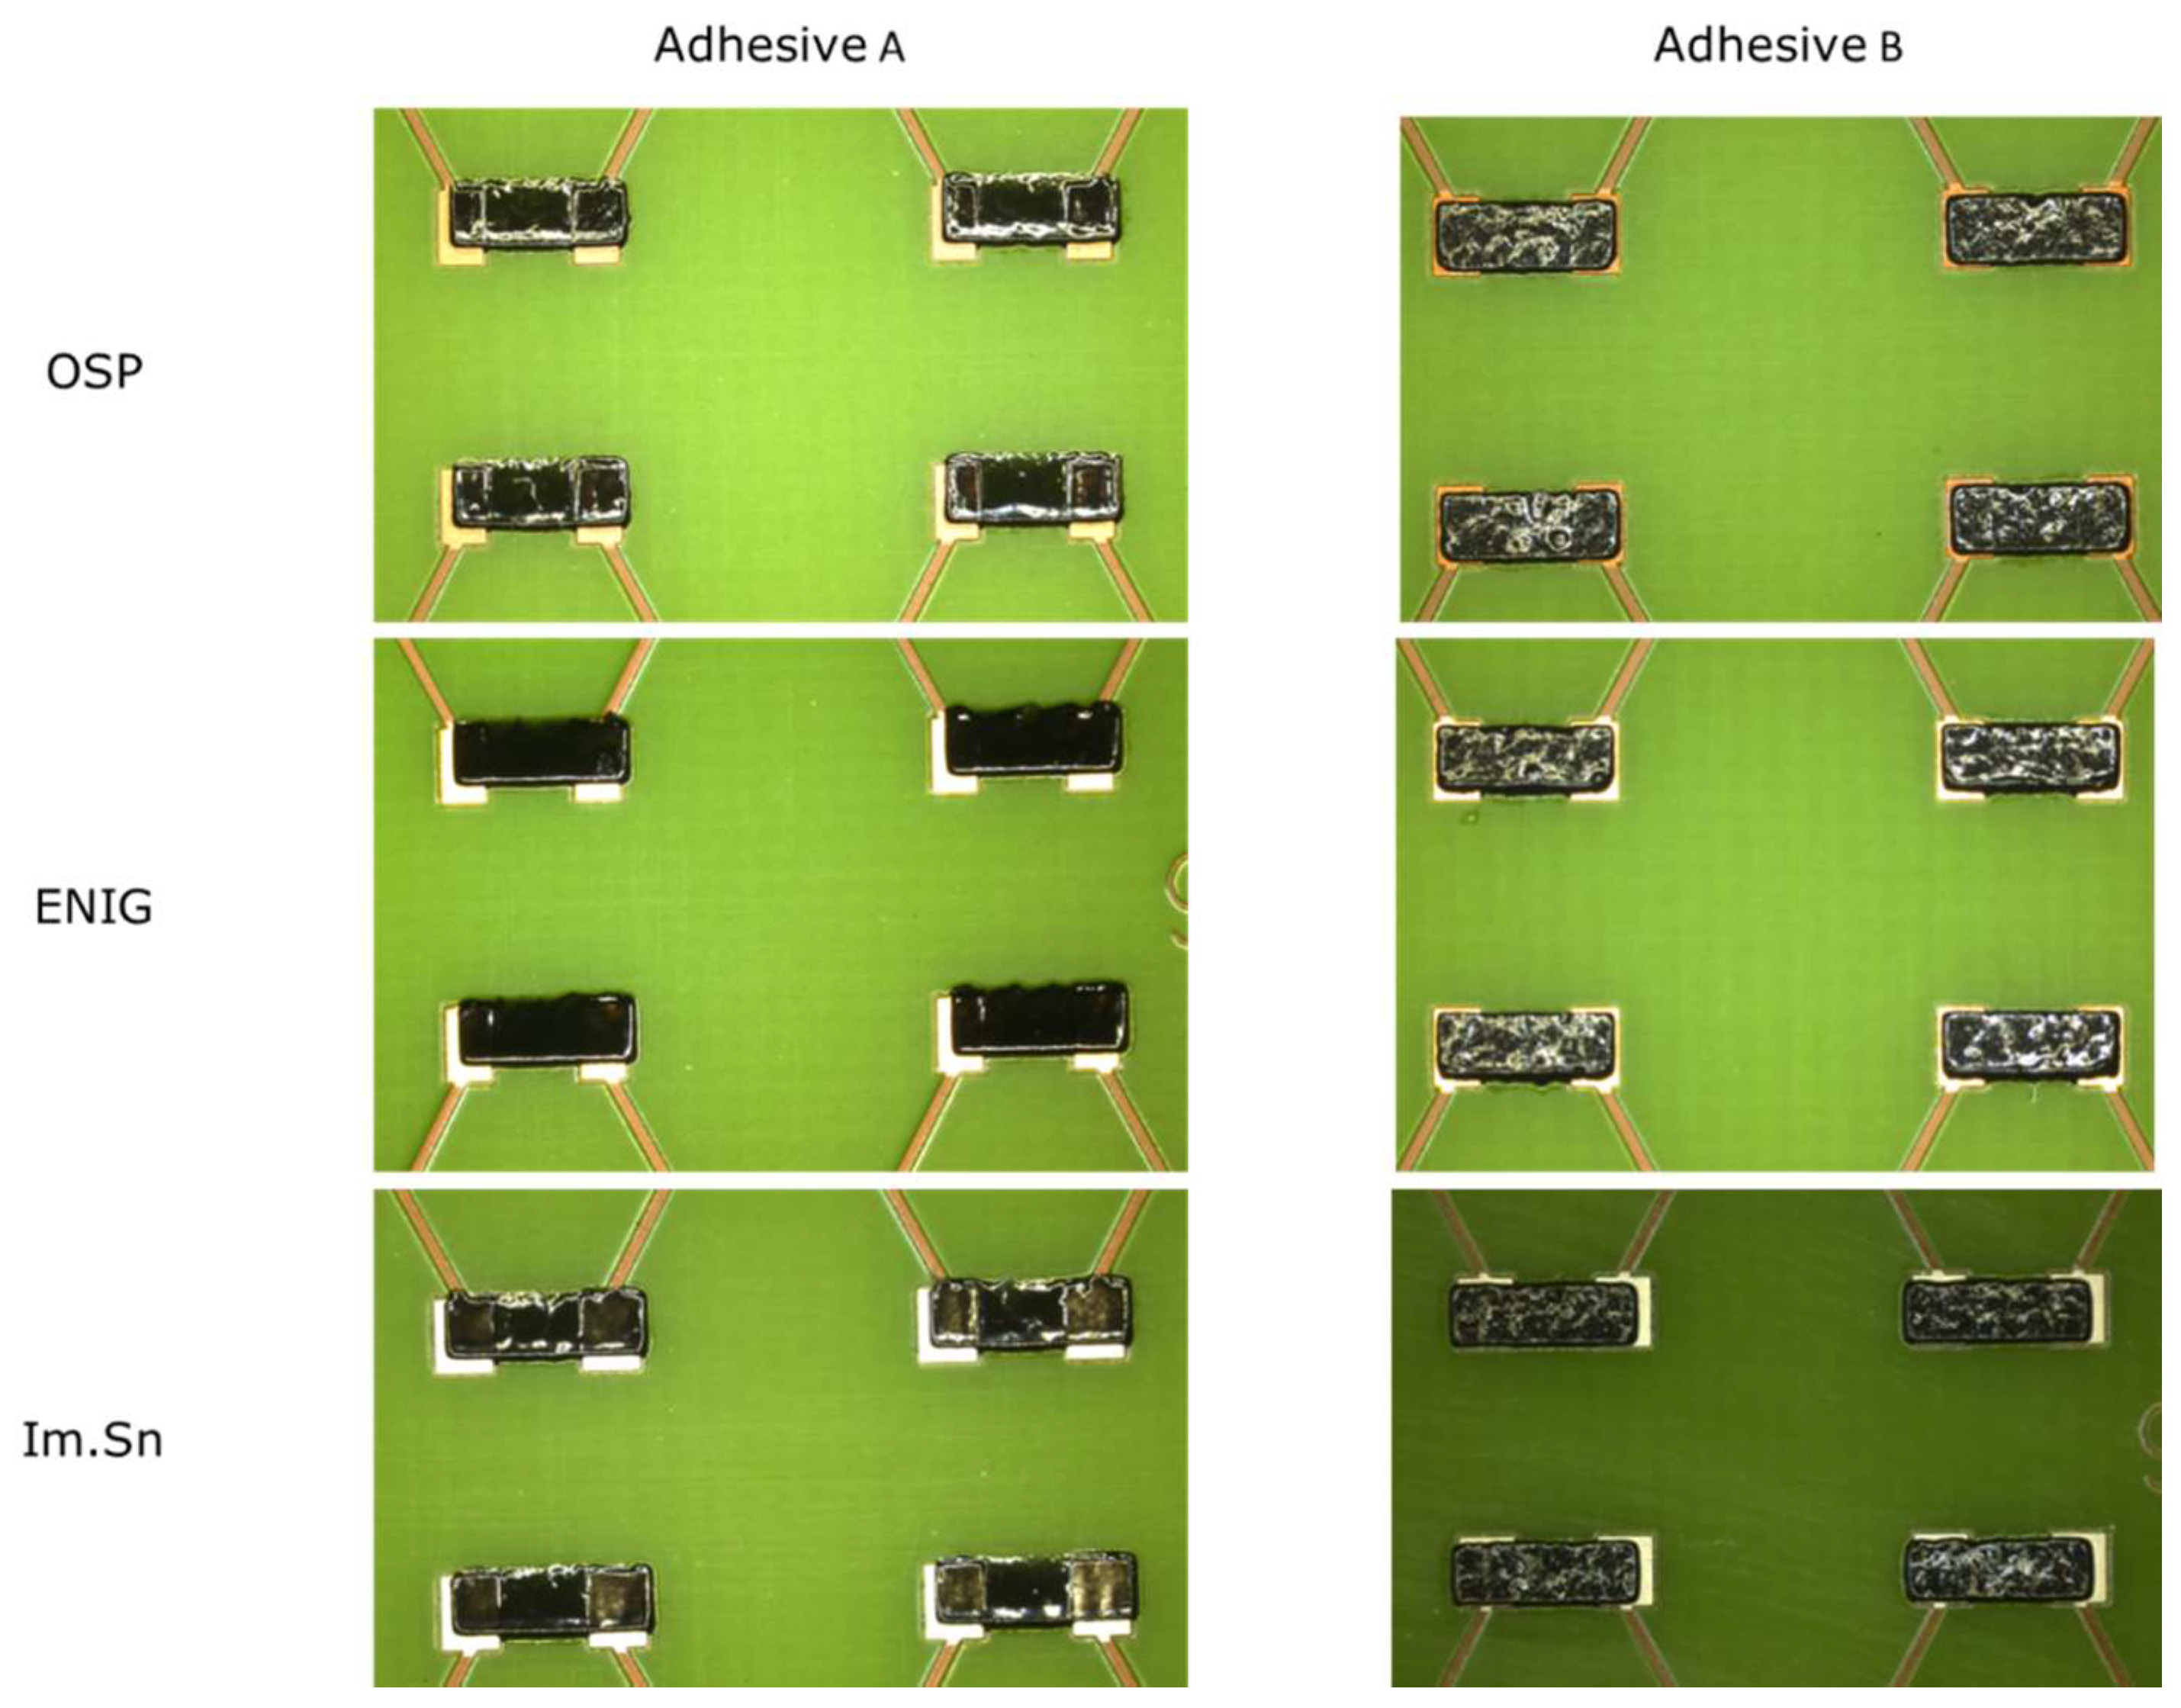
The printing tests were performed using two composites: adhesive A, prepared by dilution of a SWCNT/epoxy masterbatch to form a composite containing approximately 1 wt.% SWCNT, and adhesive B, prepared by direct mixing of 1 wt.% SWCNT in the epoxy. The adhesive prints obtained on the three different boards kept the regular dimensions of the stencil openings without evidence of spreading, as shown in Figure 10. Minor printing faults may be due to the manual stencil–PCB alignment.
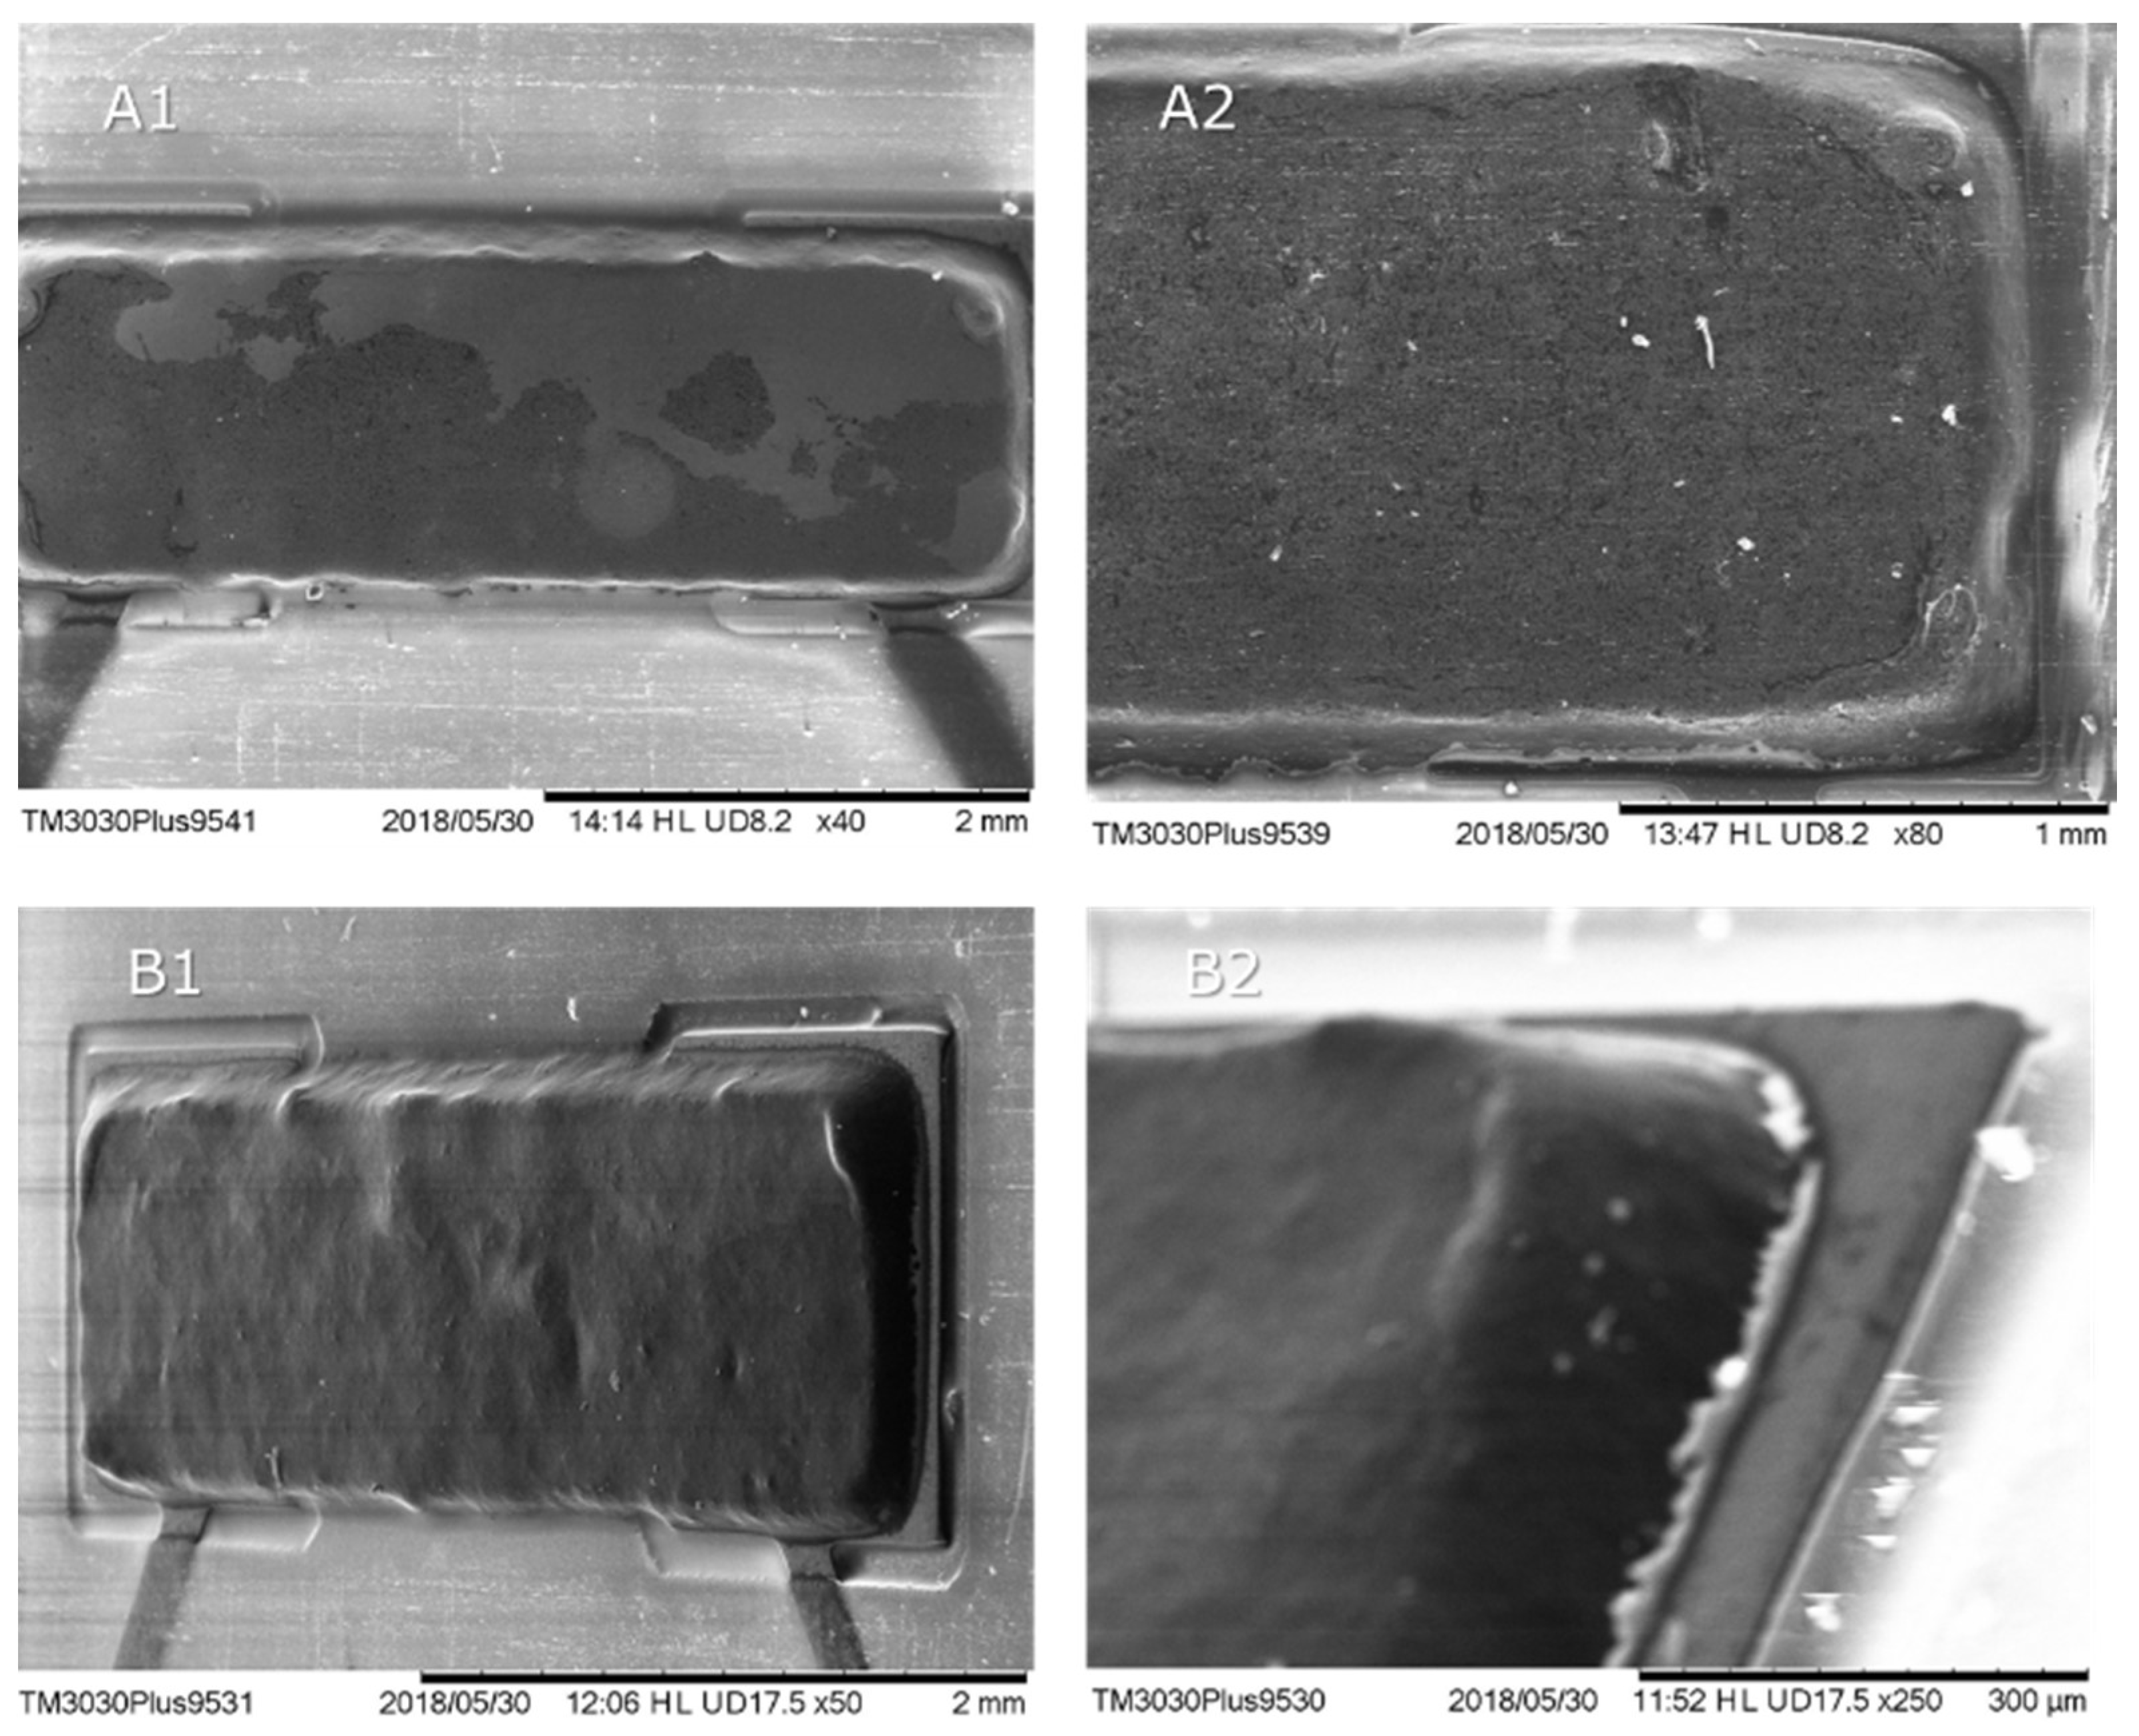
Adhesive A depicts a glassy, polished surface, whereas adhesive B shows some surface roughness. SEM images illustrating the deposited pads of adhesives A and B are presented in Figure 11, depicting the regular deposition of both adhesives.
Electrical conductivity measurements were performed showing that all the deposited pads presented electrical connectivity. The resistance (two-wire method) between the two most distant measure points (measuring two adhesive joints in series) was measured on all 12 series of adhesive joints of each PCB. Resistance values obtained were higher than expected accounting for the electrical conductivity of the composites produced. However, the adhesives applied could not be degasified before application, which may considerably affect the electrical conductivity. Table 2 presents the measured resistance values for the printed OSP and Im.Sn boards (two boards of each surface finish were measured). Both adhesives showed comparable average resistance values.
Finally, the electrical characterization of the adhesive bridges was performed on 30-min continuous tests. The Keithley 2450 Sourcemeter was set to supply a continuous voltage of 16 V, similar to the electrical rating for electronic components in automotive electronics. The resulting I and R plots are shown in Figure 12a. The test was carried out on the OSP board printed with adhesive B, demonstrating a stable resistance after the first 7 min of testing. This may be attributed to the heat dissipation promoted by the high composite resistance, at the initial test stage, after which the temperature stabilization lead to constant conductivity values. Cycle sweeps performed on the OSP board printed with adhesive B, at different times up to 30 min, are presented in Figure 10 (right) and all show the same behavior.

3.5. Assessment of the Shelf Life of the Nanocomposite Adhesive

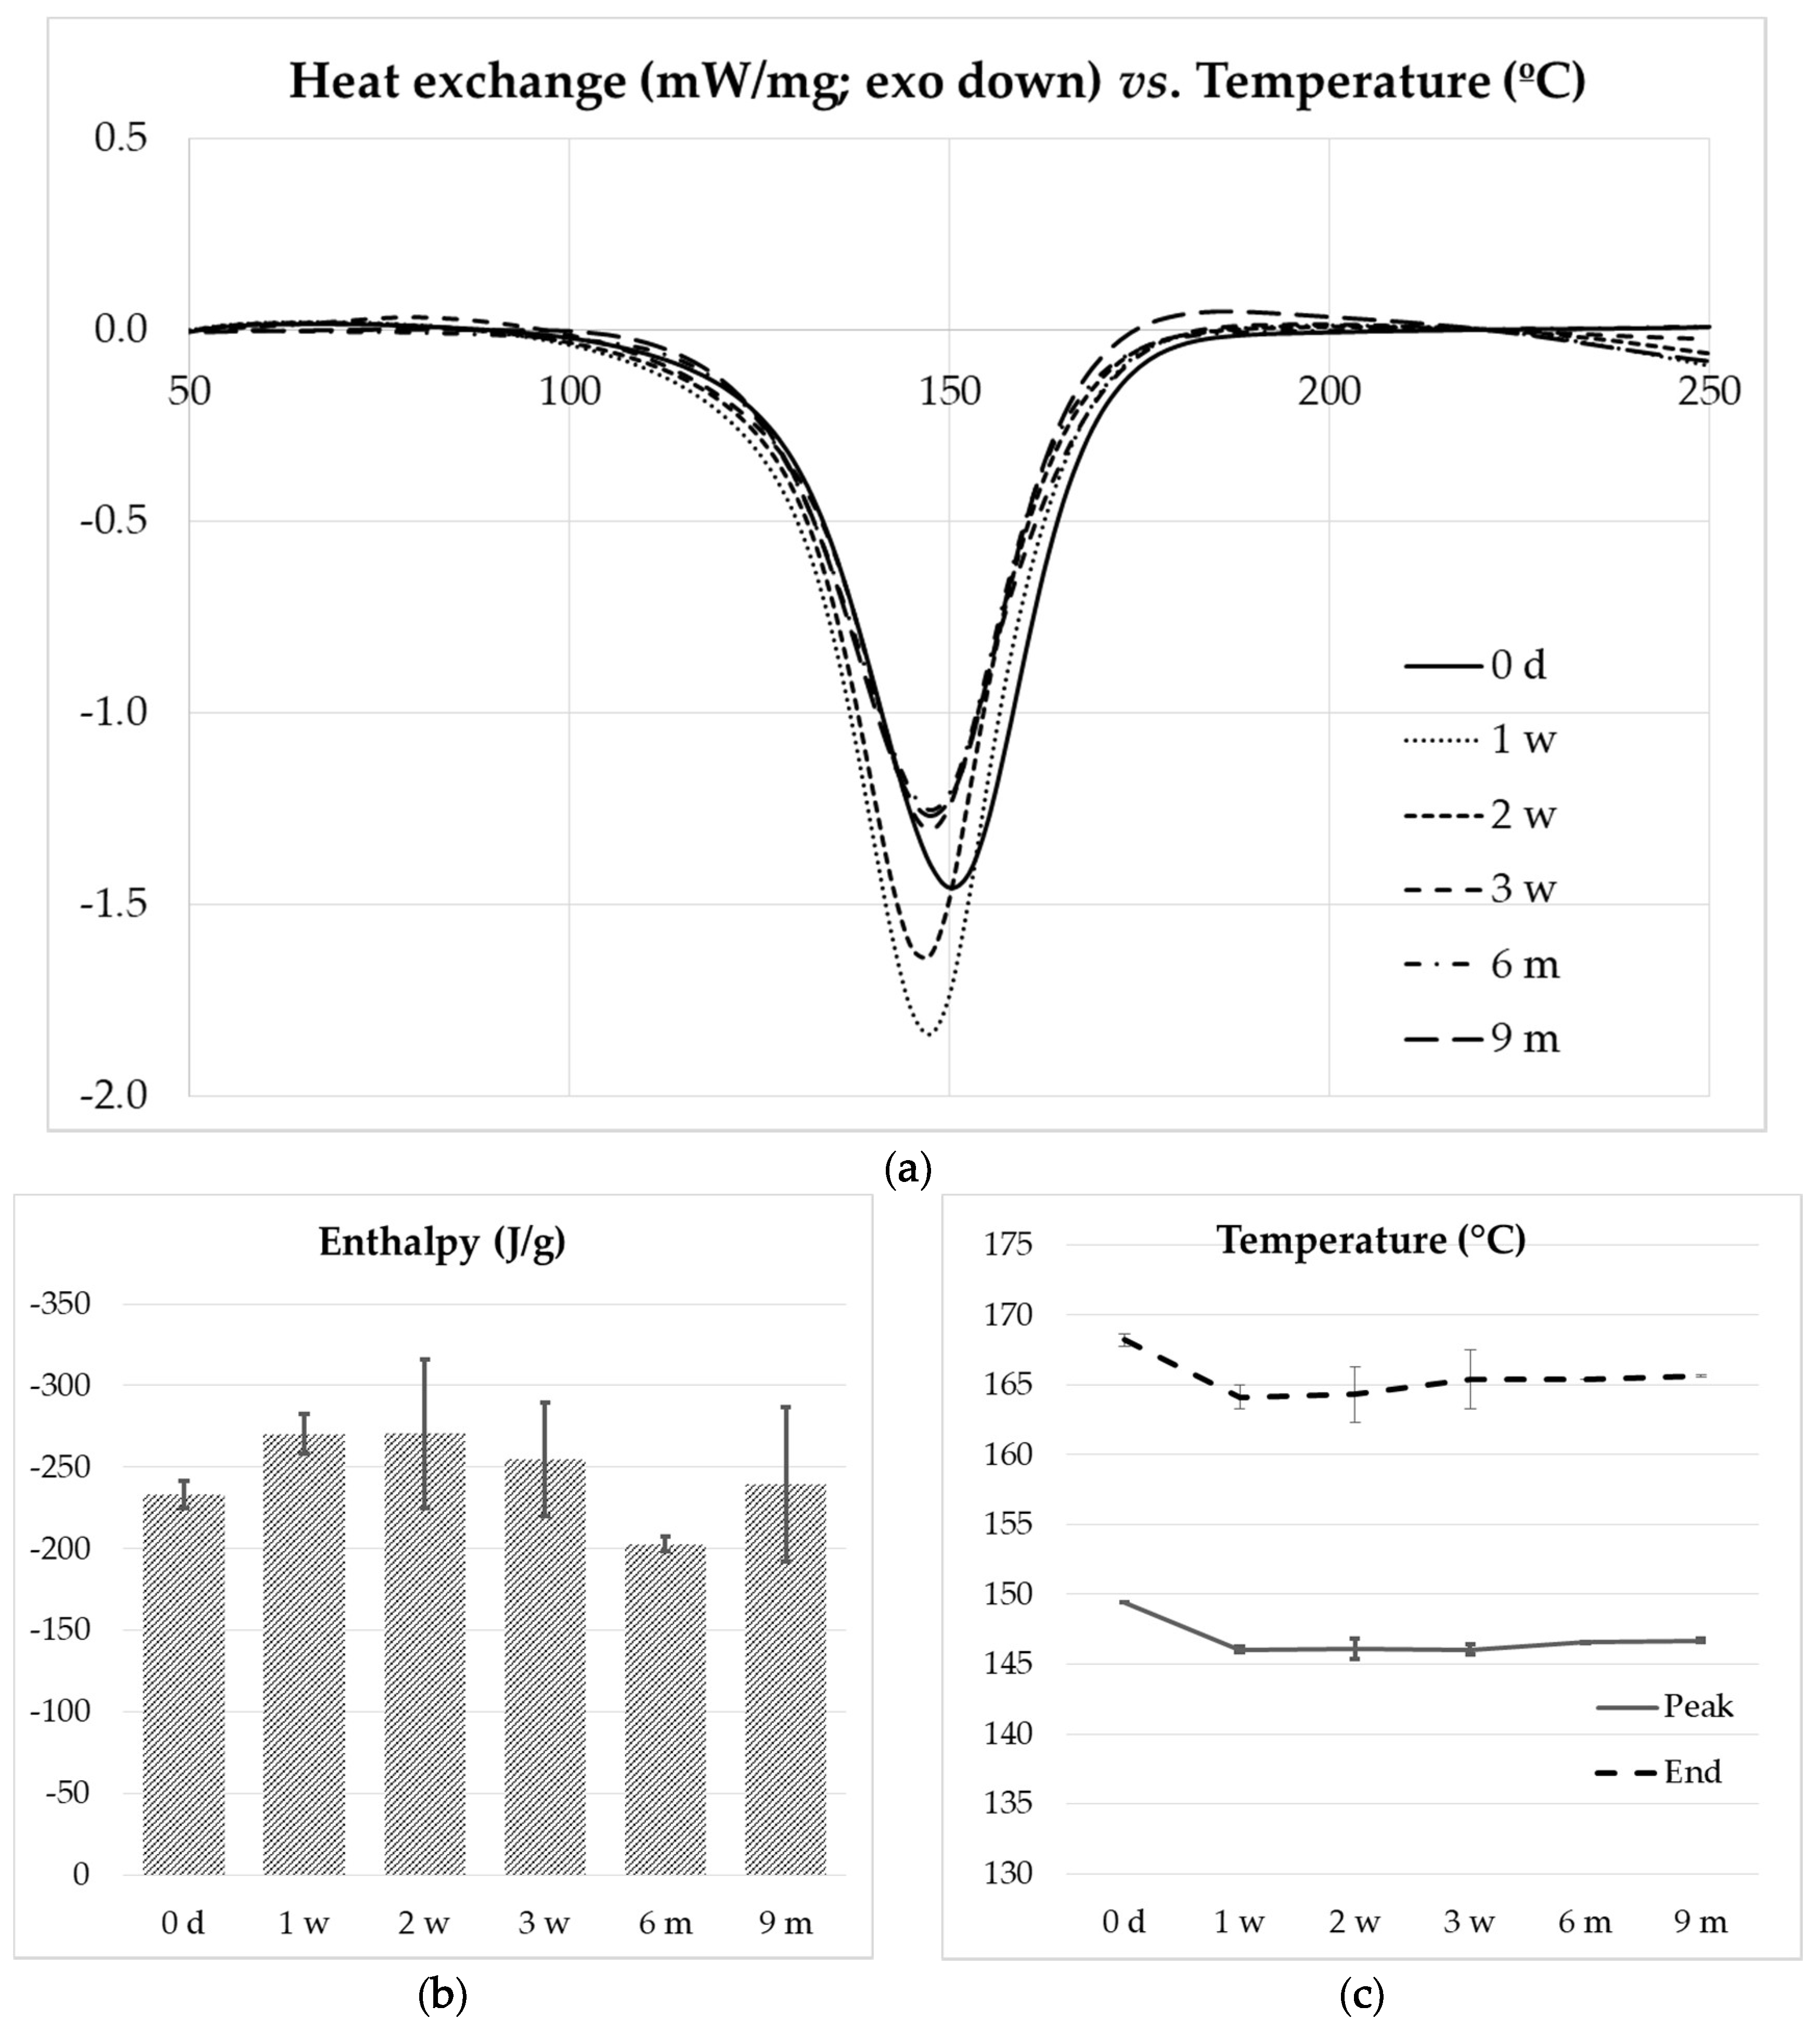
A composite resin was prepared with the complete formulation (epoxy resin, hardener, accelerator and carbon nanofillers) to study its shelf life when stored at −18 °C. The composite selected contained 0.5 wt.% SWCNT + 2 wt.% EG. The pot life of the resin at room temperature was 24 h, according to the manufacturer. Freshly prepared composite samples were stored in the freezer during 1, 2 and 3 weeks, and 6 and 9 months. The cure of the thawed composites and as-prepared samples was studied by DSC. Figure 13a presents the DSC thermograms obtained by heating the composite resins from 30 to 250 °C at a heating rate of 10 °C/min. No major differences in peak temperature and shape were observed for composites subjected to increasing freezing time. The cure enthalpies, peak temperatures and peak end temperatures are plotted in Figure 13b,c, showing the similarity of all the samples tested.
The simulation of the cure reaction in the PCB soldering tunnel was performed by heating the composite resins at 60 °C/min from 30 to 220 °C, simulating the temperature profile and residence time in a PCB’s soldering process. The DSC profiles obtained were similar for all the samples, regardless of storage time. The second heating of the cured composites at 10 °C/min originates a flat DSC curve, evidencing the complete cure of the composite resins in the first heating process.
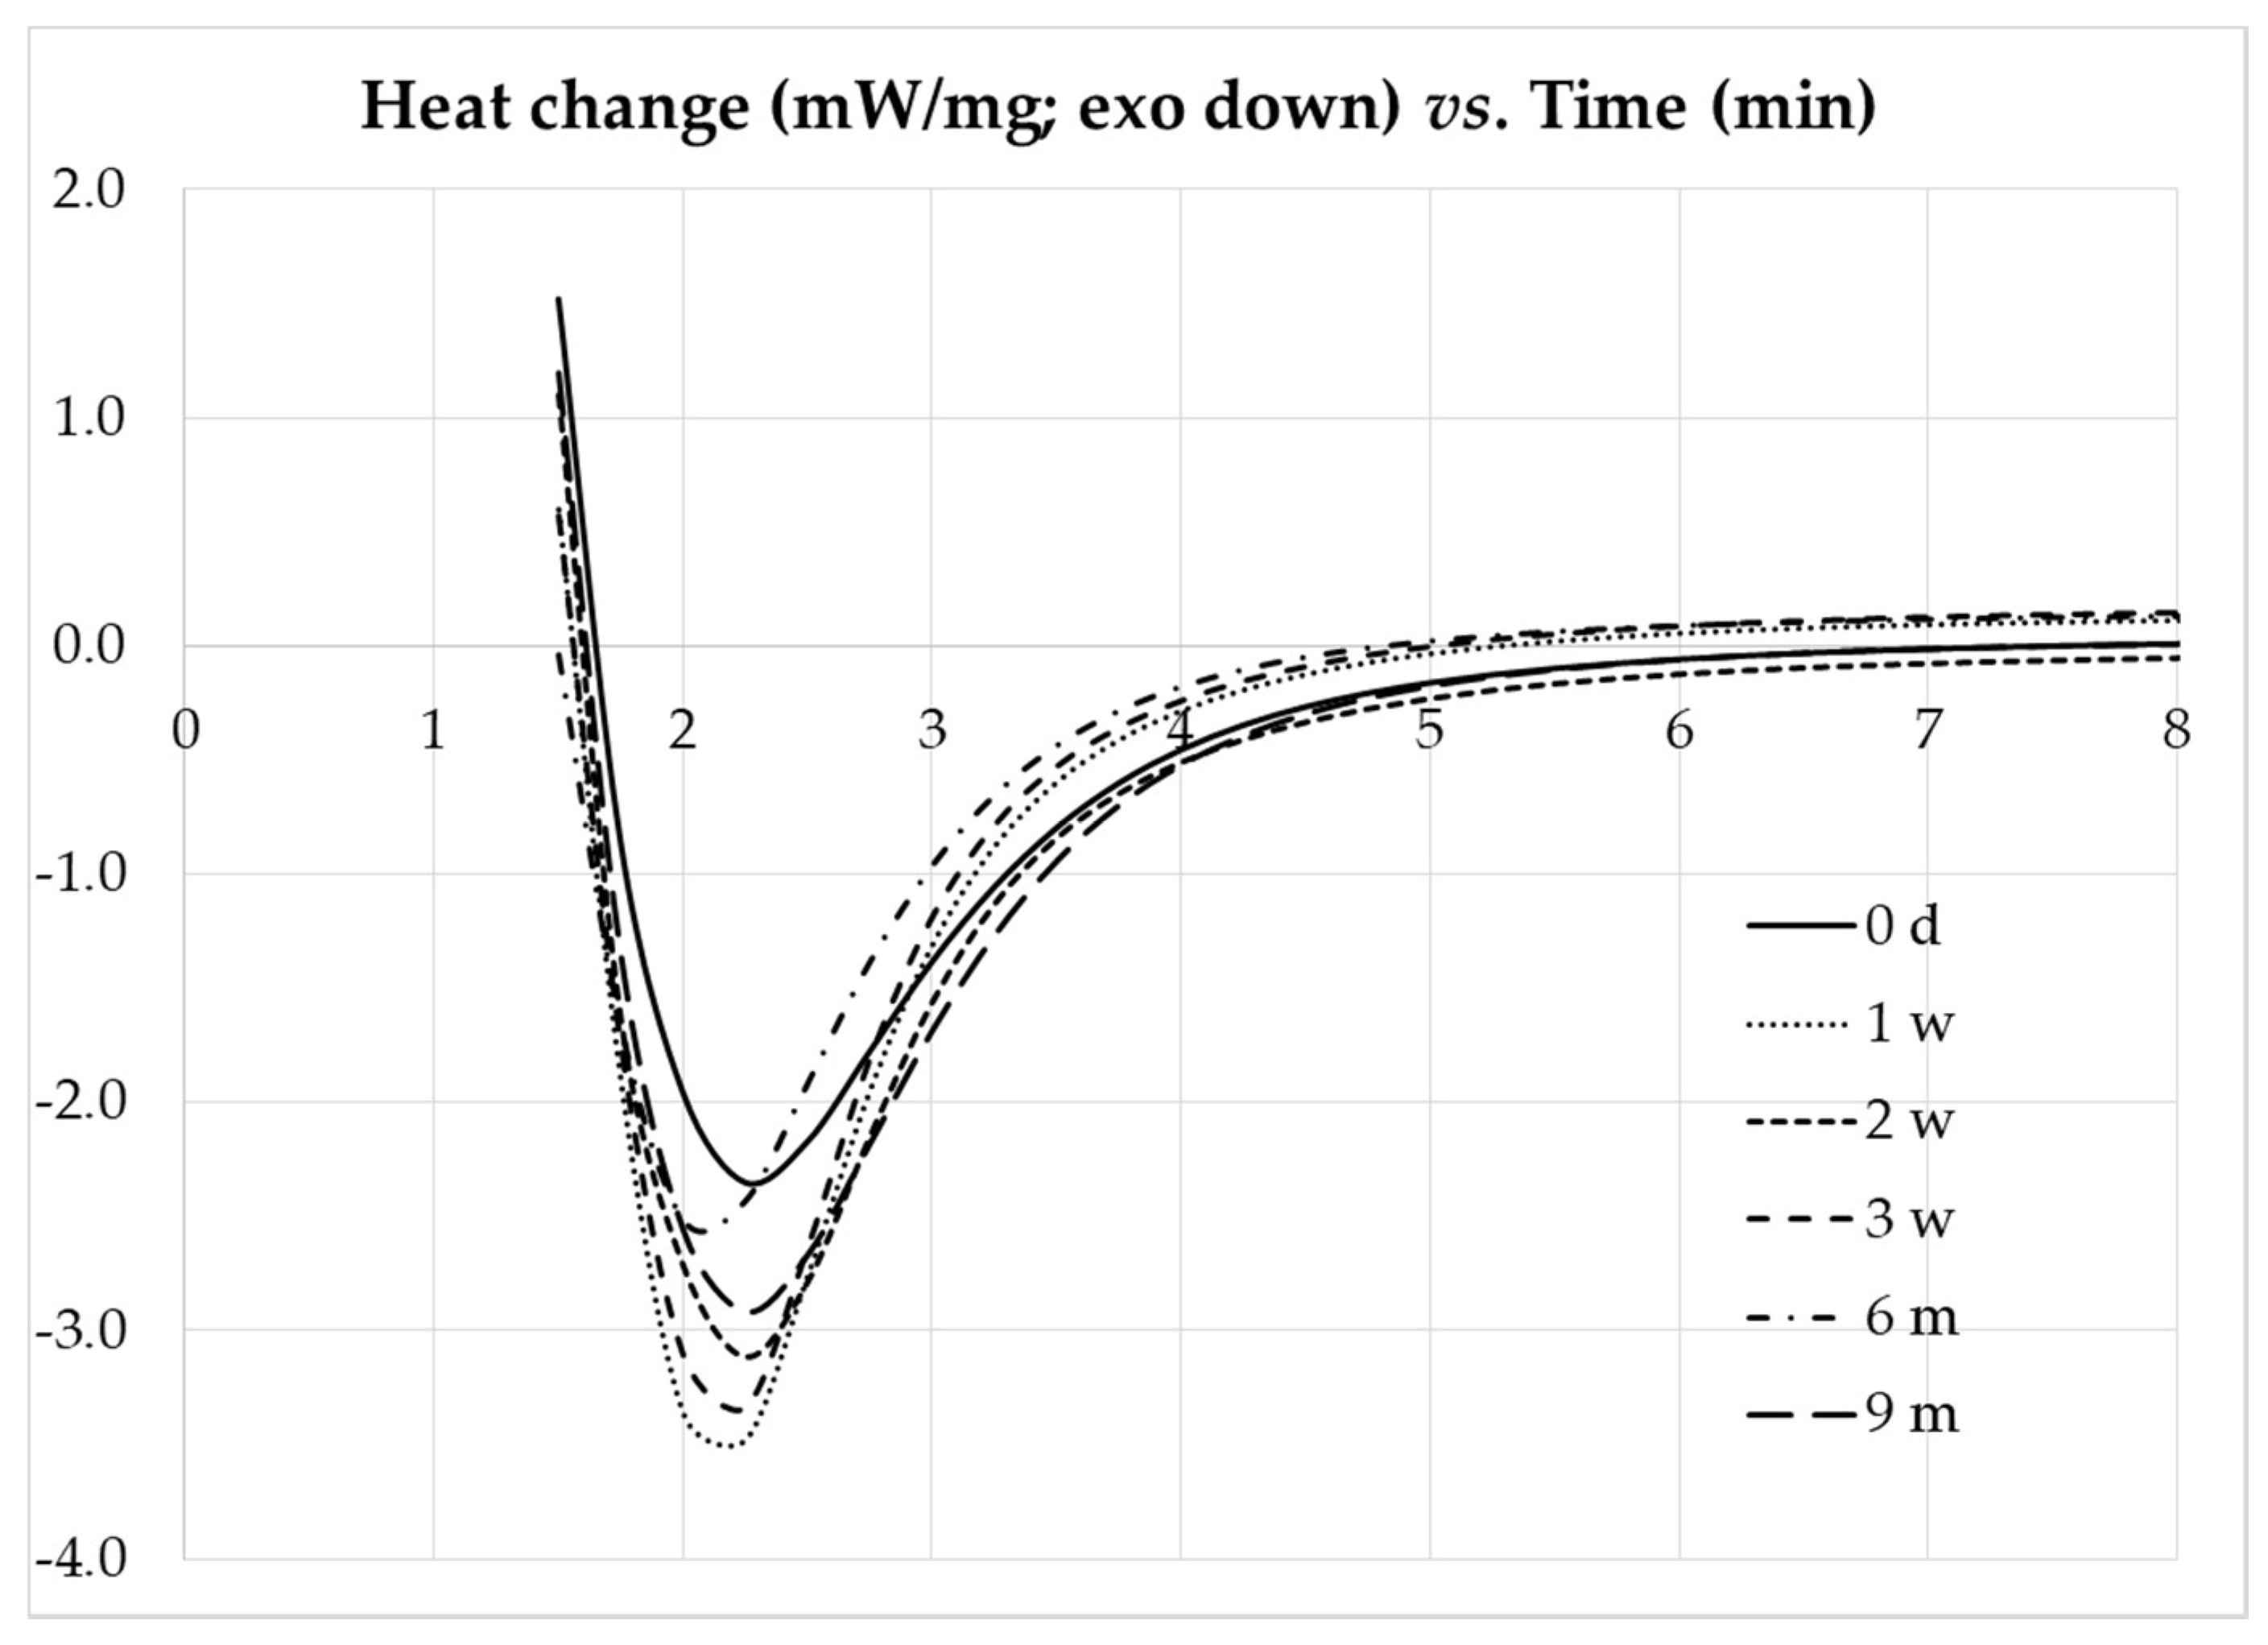
The DSC carried out in isothermal mode at 150 °C for the composites with different freezing storage times are presented in Figure 14, showing no major differences in the curves. The time elapsed until the isothermal peak was observed, or peak time, is similar for the as-prepared and freeze-thawed composites, ranging from 2.10 to 2.25 min. These results show that the storage conditions used are suitable for long term storage of the composite adhesive, without deterioration of the cure performance.
Considering that currently available resins have a shelf life of up to 6 months at a storage temperature of −40 °C, it was observed that the present formulation can be stored at a higher temperature without affecting the shelf life.
4. Conclusions

The objective of the present work is to develop ECAs based on epoxy resin and carbon nanomaterials with electrical resistivity lower than 10 Ω cm, with rheological characteristics that allow deposition by screen printing, and enhanced thermal conductivity. For that purpose, composite resins based on epoxy and carbon nanomaterials, namely SWCNT and MWCNT and EG, were produced within a range of compositions using a three roll mill. The compositions prepared were from 0.01 to 1.2 wt.% for SWCNT, 0.02 to 1.8 wt.% for MWCNT, and hybrid composites with SWCNT/EG and MWCNT/EG were prepared with different nanotube compositions and additional 2 and 5 wt.% of EG. The ECAs prepared were characterized relative to their morphology (dispersion of the conductive nanomaterials) as well as rheological properties, electrical and thermal conductivity, deposition on a test board (PCB) and the ECA’s shelf life.
The good dispersion of the carbon nanomaterials was observed by SEM, mapping by Raman microscopy and HD-KFM. SEM images illustrate the strong interaction between SWCNT and the EG surface. HD-KFM measurements allowed visualization of the SWCNT network in the composite matrix, providing higher lateral resolution information compared to the Raman mapping measurements, where individual SWCNT cannot be resolved. The HD-KFM and Raman mapping measurements performed on composites containing EG, with lateral size of approximately 9.5 μm, retrieved similar information since the resolution is comparable for both techniques.
The ECAs produced with SWCNT reached electrical conductivities in the range of 10 to 28 Ω cm while with MWCNT it ranged from 145 to 5500 Ω cm. The incorporation of EG influences differently the electrical resistivity of composites containing SWCNT or MWCNT. Mixing EG and SWCNT forms composites with higher electrical resistivity at the lower SWCNT content (0.2 wt.%); however, at higher SWCNT contents (0.8 and 1.2 wt.%) the electrical resistivity of the composites is invariant with the addition of EG, at both 2 and 5 wt.% EG contents. Composites with MWCNT content of 0.4, 1.2 and 1.8 wt.% depicted a resistivity increase with the addition of 2 wt.% of EG, but recovered or even decreased the resistivity with the addition of 5 wt.% of EG.
Thermal conductivity of the composites is enhanced by the addition of EG. While the composites with SWCNT could reach an increase of thermal conductivity up to 90% relative to that of epoxy, the addition of EG enhanced the thermal conductivity up to 164%.
The values obtained for the thermal and electrical conductivities indicate that thermal conduction is mainly provided by EG, while electrical conduction is mainly provided by SWCNT (or MWCNT). It is also evident that the synergy between the different materials is not as positive as expected.
The addition of 2 or 5 wt.% of EG does not strongly affect the shear storage modulus relative to the corresponding composites with SWCNT or MWCNT only.
The deposition of an ECA based on epoxy/1 wt.% SWCNT was successfully achieved by screen printing onto test PCBs with different surface finish.
The cure of the epoxy composite prepared with the adequate catalyst system was analyzed by DSC. The as-prepared ECA and the ECA frozen at −18 °C, thawed after different lengths of freezing time ranging from one week up to 9 months were analyzed, demonstrating its shelf life under common freezing conditions for long a period.
The ECAs reported in the present work demonstrated good potential for the application in PCB component bonding, presenting low filler content, promising thermal and electrical properties, ease of application and a large shelf life. Future work aiming at car multimedia applications will encompass the increase in electrical conductivity and the validation of the bonding mechanical performance and reliability.

Supplementary Materials

The following are available online at https://www.mdpi.com/2504-477X/4/3/105/s1, Figure S1. Stencil printing equipment used to deposit electrically conductive composits on the PCB’s; Figure S2. Transmission electron microscopy images of individual MWCNTs NC7000 and ropes of SWCNTs Tuball; Figure S3. Images of Raman intensity maps and typical Raman spectra; Figure S4. Schematic of the preparation of the samples for AFM analyze; Table S1. Settings used to operate the three-roll mill for the dispersion of nanomaterials in the epoxy resin; Table S2. Volume electrical resistivity for the composites prepared with epoxy CR141 and each carbon filler; Table S3. Thermal conductivity of the epoxy nanocomposites prepared with epoxy CR141 and SWCNT, EG and selected combinations.

Author Contributions

Conceptualization, M.C.P., R.A.; methodology, P.E.L., H.F.; investigation, D.M., P.E.L., L.H., H.F., B.K., E.L.; formal analysis, P.E.L., L.H., D.M., H.F., B.K.; supervision, M.C.P., P.E.L., R.A., L.H.; validation, P.E.L., L.H., P.P., L.P.; visualization, P.E.L.; writing—original draft preparation, D.M., H.F., P.E.L.; writing—review and editing, M.C.P., P.E.L., L.H., B.K., P.P. All authors have read and agreed to the published version of the manuscript.

Funding

This research was funded by the Portugal Incentive System for Research and Technological Development, Project in Co-Promotion n° 039479/2019 (Factory of the Future: Smart Manufacturing 2019–2021).

Acknowledgments

IPC acknowledges the support of the Portuguese Foundation for Science and Technology (FCT) through the National Funds References UIDB/05256/2020 and UIDP/05256/2020. LH acknowledges the FCT Investigator Programme through grant IF/00606/2014. M.C.P. is grateful to IPF Dresden for providing a grant for a research stay at IPF Dresden. The authors are grateful to Paco Martinez (ScienTec Iberica) for the helpful discussion on the AFM results.

Conflicts of Interest

The authors declare no conflict of interest.

References

  1. Li, Y.; Anway, M.D.; Cupp, A.S.; Uzumcu, M.; Skinner, M.K. Electronics without lead. Science 2005, 308, 1419–1420. [Google Scholar] [CrossRef] [PubMed]
  2. Amoli, B.M.; Trinidad, J.; Hu, A.; Zhou, Y.N.; Zhao, B. Highly electrically conductive adhesives using silver nanoparticle (Ag NP)-decorated graphene: The effect of NPs sintering on the electrical conductivity improvement. J. Mater. Sci. Mater. Electron. 2014, 26, 590–600. [Google Scholar] [CrossRef]
  3. Böhm, S.; Stammen, E.; Hemken, G.; Wagner, M. 17—Adhesive bonding. In Microjoining and Nanojoining; Zhou, Y., Ed.; Woodhead Publishing: Cambridge, UK, 2008; pp. 500–544. [Google Scholar]
  4. Yang, C.; Wong, C.-P.; Yuen, M.M.F. Printed electrically conductive composites: Conductive filler designs and surface engineering. J. Mater. Chem. C 2013, 1, 4052. [Google Scholar] [CrossRef]
  5. Jeong, W.-J.; Nishikawa, H.; Itou, D.; Takemoto, T. Electrical Characteristics of a New Class of Conductive Adhesive. Mater. Trans. 2005, 46, 2276–2281. [Google Scholar] [CrossRef] [Green Version]
  6. Amoli, B.M.; Gumfekar, S.P.; Zhao, B.; Hu, A.; Zhou, Y.N. Thiocarboxylate functionalization of silver nanoparticles: Effect of chain length on the electrical conductivity of nanoparticles and their polymer composites. J. Mater. Chem. 2012, 22, 20048. [Google Scholar] [CrossRef]
  7. Marsden, A.J.; Papageorgiou, D.; Valles, C.; Liscio, A.; Palermo, V.; Bissett, M.A.; Young, R.J.; Kinloch, I.A. Electrical percolation in graphene–polymer composites. 2D Mater. 2018, 5, 032003. [Google Scholar] [CrossRef] [Green Version]
  8. Meng, Q.; Han, S.; Araby, S.; Zhao, Y.; Liu, Z.; Lu, S. Mechanically robust, electrically and thermally conductive graphene-based epoxy adhesives. J. Adhes. Sci. Technol. 2019, 33, 1337–1356. [Google Scholar] [CrossRef]
  9. Li, Y.; Tang, J.; Huang, L.-J.; Wang, Y.; Liu, J.; Ge, X.; Tjong, S.; Li, R.K.; Belfiore, L.A. Facile preparation, characterization and performance of noncovalently functionalized graphene/epoxy nanocomposites with poly(sodium 4-styrenesulfonate). Compos. Part A Appl. Sci. Manuf. 2015, 68, 1–9. [Google Scholar] [CrossRef]
  10. Moriche, R.; Sánchez, M.; Jiménez-Suárez, A.; Prolongo, S.; Ureña, A. Electrically conductive functionalized-GNP/epoxy based composites: From nanocomposite to multiscale glass fibre composite material. Compos. Part B Eng. 2016, 98, 49–55. [Google Scholar] [CrossRef]
  11. Aradhana, R.; Mohanty, S.; Nayak, S.K. A review on epoxy-based electrically conductive adhesives. Int. J. Adhes. Adhes. 2020, 99, 102596. [Google Scholar] [CrossRef]
  12. Yu, A.; Itkis, M.E.; Bekyarova, E.; Haddon, R. Effect of single-walled carbon nanotube purity on the thermal conductivity of carbon nanotube-based composites. Appl. Phys. Lett. 2006, 89, 133102. [Google Scholar] [CrossRef]
  13. Cunha, E.; Proença, F.; Pereira, G.; Fernandes, M.J.; Young, R.J.; Strutyński, K.; Melle-Franco, M.; Gonzalez-Debs, M.; Lopes, P.E.; Paiva, M.C. Water Dispersible Few-Layer Graphene Stabilized by a Novel Pyrene Derivative at Micromolar Concentration. Nanomaterial 2018, 8, 675. [Google Scholar] [CrossRef]
  14. Chandrasekaran, S.; Faiella, G.; Prado, L.; Tölle, F.; Mülhaupt, R.; Schulte, K. Thermally reduced graphene oxide acting as a trap for multiwall carbon nanotubes in bi-filler epoxy composites. Compos. Part A Appl. Sci. Manuf. 2013, 49, 51–57. [Google Scholar] [CrossRef]
  15. Jiang, H.; Moon, K.-S.; Li, Y.; Wong, C.P. Surface Functionalized Silver Nanoparticles for Ultrahigh Conductive Polymer Composites. Chem. Mater. 2006, 18, 2969–2973. [Google Scholar] [CrossRef]
Figure 1. Rheological protocol: (a) time evolution of the shear viscosity response to the application of a steady shear rate of 1 s−1 for a resin containing 0.1 wt.% SWCNT; (b) time evolution of the shear storage (G′) and loss (G″) moduli during the structural recovery of a resin containing 0.08 wt.% SWCNT, following the cessation of the steady shear applied in (a); (c) mechanical spectrum of a resin containing 0.1 wt.% SWCNT, measured after achieving structural equilibrium as shown in (b); (d) strain dependence of storage (G′) and loss (G″) moduli of a resin with 0.1 wt.% SWCNT; inset in (d) is the curing at 5 °C/min of the neat resin.
Jcs 04 00105 g001
Figure 2. Prototype 1 board layout (a) and stencil design (b).
Jcs 04 00105 g002
Figure 3. SEM micrographs of the selected carbon nanomaterials.
Jcs 04 00105 g003
Figure 4. Electrical percolation curves of the epoxy nanocomposites prepared with the selected carbon nanomaterials.
Jcs 04 00105 g004
Figure 5. SEM micrographs of selected epoxy nanocomposites.
Jcs 04 00105 g005
Figure 6. Images of Raman intensity maps and typical Raman spectra: (a) G band intensity distribution of the composite with 5 wt.% of EG (higher intensity areas in white); (b) Raman spectra of the regions presenting higher and lower intensity; (c) G band intensity distribution for the composite with 0.2 wt.% single wall carbon nanotubes (SWCNT) and 5 wt.% of EG (higher intensity in white—higher SWCNT concentration); (d) Raman spectra corresponding to the regions of higher and lower intensities of the G band of 0.2 wt.% SWCNT and 5 wt.% of EG; (e) D band intensity distribution of the composite with 1.2 wt.% of MWCNT and 5 wt.% EG (darker areas corresponding to EG); (f) G to D intensity ratio distribution where regions of higher intensity ratio appear in white (EG) and lower intensity ratio in black (MWCNT); (g) Raman spectra corresponding to the regions of higher and lower intensity ratio. Maps and Raman spectra of composites with all the compositions prepared, presenting similar features to those shown in Figure 6, are provided in the Supplementary Information.
Jcs 04 00105 g006
Figure 7. AFM images of the epoxy composites with 1.2 wt.% SWCNT (a,b) and 5 wt.% EG (c,d). Images (a,c) were obtained in topographic mode while b and d were obtained in high definition kelvin Force microscopy (HD-KFM) mode.
Jcs 04 00105 g007aJcs 04 00105 g007b
Figure 8. Evolution of the storage modulus measured at 1 Hz (G1Hz) as a function of the carbon nanotube content in the resin. The dashed area represents the onset of SWCNT percolation in the resin. Solid symbols correspond to resins containing only carbon nanotubes (SWCNT or MWCNT), whereas empty symbols refer to data measured for mixed systems where 2 wt.% (circles) and 5 wt.% (triangles) were added to the resin with carbon nanotubes. Inset: temperature for onset of curing as a function of the carbon nanotube content. Symbols are as in the main chart.
Jcs 04 00105 g008
Figure 9. Thermal conductivity of the epoxy nanocomposites prepared with SWCNT, EG and selected combinations.
Jcs 04 00105 g009
Figure 10. Images of the prototype boards after adhesive deposition and curing.
Jcs 04 00105 g010
Figure 11. SEM images of screen-printed Adhesive A (top) on ImSn (A1) and SSP (A2) PCBs and Adhesive B (bottom) on ImSn (B1) and SSP (B2) PCBs.
Jcs 04 00105 g011
Figure 12. Measured current and resistance as a function of test time for adhesive B on an OSP test board (a) and cycle sweeps (b).
Jcs 04 00105 g012
Figure 13. DSC profiles for scans at 10 °C/min of composites with 0.5 wt.% SWCNT + 2 wt.% EG after different storage times. (a); corresponding cure enthalpies and (b); peak temperatures and peak end temperatures (c).
Jcs 04 00105 g013
Figure 14. DSC isothermal profiles of composite with different storage times.
Jcs 04 00105 g014
Table 1. Electrical volume resistivity of the composites containing multiple carbon nanomaterials.
CompositionR0 (Ω cm)
SWCNTEG
0.2 wt.%0 wt.%7.82 × 101 ± 8.50 × 100
2 wt.%2.77 × 10² ± 3.27 × 101
5 wt.%2.80 × 10² ± 1.27 × 10²
0.8 wt.%0 wt.%1.61 × 101 ± 7.57 × 100
2 wt.%1.66 × 101 ± 3.10 × 100
5 wt.%1.01 × 101 ± 1.33 × 100
1.2 wt.%2 wt.%1.94 × 101 ± 5.29 × 100
5 wt.%2.17 × 101 ± 7.14 × 100
MWCNTEGR0 (Ω cm)
0.4 wt.%0 wt.%1.93 × 10³ ± 6.63 × 10²
2 wt.%2.30 × 10⁷ ± 3.98 × 10⁶
5 wt.%1.93 × 10² ± 2.70 × 101
1.2 wt.%0 wt.%2.84 × 10² ± 1.21 × 10² a
2 wt.%2.35 × 10³ ± 2.21 × 10²
5 wt.%1.45 × 10² ± 8.00 × 101
1.8 wt.%2 wt.%5.53 × 10³ ± 1.10 × 10³
5 wt.%2.91 × 10² ± 3.40 × 101
a This value was obtained for a composite with 1 wt.% MWCNT content.
Table 2. Average resistance of adhesive joints and standard deviation.
AdhesiveBoard SurfaceAverage Resistance (×103 Ω)Std. Deviation (×103 Ω)
AOSP7.961.96
Im.Sn7.623.11
BOSP7.402.69
Im.Sn9.011.84