Review

Factors that Affect Network Formation in Carbon Nanotube Composites and their Resultant Electrical Properties

by
Morgan R. Watt
and
Rosario A. Gerhardt
*
School of Materials Science and Engineering, Georgia Institute of Technology, Atlanta, GA 30332, USA
*
Author to whom correspondence should be addressed.
J. Compos. Sci. 2020, 4(3), 100; https://doi.org/10.3390/jcs4030100
Submission received: 22 June 2020 / Revised: 16 July 2020 / Accepted: 20 July 2020 / Published: 24 July 2020
(This article belongs to the Special Issue Feature Papers in Journal of Composites Science in 2020)

Abstract

:
This review paper explores the formation of carbon nanotube (CNT) polymer composites as a function of material and processing parameters. The effect of different polymer systems, increasing multiwall CNT content, modification of CNTs, processing conditions, and aspect ratio are discussed in detail for multi-walled carbon nanotubes (MWCNT) composites along with some examples for SWCNT composites. All of these factors influence the microstructure and how the network of CNTs forms within it. Often, researchers choose to modify the CNTs to aid in their distribution; however, this may result in a reduction or increase in conductivity depending on many factors. The electrical properties are directly affected by changes in the CNT network and how the material has been processed. As soon as the network forms, percolation occurs and the conductivity increases. In order to understand how to control the properties of CNT composites, all material characteristics and processing conditions must be taken into account.

Graphical Abstract

1. Introduction

The electrical, mechanical, and thermal properties of a material can be greatly improved by the addition of carbon nanotubes (CNTs). Therefore, understanding their influence within a composite is an important endeavor. The objective of this review paper is to explore the network formation of carbon nanotube nanocomposites, specifically within insulating matrices. The methodology utilized are impedance spectroscopy and scanning electron microscopy (SEM), among other methods. The importance of the amount of CNTs, type of polymer matrix, functionalization of CNTs, size of CNTs, processing techniques, and purification will be explored by a comprehensive review of the literature.

1.1. Importance of Multiwalled Carbon Nanotube (MWCNT) Composites

The addition of nanoparticles to an insulating matrix may affect the properties significantly, including the electrical, mechanical, and optical properties. Carbon nanotubes have excellent mechanical strength along with high electrical and thermal conductivity [1]. CNTs have a higher electrical conductivity than copper due to them having low resistance and few defects [2]. These properties make CNT composites a possible solution for multiple applications, including electromagnetic interference (EMI) shielding, transparent conducting films, gas sensors, and more [3,4,5].
Carbon nanotubes can be thought of as single or multiple sheets of graphite rolled into a cylinder. It is important to note that the diameter, aspect ratio, crystallinity, and crystalline orientation have a big impact on the intrinsic properties of the composite [1]. Transmission electron microscopy (TEM) images of representative MWCNT powder showing polydispersity are shown in Figure 1. The inset image shows wall thickness at a higher magnification. In this paper, MWCNTs in different matrices will be focused on, while SWCNT composites will be briefly mentioned for comparison.
Many different insulating polymer matrices have been used in the fabrication of MWCNT composites. These include thermoplastics, thermosetting resins, liquid crystalline polymers, and water-soluble polymers. Simultaneously, there are multiple methods used to mix the polymer and CNTs. Melt processing, solution mixing, extrusion, mechanical stretching, spin coating, latex technology, a conjugated method, and in-situ polymerization are examples [1,3]. Melt mixing is known for its speed, simplicity, low cost, absence of solvents, and equipment availability in industry [3]. Therefore, melt mixing is generally chosen to make composites rather than solution mixing or in-situ polymerization, both of which may result in contamination from residual monomers or solvent. Another possible benefit for melt mixing is that the shear applied may minimize the formation of MWCNT into aggregates [6].
It is important to fully disperse the CNTs within the polymer matrix to form a homogeneous composite with the best properties. There is difficulty in achieving this since carbon nanotubes are strongly affected by Van der Waals forces owing to their small size and large surface area. Therefore, CNTs have a tendency to agglomerate and cause difficulties when attempting to disperse them. Furthermore, the surfaces of CNTs have high chemical stability and may not interact with the matrix [7].

1.2. Methods of Mixing

There are many ways to combine the CNTs and polymer. However, they all follow the same basic mechanisms. First, the agglomerates are wetted by the polymer. This depends on the interfacial energy between the two parties. Therefore, if the CNTs are functionalized, this step may be easier. Second, the polymer chains must infiltrate into the agglomerates to weaken them. This action can be represented by the Lucas-Washburn equation: [8]
h ( t ) 2 = r γ cos θ   t 2 η l
where h ( t ) 2 is the time dependent infiltration length for the case of a fully wettable capillary. The rest of the symbols are: η l is the dynamic viscosity, γ is the interfacial tension between capillary and liquid, θ is the contact angle, and r is the pore radius. This equation shows that if the agglomerates are less packed (large pore radius), the polymer matrix will have an easier time infiltrating. It also depends on the shear rate, molecular weight distribution, and temperatures used, since infiltration is related to the viscosity. This equation does not consider the size exclusion (radius of gyration and pore diameter) and external pressure. The success of the next step is dependent on the successful infiltration of the agglomerates. The third step is dispersion of agglomerates by rupture and erosion, and the final step is distributing the nanotubes into the matrix [8]. Figure 2 shows three processing methods that will be mentioned in the paper. They include mechanical mixing, melt mixing, and solution mixing. Since the processing method used and characteristics of materials used are very important to the fabrication of MWCNT/polymer composites, their effects will be described in the discussion.

1.3. Functionalization of MWCNT to Improve Dispersion and/or Conductivity

Functionalization, the addition of functional groups to the surface of CNTs, is one way to aid the dispersal of carbon nanotubes. One functionalization method is to treat the CNT with oxidizing agents such as HCl, H2SO4, H2O2, H2O2+H2SO4, 1HNO3+3H2SO4, HNO3, KMnO4, NaClO, SOCl2, etc. The oxidation results in the formation of carboxyl (-COOH), alcohol (C-OH), and ketonic (-C=O) groups on the surface of the CNT. The number and type of group depends on the method of oxidation. However, it has been reported that oxidation reduces the composite’s conductivity and shifts the percolation to higher concentrations [7].
A second method to improve dispersion is using surfactants and coupling agents. Coupling agents have two chemically reactive groups on either end of their molecular structure. One reacts with the fillers chemically, while the other links with the polymer through either physical entanglement or chemical reaction. Therefore, it creates a bridge between the filler and polymer. Surfactants also have two different groups: hydrophilic and lipophilic. The hydrophilic group gets absorbed on the surface of fillers, thus decreasing the surface energy and breaking the aggregation. The lipophilic group is compatible with the polymer, and acts as the bridge between the filler and polymer [10].

1.4. Percolation and Electrical Testing

Percolation occurs when the composite reaches a critical amount of filler (CNT) that causes a sudden decrease in the resistivity, as seen in Figure 3. When the critical volume content, pc is reached, the resistivity jumps multiple orders of magnitude. This is because the filler reached the amount needed to form a network through the matrix. Carbon nanotubes have a very high aspect ratio (length to diameter ratio = L/D) of 100–1000 [4]. The higher the ratio a particle has, the lower the percolation threshold will be [11]. The type, dispersion, alignment, and interaction of CNTs with the matrix all have an effect on the percolation threshold. Therefore, the effect of the amount of CNTs, type of polymer matrix, functionalization of CNT, processing methodology, and CNT size will all be discussed. Many different methods for measuring the electrical properties are also reported, including dielectric relaxation spectroscopy, 4-point probe and automated inline DC, and impedance spectroscopy. Electrical measurements are important for detection of reaching the percolation threshold.
Impedance spectroscopy is a useful technique for characterizing composites due to its high sensitivity to all types of interfaces. It has the ability to pick up subtle changes in the CNT networks over a range of frequencies. This data may also be fit to an equivalent circuit, which can be further assigned to microstructural features—the interconnectivity of CNT, intrinsic CNT properties, matrix influence, etc. There are many examples of impedance spectroscopy being used successfully to characterize insulating matrix, conducting filler composites [1,9,12,13,14].

2. Factors that Affect the Electrical Properties of Composites

2.1. Differences in Polymer Systems

It is important to compare different polymer systems: PMMA, polyethylene (PE), polypropylene (PP), polycarbonate (PC), polyamide (PA), and epoxy. The graphs in Figure 4 compare percolation thresholds and maximum conductivity values for several polymer systems disregarding processing methods and size of MWCNT. In Figure 4a, it can be seen that percolation thresholds were below 10 wt% in all cases, with majority being less than 2 wt%. Typically, melt mixing accounts for the higher percolation thresholds as it distributes the MWCNTs more evenly. In Figure 4b, the majority of the maximum conductivity values are below 30 S/m at concentrations varying from about 0.01 to 22 wt%. Values above 100 S/m were disregarded as outliers [15,16] since they do not seem to fit the patterns established by the majority of trends. Nevertheless, it is important to try to investigate why these cases are so different. For more details about the percolation and maximum conductivity for specific polymer matrices and MWNT content, please see Table S1 in the supplementary file.
In Table 1, the percolation thresholds and filler structure for different polymer systems are given. When comparing the filler structure to the percolation threshold, it can be seen that the threshold is higher for randomly distributed structures and lower for segregated structures.

2.2. Effect of Increasing the Amount of MWCNT

Finding the balance between amount of MWCNT used and the resultant properties in composites is important to creating a composite that satisfies the needs of a given situation. In order to do that, the MWCNT content needs to be increased until percolation is achieved. Some papers report in weight percent or volume percent.
Figure 5 displays data for a PMMA/MWCNT composite that was made via melt mixing and measured using AC impedance with a frequency range of 1 to 105 Hz at 30 °C [1]. The carbon nanotubes used were created using catalytic chemical vapor deposition (CCVD) and had dimensions of 10–30 nm in diameter and 1–10 μm in length. From Figure 5a,c, it can be seen that samples with less than 8.5 wt% MWCNT show little change and are highly capacitive. The dielectric constant in this case showed much more variation than the others. For the 10 wt% sample, it can be seen in Figure 5b that the dielectric constant decreases with increasing frequency. This may be attributed to charge release between the filler and matrix interfaces. There is also a large gap between 8.5 and 10 wt% MWCNT for the dielectric constant, which indicates that the percolation threshold appears within that range [1].
Similar to the previous figures, Figure 6 displays the data for PMMA and PMMA/MWCNT composites that were melt mixed and tested using dielectric relaxation spectroscopy (DRS) (frequency range 10−2–106 Hz) and four point probe DC conductivity [3]. The nanotubes were created using CVD and had average dimensions of 9.5 nm in diameter and 1.5 μm in length. For PMMA and 0.5 wt% MWCNT, the conductivity increases linearly with frequency, indicating an insulating behavior. For samples of 0.75 wt% MWCNT and above, a DC leveling out may be seen at a critical frequency. Therefore, the samples become conductive and the percolation threshold is between 0.5 and 0.75 wt%. At concentrations higher than 1 wt% MWCNT, there is saturation, and conductivity increases with the amount of conducting filler. The drop in conductivity at frequency greater than 3 × 10⁴ Hz indicates that the measurements were outside the upper experimental limit of the apparatus. Therefore, the authors switched from DRS to four-point probe and re-measured the samples containing more than 1 wt% (Figure 7). This figure also displays the expected properties for a variety of important applications [3].
The conductivity versus frequency of MWCNT/polyamide 6 (PA6) composites for increasing amounts of CNT is shown in Figure 8. These composites were created by diluting a 20 wt% masterbatch of MWCNT/PA6, then melt mixing and compression molding. The CNTs had an outer diameter of 10 nm and a length of 10 μm. In this case, the beginning of percolation can be seen at 5 wt% MWCNT, and the same change from frequency dependent to independent behavior seen in Figure 6 can also be observed here [4].
Logakis et al. [59] studied the impedance spectra for room temperature vulcanization silicon rubber (RT-SR) and MWCNT composites (Figure 9). The carbon nanotubes used were 10–30 nm in diameter and 10–15 μm in length and were chemically modified in ethanol with a coupling agent, γ-aminopropyltriethoxy silane. In each plot, it can be seen that there are two semi-circles. Therefore, the composite’s equivalent circuit can be represented as two parallel RC circuits, as depicted in Figure 9e. Instead of using ideal capacitance, the authors used constant phase elements (CPEs) [64]. While the authors did not provide an equation that takes into account the inductance element shown in their equivalent circuit, the complex impedance for their samples may be expressed using the following equation:
Z * = R 1 j C P E 1 R 1 2 1 + ω 2 C P E 1 2 R 1 2 + R 2 j C P E 2 R 2 2 1 + ω 2 C P E 2 2 R 2 2 + j w L
R1 and CPE1 are produced by the polarization of the interfacial layer of MWCNT and RT-SR, while R2 and CPE2 are the resistance and capacitance of the polarization of MWCNT at high frequency. The authors used ZVIEW2 to simulate the sample and found that R1 and R2 decrease and CPE1 and CPE2 increase with the loading of MWCNT [64]. Inductance values were not provided.
This section has illustrated through multiple examples that increasing the content of MWCNT causes a percolation threshold to be reached. This in turn causes a jump in conductivity and a change from insulator to conductor behavior. Figure 5, Figure 6 and Figure 7 may be the same polymer system, MWCNT/PMMA, but they all achieved very different percolation thresholds. This may be caused by differences in MWCNTs characteristics or processing conditions used.

2.3. Effect of Processing Methods

The processing of the composites can also have a strong effect on the resultant properties. The CNTs may end up dispersed, segregated from the matrix, or agglomerated depending on the processing. This section will cover the ways that processing may affect the formation of a CNT network and therefore the electrical properties.
Past research conducted by this group compared three different mixing methods (mechanical, melt, and solution as in Figure 2 using otherwise the exact same source of materials and final compaction method [9]. Polydisperse PMMA was used with a particle size in the range of 10−100 μm. MWCNTs with a nominal diameter 8 nm but were found to be 20 nm in some cases and 0.5–2 μm in length. In all cases, the samples go from capacitive behavior (−90° on phase degree graphs) to inductive behavior (90°) as the CNT content increases. For the phase degree graphs, 0° indicated resistive behavior. The changes described can be seen in Figure 10. Mechanical, solution and melt mixtures percolated at 0.05 phr, 2 phr, and 4 phr, respectively. The difference in processing resulted in three very different microstructures: segregated, agglomerated, and distributed, respectively. The even distribution of the melt mixing causes the CNTs to not touch to form a network until a higher CNT concentration is reached [9].
The percolation thresholds of multiple polymer systems and methods of processing are compiled in Figure 11, not taking into account the sizes of either the CNTs or the matrix particles [1,3,9,15,17,18,19,20,21,22,23,24,25,26,27,28,29,30,31,32,33,34,35,36,37,38,39,40,41,42,43,44,45,46,47,48,49,50,51,52,53,54,55,56,57]. A few general trends can be noted. Epoxy shows lower percolation thresholds than the other polymers consistently. Melt mixed composites showed among the highest percolation thresholds, likely due to high dispersal of CNTs. Solution mixed samples generally have percolation thresholds less than 1 wt% with some higher. This method has the most variation in outcome microstructures and percolation thresholds. This is presumably due to functionalization, which can both help and hinder formation of the filler network. The mechanically mixed method is less commonly used, but consistently showed <~0.5 wt% as a percolation threshold. This method results in a grain-like, segregated network microstructure that pushes the filler to the edges of the matrix particles [9].
Figure 12a demonstrates how annealing may affect the conductivity of injection molded polycarbonate plates containing MWCNTs. After annealing at 230 °C for 1 hr, the conductivity jumps several orders of magnitude. Figure 12b shows an increase in conductivity with annealing time for different MWCNT amounts. This suggests that annealing allowed the microstructure to change in a way that enhances the conductive network. The theory of the authors is that a secondary agglomeration occurs that enhances the conductivity [65].
Another example of annealing (Figure 13) was studied by Combessis et al. using very low density polyethylene (VLDPE) [66]. The samples were annealed at 200 °C, 104 °C above the melting/softening temperature of the matrix, VLDPE. As the annealing time increased, the percolation threshold decreased and the conductivity increased. The final percolation threshold of 0.14 vol%, obtained after 1440 min of annealing, has fair agreement with the theoretical value. This mechanism is referred to as dynamic percolation, which is a type of filler auto-assembly mechanism [66].
Figure 14a,b compares the influence of thermal history on electrical conductivity in an amorphous matrix polymer (PC with 1 wt% MWCNT) and a semi-crystalline polymer (PP with 2 wt% MWCNT). In part a, heating above the glass transition temperature, Tg, allows secondary agglomeration to occur, which increases the conductivity. When cooled, it maintains the new microstructure and conductivity. In Figure 14b, the sample was heated from 100 °C to 200 °C rapidly (PP’s Tm = 145 °C ) and annealed for 5 h, then it was cooled below the crystallization temperature at 0.2 K/min. The authors claim that the initial low conductivity may be caused by a CNT network that was partially destroyed by the pressure of compression molding. During melting and annealing, the secondary agglomerates were formed, and the cooling trapped the CNT network. The decrease in conductivity is due to immobilization of charge carriers that were partially prevented from interacting due to the crystalline portions [8,67].
Klonos, et al. did a comparative study on the effects of CNTs on thermal transitions, thermal diffusivity, and electrical conductivity in PE (semi-crystalline) and styrene-butadiene rubber (SBR) (amorphous) composites [68]. Due to the differences in polymer type, the two series of composites were fabricated using different methods. In the semi-crystalline series, linear low density polyethylene (LLD-PE) and MWCNT (average length 3–6 mm, external diameter 10 nm) were melt mixed at 140 °C and 40 rpm for the rotation speed of the rotating blades, then compression molded at 130 °C. In the amorphous series, SBR was combined with MWCNTs from a different source that has an average length 1.2 μm and external diameter ~9.5 nm. Despite the differences between the two series, both had a percolation threshold between 2 and 4 CNT wt% as seen in Figure 15. Overall, the electrical conductivity and trends are very similar suggesting almost no effect of crystallinity on conductivity [68]. On the other hand, Sullivan et al. [64] observed that crystallization induced by the presence of graphite nanoplatelets in polylactic acid led to increases in the electrical conductivity.
Schlea et al. studied network formation of MWCNTs/PETI-330 composites before and after curing to determine how the network is affected by the process [69]. The MWNTs had diameters of 10–12 nm and micron lengths. Overall, there is little change in the conductivity of the composites before and after being cured, except for before the percolation threshold, as seen in Figure 16a. The percolation threshold also does not show a large change between uncured (0.77 wt%) and cured (0.80 wt%) composites, which is displayed in Figure 16b,c. This shows that the curing does not play a large role in rheological transport and did not cause aggregation [69].
As previously mentioned, viscosity and therefore mixing temperature and shear rate may also affect the properties of the composites. Figure 17 illustrates how the melt viscosity affects the structure of 1 wt% MWCNT/PC composites using three different PCs of different molecular weight. The composites were prepared by melt mixing at 280 °C and 50 rpm for 5 min. Higher melt viscosity results in smaller initial agglomerates, which results in faster agglomerate infiltration [70].
Figure 18 is an example that demonstrates that the compression molding temperature is very important to the resulting AC conductivity and microstructure of 0.6 vol% MWCNT/PC composites. The micrograph for the lower temperature molding shows homogeneous distribution of nanotubes. The initial agglomerates were destroyed during melt mixing at 250 °C for 15 min with 50 rpm. The micrograph of the higher temperature (lower viscosity) molding shows inhomogeneous nanotube distribution with secondary agglomerates. The conductivity measurement matches the microstructures formed: the higher temperature molding is conductive, while the lower temperature is insulating [37].

2.4. Modification of the MWCNT

MWCNTs are often functionalized in order to increase the dispersion of the CNTs in the polymer. In Figure 19, it can be seen that while there is little change to the CNT, there are fewer defects after it is oxidized [7]. This section will explore how the electrical properties change with functionalization of CNT.
Figure 20 shows the change in conductivity with frequency for MWCNT/methylvinyl silicone rubber (VMQ) composites where the nanotubes were modified with cetrimonium bromide (CTAB), 3-Aminopropyltriethoxysilane (KH550), and both CTAB and KH550. The CNTs were originally 20–40 nm in diameter and 5–15 μm in length. The composites were made via solution mixing and hot pressing. With KH550, the MWCNTs are tightly bound with the rubber and there are thick rubber layers among the CNTs, which make it more difficult to conduct electrons. CTAB, on the other hand, results in higher conductivity due to more physical interfacial action between MWCNTs. The NH3+ is also helpful for decreasing the energy barrier for charge transport. The combination of the two modifiers causes stronger interfacial interaction and better dispersion, and therefore the conductivity falls in between the individual modifier data [10].
Ryu et al. studied the conductivity versus MWCNT loading for MWCNT/PMMA composites blended with dimethylformamide (DMF), methanol (MeOH), or nothing made using the method shown in Figure 21. The MWCNTs have a 5–10 nm inner diameter, a 60–100 nm outer diameter, and an aspect ratio of 1000–1600. Both DMF and MeOH increased the conductivity of the composite with DMF increasing it the most. The percolation thresholds are low due to formation of grain-like structure with CNT on the outside of PMMA particles. Therefore, these mixing mediums clearly enhanced the MWCNT/PMMA composite [20].
Zhu, et al. compared aligned and unaligned MWCNT within an epoxy matrix along using pristine (p-) and amine- functionalized (a-) MWCNT (Figure 22) [71]. The MWCNT had a mean diameter of 20 nm and average length of about 10 m. The pristine MWCNT was then purified using hydrofluoric acid. A-MWCNT was created by further chemical modification of the pristine MWCNT. An electric field was used to align the MWCNT, then UV light was used to rapidly polymerize the epoxy and hold the alignment. The composites were measured both perpendicular and parallel to the electric field. The pristine MWCNT composites had higher conductivity overall than the amine-functionalized MWCNT composites. Aligned MWCNT also had higher conductivity than unaligned MWCNT. At higher frequencies, perpendicular measurements of the aligned MWCNT were close to the non-aligned MWCNT. However, at low frequencies, the aligned perpendicular MWCNT had higher conductivity than the non-aligned one. Parallel measurements of aligned MWCNTs composites had the highest conductivity [71].
The effect of functionalizing CNT composites varies widely depending on the modifiers, additives, and solvents used. In the previous case (Figure 21), the conductivity increased with functionalization, as shown in Figure 22. The effect of the modifiers’ conductivity cannot be determined from Figure 20 since plain MWCNT composites in the same processing conditions was not compared to. However, functionalization may be a solution to obtain even distribution of MWCNT in the polymer matrices.

2.5. Effect of Aspect Ratio of MWCNT

The ratio between the size of the MWCNTs and size of the matrix particles is important to consider in the fabrication of composites. It is difficult to compare composites of different research papers because even if the same type of material is used, the sizes used may be different.
Martin et al. studied the effect of CNT lengths on epoxy composites [47]. Figure 23 displays the change in conductivity versus CNT content for three different CNT lengths: 10, 17, and 43 μm [52]. The polymer matrix is based on a bisphenol-A resin (Araldite LY 556 from Vantico, Basel, Switzerland) and an amine hardener (Araldite HY 932 from Vantico). In this case, the composites made from CNTs with 10 μm in length percolated first, followed by 17 μm CNTs. Therefore, for composites using the same matrix and CNT diameter (~50 nm), it is shown that shorter CNTs would be preferred, most likely due to increase in the difference in size between the CNT and epoxy matrix [52].
Figure 24 compares the resistivity of composites made with nanotubes of different lengths in PMMA [9,72]. The matrix material for this study was PMMA from Buehler’s Transoptic Powder. The PMMA used was polydisperse with a particle size in the range of 10−100 μm. Carbon nanotubes were used as the filler. The shorter CNTs were nominally 8 nm in diameter but were found to be 20 nm in some cases and 0.5–2 μm in length. The longer CNTs were nominally 8–15 nm in diameter and 10–50 μm in length. They were bought from Cheaptubes.com. Four of the series were made through mechanical mixing with either 150 °C or 170 °C as compression molding temperature [9,72]. The last two were made through solution and melt mixing with 170 °C as compression temperature [9].
In Figure 24, the short-MWCNT mechanically mixed composites at both 150 °C and 170 °C have lower percolation points than composites made with long-MWCNT composites. In the case of mechanically mixed composites, the increased difference in size ratio between the PMMA and MWCNT length allows the CNTs to form a segregated network easier. Melt mixed composites dispersed the CNTs so well that they showed the highest percolation point out of the different series shown, while solution made samples sit in between [9,72].
Figure 25 displays the same data as in Figure 4 and Figure 11 with some points not included due to size information not being provided [1,3,9,15,17,18,19,20,21,22,23,24,25,26,27,28,29,30,31,32,33,34,35,36,37,38,39,40,41,42,43,44,45,46,47,48,49,50,51,52,53,54,55,56,57]. In this case, the data is plotted as the change in percolation threshold with the diameter/length of the MWCNTs. While longer nanotubes increase pc in some cases, it is difficult to draw conclusions unless the size of the matrix and processing method is also considered. This emphasizes the importance of taking into account the history of the sample and its constituent sizes. All of them combined change the resulting properties, which is difficult to show in a 2D graph.

2.6. Single-Walled Carbon Nanotube (SWCNT)

Single-walled carbon nanotubes (SWCNTs) need to be explored separately from MWCNTs. Purity may also affect both types of nanotubes; Pötschke et al. studied the effect of purity on SWCNT/PC composites [73]. As the purity of the SWCNT increased, the percolation threshold increased and conductivity decreased (Figure 26). There are multiple possibilities for this result. One is that the CNT lattice was weakened by defects caused during purification. The CNTs would then break under the shear of melt mixing and decrease the aspect ratio of the CNTs. A second possibility is the removal of non-CNT particles causing an increase in CNT interparticle interaction, resulting in increased agglomeration and higher conductivity [73].
Figure 27 is a compilation of percolation thresholds and maximum conductivity values for several polymer system matrices with SWCNT disregarding processing methods and size of SWCNT [25,51,56,73,74,75,76,77,78,79,80,81,82,83,84,85,86,87,88,89,90,91,92,93]. In Figure 27a, it can be seen that percolation thresholds were below 4 wt% in all cases, with the majority being less than 1 wt%. In Figure 27b, most max conductivity values are below 10 S/m at concentrations varying from about 0.01 to 15 wt%. As a result, maximum conductivity values above 100 S/m are regarded as outliers [93]. For more details about the individual points, please see Table S2 in the supplementary file.

3. Conclusions

The addition of MWCNTs can increase the electrical, mechanical, and thermal properties of a composite material. This paper focused on insulating polymer matrices with MWCNTs as fillers. After explaining methods of functionalization of the CNTs and the importance of percolation, the general steps for MWCNT and polymer mixing were discussed. It was emphasized that the type of polymer, functionalization method of CNTs, and processing technique used have a strong influence on the resulting microstructure and properties of the composite, along with the amount of CNT needed to achieve percolation in the composite.
There are several trends shown in this paper, which are summarized in Table 2. First, a percolation threshold will be reached as MWCNT content is increased, causing the conductivity to jump orders of magnitude and for the composite to transition from insulator to conductor. The composites also may be represented as two parallel RC circuits with some inductance in some cases. Second, the polymer matrix is also important to electrical properties. Segregated structures and amorphous systems are able to achieve lower percolation thresholds and higher conductivity than semicrystalline materials. Third, functionalization may increase or decrease conductivity by distributing the MWCNTs. Fourth, thermal history and processing is very important to the resulting composite properties.
Theoretical and experimental values for percolation threshold show large discrepancies for different polymer systems and processing methods due possibly to poor dispersion or differences in the starting materials, thermal history, and/or sizes of the fillers. Annealing can be successfully used to get rid of some of these discrepancies. Additionally, the ratio of the size of the filler to matrix is very important. The smaller the ratio, the easier it is for percolation to be achieved. Comparison between composites is unreliable, unless all factors are taken into account. Lastly, purification may cause a decrease in conductivity and an increase in percolation threshold.

Supplementary Materials

The following are available online at https://www.mdpi.com/2504-477X/4/3/100/s1, Table S1: MWCNT/Polymer Composite Electrical Data, Table S2: SWCNT/Polymer Composite Electrical Data.

Funding

We acknowledge support by the Department of Education Graduate Assistance in Areas of National Need (GAANN) program at Georgia Institute of Technology (Award #P200A180075).

Conflicts of Interest

The authors declare no conflict of interest.

References

  1. Khattari, Z.; Maghrabi, M.; McNally, T.; Abdul Jawad, S. Impedance study of polymethyl methacrylate composites/multi-walled carbon nanotubes (PMMA/MWCNTs). Phys. B Condens. Matter 2012, 407, 759–764. [Google Scholar] [CrossRef]
  2. Zhang, S.; Nguyen, N.; Leonhardt, B.; Jolowsky, C.; Hao, A.; Park, J.G.; Liang, R. Carbon-Nanotube-Based Electrical Conductors: Fabrication, Optimization, and Applications. Adv. Electron. Mater. 2019, 5, 1800811. [Google Scholar] [CrossRef]
  3. Logakis, E.; Pandis, C.; Pissis, P.; Pionteck, J.; Pötschke, P. Highly conducting poly(methyl methacrylate)/carbon nanotubes composites: Investigation on their thermal, dynamic-mechanical, electrical and dielectric properties. Compos. Sci. Technol. 2011, 71, 854–862. [Google Scholar] [CrossRef] [Green Version]
  4. Logakis, E.; Pandis, C.; Peoglos, V.; Pissis, P.; Pionteck, J.; Pötschke, P.; Mičušík, M.; Omastová, M. Electrical/dielectric properties and conduction mechanism in melt processed polyamide/multi-walled carbon nanotubes composites. Polymer 2009, 50, 5103–5111. [Google Scholar] [CrossRef]
  5. Zhang, S.; Nguyen, N.; Park, J.G.; Hao, A.; Liang, R. Chapter 14—Carbon Nanotubes and Their Assemblies: Applications in Electromagnetic Interference Shielding. In Nanotube Superfiber Materials, 2nd ed.; Schulz, M.J., Shanov, V., Yin, Z., Cahay, M., Eds.; William Andrew Publishing: Norwich, NY, USA, 2019; pp. 335–357. [Google Scholar]
  6. Aalaie, J.; Rahmatpour, A.; Maghami, S. Preparation and Characterization of Linear Low Density Polyethylene/Carbon Nanotube Nanocomposites. J. Macromol. Sci. Part B 2007, 46, 877–889. [Google Scholar] [CrossRef]
  7. Macutkevic, J.; Seliuta, D.; Valusis, G.; Adomavicius, R.; Krotkus, A.; Kuzhir, P.; Paddubskaya, A.; Maksimenko, S.; Kuznetsov, V.; Mazov, I.; et al. Multi-walled carbon nanotubes/PMMA composites for THz applications. Diam. Relat. Mater. 2012, 25, 13–18. [Google Scholar] [CrossRef]
  8. Alig, I.; Pötschke, P.; Lellinger, D.; Skipa, T.; Pegel, S.; Kasaliwal, G.R.; Villmow, T. Establishment, morphology and properties of carbon nanotube networks in polymer melts. Polymer 2012, 53, 4–28. [Google Scholar] [CrossRef]
  9. Watt, M.R.; Gerhardt, R.A. Effect of processing on the properties and morphology of MWCNT-polymer networks. Mater. Res. Express 2020, 7, 015075. [Google Scholar] [CrossRef]
  10. Jiang, M.-J.; Dang, Z.-M.; Yao, S.-H.; Bai, J. Effects of surface modification of carbon nanotubes on the microstructure and electrical properties of carbon nanotubes/rubber nanocomposites. Chem. Phys. Lett. 2008, 457, 352–356. [Google Scholar] [CrossRef]
  11. Deng, H.; Skipa, T.; Zhang, R.; Lellinger, D.; Bilotti, E.; Alig, I.; Peijs, T. Effect of melting and crystallization on the conductive network in conductive polymer composites. Polymer 2009, 50, 3747–3754. [Google Scholar] [CrossRef]
  12. Bertram, B.D.; Gerhardt, R.A.; Schultz, J.W. Impedance response and modeling of composites containing aligned semiconductor whiskers: Effects of dc-bias partitioning and percolated-cluster length, topology, and filler interfaces. J. Appl. Phys. 2012, 111, 124913. [Google Scholar] [CrossRef]
  13. Muhlbauer, R.L.; Pruyn, T.L.; Puckett, W.T.; Gerhardt, R.A. Effect of graphitic filler size and shape on the microstructure, electrical percolation behavior and thermal properties of nanostructured multilayered carbon films deposited onto paper substrates. J. Mater. Res. 2014, 29, 472–484. [Google Scholar] [CrossRef]
  14. Pruyn, T.L.; Gerhardt, R.A. Detection of Different Interfaces in Percolated Networks of Antimony Tin Oxide: Borosilicate Glass Composites by Impedance Spectroscopy. J. Am. Ceram. Soc. 2015, 98, 154–162. [Google Scholar] [CrossRef]
  15. Schmidt, R.H.; Kinloch, I.A.; Burgess, A.N.; Windle, A.H. The Effect of Aggregation on the Electrical Conductivity of Spin-Coated Polymer/Carbon Nanotube Composite Films. Langmuir 2007, 23, 5707–5712. [Google Scholar] [CrossRef]
  16. Han, M.S.; Lee, Y.K.; Lee, H.S.; Yun, C.H.; Kim, W.N. Electrical, morphological and rheological properties of carbon nanotube composites with polyethylene and poly(phenylene sulfide) by melt mixing. Chem. Eng. Sci. 2009, 64, 4649–4656. [Google Scholar] [CrossRef]
  17. McClory, C.; McNally, T.; Baxendale, M.; Pötschke, P.; Blau, W.; Ruether, M. Electrical and rheological percolation of PMMA/MWCNT nanocomposites as a function of CNT geometry and functionality. Eur. Polym. J. 2010, 46, 854–868. [Google Scholar] [CrossRef] [Green Version]
  18. Chen, H.; Muthuraman, H.; Stokes, P.; Zou, J.; Liu, X.; Wang, J.; Huo, Q.; Khondaker, S.I.; Zhai, L. Dispersion of carbon nanotubes and polymer nanocomposite fabrication using trifluoroacetic acid as a co-solvent. Nanotechnology 2007, 18, 415606. [Google Scholar] [CrossRef]
  19. Kim, H.M.; Choi, M.-S.; Joo, J.; Cho, S.J.; Yoon, H.S. Complexity in charge transport for multiwalled carbon nanotube and poly(methyl methacrylate) composites. Phys. Rev. B 2006, 74, 054202. [Google Scholar] [CrossRef]
  20. Ryu, S.H.; Cho, H.-B.; Moon, J.W.; Kwon, Y.-T.; Eom, N.S.A.; Lee, S.; Hussain, M.; Choa, Y.-H. Highly conductive polymethly(methacrylate)/multi-wall carbon nanotube composites by modeling a three-dimensional percolated microstructure. Compos. Part A Appl. Sci. Manuf. 2016, 91, 133–139. [Google Scholar] [CrossRef]
  21. Hermant, M.C.; Smeets, N.M.B.; van Hal, R.C.F.; Meuldijk, J.; Heuts, H.P.A.; Klumperman, B.; van Herk, A.M.; Koning, C.E. Influence of the molecular weight distribution on the percolation threshold of carbon nanotube—Polystyrene composites. E Polym. 2009, 9, 1–13. [Google Scholar] [CrossRef]
  22. Ryu, S.H.; Cho, H.-B.; Kim, S.; Kwon, Y.-T.; Lee, J.; Park, K.-R.; Choa, Y.-H. The effect of polymer particle size on three-dimensional percolation in core-shell networks of PMMA/MWCNTs nanocomposites: Properties and mathematical percolation model. Compos. Sci. Technol. 2018, 165, 1–8. [Google Scholar] [CrossRef]
  23. Lisunova, M.O.; Mamunya, Y.P.; Lebovka, N.I.; Melezhyk, A.V. Percolation behaviour of ultrahigh molecular weight polyethylene/multi-walled carbon nanotubes composites. Eur. Polym. J. 2007, 43, 949–958. [Google Scholar] [CrossRef]
  24. McNally, T.; Pötschke, P.; Halley, P.; Murphy, M.; Martin, D.; Bell, S.E.J.; Brennan, G.P.; Bein, D.; Lemoine, P.; Quinn, J.P. Polyethylene multiwalled carbon nanotube composites. Polymer 2005, 46, 8222–8232. [Google Scholar] [CrossRef]
  25. Mierczynska, A.; Mayne-L’Hermite, M.; Boiteux, G.; Jeszka, J.K. Electrical and mechanical properties of carbon nanotube/ultrahigh-molecular-weight polyethylene composites prepared by a filler prelocalization method. J. Appl. Polym. Sci. 2007, 105, 158–168. [Google Scholar] [CrossRef]
  26. Jouni, M.; Boiteux, G.; Massardier, V. New melt mixing polyethylene multiwalled carbon nanotube nanocomposites with very low electrical percolation threshold. Polym. Adv. Technol. 2013, 24, 909–915. [Google Scholar] [CrossRef]
  27. Jouni, M.; Faure-Vincent, J.; Fedorko, P.; Djurado, D.; Boiteux, G.; Massardier, V. Charge carrier transport and low electrical percolation threshold in multiwalled carbon nanotube polymer nanocomposites. Carbon 2014, 76, 10–18. [Google Scholar] [CrossRef]
  28. Al-Saleh, M.H. Carbon nanotube-filled polypropylene/polyethylene blends: Compatibilization and electrical properties. Polym. Bull. 2016, 73, 975–987. [Google Scholar] [CrossRef]
  29. Müller, M.T.; Krause, B.; Pötschke, P. A successful approach to disperse MWCNTs in polyethylene by melt mixing using polyethylene glycol as additive. Polymer 2012, 53, 3079–3083. [Google Scholar] [CrossRef]
  30. Shi, Y.-D.; Li, J.; Tan, Y.-J.; Chen, Y.-F.; Wang, M. Percolation behavior of electromagnetic interference shielding in polymer/multi-walled carbon nanotube nanocomposites. Compos. Sci. Technol. 2019, 170, 70–76. [Google Scholar] [CrossRef]
  31. Mičušík, M.; Omastová, M.; Pionteck, J.; Pandis, C.; Logakis, E.; Pissis, P. Influence of surface treatment of multiwall carbon nanotubes on the properties of polypropylene/carbon nanotubes nanocomposites. Polym. Adv. Technol. 2011, 22, 38–47. [Google Scholar] [CrossRef]
  32. Tjong, S.C.; Liang, G.D.; Bao, S.P. Electrical behavior of polypropylene/multiwalled carbon nanotube nanocomposites with low percolation threshold. Scr. Mater. 2007, 57, 461–464. [Google Scholar] [CrossRef]
  33. Seo, M.-K.; Park, S.-J. Electrical resistivity and rheological behaviors of carbon nanotubes-filled polypropylene composites. Chem. Phys. Lett. 2004, 395, 44–48. [Google Scholar] [CrossRef]
  34. Lee, S.H.; Kim, M.W.; Kim, S.H.; Youn, J.R. Rheological and electrical properties of polypropylene/MWCNT composites prepared with MWCNT masterbatch chips. Eur. Polym. J. 2008, 44, 1620–1630. [Google Scholar] [CrossRef]
  35. Müller, M.T.; Krause, B.; Kretzschmar, B.; Pötschke, P. Influence of feeding conditions in twin-screw extrusion of PP/MWCNT composites on electrical and mechanical properties. Compos. Sci. Technol. 2011, 71, 1535–1542. [Google Scholar] [CrossRef]
  36. Pan, Y.; Li, L.; Chan, S.H.; Zhao, J. Correlation between dispersion state and electrical conductivity of MWCNTs/PP composites prepared by melt blending. Compos. Part A Appl. Sci. Manuf. 2010, 41, 419–426. [Google Scholar] [CrossRef]
  37. Pegel, S.; Pötschke, P.; Petzold, G.; Alig, I.; Dudkin, S.M.; Lellinger, D. Dispersion, agglomeration, and network formation of multiwalled carbon nanotubes in polycarbonate melts. Polymer 2008, 49, 974–984. [Google Scholar] [CrossRef]
  38. Pötschke, P.; Abdel-Goad, M.; Alig, I.; Dudkin, S.; Lellinger, D. Rheological and dielectrical characterization of melt mixed polycarbonate-multiwalled carbon nanotube composites. Polymer 2004, 45, 8863–8870. [Google Scholar] [CrossRef]
  39. Chen, L.; Pang, X.-J.; Yu, Z.-L. Study on polycarbonate/multi-walled carbon nanotubes composite produced by melt processing. Mater. Sci. Eng. A 2007, 457, 287–291. [Google Scholar] [CrossRef]
  40. Pötschke, P.; Dudkin, S.M.; Alig, I. Dielectric spectroscopy on melt processed polycarbonate—Multiwalled carbon nanotube composites. Polymer 2003, 44, 5023–5030. [Google Scholar] [CrossRef]
  41. Pötschke, P.; Fornes, T.D.; Paul, D.R. Rheological behavior of multiwalled carbon nanotube/polycarbonate composites. Polymer 2002, 43, 3247–3255. [Google Scholar] [CrossRef]
  42. Maiti, S.; Shrivastava, N.; Suin, S.; Khatua, B. A strategy for achieving low percolation and high electrical conductivity in melt-blended polycarbonate (PC)/multiwall carbon nanotube (MWCNT) nanocomposites: Electrical and thermo-mechanical properties. Express Polym. Lett. 2013, 7, 505–518. [Google Scholar] [CrossRef]
  43. Jin, S.H.; Choi, D.K.; Lee, D.S. Electrical and rheological properties of polycarbonate/multiwalled carbon nanotube nanocomposites. Colloids Surf. A Physicochem. Eng. Asp. 2008, 313–314, 242–245. [Google Scholar] [CrossRef]
  44. Han, M.S.; Lee, Y.K.; Kim, W.N.; Lee, H.S.; Joo, J.S.; Park, M.; Lee, H.J.; Park, C.R. Effect ofF multi-walled carbon nanotube dispersion on the electrical, morphological and rheological properties of polycarbonate/multi-walled carbon nanotube composites. Macromol. Res. 2009, 17, 863–869. [Google Scholar] [CrossRef]
  45. Kodgire, P.V.; Bhattacharyya, A.R.; Bose, S.; Gupta, N.; Kulkarni, A.R.; Misra, A. Control of multiwall carbon nanotubes dispersion in polyamide6 matrix: An assessment through electrical conductivity. Chem. Phys. Lett. 2006, 432, 480–485. [Google Scholar] [CrossRef]
  46. Krause, B.; Pötschke, P.; Häußler, L. Influence of small scale melt mixing conditions on electrical resistivity of carbon nanotube-polyamide composites. Compos. Sci. Technol. 2009, 69, 1505–1515. [Google Scholar] [CrossRef]
  47. Krause, B.; Petzold, G.; Pegel, S.; Pötschke, P. Correlation of carbon nanotube dispersability in aqueous surfactant solutions and polymers. Carbon 2009, 47, 602–612. [Google Scholar] [CrossRef]
  48. Socher, R.; Krause, B.; Boldt, R.; Hermasch, S.; Wursche, R.; Pötschke, P. Melt mixed nano composites of PA12 with MWNTs: Influence of MWNT and matrix properties on macrodispersion and electrical properties. Compos. Sci. Technol. 2011, 71, 306–314. [Google Scholar] [CrossRef]
  49. Kovacs, J.Z.; Velagala, B.S.; Schulte, K.; Bauhofer, W. Two percolation thresholds in carbon nanotube epoxy composites. Compos. Sci. Technol. 2007, 67, 922–928. [Google Scholar] [CrossRef] [Green Version]
  50. Li, J.; Ma, P.C.; Chow, W.S.; To, C.K.; Tang, B.Z.; Kim, J.-K. Correlations between Percolation Threshold, Dispersion State, and Aspect Ratio of Carbon Nanotubes. Adv. Funct. Mater. 2007, 17, 3207–3215. [Google Scholar] [CrossRef]
  51. Moisala, A.; Li, Q.; Kinloch, I.A.; Windle, A.H. Thermal and electrical conductivity of single- and multi-walled carbon nanotube-epoxy composites. Compos. Sci. Technol. 2006, 66, 1285–1288. [Google Scholar] [CrossRef]
  52. Martin, C.A.; Sandler, J.K.W.; Shaffer, M.S.P.; Schwarz, M.K.; Bauhofer, W.; Schulte, K.; Windle, A.H. Formation of percolating networks in multi-wall carbon-nanotube—Epoxy composites. Compos. Sci. Technol. 2004, 64, 2309–2316. [Google Scholar] [CrossRef]
  53. Sandler, J.; Shaffer, M.S.P.; Prasse, T.; Bauhofer, W.; Schulte, K.; Windle, A.H. Development of a dispersion process for carbon nanotubes in an epoxy matrix and the resulting electrical properties. Polymer 1999, 40, 5967–5971. [Google Scholar] [CrossRef]
  54. Yuen, S.-M.; Ma, C.-C.M.; Wu, H.-H.; Kuan, H.-C.; Chen, W.-J.; Liao, S.-H.; Hsu, C.-W.; Wu, H.-L. Preparation and thermal, electrical, and morphological properties of multiwalled carbon nanotubeand epoxy composites. J. Appl. Polym. Sci. 2007, 103, 1272–1278. [Google Scholar] [CrossRef]
  55. Sandler, J.K.W.; Kirk, J.E.; Kinloch, I.A.; Shaffer, M.S.P.; Windle, A.H. Ultra-low electrical percolation threshold in carbon-nanotube-epoxy composites. Polymer 2003, 44, 5893–5899. [Google Scholar] [CrossRef]
  56. Gojny, F.H.; Wichmann, M.H.G.; Fiedler, B.; Kinloch, I.A.; Bauhofer, W.; Windle, A.H.; Schulte, K. Evaluation and identification of electrical and thermal conduction mechanisms in carbon nanotube/epoxy composites. Polymer 2006, 47, 2036–2045. [Google Scholar] [CrossRef]
  57. Prystaj, L.A. Effect of Carbon Filler Characteristics on the Electrical Properties of Conductive Polymer Composites Possessing Segregated Network Microstructures. Masters Thesis, Georgia Institute of Technology, Atlanta, GA, USA, 2008. [Google Scholar]
  58. He, X.J.; Du, J.H.; Ying, Z.; Cheng, H.M.; He, X.J. Positive temperature coefficient effect in multiwalled carbon nanotube/high-density polyethylene composites. Appl. Phys. Lett. 2005, 86, 062112. [Google Scholar] [CrossRef]
  59. Stauffer, D.; Aharony, A. Introduction to Percolation Theory; e-book; CRC Press: Boca Raton, FL, USA, 2018. [Google Scholar]
  60. Shrivastava, N.K.; Suin, S.; Maiti, S.; Khatua, B.B. Ultralow Electrical Percolation Threshold in Poly(styrene-co-acrylonitrile)/Carbon Nanotube Nanocomposites. Ind. Eng. Chem. Res. 2013, 52, 2858–2868. [Google Scholar] [CrossRef]
  61. Du, J.; Zhao, L.; Zeng, Y.; Zhang, L.; Li, F.; Liu, P.; Liu, C. Comparison of electrical properties between multi-walled carbon nanotube and graphene nanosheet/high density polyethylene composites with a segregated network structure. Carbon 2011, 49, 1094–1100. [Google Scholar] [CrossRef]
  62. Gao, J.-F.; Li, Z.-M.; Meng, Q.-j.; Yang, Q. CNTs/ UHMWPE composites with a two-dimensional conductive network. Mater. Lett. 2008, 62, 3530–3532. [Google Scholar] [CrossRef]
  63. Pang, H.; Yan, D.-X.; Bao, Y.; Chen, J.-B.; Chen, C.; Li, Z.-M. Super-tough conducting carbon nanotube/ultrahigh-molecular-weight polyethylene composites with segregated and double-percolated structure. J. Mater. Chem. 2012, 22, 23568–23575. [Google Scholar] [CrossRef]
  64. Jiang, M.-J.; Dang, Z.-M.; Bozlar, M.; Miomandre, F.; Bai, J. Broad-frequency dielectric behaviors in multiwalled carbon nanotube/rubber nanocomposites. J. Appl. Phys. 2009, 106, 084902. [Google Scholar] [CrossRef] [Green Version]
  65. Alig, I.; Skipa, T.; Lellinger, D.; Bierdel, M.; Meyer, H. Dynamic percolation of carbon nanotube agglomerates in a polymer matrix: Comparison of different model approaches. Phys. Status Solidi (b) 2008, 245, 2264–2267. [Google Scholar] [CrossRef]
  66. Combessis, A.; Bayon, L.; Flandin, L. Effect of filler auto-assembly on percolation transition in carbon nanotube/polymer composites. Appl. Phys. Lett. 2013, 102, 011907. [Google Scholar] [CrossRef]
  67. Alig, I.; Pötschke, P.; Pegel, S.; Dudkin, S.; Lellinger, D. Plastic composites containing carbon nanotubes: Optimisation of processing conditions and properties. Rubber Fibre Plast. 2008, 3, 92–95. [Google Scholar]
  68. Klonos, P.A.; Tegopoulos, S.N.; Koutsiara, C.S.; Kontou, E.; Pissis, P.; Kyritsis, A. Effects of CNTs on thermal transitions, thermal diffusivity and electrical conductivity in nanocomposites: Comparison between an amorphous and a semicrystalline polymer matrix. Soft Matter 2019, 15, 1813–1824. [Google Scholar] [CrossRef]
  69. Schlea, M.R.; Meree, C.E.; Gerhardt, R.A.; Mintz, E.A.; Shofner, M.L. Network behavior of thermosetting polyimide/multiwalled carbon nanotube composites. Polymer 2012, 53, 1020–1027. [Google Scholar] [CrossRef]
  70. Kasaliwal, G.R.; Villmow, T.; Pegel, S.; Pötschke, P. 4 - Influence of material and processing parameters on carbon nanotube dispersion in polymer melts. In Polymer–Carbon Nanotube Composites; McNally, T., Pötschke, P., Eds.; Woodhead Publishing: Cambridge, UK, 2011; pp. 92–132. [Google Scholar]
  71. Zhu, Y.-F.; Ma, C.; Zhang, W.; Zhang, R.-P.; Koratkar, N.; Liang, J. Alignment of multiwalled carbon nanotubes in bulk epoxy composites via electric field. J. Appl. Phys. 2009, 105, 054319. [Google Scholar] [CrossRef]
  72. Janoff, A.; Gerhardt, R.A. Comparison of Short and Long Multi Wall Carbon Nanotube and Polymethyl Methacrylate Composites. In Proceedings of the MRS, San Francisco, CA, USA, 6–10 April 2015; Available online: http://hdl.handle.net/1853/62965 (accessed on 9 July 2020).
  73. Pötschke, P.; Hornbostel, B.; Roth, S.; Vohrer, U.; Dudkin, S.M.; Alig, I. Purification and Percolation—Unexpected Phenomena in Nanotube Polymer Composites. AIP Conf. Proc. 2005, 786, 596–601. [Google Scholar]
  74. Kymakis, E.; Amaratunga, G.A.J. Electrical properties of single-wall carbon nanotube-polymer composite films. J. Appl. Phys. 2006, 99, 084302. [Google Scholar] [CrossRef]
  75. Liu, L.; Matitsine, S.; Gan, Y.B.; Chen, L.F.; Kong, L.B.; Rozanov, K.N. Frequency dependence of effective permittivity of carbon nanotube composites. J. Appl. Phys. 2007, 101, 094106. [Google Scholar] [CrossRef]
  76. Dai, J.; Wang, Q.; Li, W.; Wei, Z.; Xu, G. Properties of well aligned SWNT modified poly (methyl methacrylate) nanocomposites. Mater. Lett. 2007, 61, 27–29. [Google Scholar] [CrossRef]
  77. Chauvet, O.; Benoit, J.M.; Corraze, B. Electrical, magneto-transport and localization of charge carriers in nanocomposites based on carbon nanotubes. Carbon 2004, 42, 949–952. [Google Scholar] [CrossRef]
  78. Nogales, A.; Broza, G.; Roslaniec, Z.; Schulte, K.; Šics, I.; Hsiao, B.S.; Sanz, A.; García-Gutiérrez, M.C.; Rueda, D.R.; Domingo, C.; et al. Low Percolation Threshold in Nanocomposites Based on Oxidized Single Wall Carbon Nanotubes and Poly(butylene terephthalate). Macromolecules 2004, 37, 7669–7672. [Google Scholar] [CrossRef]
  79. Zhang, Q.; Rastogi, S.; Chen, D.; Lippits, D.; Lemstra, P.J. Low percolation threshold in single-walled carbon nanotube/high density polyethylene composites prepared by melt processing technique. Carbon 2006, 44, 778–785. [Google Scholar] [CrossRef]
  80. Bryning, M.B.; Islam, M.F.; Kikkawa, J.M.; Yodh, A.G. Very Low Conductivity Threshold in Bulk Isotropic Single-Walled Carbon Nanotube–Epoxy Composites. Adv. Mater. 2005, 17, 1186–1191. [Google Scholar] [CrossRef]
  81. Barrau, S.; Demont, P.; Peigney, A.; Laurent, C.; Lacabanne, C. DC and AC Conductivity of Carbon Nanotubes−Polyepoxy Composites. Macromolecules 2003, 36, 5187–5194. [Google Scholar] [CrossRef] [Green Version]
  82. Du, F.; Scogna, R.C.; Zhou, W.; Brand, S.; Fischer, J.E.; Winey, K.I. Nanotube Networks in Polymer Nanocomposites:  Rheology and Electrical Conductivity. Macromolecules 2004, 37, 9048–9055. [Google Scholar] [CrossRef]
  83. Li, N.; Huang, Y.; Du, F.; He, X.; Lin, X.; Gao, H.; Ma, Y.; Li, F.; Chen, Y.; Eklund, P.C. Electromagnetic Interference (EMI) Shielding of Single-Walled Carbon Nanotube Epoxy Composites. Nano Lett. 2006, 6, 1141–1145. [Google Scholar] [CrossRef]
  84. Du, F.; Fischer, J.E.; Winey, K.I. Effect of nanotube alignment on percolation conductivity in carbon nanotube/polymer composites. Phys. Rev. B 2005, 72, 121404. [Google Scholar] [CrossRef] [Green Version]
  85. Du, F.; Fischer, J.E.; Winey, K.I. Coagulation method for preparing single-walled carbon nanotube/poly(methyl methacrylate) composites and their modulus, electrical conductivity, and thermal stability. J. Polym. Sci. Part B Polym. Phys. 2003, 41, 3333–3338. [Google Scholar] [CrossRef]
  86. Du, F.; Guthy, C.; Kashiwagi, T.; Fischer, J.E.; Winey, K.I. An infiltration method for preparing single-wall nanotube/epoxy composites with improved thermal conductivity. J. Polym. Sci. Part B Polym. Phys. 2006, 44, 1513–1519. [Google Scholar] [CrossRef] [Green Version]
  87. Dettlaff-Weglikowska, U.; Kaempgen, M.; Hornbostel, B.; Skakalova, V.; Wang, J.; Liang, J.; Roth, S. Conducting and transparent SWNT/polymer composites. Phys. Status Solidi (b) 2006, 243, 3440–3444. [Google Scholar] [CrossRef]
  88. Hornbostel, B.; Pötschke, P.; Kotz, J.; Roth, S. Single-walled carbon nanotubes/polycarbonate composites: Basic electrical and mechanical properties. Phys. Status Solidi (b) 2006, 243, 3445–3451. [Google Scholar] [CrossRef]
  89. Grossiord, N.; Wouters, M.E.L.; Miltner, H.E.; Lu, K.; Loos, J.; Mele, B.V.; Koning, C.E. Isotactic polypropylene/carbon nanotube composites prepared by latex technology: Electrical conductivity study. Eur. Polym. J. 2010, 46, 1833–1843. [Google Scholar] [CrossRef]
  90. Jeon, K.; Lumata, L.; Tokumoto, T.; Steven, E.; Brooks, J.; Alamo, R. Low electrical conductivity threshold and crystalline morphology of single-walled carbon nanotubes—High density polyethylene nanocomposites characterized by SEM, Raman spectroscopy and AFM. Polymer 2007, 48, 4751–4764. [Google Scholar] [CrossRef]
  91. Krause, B.; Pötschke, P.; Ilin, E.; Predtechenskiy, M. Melt mixed SWCNT-polypropylene composites with very low electrical percolation. Polymer 2016, 98, 45–50. [Google Scholar] [CrossRef]
  92. Benoit, J.M.; Corraze, B.; Lefrant, S.; Blau, W.J.; Bernier, P.; Chauvet, O. Transport properties of PMMA-Carbon Nanotubes composites. Synth. Met. 2001, 121, 1215–1216. [Google Scholar] [CrossRef]
  93. Skákalová, V.; Dettlaff-Weglikowska, U.; Roth, S. Electrical and mechanical properties of nanocomposites of single wall carbon nanotubes with PMMA. Synth. Met. 2005, 152, 349–352. [Google Scholar] [CrossRef]
Figure 1. Transmission electron microscopy images of multi-walled carbon nanotubes (MWCNT) powder with the inset image at a higher magnification.
Jcs 04 00100 g001
Figure 2. Schematics of particle processing methods used to make polymer-CNT composites. (a) mechanical mixing; (b) melt mixing; (c) solution mixing [9].
Jcs 04 00100 g002
Figure 3. Percolation curve of MWCNT/ poly(methyl methacrylate) (PMMA) made using mechanical mixing. Modified from [9].
Jcs 04 00100 g003
Figure 4. (a) Percolation threshold and (b) max conductivity values at various MWCNT contents for several MWCNT/polymer systems [1,3,9,15,17,18,19,20,21,22,23,24,25,26,27,28,29,30,31,32,33,34,35,36,37,38,39,40,41,42,43,44,45,46,47,48,49,50,51,52,53,54,55,56,57]. See Table S1 for more details.
Jcs 04 00100 g004
Figure 5. Variation of (a) the real and imaginary impedance, (b) dielectric constant, and (c) AC conductivity with frequency for MWCNT/PMMA composite with varying amounts of MWCNT. σAC was obtained by subtracting σDC from the total conductivity [1].
Jcs 04 00100 g005
Figure 6. Variation of the real part of conductivity with frequency for MWCNT/PMMA composite with varying amounts of MWCNT at room temperature [3].
Jcs 04 00100 g006
Figure 7. DC conductivity vs. MWCNT vol% for nanocomposites with regard to the percolation threshold [3].
Jcs 04 00100 g007
Figure 8. Variation of conductivity with frequency for MWCNT/PA composite with varying amounts of MWCNT at room temperature [4].
Jcs 04 00100 g008
Figure 9. Impedance spectra of the MWCNT/RT-SR composites at fMWCNT = (a) 0.019, (b) 0.026, (c) 0.029, and (d) 0.032. (e) Equivalent circuits of the MWCNT/RT-SR composites [64].
Jcs 04 00100 g009
Figure 10. Impedance magnitude and phase angle vs. frequency for (a,b) mechanically, (c,d) melt, and (e,f) solution mixed CNT-PMMA composites [9].
Jcs 04 00100 g010
Figure 11. Percolation thresholds for several carbon nanotube/polymer composites with different processing conditions [1,3,9,15,17,18,19,20,21,22,23,24,25,26,27,28,29,30,31,32,33,34,35,36,37,38,39,40,41,42,43,44,45,46,47,48,49,50,51,52,53,54,55,56,57]. For more details about individual points, please see Table S1 in the supplementary file.
Jcs 04 00100 g011
Figure 12. Percolation for injection molded polycarbonate plates with MWCNTs before and after annealing: (a) at room temperature (solid state) and (b) time evolution of the conductivity during annealing in the melt at 230 °C for samples with different MWCNT contents [65].
Jcs 04 00100 g012
Figure 13. Variation of conductivity with filler amount at different annealing steps for MWCNT/VLDPE [66].
Jcs 04 00100 g013
Figure 14. Electrical conductivity of (a) an amorphous and (b) a semi-crystalline polymer-MWCNT composite during heating-annealing-cooling cycles [8,67].
Jcs 04 00100 g014
Figure 15. Real conductivity versus (a) frequency and (b) CNT wt fraction for PE/MWCNT and SBR/MWCNT composites [68].
Jcs 04 00100 g015
Figure 16. (a) Electrical conductivity at 0.1 Hz for uncured and cured MWCNT/PETI-330 composites Linear fits for determining the percolation threshold for the (b) uncured and (c) cured nanocomposites. Modified from [69].
Jcs 04 00100 g016
Figure 17. Optical micrographs of polycarbonate with 1 wt% MWCNT (Baytubes C150HP) where the polycarbonate differs in melt viscosity: (a) low (Makrolon2205), (b) medium (Makrolon 2600), and (c) high (Makrolon 3108) melt viscosity [70].
Jcs 04 00100 g017
Figure 18. Variation of conductivity with frequency for compression molded polycarbonate/MWCNT plates (0.6 vol% MWCNT) and related TEM micrographs. (a) real (ε’) and imaginary (ε”) permittivity and AC conductivity (σ’) plotted vs frequency; (b) TEM micrographs of samples pressed at 300 °C; (c) and 250 °C [37].
Jcs 04 00100 g018
Figure 19. High-resolution transmission electron microscopy (HRTEM) images of CNT as prepared (1) and oxidized (2) [7].
Jcs 04 00100 g019
Figure 20. Variation of conductivity with frequency for MWCNTs/VMQ composites (1.6 vol% MWCNTs loading) with different modifiers at room temperature [10].
Jcs 04 00100 g020
Figure 21. Method used to make the PMMA/MWCNT composites and conductivity variation of the composite as a function of MWCNT content (wt%). The fitting plots of the composites using (a) DMF, (b) MeOH, and (c) random blending method by the scaling relation of log σ vs. log(φ–φc) [20].
Jcs 04 00100 g021
Figure 22. Electric conductivities of pure epoxy and nanocomposite samples containing MWNTs [71].
Jcs 04 00100 g022
Figure 23. Variation of conductivity with CNT content for three different nanotube lengths in epoxy composites [52].
Jcs 04 00100 g023
Figure 24. Comparison of two sizes of MWCNTs in PMMA composites with different compression temperatures [9,72].
Jcs 04 00100 g024
Figure 25. Variation of percolation threshold with the aspect ratio of CNTs used in different polymer matrix composites [1,3,9,15,17,18,19,20,21,22,23,24,25,26,27,28,29,30,31,32,33,34,35,36,37,38,39,40,41,42,43,44,45,46,47,48,49,50,51,52,53,54,55,56,57]. For more details, see Table S1 in the supplementary file.
Jcs 04 00100 g025
Figure 26. Conductivity versus Single Wall Nanotube (SWNT) concentration for melt-mixed SWNT/PC composites at different levels of SWCNT purity. Modified from [73].
Jcs 04 00100 g026
Figure 27. (a) Percolation threshold and (b) max conductivity values at various SWCNT contents for several SWCNT/polymer systems [25,51,56,73,74,75,76,77,78,79,80,81,82,83,84,85,86,87,88,89,90,91,92,93]. See Table S2 for specific details.
Jcs 04 00100 g027
Table 1. Percolation threshold values from recent research on carbon nanotube (CNT)-polymer composites. Modified from [20].
Polymer TypeFiller TypeFiller StructurePercolation Threshold (Wt%)Ref.
HDPE aMWCNTRandomly distributed2[58]
PMMASWCNTRandomly distributed0.3[59]
UHMWPE bMWCNTRandomly distributed3.1[60]
HDPE aMWCNTSegregated0.311[61]
SAN particles cMWCNTSegregated0.032[62]
UHMWPE b/PMMACNTSegregated0.3[63]
PMMAMWCNT_DMFSegregated0.0095[20]
PMMAMWCNT_MeOHSegregated0.051[20]
PMMAMWCNT (blended)Randomly distributed0.45[20]
PMMAMWCNT dSegregated0.05[9]
PMMAMWCNT eRandomly distributed3.85[9]
PMMAMWCNT fAgglomerated1.96[9]
a High density polyethylene b Ultrahigh molecular weight polyethylene c Poly(styrene-co-acrylonitrile d Mechanically mixed e Melt mixed f Solution mixed.
Table 2. Summary of Trends for MWCNT Polymer Composites.
Differences in Polymer SystemsPercolation threshold is higher for randomly distributed structures and lower for segregated
Effect of increasing the amount of MWCNTEven using the same polymer system, different percolation thresholds may be caused by differences in MWCNT characteristics and processing conditions
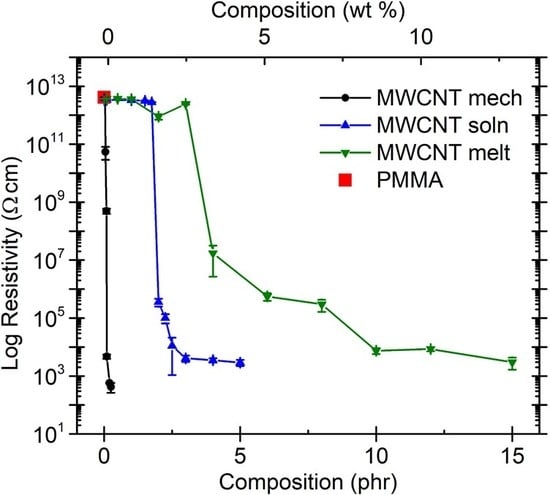
Effect of Processing MethodsMelt—evenly distributes
Solution—may cause any microstructure
Mechanical—segregated grain-like microstructure
Annealing—increase conductivity in both PC, PP and PE composites, decreased percolation threshold in PE composites
Curing—uncured PETI composite had higher conductivity than cured before percolation. Little difference above percolation
Melt viscosity—higher melt viscosity results in smaller initial agglomerates
Compression molding temperature: higher molding temperature resulted in more conductive composites
Modification of CNTThe effect of functionalizing CNT composites varies widely depending on the modifiers, additives, and solvents used. Functionalization may be a solution to obtain even distribution of CNT
Effect of Aspect Ratio of MWCNTShorter CNT results in lower percolation—due to increase in the difference in size between CNT and matrix
SWCNTPurity—increased purity decreased conductivity and increased the percolation threshold

