Article

Low-Velocity Impact Induced Damage Evaluation and Its Influence on the Residual Flexural Behavior of Glass/Epoxy Laminates Hybridized with Glass Fillers

by
Saravanakumar Kannivel
1,
Harini Subramanian
2,
Vellayaraj Arumugam
3 and
Hom N. Dhakal
4,*
1
Department of Aerospace Engineering, SRM Institute of Science and Technology, Kattankulathur, Chennai 603203, Tamil Nadu, India
2
Department of Aerospace Engineering, Indian Institute of Technology Madras, Chennai 600036, Tamil Nadu, India
3
Department of Aerospace Engineering, MIT Campus, Chromepet, Anna University, Chennai 600044, Tamil Nadu, India
4
Advanced Materials and Manufacturing (AMM) Research Group, School of Mechanical and Design Engineering, University of Portsmouth, Portsmouth PO1 3DJ, UK
*
Author to whom correspondence should be addressed.
J. Compos. Sci. 2020, 4(3), 99; https://doi.org/10.3390/jcs4030099
Submission received: 7 June 2020 / Revised: 11 July 2020 / Accepted: 21 July 2020 / Published: 24 July 2020

Abstract

:
This research work investigates the low-velocity impact induced damage behavior and its influence on the residual flexural response of glass/epoxy composites improved with milled glass fillers. The low-velocity impact damage employing varying impact velocities (3 m/s, 3.5 m/s, and 4 m/s) was induced on baseline and filler loaded samples with different fiber orientations. The residual performance and their damage modes were characterized using post impact flexural (FAI) test and acoustic emission (AE) monitoring. In all fiber orientations, the filler modified glass/epoxy samples showed improved impact strength and stiffness properties. A substantial improvement in impact damage tolerance, especially for samples impacted at 3.5 m/s and 4 m/s was observed. The presence of filler at the interlaminar zone contributed to improved energy dissipation through filler debonding and pull-out. This further contributed in arresting the crack growth, showing reduced damaged area. The inclusion of milled fibers on glass/epoxy laminates enhanced the impact toughness and residual flexural behavior.

1. Introduction

The lightweight structures in the field of aerospace and defense sectors, automotive, wind turbine, and construction industries widely use fiber reinforced composites, due to their high specific stiffness/strength, property tailoring capability, improved fatigue, and corrosion resistance [1,2]. However, laminated composites possess numerous weaknesses like low impact resistance, delamination problems, low transverse mechanical properties, and weak fiber–matrix interface. During their maintenance, service life, these composites structures can be subjected to different impact loading conditions such as high, medium, and low velocity and are susceptible to such impact loadings. Amongst these impact scenarios, the low velocity impact occurs for example during maintenance by tool drop (or) by runway debris which is difficult to detect as impact damage is not so visible as opposed to high velocity impact damage. However, this type of damage can progress during service loading conditions and significantly reduces the structural integrity (strength and stiffness) of the structures [3,4].
In this approach, synergic effects of two or more types of materials are adapted. Initially, the matrix cracking occurs within the plies during an impact events (out of plane loading). Subsequently, coalescence of these crack leads to delamination between the plies which drastically reduces the strength and stiffness of the laminates. Typically, the mode II interlaminar shear stress controls the delamination induced during impact loading [5]. Also, it was highlighted that the delaminated area and buckling of plies affect the residual strength of the composites [6,7]. This critical failure delamination causes the loss of stability during post impact tests, resulting in lower residual strength. Hence, it is essential to evaluate the impact resistance of these structures and its damage tolerance to ensure the safety and integrity. Moreover, these damage occur internally and difficult to detect from normal visual means. In such situations, the application of structural health monitoring (SHM) to evaluate the barely visible impact damages (BVID) becomes of paramount importance.
Numerous studies have been carried out on the post-impact tensile and compressive performance of composite laminates [8,9,10,11]. However, only a few works have been performed in residual flexural properties [12,13,14,15]. It was reported that the impact energy controls the delaminated area and residual strength of the laminates [10]. The repeated low velocity impact response of carbon/epoxy laminates was experimentally investigated. The bending stiffness decreased and delamination area increased with the increasing number of impacts [11]. Santiuste et al. [15] studied the impact response and flexural after impact behavior of glass/polyester laminates. It was reported that the impactor nose and width of the beam affected the damage evolution, absorbed energy, and residual strength. However, no substantial influence on the relationship between impact energy absorption and residual strength was reported.
Furthermore, researchers [16,17,18,19,20,21,22] have improved the impact and/or delamination resistance through inclusion of micro/nano-sized fillers into the epoxy matrix. Crack pinning, crack bridging, and crack deflection mechanisms were reported to improve the interlaminar fracture toughness [17,18]. Moreover, in recent years, a hybrid approach has been extensively used in composite materials for property enhancement as well as material valorization. For example, work carried out by Lee et al. investigated the performance of concrete by incorporating waste glass powder and waste glass sludge (silica based waste industrial byproducts) with a view to develop a sustainable alternative cementing material for the construction industry. It was reported that significant improvements in mechanical property and durability were achieved with the incorporation of glass sludge [23]. Similarly, Mu et al. investigated the effects of short glass and PVA fibers on the mechanical properties of composite plates fabricated by extrusion process. Their results indicated that by hybridizing stronger glass and ductile PVA fibers exhibited an enhanced tensile and impact toughness of studied composite plates [24].
Current research work of incorporating nano-particles into different matrix materials has shown greater potential to improve the interlaminar properties. Nicholas et al. [21] reported that the samples with higher GnP concentration showed greater energy dissipation during impact loading. Also, the pristine samples exhibited noticeable surface damage resulting from matrix cracking, delamination, and fiber breakage while the samples modified with GnPs indicated reduced extent of damage area. However, inclusion of nanoparticles/nanofillers requires costly functionalization process which facilitates uniform dispersion and better interfacial bonding with epoxy matrix [16,19,20]. Cholake et al. [22] investigated the effect of milled carbon fibers on the mode I fracture toughness. Addition of fillers by 5 wt % and 10 wt % were reported to improve the fracture toughness of the matrix by 261% and 692%, respectively. Also, inclusion of milled glass fibers showed substantial improvement in impact and delamination resistance of glass/epoxy laminates [23,24,25,26]. All the research mentioned above indicate that addition of fillers into the laminates promote delamination resistance.
This study aims to investigate the influence of milled fibers hybridization on the low velocity impact resistance and post-impact flexural properties of the glass/epoxy laminates. The epoxy matrix was modified with milled fibers by 5% weight fraction. The filler modified glass/epoxy laminates with uni-directional (UD), cross-ply (CP), and quasi-Iso (QIS) orientation were impacted at 3 m/s, 3.5 m/s, and 4 m/s respectively. The impact response was investigated and the results were correlated with the baseline laminates. Also, the residual load-bearing capacity was estimated by conducting a three-point bending test with online acoustic emission monitoring. The novel aspects of this work lie in implementing milled glass fibers as a replacement to expensive fillers with enhanced impact and post impact residual properties. The incorporation of these low-cost fillers has contributed a significant improvement on the impact toughness behavior. Additionally, the post impact flexural behavior improvement and how the damages have evolved by linking to failure modes are reported.

2. Experimental Procedure

2.1. Materials and Fabrication of Composite Laminates

Unidirectional glass fiber mats (220 GSM), were procured from Mark Tech Composites (Bangalore, India) and LY556 epoxy resin with HY951 hardener was employed as a reinforcement and matrix material. The density of epoxy and hardener was 1.12-–1.15 g/cm3 and 0.98 g/cm3, 3 respectively. Unidirectional [0°]8S, Cross-ply [0°/90°]4S and Quasi-iso [0°/45°/90°/−45°]2S laminates were fabricated by hand lay-up technique and further cured under 50 kN compression molding machine. Initially, the epoxy resin was added with milled glass fibers (by 5% weight of epoxy) and mechanically stirred. The mixture was sonicated well to achieve uniform distribution. Then, hardener was added to the mixture at a ratio of 1:10 by weight and stirred well to initiate the curing process and ease proper mixing [27,28]. Later, a brush and a roller were used to evenly distribute the epoxy mixture and impregnate the fibers. All the laminates were allowed to cure under a compaction pressure of 5 MPa at room temperature for 24 h. The fiber content in the laminates was calculated according to the ASTM D3171-99. The fiber content in the baseline laminates (neat glass/epoxy) was 48%. Similarly, the fiber content in filler loaded laminates was 51%. The size of the fabricated laminates was 500 mm × 500 mm and its nominal thickness was 4.5 (±0.25) mm and was measured with a digital Vernier caliper. Abrasive water-jet cutting technique was used to prepare the samples of 150 mm × 30 mm (according to ASTM D790-03 standard) [28,29].

2.2. Low Velocity Impact Test

Low velocity impact test was performed on a CEAST Fractovis Plus 7526 drop weight impact tester (Instron, Chennai, India) at room temperature. The baseline and filler loaded glass/epoxy laminates were subjected to impact velocities of 3, 3.5, and 4 m/s respectively. The hemispherical steel impactor with a mass of 1.926 kg and 12.7 mm diameter was used. The samples were centrally supported in a circular base fixture with 75 mm diameter. In order to prevent multiple impacts, a catcher mechanism with a clamping force of 1000 N was employed. Four repetitions were performed in each type of sample and their average values with standard deviations were recorded. A drop weight impact testing system and AE monitoring schematic is shown in Figure 1.

2.3. Post-Impact Flexural Test with AE Monitoring

The post-impacted glass/epoxy samples were subjected to three-point bending test with a cross-head speed of 1 mm/min in 100 kN Tinius Olsen universal testing machine. The span length was kept as 100 mm, and four repetitions were performed in each category of samples and average values were taken. The residual load-bearing capacity was evaluated and the results were correlated with the non-impacted (virgin) baseline and filler modified samples. In this work, an eight-channel AE system with a sampling rate of 3 MHz and a 40 dB pre-amplification was used. The ambient noises were filtered with a threshold of 45 dB. Two wideband (WD) sensors were fixed in the samples at a nominal distance of 100 mm along length. High vacuum silicon grease was used as a couplant between the surface of the sample and AE sensor. The peak definition time (PDT), hit definition time (HDT), and hit lockout time (HLT) were set to be 31 µs, 150 µs, and 300 µs respectively. The average wave velocity for both baseline and filler modified glass/epoxy samples was found to be 3120 m/s. Pencil lead break test was carried out to assess the wave velocity and calibration of sensors.

3. Results and Discussion

3.1. Low-Velocity Impact Damage Behavior

Figure 2 shows the load, deformation, and energy response of glass/epoxy samples subjected to different impact velocities. The low velocity impact test results of glass/epoxy samples with uni-directional (UD), cross-ply (CP), and quasi-iso (QIS) configurations are depicted in the plots. The filler modified samples showed higher peak load than the baseline samples, in all the cases of orientation and velocities. The measured peak force was observed to reach a load plateau region at higher velocities, which indicates that impact force does not increase beyond an energy threshold. Figure 2a shows the force vs. deformation response of glass/epoxy samples impacted at 3 m/s. The incidence of minor oscillation after the incipient point corresponds to matrix cracking and interlaminar delamination. Typically, the load–deformation response is characterized by a progressively increasing load which attains a maximum peak (peak load) and subsequent load drops. In all the cases of impact, the impactor has deformed the samples and returns through rebound without causing severe penetration.
The load–deformation plot depicts the impact damage evolution and the change in stiffness of the glass/epoxy samples. The curve profile was initially smooth with minor oscillation, indicating no dominant failure has occurred in all the glass/epoxy samples. However, as the impact velocity increases, sudden load drops were observed beyond peak load indicating the expansion of impact damage (delamination) as shown in Figure 2b,c. In contrast, this behavior was absent in the filler loaded samples of all fiber orientations. The above results indicate that the filler modified samples show enhanced impact performance than the baseline glass/epoxy samples [30,31,32,33].
Typically, the stiffness of the unidirectional (UD) samples was observed to be better than the cross-ply (CP) and quasi-iso (QIS) laminates under impact events. Also, irrespective of fiber orientation, the filler-loaded samples showed better impact stiffness than the reference specimen. The addition of milled glass fibers into the epoxy matrix has improved the interlaminar properties through crack deflection/arresting and filler debonding/pullout toughening mechanisms, resulting in enhanced impact strength/stiffness. The presence of filler in the interlaminar region prevents/delays the onset of damage initiation and propagation and consequently improves the impact resistance than the baseline samples. As expected, the deformation of the samples increases with impact velocity. Irrespective of fiber orientation, the deformation was minor in filler loaded samples in comparison with baseline samples as shown in Figure 2c. At 3 m/s the quasi-iso (QIS) laminates showed large deformation, while at 3.5 m/s and 4 m/s impact velocity the cross-ply samples exhibited greater deformation than the other fiber orientations.
As discussed in the literature [23], greater energy absorption through large deformation and substantial damage occurred owing to extended contact of striker with the sample. In general, unidirectional (UD) samples showed less contact duration than the cross-ply (CP) and quasi-iso (QIS). However, the contact duration increased with increasing impact velocity. It can be observed from Figure 2b,c, that the cross-ply samples had longer contact duration, exhibiting large deformation compared to quasi-iso and unidirectional samples. On the other hand, the filler-loaded samples exhibited less contact duration and maximum deformation in comparison with baseline samples. This result signifies that irrespective of fiber orientation, inclusion of milled fibers has enhanced the stiffness/rigidity [24].
Figure 3a shows the peak force offered by the laminates, denoting the impact load resistance of the samples. The change in peak force related to impact velocity was prevalent only in quasi-iso (QIS) baseline samples compared to cross-ply (CP) and unidirectional (UD) baseline samples. However, filler loaded samples showed significant improvement in peak force in all cases. The percentage increase in peak load due to the inclusion of filler is shown in Figure 3b. Unidirectional (UD) samples showed substantial improvement compared to cross-ply (CP) and quasi-iso (QIS) samples. These results confirm that the fiber orientations and the presence of fillers (milled fibers) have influenced the resistance to the impact force. Typically, the deformation increases with impact velocity as shown in Figure 3c. In all fiber orientation, the baseline samples exhibit larger deformation than the filler-loaded samples. The change in maximum deformation with respect to impact velocity (between 3 m/s to 4 m/s) was 76% in unidirectional (UD), 66% in cross-ply (CP) and 35% in quasi-iso (QIS) baseline samples respectively. However, this variation was only 65% in unidirectional (UD), 60% in cross-ply (CP), and 27% in quasi-iso (QIS) filler loaded samples respectively. Figure 3d shows the percentage reduction of maximum deformation in filler loaded samples. At all impact velocities, unidirectional (UD) samples showed prevalent reduction in deformation than cross-ply (CP) and quasi-iso (QIS) samples.
During an impact event, the energy absorbed by the laminates is dissipated through the damage formation. The integral area bounded by the loading and unloading profile of load–deformation curve indicates the absorbed energy. Figure 2d,f shows the energy-time response of glass/epoxy samples impacted at different impact velocities. In all the cases, the baseline samples showed greater absorbed energy, signifying the presence of severe damage in the laminates. As suggested in literatures [34,35,36,37], highest value of the absorbed energy shows the laminate has severe damage and consequently lower elastic energy. The samples absorb more energy with increasing impact velocity as shown in Figure 4a. Correspondingly, the baseline samples showed substantial variation in absorbed energy with increasing impact velocity (3 m/s to 4 m/s). This variation was 1.86, 2.42, and 2.8 times in unidirectional (UD), cross-ply (CP), and quasi-iso (QIS) baseline laminates. Conversely, the filler-loaded samples showed less absorbed energy as shown in Figure 4b.
The percentage reduction in absorbed energy was significant in unidirectional (UD) samples than cross-ply (CP) and quasi-iso (QIS) samples. Moreover, this percentage variation decreases with increasing impact velocity. This observation was prominent in cross-ply (CP) samples which corroborates the criticality of damage with increasing impact velocities. These observations were reflected well in the results of the residual load.
Energy profile diagram (EPD) depicts the relationship between the absorbed energy and corresponding impact energy. The impact damage criticality at various impact energies can be inferred from Figure 4c. As expected, the absorbed energy and impact damage (delamination) increased with the impact energy. The cross-ply (CP) samples exhibited higher absorbed energy compared to unidirectional (UD) and quasi-iso (QIS) laminates in all the cases. This result confirms that the cross-ply samples suffered predominant impact damage. Subsequently, this also reflected well in the damage degree and elastic energy results. Damage degree measures the deterioration of impact performance and shows the expansion of impact damage [30]. It is significant to note that no penetration has occurred in all the cases considered. Figure 4d shows an increase in damage degree with impact velocity, which reveals the expansion of impact damage. However, the filler-loaded samples showed lower damage degree than the baseline samples.
During impact events, initially the impactor velocity is higher. Correspondingly, the samples attain a maximum deformation when the velocity of the impactor reaches zero. Figure 5a,b shows the incidence of bounce point in the velocity–time plot. Here for clarity, only the results of samples impacted at 3 m/s and 4 m/s were shown. At 3 m/s, both the baseline and filler loaded quasi-iso (QIS) samples had delayed bounce point while earlier bounce point occurred for the unidirectional (UD) and cross-ply (CP) filler loaded samples. However, at 3.5 m/s and 4 m/s, the cross-ply (CP) baseline samples had delayed bounce time. In all the cases, the unidirectional (UD) filler loaded samples had shorter bounce time as shown in Figure 5c. Irrespective of fiber orientation, the filler-loaded samples showed earlier bounce points compared to baseline samples. These results confirm that addition of milled fibers improved the impact strength/stiffness, resulting in lesser deformation and earlier bounce points (impact response).
Figure 5d shows the velocity ratio of different glass/epoxy samples at various impact velocities. The ratio of rebound velocity to impact velocity is known as velocity ratio (VR/VI). A decrease in velocity ratio was observed with increasing impact energy, which denotes the progression of impact damage. In all the cases, filler modified samples show greater velocity ratio and elastic energy. This result further indicates that the inclusion of milled fibers has enhanced the impact resistance of the glass/epoxy samples. Overall, the filler-loaded samples exhibited shorter bounce time than the baseline samples. The filler loaded samples exhibited a higher velocity ratio than the baseline samples, which is attributed to the instant elastic energy offered by the filler-loaded samples during an impact event.
As discussed earlier, at higher impact velocities, more energy will be consumed in damage formation rather than impactor rebound. In all the cases, elastic energy of filler loaded samples was substantially improved than baseline samples as shown in Figure 6a. As shown in Figure 6b, the variation in elastic energy was observed to decrease at higher impact velocity. At 4 m/s impact, the samples absorbed more energy and experienced severe impact damage. Permanent dents induced on the samples are known as residual deformation. Figure 6c shows the residual deformation increases with impact velocity, indicating the development of impact damage. At 3 m/s, unidirectional baseline samples showed higher residual dent than the other categories of laminates, whereas at 3.5 m/s and 4 m/s, the cross-ply samples exhibited a higher residual dent.
Conversely, the filler-loaded samples possess less permanent denting, evidencing the improvement of impact damage resistance by the incorporation of milled glass fibers. The percentage variation of residual denting was substantial in unidirectional (UD) and cross-ply (CP) samples as shown in Figure 6d. The contribution of milled fibers to the reduction in permanent deformation was minimal at 3 m/s. However, this was prevalent at higher impact velocities, especially in unidirectional (UD) and cross-ply (CP) samples. The milled fibers in the polymer matrix induce filler debonding/pullout mechanisms which contribute to energy dissipation (shown in Figure 7). The samples with higher absorbed energy possess lower elastic energy with consequently more damage area (shown in Figure 8). The contribution of milled glass fiber fillers on elastic energy was significant in unidirectional (UD) and cross-ply (CP) than quasi-iso (QIS) samples. The milled fibers in the interlaminar region arrests/prevents delamination crack growth, which results in lesser impact damage area (shown in Figure 9).
Figure 10 depicts the load bearing capacity of various configurations of glass/epoxy samples. The post impacted unidirectional (UD), cross-ply (CP), and quasi-iso (QIS) glass/epoxy samples were subjected to three-point bending tests to determine the residual load-bearing capacity. As expected, the residual load decreased with impact velocities. However, this reduction in residual load was minimal in filler loaded samples as shown in Figure 11a. The percentage variation in flexural load was predominant in unidirectional (UD) and quasi-iso (QIS) baseline samples. The cross-ply (CP) and quasi-iso (QIS) samples impacted at 3.5 m/s and 4 m/s showed prevalent decrease in flexural load, evidencing the impact damage criticality. During flexural loading, the impact damage (delamination) progressed across the sample width and the ultimate failure occurs by either fiber micro-buckling or in-plane fiber tensile failure.
Figure 11b depicts the percentage variation in residual load carrying capability of glass/epoxy laminates. In all the cases (non-impacted, impacted at 3, 3.5, and 4 m/s), the improvement in load bearing capacity was prevalent in unidirectional (UD) samples compared to the cross-ply (CP) and quasi-iso (QIS) samples. For non-impacted and 3 m/s impacted samples, only nominal increase was observed in cross-ply (CP) and quasi-iso (QIS) samples. Conversely, the cross-ply (CP) and quasi-iso (QIS) samples impacted at 3.5 m/s and 4 m/s velocities showed significant improvement in residual flexural strength. The contribution of milled fibers in damage dissipation and efficient load transfer was considerable at 3.5 m/s and 4 m/s impact velocity. Figure 7 illustrates the impact energy dissipation through filler debonding/pullout. Additionally, the milled fibers at the interlaminar zone hindered the delamination crack progression. Therefore, in all cases, filler-modified laminates show improved residual load bearing capacity.

3.2. Post Impact Flexural Test with Online AE Monitoring

The residual load bearing capacity of glass/epoxy laminates were evaluated by performing post-impact flexural testing. Online AE technique was employed during three-point bending test to monitor the evolution of damage in the samples. The initiation and progression of damage, and its failure mechanisms associated during post-impact flexural loading were discussed. The fiber orientation of the samples was found to significantly influence the load-bearing capacity and its corresponding failure modes. Figure 12 shows the schematic illustration of impacted samples under flexural loading with online AE monitoring. Initially, the profile was almost flat (Zone I), attributed to insignificant damages such as matrix cracking. However, further loading causes a rise in slope (Zone II) of the normalized AE cumulative counts, indicating the substantial damage progression (debonding/delamination). Furthermore, a steep rise in normalized AE cumulative counts (Zone III) indicates the occurrence of ultimate failure. Figure 13a,f shows the normalized AE cumulative counts plots which illustrate progression of damage in the sample during flexural test [38,39]. Samples impacted at higher velocities showed premature incidence of Zone II and Zone III of normalized AE cumulative counts compared to non-impacted samples.
Figure 13a,b illustrate the AE cumulative count results of baseline and filler loaded unidirectional samples. The unidirectional samples exhibited longer Zone II with nominal Zone I and Zone III. In contrast, the baseline and filler loaded quasi-iso samples showed extended Zone I with shorter Zone II as shown in Figure 13e,f. Figure 13c,d shows that Zone I was observed to be very short while Zone II and Zone III occurred earlier in cross-ply samples than the unidirectional and quasi-iso samples. All these results reveal that, irrespective of fiber orientations, the filler loaded samples exhibited delayed damage initiation and progression.
The frequency analysis was performed to discriminate the various failure mechanisms in the glass/epoxy samples. The failure modes observed from the tests were also reported in previous works by Ramirez-Jimenez et al. [40]. Arumugam et al. [27,28] stated that the AE signals with low duration and low amplitude correspond to the matrix cracking failure mode. Also, a high duration and moderate amplitude signals indicate delamination. While a short duration and high amplitude signals characterize fiber failure. Figure 14a,d shows the load–displacement response accompanied with peak frequency—AE location plot of unidirectional samples. Initially, the curve profile was linear followed by a non-linear zone. This transition load corresponds to the incidence of matrix cracking. Consequently, with increasing load, the coalescence of these micro damages leads to expansion of damage in the samples, which causes the formation of macro-damage, such as debonding/delamination, which substantially reduces the load-bearing capacity of the laminates.
From the peak frequency–AE location plot, the different failure mechanisms associated with flexural loading were sequentially characterized as reported in the literature [36]. The damage initiates with matrix cracking, relating to peak frequency ranges between (70 to 120 kHz). This matrix cracking triggers the delamination between the adjacent plies through fiber/matrix debonding. The moderate-frequency range between (130 to 180 kHz) attributes to delamination and (190 to 260 kHz) attributes to fiber/matrix debonding. While the fiber breakage is associated with a range (270 to 320 kHz). In all the cases, the filler loaded samples show lesser delamination failure modes. This observation indicates that the addition of filler has suppressed the delamination crack growth during post impact flexural loading.
Similarly, Figure 14b,e shows the load–displacement behavior of cross-ply (CP) samples accompanied by peak frequency–AE location plot. The intensity of accumulated AE signal was observed to be greater in cross-ply samples than unidirectional (UD) samples. This observation shows the expansion of substantial damage due to transverse cracking and debonding/delamination between the adjacent 0° and 90° plies. In contrast, the intensity of matrix cracking, delamination was predominantly reduced in cross-ply (CP) filler loaded samples. Likewise, the load–displacement behavior of quasi-iso (QIS) samples was shown in Figure 14c,f. The intensity of accumulated AE signals corresponding to appropriate damage mechanism was prevalent in quasi-iso (QIS) baseline samples compared to the filler-loaded quasi-iso (QIS) samples. The accumulation of damage signals at one region of the filler-loaded quasi-iso samples indicates the damage initiated in 45° and impulsively propagated to the width wise direction of the samples causing ultimate failure as seen from Figure 15f. Here for illustration, only the AE results of flexural after impact test of non-impacted and samples impacted at 4 m/s were shown (i.e.,) load-displacement and peak frequency–AE location. However, the samples impacted at 3 m/s and 3.5 m/s exhibited similar trends, and Figure 16 represents their corresponding AE results.
Figure 16 shows the normalized AE events of failure mechanisms for baseline and filler loaded samples. Typically, the non-impacted (virgin) samples subjected to flexural loading shows matrix cracking, debonding, delamination, and fiber breakage failure modes sequentially from the beginning of the test. Conversely, this will not be the case for impacted samples. In all the cases, the filler-loaded samples showed dominant matrix cracking than baseline specimens. This observation was attributed to the enhanced energy dissipation through filler debonding and pull-out, causing more intense micro-cracking and progression during flexural loading. The intensity of delamination failure modes related to peak frequency range (130 to 180 kHz) was considerably decreased in 3.5 m/s and 4 m/s. The samples impacted by 3.5 m/s and 4 m/s caused substantial delamination damage which impulsively propagated during flexural loading. This observation shows that the ultimate failure of samples impacted by 3.5 m/s and 4 m/s occurred through debonding and fiber breakage with minor delamination (as shown in Figure 15). The above result confirms that the impact velocities influence the evolution of damage and its corresponding damage mechanisms.
Figure 16 shows the filler-loaded samples have less intense delamination signals than the baseline samples. Similarly, the intensity of fiber/matrix debonding modes was considerably increased for all the cases of filler loaded samples. This result demonstrates that the energy dissipation has occurred through predominant filler debonding/pull-out between the filler/matrix interfaces which contribute to the improved load resistance. Therefore, the filler modified samples showed a more intense debonding signal. However, the fiber breakage failure mode was prevalent in unidirectional (UD) and cross-ply (CP) samples.
The fiber breakage failure mode occurred dominantly in the samples impacted at 3.5 m/s and 4 m/s velocity. This premature damage propagation resulted in lower load-bearing capacity. In all the cases of fiber orientations, these observations were predominant in filler loaded samples as shown in Figure 16.
The premature delamination damage in baseline samples will induce ultimate failure, either on the compression side through micro-buckling (or) tensile rupture at the bottom. However, delayed delamination crack propagation and better load resistance were offered by the filler-loaded samples which can be attributed to excessive fiber breakage signals. Moreover, the dominant incidence of AE damage signals from one side of sample (off-center) shows that the damage initiated/progressed from the former impact damage induced at specific location (shown in Figure 15). This was observed to be dominant in samples impacted at 4 m/s, especially in unidirectional and quasi-iso samples.

4. Conclusions

This research work experimentally investigates the influence of milled fibers on low velocity impact behavior and post-impact flexural performance of glass/epoxy composites. The baseline and filler modified samples with different fiber orientations were subjected to varying impact velocities (3, 3.5, and 4 m/s). Furthermore, the residual load-bearing capacity was evaluated by conducting three-point bending test with online AE technique and their results were compared with samples without any impact. From the experimentally obtained results, the key points can be concluded as follows:
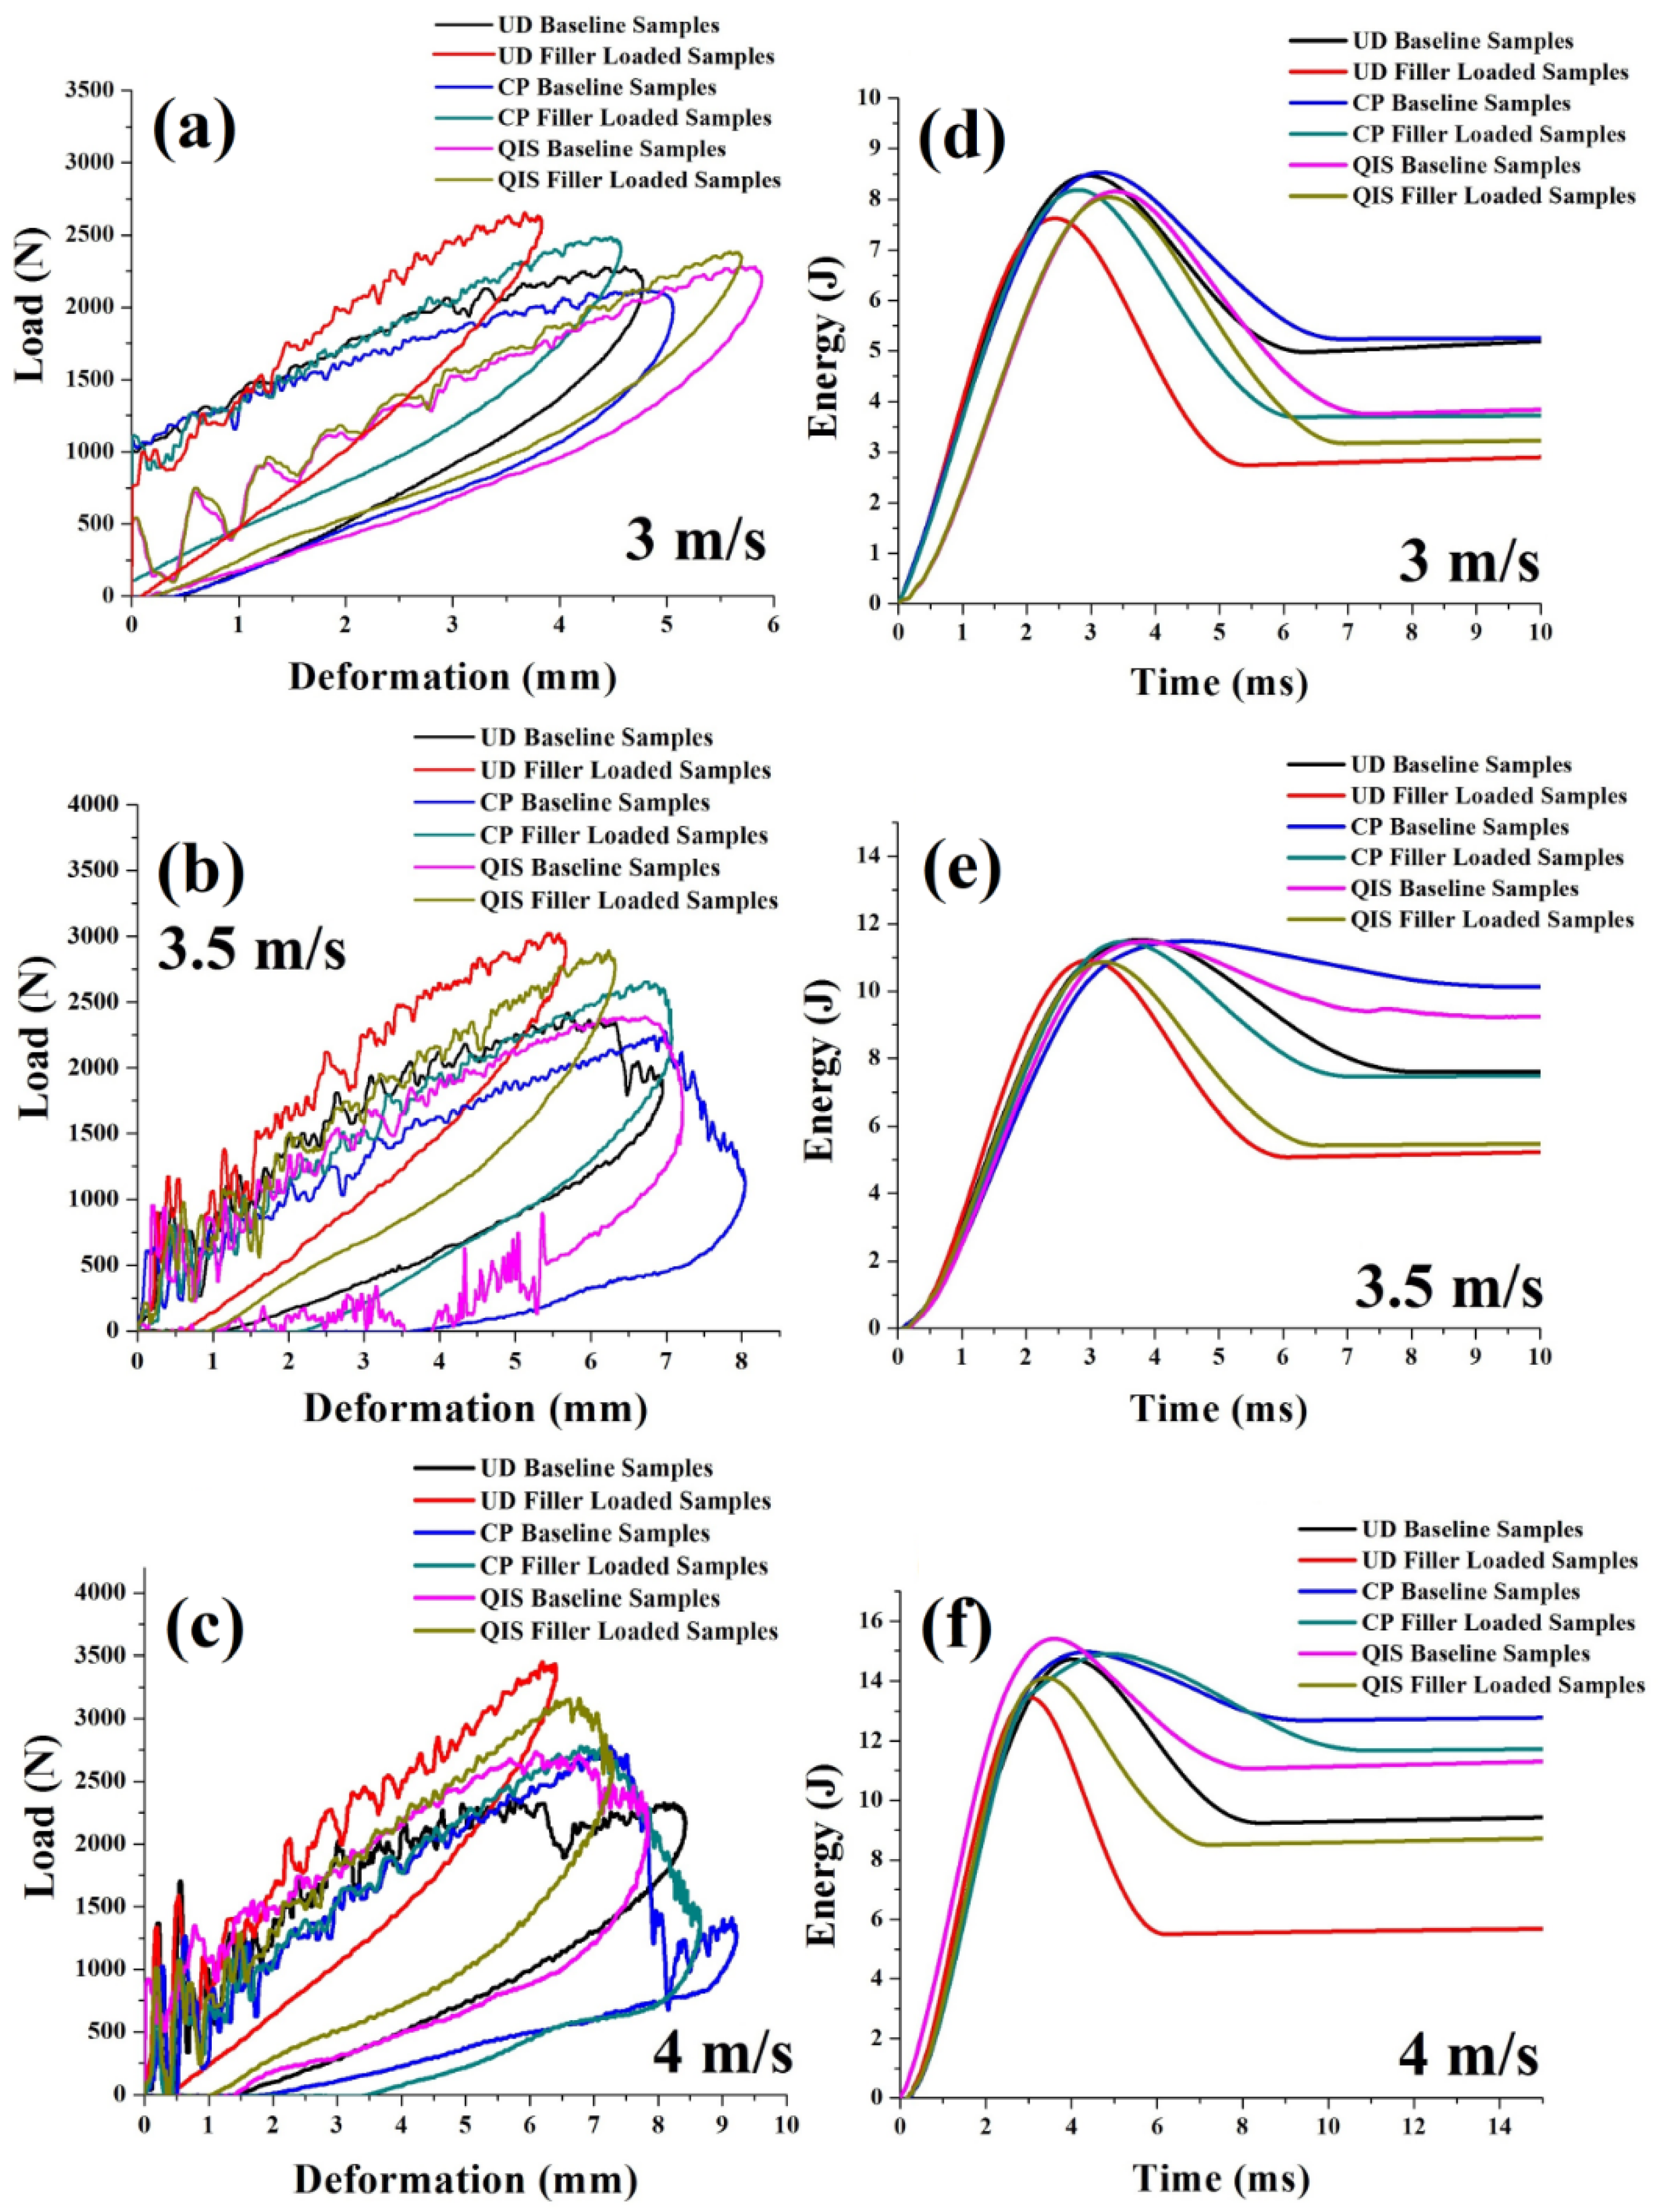
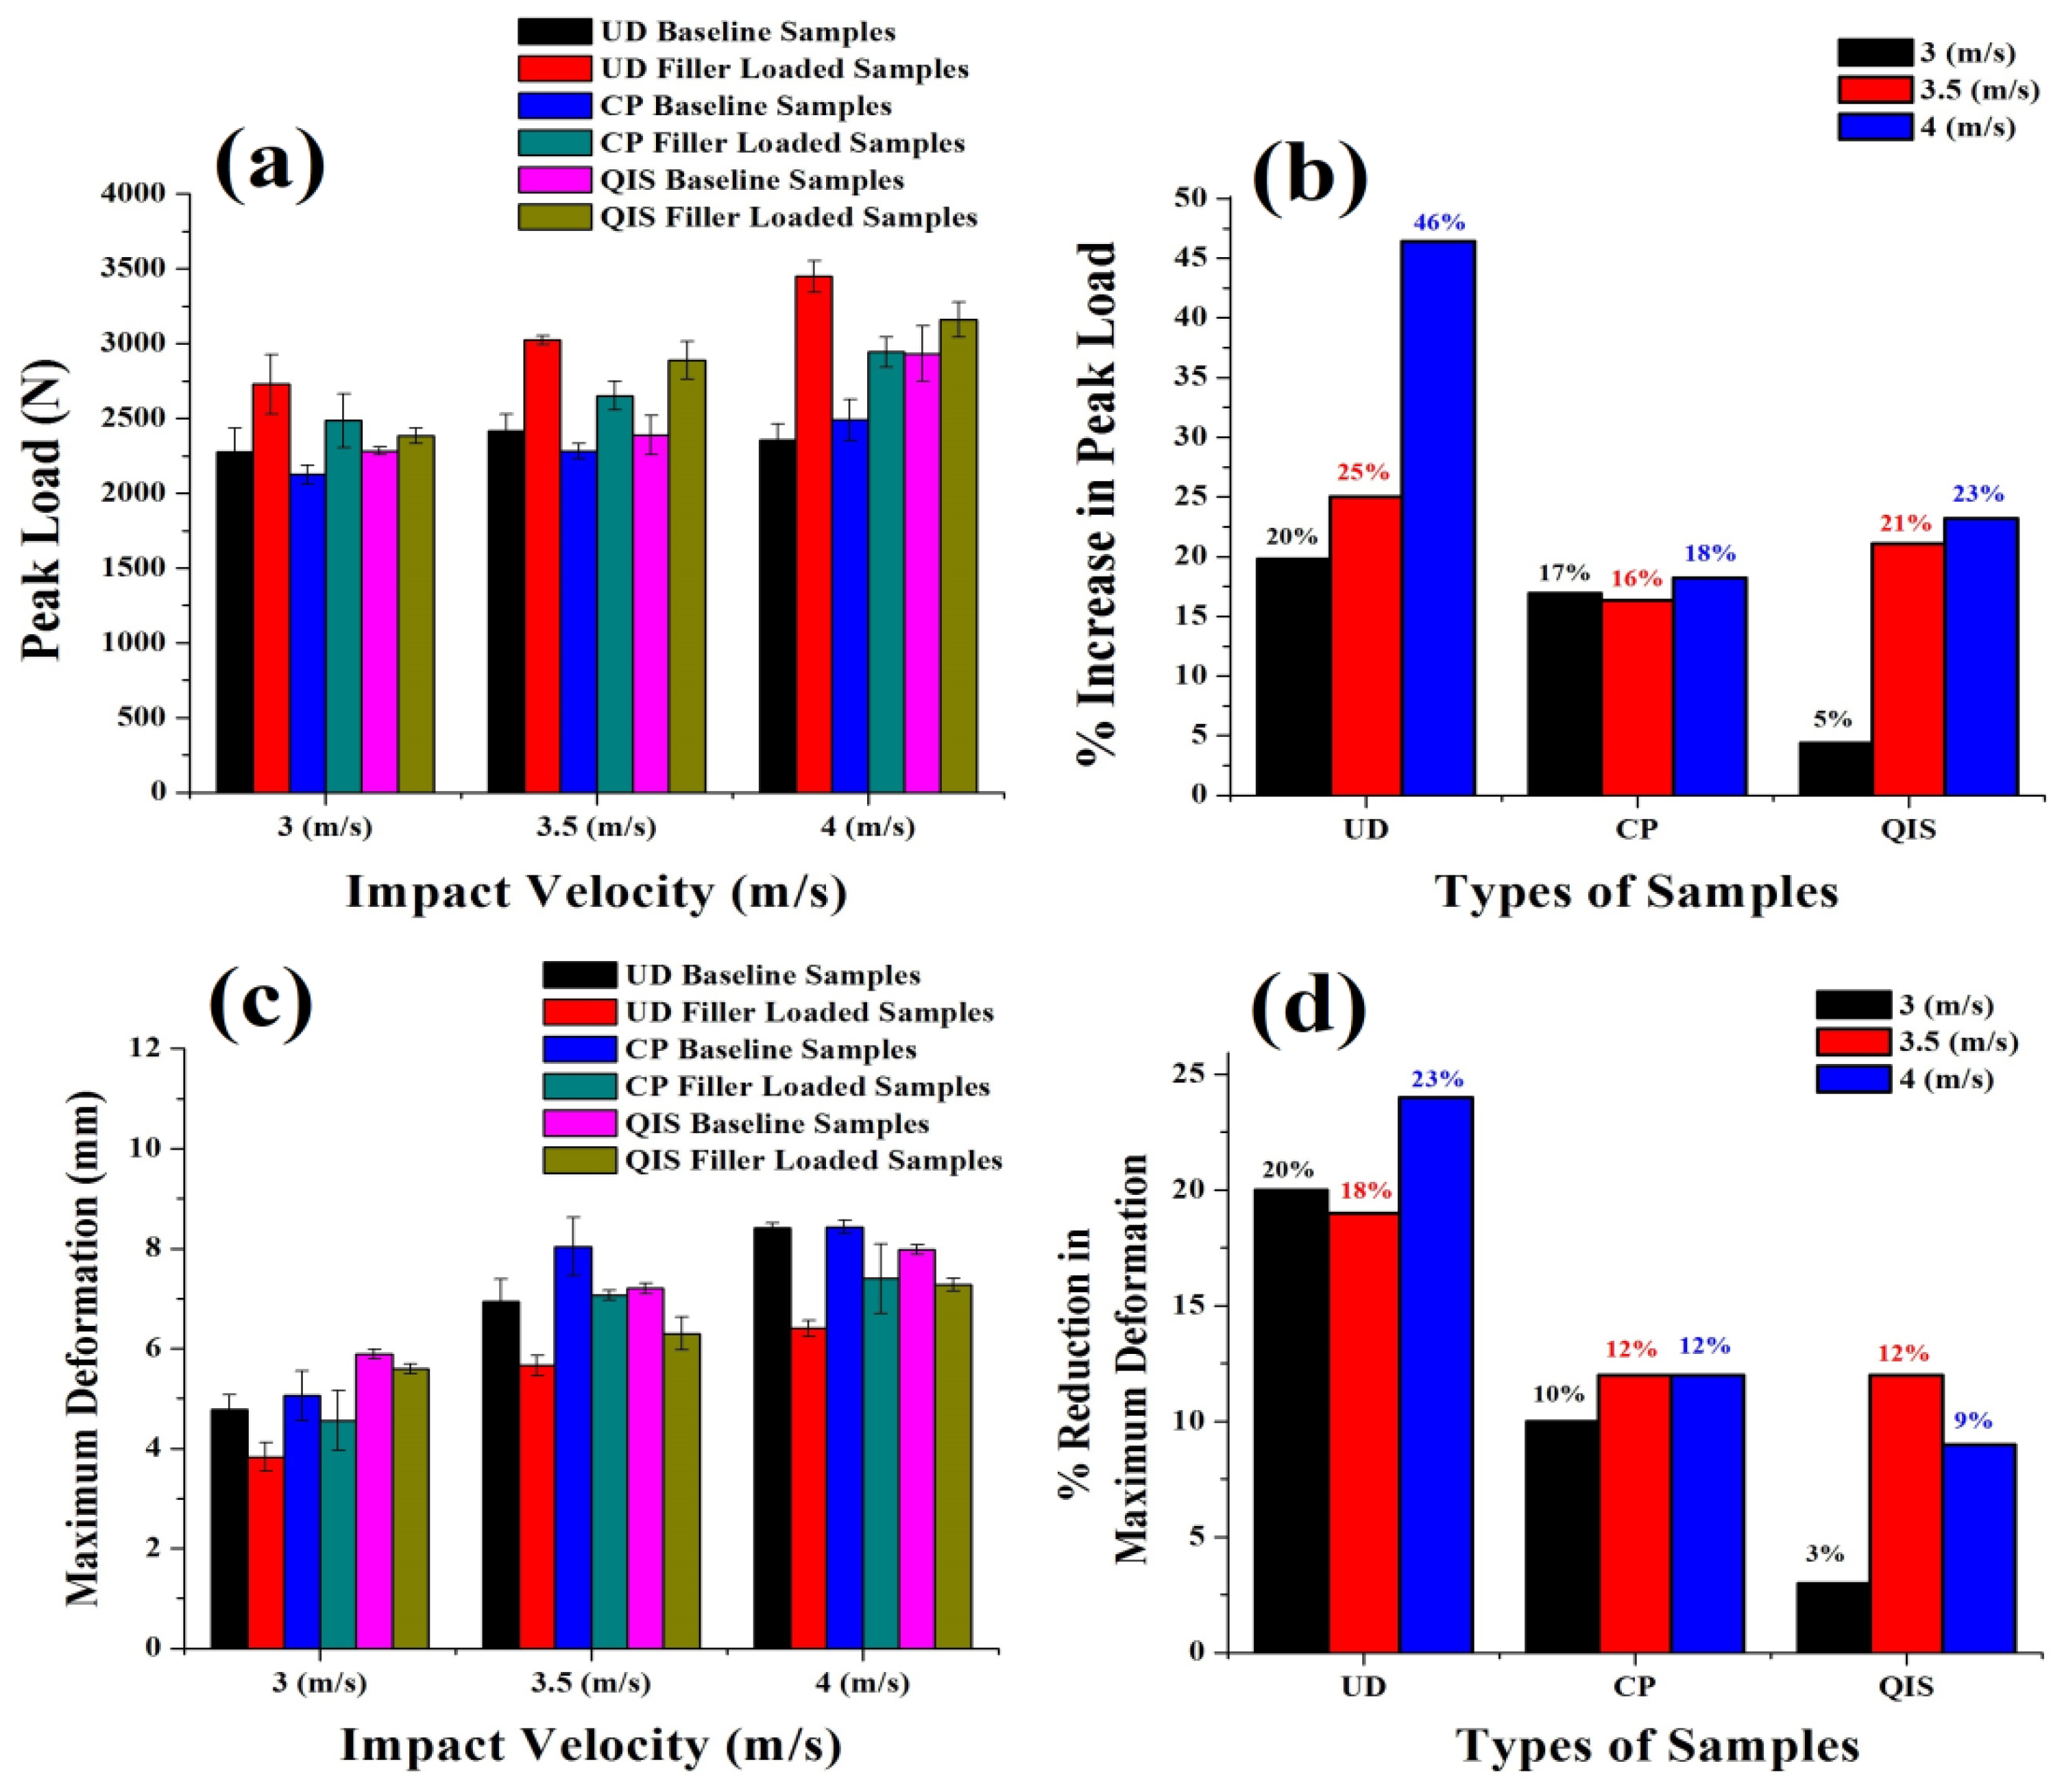
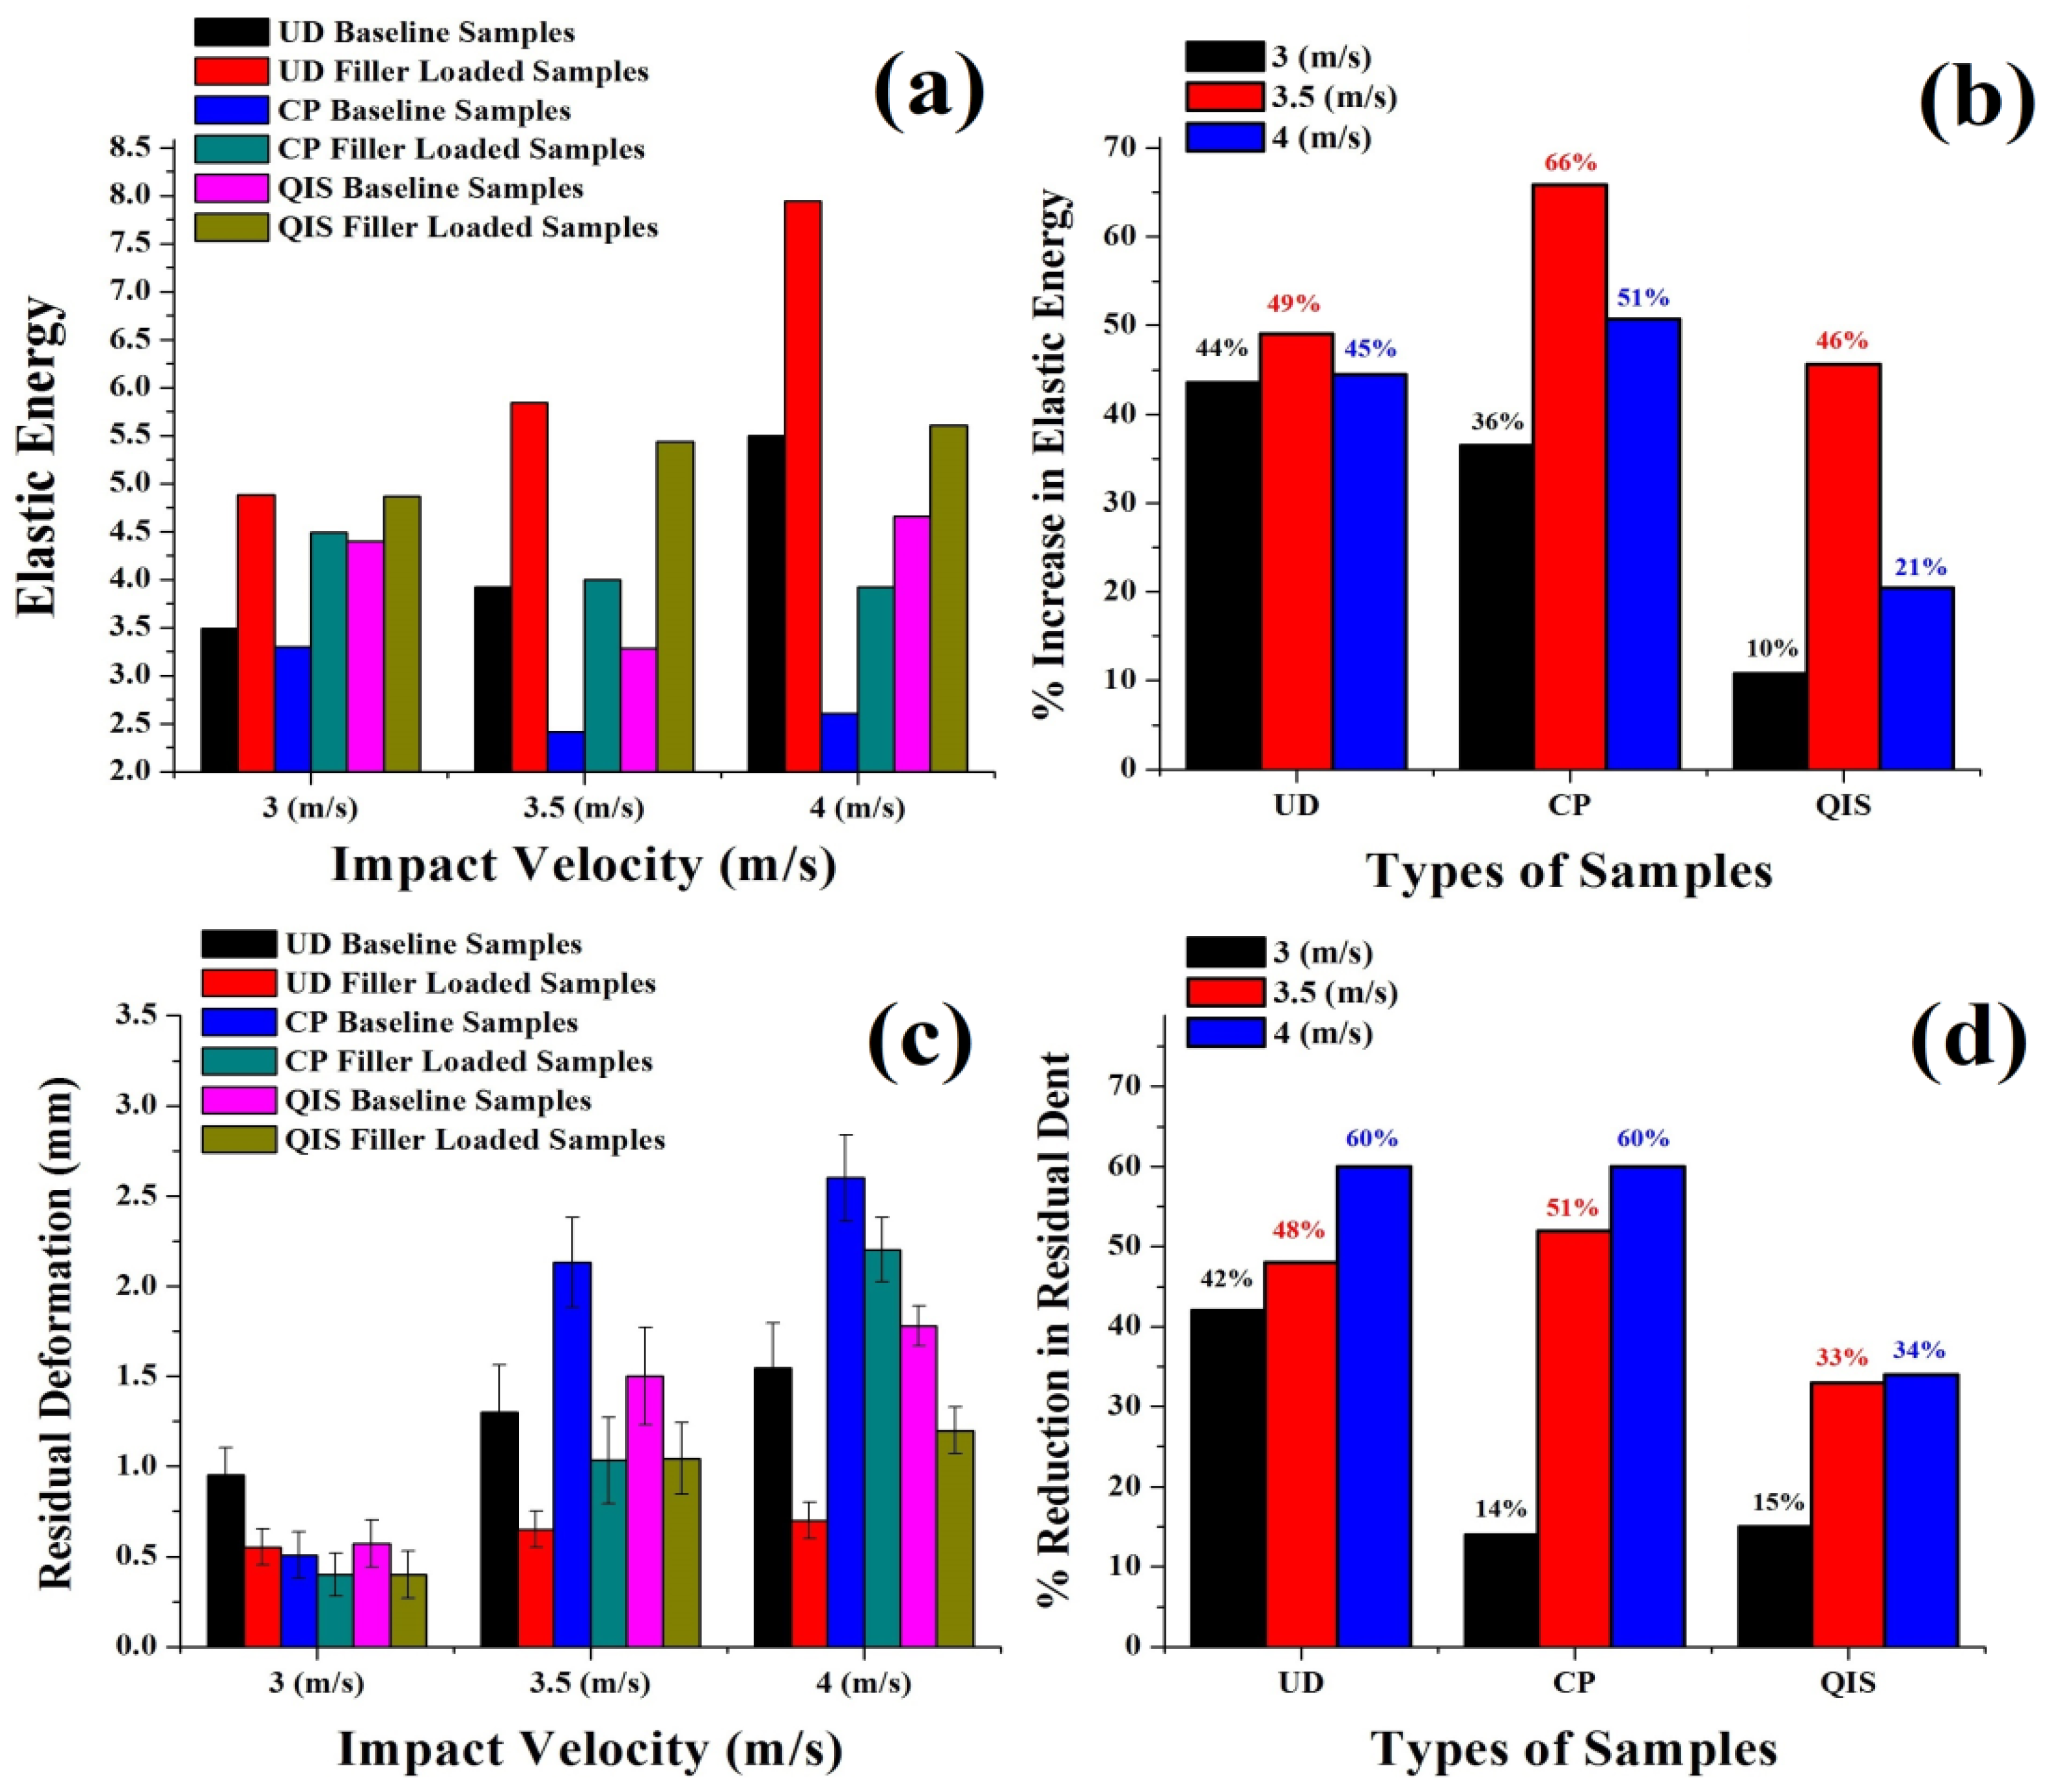
  • The change in peak force variation with increment velocity change was prevalent in quasi-iso samples compared to cross-ply and unidirectional baseline samples. In contrast, the improvement in peak load due to the inclusion of filler was dominant in unidirectional samples. In all the cases, the filler-modified samples showed higher peak force and less deformation than the reference samples.
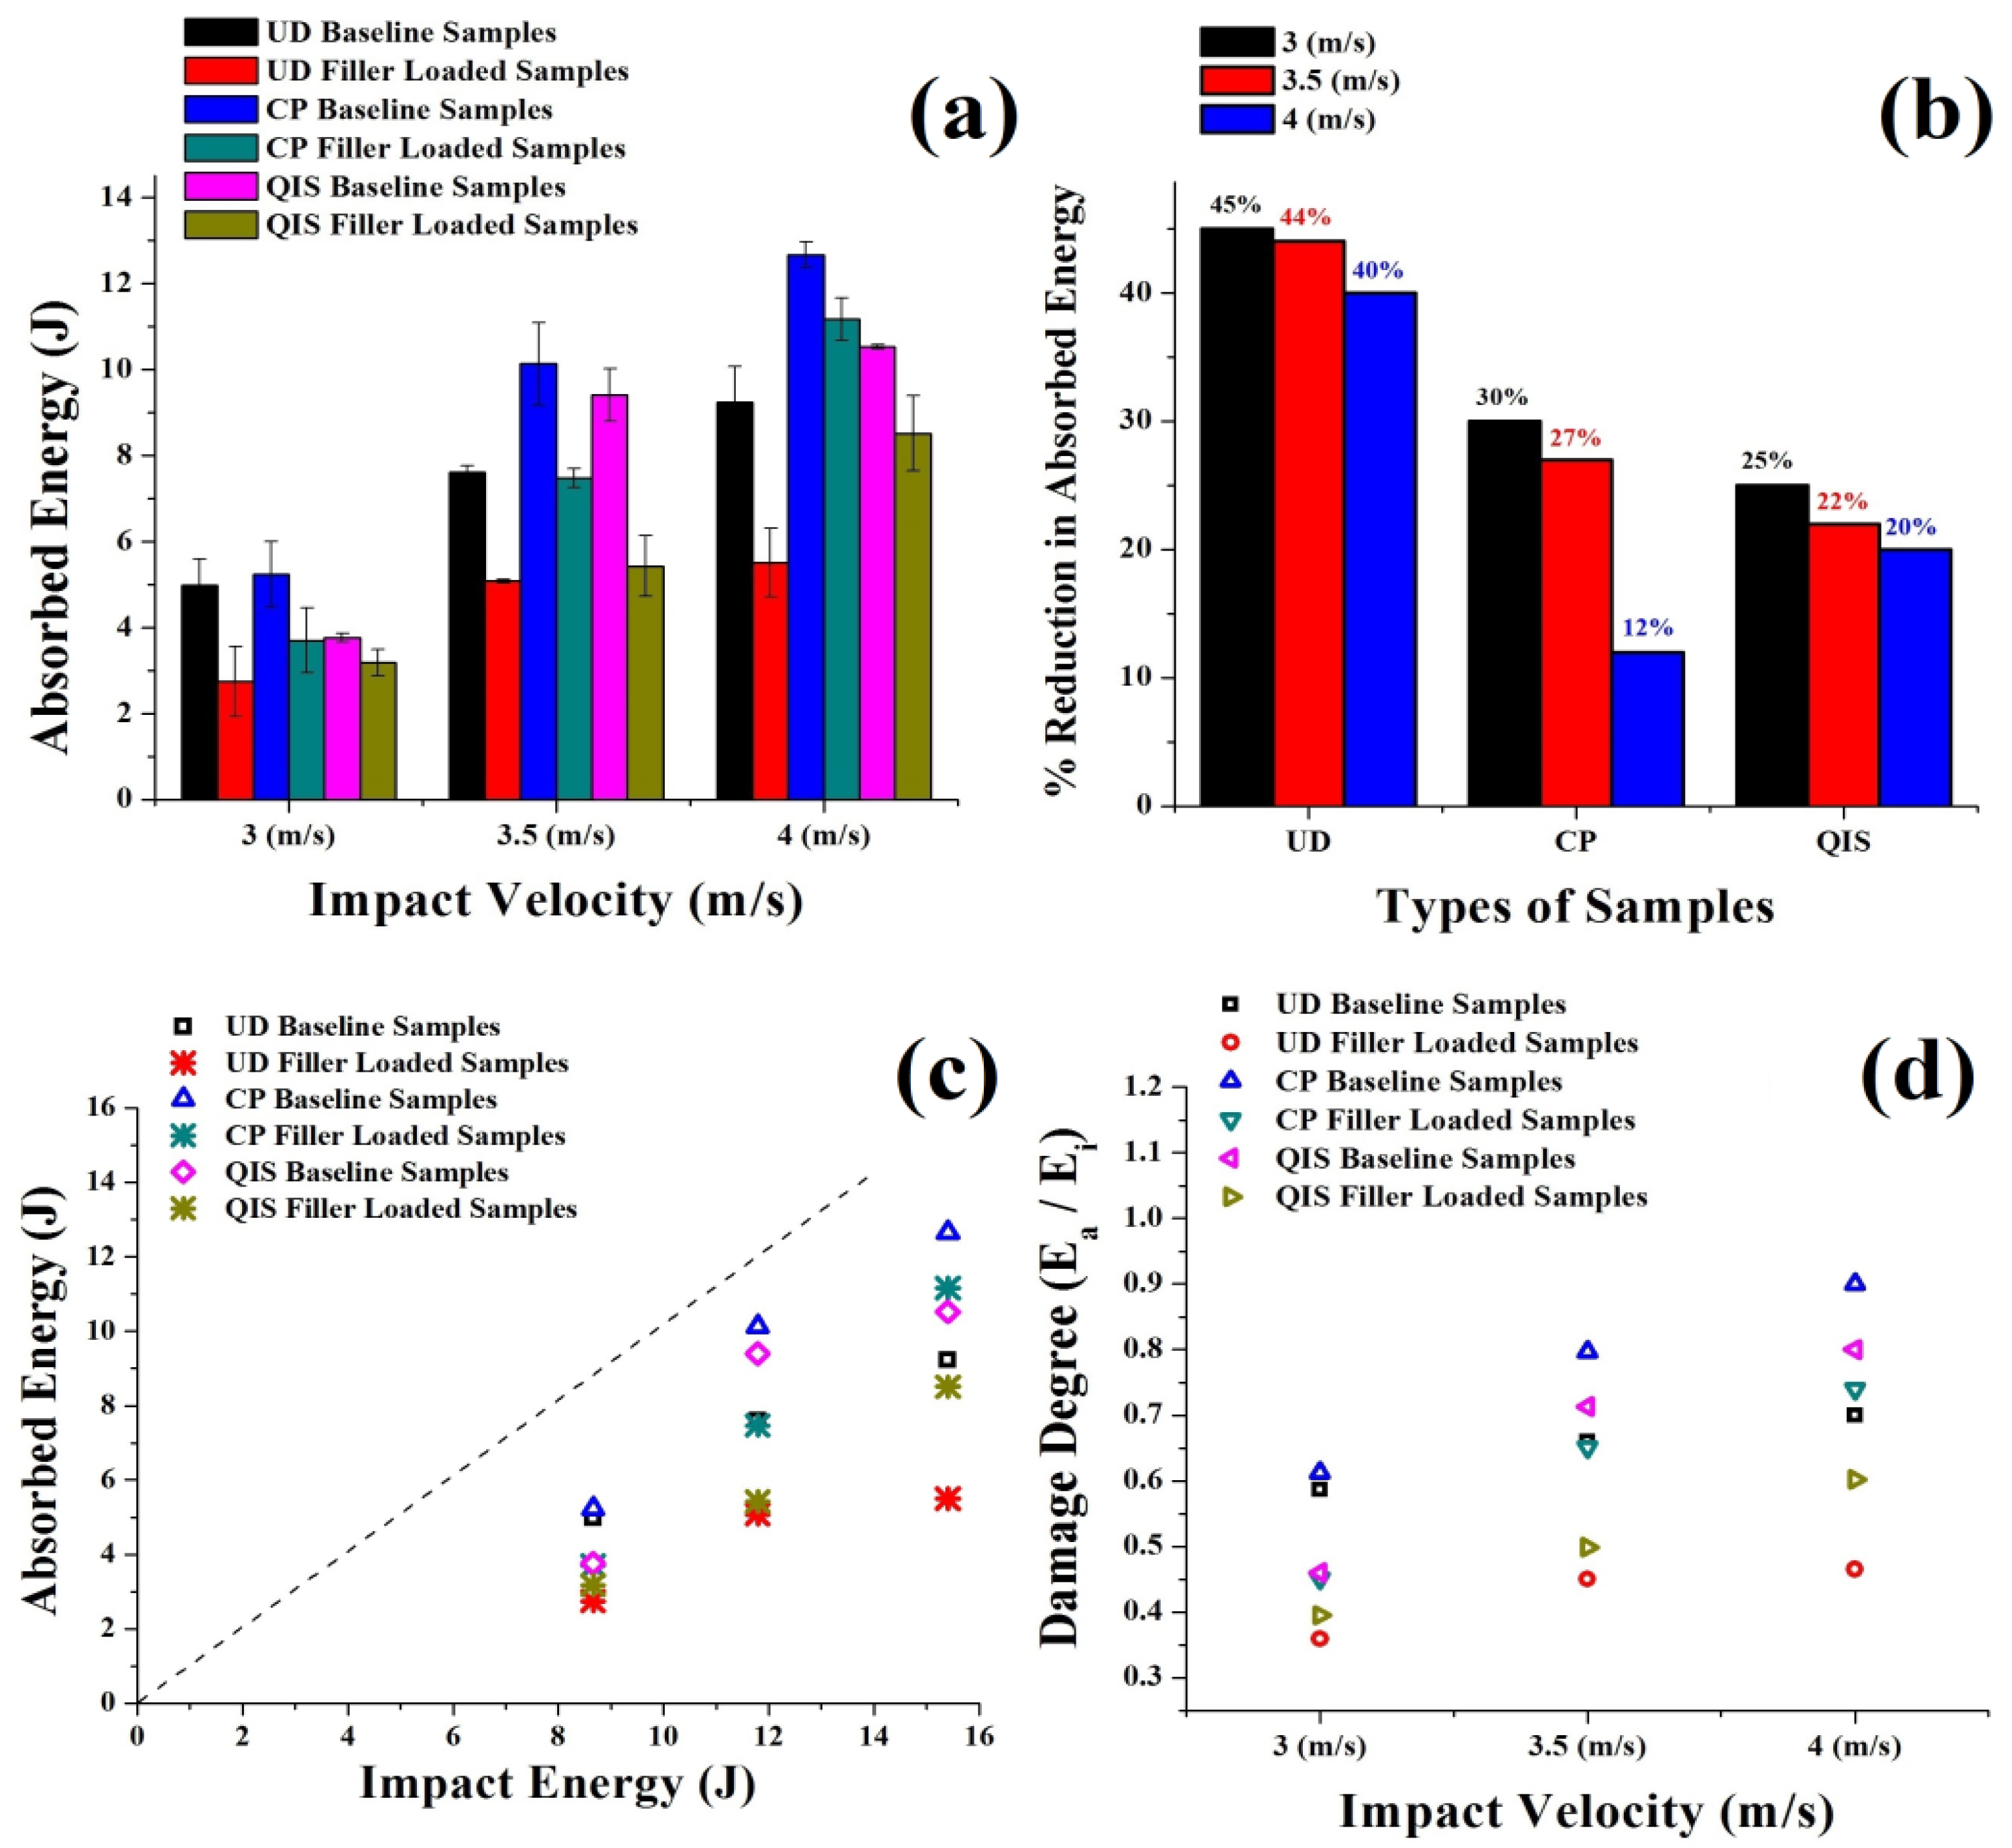
  • In all the cases of fiber orientations, the filler-modified samples showed reduced absorbed energy and less residual deformation than the baseline samples. Moreover, the contribution of fillers on percentage reduction in the energy absorption decreased when impact velocity was increased.
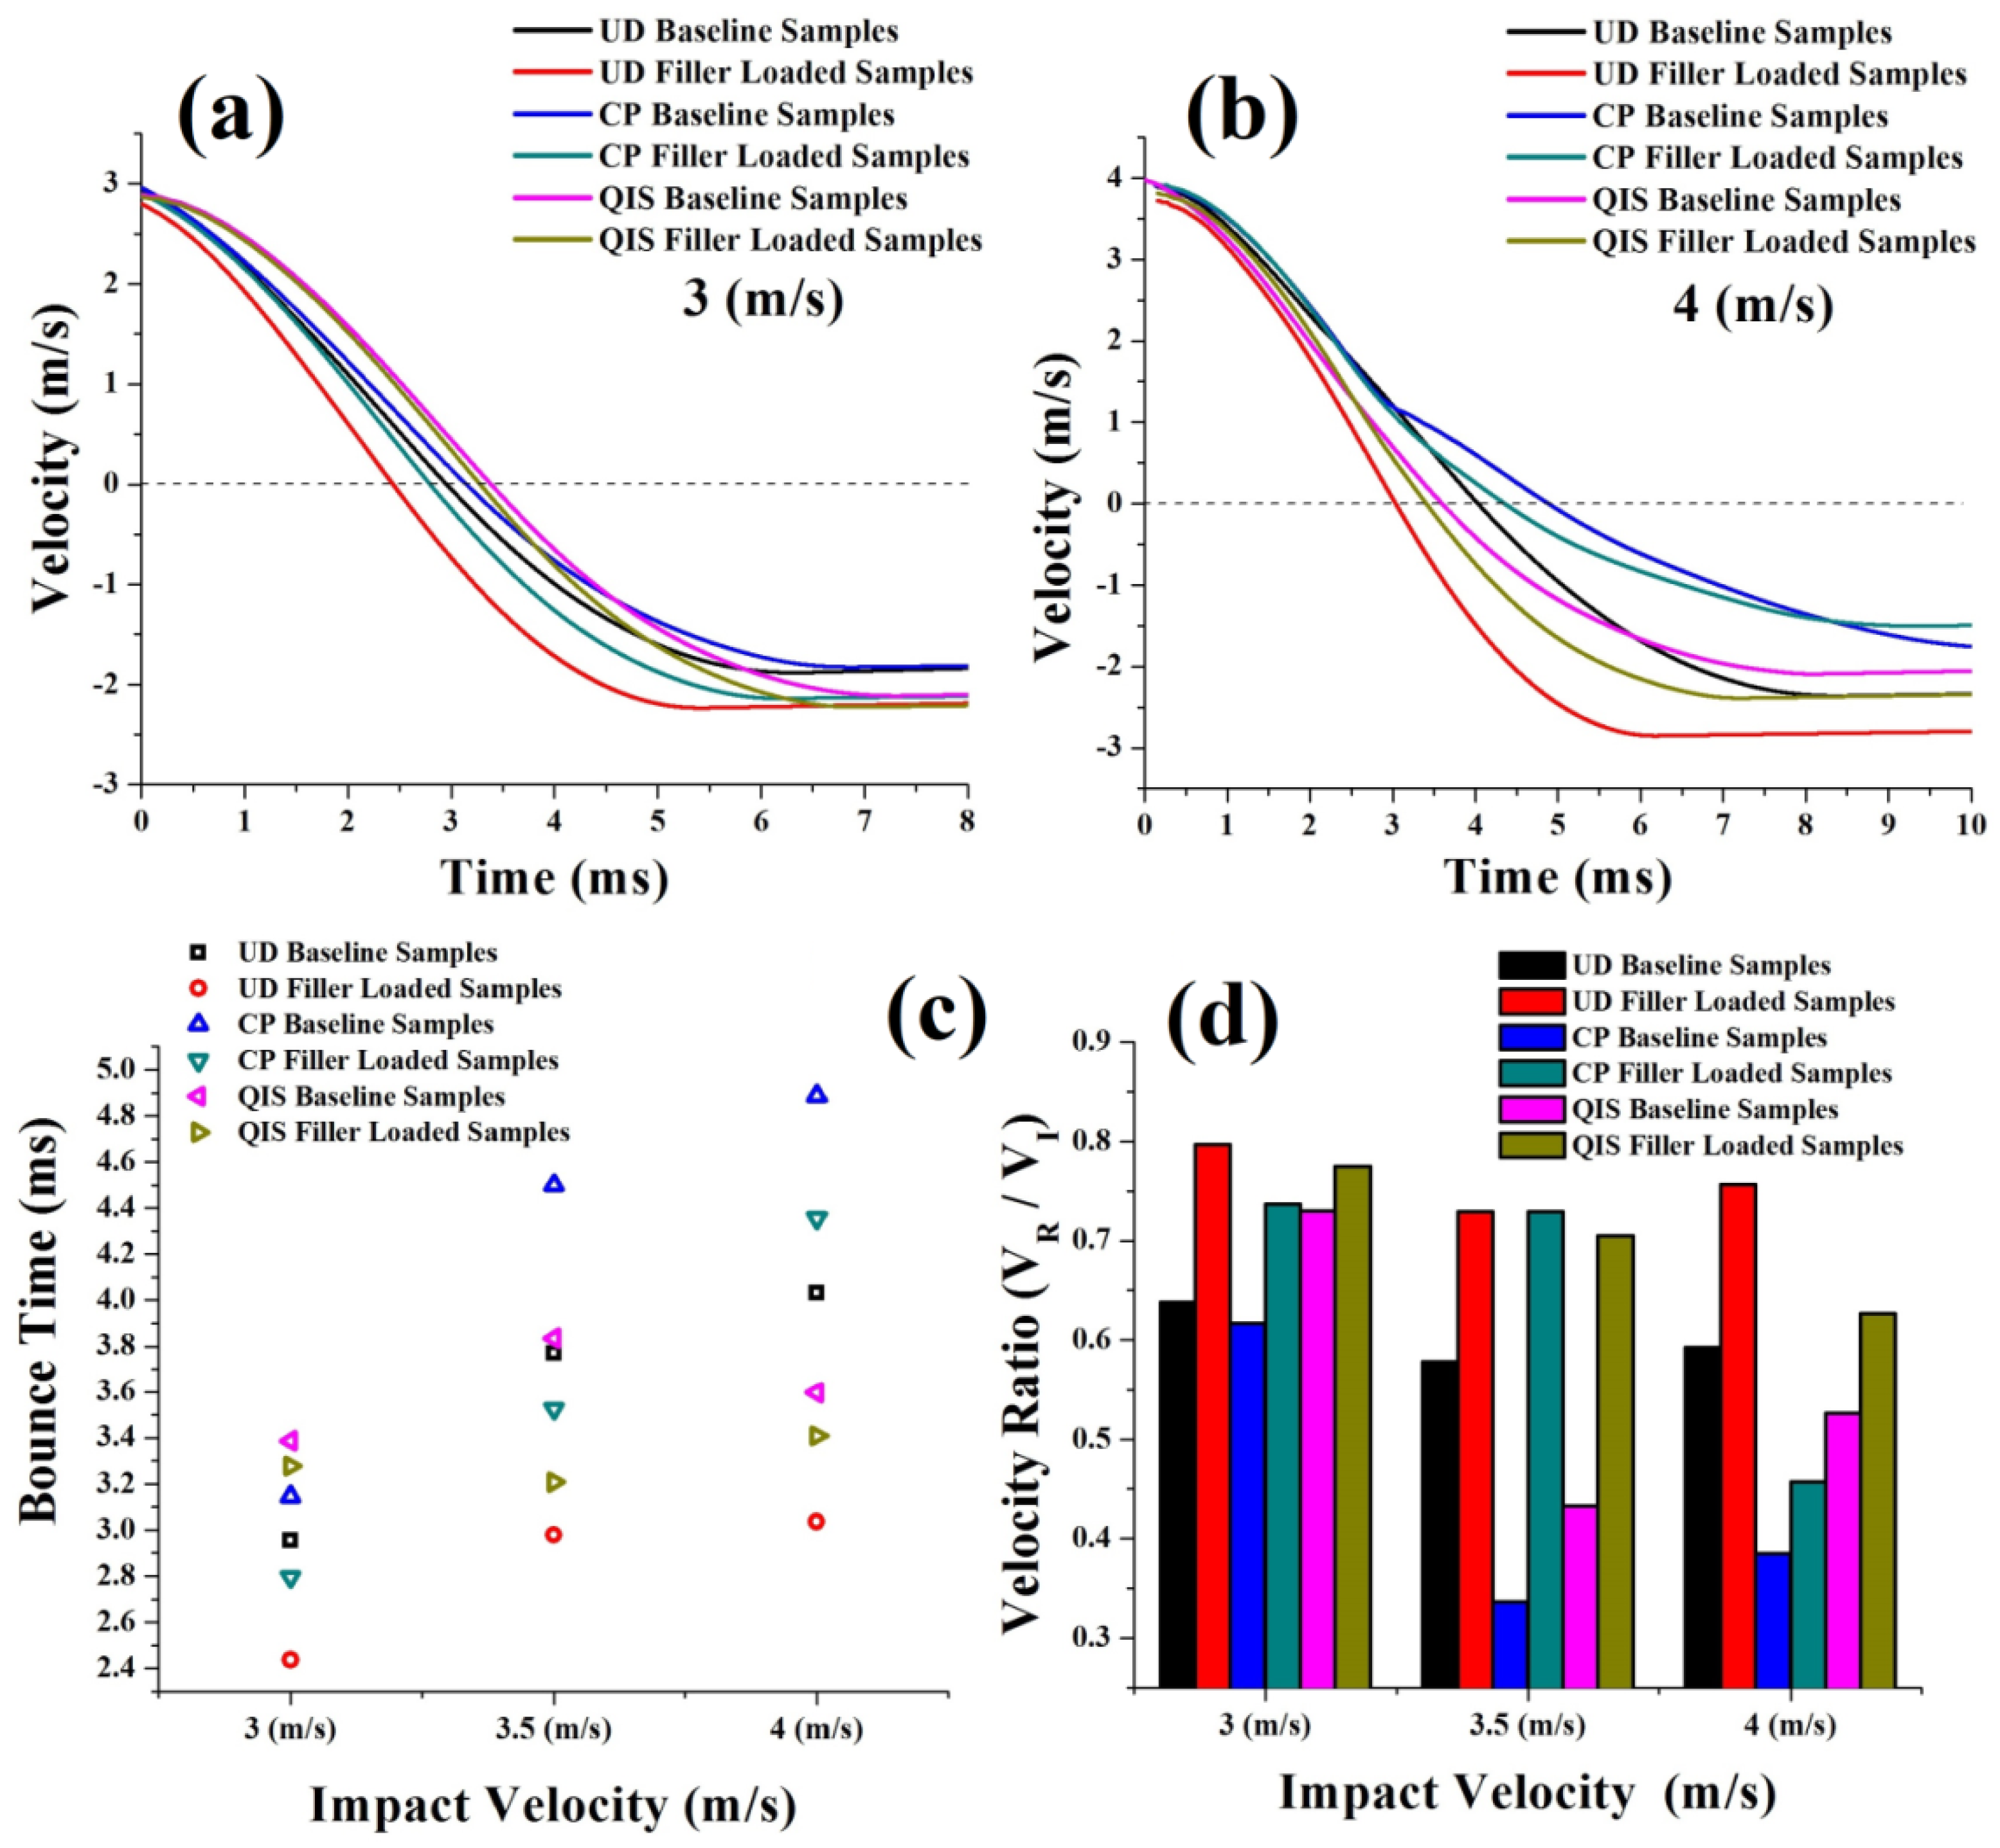
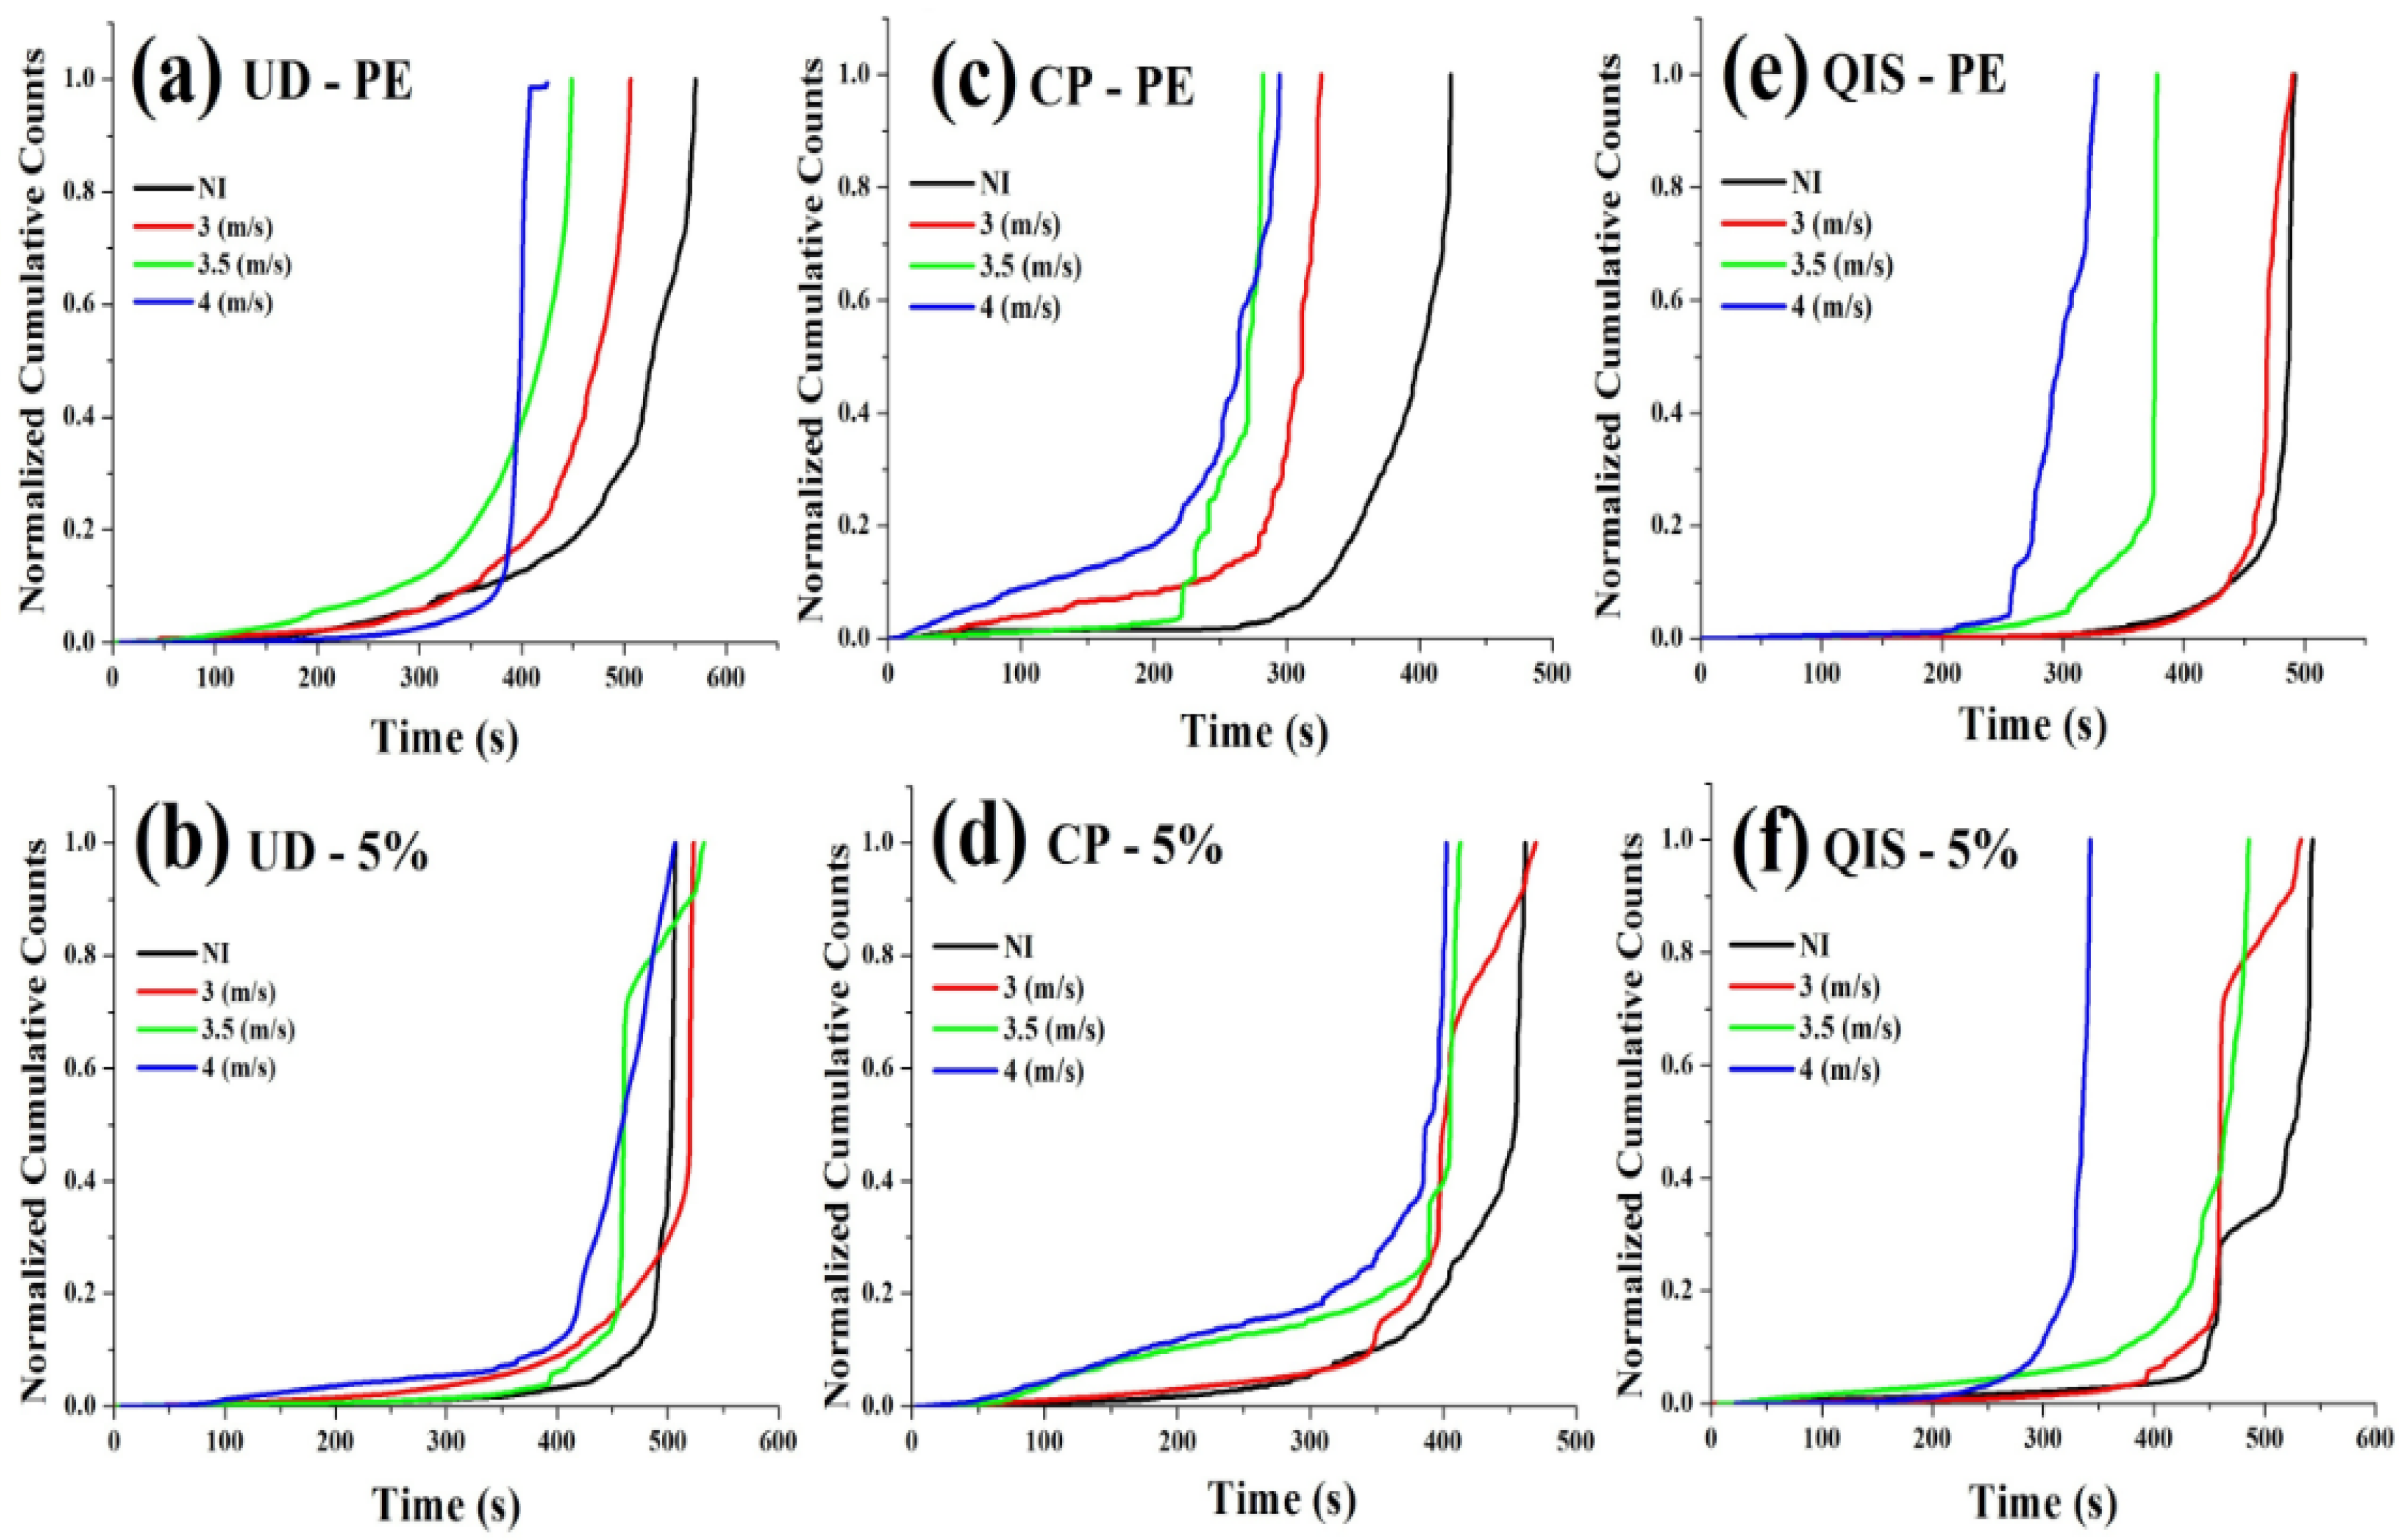
  • The bounce time occurred earlier for unidirectional and cross-ply filler loaded samples at 3 m/s impact velocity, whereas the quasi-iso baseline and filler loaded samples exhibited delayed bounce time. However, at 3.5 m/s and 4 m/s, the cross-ply baseline samples had delayed bounce time while unidirectional filler loaded samples had shorter bounce time. This evidences that the addition of milled fibers has improved the impact strength/stiffness, which contributes to the lesser deformation and earlier bounce time.
  • The cross-ply and quasi-iso samples showed prevalent reduction in residual load bearing capacity at 3.5 m/s and 4 m/s whereas this reduction was minimal in filler modified samples. In the cases of non-impacted and impacted at 3 m/s, the cross-ply and quasi-iso samples showed nominal influence on strength of the samples. However, at higher impact velocities, substantial improvement in residual load was observed for all the cases of filler loaded samples.
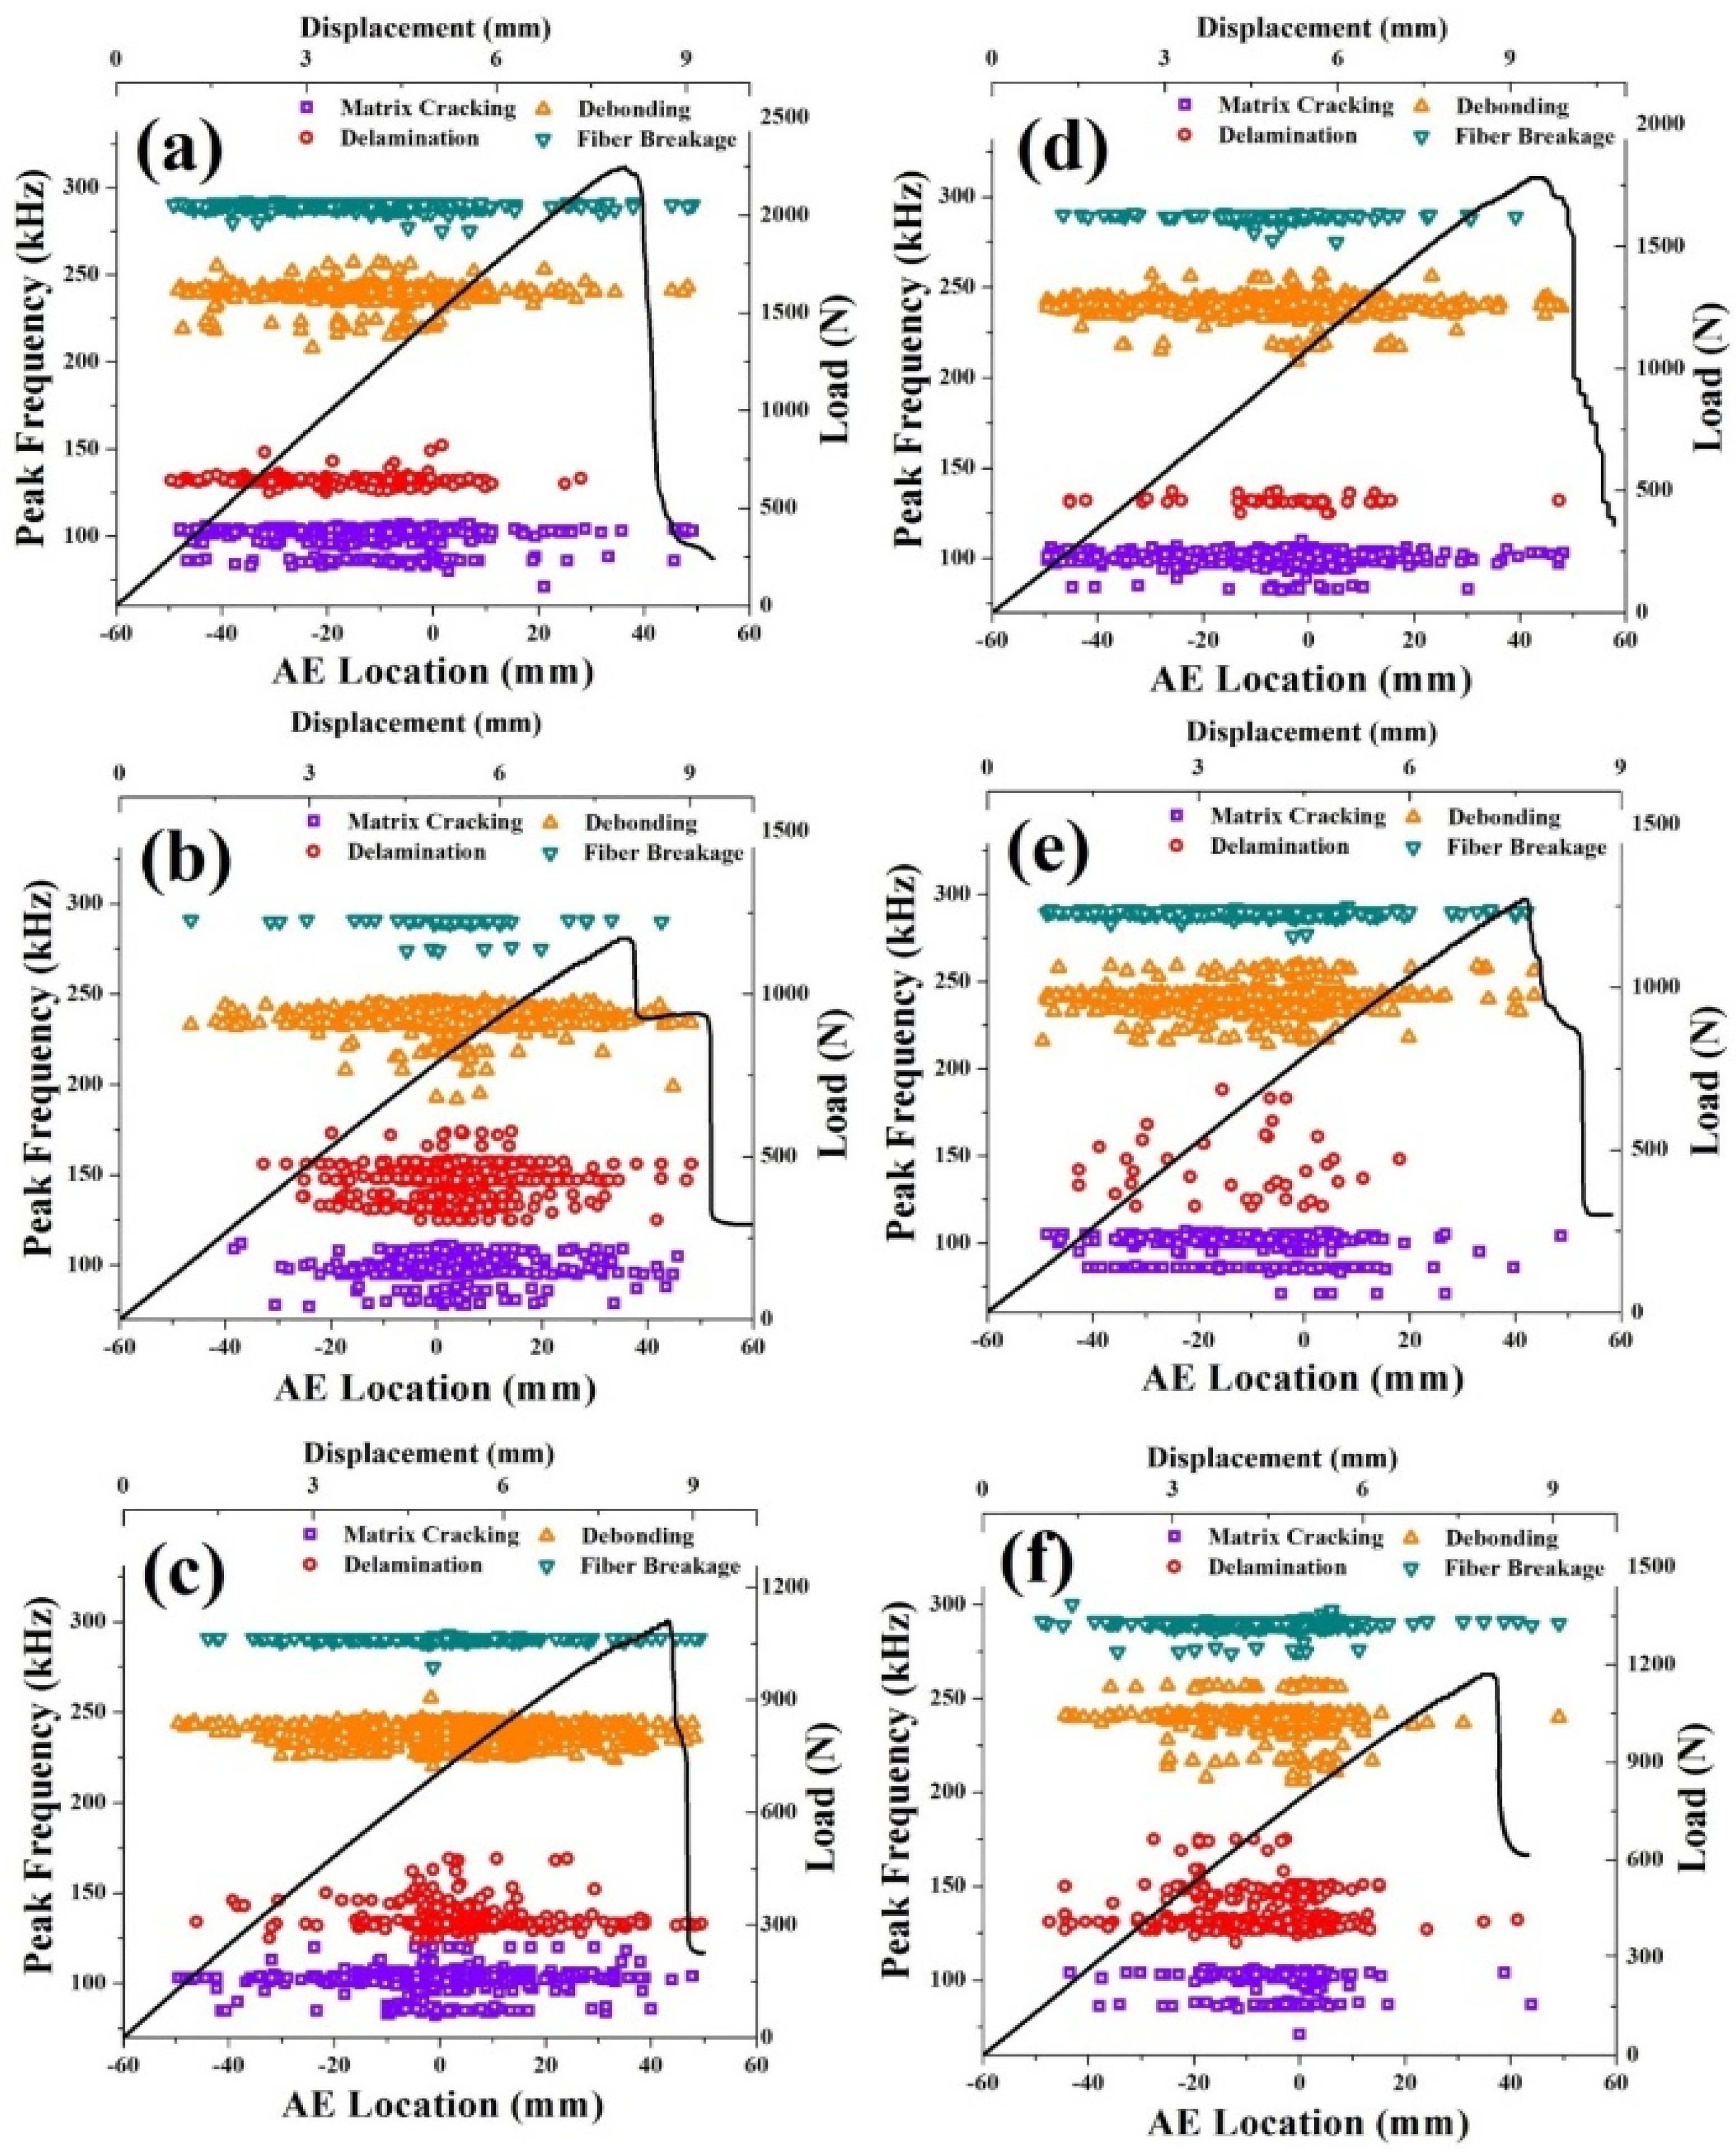
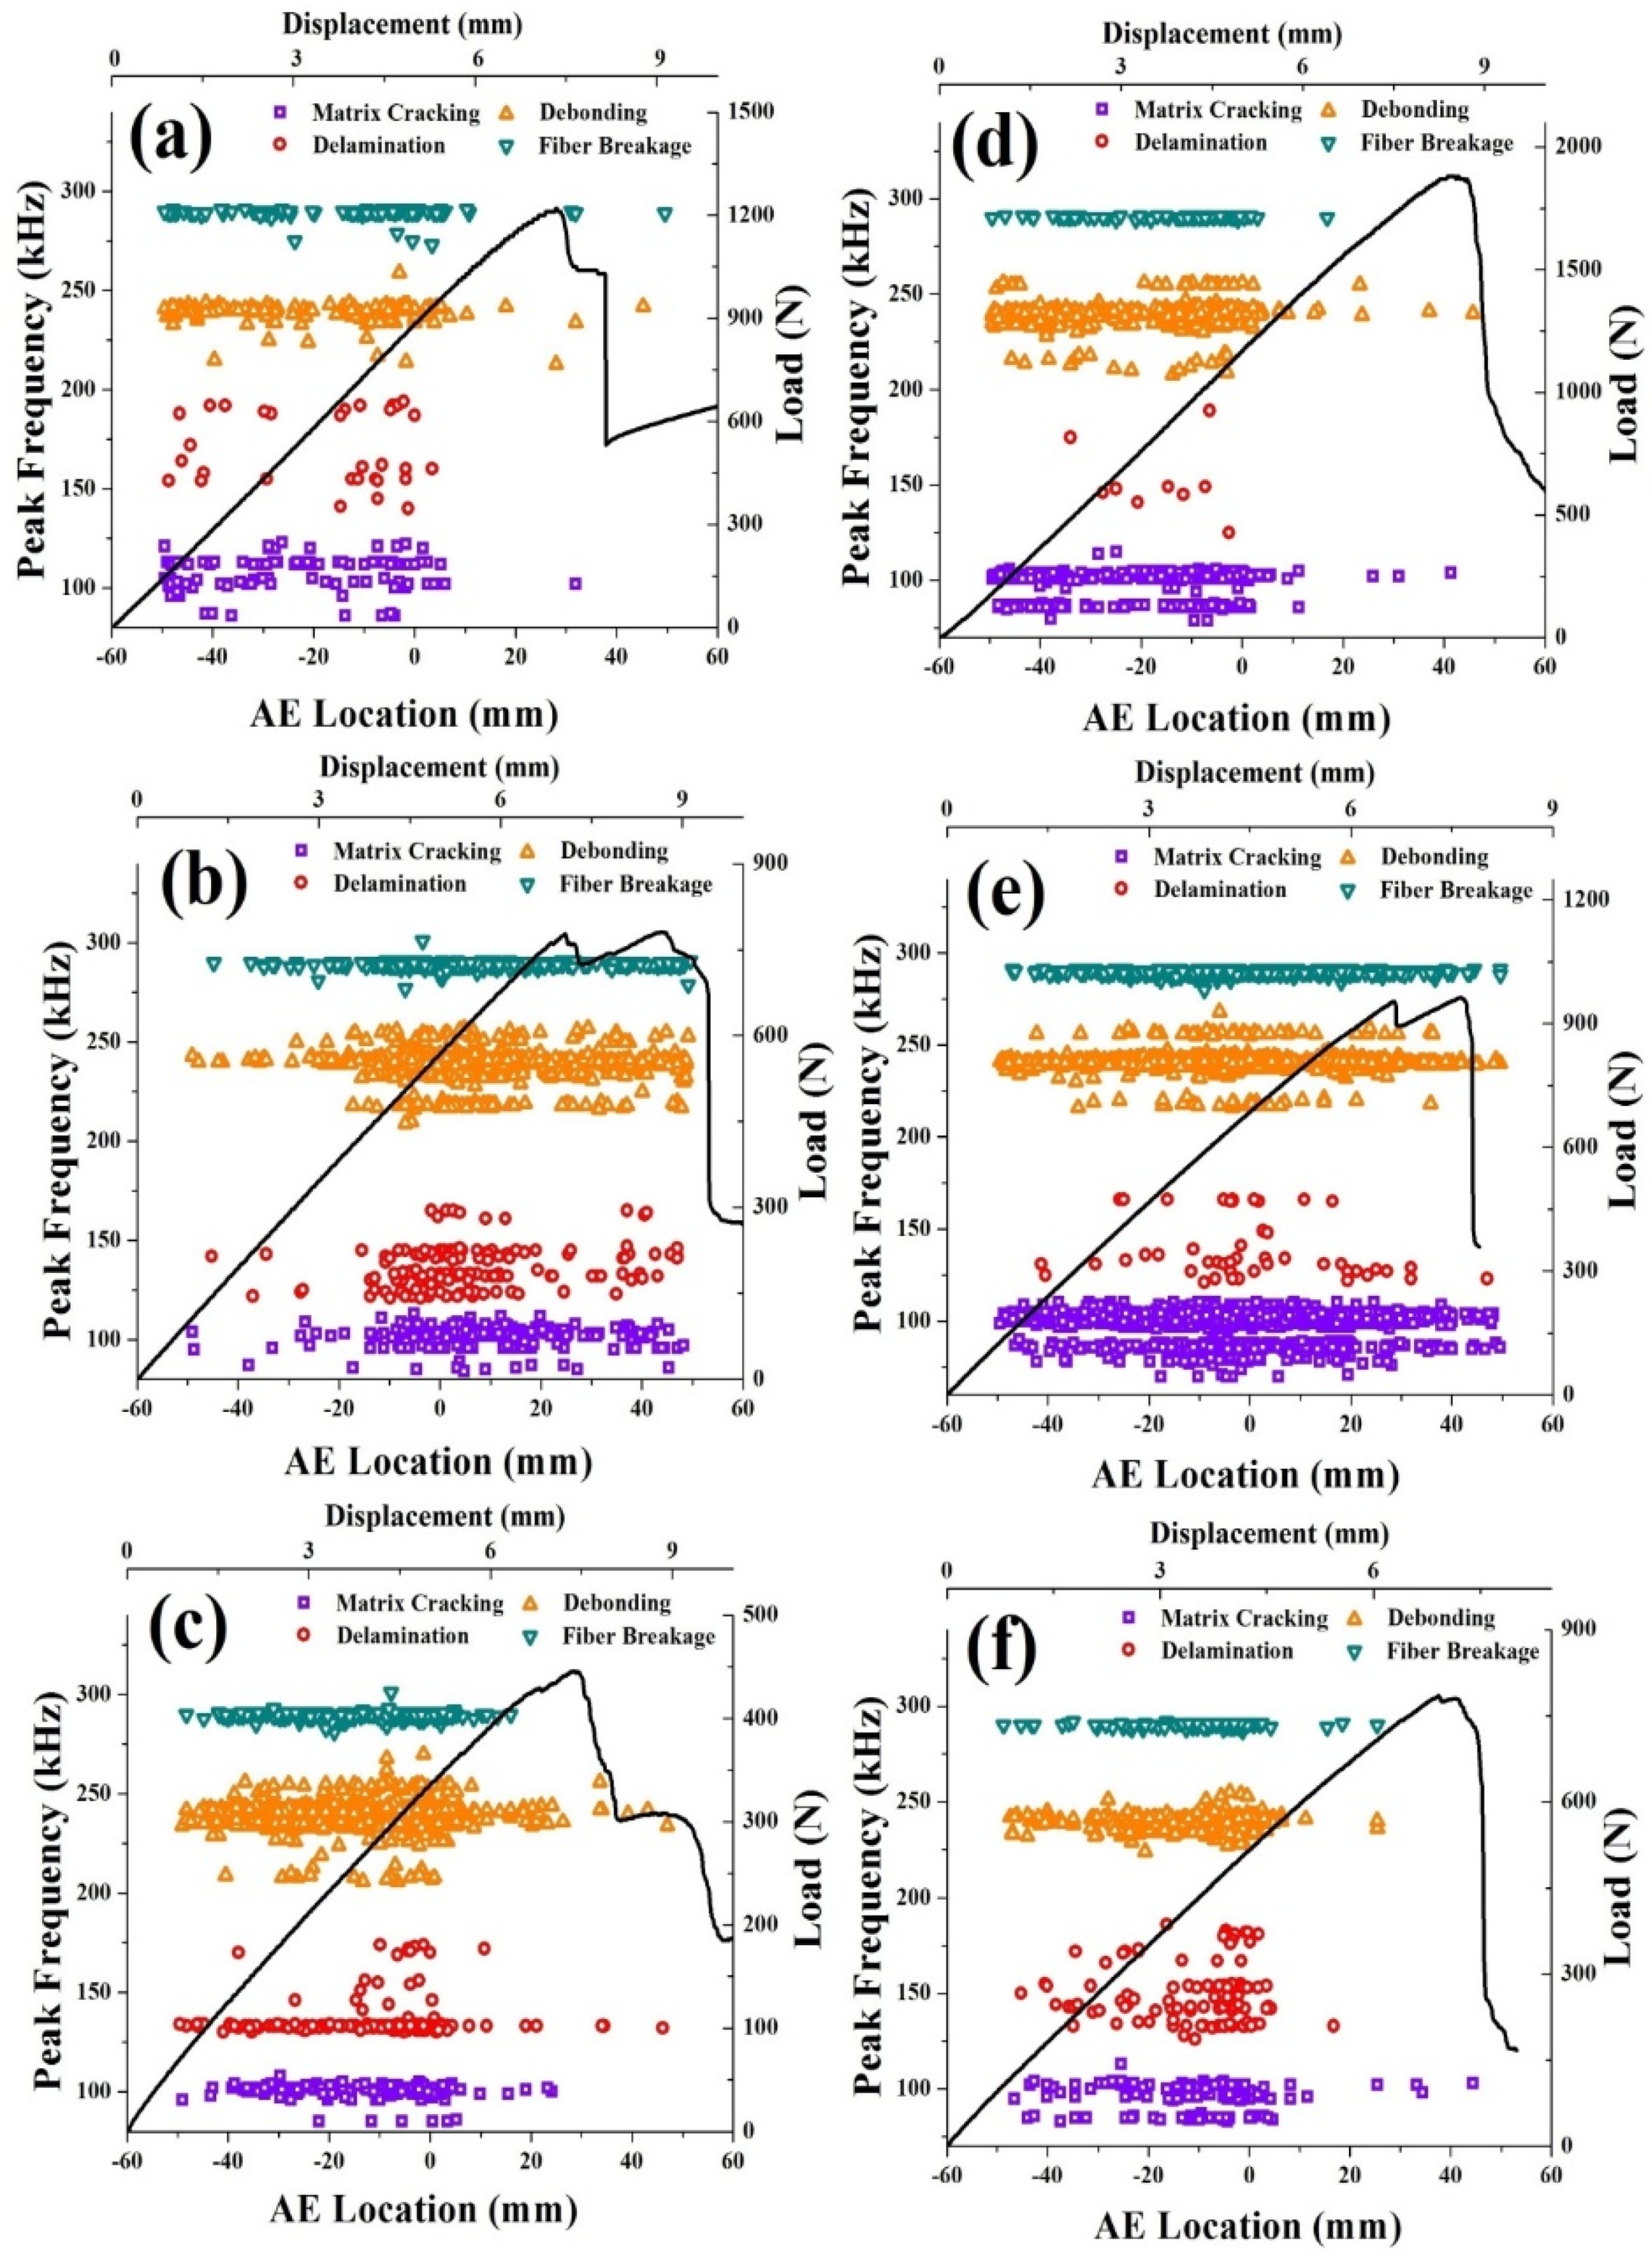
  • The presence of fillers at the interlaminar zone contributes to improved energy dissipation process by filler debonding/pull-out and also arrest/prevent the delamination crack growth, resulting in reduced damage size. Therefore, the addition of milled fibers on glass/epoxy laminates has enhanced the impact toughness and post-impact flexural strength.

Author Contributions

Conceptualization, V.A.; Data curation, S.K.; Formal analysis, S.K. and H.S.; Investigation, S.K.; Methodology, H.S. and V.A.; Supervision, V.A. and H.N.D.; Writing–original draft, S.K.; Writing–review & editing, V.A. and H.N.D. All authors have read and agreed to the published version of the manuscript.

Funding

This research received no specific grant from any funding agency in the public, commercial, or not-for-profit sectors.

Conflicts of Interest

The authors declared no potential conflicts of interest with respect to the research, authorship, and/or publication of this article.

References

  1. Hanif, A.; Usman, M.; Lu, Z.; Cheng, Y.; Li, Z. Flexural fatigue behaviour of this laminated cementitious composites incorporating censphere fillers. Mater. Des. 2018, 140, 267–277. [Google Scholar] [CrossRef]
  2. Hanif, A.; Cheng, Y.; Lu, Z.; Li, Z. Mechanical behaviour of thin-laminated cementitious composites incorporating cenosphere fillers. ACI Mater. J. 2018, 115, 117–127. [Google Scholar]
  3. Abrate, S. Impact on Composite Structures; Cambridge Press University: Cambridge, UK, 1998. [Google Scholar]
  4. Hull, D.; Shi, Y.B. Damage mechanism characterization in composite damage tolerance investigations. Compos. Struct. 1993, 23, 99–120. [Google Scholar] [CrossRef]
  5. Kostopoulos, V.; Baltopoulos, A.; Karapappas, P.; Vavouliotis, A.; Paipetis, A. Impact and after-impact properties of carbon fibre reinforced composites enhanced with multi-wall carbon nanotubes. Compos. Sci. Technol. 2010, 70, 553–563. [Google Scholar] [CrossRef]
  6. Esrail, F.; Kassapoglou, C. An efficient approach to determine compression after impact strength of quasi-isotropic composite laminates. Compos. Sci. Technol. 2014, 98, 28–35. [Google Scholar] [CrossRef]
  7. Nyman, T.; Bredberg, A.; Schon, J. Equivalent damage and residual strength for impact damaged composite structures. J. Reinf. Plast. Compos. 2000, 19, 428–448. [Google Scholar] [CrossRef]
  8. Mehmet, A.; Cesim, A.; Bülent, M.I.; Ramazan, K. An experimental investigation of the impact response of composite laminates. Compos. Struct. 2009, 87, 307–313. [Google Scholar]
  9. Khondker, O.A.; Leong, K.H.; Herszberg, I.; Hamada, H. Impact and compression after impact performance of weft-knitted glass textile composites. Compos. Part A Appl. Sci. Manuf. 2005, 36, 638–648. [Google Scholar] [CrossRef]
  10. Zhou, J.; Liao, B.; Shi, Y.; Zuo, Y.; Tuo, H.; Jia, L. Low-velocity impact behavior and residual tensile strength of CFRP laminates. Compos. Part B Eng. 2019, 161, 300–313. [Google Scholar] [CrossRef]
  11. Binbin, L.; Jianwu, Z.; Ying, L.; Panding, W.; Li, X.; Ruxin, G.; Ke, B.; Daining, F. Damage accumulation mechanism of composite laminates subjected to repeated low velocity impacts. Int. J. Mech. Sci. 2020, 182, 105783. [Google Scholar] [CrossRef]
  12. Chenghong, H.; Yubin, L.; Zuoguang, Z.; Zhijie, S. Impact damage modes and residual flexural properties of composite beam. J. Reinf. Plast. Compos. 2008, 27, 1163–1175. [Google Scholar] [CrossRef]
  13. Amaro, A.M.; Reis, P.N.B.; Moura, M.F.S.F. Residual strength after low velocity impact in carbon-epoxy laminates. Mater Sci. Forum 2006, 514, 624–628. [Google Scholar] [CrossRef]
  14. Zhang, Z.Y.; Richardson, M.O.W. Low velocity impact induced damage evaluation and its effect on the residual flexural properties of pultruded GRP composites. Compos. Struct. 2007, 81, 195–201. [Google Scholar] [CrossRef]
  15. Santiuste, C.; Sanchez-Saez, S.; Barbero, E. Residual flexural strength after low-velocity impact in glass/polyester composite beams. Compos. Struct. 2010, 92, 25–30. [Google Scholar] [CrossRef] [Green Version]
  16. Sun, L.; Gibson, R.F.; Gordaninejad, F.; Suhr, J. Energy absorption capability of nanocomposites: A review. Compos. Sci. Technol. 2009, 69, 2392–2409. [Google Scholar] [CrossRef]
  17. Wicks, S.; de Villoria, R.; Wardle, B. Inter-laminar and intralaminar reinforcement of composite laminates with aligned carbon nanotubes. Compos. Sci. Technol. 2010, 70, 20–28. [Google Scholar] [CrossRef]
  18. Davis, D.; Whelan, B. An experimental study of inter-laminar shear fracture toughness of a nanotube-reinforced composite. Compos. Part B 2011, 42, 105–116. [Google Scholar] [CrossRef]
  19. Zhu, Y.; Bakis, C.E.; Adair, J.H. Effects of carbon nanofiller functionalization and distribution on interlaminar fracture toughness of multi-scale reinforced polymer composites. Carbon 2012, 50, 1316–1331. [Google Scholar] [CrossRef]
  20. Soliman, E.M.; Sheyka, M.P.; Tahaa, M.R. Low-velocity impact of thin woven carbon fabric composites incorporating multi-walled carbon nanotubes. Int. J. Impact Eng. 2012, 47, 39–47. [Google Scholar] [CrossRef]
  21. Nicholas, T.K.; Mohammad, M.H.; Anton, K.; Mahmood, H.; Lawrence, T.D.; Alfred, L. Interlaminar reinforcement of glass fiber/epoxy composites with graphene nano platelets. Compos. Part A 2015, 70, 82–92. [Google Scholar]
  22. Cholake, S.T.; Moran, G.; Joe, B.; Bai, Y.; Raman, R.S.; Zhao, X.L.; Rizkalla, S.; Bandyopadhyay, S. Improved mode I fracture resistance of FRP composites by reinforcing epoxy matrix with recycled short milled carbon fiber. Constr. Build. Mater. 2016, 111, 399–407. [Google Scholar] [CrossRef]
  23. Lee, H.; Hanif, A.; Usman, M.; Sim, J.; Oh, H. Performance evaluation of concrete incorporating glass powder and glass sludge wastes as supplementary cementing material. J. Clean. Prod. 2018, 170, 683–693. [Google Scholar] [CrossRef]
  24. Mu, B.; Li, Z.; Peng, J. Short fiber-reinforced cementitious extruded plates with high percentage of slag and different fibers. Cem. Concr. Res. 2000, 30, 1277–1282. [Google Scholar] [CrossRef]
  25. Saravanakumar, K.; Lakshminarayanan, B.S.; Arumugam, V. Effect of thickness and denting behavior of glass/epoxy laminates subjected to quasi-static indentation (QSI) loading under acoustic emission monitoring. J. Nondestruct. Eval. 2018, 37, 63. [Google Scholar] [CrossRef]
  26. Saravanakumar, K.; Nibras, F.; Arumugam, V. Effect of fiber orientation on Mode-I delamination resistance of glass/epoxy laminates incorporated with milled glass fiber fillers. Eng. Fract. Mech. 2018, 199, 61–70. [Google Scholar] [CrossRef]
  27. Asokan, R.; Arumugam, V.; Santulli, C.; Barath Kumar, S.; Joseph Stanley, A. Investigation of the strength of the failure modes in GFRP laminates using acoustic emission monitoring. Int. J. Poly Technol. 2011, 3, 57–65. [Google Scholar]
  28. Arumugam, V.; Sajith, S.; Stanley, A.J. Acoustic emission characterization of failure modes in GFRP laminates under mode I delamination. J. Nondestruct. Eval. 2011, 30, 213–219. [Google Scholar] [CrossRef]
  29. Jefferson Andrew, J.; Arumugam, V.; Saravanakumar, K.; Dhakal, H.N.; Santulli, C. Compression after impact strength of repaired GFRP composite laminates under repeated impact loading. Compos. Struct. 2015, 133, 911–920. [Google Scholar] [CrossRef]
  30. Saravanakumar, K.; Harini, S.; Arumugam, V.; Dhakal, H.N. Influence of milled glass fillers on the impact and compression after impact behavior of glass/epoxy composite laminates. Polym. Test. 2019, 75, 133–141. [Google Scholar] [CrossRef] [Green Version]
  31. Diantang, Z.; Ying, S.; Li, C.; Ning, P. A comparative study on low-velocity impact response of fabric composite laminates. Mater. Des. 2013, 50, 750–756. [Google Scholar]
  32. Sevkat, E.; Liaw, B.; Delale, F.; Raju, B.B. Effect of repeated impacts on the response of plain-woven hybrid composites. Compos. Part B Eng. 2010, 41, 403–413. [Google Scholar] [CrossRef]
  33. Shyr, T.W.; Pan, Y.H. Impact resistance and damage characteristics of composite laminates. Compos. Struct. 2003, 62, 193–203. [Google Scholar] [CrossRef]
  34. Dehkordi, M.T.; Nosraty, H.; Shokrieh, M.M.; Minak, G.; Ghelli, D. Low velocity impact properties of intra-ply hybrid composites based on basalt and nylon woven fabrics. Mater Des. 2010, 31, 3835–3844. [Google Scholar] [CrossRef]
  35. Fan, W.; Qiao, P. Vibration-based damage identification methods: A review and comparative study. Struct. Health Monit. 2011, 10, 83–111. [Google Scholar] [CrossRef]
  36. Reis, P.N.B.; Ferreira, J.A.M.; Santos, P.; Richardson, M.O.W.; Santos, J.B. Impact response of Kevlar composites with filled epoxy matrix. Compos. Struct. 2012, 94, 3520–3528. [Google Scholar] [CrossRef]
  37. Reis, P.N.B.; Ferreira, J.A.M.; Zhang, Z.Y.; Benameur, T.; Richardson, M.O.W. Impact response of Kevlar composites with nanoclay enhanced epoxy matrix. Compos. Part B Eng. 2013, 46, 7–14. [Google Scholar] [CrossRef]
  38. Boominathan, R.; Arumugam, V.; Santulli, C.; Adhithya, P.S.A.; Anand, S.R.; Sridhar, B.T.N. Acoustic emission characterization of the temperature effect on falling weight impact damage in carbon/epoxy laminates. Compos. Part B 2014, 56, 591–598. [Google Scholar] [CrossRef]
  39. Saravanakumar, K.; Arumugam, V. Effect of milled glass fibers on quasi-static indentation and tensile behavior of tapered laminates under acoustic emission monitoring. Eng. Fract. Mech. 2018, 201, 36–46. [Google Scholar] [CrossRef]
  40. Ramirez-Jimenez, C.R.; Papadakis, N.; Reynolds, N.; Gan, T.H.; Purnell, P.; Pharaoh, M. Identification of failure modes in glass/polypropylene composites by means of the primary frequency content of the acoustic emission event. Compos. Sci. Technol. 2004, 64, 1819–1827. [Google Scholar] [CrossRef]
Figure 1. Fractovis drop-weight impact setup (left). (a) Drop weight impact testing tower. (b) Catcher mechanism for arresting multiple impact; and (c) Clamping fixture and post-impact test with AE monitoring (right). (d) Impacted glass/epoxy samples being subjected to three-point bending test.
Jcs 04 00099 g001
Figure 2. Load vs. deformation and energy vs. time response of composite laminates at different impact velocities. (a) 3 m/s; (b) 3.5 m/s; (c) 4 m/s; (d) 3 m/s; (e) 3.5 m/s; (f) 4 m/s.
Jcs 04 00099 g002
Figure 3. (a) Peak load; (b) % change in peak load; (c) maximum deformation; (d) % change in maximum deformation for different samples at various impact velocities.
Jcs 04 00099 g003
Figure 4. (a) Absorbed energy; (b) % change in absorbed energy; (c) energy profile diagram; (d) damage degree for different samples at various impact velocities.
Jcs 04 00099 g004
Figure 5. Velocity vs. time response of different samples (a) 3 m/s, (b) 4 m/s, (c) bounce time, and (d) velocity ratio.
Jcs 04 00099 g005
Figure 6. (a) Elastic energy; (b) % change in elastic energy; (c) residual deformation; and (d) % change in residual deformation for different samples at various impact velocities.
Jcs 04 00099 g006
Figure 7. SEM images of fractures surfaces of filler loaded samples.
Jcs 04 00099 g007
Figure 8. Backlight photograph of impact damage on baseline samples.
Jcs 04 00099 g008
Figure 9. Backlight photograph of impact damage on filler added samples.
Jcs 04 00099 g009
Figure 10. Flexural after impact load of different samples at varying velocities.
Jcs 04 00099 g010
Figure 11. (a) Percentage reduction of FAI load as a result of increasing impact velocities. (b) Percentage increase of residual load in filler loaded samples.
Jcs 04 00099 g011
Figure 12. Schematic illustration of impacted samples under flexural loading with acoustic emission monitoring.
Jcs 04 00099 g012
Figure 13. Normalized AE cumulative counts vs. time plot for different samples. Baseline: (a) UD, (c) CP, (e) QIS and filler loaded: (b) UD, (d) CP, (f) QIS.
Jcs 04 00099 g013
Figure 14. Load–displacement curves with peak frequency plot of non-impacted samples. Baseline: (a) UD, (b) CP, (c) QIS and filler loaded: (d) UD, (e) CP, (f) QIS.
Jcs 04 00099 g014
Figure 15. Load–displacement curves with peak frequency plot of samples impacted at 4 m/s. Baseline: (a) UD, (b) CP, (c) QIS and filler loaded: (d) UD, (e) CP, (f) QIS.
Jcs 04 00099 g015
Figure 16. Types of failure modes vs. normalized AE events plot. (a) Non-impacted samples; (b) samples impacted at 3 m/s; (c) samples impacted at 3.5 m/s; (d) samples impacted at 4 m/s.
Jcs 04 00099 g016

