Article

Machine Learning Models for Predicting Mechanical Properties of FRP-Confined Concrete Columns Across Low- to Ultra-High-Strength Concrete

by
Javad Shayanfar
* and
Joaquim A. O. Barros
ISISE, IBS, Department of Civil Engineering, University of Minho, Azurém, 4800-058 Guimarães, Portugal
*
Author to whom correspondence should be addressed.
J. Compos. Sci. 2026, 10(8), 393; https://doi.org/10.3390/jcs10080393
Submission received: 1 July 2026 / Revised: 15 July 2026 / Accepted: 23 July 2026 / Published: 27 July 2026

Abstract

This study presents a comprehensive analysis and predictive modeling framework for the axial compressive strength (fcc) and ultimate axial strain (εcu) of concrete columns confined within fiber-reinforced polymer (FRP) systems. Large databases comprising 3312 samples for fcc and 3319 for εcu were compiled from the literature, encompassing a wide range of key variables, including unconfined concrete strength from 7 MPa to 204 MPa and diverse FRP confinement configurations. The datasets were subjected to extensive statistical and multivariate analyses to identify the primary factors influencing axial behavior and guide feature selection for predictive modeling. Three groups of machine learning (ML) algorithms were subsequently considered: (i) artificial neural networks (including multilayer perceptrons with one and two hidden layers), (ii) kernel-based models (Gaussian process regression and support vector regression), and (iii) tree-based ensemble models (gradient boosting machine, eXtreme gradient boosting, and light gradient boosting machine). Hyperparameters were optimized using grid search cross-validation, while feature importance analyses were performed to quantify the contribution of each input variable. Among all ML models, eXtreme gradient boosting demonstrated superior predictive performance, effectively capturing the nonlinear and multivariate interactions governing confinement effectiveness. Comparative analysis with the top performing regression-based formulations further highlighted the accuracy, robustness, and generalization capability of the eXtreme gradient boosting model. The findings provide a data-driven and interpretable framework for the design and prediction of FRP-confined concrete columns.

1. Introduction

Fiber-reinforced polymer (FRP) confinement is widely recognized as an effective method for enhancing the compressive behavior of reinforced concrete (RC) columns. When externally bonded as continuous jackets, FRP composites provide passive lateral confinement that restrains the concrete radial dilation, thereby increasing its compressive strength, ductility, and ultimate strain [1,2,3,4]. The confinement action significantly modifies the concrete stress–strain response, particularly in the post-peak phase. This effect becomes especially evident because unconfined concrete exhibits rapid strength degradation under substantial lateral deformation. Experimental studies (e.g., Lim and Ozbakkaloglu [5], Shayanfar et al. [6]) consistently show that the structural behavior of FRP-confined concrete columns is strongly influenced by the compressive strength of the unconfined concrete (fc0). Accordingly, for a given level of normalized FRP confinement pressure (fl/fc0), the enhancement provided by FRP confinement decreases as fc0 increases. This behavior is primarily attributed to the relatively reduced lateral dilation of higher-strength concrete, which delays the activation of the FRP jacket and limits the development of effective confinement pressure, fl, [7]. As concrete strength increases, the material becomes more brittle and exhibits a smaller volumetric expansion before failure, resulting in lower hoop strains in the FRP and a reduced ability of the confinement system to mobilize its full confining potential. Additionally, the higher elastic modulus and lower microcrack density in high-strength concrete restrict the interaction between the expanding concrete core and the FRP jacket, further diminishing confinement effectiveness ([8]). While low-strength concrete typically exhibits a full strain-hardening response under FRP confinement, the behavior gradually shifts to a strain-softening response for high- and ultra-high-strength concrete, dependent on confinement stiffness level ([9,10,11]). This transition reflects the decreasing ability of FRP confinement to compensate for the intrinsic brittleness and limited dilation capacity of higher-strength concretes.
Although many regression-based models (e.g., [12,13,14,15,16,17,18,19]) have been proposed to estimate the compressive strength (fcc) and ultimate strain (εcu) of FRP-confined concrete, most of these models assume a linear relationship between fcc/fc0 and fl/fc0. However, this assumption is not supported by experimental evidence, particularly across different concrete strength classes. On the other hand, most existing formulations have been calibrated using datasets limited to a specific range of fc0, which restricts their ability to accurately capture the nonlinear and strength-dependent confinement mechanisms [20]. Artificial intelligence (AI) has been increasingly applied across various areas of civil engineering, including structural design and analysis ([21]), earthquake and seismic assessment ([22]), bridge and infrastructure monitoring ([23]), concrete material modeling ([24]), and traffic and transportation systems ([25]). Within this context, a growing number of studies have investigated the use of machine learning (ML) models to predict fcc and εcu, aiming to overcome the limitations of traditional empirical formulations. Early ML-based approaches primarily relied on artificial neural networks (ANNs) and genetic programming trained on relatively small experimental datasets (100–213 specimens). These models typically considered input variables related to column geometry, unconfined concrete strength, and FRP mechanical properties such as thickness, elastic modulus, and tensile strength ([26,27,28,29,30]). Although these models demonstrated the potential of ML to capture the compressive response of FRP-confined concrete, their predictive reliability was constrained by limited data coverage and parameter variability, restricting their general applicability. Subsequent studies expanded both dataset size and input parameter space, using databases ranging from 128 to 519 specimens and incorporating additional features such as confinement stiffness, FRP rupture strain, and confinement pressure at rupture phase ([31,32,33]). These considerations resulted in more reliable predictions and a better representation of the physical confinement mechanics. More recent research has adopted advanced ML techniques, including support vector regression (SVR), hybrid models, and ensemble learning frameworks, often utilizing datasets exceeding 1000 specimens ([34,35,36,37]). Among these approaches, SVR, Kriging, and Gaussian Process Regression (GPR) have exhibited particularly strong predictive capability. The effectiveness of optimized GPR was confirmed when applied to a database of 1151 specimens [38], while comparative evaluations of ensemble and deep learning methods identified back-propagation neural networks as the most accurate architecture [39].
Despite significant progress in applying ML to predict fcc and εcu, existing studies are constrained in several key ways. First, many works rely on relatively small experimental databases, often comprising fewer than 500 specimens, which limits the models’ to be extended to diverse column geometries, FRP types, and material properties. Second, there is considerable inconsistency in input parameter selection across studies. While early models focused on basic parameters of geometry and FRP and concrete mechanical properties, more recent works incorporated additional variables like confinement stiffness, FRP confinement pressure at rupture phase. However, no consensus exists on the optimal combination of features, and many models remain sensitive to the choice of inputs. Third, most studies focus on a single ML technique, such as ANN, SVR, or GPR, without systematically comparing multiple state-of-the-art algorithms to identify the most effective approach for fcc and εcu prediction.
In this study, a large database of axially loaded FRP-confined concrete columns was compiled, encompassing a wide range of key parameters, including fc0 from 7 MPa to 204 MPa with a mean value (MV) of 48 MPa and a coefficient of variation (CoV) of 0.70. Extensive statistical and multivariate analyses were conducted on the dataset to identify the principal parameters governing for fcc and εcu, and to guide the selection of input variables for predictive modeling. Then, the performance of existing regression-based formulations was evaluated against this database to identify the most reliable models. Subsequently, three groups of state-of-the-art ML models were adopted: (i) ANN, including multilayer perceptrons (MLPs) with one and two hidden layers (MLP1 and MLP2); (ii) kernel-based models, including SVR and GPR; and (iii) tree-based ensemble models, including gradient boosting machine (GBM), eXtreme gradient boosting (XGBoost), and light gradient boosting machine (LightGBM). Hyperparameters for all models were optimized via grid search cross-validation to ensure robust predictive performance. The best-performing ML models for fcc and εcu were identified based on cross-validated metrics, and a feature importance analysis quantified the contribution of each input variable. Finally, the selected ML models were comprehensively compared with the top-performing regression-based formulations to assess their relative accuracy and predictive robustness across the dataset.
Following this introduction, Section 2 presents the fundamental confinement mechanisms and identifies the key parameters governing strength enhancement and ultimate strain, establishing the basis for model development. Section 3 presents the development and statistical characterization of the experimental databases, providing the foundation for the subsequent data-driven analyses. Section 4 investigates the relationships among the governing variables through correlation analysis, thereby supporting the selection and interpretation of model inputs. Section 5 evaluates existing regression-based formulations and establishes benchmark predictive performance. Building on these findings, Section 6 develops and optimizes the machine learning models, and Section 7 assesses their predictive capability relative to existing formulations while providing insight into the influence of input variables through feature importance analysis. Finally, Section 8 summarizes the main findings and conclusions of the study.

2. FRP Confinement-Induced Strength and Deformation Enhancement

2.1. Maximum Compressive Strength

For axially loaded concrete confined with FRP, the maximum compressive strength, fcc, exceeds that of unconfined concrete, fc0, due to the confinement effect. This enhancement is quantified by Δf, leading to the following expression:
f c c = f c 0 1 + Δ f
Here, Δf represents the additional strength provided by the FRP, which acts by restraining lateral expansion of the concrete core. As a result, the FRP confinement delays cracking and crushing, allowing the concrete to sustain higher axial loads than it could in the unconfined state ([40]). The magnitude of Δf depends on three main factors: (i) the FRP confinement stiffness and pressure; (ii) the strength class of unconfined concrete; and (iii) size effects. Regarding factor (i), the effectiveness of FRP confinement depends on the confinement stiffness of the FRP jacket (KL) and the lateral confining pressure (fl,rup) it can generate. Higher stiffness or thicker FRP produces greater lateral restraint, limiting lateral expansion of the concrete core, which delays cracking and crushing and thus increases Δf. The parameters KL and fl,rup can be calculated as follows [12]:
K L = 2 n f t f E f b
f l , r u p = K L ε h , r u p
where nf is the number of FRP wrapping layers; tf is the nominal thickness of one FRP layer; Ef is FRP elastic modulus; b is the dimension of the column cross-section. In Equation (3) εh,rup is the FRP rupture strain, which was considered to be 0.55 of the ultimate tensile strain of FRP (εfu) [41]. With respect to factor (ii), stronger concrete is less deformable, so a certain increment in axial strain in this concrete induces smaller confining pressure from FRP than in a less resistant concrete, especially for compressive strain levels above the one corresponding to fc0. Therefore, Δf is typically smaller for high-strength concrete compared to normal-strength concrete for the same confinement level. Finally, concerning factor (iii), larger concrete specimens tend to exhibit lower confinement efficiency due to stress gradients and non-uniform lateral strain distribution across the section (higher probability of occurring weaker zones for damage localization). As a result, Δf decreases with increasing specimen size, reflecting smaller effectiveness of the same FRP confinement.
The objective of this study is to predict the confinement-induced strength enhancement, Δf, using state-of-the-art ML approaches applied to a comprehensive database of experimental tests. By leveraging ML models, the study aims to capture the complex interactions between FRP confinement properties, concrete strength, and size effects, providing more accurate and generalizable predictions of Δf than conventional analytical models.

2.2. Ultimate Axial Strain

The ultimate axial strain (εcu) of FRP-confined concrete under compression is defined as the axial strain corresponding to the condition at which the hoop strain in the FRP jacket reaches its rupture value (εh,rup). At this stage, the FRP jacket can no longer provide lateral confinement, and the confined concrete core undergoes unstable axial deformation. Considering strain compatibility and the Poisson effect, the axial strain at failure is related to the lateral strain through the ultimate secant Poisson’s ratio (νcu), leading to the following expression:
ε c u = ε h , r u p υ c u
Given εh,rup = 0.55 εfu ([41]), Equation (4) can be written as follows:
ε c u = 0.55 ε f u υ c u
Equation (5) highlights that the axial strain capacity of FRP-confined concrete is governed by two primary mechanisms: (i) the tensile strain capacity of the FRP jacket (εfu) and (ii) the dilation characteristics of the confined concrete, represented by νcu. Previous studies (e.g., [1]) demonstrated that νcu is not a constant material property, but rather a confinement-dependent parameter that is strongly influenced by KL and fc0. Increased confinement stiffness restricts lateral dilation, while higher concrete strength presented delayed crack propagation and volumetric expansion, both of which directly affect νcu. Based on these observations, εcu can be expressed in a generalized power-law form as follows:
ε c u = A 1 K L A 2 f c 0 A 3 ε f u A 4
where A1 to A4 are the regression coefficients. This formulation captures the dominant material and confinement-related parameters governing strain enhancement. However, it does not explicitly account for geometric effects, such as specimen size and slenderness, which have been shown experimentally to influence confinement efficiency. Larger specimens tend to exhibit reduced effective confinement due to strain localization, non-uniform hoop stresses, and scale-dependent cracking patterns, while geometric ratios affect the stress distribution and dilation behavior of the confined concrete core. To overcome these limitations, the objective of this study is to predict εcu using state-of-the-art ML techniques applied to a comprehensive database of experimental tests. ML-based models are particularly well suited for this purpose, as they can capture highly nonlinear interactions among FRP material properties, confinement stiffness, concrete strength, and geometric parameters without imposing restrictive functional assumptions. By incorporating these coupled effects, the proposed ML framework aims to provide more accurate, robust, and generalizable predictions of εcu compared with conventional analytical formulations.

3. Test Databases of Axially Loaded FRP-Confined Concrete

Table 1 and Table 2 present the experimental databases covering the axial behavior of FRP-confined concrete columns subjected to concentric compression.
To ensure the consistency, reliability, and comparability of the compiled dataset, the following inclusion and exclusion criteria were enforced:
(i)
Only data derived from axial compressive tests on plain concrete specimens were considered. Specimens incorporating internal steel reinforcement were deliberately excluded to eliminate interaction effects.
(ii)
Only specimens confined by FRP systems applied in the hoop direction were included. Specimens employing alternative confinement configurations, such as hybrid or helical systems, were excluded to maintain uniformity in confinement mechanics.
(iii)
Experimental data lacking sufficient documentation of essential material properties and geometric parameters were excluded to preserve data integrity and reproducibility.
(iv)
Specimens exhibiting a normalized peak compressive strength less than unity were excluded, as they indicate no measurable strength gain attributable to FRP confinement.
(v)
Specimens with an ultimate compressive strain below 0.002 were excluded, since this strain level is approximately equal to the peak strain of unconfined concrete and does not indicate meaningful confinement-induced deformation enhancement.
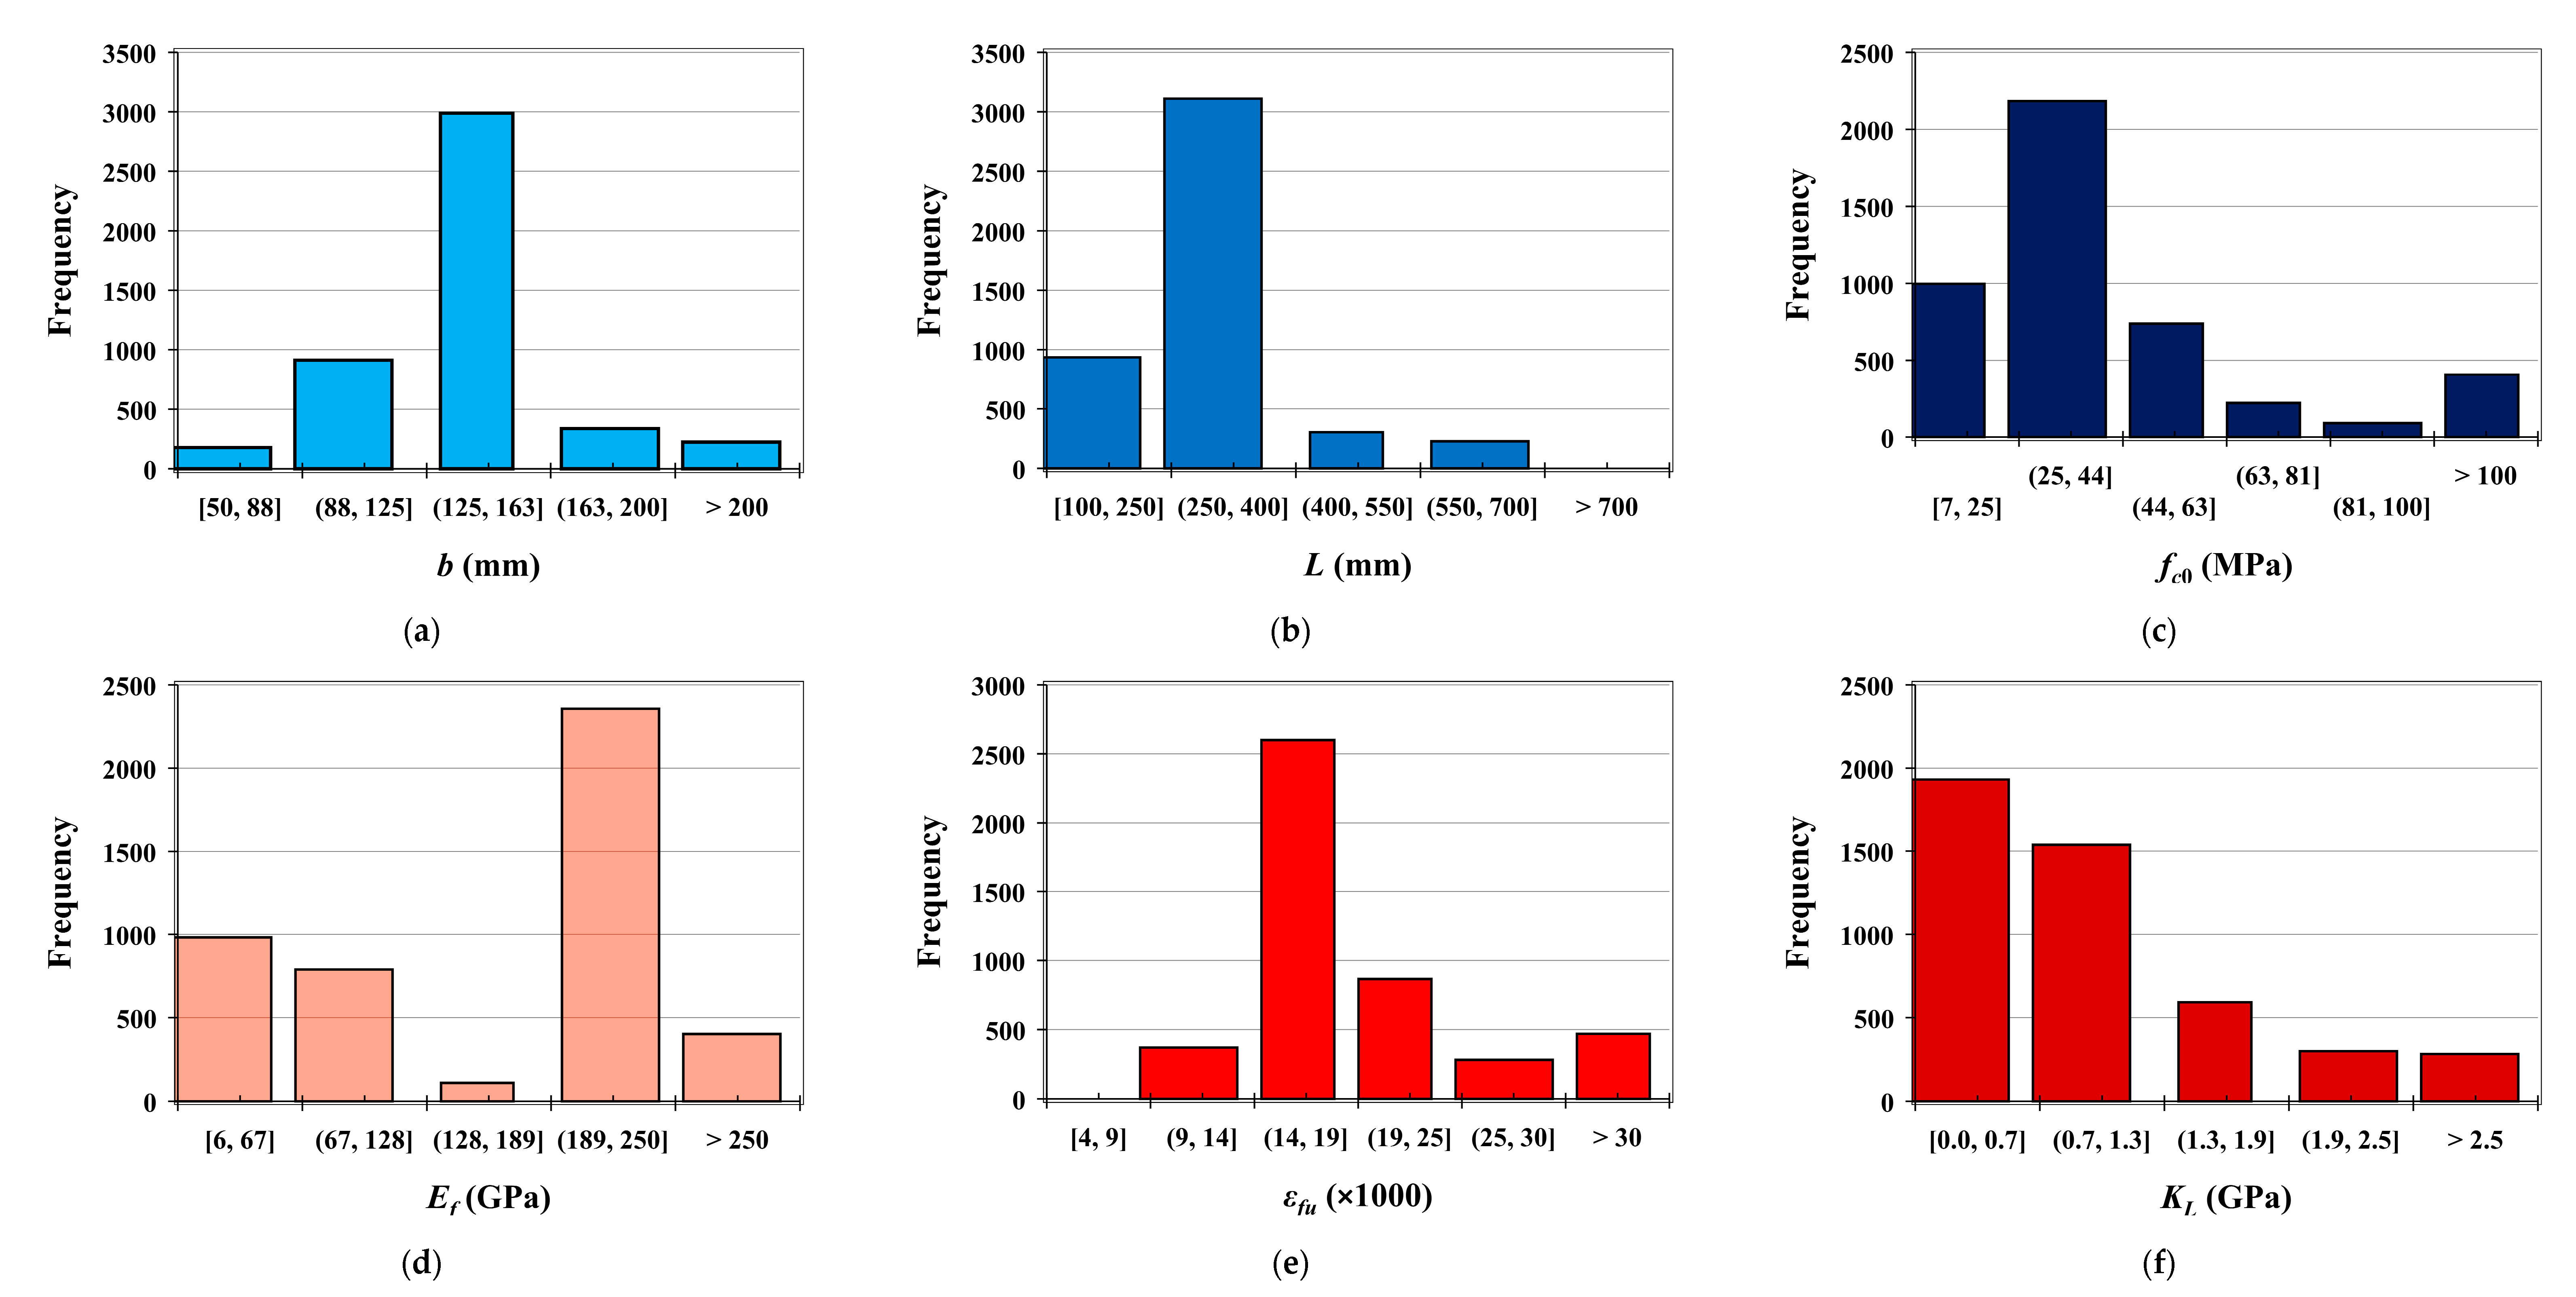
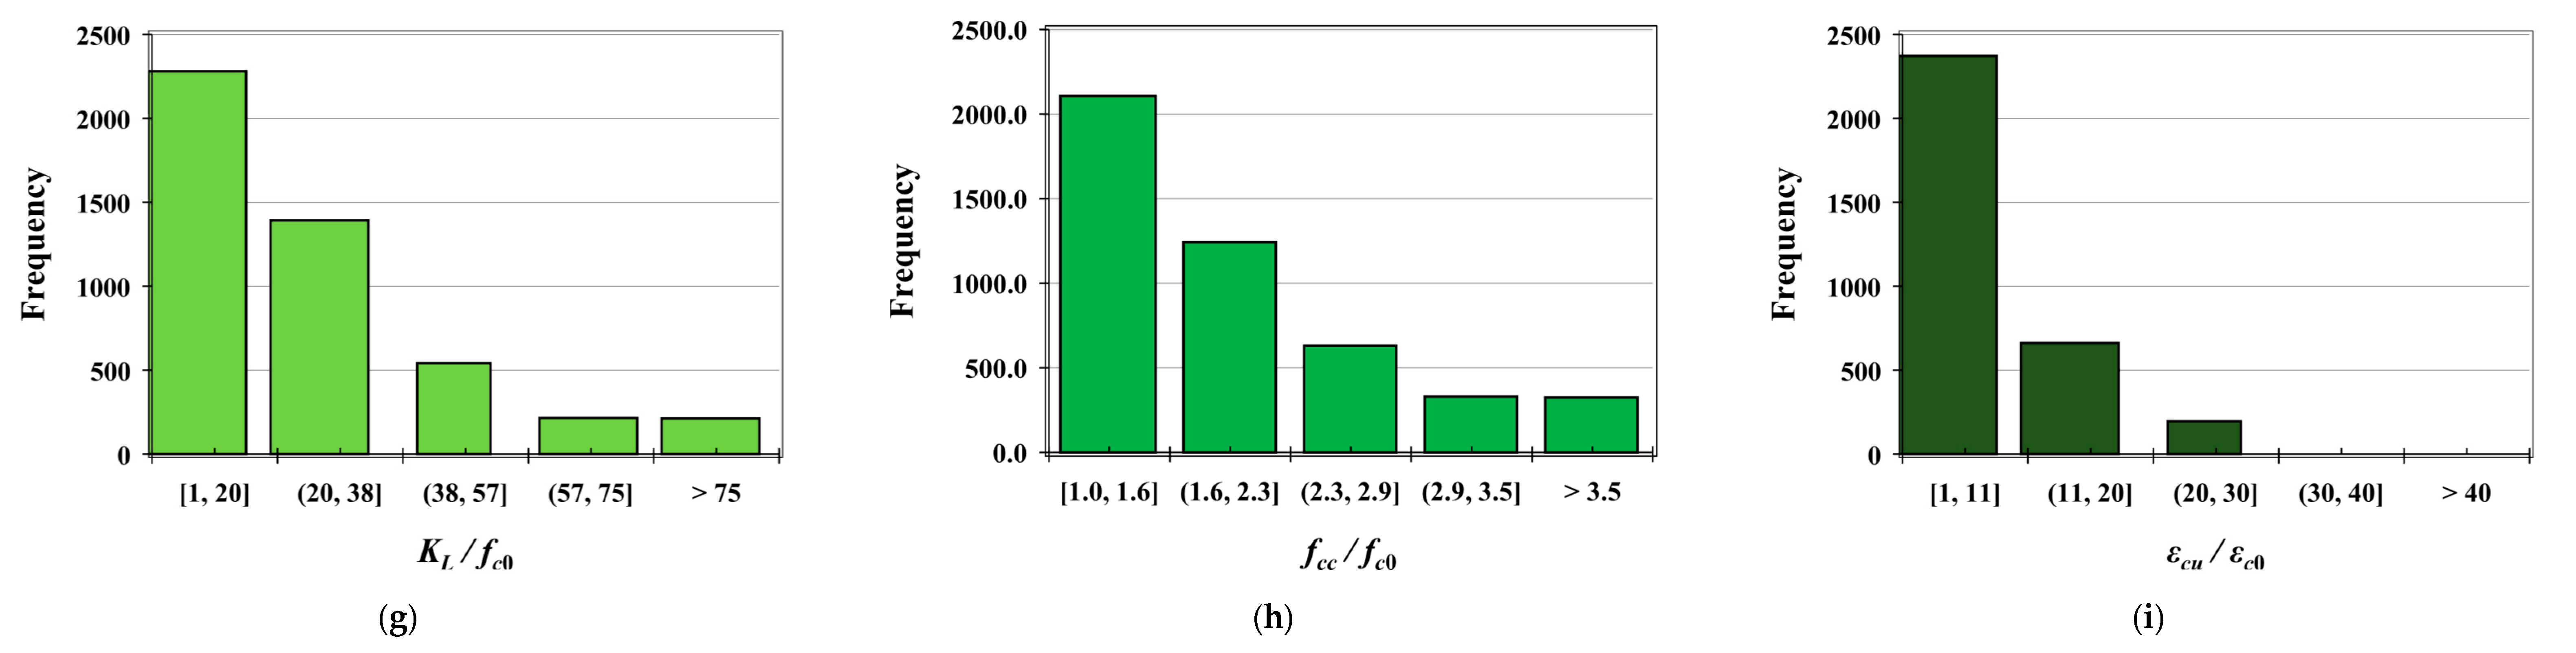
Figure 1 presents the frequency distributions of the key variables in the experimental dataset. The histograms reveal that most specimens have moderate dimensions and concrete strengths, while FRP properties and confinement parameters exhibit broader variability. Similarly, normalized responses (fcc/fc0 and εcu/εc0) are positively skewed, with most columns showing moderate strength and strain enhancements, and a few specimens exhibiting exceptional confinement effects. This confirms the heterogeneity of the dataset, demonstrating its capability to capture both typical and extreme behaviors, which is advantageous for predictive modeling.
The database (Table 1) consists of 3312 test results of fcc collected from a wide range of published studies and includes geometric characteristics, material properties, confinement parameters, and corresponding axial strength responses. The database spans a broad spectrum of variables. The statistical analysis of the ten normalized variables in the dataset indicates that all distributions exhibit positive skewness, ranging from moderate (0.37) to very high (6.12), along with elevated kurtosis, in several cases exceeding 40. Positive skewness indicates that most specimens have values near the lower or median range, while a few rare but extreme high values create long right tails. Physically, this reflects that the majority of FRP-confined columns have typical geometric and material properties, but some specimens have large dimensions or exceptionally high fc0, which can disproportionately influence the mean and overall variability. For example, parameters such as b/150 (skewness = 1.34) and nf × tf (skewness = 2.65) exhibit moderate-to-high skewness, indicating that large values are less frequent but present in the dataset. Kurtosis, which measures the “peakedness” of a distribution relative to a normal distribution (kurtosis = 3), is particularly high for variables like L/b (46.76) and nf × tf (10.38). This implies that while most specimens cluster around typical values, the tail heaviness due to extreme values is significant. Overall, the presence of skewed and heavy-tailed distributions demonstrates the heterogeneity of the experimental database, which is advantageous for machine learning. Considering skewness and kurtosis alongside the mean, median, and CoV provides a comprehensive characterization of variability, enabling ML models to capture both common and extreme conditions and supporting robust and generalizable predictive modeling of the ultimate condition of FRP-confined concrete columns.
For the analysis of the ultimate axial strain (εcu), almost the same experimental database is utilized, focusing on strain-related behavior. Table 2 summarizes the statistical indicators of the variables relevant to εcu. Although the dataset closely mirrors that of Table 1 and Table 2, it is separately presented to clearly distinguish strain-based from strength-based analyses while avoiding unnecessary repetition. The values of εcu range from 0.002 to 0.195, with a mean of 0.022. CoV = 0.781 indicates substantial variability among the specimens. The skewness is 2.856, showing a positively skewed distribution with a long tail toward higher strain values. The kurtosis is 16.79, reflecting the presence of extreme values in the dataset. These statistical indicators highlight the variability and distribution characteristics of εcu, providing a solid foundation for the development of predictive models using the experimental database.

4. Correlation Matrix

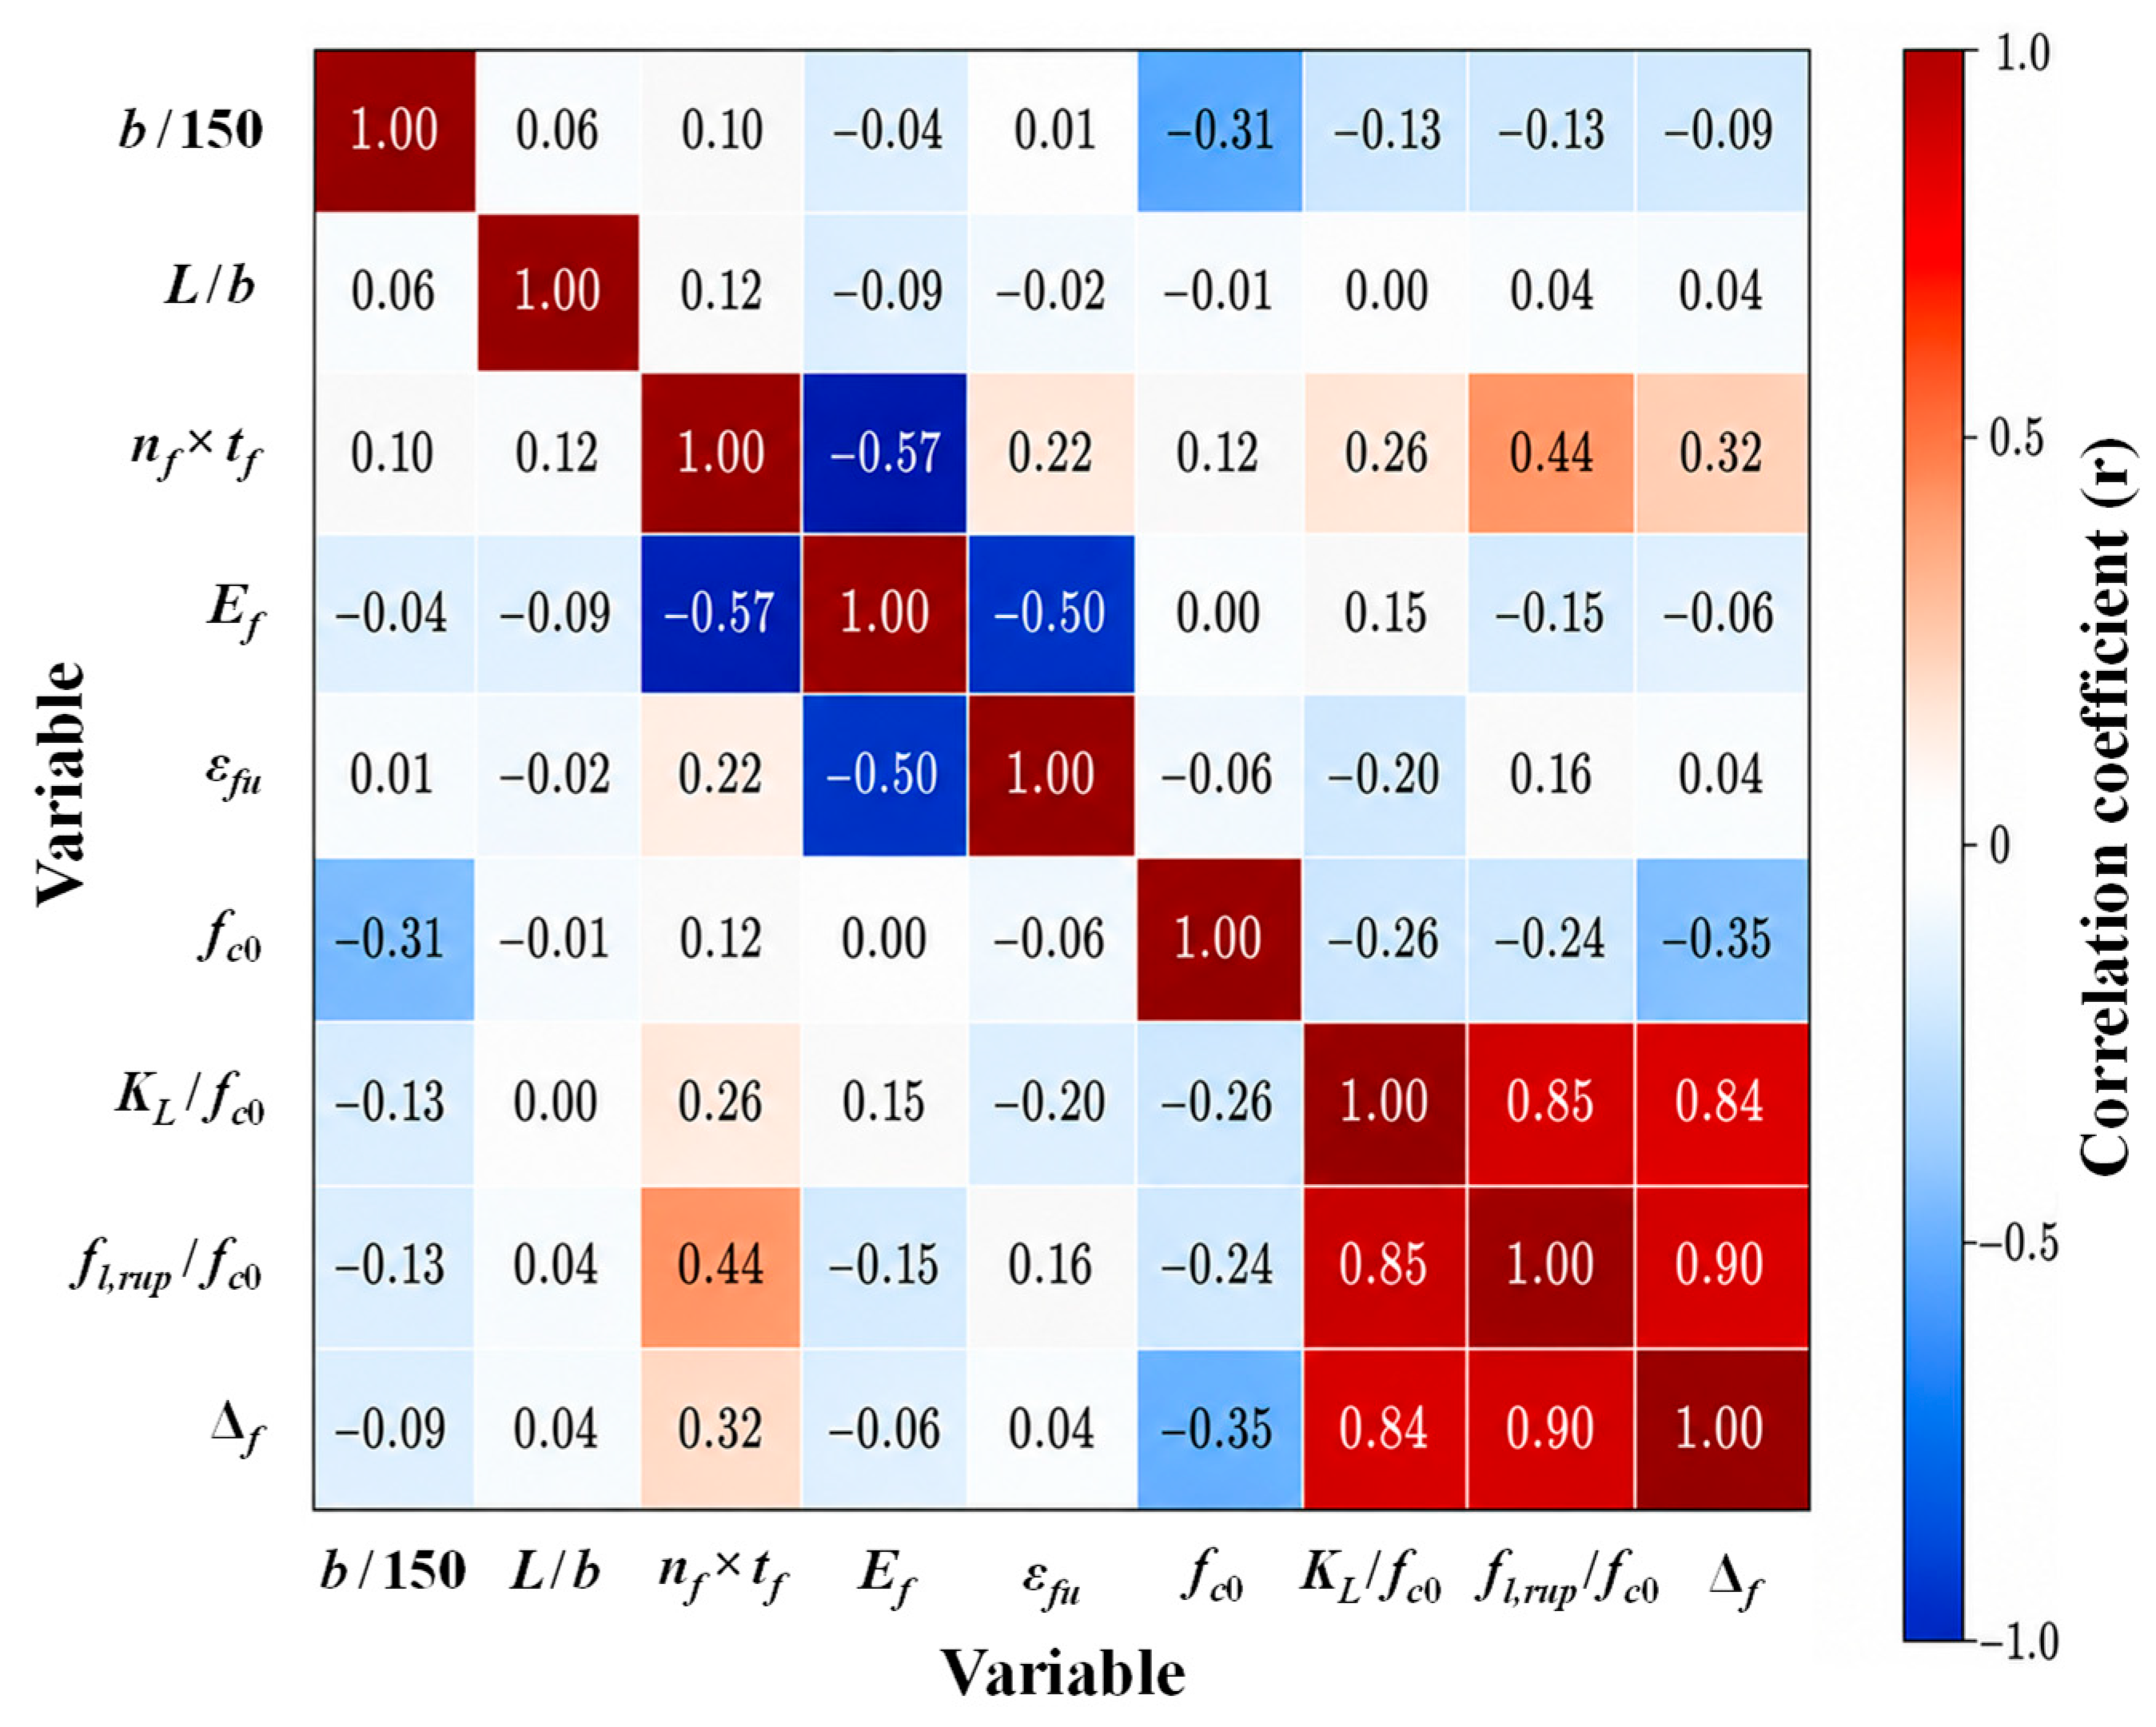
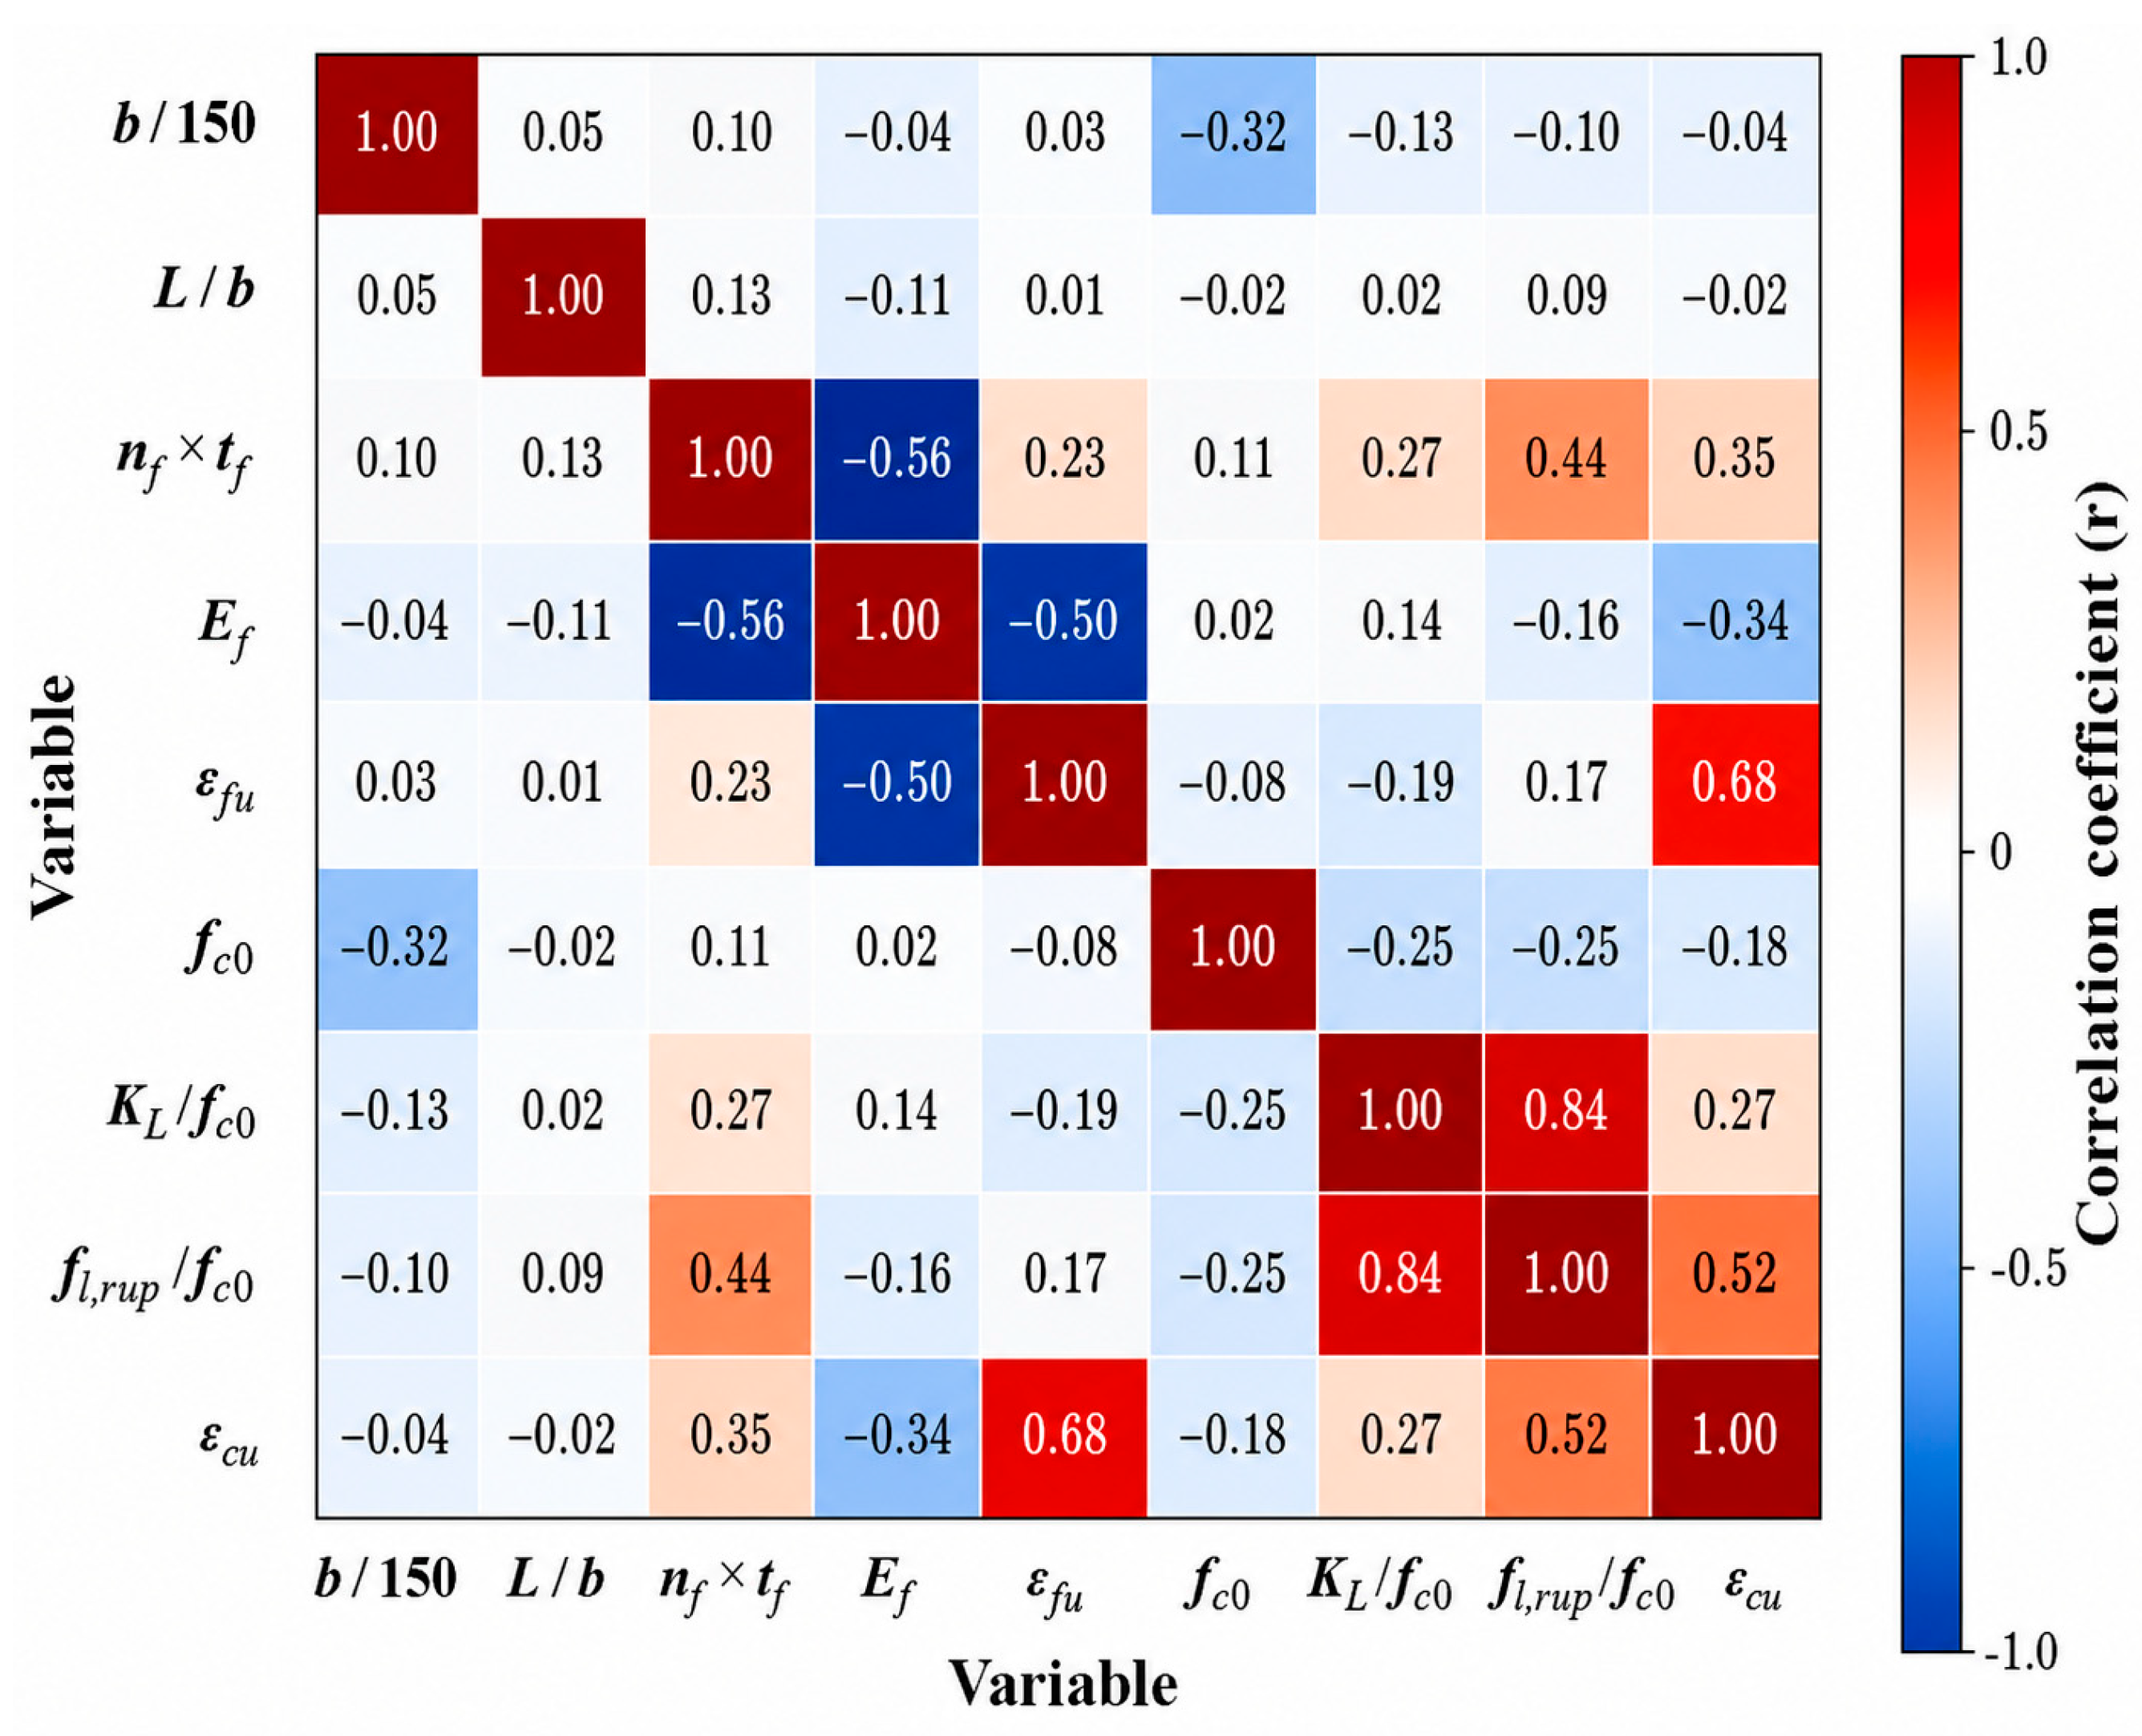
Figure 2 and Figure 3 present the correlation matrix of the FRP-confined concrete database, with Table 3 summarizing the correlation of governing parameters with Δf and εcu. To quantify the linear relationships among the input variables and the target responses, Pearson’s product-moment correlation coefficient (r) was employed. Pearson’s coefficient measures the strength and direction of the linear association between two continuous variables. It is computed from the covariance between the variables, which describes how they vary together, and then normalized by dividing by the product of their standard deviations. This normalization removes the influence of the variables’ measurement scales and units, resulting in a dimensionless coefficient that ranges from −1 to +1. Positive values indicate that both variables tend to increase or decrease together, whereas negative values indicate that one variable tends to increase as the other decreases. Values close to zero indicate little or no linear relationship, while values approaching ±1 denote increasingly strong linear associations, with ±1 corresponding to perfect positive or negative linear relationships. As shown in Figure 2 for the strength-related case, nf × tf exhibits a moderate negative correlation with Ef (r = −0.57), indicating that thicker or multilayered FRP laminates in the dataset are generally associated with slightly lower modulus materials. Similarly, Ef shows a moderate negative correlation with εfu (r = −0.50), reflecting the physical trade-off between stiffness and deformability inherent to FRP materials. The fc0 is negatively correlated with Δf (r = −0.35), consistent with the well-established observation that weaker concrete benefits more substantially from FRP confinement. Among the independent input variables, the nf × tf demonstrates the strongest positive correlation with Δf (r = 0.32), confirming its pivotal role in enhancing axial confinement. Conversely, FRP material properties (Ef and εfu) show negligible direct linear correlation with Δf (not directly captured by simple linear relationships), indicating that their influence on axial performance is indirect and arises mainly through interactions with nf × tf and fc0.
Figure 3 presents a distinct correlation pattern for the case of εcu. Unlike the strength enhancement, εcu exhibits a strong positive correlation with εfu (r = 0.68), highlighting the dominant role of FRP rupture characteristics in governing ductility capacity. The effective confinement index fl,rup/fc0 also shows a moderate-to-strong positive correlation with εcu (r = 0.52), indicating that increased confinement pressure contributes to improved axial deformability, albeit to a lesser extent than FRP rupture strain. Additionally, nf × tf maintains a moderate positive correlation with εcu (r = 0.35), suggesting that increased FRP thickness enhances ductility primarily by delaying rupture and sustaining confinement at higher axial strains. Conversely, Ef exhibits a moderate negative correlation with εcu (r = −0.34), implying that stiffer FRP systems tend to reduce the attainable ultimate axial strain, consistent with their lower strain capacity. In contrast to the strength enhancement case, the correlation between fc0 and εcu is relatively weak (r = −0.18), indicating that the influence of concrete strength on ductility gain is secondary compared to FRP-related parameters. Geometric ratios such as b/150 and L/b show negligible correlations with both Δf and εcu, confirming that axial response is largely governed by material and confinement characteristics rather than specimen geometry within the considered range.
Overall, the correlation analysis indicates that Δf is primarily controlled by confinement pressure and concrete strength, whereas εcu is governed predominantly by FRP rupture strain and confinement characteristics. These findings underscore the need to treat strength and ultimate strain as distinct response measures and to prioritize different parameter interactions when developing predictive models for FRP-confined concrete.

5. Regression-Based Empirical Models

5.1. Strength-Related Formulations

Table 4 summarizes the predictive performance of 20 existing regression-based strength models ([4,15,16,17,18,19,41,42,43,44,45,46,47,48,49,50,51,52,53,54,55,56]). The reported metrics include MV (Mean Value), which quantifies the proximity of the model’s predicted mean to the observed mean (ideal value = 1); CoV (Coefficient of Variation), presenting relative variability of predictions (lower is better); MSE (Mean Squared Error), presenting average squared deviation of predictions (lower is better); MAPE (Mean Absolute Percentage Error), presenting average relative error in percentage (lower is better); and R2 (Coefficient of Determination), presenting the proportion of variability captured by the model (better as closer to 1). A statistical score (SS) combining all metrics is also used to give an overall performance measure (lower SS = better predictive performance). The SS formula integrates bias, variability, and error into a single metric:
S S = 1 M V + C o V + M S E + M A P E + 1 R 2
While most models predict the mean strength with minimal bias (MV close to 1), notable exceptions include Guo et al. [48,49], which underpredicts (MV = 0.797), and Wei and Wu [42] and Wang et al. [54], which overpredict (MV > 1.28). Prediction consistency, measured by CoV, further differentiates model reliability. Shayanfar et al. [56] demonstrates lowest variability (CoV = 0.162), while Shayanfar et al. [19] and Pour et al. [47] also show low variability (CoV ≈ 0.18). Error metrics support these distinctions, with Shayanfar et al. [56] achieving the lowest MSE (0.157) and MAPE (0.124), indicating superior accuracy, while models such as Al Abadi et al. [45] and Zeng et al. [55] exhibit high prediction errors (MSE > 0.9, MAPE > 0.23). Although R2 values are generally high (>0.87), Shayanfar et al. [56] demonstrate highest value of 0.922. The SS, which integrates bias, variability, error, and fit, clearly identifies Shayanfar et al. [56] as the best-performing model (SS = 0.522), followed closely by Shayanfar et al. [19], Pour et al. [17] and Keshtegar et al. [46]. These findings indicate that Shayanfar et al. [56] not only achieves minimal bias and high consistency but also excels in overall predictive accuracy, making it the most reliable choice for structural strength estimation.

5.2. Strain-Related Formulations

Table 5 summarizes the predictive performance of 15 existing regression-based models [12,15,16,17,18,41,42,44,46,47,50,51,54,57,58] for estimating the εcu of FRP-confined concrete. Overall, most models tend to overpredict the ultimate strain, with MVs generally exceeding 1.0. The largest overpredictions are observed in Wang et al. [54] (MV = 1.550) and Cao et al. [44] (MV = 1.413), providing substantial positive bias. Conversely, some models slightly underpredict strain, such as fib [51] (MV = 0.856) and Yuan et al. [50] (MV = 0.931), suggesting conservative estimates in these formulations. Prediction consistency, measured by CoV, varies substantially across models. Liao et al. [53] (CoV = 0.602) and Wei and Wu [42] (CoV = 0.562) exhibit high variability, while Pour et al. [17] (CoV = 0.521) and Shayanfar et al. [18] (CoV = 0.517) demonstrate relatively low variability, reflecting more reliable predictions across the dataset. Error metrics further differentiate model performance. Shayanfar et al. [18] achieves the lowest MSE (23.7) and MAPE (0.367) along with the highest R2 (0.662), indicating superior predictive accuracy. The composite SS confirms these trends. Shayanfar et al. [18] attains the lowest SS (25.05), closely followed by Yuan et al. [50] (27.26) and Pour et al. [17] (28.026), establishing these models as the most reliable for predicting axial strain. Overall, this analysis identifies Shayanfar et al. [18] as the most accurate and consistent model for predicting the εcu of FRP-confined concrete.

6. ML-Based Models

6.1. Algorithms for Machine Learning Model Training

This study employs several state-of-the-art ML algorithms for predicting axial compressive responses. Among these algorithms, multilayer perceptron (MLP) is a feedforward artificial neural network capable of learning nonlinear relationships between input features and outputs through back-propagation. Both single-layer and two-layer MLP (designated as MLP1 and MLP2) architectures are considered. Gaussian Process Regression (GPR) is a non-parametric Bayesian regression approach that models the output as a Gaussian distribution with a mean function and a covariance (kernel) function, providing uncertainty estimates along with predictions. Support Vector Regression (SVR) uses kernel functions to map data into high-dimensional spaces, aiming to minimize prediction error within a specified tolerance margin (ε-insensitive loss). Gradient Boosting Machine (GBM) builds an ensemble of decision trees sequentially, where each tree corrects the errors of previous trees. Variants include standard GBM, eXtreme Gradient Boosting (XGBoost), and Light Gradient Boosting Machine (LightGBM).
It should be noted that the selection of these algorithms is particularly relevant given the broad range of concrete strengths represented in the database. FRP-confined concretes spanning low-, normal-, high-, and ultra-high-strength classes may exhibit substantially different stress–strain responses, ranging from pronounced compressive strain-hardening behavior to compressive strain-softening behavior [59,60,61,62]. Nevertheless, these responses are governed by the same fundamental confinement mechanism, namely the interaction between the lateral dilation of the concrete core and the restraining action of the FRP jacket. The primary distinction lies in the extent of lateral dilation and the confinement pressure that can be mobilized. Since unconfined concrete strength (fc0) directly influences these mechanisms and is explicitly included among the model inputs, the adopted ML algorithms can learn the strength-dependent evolution of confinement effectiveness across the entire strength spectrum. Consequently, the use of a unified database enables the development of generalized predictive models capable of capturing the continuous transition in behavior from low- to ultra-high-strength concrete, while avoiding the limitations associated with predictive models calibrated for a single strength class. This unified framework also provides a broader basis for evaluating the relative influence of concrete strength and confinement parameters on the axial response of FRP-confined concrete columns.

6.2. Hyperparameter Optimization

A unified 10-fold cross-validation (CV) framework was employed to optimize and evaluate multiple machine learning models for predicting (i) the compressive strength and (ii) the ultimate axial strain of FRP-confined concrete. In each fold, the dataset was partitioned into a training subset (90%) and a held-out validation subset (10%). Model parameters were estimated exclusively using the training data, and predictive performance was assessed on the corresponding validation subset. All reported CV metrics therefore represent averages over the validation folds. Hyperparameter tuning was performed using grid-based searches (or internal optimization where applicable), with all data preprocessing steps (standardization and normalization) recalculated within each training fold to prevent information leakage. Model selection was primarily guided by minimizing the average cross-validated MSE computed on the held-out validation subset, while average R2 and MAPE were used as complementary indicators of predictive accuracy and robustness. The candidate input variables considered in the present study represent the geometry, material properties, and confinement characteristics of FRP-confined concrete columns: b, L/b, nf × tf, Ef, εfu, fc0, KL, and fl,rup. The final input feature set adopted for model development is determined through the feature selection analysis presented in Section 6.3.
Table 6 presents the optimized hyperparameter configurations and corresponding 10-fold CV performance metrics for strength prediction. All MSE values reported in the table correspond to errors computed on the held-out validation folds, unless explicitly stated as training MSE. For neural networks, both MLP1 and MLP2 were optimized over a broad search space that included hidden layer sizes (10–30 neurons), training algorithms (Levenberg–Marquardt, Bayesian Regularization, and Scaled Conjugate Gradient), and data normalization strategies. Bayesian Regularization (trainbr) was consistently selected as the optimal training algorithm due to its effectiveness in controlling model complexity. Among the two architectures, MLP1 achieved lower MSE and higher R2 values than MLP2, indicating superior generalization. The GPR model employed a squared-exponential kernel, with kernel hyperparameters optimized internally within each fold using maximum likelihood estimation based solely on the training data. This approach resulted in competitive validation MSE and R2 values across folds. SVR was optimized with respect to the BoxConstraint, epsilon, and kernel scale parameters. The selected configuration (C = 5, ε = 0.01, kernel scale = 1) yielded stable predictive performance, outperforming neural network models but remaining inferior to ensemble-based approaches. Tree-based ensemble models provided the best overall performance. GBM, XGBoost, and LightGBM all achieved substantially lower MSEs and higher R2 values compared with neural and kernel-based models. Among them, XGBoost exhibited the strongest performance, achieving the lowest MSE (0.035 ± 0.006), the highest R2 (0.965 ± 0.006), and the lowest MAPE (16.25%), demonstrating superior accuracy and robustness for strength prediction.
Table 7 summarizes the optimized hyperparameters and 10-fold CV results for ultimate strain prediction, with performance metrics again computed on the held-out validation folds. Neural network models benefited from Bayesian Regularization, with MLP1 marginally outperforming MLP2 in terms of MSE and R2. However, both architectures exhibited relatively higher prediction errors compared with other modeling approaches, reflecting the increased complexity and variability associated with strain data. GPR and SVR models provided moderate improvements over neural networks, achieving mean cross-validated validation R2 values close to 0.80, but with higher variability across folds. Boosting-based ensemble methods again demonstrated clear superiority. GBM, XGBoost, and LightGBM all produced substantial reductions in average MSE and notable improvements in explained variance. XGBoost consistently achieved the best performance, with the lowest average MSE (4.784 ± 1.286), the highest R2 (0.929 ± 0.015), and the lowest MAPE (14.36%). These results confirm the strong generalization capability of XGBoost for ultimate strain prediction.
Consequently, for both strength and ultimate strain prediction, XGBoost consistently demonstrated the highest accuracy and stability, and was therefore selected as the optimal modeling framework for subsequent model development and training.

6.3. Input Feature Selection

The selection of input variables is a critical step in machine learning model development, as the predictive capability of a model depends not only on the learning algorithm but also on the relevance and completeness of the information provided to it. To evaluate the contribution of different geometric, material, and confinement-related parameters, several input feature configurations were examined using the optimized XGBoost model, which demonstrated the best overall performance among the investigated algorithms. The considered configurations were designed to assess the influence of confinement parameters (KL and fl,rup), geometric characteristics (b and L/b), and normalized confinement indicators (KL/fc0 and fl,rup/fc0) on predictive accuracy.
Table 8 summarizes the predictive performance of the investigated feature configurations based on 10-fold cross-validation. Among the evaluated alternatives, Configuration B, which includes all geometric and material parameters (b, L/b, nf × tf, Ef, εfu, fc0, KL, and fl,rup), achieved the highest predictive accuracy, yielding a mean MSE of 0.00033 ± 0.00005 and a mean R2 value of 0.9655 ± 0.0059. The superior performance of this configuration indicates that the explicit inclusion of both confinement descriptors and geometric characteristics provides complementary information that enhances the prediction of the axial compressive response of FRP-confined concrete columns. A comparison of the remaining configurations further highlights the importance of the selected parameters. Replacing KL and fl,rup with their normalized forms (KL/fc0 and fl,rup/fc0) resulted in a reduction in predictive accuracy (Configuration A), while excluding confinement parameters altogether (Configuration D) produced the lowest performance. Similarly, omitting the aspect ratio parameter (L/b) led to a decrease in model accuracy (Configurations C and E), indicating that specimen geometry contributes meaningful information beyond the material and confinement properties. These observations confirm that the axial response of FRP-confined concrete columns is governed by the combined effects of geometry, concrete strength, FRP mechanical properties, and confinement effectiveness.
Based on these findings, Configuration B was selected as the optimal feature set and was subsequently adopted for all machine learning models developed in this study. Using the same input variables for all algorithms ensures a consistent and unbiased comparison of predictive performance, allowing differences in the obtained results to be attributed solely to the characteristics of the learning algorithms rather than variations in feature selection.

6.4. Generalization and Independent Validation of the Proposed XGBoost Model

For the strength database, a total of 3312 experimental samples were available, while the strain database comprised 3319 samples. Each dataset was randomly divided into 60% training and 40% testing subsets, resulting in 1987 training samples and 1325 independent unseen testing samples for strength, and 1991 training samples and 1328 independent unseen testing samples for strain. Notably, the independent testing subsets alone contain more than 1300 specimens, which exceeds the total database size adopted in most previously published machine-learning studies on FRP-confined concrete columns [26,27,28,29,30,31,32,33,34,35,36,37,38,39]. Given the wide ranges of concrete strength, FRP mechanical properties, confinement levels, and geometric characteristics represented in these datasets, the hold-out testing subsets provide extensive coverage of the practical design space of FRP-confined concrete columns. Their large size reduces the sensitivity of the performance metrics to individual observations and localized data patterns, resulting in a more stable and reliable evaluation. Consequently, the independent testing subsets provide a rigorous basis for assessing predictive performance and model generalization.
Following the hyperparameter optimization and feature selection procedures described in Section 6.2 and Section 6.3, the final XGBoost model was developed using the optimal feature set identified in Configuration B. The resulting model was then evaluated using independent testing datasets to assess its generalization capability. As the XGBoost hyperparameters were fixed in advance based on a separate 10-fold CV procedure, the training–testing split was used exclusively to evaluate model generalization rather than for hyperparameter tuning. To ensure robust and unbiased performance assessment, the data splitting and model training process was repeated multiple times using a Monte Carlo–style validation strategy. In each iteration, performance metrics including MSE, CoV, R2, and SS were computed. The final model was accepted only when all predefined performance criteria were simultaneously satisfied, thus providing statistically stable and reliable validation of predictive accuracy for strength- and strain-related responses.
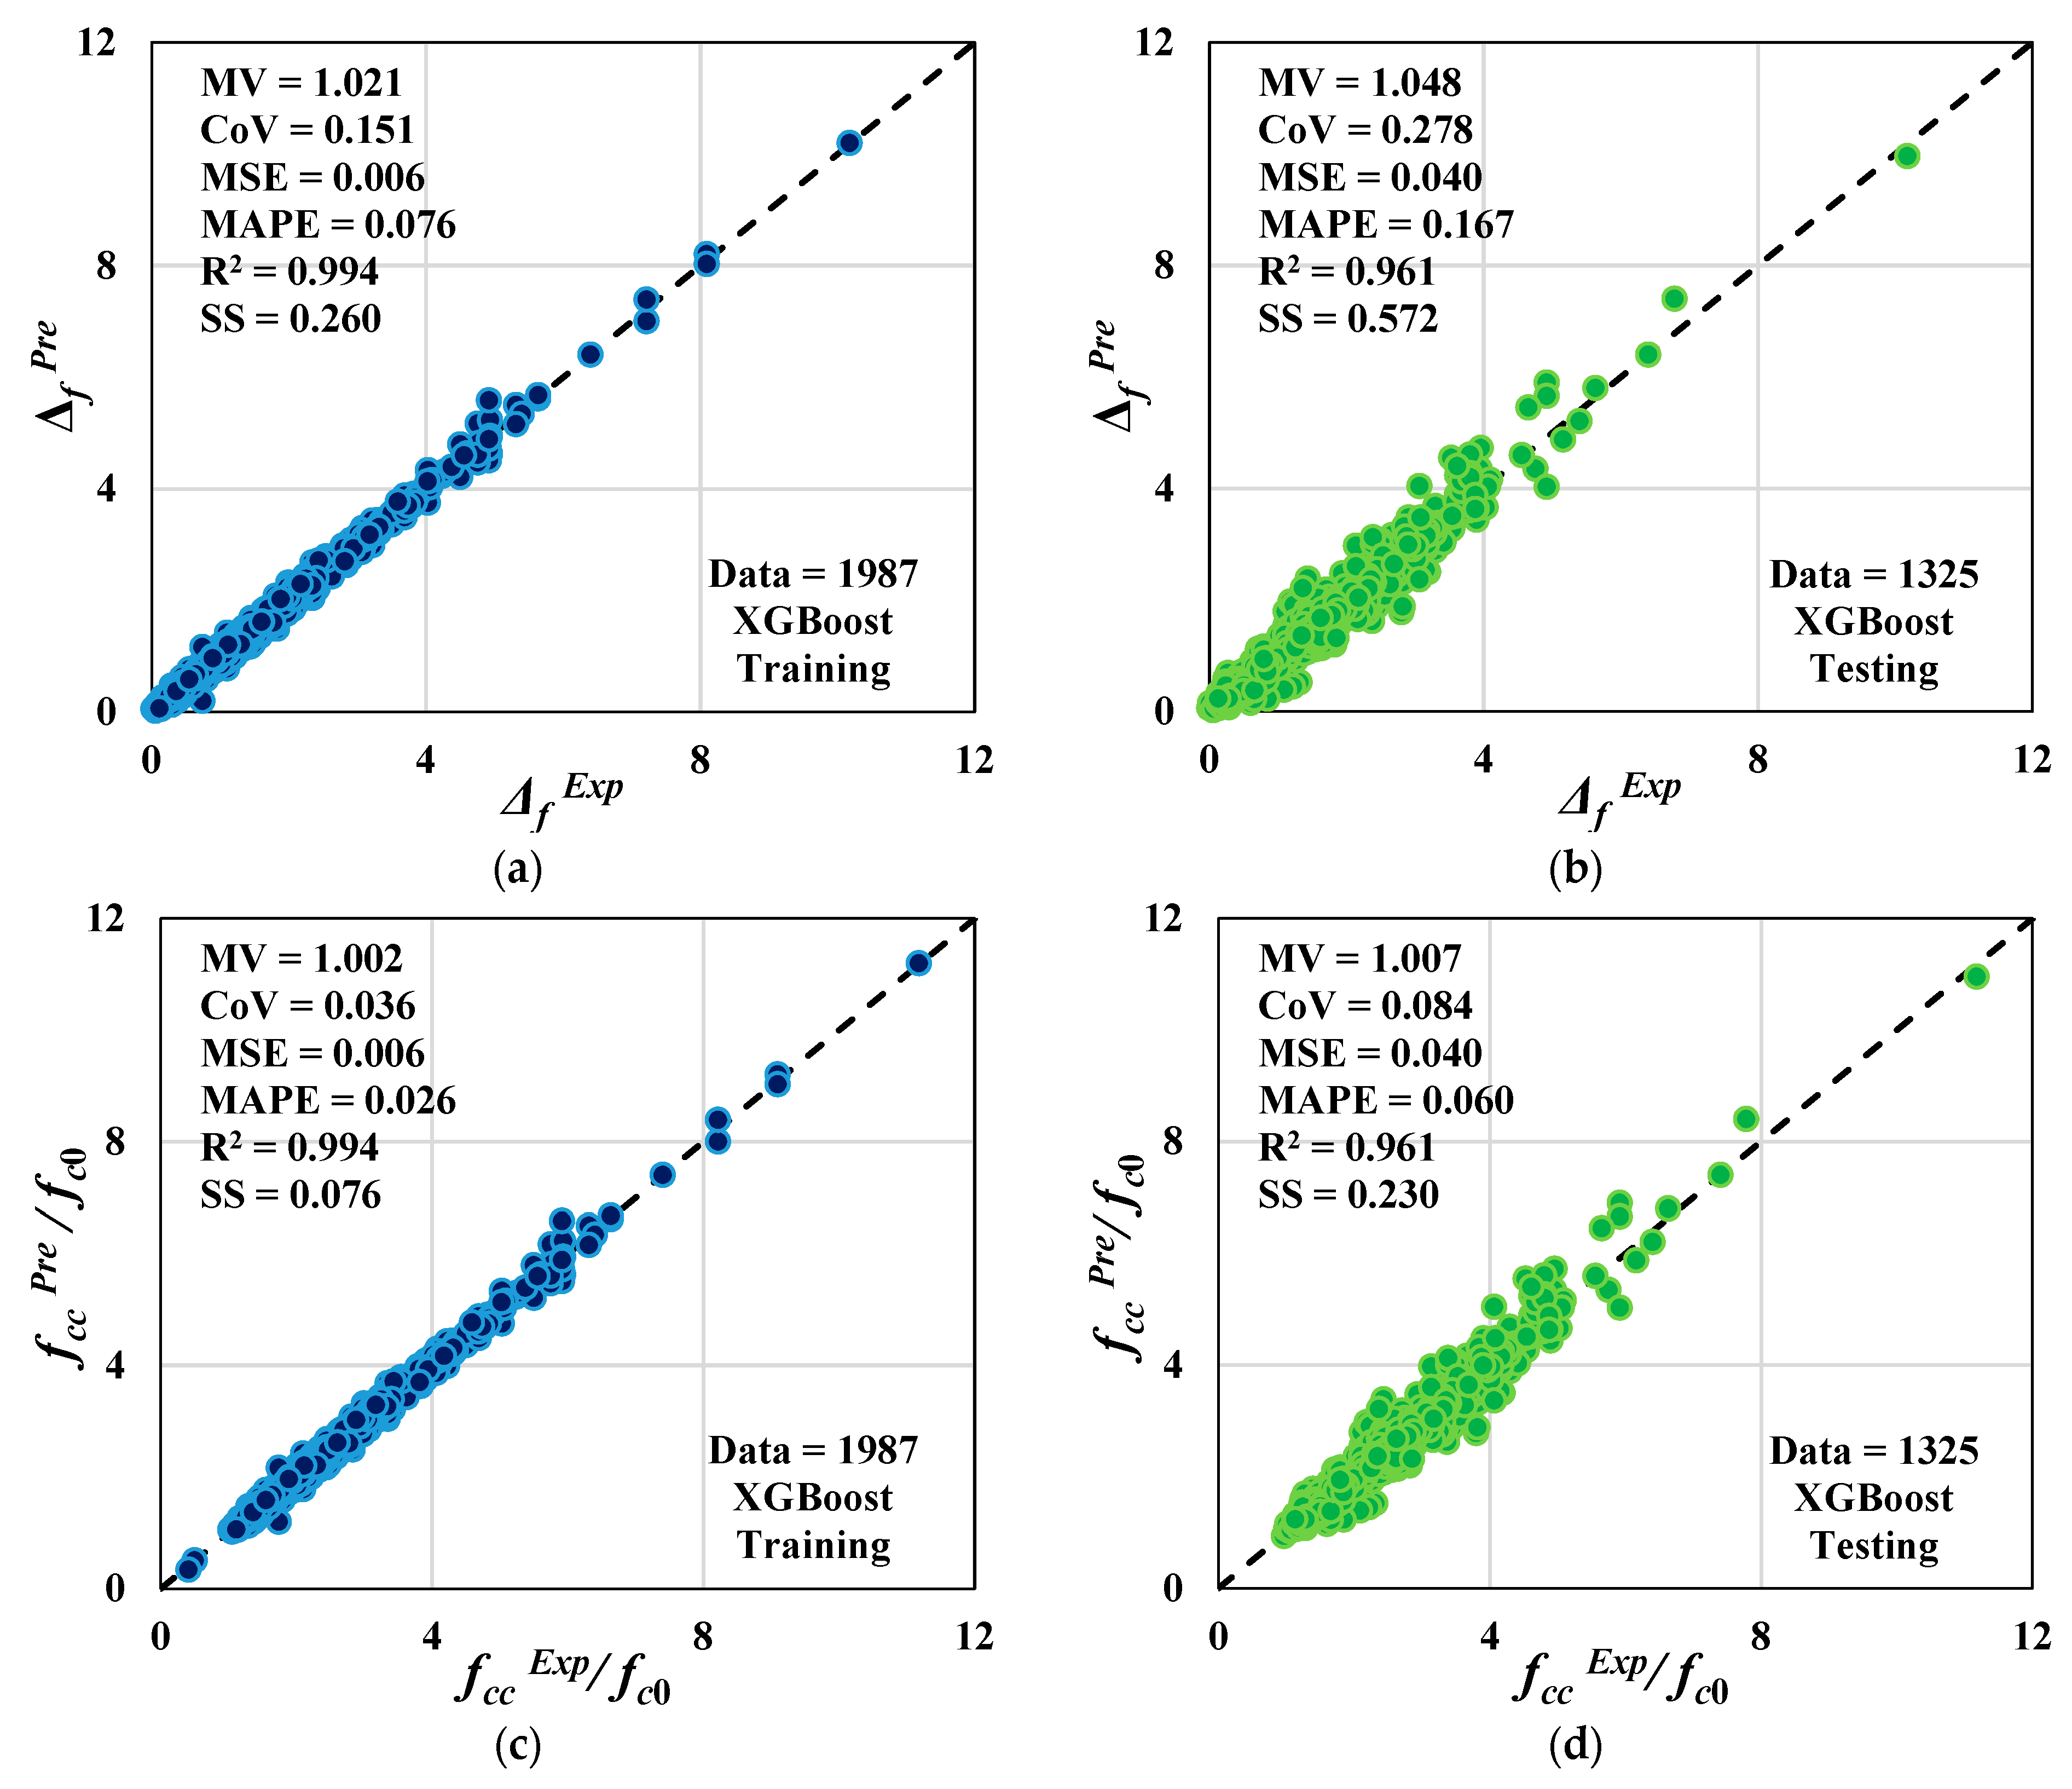
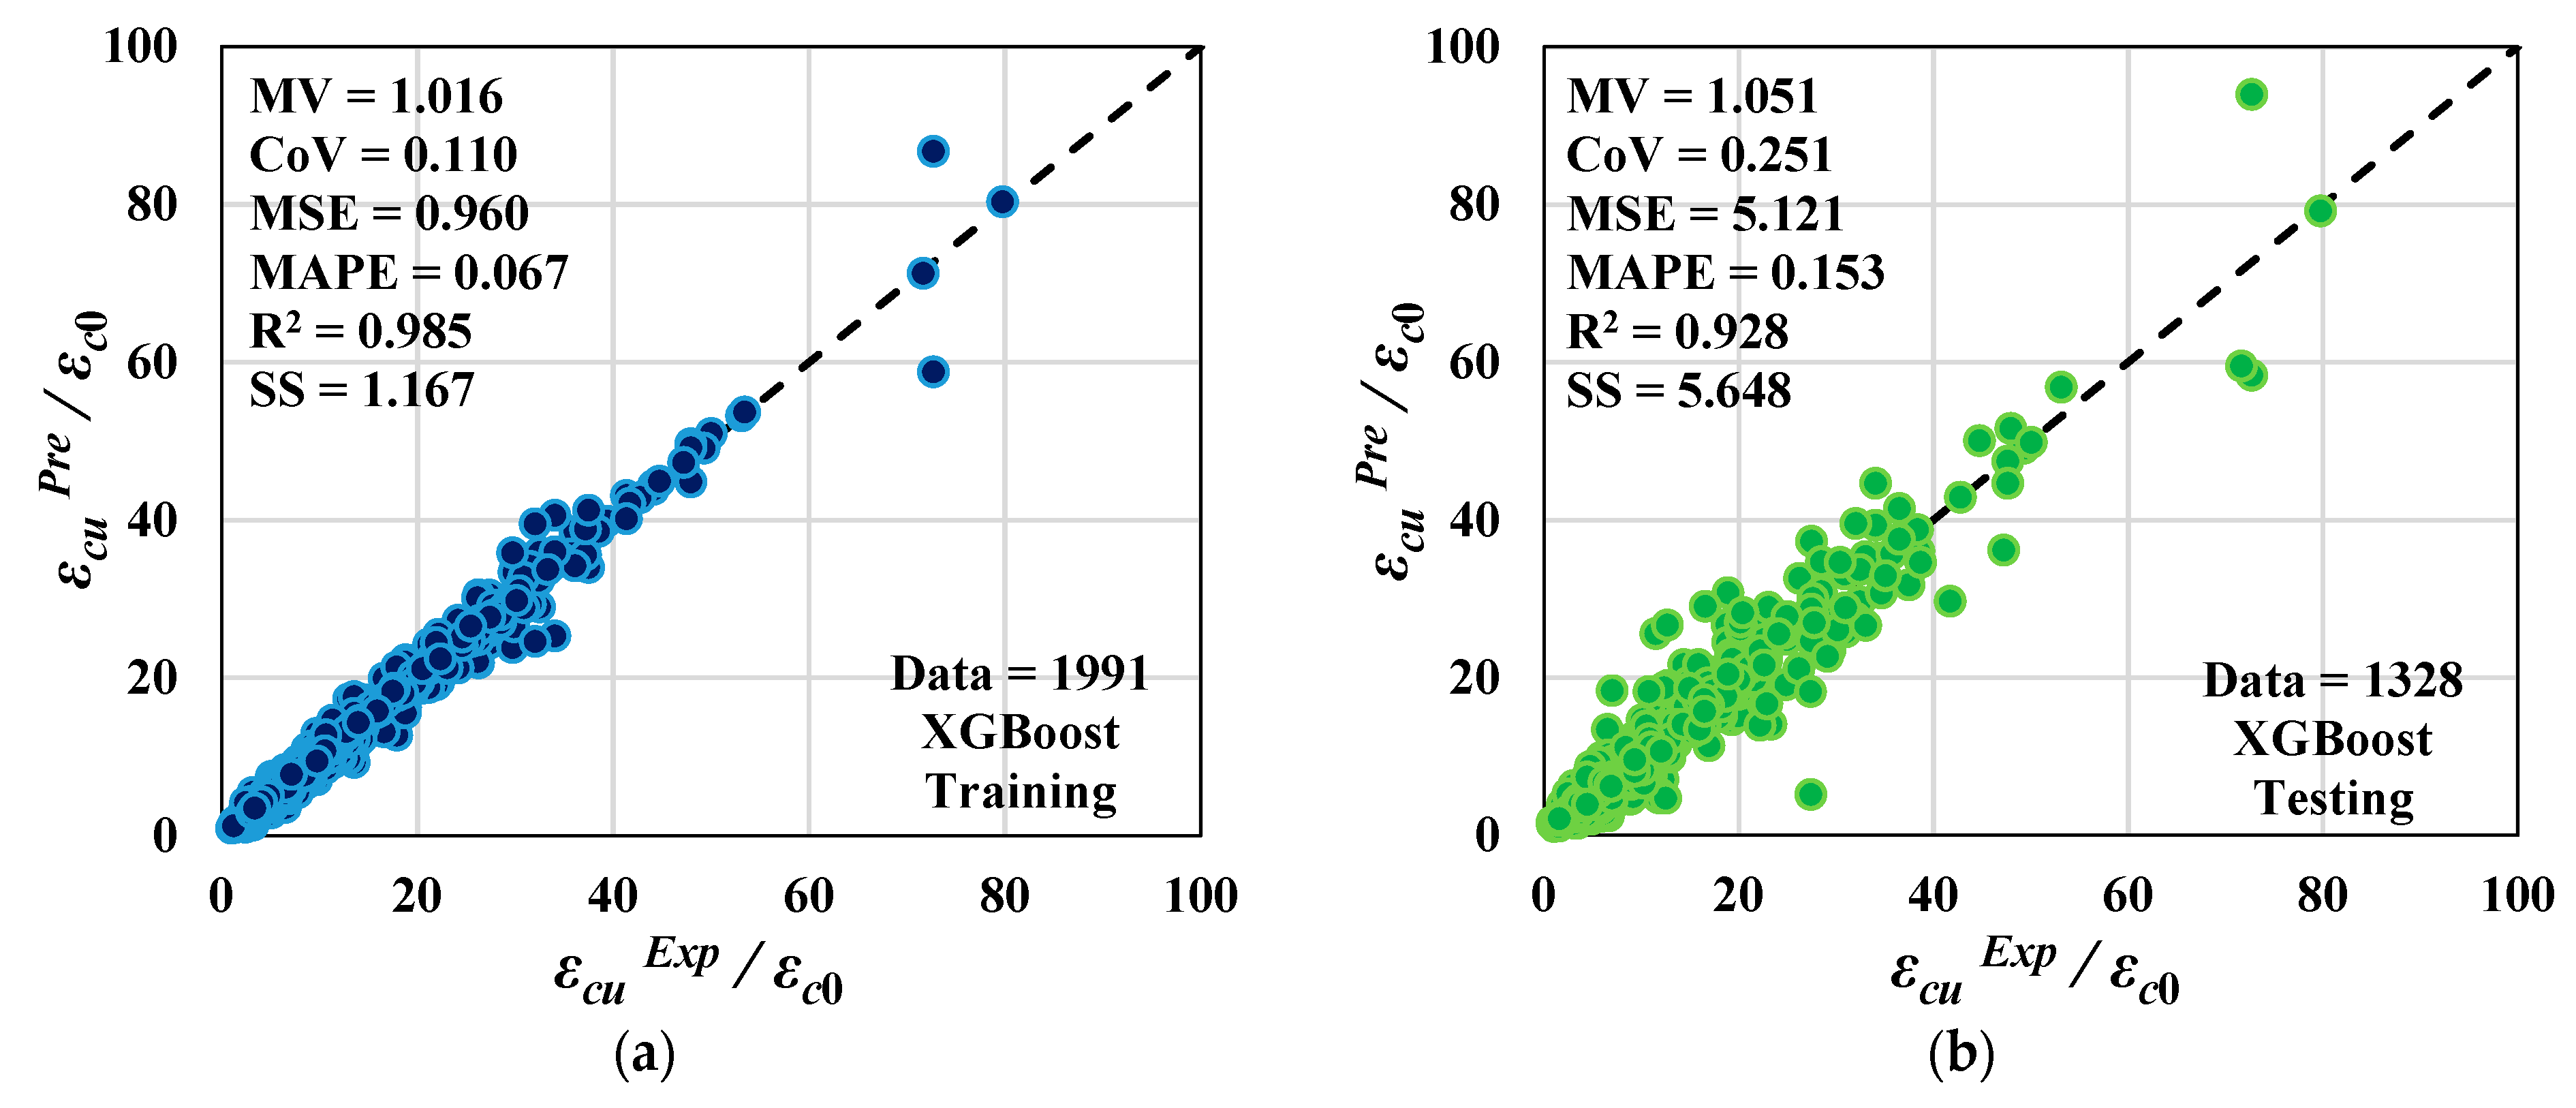
Figure 4 and Table 9 present the predictive performance of the developed XGBoost model for strength-related responses of FRP-confined concrete, including the strength enhancement factor Δf and the compressive strength fcc. Using 1987 samples for training and an independent testing set of 1325 unseen samples, the model demonstrates strong generalization capability at the testing level, with R2 = 0.961 and mean value ratios close to unity. The relatively low testing CoV and SS values indicate not only accurate predictions but also limited dispersion and bias when the model is applied to unseen data. This behavior suggests that the XGBoost framework effectively captures the nonlinear interactions between confinement parameters and compressive strength, which are governed by well-defined mechanical mechanisms in FRP-confined concrete. The predictive performance of the model for εcu/εc0 is presented in Figure 5 and Table 9 using 1991 training samples and 1328 independent unseen testing samples. At the testing level, the model achieves an R2 value of 0.928, confirming that the overall trend of ultimate strain is satisfactorily reproduced. However, the higher testing CoV and SS values relative to strength-related responses indicate increased scatter in strain predictions. This outcome is consistent with the inherently higher experimental variability of ultimate strain measurements in FRP-confined concrete, which are influenced by localized damage, and measurement uncertainty. Consequently, the observed increase in dispersion reflects the physical uncertainty of the response rather than deficiencies in the proposed XGBoost modeling approach. Furthermore, the large experimental database employed in this study helps reduce the influence of individual experimental anomalies and provides a robust basis for model development and validation. The present work focuses on deterministic prediction performance. Probabilistic prediction intervals and other uncertainty quantification frameworks represent a valuable extension of the current study and may be investigated in future research.

7. Performance of Developed XGBoost Model Versus Regression-Based Formulations

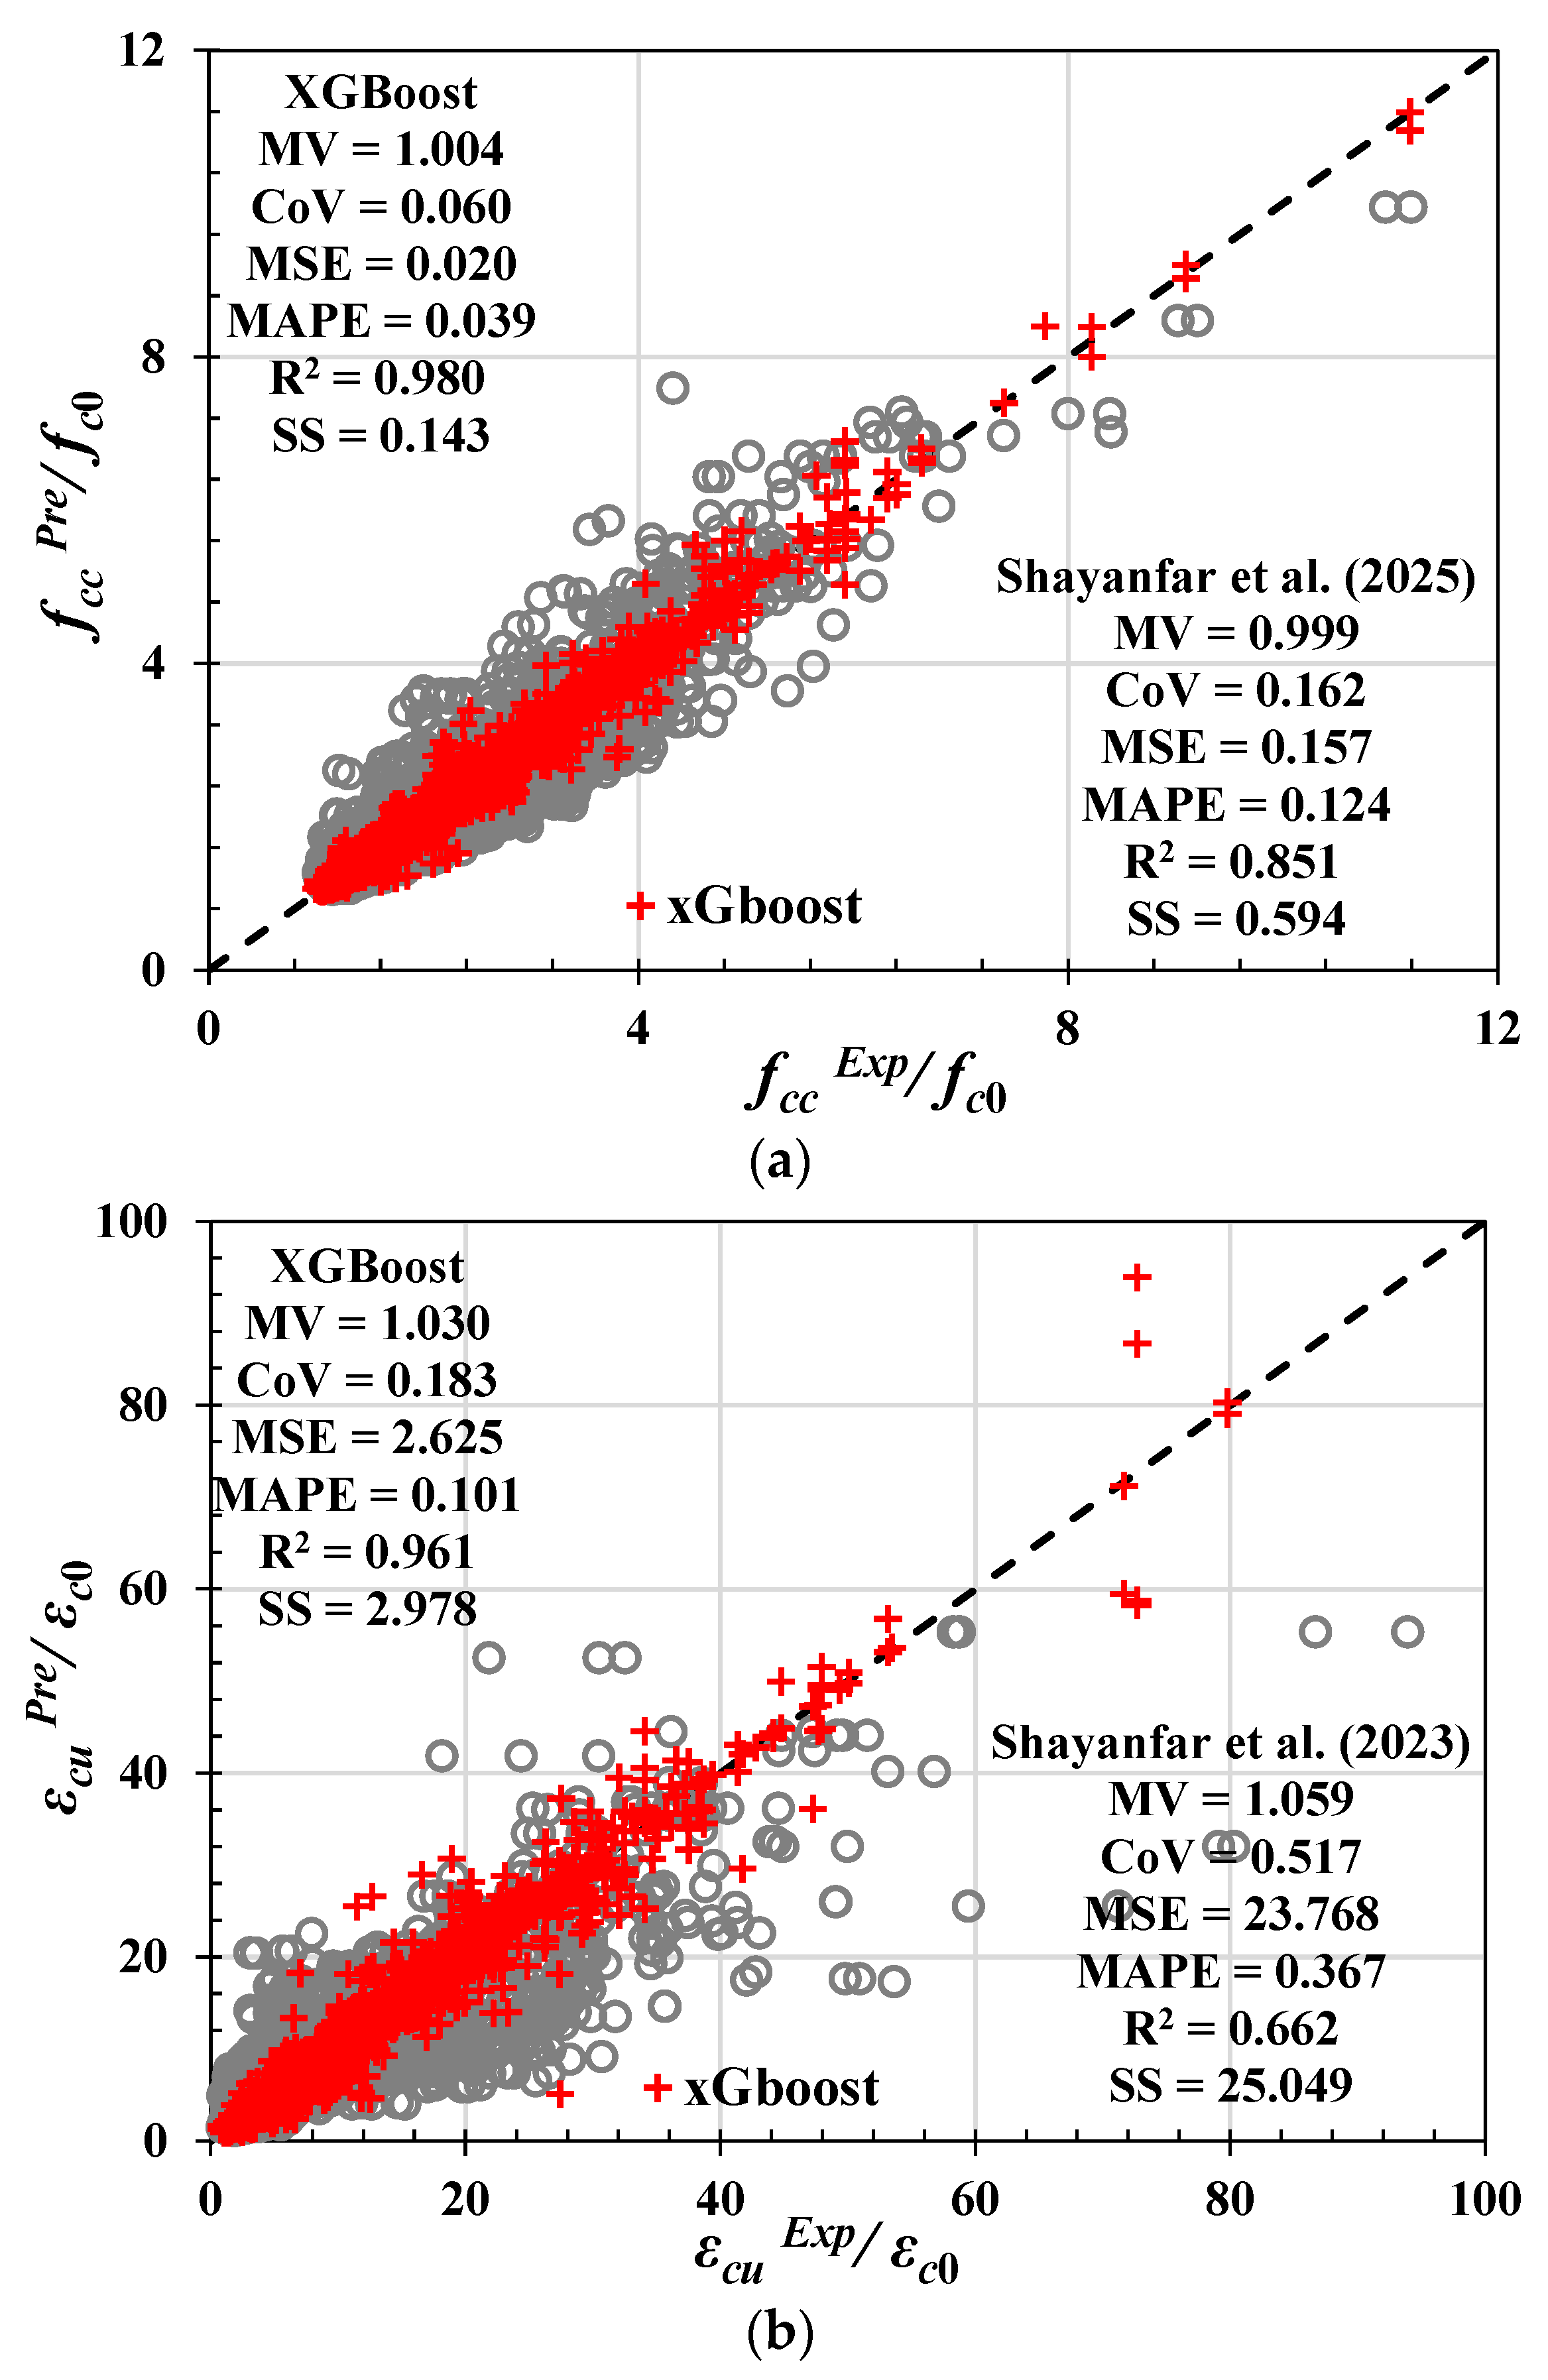
The performance of the proposed XGBoost model was further assessed through direct comparison with the best-performing regression-based formulations reported in the literature, namely Shayanfar et al. [56] for strength prediction and Shayanfar et al. [18] for ultimate strain prediction, which were selected as benchmark models in Section 5. Figure 6 and Table 10 present the comparative results based on the full datasets, comprising 3312 samples for strength and 3319 samples for strain.
For the strength ratio fcc/fc0, the XGBoost model exhibits a substantial reduction in prediction dispersion and error relative to the regression model, as evidenced by markedly lower CoV, MSE, MAPE, and SS values. In particular, the CoV is reduced from 0.162 to 0.06, while the SS decreases from 0.594 to 0.143, indicating a significant improvement in both accuracy and robustness. The higher R2 (=0.980) further confirms that the XGBoost model captures a greater proportion of the variance in experimental data. This improvement can be attributed to the ability of gradient-boosted decision trees to model complex nonlinear interactions between confinement parameters, material properties, and geometric effects, which are only partially represented in closed-form regression expressions.
The superiority of the XGBoost model becomes even more pronounced for the normalized ultimate strain εcu/εc0. Compared with the regression model, the XGBoost approach achieves a significant reduction in MSE and SS, alongside a substantial increase in R2 from 0.662 to 0.961. While regression-based models rely on predefined functional forms calibrated to limited subsets of experimental observations, the ML framework adaptively learns hierarchical nonlinear relationships and interaction effects directly from the data. This capability is particularly important for strain prediction, which is strongly influenced by localized damage mechanisms, confinement efficiency, and FRP rupture characteristics that are difficult to capture using simplified analytical formulations.
Overall, the comparative results demonstrate that the proposed XGBoost model not only improves predictive accuracy but also significantly enhances robustness and generalization across a broad range of experimental conditions. The consistent reductions in dispersion- and error-based indicators confirm that the machine learning-based approach overcomes key limitations of conventional regression models, especially for deformation-related responses characterized by high inherent variability.

8. Feature Importance Analysis of the Proposed XGBoost Models

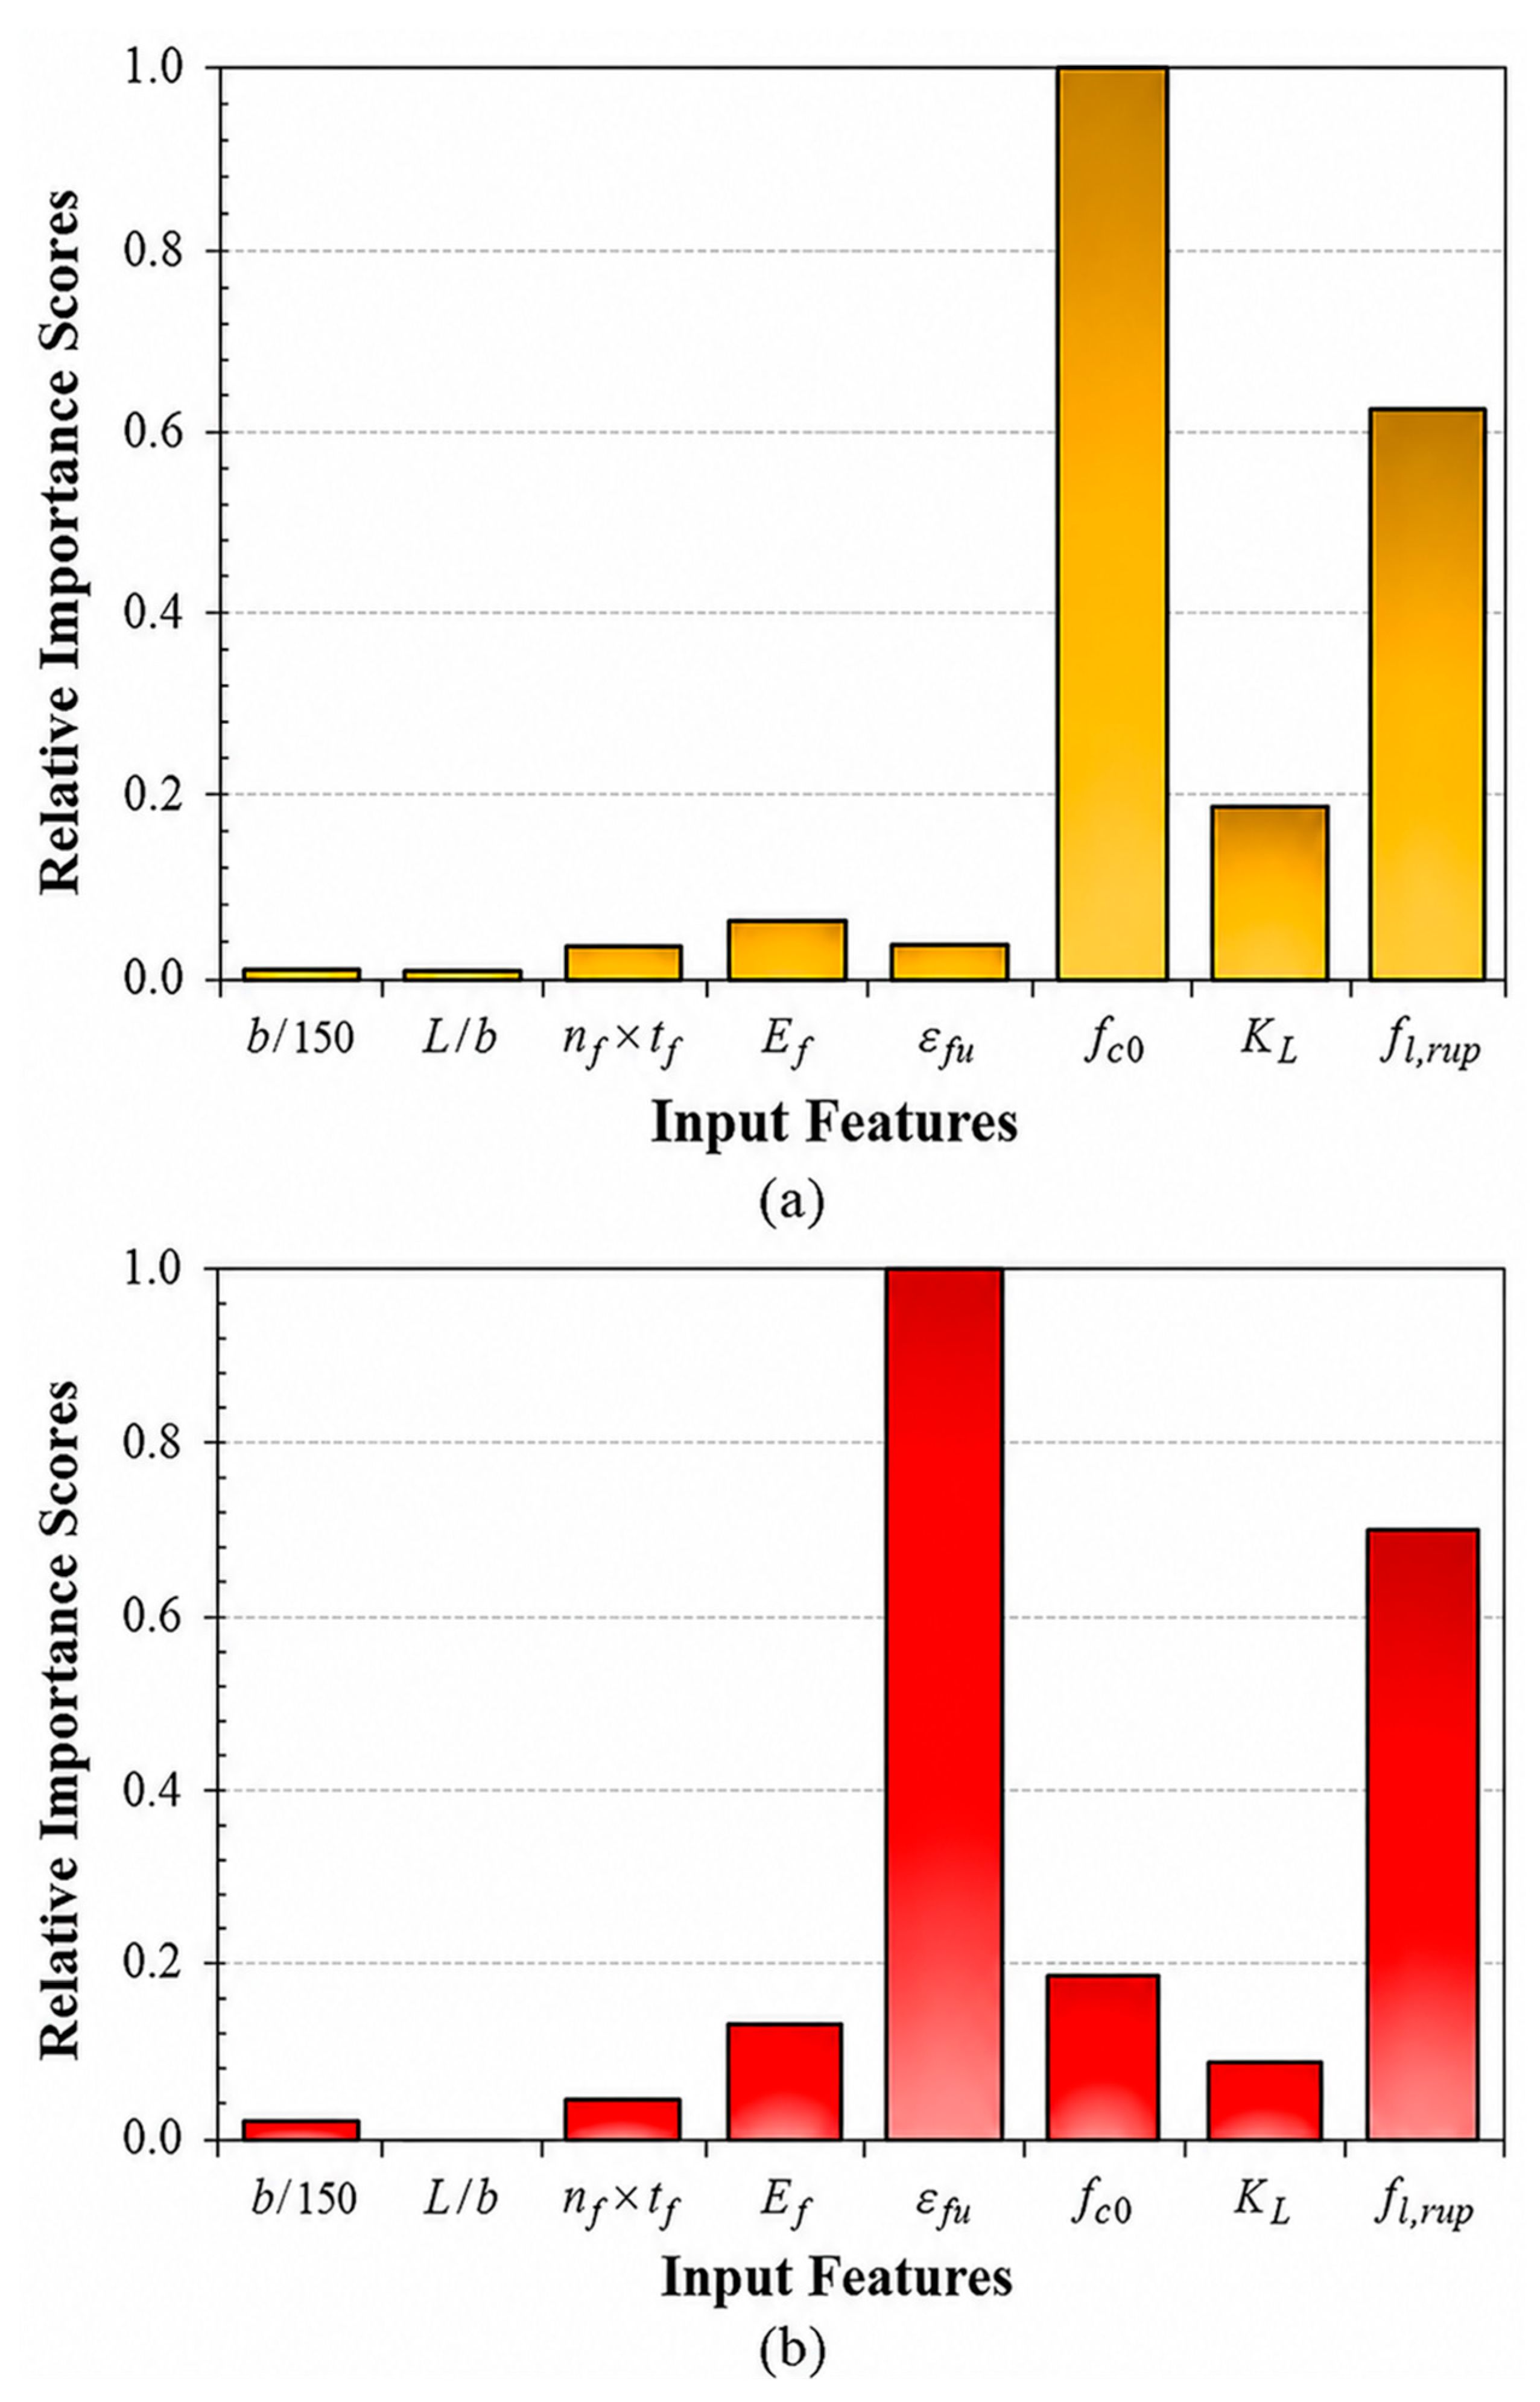
Figure 7 illustrates the relative importance of the input features identified by the XGBoost models developed for predicting the Δf and εcu of FRP-confined concrete columns.
For the strength-related XGBoost model, fc0 is identified as the most influential parameter. This behavior is mechanically justified because the efficiency of confinement-induced strength enhancement is not independent of the baseline concrete strength. For a given level of lateral confining pressure, lower-strength concretes exhibit greater relative strength enhancement due to earlier onset of lateral dilation and more effective mobilization of FRP confinement, whereas higher-strength concretes dilate less and benefit less from the same confinement level. As a result, variations in fc0 strongly influence the magnitude of Δf, which explains its dominant importance in the learned model despite normalization (Δf = fcc/fc0 − 1). The confinement-related parameters fl,rup and KL exhibit high importance scores in the strength-related XGBoost model because they directly quantify the magnitude and effectiveness of the lateral confining pressure that can be developed at ultimate conditions. Higher values of these parameters increase the confining pressure acting on the concrete, which elevates the peak axial stress by suppressing lateral dilation and delaying the transition from microcrack initiation to unstable crack propagation. The strong weighting of these features therefore indicates that the XGBoost model explicitly recognizes the governing role of ultimate confinement capacity in determining the confined compressive strength. Ef shows a moderate importance score, ranking above several other FRP-related and geometric parameters. nf × tf and εfu exhibit comparatively lower importance scores. This observation suggests that their influence on Δf is already embedded within fl,rup and KL, which explicitly combine FRP stiffness, strength, and rupture characteristics into effective confinement-related indices. As a result, once these parameters are included, the additional explanatory contribution of individual FRP mechanical properties becomes secondary. The geometric parameters such as b/150 and L/b display the lowest importance scores, indicating a minimal direct influence on normalized strength enhancement. Their effects are limited to secondary geometric and boundary considerations and do not significantly modify the essential confinement mechanism governing Δf.
The feature importance analysis for the strain-related XGBoost model reveals that εfu is the most influential parameter, consistent with the physical expectation that the deformation capacity of FRP-confined concrete is fundamentally controlled by the rupture limit of the lateral reinforcement. fl,rup also exhibits high importance while KL also plays a secondary role, reflecting its role in setting the maximum confining pressure that can be sustained before failure. fc0 exhibits moderate importance, indicating that stronger concrete cores can resist deformation for longer before lateral dilation activates the FRP jacket fully, but its effect on normalized ultimate strain is less pronounced than for Δf. Ef and nf × tf form a secondary tier of contributors. Their importance indicates that, in addition to the ultimate capacity of the jacket, the stiffness and amount of FRP influence how rapidly confinement is mobilized as concrete dilates. Geometric parameters such as b/150 and L/b remain of low importance, suggesting that the specimen dimensions have a limited direct influence on the normalized ultimate strain once FRP confinement mechanics are accounted for. Overall, the hierarchy of feature importance analysus for εcu confirms that deformation behavior is primarily controlled by FRP mechanical properties and secondarily influenced by concrete strength and confinement stiffness. Geometric parameters contribute minimally, emphasizing that strain prediction depends predominantly on the interaction between concrete dilation and the mechanical response of the FRP jacket.

9. Summary and Conclusions

This study developed a comprehensive data-driven framework for predicting the compressive strength (fcc) and ultimate axial strain (εcu) of FRP-confined concrete columns using machine learning (ML) techniques. Large experimental databases comprising 3312 strength records and 3319 strain records were compiled from the literature, covering a wide range of concrete strengths, FRP properties, geometric configurations, and confinement conditions. Existing regression-based formulations were first evaluated and subsequently compared with seven ML models optimized through grid search cross-validation. The main findings of this study are summarized as follows:
(1)
The compiled databases represent one of the most comprehensive collections currently available for FRP-confined concrete columns, encompassing low-, normal-, high-, and ultra-high-strength concrete with unconfined compressive strengths ranging from 7 MPa to 204 MPa.
(2)
Among the existing regression-based models, the formulations proposed by Shayanfar et al. [56] for fcc and Shayanfar et al. [18] for εcu provided the best predictive performance. However, noticeable prediction errors remained, particularly across broad ranges of confinement conditions and concrete strengths.
(3)
Seven ML models, including MLP1, MLP2, GPR, SVR, GBM, XGBoost, and LightGBM, were developed and optimized using 10-fold cross-validation and grid search procedures. The best performance was achieved when all governing variables were considered as model inputs.
(4)
Tree-based ensemble methods consistently outperformed neural network and kernel-based approaches. Among all models, XGBoost demonstrated the highest predictive accuracy and generalization capability for both fcc and εcu on the full databases as well as on independent unseen datasets.
(5)
Feature importance analysis indicated that unconfined strength (fc0), confinement stiffness (KL), and lateral pressure (fl,rup) are the most influential parameters governing compressive strength enhancement, whereas FRP rupture strain (εfu), fl,rup, and fc0 play dominant roles in predicting ultimate axial strain.
(6)
The proposed XGBoost models substantially outperformed the best existing empirical formulations across all evaluation metrics while maintaining robust predictive capability over a broad range of material properties and confinement conditions.
Overall, the proposed framework provides an accurate, interpretable, and generalizable tool for predicting the compressive behavior of FRP-confined concrete columns. Nevertheless, the developed models are data-driven and their applicability is limited to the range of parameters and structural configurations represented in the experimental databases used for training. In particular, the present study focuses on concentrically loaded concrete columns confined with continuous FRP jackets and is therefore not directly applicable to members with non-circular cross-sections (e.g., square, rectangular, or elliptical cross-sections), discontinuous confinement systems such as FRP strips, or columns subjected to eccentric loading. These cases involve different confinement mechanisms and stress distributions that may significantly influence the strength and deformation response. Consequently, the framework developed herein should be regarded as a foundation for future investigations. Further research should focus on expanding the database to include these structural configurations and loading conditions, as well as exploring hybrid and physics-informed machine learning approaches to enhance model robustness, interpretability, and applicability.


Author Contributions

J.S.: Writing—original draft, Visualization, Validation, Software, Investigation, Formal analysis, Data curation, Methodology and Conceptualization. J.A.O.B.: Writing—review & editing, Supervision, Resources, Project administration, Methodology and Conceptualization. All authors have read and agreed to the published version of the manuscript.

Funding

This work is financed by national funds through the FCT—Foundation for Science and Technology—through the project TuRUpAI Multiscale modelling for optimum retrofitting of tunnels with fibre reinforced shotcrete designed by machine learning (https://doi.org/10.54499/2022.06602.PTDC). It was also supported by FCT/MCTES under the R&D Unit Institute for Sustainability and Innovation in Structural Engineering (ISISE), under the references UID/4029/2025 (https://doi.org/10.54499/UID/04029/2025) and UID/PRR/04029/2025 (https://doi.org/10.54499/UID/PRR/04029/2025), and under the Associate Laboratory Advanced Production and Intelligent Systems ARISE, under reference LA/P/0112/2020.

Data Availability Statement

The data presented in this study are available on request from the corresponding author due to the privacy restrictions.

Conflicts of Interest

The authors declare no conflicts of interest.

References

  1. Shayanfar, J.; Rezazadeh, M.; Barros, J.A. Analytical model to predict dilation behavior of FRP confined circular concrete columns subjected to axial compressive loading. J. Compos. Constr. 2020, 24, 04020071. [Google Scholar] [CrossRef] [Scilit]
  2. Nawar, M.T.; Selim, M.; Zaghlal, M.; El-Zohairy, A.; Emara, M. Performance of GFRP-Confined Rubberized Engineered Cementitious Composite Columns. J. Compos. Sci. 2024, 8, 330. [Google Scholar] [CrossRef] [Scilit]
  3. Zeng, J.J.; Zheng, B.T.; Teng, J.G.; Chen, J.F. Axial stress distributions in FRP-confined concrete columns: Pressure-film measurements and finite element predictions. Eng. Struct. 2025, 345, 121419. [Google Scholar] [CrossRef] [Scilit]
  4. Akbarpour, A.; Volz, J.; Vemuganti, S. An experimental study incorporating carbon fiber composite bars and wraps for concrete performance and failure insight. J. Compos. Sci. 2024, 8, 174. [Google Scholar] [CrossRef] [Scilit]
  5. Lim, J.C.; Ozbakkaloglu, T. Hoop strains in FRP-confined concrete columns: Experimental observations. Mater. Struct. 2015, 48, 2839–2854. [Google Scholar]
  6. Shayanfar, J.; Barros, J.A.; Rezazadeh, M.; Kafshgarkolaei, H.J. Enhancing the performance of heat-damaged rectangular RC columns using prestressed FRP confinement. Constr. Build. Mater. 2025, 501, 144346. [Google Scholar] [CrossRef] [Scilit]
  7. Shayanfar, J.; Barros, J.A.; Rezazadeh, M. Stress–strain model for FRP-confined circular concrete columns developing structural softening behavior. J. Compos. Constr. 2024, 28, 04023065. [Google Scholar] [CrossRef] [Scilit]
  8. Ozbakkaloglu, T.; Vincent, T. Axial compressive behavior of circular high-strength concrete-filled FRP tubes. J. Compos. Constr. 2014, 18, 04013037. [Google Scholar] [CrossRef] [Scilit]
  9. Shayanfar, J.; Kafshgarkolaei, H.J.; Barros, J.A.; Rezazadeh, M. Unified strength model for FRP confined heat-damaged circular and square concrete columns. Compos. Struct. 2023, 307, 116647. [Google Scholar] [CrossRef] [Scilit]
  10. Shayanfar, J.; Barros, J.A.; Rezazadeh, M. Design-oriented stress–strain model for RC columns with dual FRP-steel confinement mechanism. Compos. Struct. 2024, 330, 117821. [Google Scholar] [CrossRef] [Scilit]
  11. Lam, L.; Huang, L.; Xie, J.H.; Chen, J.F. Compressive behavior of ultra-high performance concrete confined with FRP. Compos. Struct. 2021, 274, 114321. [Google Scholar] [CrossRef] [Scilit]
  12. Lam, L.; Teng, J.G. Design-oriented stress–strain model for FRP-confined concrete. Constr. Build. Mater. 2003, 17, 471–489. [Google Scholar] [CrossRef] [Scilit]
  13. Lam, L.; Teng, J.G.; Cheung, C.H.; Xiao, Y. FRP-confined concrete under axial cyclic compression. Cem. Concr. Compos. 2006, 28, 949–958. [Google Scholar] [CrossRef] [Scilit]
  14. Nematzadeh, M.; Mousavimehr, M.; Shayanfar, J.; Omidalizadeh, M. Eccentric compressive behavior of steel fiber-reinforced RC columns strengthened with CFRP wraps: Experimental investigation and analytical modeling. Eng. Struct. 2021, 226, 111389. [Google Scholar] [CrossRef] [Scilit]
  15. Teng, J.G.; Jiang, T.; Lam, L.; Luo, Y.Z. Refinement of a design-oriented stress–strain model for FRP-confined concrete. J. Compos. Constr. 2009, 13, 269–278. [Google Scholar] [CrossRef] [Scilit]
  16. Sadeghian, P.; Fam, A. Improved design-oriented confinement models for FRP-wrapped concrete cylinders based on statistical analyses. Eng. Struct. 2015, 87, 162–182. [Google Scholar] [CrossRef] [Scilit]
  17. Pour, A.F.; Faradonbeh, R.S.; Gholampour, A.; Ngo, T.D. Predicting ultimate condition and transition point on axial stress–strain curve of FRP-confined concrete using a meta-heuristic algorithm. Compos. Struct. 2023, 304, 116387. [Google Scholar] [CrossRef] [Scilit]
  18. Shayanfar, J.; Barros, J.A.; Abedi, M.; Rezazadeh, M. Unified compressive strength and strain ductility models for fully and partially FRP-confined circular, square, and rectangular concrete columns. J. Compos. Constr. 2023, 27, 04023053. [Google Scholar] [CrossRef] [Scilit]
  19. Shayanfar, J.; Barros, J.A.; Rezazadeh, M. Cross-sectional and confining system unification on peak compressive strength of FRP-confined concrete. Struct. Concr. 2023, 24, 1531–1545. [Google Scholar]
  20. Shayanfar, J. Integrated Modelling Strategy for FRP-Based Confinement Imposed to RC Columns: From Undamaged to Post-Fire Damage. Ph.D. Thesis, University of Minho, Braga, Portugal, 2024. [Google Scholar]
  21. Sarfarazi, S.; Mascolo, I.; Modano, M.; Guarracino, F. Application of artificial intelligence to support design and analysis of steel structures. Metals 2025, 15, 408. [Google Scholar] [CrossRef] [Scilit]
  22. Sadeghpour Haji, M.; Niknam, R.; Shayanfar, J. ANN-Based Modeling of Shear Behavior of Reinforced Concrete Columns under Constant Axial Loads. Civ. Eng. Appl. Solut. 2026, 2, 28–48. [Google Scholar]
  23. Plevris, V.; Papazafeiropoulos, G. AI in structural health monitoring for infrastructure maintenance and safety. Infrastructures 2024, 9, 225. [Google Scholar] [CrossRef] [Scilit]
  24. Tariq, M.; Khan, A.; Ullah, A.; Shayanfar, J.; Niaz, M. Improved shear strength prediction model of steel fiber reinforced concrete beams by adopting gene expression programming. Materials 2022, 15, 3758. [Google Scholar] [CrossRef] [Scilit] [PubMed]
  25. Bharadiya, J.P. Artificial intelligence in transportation systems: A critical review. Am. J. Comput. Eng. 2023, 6, 35–45. [Google Scholar] [CrossRef] [Scilit]
  26. Cevik, A. Modeling strength enhancement of FRP confined concrete cylinders using soft computing. Expert Syst. Appl. 2011, 38, 5662–5673. [Google Scholar] [CrossRef] [Scilit]
  27. Shayanfar, S.; Ghasemi Naghibdehi, M.; Shayanfar, J. Data-Driven Predictive Formulation for FRP-Confined Circular Concrete Columns. Civ. Eng. Appl. Solut. 2027, 3, 25–36. [Google Scholar]
  28. Cevik, A.; Göğüş, M.T.; Güzelbey, İ.H.; Filiz, H. Soft computing based formulation for strength enhancement of CFRP confined concrete cylinders. Adv. Eng. Softw. 2010, 41, 527–536. [Google Scholar] [CrossRef] [Scilit]
  29. Gondomar, A.H.; Alavi, A.H.; Sahab, M.G. New formulation for compressive strength of CFRP confined concrete cylinders using linear genetic programming. Mater. Struct. 2010, 43, 963–983. [Google Scholar]
  30. Naderpour, H.; Kheyroddin, A.V.G.G.; Amiri, G.G. Prediction of FRP-confined compressive strength of concrete using artificial neural networks. Compos. Struct. 2010, 92, 2817–2829. [Google Scholar] [CrossRef] [Scilit]
  31. Elsanadedy, H.M.; Al-Salloum, Y.A.; Abbas, H.; Alsayed, S.H. Prediction of strength parameters of FRP-confined concrete. Compos. Part B Eng. 2012, 43, 228–239. [Google Scholar] [CrossRef] [Scilit]
  32. Jalal, M.; Ramezanianpour, A.A. Strength enhancement modeling of concrete cylinders confined with CFRP composites using artificial neural networks. Compos. Part B Eng. 2012, 43, 2990–3000. [Google Scholar] [CrossRef] [Scilit]
  33. Mansouri, I.; Kisi, O.; Sadeghian, P.; Lee, C.H.; Hu, J.W. Prediction of ultimate strain and strength of FRP-confined concrete cylinders using soft computing methods. Appl. Sci. 2017, 7, 751. [Google Scholar] [CrossRef] [Scilit]
  34. Mozumder, R.A.; Roy, B.; Laskar, A.I. Support vector regression approach to predict the strength of FRP-confined concrete. Arab. J. Sci. Eng. 2017, 42, 1129–1146. [Google Scholar]
  35. Shayanfar, J.; Akbarzadeh Bengar, H. Nonlinear analysis of RC frames considering shear behaviour of members under varying axial load. Bull. Earthq. Eng. 2017, 15, 2055–2078. [Google Scholar]
  36. Keshtegar, B.; Gholampour, A.; Thai, D.K.; Taylan, O.; Trung, N.T. Hybrid regression and machine learning model for predicting ultimate condition of FRP-confined concrete. Compos. Struct. 2021, 262, 113644. [Google Scholar] [CrossRef] [Scilit]
  37. Jamali, F.; Mousavi, S.R.; Peyma, A.B.; Moodi, Y. Prediction of compressive strength of fiber-reinforced polymers-confined cylindrical concrete using artificial intelligence methods. J. Reinf. Plast. Compos. 2022, 41, 679–704. [Google Scholar] [CrossRef] [Scilit]
  38. Kumar, P.; Arora, H.C.; Bahrami, A.; Kumar, A.; Kumar, K. Development of a reliable machine learning model to predict compressive strength of FRP-confined concrete cylinders. Buildings 2023, 13, 931. [Google Scholar] [CrossRef] [Scilit]
  39. Ghasri, M.; Ghasemi, M.; Salarnia, A. Leveraging the power of hybrid and standalone machine learning for enhanced FRP-confined concrete columns strength prediction. J. Soft Comput. Civ. Eng. 2025, 9, 60–96. [Google Scholar]
  40. Naser, M.Z.; Hawileh, R.A.; Abdalla, J. Modeling strategies of finite element simulation of reinforced concrete beams strengthened with FRP: A review. J. Compos. Sci. 2021, 5, 19. [Google Scholar] [CrossRef] [Scilit]
  41. ACI (American Concrete Institute). Design and Construction of Externally Bonded Fiber-Reinforced Polymer (FRP) Systems for Strengthening Concrete Structures—Guide; ACI PRC-440.2-23; American Concrete Institute: Farmington Hills, MI, USA, 2023. [Google Scholar]
  42. Wei, Y.Y.; Wu, Y.F. Unified stress–strain model of concrete for FRP-confined columns. Constr. Build. Mater. 2012, 26, 381–392. [Google Scholar] [CrossRef] [Scilit]
  43. Li, L.; Fan, J.; Jiang, Y.; Zhang, Y. Improved strength model of FRP-confined concrete in rectangular columns. Int. J. Struct. Civ. Eng. Res. 2015, 4, 478–487. [Google Scholar]
  44. Cao, Y.G.; Jiang, C.; Wu, Y.F. Cross-sectional unification on the stress–strain model of concrete subjected to high passive confinement by fiber-reinforced polymer. Polymers 2016, 8, 186. [Google Scholar] [CrossRef] [Scilit] [PubMed]
  45. Al Abadi, H.; El-Naga, H.A.; Shaia, H.; Paton-Cole, V. Refined approach for modelling strength enhancement of FRP-confined concrete. Constr. Build. Mater. 2016, 119, 152–174. [Google Scholar] [CrossRef] [Scilit]
  46. Keshtegar, B.; Sadeghian, P.; Gholampour, A.; Ozbakkaloglu, T. Nonlinear modeling of ultimate strength and strain of FRP-confined concrete using chaos control method. Compos. Struct. 2017, 163, 423–431. [Google Scholar] [CrossRef] [Scilit]
  47. Fallahpour, A.; Ozbakkaloglu, T.; Vincent, T. Simplified design-oriented axial stress–strain model for FRP-confined normal- and high-strength concrete. Eng. Struct. 2018, 175, 501–516. [Google Scholar]
  48. Guo, Y.C.; Xiao, S.H.; Luo, J.W.; Ye, Y.Y.; Zeng, J.J. Confined concrete in fiber reinforced polymer partially wrapped square columns: Axial compressive behavior and strain distributions by a particle image velocimetry sensing technique. Sensors 2018, 18, 4118. [Google Scholar] [CrossRef] [Scilit] [PubMed]
  49. Guo, Y.C.; Gao, W.Y.; Zeng, J.J.; Duan, Z.J.; Ni, X.Y.; Peng, K.D. Compressive behavior of FRP ring-confined concrete in circular columns: Effects of specimen size and a new design-oriented stress–strain model. Constr. Build. Mater. 2019, 201, 350–368. [Google Scholar] [CrossRef] [Scilit]
  50. Yuan, W.Y.; Han, Q.; Bai, Y.L. A unified stress–strain model for large rupture strain FRP-confined concrete columns with square and circular cross-sections. Eng. Struct. 2022, 255, 113900. [Google Scholar] [CrossRef] [Scilit]
  51. fib (International Federation for Structural Concrete). Externally Applied FRP Reinforcement for Concrete Structures; Bulletin 90; fib: Siegmar, Germany, 2019. [Google Scholar]
  52. Zhu, Z.; Zhou, Y.; Li, Z.; Li, H.; Hu, B.; Li, P. A versatile continuous model for predicting various post-peak patterns of FRP-confined concrete. Compos. Struct. 2022, 294, 115750. [Google Scholar] [CrossRef] [Scilit]
  53. Liao, J.; Zeng, J.J.; Gong, Q.M.; Quach, W.M.; Gao, W.Y.; Zhang, L. Design-oriented stress–strain model for FRP-confined ultra-high performance concrete. Constr. Build. Mater. 2022, 318, 126200. [Google Scholar] [CrossRef] [Scilit]
  54. Wang, J.; Xia, J.; Chang, H.; Han, Y.; Yu, L. The axial compressive experiment and analytical model for FRP-confined gangue aggregate concrete. Struct. Concr. 2022, 36, 98–110. [Google Scholar] [CrossRef] [Scilit]
  55. Zeng, J.J.; Liao, J.; Zhu, D.H.; Li, P.D. Axial compressive behavior and design-oriented model for large-rupture-strain FRP-confined concrete in rectangular columns. J. Build. Eng. 2023, 75, 106925. [Google Scholar] [CrossRef] [Scilit]
  56. Shayanfar, J.; Baharloo, S.; Barros, J.A.; Mohammadi, A. Strength model for FRP-confined concrete: Comprehensive database and reliability-based partial factor calibration. J. Compos. Constr. 2026, 30, 04026006. [Google Scholar] [CrossRef] [Scilit]
  57. Jiang, T.; Teng, J.G. Analysis-oriented stress–strain models for FRP-confined concrete. Eng. Struct. 2007, 29, 2968–2986. [Google Scholar] [CrossRef] [Scilit]
  58. Lim, J.C.; Ozbakkaloglu, T. Confinement model for FRP-confined high-strength concrete. J. Compos. Constr. 2014, 18, 04013058. [Google Scholar] [CrossRef] [Scilit]
  59. Shayanfar, J.; Barros, J.A.; Pereira, J.P. A versatile model with a design framework for axially-loaded FRP-confined concrete with/without a stress reduction-recovery behavior. Constr. Build. Mater. 2024, 448, 138097. [Google Scholar] [CrossRef] [Scilit]
  60. Shayanfar, J.; Barros, J.A. Design-oriented model of unified character to determine softening–hardening stress–strain behavior of FRP-confined concrete columns of general cross section. J. Compos. Constr. 2024, 28, 04024059. [Google Scholar] [CrossRef] [Scilit]
  61. Liao, J.; Yang, K.Y.; Zeng, J.J.; Quach, W.M.; Ye, Y.Y.; Zhang, L. Compressive behavior of FRP-confined ultra-high performance concrete (UHPC) in circular columns. Eng. Struct. 2021, 249, 113246. [Google Scholar] [CrossRef] [Scilit]
  62. Shayanfar, J.; Barros, J.A.; Rezazadeh, M. Generalized Analysis-oriented model of FRP confined concrete circular columns. Compos. Struct. 2021, 270, 114026. [Google Scholar] [CrossRef] [Scilit]
Figure 1. An overview of the key variables in the test datasets employed for model development: Frequency distribution of (a) b; (b) L; (c) fc0; (d) Ef; (e) εfu; (f) KL; (g) KL/fc0; (h) fcc/fc0; (i) εcu/εc0.
Jcs 10 00393 g001aJcs 10 00393 g001b
Figure 2. Correlation matrix of input variables and strength enhancement.
Jcs 10 00393 g002
Figure 3. Correlation matrix of input variables and ultimate strain capacity.
Jcs 10 00393 g003
Figure 4. Predictive performance of developed XGBoost model for strength-related responses of FRP-confined concrete: (a) training dataset for Δf; (b) testing dataset for Δf; (c) training dataset for fcc; (d) testing dataset for fcc.
Jcs 10 00393 g004
Figure 5. Predictive performance of developed XGBoost model for ultimate strain of FRP-confined concrete: (a) training dataset; (b) testing dataset.
Jcs 10 00393 g005
Figure 6. Evaluation of XGBoost and benchmark regression models for FRP-confined concrete: strength and strain predictions: (a) fccPre/fc0 versus fccExp/fc0 relationship; (b) εccPre/εc0 versus εccExp/εc0 relationship.
Jcs 10 00393 g006
Figure 7. Relative importance of input features identified by XGBoost models developed for predicting (a) Δf and (b) εcu.
Jcs 10 00393 g007
Table 1. Statistical indicators of key parameters for strength-related dataset.
Data NumberStatistical Indicator b / 150 (mm) L b n f t f (mm) E f (GPa) ε f u f c 0 (MPa) K L f c 0 f l , r u p f c 0 f c c f c 0 Δ f
3312Min.0.331.600.0660.00471.50.020.021.02
Max.2.675.159.506570.113204229.02.8610.211.2
Median1.002.000.372110.0183820.50.220.921.92
MV0.962.061.001600.0224828.00.301.182.18
CoV0.2940.1621.4580.6340.6920.7000.8850.8950.8480.459
Skewness1.3416.1192.6540.3713.5351.9222.8073.0532.2482.248
Kurtosis8.74446.7610.384.0715.976.5614.8518.2912.7412.74
Table 2. Statistical indicators of key parameters for strain-related dataset.
Data NumberStatistical Indicator b / 150 (mm) L b n f t f (mm) E f (GPa) ε f u f c 0 (MPa) K L f c 0 f l , r u p f c 0 ε c u
3319Min.0.331.600.0660.00471.40.020.002
Max.2.675.159.506570.113204255.82.700.195
Median1.002.000.392110.0183820.40.220.018
MV0.962.071.021570.0224928.20.300.022
CoV0.2890.1761.4270.6500.6900.6980.9000.9200.781
Skewness1.2935.7882.5860.4523.5211.9262.8872.8372.856
Kurtosis8.64440.9710.064.1615.916.5816.1515.0016.79
Table 3. Correlation of governing parameters with Δf and εcu.
ParameterCorrelation with ΔfInterpretation (Δf)Correlation with εcuInterpretation (εcu)
b/150−0.087Negligible geometric influence−0.037Negligible geometric influence
L/b0.041No meaningful effect−0.024No meaningful effect
nf × tf0.325Moderate positive effect0.354Moderate positive effect
Ef−0.057Very weak influence−0.337Moderate negative effect
εfu0.041Negligible0.679Dominant predictor of εcu
fc0−0.349Moderate negative −0.178Weak negative effect
KL/fc00.837Strong positive effect 0.266Weak–moderate positive effect
fl,rup/fc00.896Dominant predictor of Δf0.523Moderate–strong positive effect
Table 4. Predictive performance of existing regression-based strength models.
IDExpressionMVCoVMSEMAPER2SS
Lam and Teng [4] f c c f c 0 = 1 + 3.3 f l , r u p f c 0 0.9650.1880.2240.1460.9060.709
Teng et al. [15] f c c f c 0 = 1 ρ K 0.01 1 + 3.5 ρ K 0.01 ρ ε ρ K 0.01 0.8910.1910.2730.1680.9050.836
Wei and Wu [42] f c c f c 0 = 1 + 2.2 f l , max f c 0 0.94 1.2830.2141.0030.2980.8721.926
Sadeghian and Fam [16] f c c f c 0 = 1 + 2.77 ρ K 0.77 0.07 ρ ε 0.91 0.9640.1860.2060.1450.9080.665
Li et al. [43] f c c f c 0 = 1 + 3.3 k h h / b 1.7 ρ K 0.01 ρ ε 1.0390.2270.4790.1710.8791.037
Cao et al. [44] f c c f c 0 = 1 + 8.34 30 f c 0 0.54 K L E c 1.03 ε f u ε c 0 0.82 1.1140.2110.8370.1700.8921.440
Al Abadi et al. [45] f c c f c 0 = 1 + 5.54 E x p 0.00042 f c 0 + 25.6 2 0.0083 f l max 18.67 2 0.8470.3241.1670.2340.4902.388
Keshtegar et al. [46] f c c f c 0 = 1 + 3.23 4.8 ρ K 2.5 f l , r u p f c 0 0.95 0.9770.1860.2410.1440.9100.685
Pour et al. [47] f c c f c 0 = 1 + 2.5 0.01 f c 0 f l max f c 0 0.9870.1820.2170.1370.8810.668
Guo et al. [48,49] f c c f c 0 = 1 ρ K e 0.01 1 + 2 ρ K e 0.01 ρ ε ρ K e 0.01 0.7970.1850.5330.2190.9191.222
Yuan et al. [50] f c c f c 0 = 1 + 2.76 f l , max f c 0 1.1550.2070.5980.2020.8811.282
fib [51] f c c f c 0 = 1 f l , r u p / f c 0 0.07 1 + 3.3 f l , r u p / f c 0 f l , r u p / f c 0 0.07 0.8680.1920.4120.1810.8741.044
Zhu et al. [52] f c c f c 0 = 0.5 + 2.7 f l , max f c 0 0.73 0.9920.2000.2290.1520.8920.697
Liao et al. [53] f c c f c 0 = 1 + 0.606 f l , r u p f c 0 0.6 ε h , r u p ε c 0 0.7 0.9850.3190.6180.2190.7601.411
Wang et al. [54] f c c f c 0 = 1 + 5.3 ρ K + 0.036 ρ ε 1.2820.2150.8780.2980.8681.805
Pour et al. [17] f c c f c 0 = 0.666 + 2 K L 1 3 + 1.58 K L ε f u f c 0 0.9570.1930.2070.1370.9010.678
Shayanfar et al. [18] f c c f c 0 = 1 + 3.2 β 0 β U F K L 0.91 f c 0 1.32 ε f u 0.67 0.9740.1740.1810.1300.9200.590
Shayanfar et al. [19] f c c f c 0 = 1 f l , r u p / f c 0 0.05 1 + 3.4 f l , r u p / k r f c 0 f l , r u p / f c 0 0.05 0.9350.1730.2360.1380.9080.704
Zeng et al. [55] f c c f c 0 = 0.32 + 4.58 ρ K e ρ ε ρ K 0.04 1 + 4.12 ρ K 0.004 ρ ε ρ K 0.04 1.1910.2280.9530.2310.8671.735
ACI [41] f c c f c 0 = 1 f l , r u p / f c 0 0.08 1 + 3.135 f l , r u p / f c 0 f l , r u p / f c 0 0.08 0.9160.1870.2930.1570.9100.810
Shayanfar et al. [56] f c c f c 0 = 1 + 3.2 β f c β S E β E f K L 0.91 f c 0 1.32 ε f u 0.67 0.9990.1620.1570.1240.9220.522
Table 5. Predictive performance of existing regression-based strain models.
IDExpressionMVCoVMSEMAPER2SS
Lam and Teng [12] ε c u ε c 0 = 1.75 + 5.53 f l , r u p f c 0 ε h , r u p ε c 0 0.45 0.9500.47936.10.3450.51437.46
Jiang and Teng [57] ε c u ε c 0 = 0.85 1 + 8 f l , r u p f c 0 1 + 0.75 ε h , r u p / ε c 0 0.7 e 7 ε h , r u p / ε c 0 1.1300.48932.20.3880.57733.63
Teng et al. [15] ε c u ε c 0 = 1.75 + 6.5 ρ K 0.8 ρ ε 1.45 1.2450.47529.10.4250.58830.657
Wei and Wu [42] ε c u ε c 0 = 1.75 + 12 30 f c 0 0.62 f l , max f c 0 0.75 1.0800.56261.60.4050.22563.422
Ozbakkaloglu and Lim [58] ε c u ε c 0 = 2 f c 0 20 100 + 0.271 K L f c 0 0.9 ε h , r u p 1.35 ε c 0 1.0180.52329.90.3920.55631.277
Sadeghian and Fam [16] ε c u ε c 0 = 1.5 + 6.78 ρ K 0.63 ρ ε 1.08 1.0590.47532.60.3580.54933.943
Cao et al. [44] ε c u ε c 0 = 1.75 + 9.45 30 f c 0 0.79 K L E c 0.68 ε f u ε c 0 1.14 1.4130.54999.30.5480.398101.412
Keshtegar et al. [46] ε c u ε c 0 = 1 + 7.31 + 2.06 ρ ε 0.8 f l , r u p f c 0 0.6 1.0740.49228.20.3870.60529.548
Pour et al. [47] ε c u ε c 0 = 1.5 + k 2 K L / f c 0 0.75 ε f u 1.35 / ε c 0 1.1250.49826.60.3780.59228.009
fib [51] ε c u ε c 0 = 1.75 + 12 k b f l , r u p f c 0 ε h , r u p ε c 0 0.45 0.8560.51448.00.4980.39849.758
Yuan et al. [50] ε c u ε c 0 = 1.75 + 1.5 ε h , r u p ε c 0 f l , r u p f c 0 0.57 0.9310.52225.90.3740.64027.225
Liao et al. [53] ε c u ε c 0 = 1 + 0.595 f l , r u p f c 0 0.1 ε h , r u p ε c 0 1.45 1.0150.60250.30.4350.55151.801
Wang et al. [54] ε c u ε c 0 = 1.69 + 17.5 ρ K 0.98 ρ ε 1.45 1.5500.53093.30.6400.46895.552
Pour et al. [17] ε c u ε c 0 = 32.3 ε c 0 ε f u 2 K L 2 f c 0 2 / 69.65 K L 3 1 / 3 1.1250.52126.60.3710.59228.025
Shayanfar et al. [18] ε c u ε c 0 = 300 α U F K L 0.56 f c 0 0.78 ε f u 1.17 1 1.0590.51723.70.3670.66225.049
ACI [41] ε c u ε c 0 = 1.5 + 12 k b f l , r u p f c 0 ε h , r u p ε c 0 0.45 0.9890.52748.30.3820.45349.767
Table 6. Optimized hyperparameters and 10-fold cross-validation performance metrics for models predicting strength of FRP-confined concrete.
ModelConfigurationTraining Subset Held-Out Validation Subset
Mean CV MSEMean CV MSEMean CV R2Mean CV MAPE
MLP1Hidden neurons: 20; Training function: trainbr0.081 ± 0.0030.102 ± 0.0120.896 ± 0.01835.28%
MLP2Hidden neurons (layer1, layer2): [10 10]; Training function: trainbr0.070 ± 0.0120.124 ± 0.0560.878 ± 0.04133.36%
GPRKernel: Squared Exponential; Hyperparameter optimization: Internal (per fold)0.022 ± 0.0030.084 ± 0.0210.914 ± 0.02725.04%
SVRBoxConstraint: 5; Epsilon: 0.01; KernelScale: 10.035 ± 0.0010.081 ± 0.0210.918 ± 0.02226.78%
GBMNumTrees: 300; LearnRate: 0.1; MaxSplits: 20; MinLeaf: 10.013 ± 0.0000.037 ± 0.0080.961 ± 0.01017.62%
XGBoostNumTrees: 300; LearnRate: 0.1; MaxSplits: 30; MinLeaf: 10.010 ± 0.0000.035 ± 0.0060.965 ± 0.00616.25%
LightGBMNumTrees: 300; LearnRate: 0.1; MaxSplits: 20; MinLeaf: 10.013 ± 0.0000.035 ± 0.0050.964 ± 0.00717.84%
Table 7. Optimized hyperparameters and 10-fold cross-validation performance metrics for models predicting ultimate strain of FRP-confined concrete.
ConfigurationTraining Subset Held-Out Validation Subset
Mean CV MSEMean CV MSEMean CV R2Mean CV MAPE
Hidden neurons: 20; Training function: trainbr12.53 ± 0.84916.13 ± 3.8690.755 ± 0.05633.49%
Hidden neurons (layer1, layer2): [10 10]; Training function: trainbr9.216 ± 1.41516.27 ± 4.7760.751 ± 0.08932.22%
Kernel: Squared Exponential; Hyperparameter optimization: Internal (per fold)10.14 ± 0.90513.36 ± 3.7440.800 ± 0.04128.47%
BoxConstraint: 5; Epsilon: 0.01; KernelScale: 17.593 ± 0.37013.96 ± 4.7690.792 ± 0.05224.03%
NumTrees: 300; LearnRate: 0.1; MaxSplits: 20; MinLeaf: 101.891 ± 0.1095.085 ± 1.6290.924 ± 0.01915.91%
NumTrees: 300; LearnRate: 0.1; MaxSplits: 30; MinLeaf: 11.419 ± 0.0904.784 ± 1.2860.929 ± 0.01514.36%
NumTrees: 300; LearnRate: 0.1; MaxSplits: 20; MinLeaf: 11.654 ± 0.0824.789 ± 1.2030.925 ± 0.02615.13%
Table 8. Performance of input feature configurations using optimized XGBoost.
SetInput FeaturesRankMean MSE ± StdMean R2 ± Std
AbL/bnf tfEfεfufc0KL/fc0fl,rup/fc040.00038 ± 0.000110.9604 ± 0.0086
BbL/bnf tfEfεfufc0KLfl,rup10.00033 ± 0.000050.9655 ± 0.0059
Cbnf tfEfεfufc0KLfl,rup 20.00035 ± 0.000080.9631 ± 0.0086
DbL/bnf tfEfεfufc0 50.00040 ± 0.000120.9585 ± 0.0138
Ebnf tfEfεfufc0 30.00035 ± 0.000060.9623 ± 0.0085
Table 9. Performance of developed XGboost model for strength and ultimate strain.
Response VariableDatasetNo. of SamplesMVCoVMSEMAPER2SS
ΔfTraining 19871.02101510.0060.0760.9940.260
Testing 13251.0480.2780.0400.1670.9610.572
fccTraining 19871.0020.0360.0060.0260.9940.076
Testing 13251.0070.0840.0400.0600.9610.230
εcu/εc0Training 19911.0160.1100.9600.0670.9851.167
Testing 13281.0510.2515.1210.1530.9285.648
Table 10. Performance of proposed XGboost model versus regression models (Shayanfar et al. [17,56]) for strength and ultimate strain of FRP-confined concrete.
Response VariableModel TypeNo. of SamplesMVCoVMSEMAPER2SS
fcc/fc0XGboost33121.0040.0600.0200.0390.9800.143
Regression0.9990.1620.1570.1240.8510.594
εcu/εc0XGboost33191.0300.1832.6250.1010.9612.978
Regression1.0590.51723.770.3670.66225.05
Disclaimer/Publisher’s Note: The statements, opinions and data contained in all publications are solely those of the individual author(s) and contributor(s) and not of MDPI and/or the editor(s). MDPI and/or the editor(s) disclaim responsibility for any injury to people or property resulting from any ideas, methods, instructions or products referred to in the content.