Article

Effect of Gap Distance on Shock Transmission to a Protected Target in a Multilayered Ceramic–Polymer–Metal Composite System

1
Department of Mechanical Engineering, University of Mississippi, University, MS 38677, USA
2
Center for Materials and Structures, University of Nevada, Las Vegas, NV 89154, USA
3
Environmental Laboratory, U.S. Army Engineer Research and Development Center, Vicksburg, MS 39180, USA
*
Author to whom correspondence should be addressed.
J. Compos. Sci. 2026, 10(7), 366; https://doi.org/10.3390/jcs10070366
Submission received: 28 May 2026 / Revised: 24 June 2026 / Accepted: 6 July 2026 / Published: 9 July 2026
(This article belongs to the Section Composites Manufacturing and Processing)

Abstract

Shock wave propagation in a layered ceramic–polymer–metal (CPM) composite armor was investigated numerically using the Abaqus© (2024) software in a plate-impact configuration, in which a copper impactor impacts a CPM plate that serves as an intermediate layer between the impactor and a protected target representing human bone. The resulting motion of the CPM back surface closes a pre-calibrated gap, initiating a secondary impact on the protected target. Because the transmitted loadings depend on the complex interaction of compressive and release waves within the layered system, the effect of gap distance on impact response is difficult to predict. Therefore, the primary objective of this study is to develop an improved understanding of the shock-mitigation mechanisms within the CPM system that enable the target to survive the impact event. The particle-velocity history at the midplane of the protected target was used to compare responses at different gap distances. The gap effect is influenced by geometry under uniaxial strain conditions, as well as by the materials’ wave speed and shock impedance. The observed trends arise from the combined effects of geometry under uniaxial strain conditions, material wave speed, and shock impedance mismatch, which govern the evolution and interaction of the compressive and release waves at different gap distances. The CPM configuration was examined over a 1–10 mm gap, and a detailed analysis was conducted for the representative gap distances of 1–3 mm. The results indicate that the midplane velocity of the protected target depends strongly on the gap distance, with a 1 mm gap producing the highest midplane velocity, followed by gaps of 3 mm and 2 mm. The CPM response depends on differences in the timing and strength of compressive and release waves reaching its free surface before gap closure, as shown by velocity histories and x–t diagrams.

1. Introduction

Layered composite armor systems are essential in modern impact and ballistic protection research, combining layered configurations to maximize energy absorption and minimize penetration [1]. To better understand the governing mechanisms, multilayer composite materials are frequently used in plate impact experiments to explore their response to high velocity impacts, emphasizing factors such as the number of layers, layer sequence, air gap, and material thickness [2,3,4]. In such systems, silicon carbide (SiC) [5,6] is used as a front layer because of its high hardness and compressive strength, enabling efficient initial projectile disruption [7], while the aluminum alloy (Al 6061) [8] provides penetration resistance because of its strength and hardness. To complement these front and intermediate layers, a polycarbonate layer and porous foams are often used as a back layer to absorb and dissipate shock waves through controlled deformation and compaction [5,7]. Beyond material selection, the sequence of layers is an important design parameter in multilayer armor systems, as the individual layers perform different functions during impact and their order, thickness, and material properties collectively influence the overall protective performance of the armor system [7,9].
Numerous numerical and experimental studies have examined the role of air gaps in body armor and layered armor systems. Choudhury et al. [10] studied composite plate armor backed by either rubber layers or air gaps and found that both can reduce the transmitted energy and behind-armor trauma compared to when there is no backing or air gap, though the mitigation level depends on gap thickness and backing material. Moreover, an air gap has been shown to increase the ballistic resistance of multilayer targets, particularly when its thickness exceeds half of the projectile length [11]. In contrast, analytical work by Ben-Dor et al. [4] showed that the influence of an air gap depends on the material properties and layer impedances; increasing the gap can either increase or decrease the maximum velocity the structure can withstand. An experimental study of double-layered steel shields with a controlled air gap found that the spaced configuration produced minimal variation in ballistic limit compared with contacting plates, suggesting that gap size alone is not a reliable measure of improved resistance [12].
In the previous study, Zhang et al. [13] investigated a multilayer composite armor comprising ceramic (SiC), polymer (polycarbonate, PC), and metal (Al 6061), referred to as the CPM layer, and implemented a DSGZ-based VUMAT model [14] to simulate its response under plate impact. Among all layer arrangements examined, the CPM sequence exhibited the most effective impact mitigation behavior, showing comparatively low transmitted velocity and stress to the protected target (simulated human bone). Moreover, the study further explored this configuration by introducing initial gaps between the CPM layer and the protected target to evaluate its influence on the overall dynamic response of the protected target. While their study revealed different trends in midplane velocities across the three gap distances, the underlying wave-interaction mechanisms responsible for these differences were not identified. A better understanding of these mechanisms is necessary to identify gap configurations that maximize shock mitigation and to provide insight for the design of multilayer protective systems.
In the present study, we extended this previous work to investigate the effect of gap distance on shock transmission to a protected target. A modified finite-element framework was developed in Abaqus/Explicit 2024, comprising a copper impactor, a CPM layer, an adjustable gap, and a protected simulated human bone target. In addition to the multilayer configuration, a single-layer system was examined over a wider gap range (1–10 mm) to understand the wave propagation behavior of each material. The complete CPM configuration was then investigated over the same range, and the results showed that the impact response behavior for all configurations is captured within the 1–3 mm interval. These three cases were therefore selected as representative for detailed analysis. For each gap-distance configuration, free-surface velocity (FSV) histories, midplane velocities and stresses, and displacement-time (x-t) diagrams were evaluated to identify the wave-interaction mechanism governing the impact transferred to the protected target.

2. Methodology and Simulation Details

2.1. Shockwave Theory

The impact response of multilayered composites is fundamentally governed by the transmission, reflection, and interaction of stress waves at the material interfaces. In a plate impact test involving two or more layers, a compressive wave is generated after initial impact, which transmits through the successive layers and reflects back as a release wave upon reaching the free surface. When this reflected release wave reaches the interface between two materials with different impedances, the wave type is divided into transmitted and reflected waves [13,15]. The proportion of the wave that is transmitted or reflected depends on the impedance mismatch, defined as Z = ρ c L , where ρ and c L are the density and longitudinal wave speed of the material, respectively. The longitudinal wave speed can be expressed as:
c L = E 1 ν ρ ( 1 + ν ) ( 1 2 ν ) )
where E is Young’s modulus and ν is Poisson’s ratio.
The transmitted wave carries energy into the next layer, while the reflected wave travels back to the previous layer. This repeated interaction of waves at each interface produces transmitted and reflected waves that define the dynamic response of a multilayered system. When an incident stress wave σ i and particle velocity v i reach the boundary between medium 1 ( Z 1 = ρ 1 c 1 ) and medium 2 ( Z 2 = ρ 2 c 2 ), the resulting transmitted ( σ t ) and reflected stresses ( σ r ) are given by:
σ t = 2 Z 2 Z 1 + Z 2 σ i
σ r = Z 2 Z 1 Z 1 + Z 2 σ i
with the corresponding resulting transmitted ( v t ) and reflected ( v r ) velocities:
v t = 2 Z 1 Z 1 + Z 2 v i
v r = Z 1 Z 2 Z 1 + Z 2 v i
The nature of the stress wave at an interface depends upon the relative impedance of neighboring materials, as described in Equation (2). When the wave propagates from a lower-impedance material into a higher-impedance material ( Z 2 > Z 1 ), both the reflected and transmitted waves retain the same stress state as the incident wave. However, when the wave travels from a higher-impedance material into a lower-impedance material ( Z 1 > Z 2 ), the transmitted wave retains the same stress state, whereas the reflected wave changes its stress state. Moreover, at the free surface ( Z 2 = 0 ), the wave cannot pass through and undergoes a complete change in stress state upon reflection.

2.2. Simulation Details

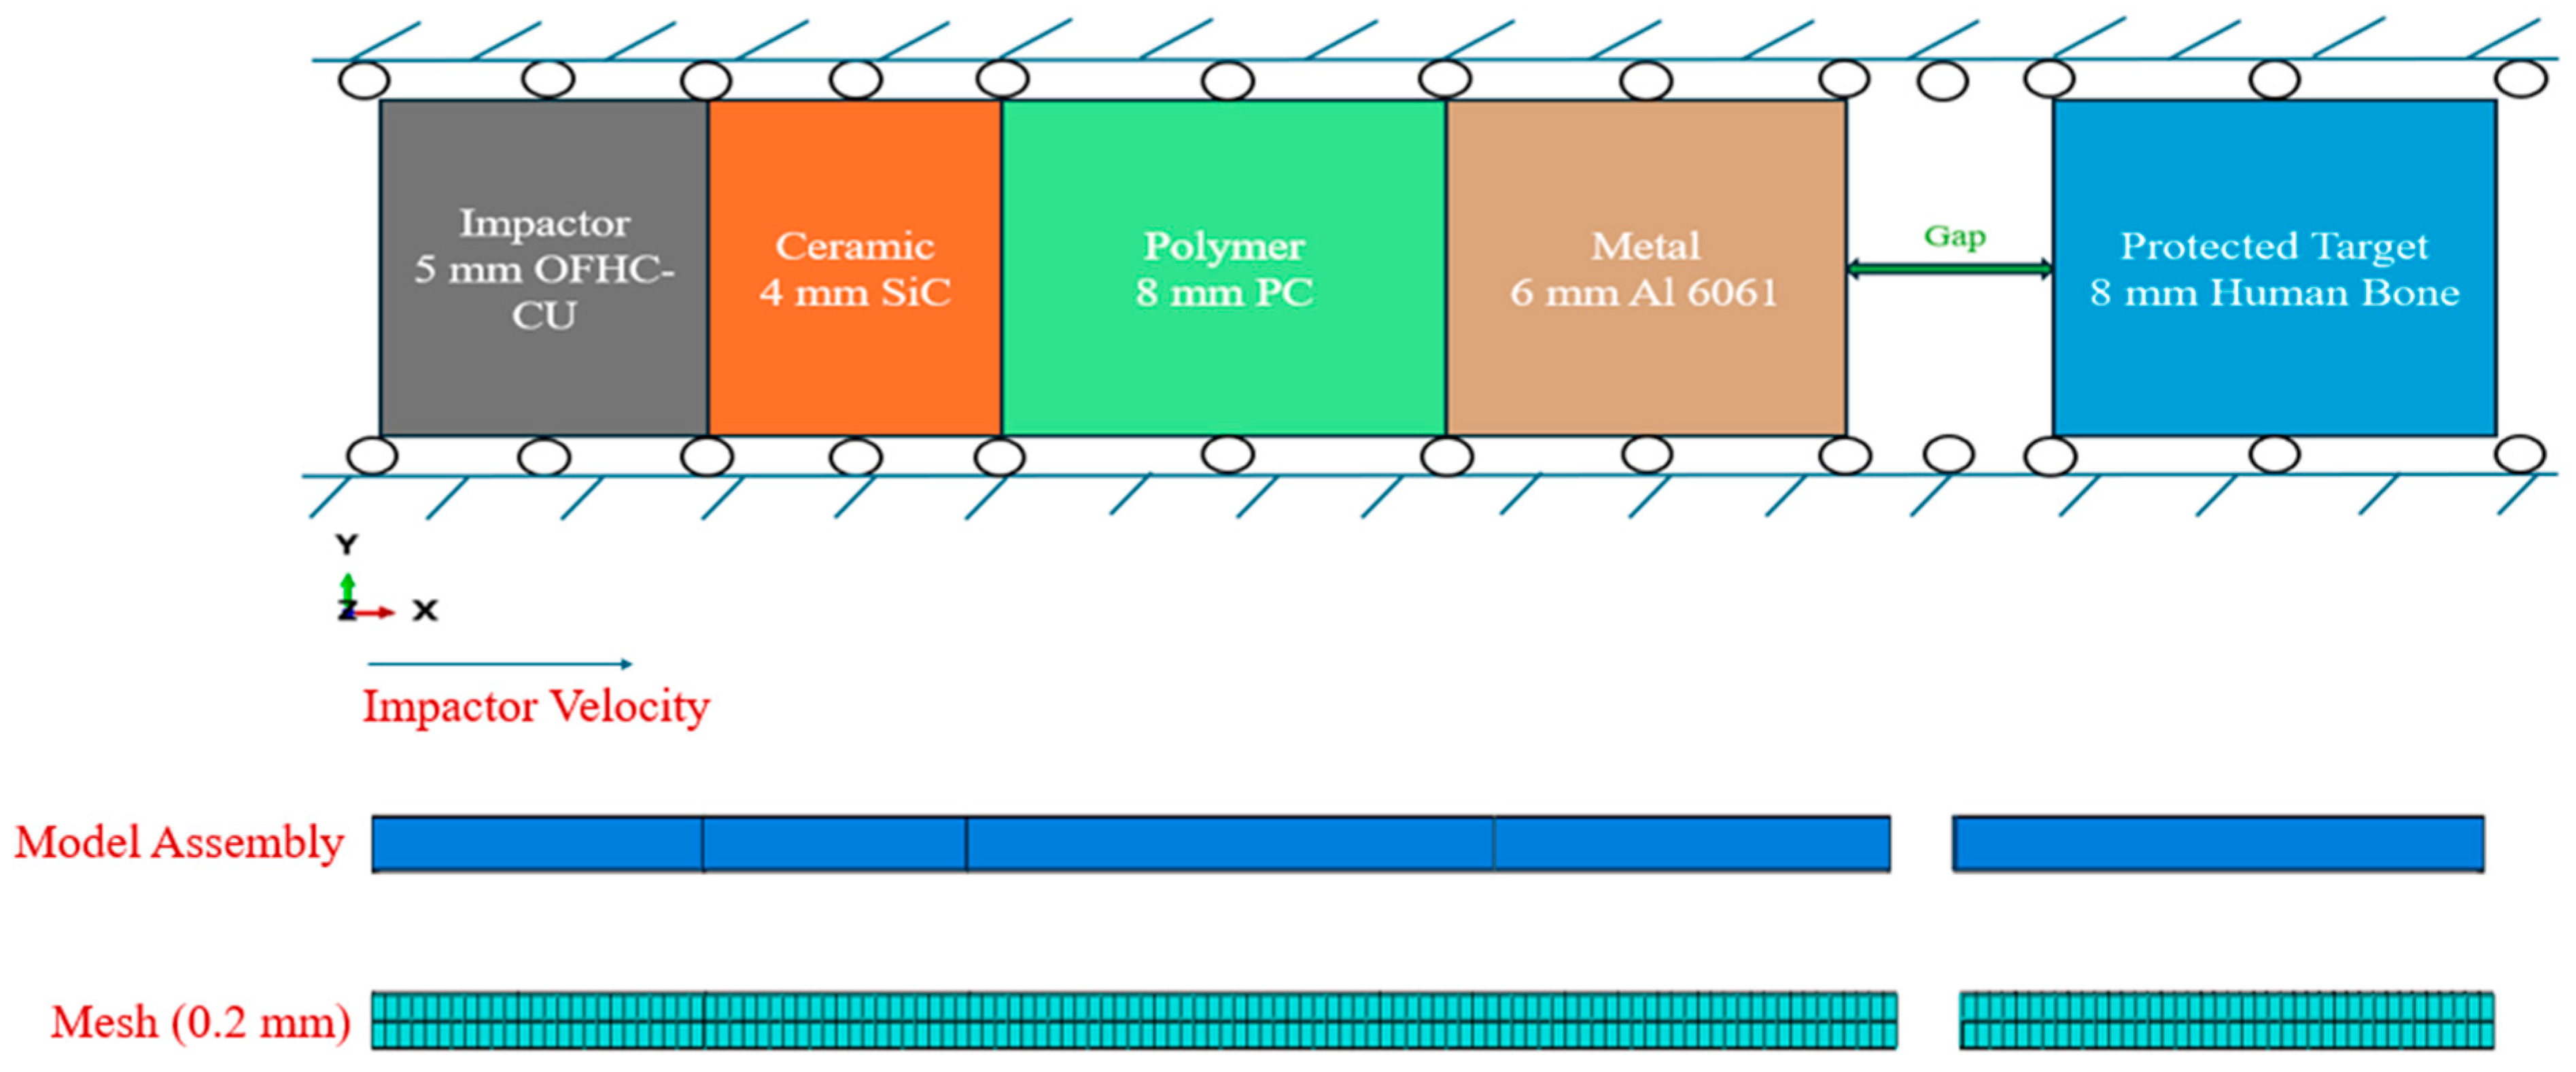
The present study modifies the CPM-layer configuration compared with that of Zhang et al. [13] to simplify the wave interactions among layers and to improve understanding of how gap distance affects wave interactions and the impact response of the protected target. The model was designed as a representation column with a square cross-section. The dimensions in both Y and Z directions were 0.4 mm. Along the impact direction, the model consisted of the impactor, composite armor layer, gap distance, and protected target, with dimensions defined by the layer thicknesses shown in Figure 1. In the present study, the front layer, anti-crack layers, and metallic backplate are omitted to simplify wave transmission and reflection. The copper impactor (oxygen-free high-conductivity copper, OFHC-Cu), with a thickness of 5 mm, strikes the composite armor layer at an initial velocity of 100 m/s. The composite armor layer consists of a 4 mm silicon carbide layer, an 8 mm polycarbonate layer, and a 6 mm Al 6061 layer. Different gap distances (1–10 mm) were assigned behind this armor layer, followed by an 8 mm-protected target representing a simulated human bone. In addition to the CPM configuration, single-layer plate impact simulations (impactor–single layer–protected target) were also performed for SiC, PC, and Al 6061. The thickness of the layers is determined in accordance with standard armor protection requirements. Different gap distances are used to systematically examine how gap distance affects the protected target’s impact response. All simulations were conducted under identical impact conditions.
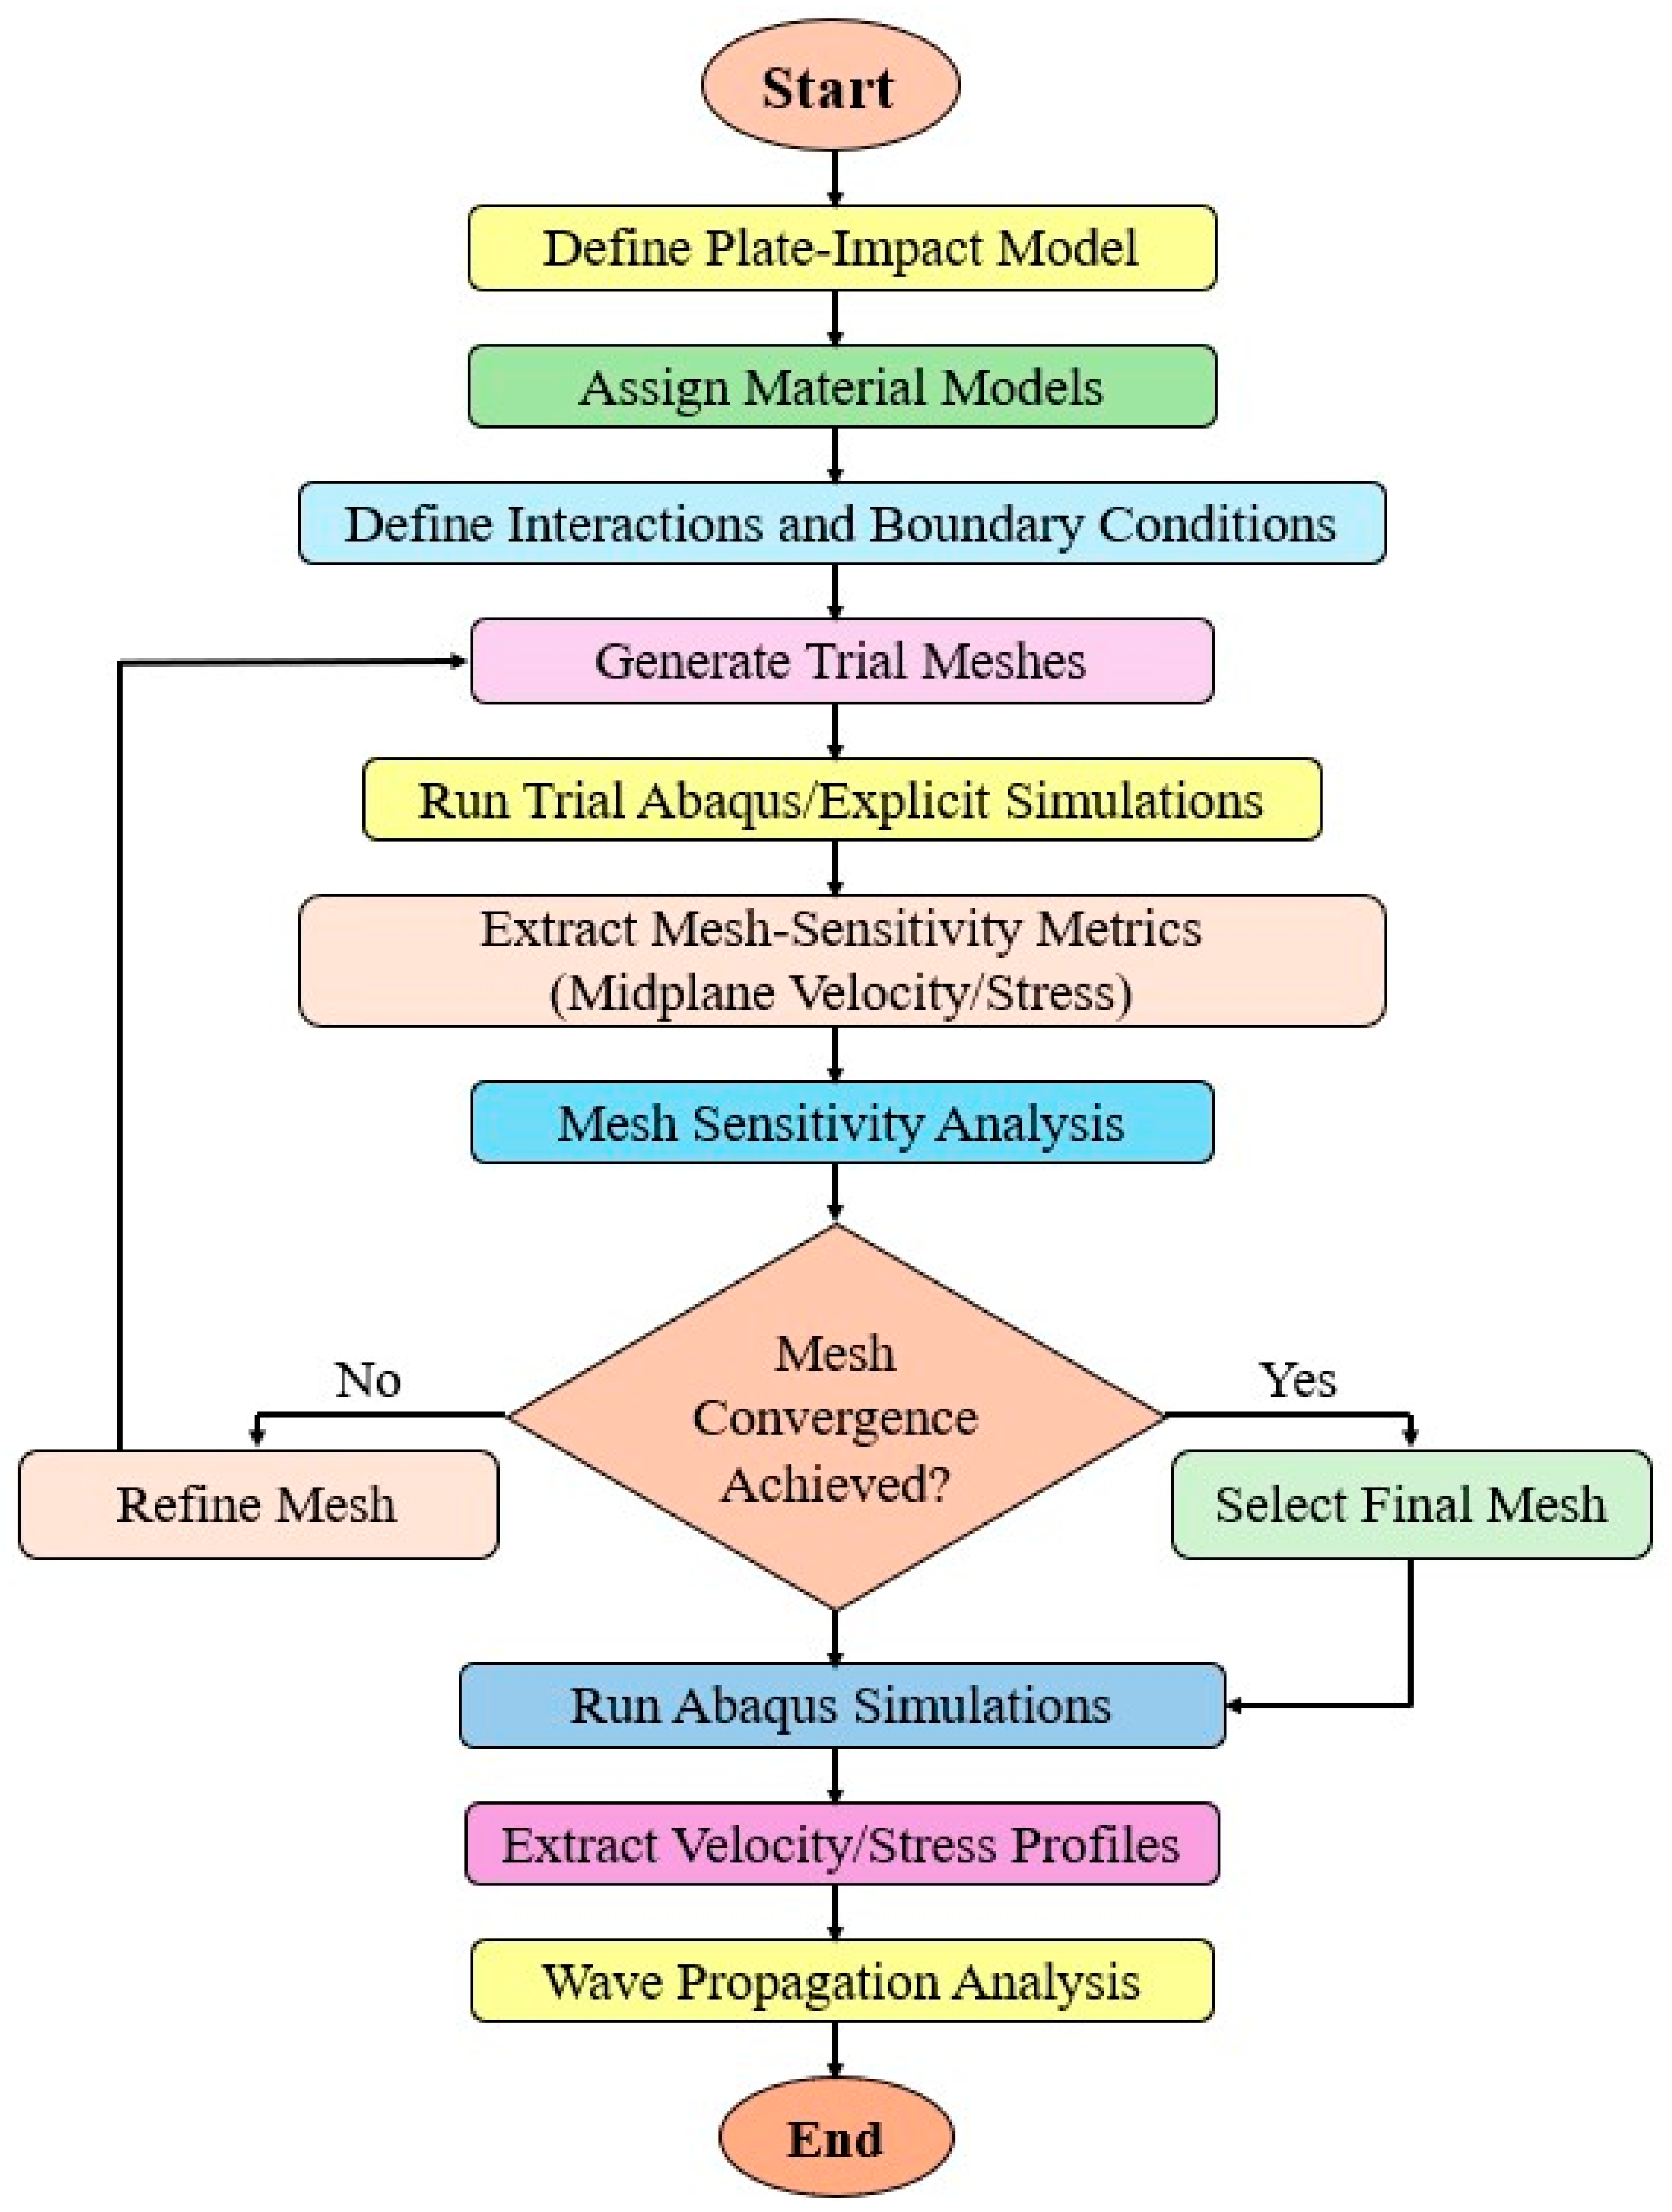
The layers were meshed using eight-node reduced-integration brick elements (C3D8R) with a uniform element size of 0.2 mm. To eliminate numerical errors, a mesh sensitivity analysis was conducted using five alternative mesh sizes (0.05, 0.08, 0.2, 0.5, and 0.8 mm). We compared the histories of mid-plane velocity and stress in the protected target at different gaps to determine whether there is a mesh-size effect. The results showed that the predicted velocity/stress response changed slightly in magnitude when the mesh size was refined below 0.2 mm. In addition, the critical timestep increments calculated by Abaqus/Explicit were also examined. The critical time increments for the 0.05, 0.08, 0.2, 0.5, and 0.8 mm meshes were 2.12 × 10⁻⁹ s, 3.39 × 10⁻⁹ s, 8.48 × 10⁻⁹ s, 1.81 × 10⁻⁸ s, and 1.96 × 10⁻⁸ s, respectively. This shows that mesh refinement below 0.2 mm substantially reduces the critical timestep, thereby increasing the number of increments required to complete the simulations and associated computational cost. Since further mesh refinement resulted in a significant increase in computational cost with negligible changes in the predicted response, a mesh size of 0.2 mm was selected for all simulations as a balance between numerical accuracy and computational efficiency. This confirms that mesh size does not affect the trends observed in the results, validating the robustness of the simulation. All CPM layers were modeled in the interaction module of Abaqus using tie constraints to glue them together. This eliminates the potential for layer delamination and allows the shock wave to reflect and transmit only due to impedance mismatch. Moreover, contacts between the impactor–armor interface and the Al 6061-bone interface were defined as “hard contact” to prevent interpenetration between the layers, and “frictionless” conditions were assigned for tangential behavior. Boundary conditions were applied to the plates, allowing them to be displaced along the loading direction (x-axis), whereas displacements in the y- and z-directions were constrained, resulting in a one-dimensional plate-impact simulation. In a plate impact condition, the dominant wave motion occurs along the direction of impact, while the lateral dimensions of the plates are larger than their thickness. As a result, the material response during early stages of wave propagation is typically treated as a uniaxial strain condition, where deformation in lateral directions is negligible during the wave transmission process. To reproduce this condition, displacements in the Y and Z directions were constrained so that wave propagation occurred primarily along the impact direction. These constraints limit lateral deformation, allowing the study to focus on the transmission, reflection, and interaction of stress waves at material interfaces and in the gap region. The overall numerical simulation procedures adopted in the present study are summarized in Figure 2. The flowchart provides a concise overview of the main steps involved in model setup, simulation execution, and result analysis.

2.3. Material Model and Properties

This study follows the exact framework for material models and constitutive descriptions established in Zhang et al. [13], where the DSGZ constitutive law [14] was introduced and validated for describing the glassy and semicrystalline polymer layer. The constitutive law was developed to describe strain hardening, strain-rate sensitivity, temperature dependence in polymers, and hydrostatic pressure dependence to differentiate tension and compression behavior. The DSGZ model was introduced to accurately capture polymer deformation under high-strain-rate conditions. The implementation was carried out in Abaqus/Explicit using a vectorized user-defined subroutine (VUMAT) coded in FORTRAN that follows the same return-mapping algorithm outlined in [13]. The VUMAT algorithm was based on a radial return mapping scheme for J2 plasticity and employed a safe Newton–Raphson method for plastic correction, ensuring stable convergence during dynamic loading. The DSGZ model was previously validated [13] using a single-element compression test implemented in VUMAT. Moreover, SiC was modeled using the Johnson–Holmquist II (JH-2) constitutive law [16] and the metallic materials, such as OFHC-Cu and Al 6061, were modeled using the Johnson–Cook elastoplastic constitutive law [17] coupled with a Mie–Grüneisen equation of state (EOS) [18,19]. Finally, the protected target was modeled as an ideal material using the elastic Mie–Grüneisen equation of state, with a shear modulus consistent with previous studies [13,20]. The elastoplastic constitutive models are used to provide a consistent description of material behavior without restricting it to purely elastic assumptions. A 3D solid-element model was used because the constitutive models employed in the simulations were implemented in their standard three-dimensional form. Using a one-dimensional or two-dimensional model would require reformulation of the yield equations for a reduced-dimensional analysis. No damage models are included in this study. The corresponding material properties, such as density, longitudinal speed, impedance, and constitutive models, for all layers are summarized in Table 1 [13,21]. All constitutive model parameters and equation of state inputs used in the Abaqus/Explicit material definition properties are provided in the supplementary material section and were adopted directly from the validated material models reported in [13].

3. Results and Discussions

This study investigates the effect of gap distance on the impact response of a protected target subjected to impact loading by a copper impactor. This study is divided into two sections. First, to understand wave transmission across different materials, three single-layer models comprising SiC, Al 6061, and PC were simulated, with gap distances ranging from 1 to 10 mm between the single layer and the protected target. Second, the single layers were combined to form a CPM composite (i.e., in the sequence of SiC, PC, and Al 6061) and simulated across 1–10 mm gap distance to identify overall trends in midplane response of the protected target. The term “midplane” here refers to the geometric center of the protected target along the impact direction. The impact velocities, FSV, and midplane velocities were extracted directly from the point node in the model. The impact velocity was extracted from the back surface (free surface) of the CPM layer (Al 6061) at the instant it contacted the protected target after passing through the gap. The FSV was extracted from the center node on the back surface of the Al 6061 layer to monitor the wave propagation. Finally, the midplane velocity was extracted from a node located at the center of the protected target. Due to the uniaxial strain boundary condition used in this study, all nodal values on a cross-sectional plane perpendicular to the loading direction exhibit identical responses. In all cases, the impactor velocity is kept identical. However, three representative gaps of 1, 2, and 3 mm were selected for detailed wave analysis.

3.1. Effect of Gap Distance in Single-Layer Configuration

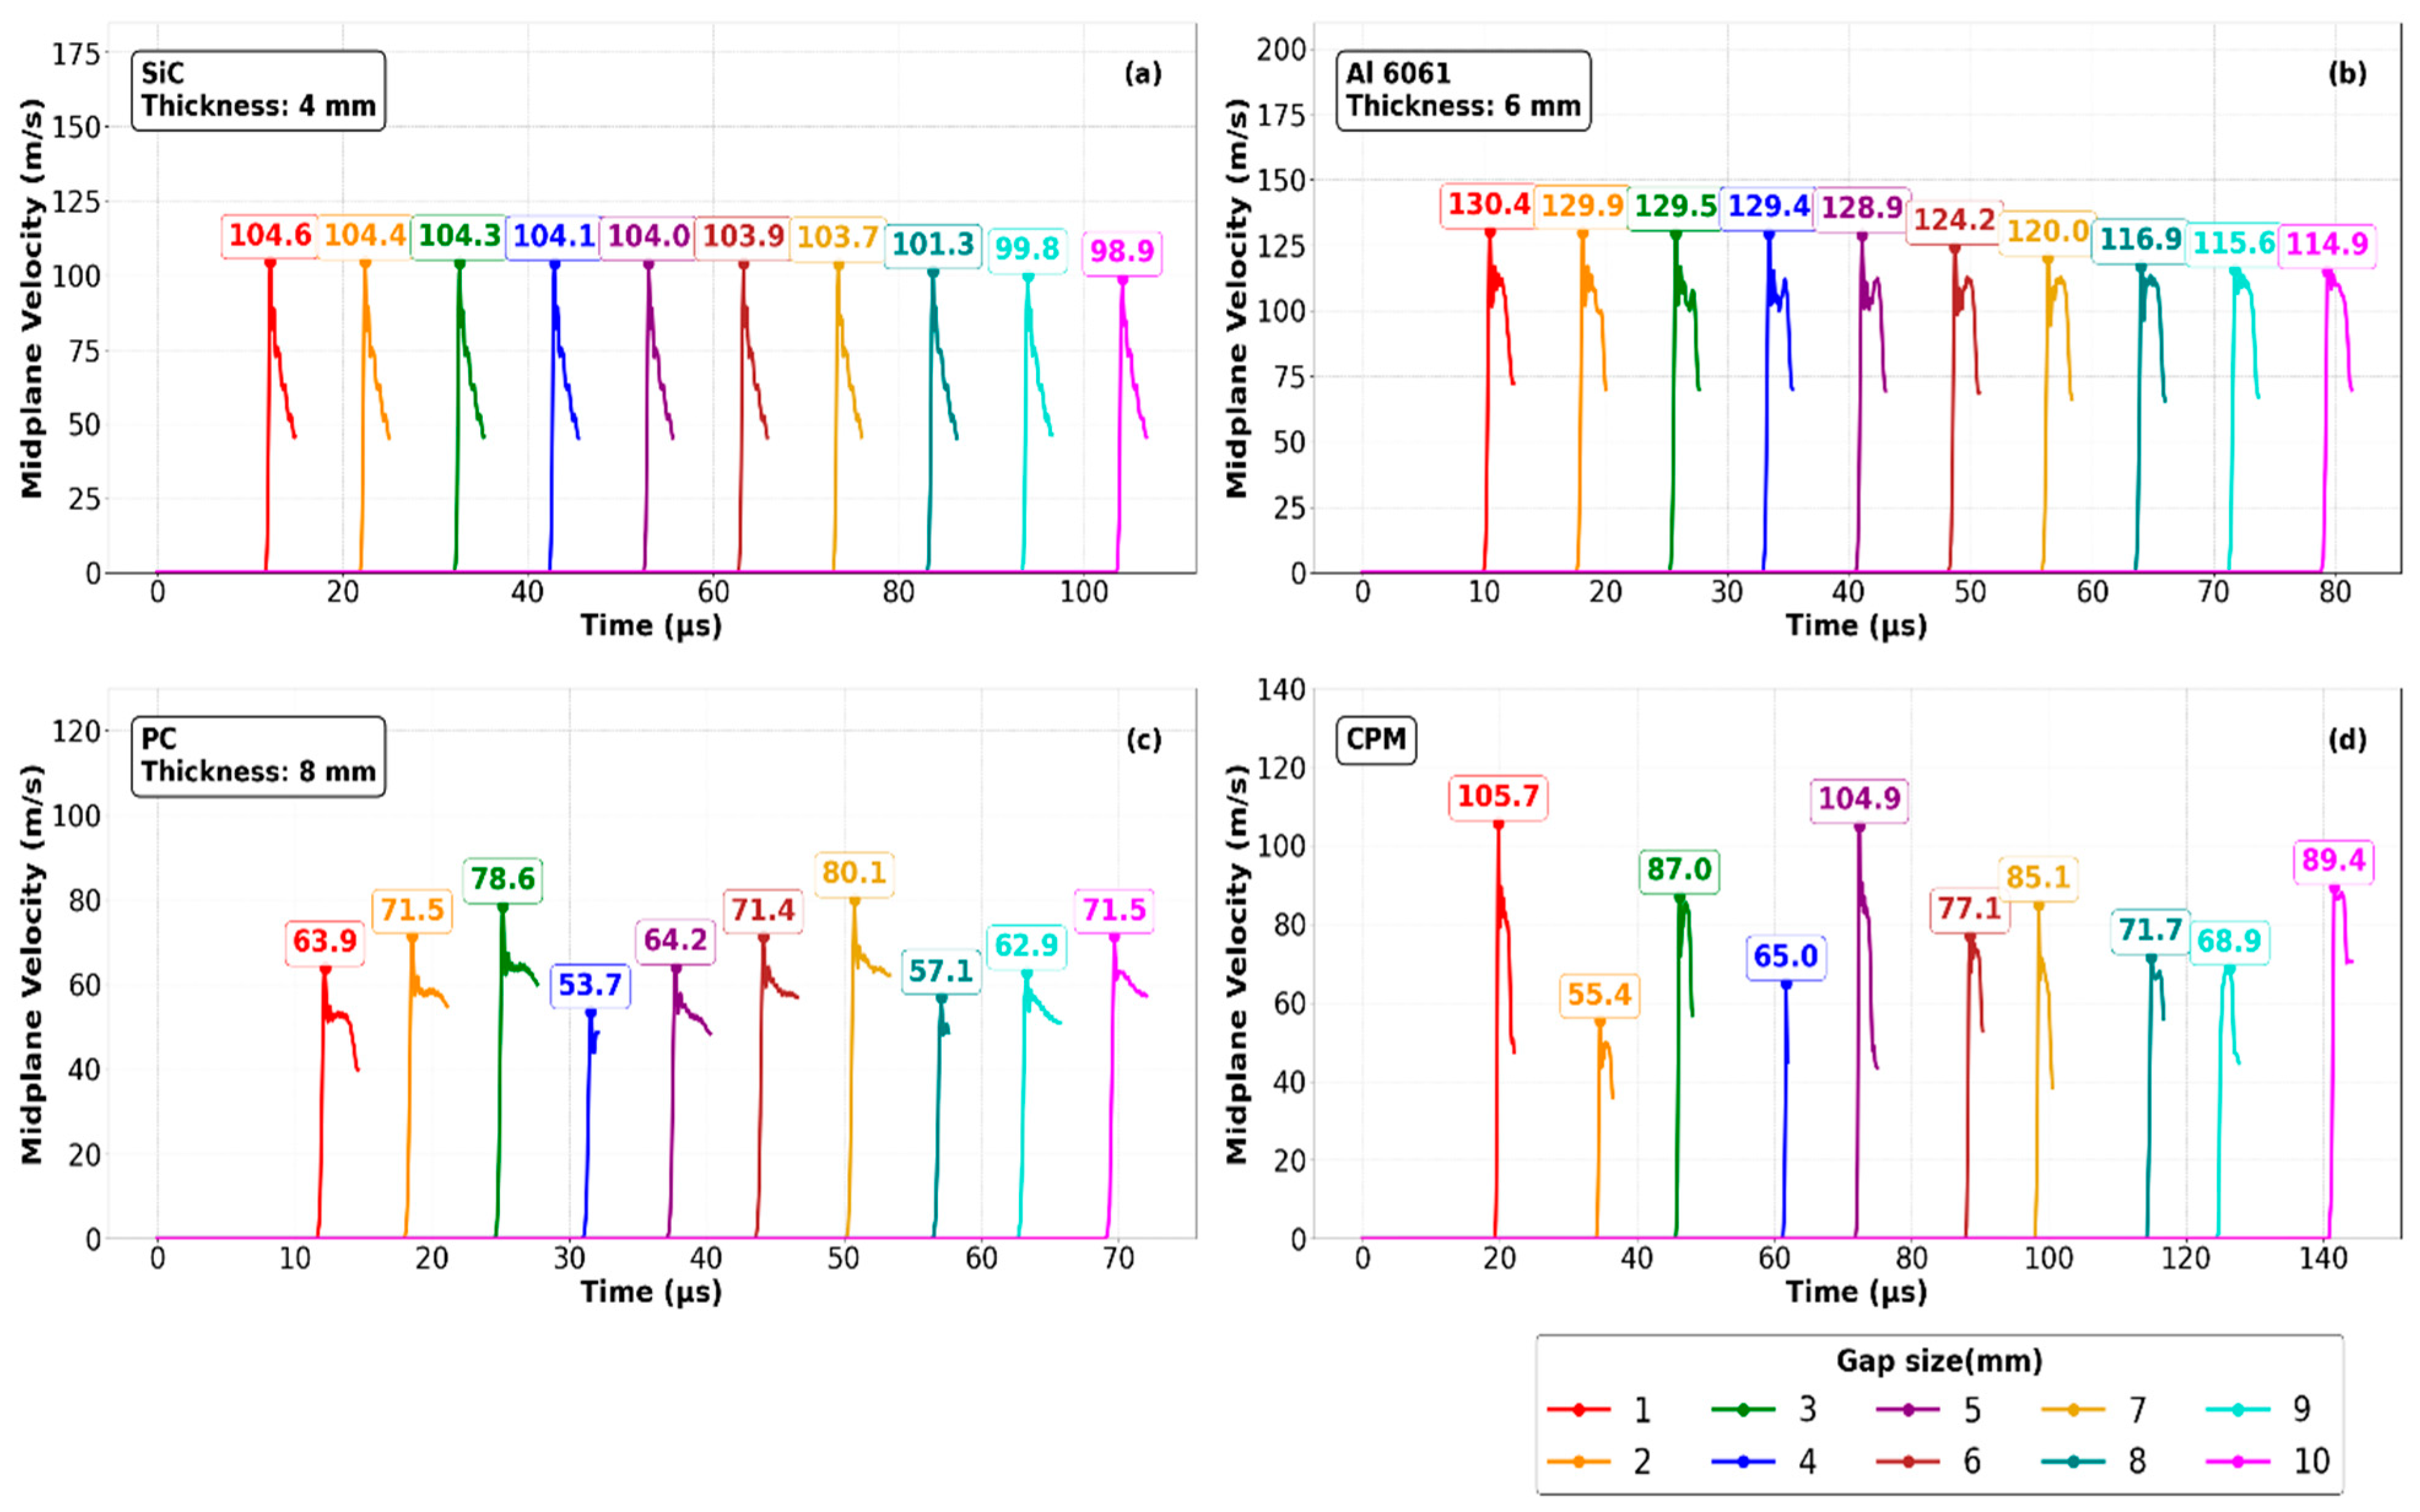
The variation in transmitted midplane velocity in the protected target with gap distance for single layers, i.e., SiC, Al 6061, PC, and the CPM composite under similar impact conditions is presented in Figure 3. The study demonstrates that the midplane response depends upon the layered material’s wave speed and impedance. For SiC, the midplane velocity of the protected target decreases with increasing gap distance, ranging from 104.6 m/s at 1 mm to 98.9 m/s at 10 mm, whereas the Al 6061 layer shows a larger midplane velocity magnitude, ranging from 130.4 m/s to 114.9 m/s over the same gap range. This is because the reflected release wave from the free surface interacts with the incoming compressive waves before they contact the protected target, reducing the impact velocity at gap closure as the gap increases. The reduction in impact velocity results in a corresponding decrease in the transmitted shock loading, and consequently, the midplane velocity of the protected target. The difference in response between SiC and Al 6061 arises from the difference in wave speed and impedance. In SiC, the reflected release wave catches up with the incoming compressive waves more quickly, whereas in Al 6061, the release waves lag the shock front, leading to additional wave interactions before impact. However, the PC shows non-monotonic trends in midplane velocity as the gap distance increases because it has lower wave speed and impedance, which produce different sequences of compressive and release wave interactions as the gap distance varies, resulting in different impact velocities, and consequently, different midplane velocity responses in the protected target. Furthermore, the three single layers are combined to form a CPM composite layer, in which the transmitted midplane velocity shows a non-monotonic trend with gap distance. This is due to differences in wave speed and impedance across the material interface, which further modify the timing and strength of the waves reaching the free surface before gap closure, resulting in a non-monotonic midplane velocity response in the protected target.
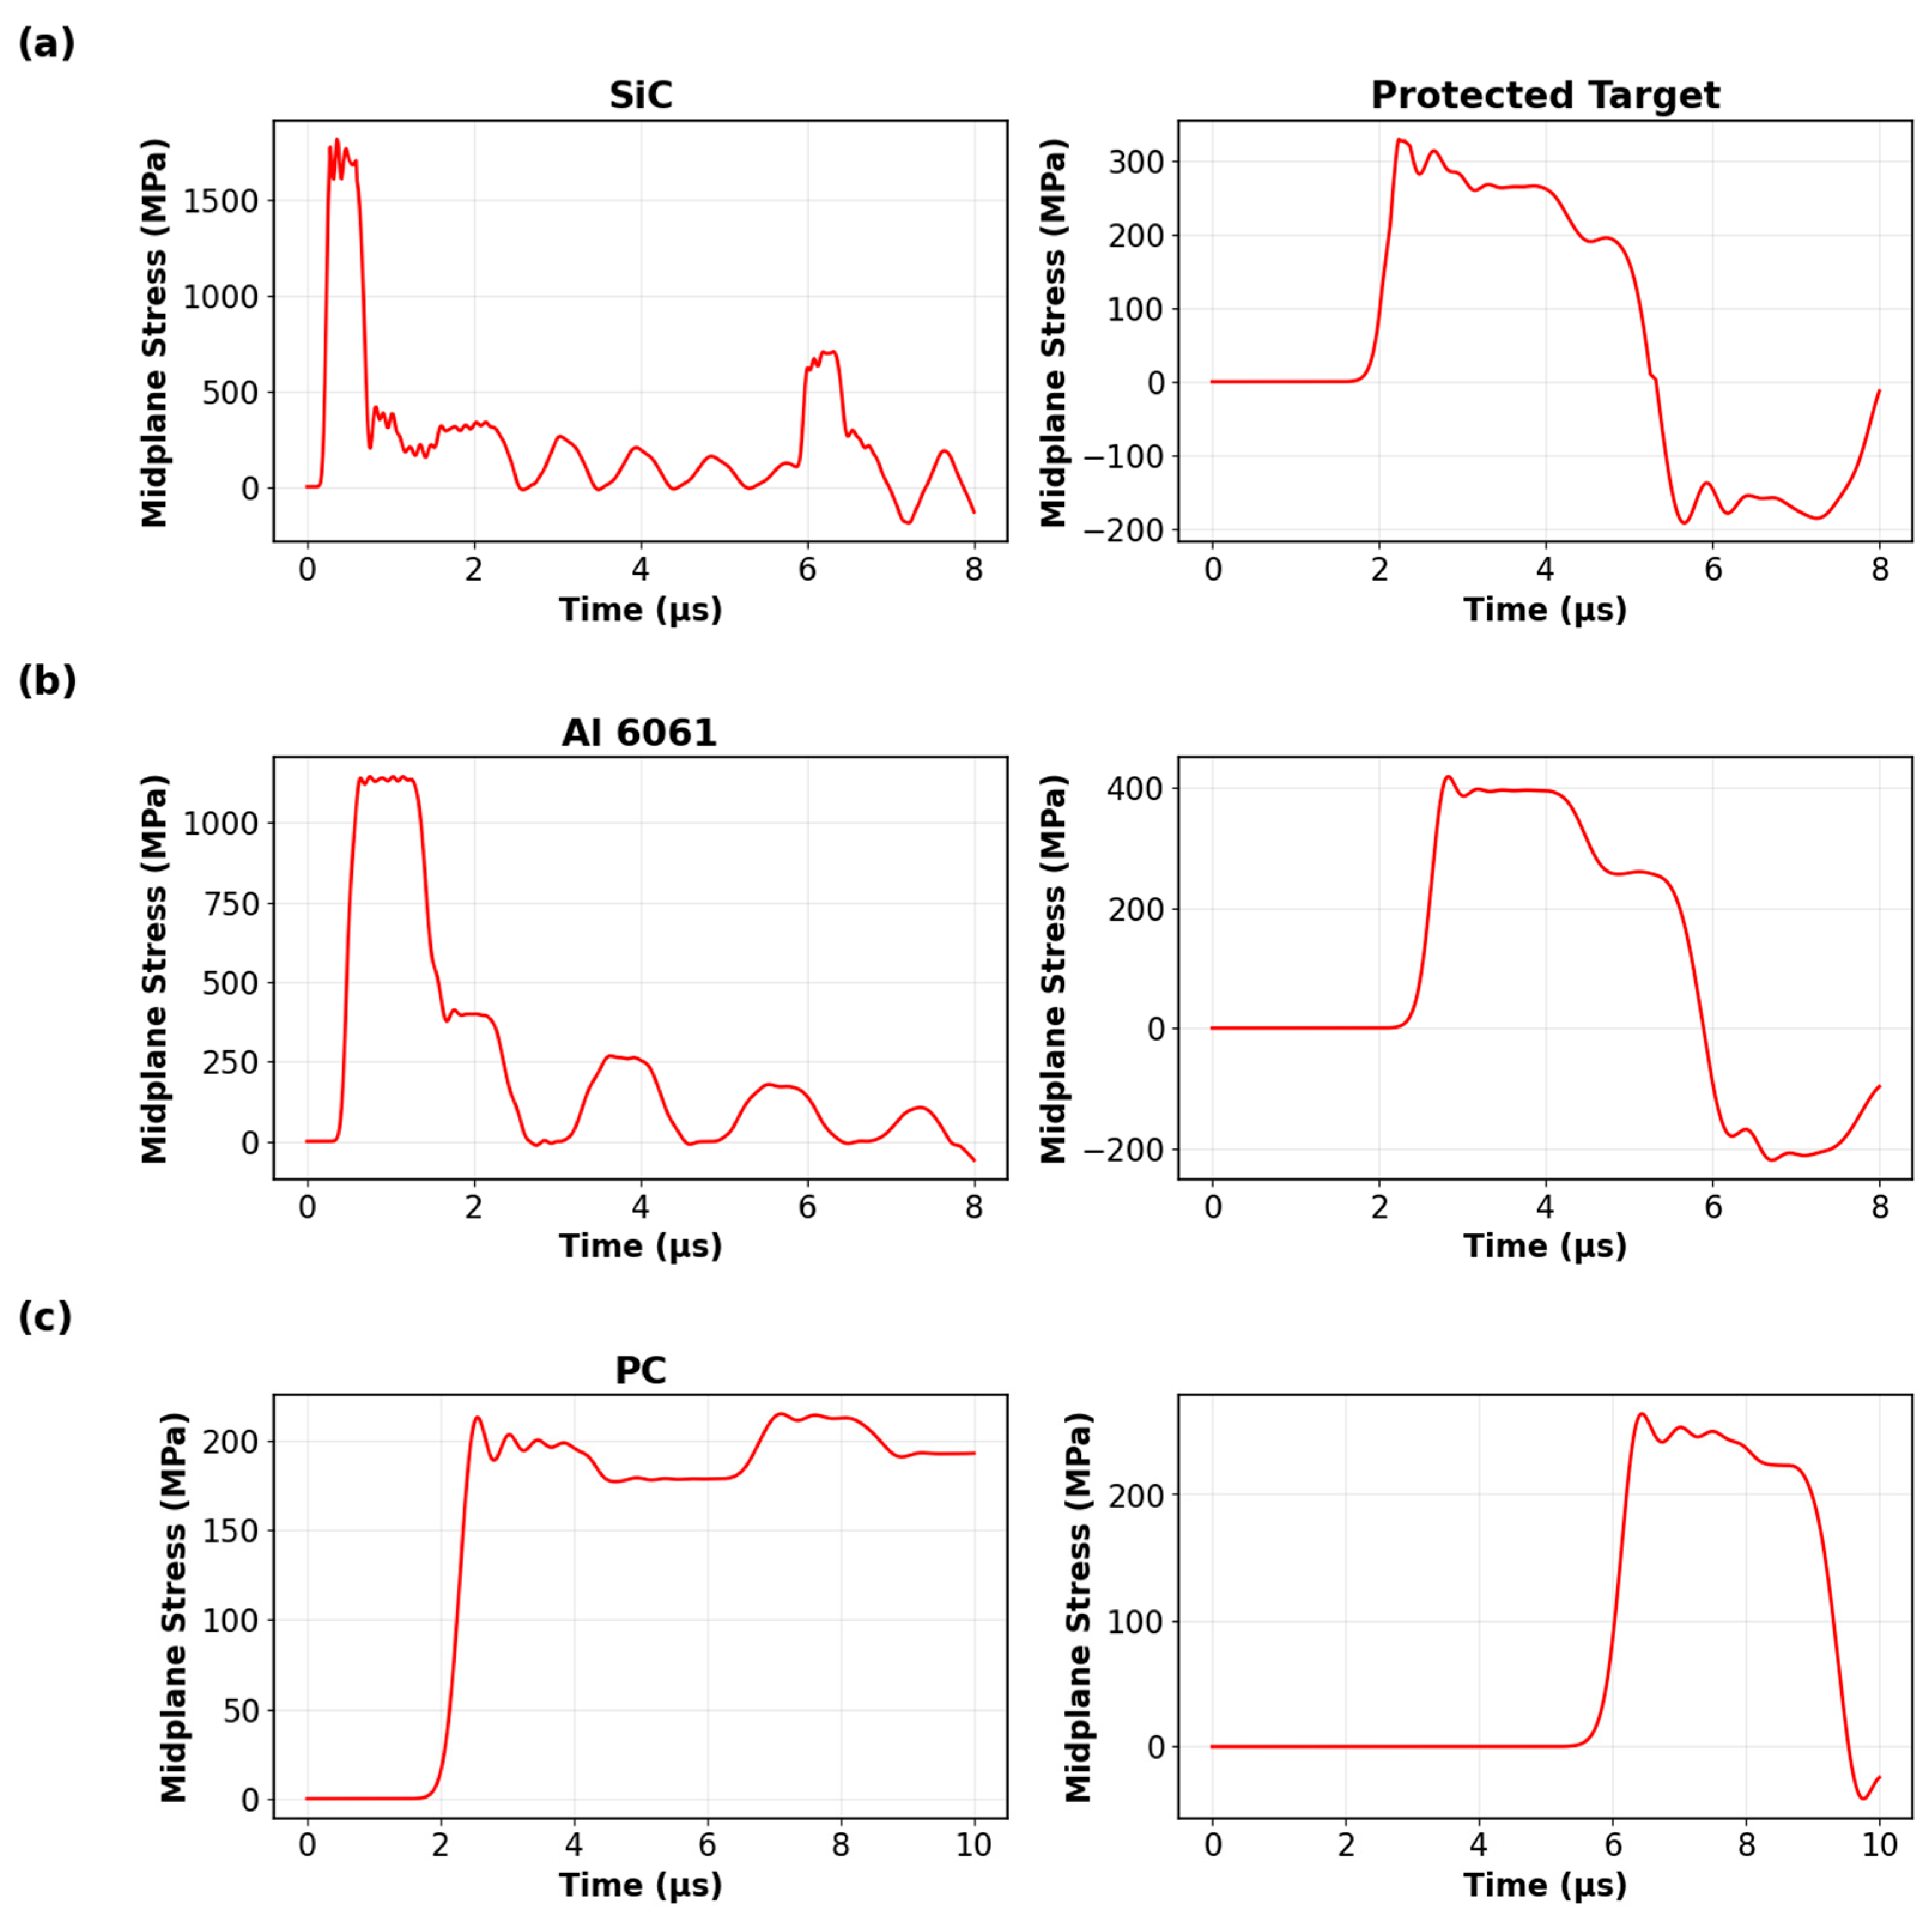
To better understand wave transmission in the protected target under gap conditions, the midplane stress histories without a gap are first examined for a single-layer plate impact configuration, as shown in Figure 4. In this configuration, a copper impactor generates the incident compressive wave, establishing how waves are transmitted and reflected before the introduction of the gap. In the SiC configuration shown in Figure 4a, a high compressive stress of 1.88 GPa is generated within the SiC layer following the impact. Because the impedance of the copper impactor and SiC are closely matched, the magnitude of the reflection coefficient ∣ σ r / σ i ∣ from Equation (3) is small, so only a small portion of the incident wave reflects at the impactor–SiC interface, allowing most of the compressive wave to be transmitted to the SiC layer and produce a sharp wave front. At the SiC-protected target interface, the large impedance mismatch causes the majority of the waves to reflect back into the SiC, while only 319 MPa is transmitted into the protected target. The reflected wave from the SiC-protected interface travels back through the SiC layer toward the copper–SiC interface, where it partially transmits into the copper and partially reflects, producing the oscillatory stress cycles as observed in SiC stress profile. Similarly, in the Al 6061 configuration shown in Figure 4b, a compressive stress of 1.15 GPa is generated at the midplane of the aluminum layer upon impact. The impedance mismatch at the copper–Al 6061 interface is larger than at the copper–SiC interface; the magnitude of the reflection coefficient increases, causing most of the incident compressive wave to be reflected back into the copper, while a smaller portion is transmitted into the aluminum. As the transmitted wave reached the Al 6061–bone interface, the larger impedance difference ( Z protected   target < Z Al ) causes part of the wave to reflect into the aluminum as a release wave, while the remaining portion is transmitted at a stress value of 397 MPa into the protected target.
For the PC layer shown in Figure 4c, the midplane stress response is dominated by the large impedance mismatch at the copper–PC interface. Because the impedance of PC is much lower than that of the copper impactor, the magnitude of the reflection coefficient is large, causing a large portion of the incident compressive wave to reflect back into the copper and limiting the transmitted stress into the polymer to 201 MPa. At the PC–protected target interface, the impedance of the protected target is greater than that of the polymer, resulting in a small reflection coefficient. Consequently, the incident compressive wave remains compressive and weak upon reflection, while a larger fraction of the midplane stress, about 249 MPa, is transmitted into the protective target. Because the reflection at this interface is weak and does not produce strong release wave, the midplane stress history in the polymer appears smooth with only a few oscillations.
Figure 4. Midplane stress histories in the single layer and protected target for single-layer configurations without a gap (a) SiC, (b) Al 6061, and (c) PC. The plot shows stress-wave transmission and reflection in the single-layer-protected target configuration.
Jcs 10 00366 g004
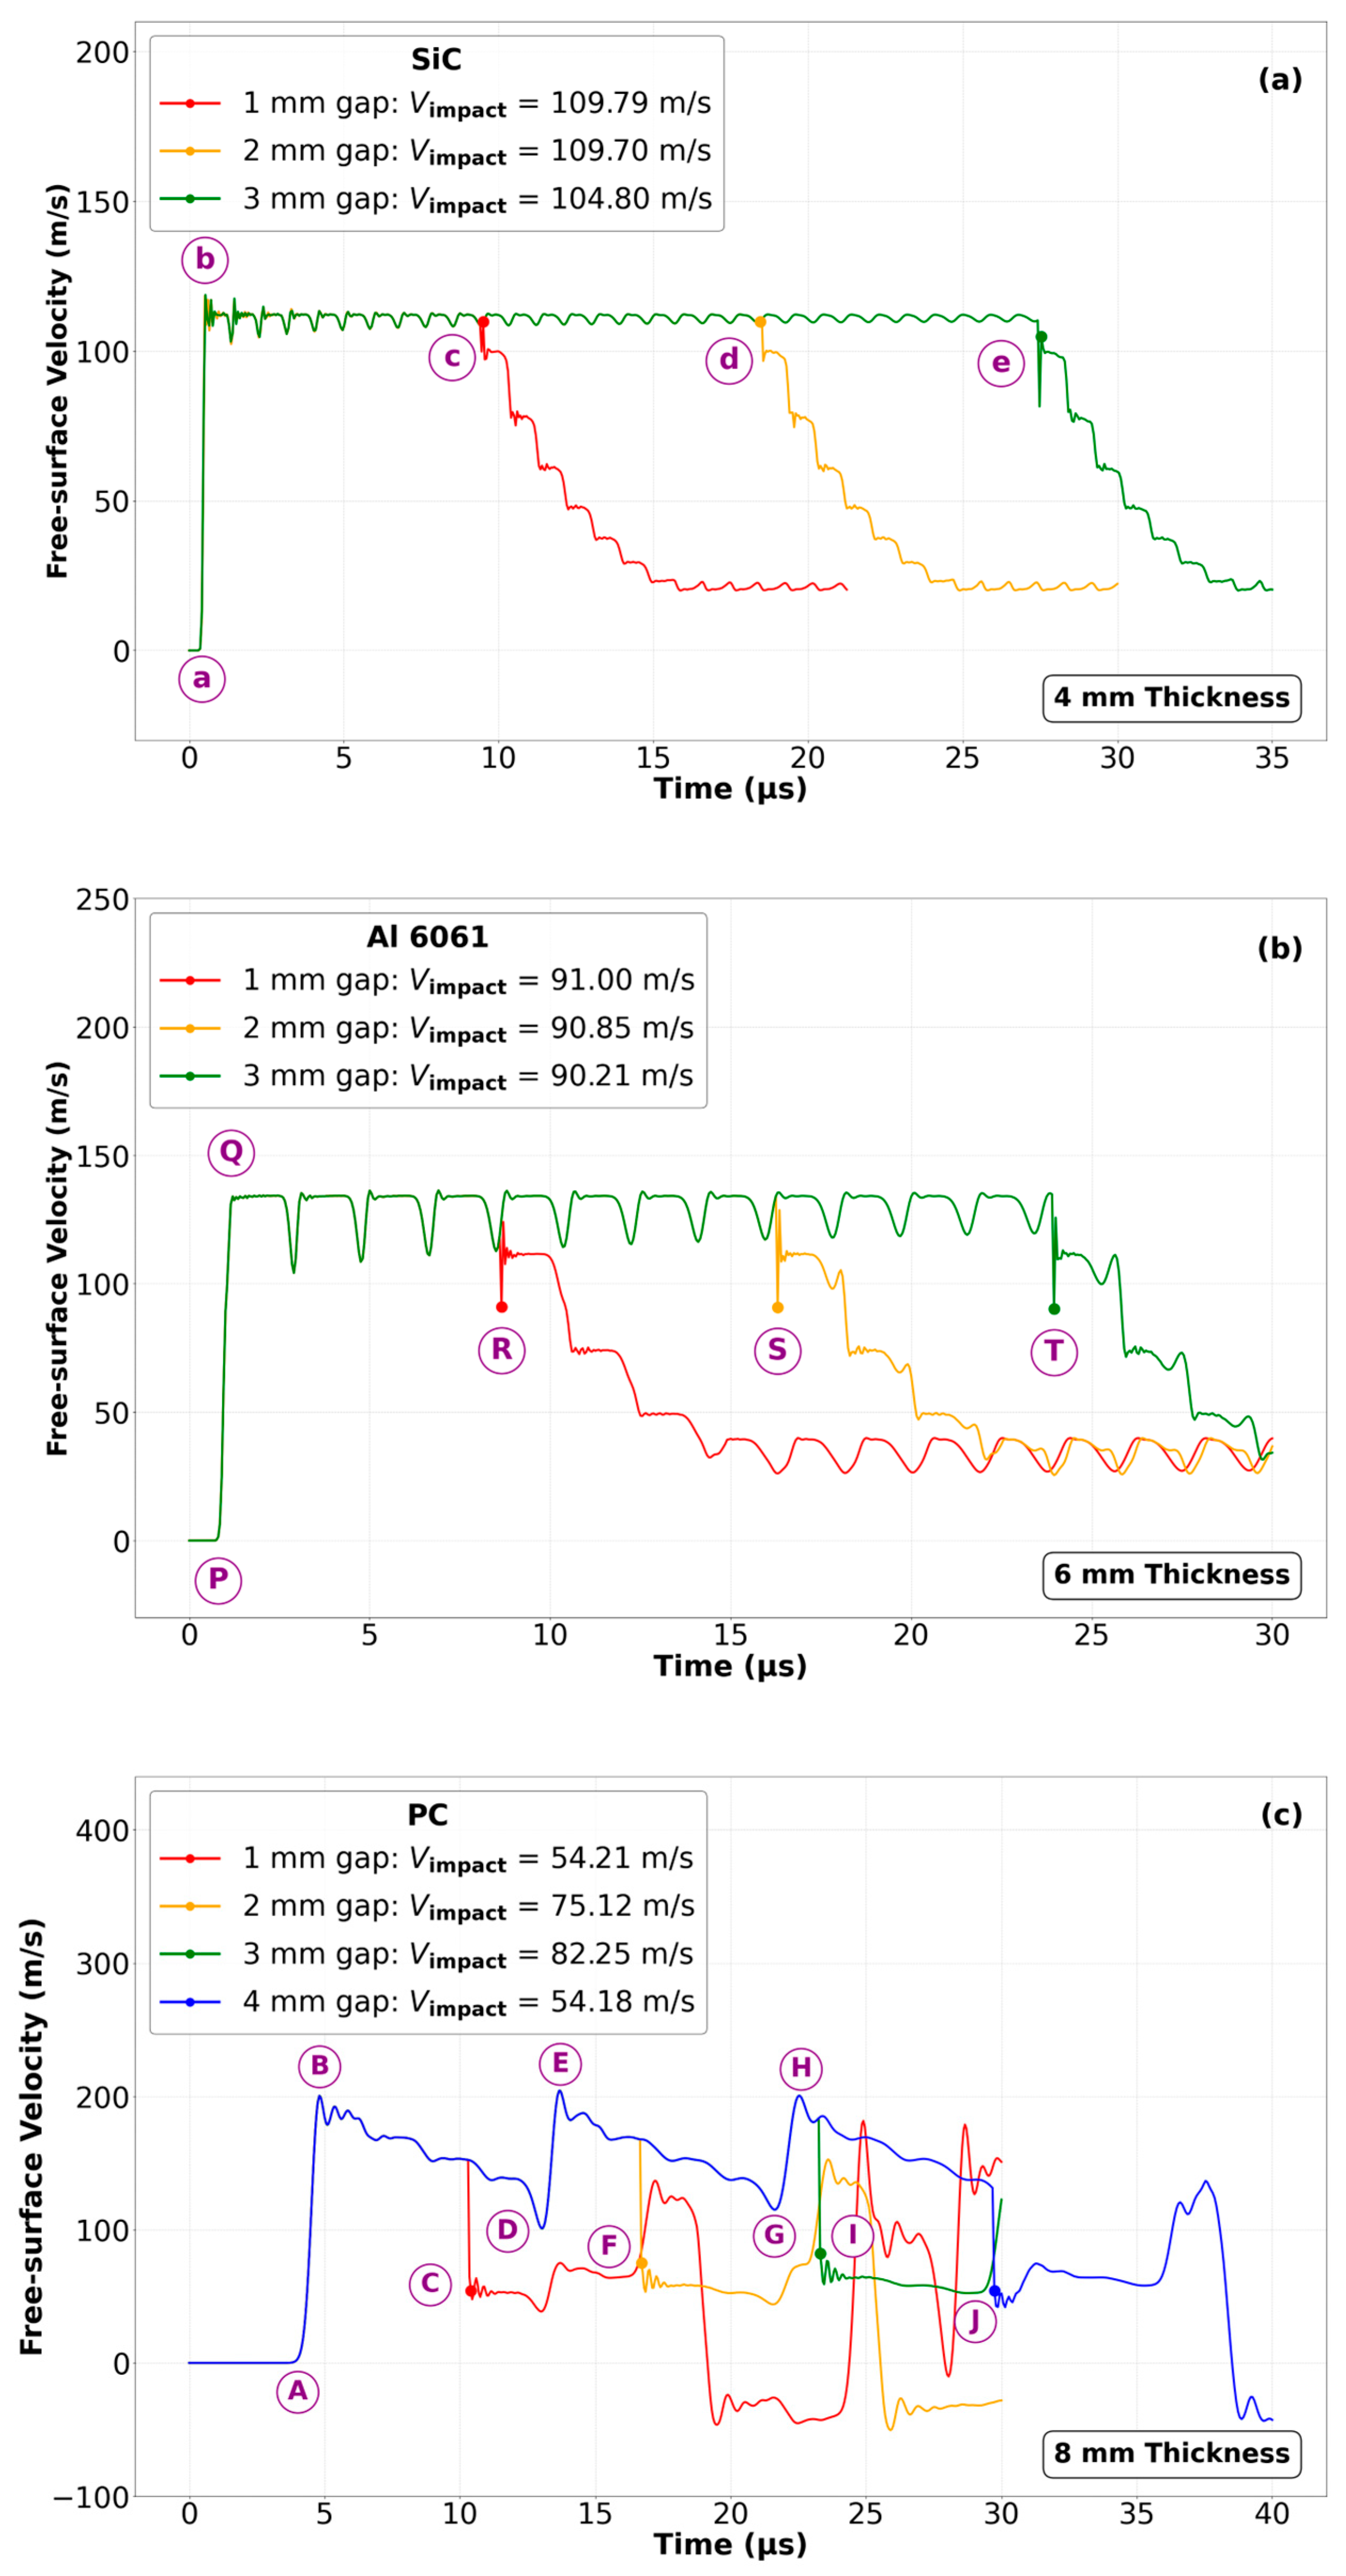
Following the no-gap analysis, a gap is introduced between the single layer and the protected target to investigate how the wave-transmission behavior changes with gap distance. The back surface of a single layer acts as a free surface, generating a reflected wave that propagates back through the layer. Meanwhile, the layer continues moving across the gap before contacting the protected target. As a result, the sequence of wave transmission and reflection before contact differs from that in the no-gap case, influencing the stress and velocity transmitted to the protected target. To further understand the gap-dependent response, the FSV histories are examined, as shown in Figure 5. Because the trends in the midplane velocity of the protected target mirror those of the impact velocity, the FSV history of the single-layer configuration was first investigated for a representative gap distance of 1–3 mm. For the SiC layer shown in Figure 5a, the FSV shows a trend similar to that of midplane velocities, with impact velocities decreasing from 109.79 to 104.80 m/s as the gap increases from 1 to 3 mm. Points c, d, and e in the graph represent the impact velocities at which the SiC contacted the protected target for gap distances of 1, 2, and 3 mm, respectively. At point a, the shock wave generated by the impact reaches the free surface of the SiC, followed by an initial rise in velocity, which indicates the arrival of a compressive wave transmitted after impact. After the initial jump, a series of small oscillations is observed between points b and c as the SiC layer travels across the gap. Due to its high wave speed, the reflected release waves from the free surface catch up with the shock front more quickly. This is why we observe that the FSV exhibits a sharp rise, followed by rapid unloading, with very small oscillations across all gap cases. The reflected release waves from the free surface of SiC propagate through the SiC layer and interact with the compressive wave before contacting the protected target. These interactions reduce the magnitude of the stress wave before the gap is closed. Consequently, the impact velocity at contact is reduced, resulting in reduced transmitted midplane velocity in the protected target.
Moreover, for the Al 6061 layer, the FSV profile in Figure 5b demonstrates the sharp initial rise in velocity followed by a series of oscillations with impact velocities of 91.00, 90.85, and 90.21 m/s, denoted by points R, S, and T, for the gap distances of 1, 2, and 3 mm, respectively. The FSV magnitude and oscillation for Al 6061 differ from those of the SiC layer due to differences in wave speed and impedance. The initial compressive wave reaches the free surface of Al 6061 at point P, followed by a rapid increase in velocity at point Q. When the compressive shock front reaches the Al 6061 free surface, a reflected release wave is generated, and the Al 6061 layer begins to move within the gap. Moreover, significant fluctuations in FSV are observed between Q and R as the wave interacts upon impact. Similar trends are observed for the 2 and 3 mm gaps at points S and T, respectively. This is because Al 6061 has a relatively low wave speed compared with SiC; the release wave from the free surface lags the shock front, leading to multiple wave interactions before impact. These interactions between the compressive wave and the release wave generate fluctuations in the FSV. As the gap increases, the wave travel time increases, and the back surface contacts the protected target later. This longer time reduces the momentum, leading to a gradual decrease in midplane velocity with gap distance.
Finally, the FSV history of the PC layer was studied for a representative gap distance of 1–4 mm, as shown in Figure 5c. At point A, the shock wave generated by the impact reaches the free surface of the PC. Initially, the compressive shock front causes the particle velocity to rise sharply, reaching point B. The gap distance is small in the 1 mm case, allowing the PC to contact the target quickly. The gap is closed at point C for the 1 mm case with an impact velocity of 54.21 m/s. The PC impacts the target at the beginning of the unloading phase, resulting in lower impact velocity. For a 2 mm gap, the PC has more time to cover, allowing the reflected waves to return to the free surface before contact. The first major unloading occurs at point D, when the release wave is reflected from the copper-PC interface with the same stress state ( Z C u > Z P C ) and reaches the PC free surface, reducing velocity magnitude. However, from point D to E, the release wave becomes compressive upon reflection from the PC’s free surface. This reflected compressive wave reaches the copper–PC interface and returns to the free surface of the PC as a compressive wave ( Z C u > Z P C ), increasing the free-surface velocity at point E. Due to wave interaction, the PC surface continues to accelerate and contacts the target at point F at an impact velocity of 75.12 m/s. The compression wave at point E occurs close to the time of impact, and the polymer surface has insufficient time to unload, leading to an increase in impact velocity compared to the 1 mm case. At a 3 mm gap, the free surface of the PC layer travels more before contacting the protected target than in the 2 and 1 mm cases. After the initial impact, the FSV curve shows a strong unloading stage (larger velocity magnitude) at G than at D. This occurs because the increased travel time allows additional wave reflection within the PC layer to reach its free surface before contacting the protected target. The release wave responsible for the velocity to decrease at G reflects from the PC free surface as a compressive wave and propagates toward the copper–PC interface. This reflected wave remains compressive due to the impedance factor and returns to the PC free surface, producing a high velocity observed at H. As a result, the PC surface accelerates toward the protected target and contacts it at point I with an impact velocity of 82.25 m/s. Because contact occurs near this velocity peak at H, the impact velocity reaches its maximum for the considered gap. However, for a 4 mm gap, the PC layer travels farther before contacting the protected target. After the velocity peak at H, the compressive wave responsible for this increase reflects from the PC’s free surface as a release wave and propagates toward the copper-PC interface. Because the impedance of copper is higher than that of PC, the reflected wave from the copper-PC interface remains release wave and returns to the PC’s free surface. This release wave reduces the free-surface velocity further before contact, so the PC’s free surface approaches the target more slowly, and the impact velocity decreases to 54.18 m/s at J. Thus, the impact velocity trend for 1–4 mm gaps is consistent with the corresponding midplane velocity response in the protected target shown in Figure 3c.
Figure 5. FSV profiles for (a) SiC, (b) Al 6061, (c) PC for gap distances of 1–3 mm.
Jcs 10 00366 g005

3.2. Effect of Gap Distance on the Impact Response of CPM Layer

The numerical investigation in this simulation reveals that the influence of the gap distance on the transmitted stress and velocity in a multilayered composite is far more complex than a simple geometric interpretation would suggest. It depends on the impedance mismatches, wave reflection at interfaces, dispersion and relaxation within the polymer layer, complex wave interactions, and the dynamic closure of the gap under impact loading. The impact of OFHC-Cu on the composite armor layer generates an initial compressive wave that propagates through the SiC and PC layers before reaching the back surface of the Al 6061. The gap between the Al 6061 and the protected target creates a void, causing the back surface of the Al 6061 to behave as a free surface. Thus, when the compressive stress waves reach the free surface, a release wave is reflected back into Al 6061. The release wave from the Al 6061 free surface interacts with the original compressive waves, causing the velocity to drop at the free surface of the Al 6061. Moreover, when the release waves return to the Al 6061–PC interface, the large impedance mismatch between Al 6061 (high impedance) and PC (low impedance) reflects the waves back into Al 6061 as a secondary compressive wave. Additionally, the compressive wave generated by the impactor upon initial impact continues to load the composite layers. This process continues until a release wave is generated at the impactor’s back surface, causing the impactor to unload. At the PC–Al 6061 interface, the shock wave from the PC layer separates into two waves: a transmitted wave and a reflected wave. Here, part of the shock wave is transmitted into the Al 6061 layer, while the remaining portion is reflected as a compressive wave. These compressive waves are relatively weak compared with the primary shock waves but can contribute to the subsequent stress state in the Al 6061 layer. The interaction of the release wave from the Al 6061 free surface, the reflected waves from the impedance mismatch, and the initial loading from the impactor produces a cycle of compression and release waves that influence the Al 6061’s motion before the gap closes.
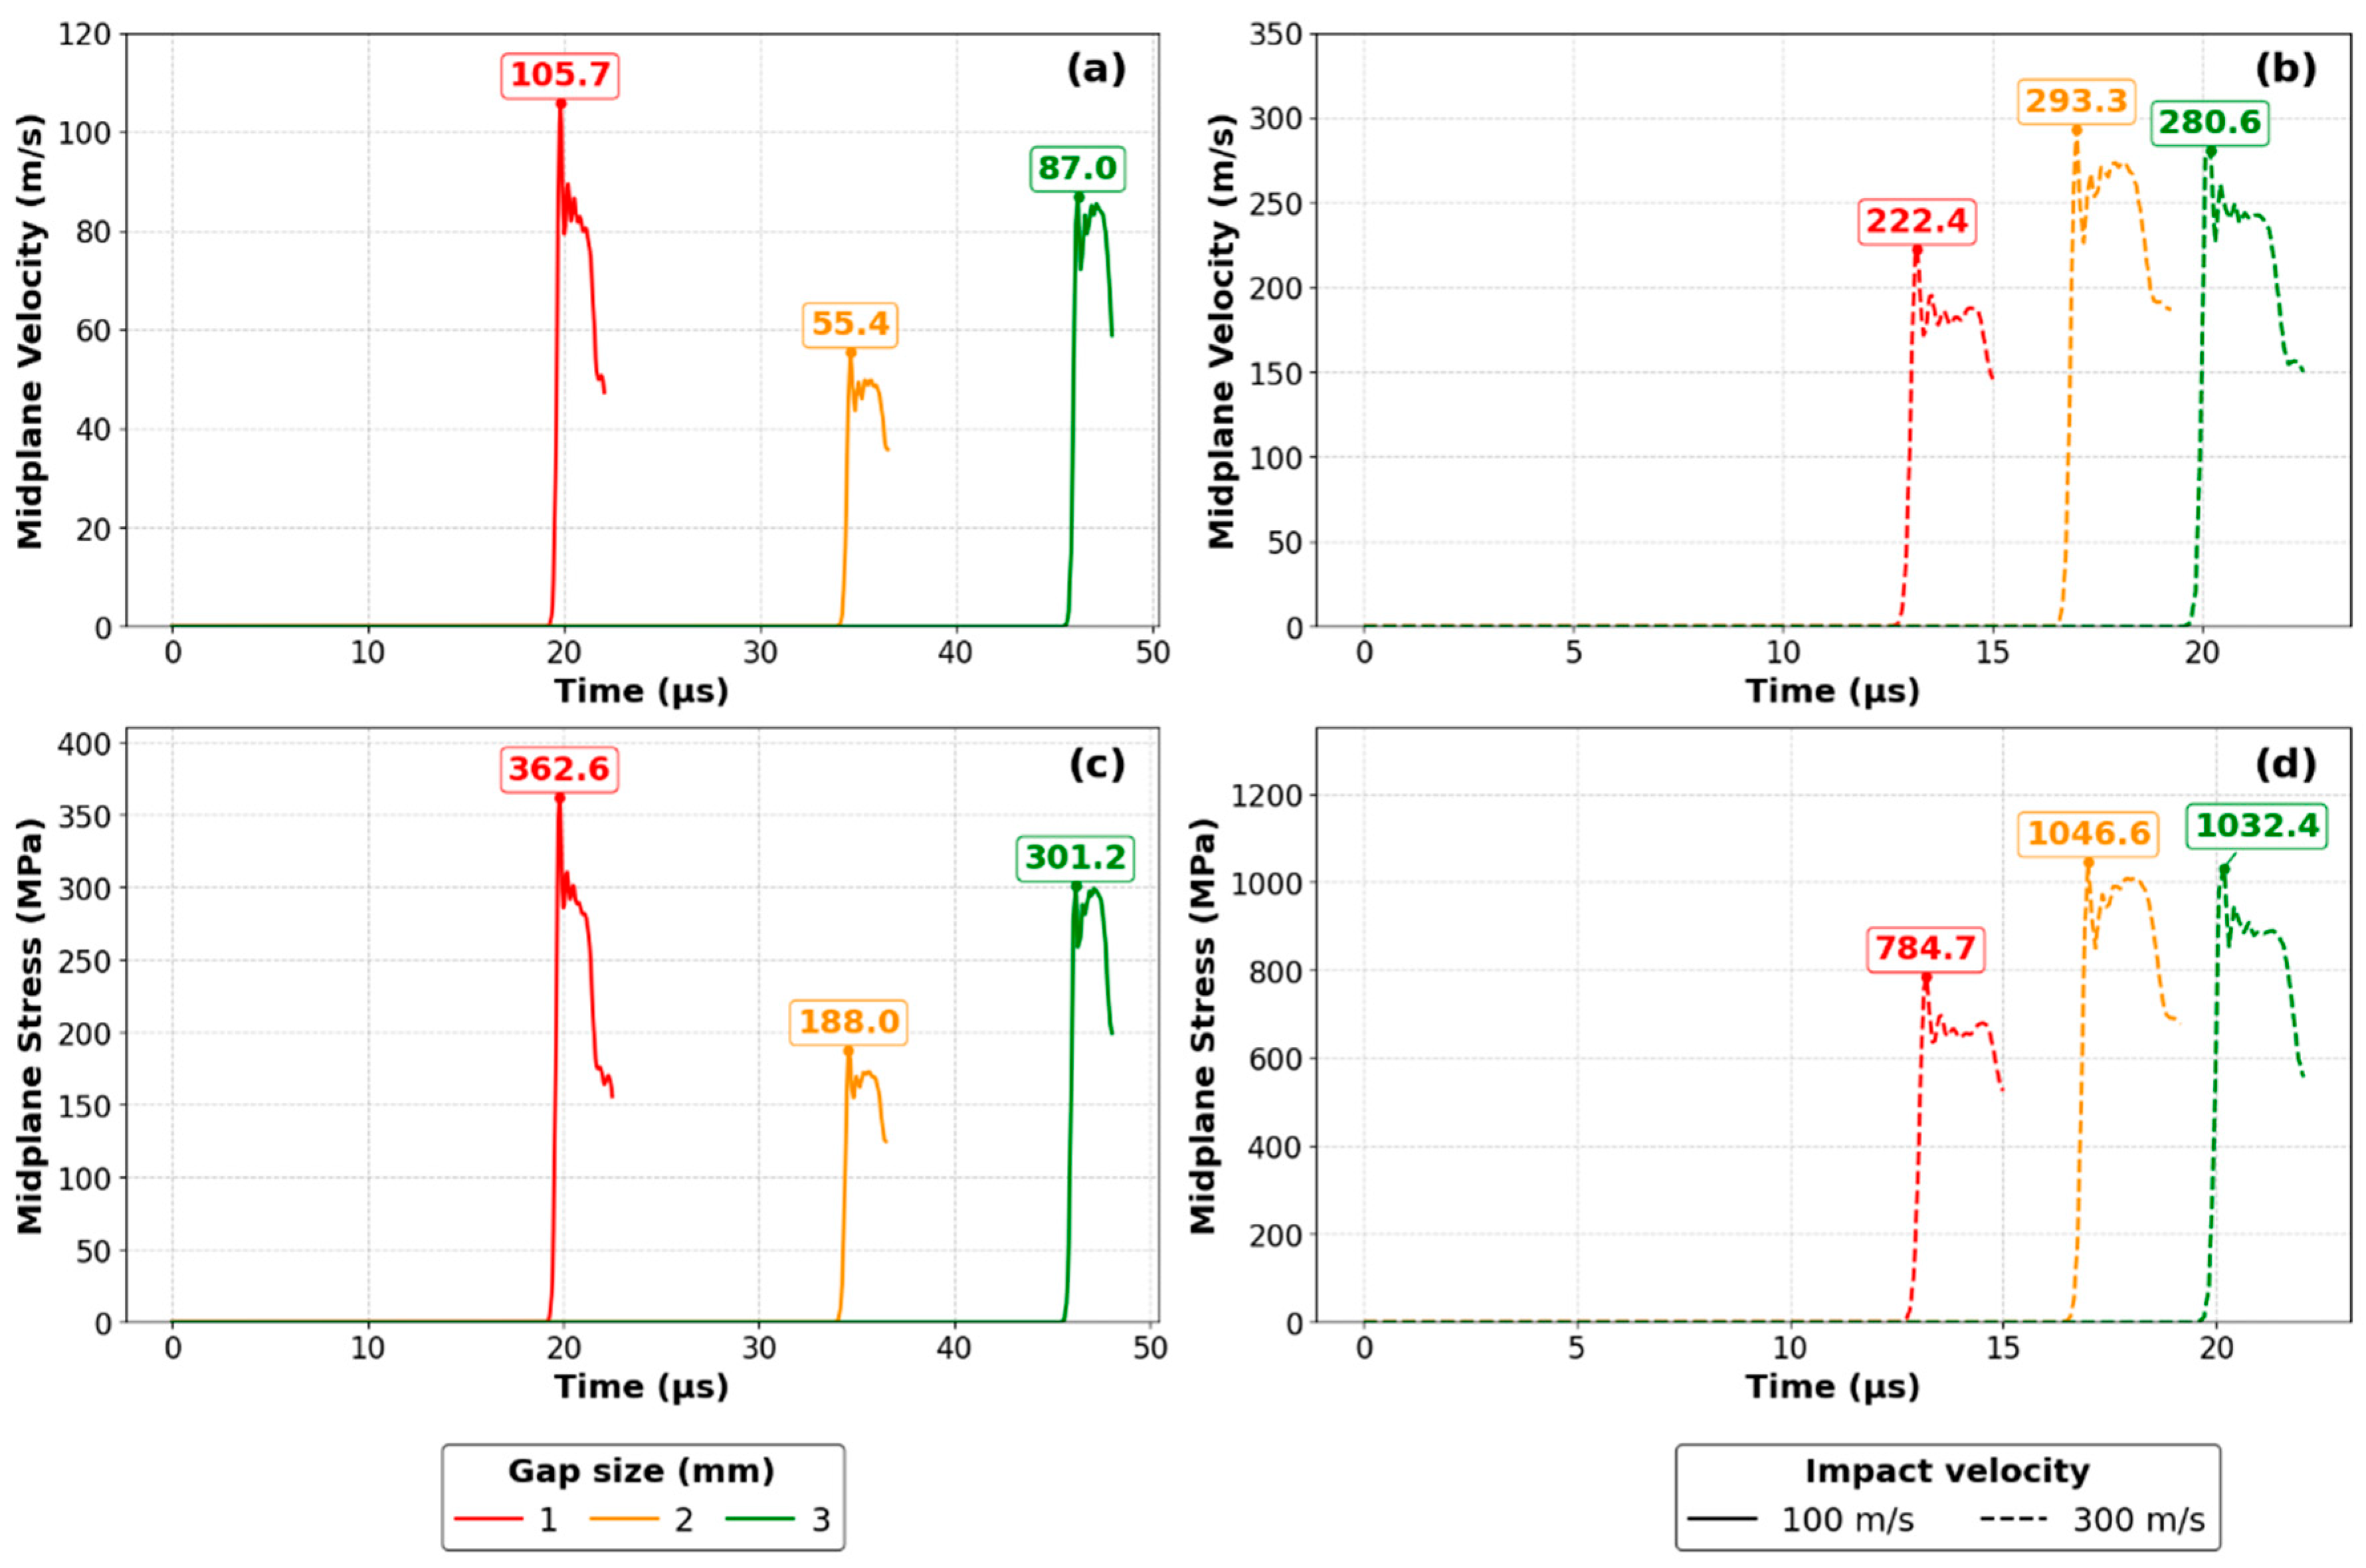
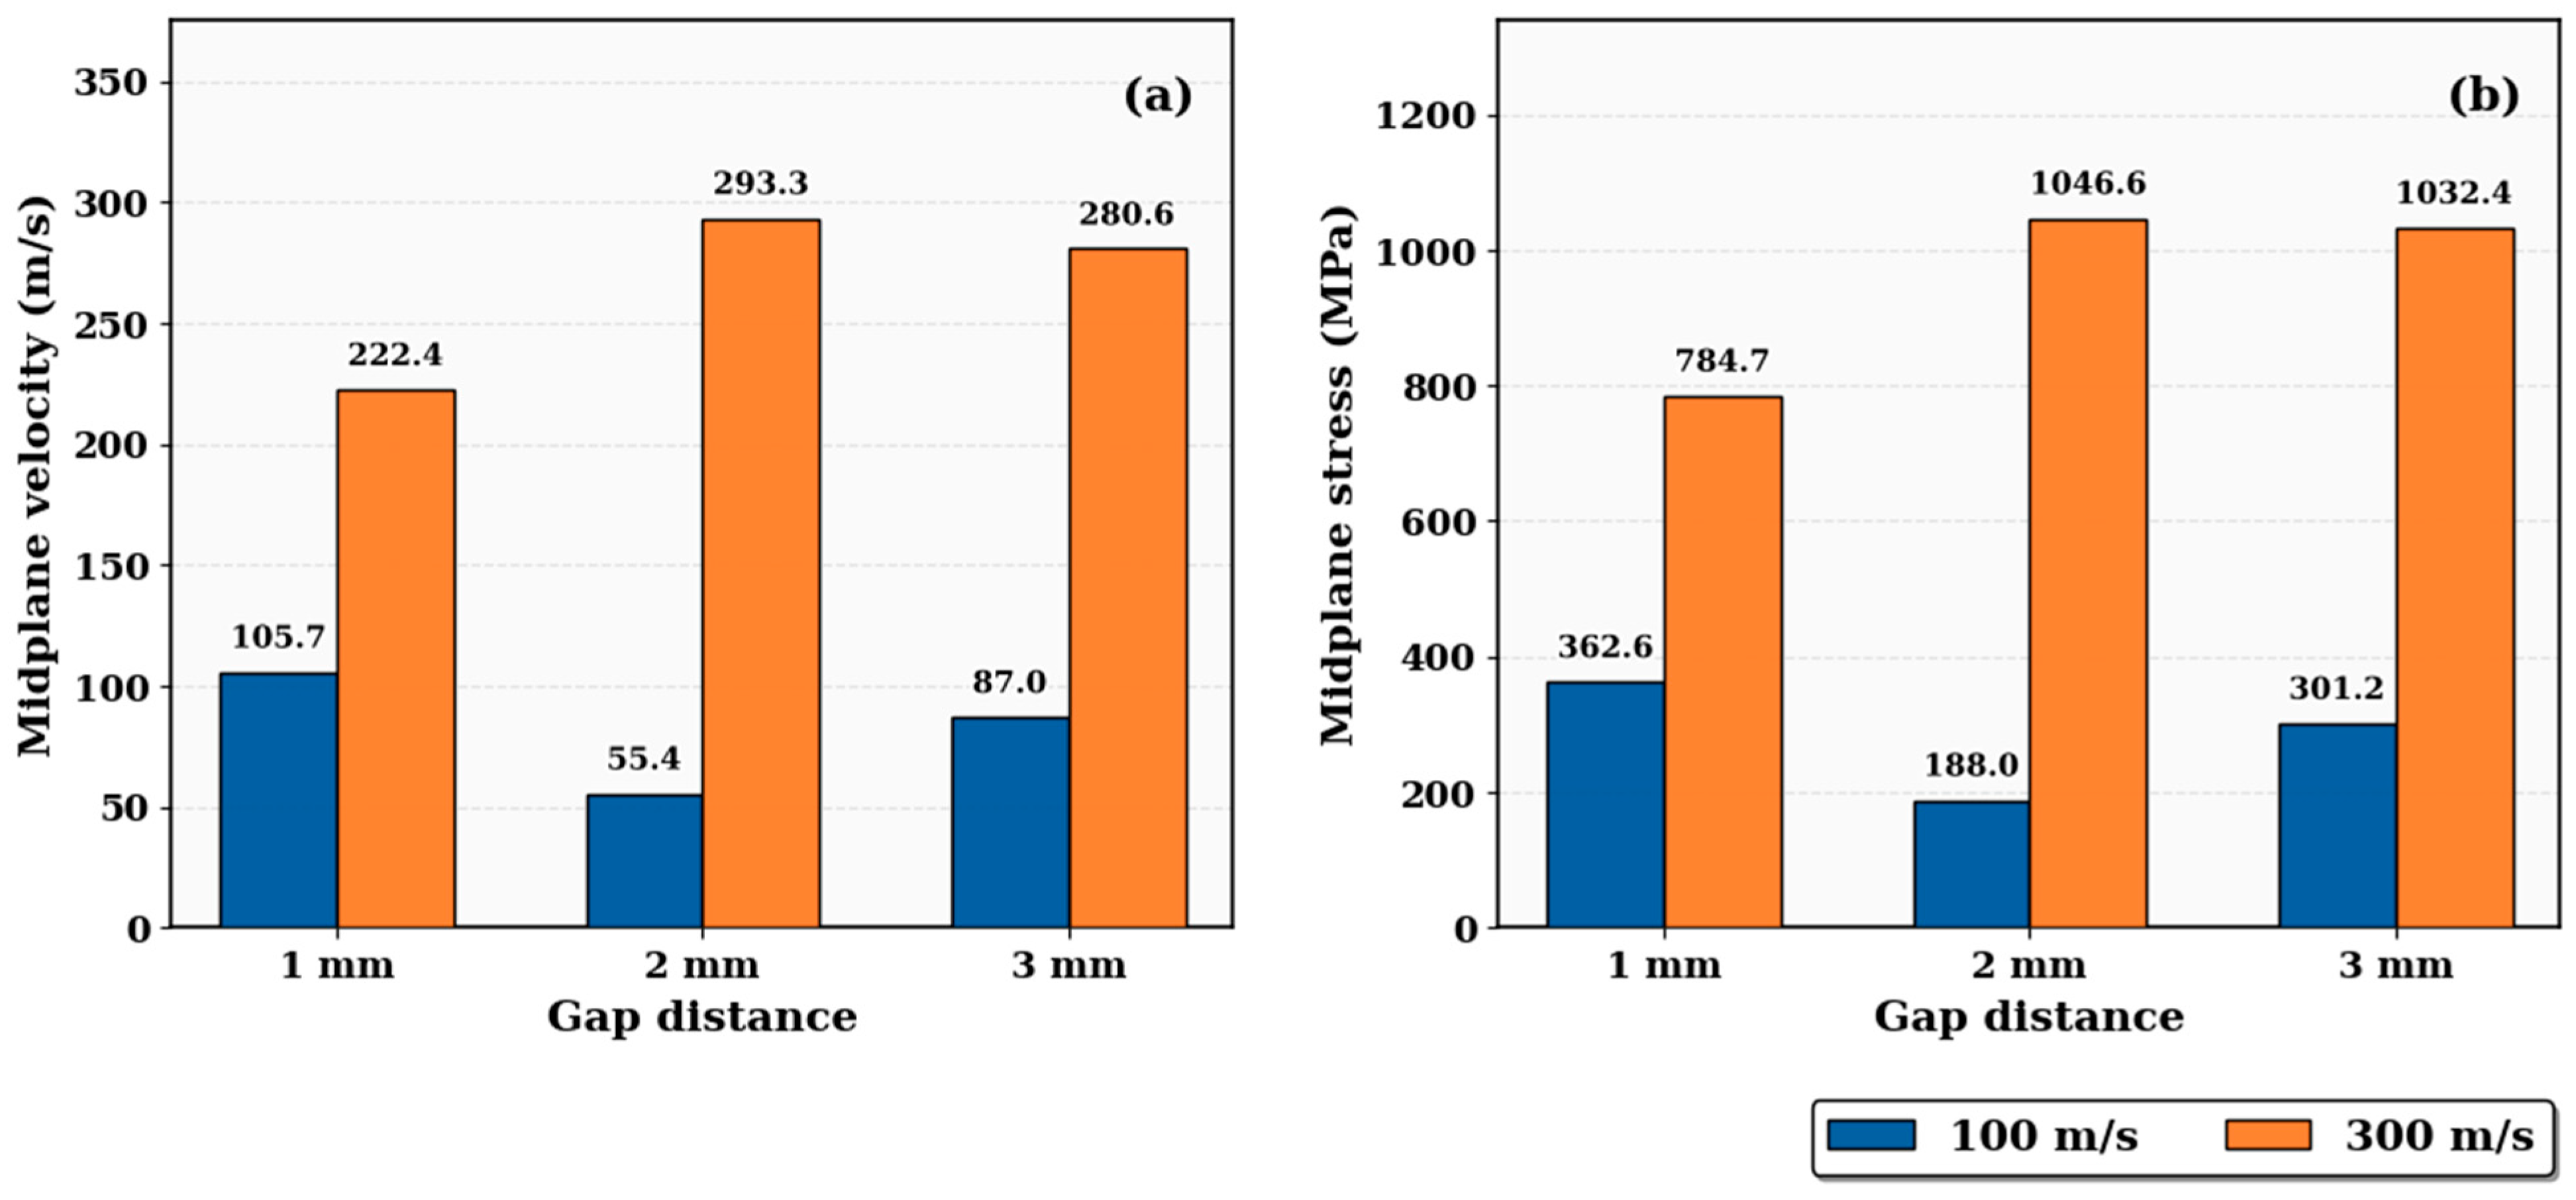
The midplane velocity response of the protected target for all gap distances up to 10 mm is shown in Figure 3d. Because midplane velocities were computed for each configuration and the overall trends are consistent across gap distances, the 1, 2, and 3 mm cases were selected as representative profiles. The midplane velocity histories and corresponding stress histories of the protected target under different impactor velocities are presented in Figure 6. For the lower impactor velocity of 100 m/s, the midplane response is governed primarily by the elastic wave propagation, where the transmitted loading depends upon the relative arrival of compressive and release waves within the composite layer. In this regime, the results demonstrate that the 1 mm gap yields the highest midplane velocity (105.7 m/s), the 2 mm gap yields the lowest (55.4 m/s), and the 3 mm gap yields a moderate midplane velocity (87 m/s). Moreover, the stress response at the midplane of the protected target follows a pattern like that of the midplane velocity profile. The midplane stress for the 1, 2, and 3 mm gap distances are 362.6, 188.0, and 301.2 MPa, respectively. To examine how the gap effect evolves under higher loading conditions, an additional impactor velocity of 300 m/s is considered. At the impactor velocity of 300 m/s, the trend changes, with the midplane velocity increasing to 293.3 m/s for the 2 mm gap and about 280.6 m/s for the 3 mm gap, while the 1 mm case shows a lower value of 222.4 m/s, and the midplane stress follows the same trend. The difference arises because the response is no longer governed only by elastic wave propagation, but by plastic deformation within the layers at an impactor velocity of 300 m/s. At high impactor velocity, the composite layer, particularly PC and Al 6061, undergoes plastic deformation once the stress exceeds the yield strength, leading to the formation of a plastic wave that travels behind the initial elastic shock waves. The presence of both elastic and plastic waves alters the timing and strength of wave reflection and transmission before they impact the protected target. As a result, the wave interactions within the composite layer differ from those observed at 100 m/s. The combined effects of elastic and plastic wave propagation modify the velocity and stress history within the composite layer, leading to differences in the magnitude and timing of the loading transmitted to the protected target. Consequently, both the midplane velocity and stress response show a different gap-dependent trend compared to the 100 m/s impact condition. The analysis at 300 m/s is included to show how the gap effect evolves at higher impactor velocity, where elastic–plastic wave propagation becomes important. However, since a detailed analysis of plastic wave behavior is beyond the scope of the present study, the following analysis focuses on the 100 m/s impact condition. A summary of the midplane velocity and stress response of the protected target for CPM configuration at impactor velocities of 100 m/s and 300 m/s is presented in Figure 7.
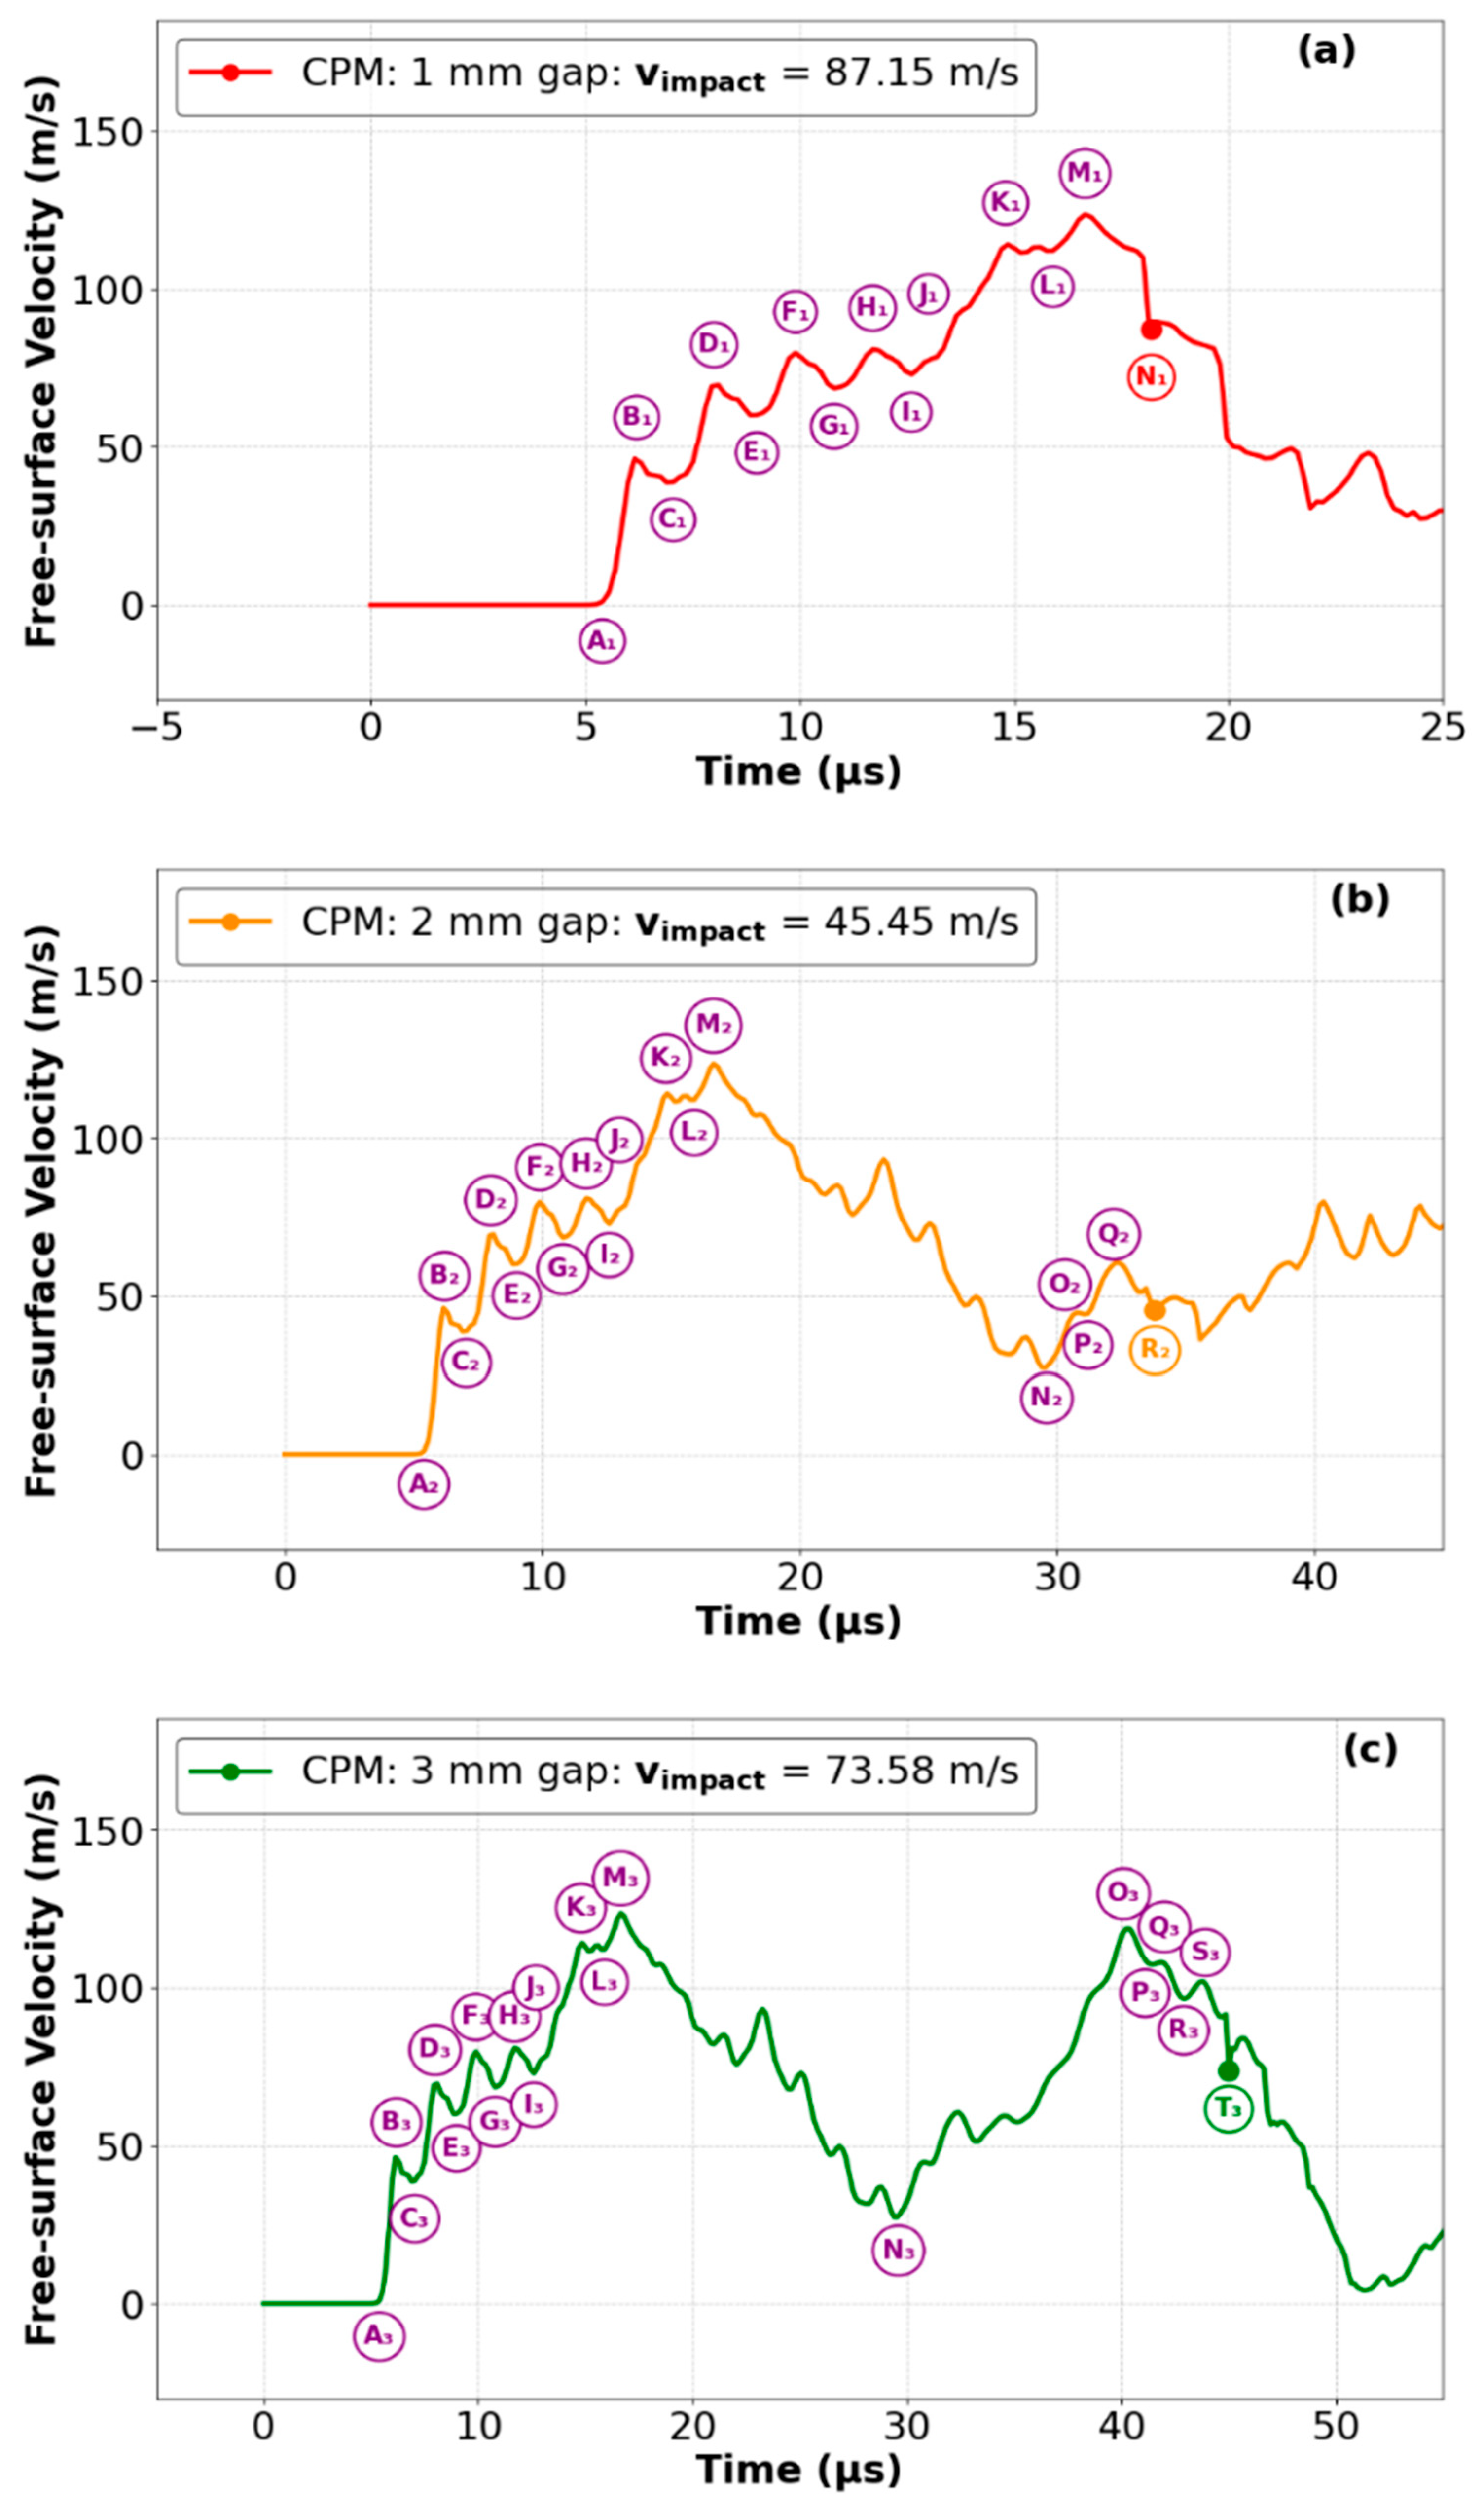
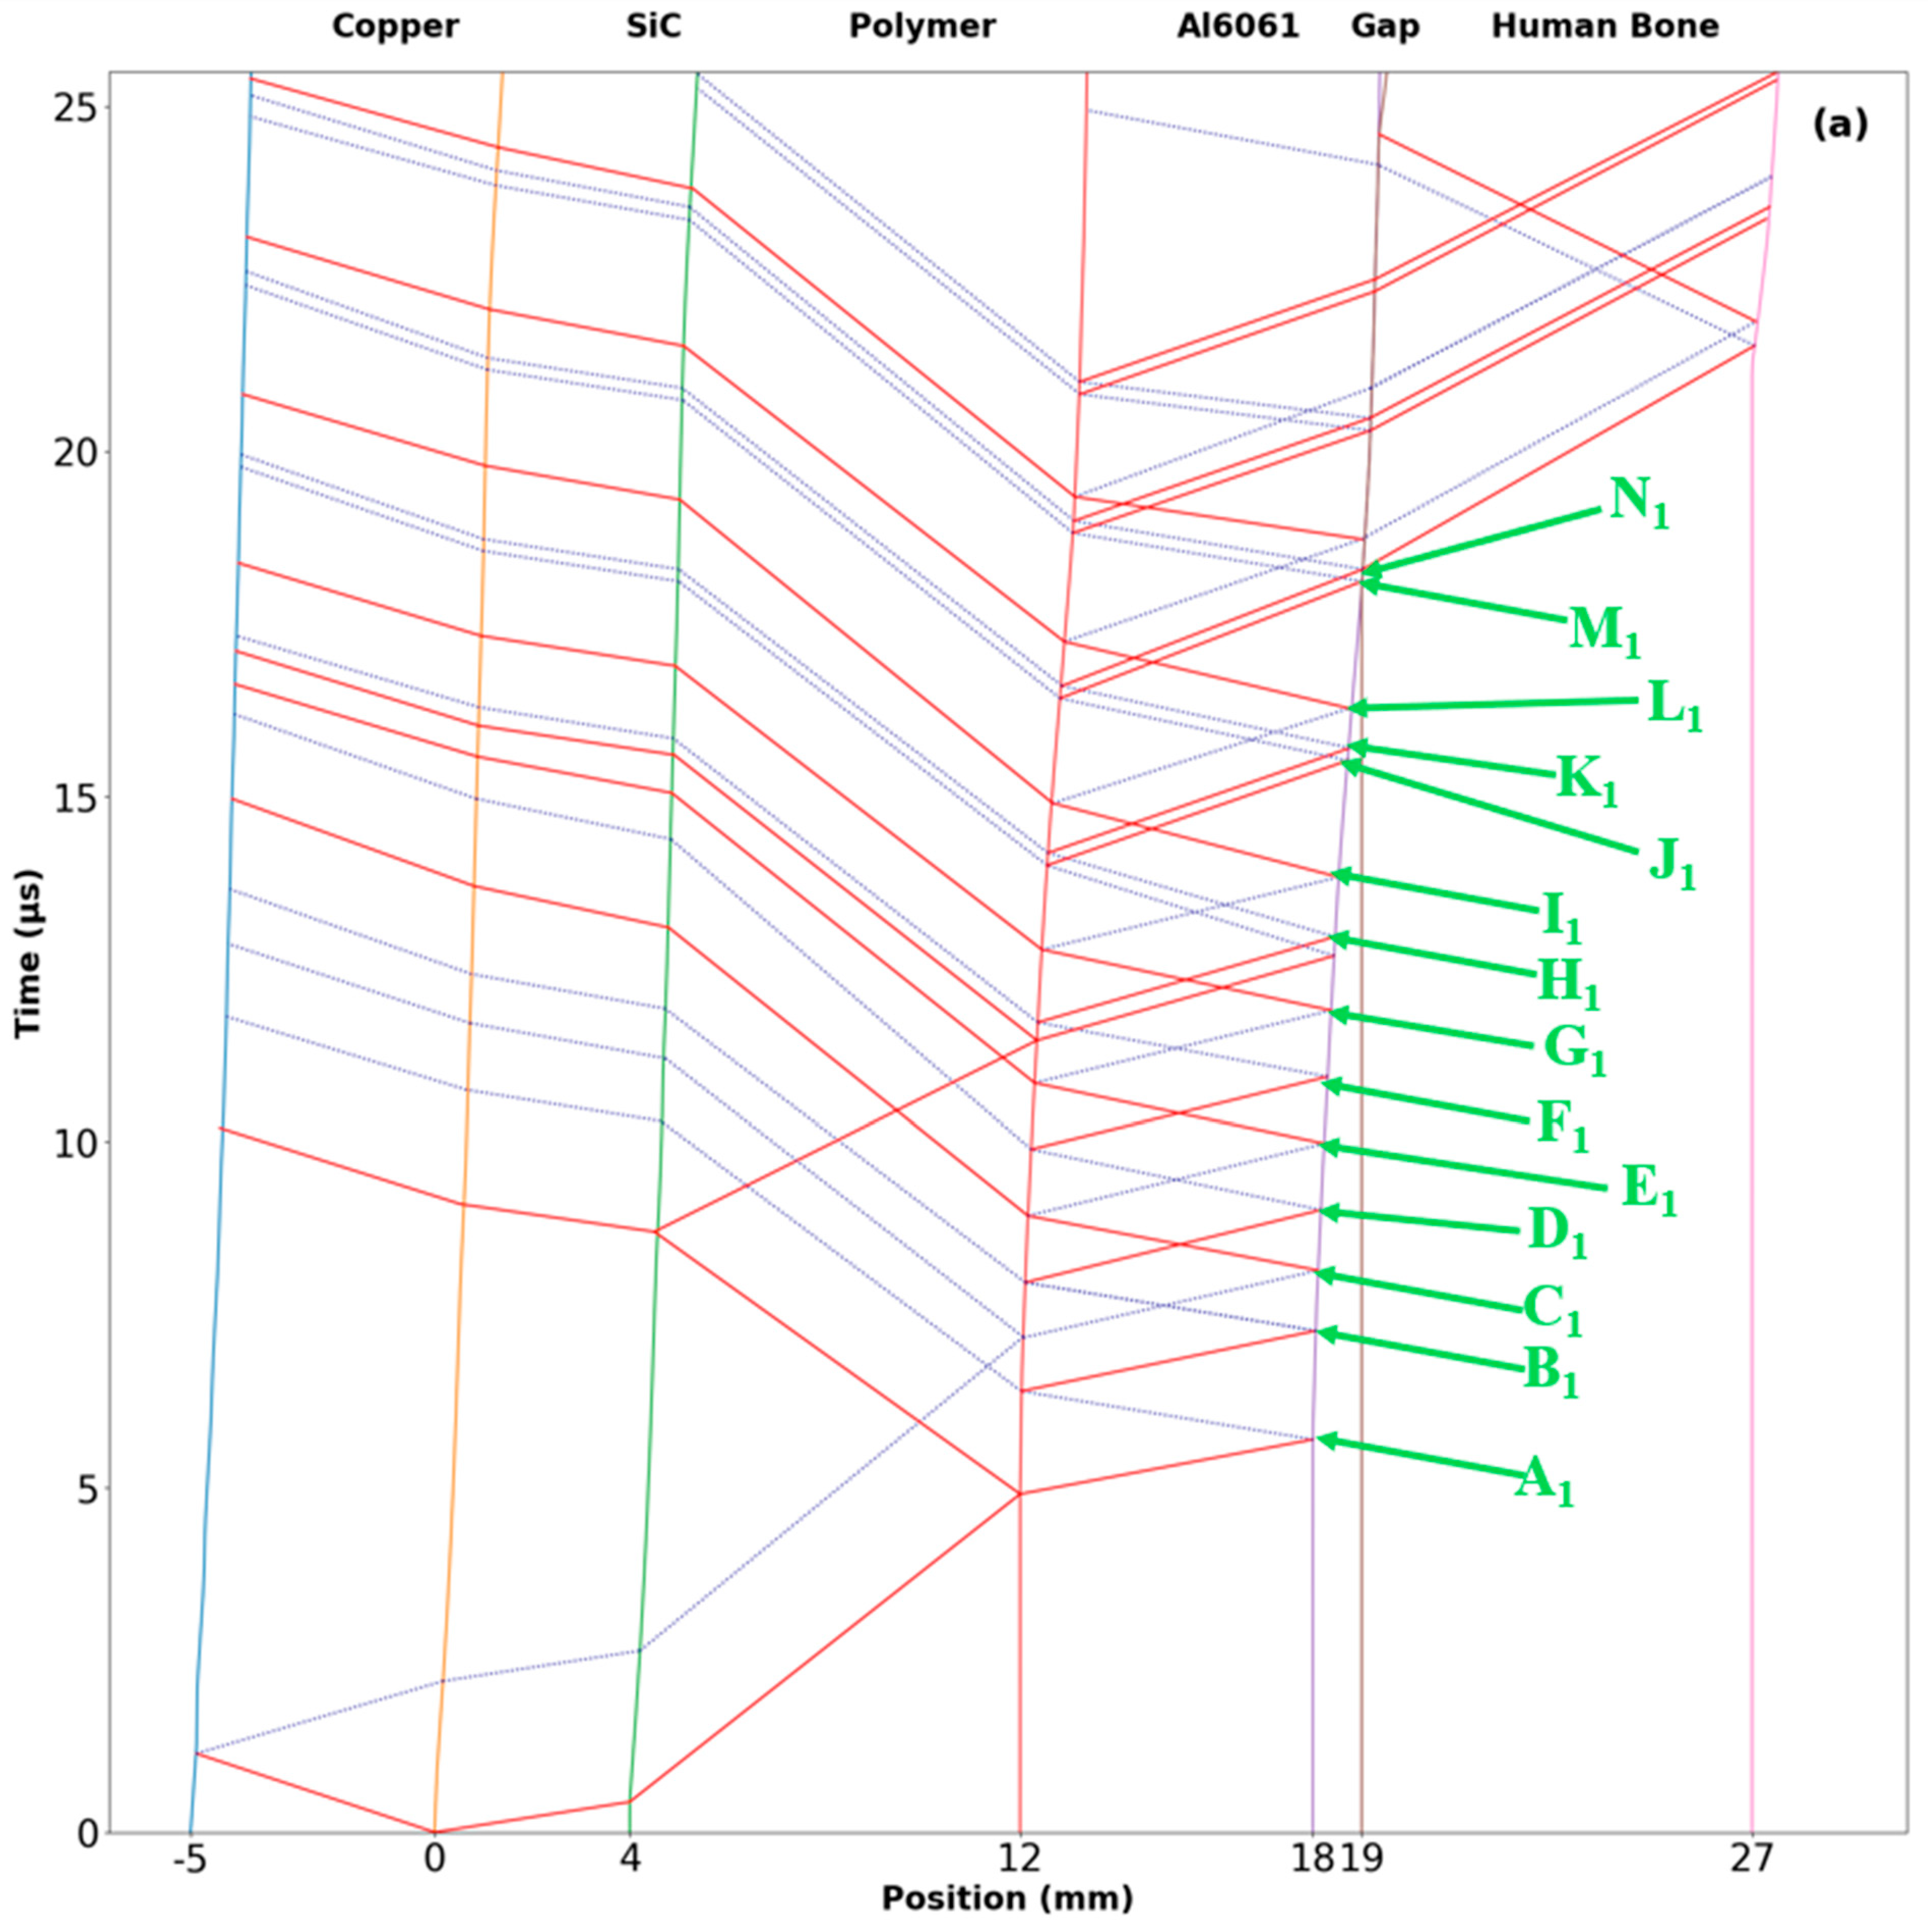
The deviation in the trend of the midplane velocity and stress history under an impactor velocity of 100 m/s can be explained by the free-surface velocity of Al 6061, as shown in Figure 8. The FSV trends for the three gap distances shown in Figure 8 can be understood by examining the wave interactions in the x-t diagrams presented in Figure 9. The x-t diagram shows wave transmission and reflection near the gap and within the aluminum layer. The analysis focuses on wave interactions within the aluminum layer, at the aluminum–gap interface, and their influence on the loading transmitted to the protected target after gap closure. To reduce the complexity of wave interactions, reflections from the SiC and PC layers are omitted, and the x-t diagram is limited to the region that governs the gap response. The free-surface velocity history for the composite-layer assembly at gap distances of 1, 2, and 3 mm, together with the x-t diagram, provides a complete picture of the complex wave interactions that influence the transmitted loading on the protected target. Each rise in the FSV profile represents a compressive wave (solid lines in the x-t diagram), while each drop represents a release wave (dashed lines). In the 1 mm gap case, at point A1, the first compressive wave reaches the Al 6061 free surface after impact, resulting in a slight initial increase in the free-surface velocity. The FSV begins to rise from point A1 to B1 when the first strong compressive wave arrives at the Al 6061 free surface, which appears as a solid line in the x-t diagram. The subsequent rise in FSV continues through D1, F1, H1, and J1, and finally reaches a maximum velocity at M1 (123 m/s) because of the compressive wave traveling from the PC–Al 6061 interface toward the Al 6061 free surface. Between arrivals of compressive waves, release waves reach the free surface at points C1, E1, G1, I1, and L1, slowing the increase in FSV. These release waves are not strong enough to reduce the rise in velocity because the subsequent compressive waves are stronger and arrive sooner. As a result, the FSV continues to rise with small oscillations, reaching the maximum peak at M1 when the strongest compressive wave arrives. Moreover, the CPM layers continue to move forward after experiencing strong loading at M1, followed by a weak release wave, closing the gap at around 18.15 µs with an impact velocity of 87 m/s at N1.
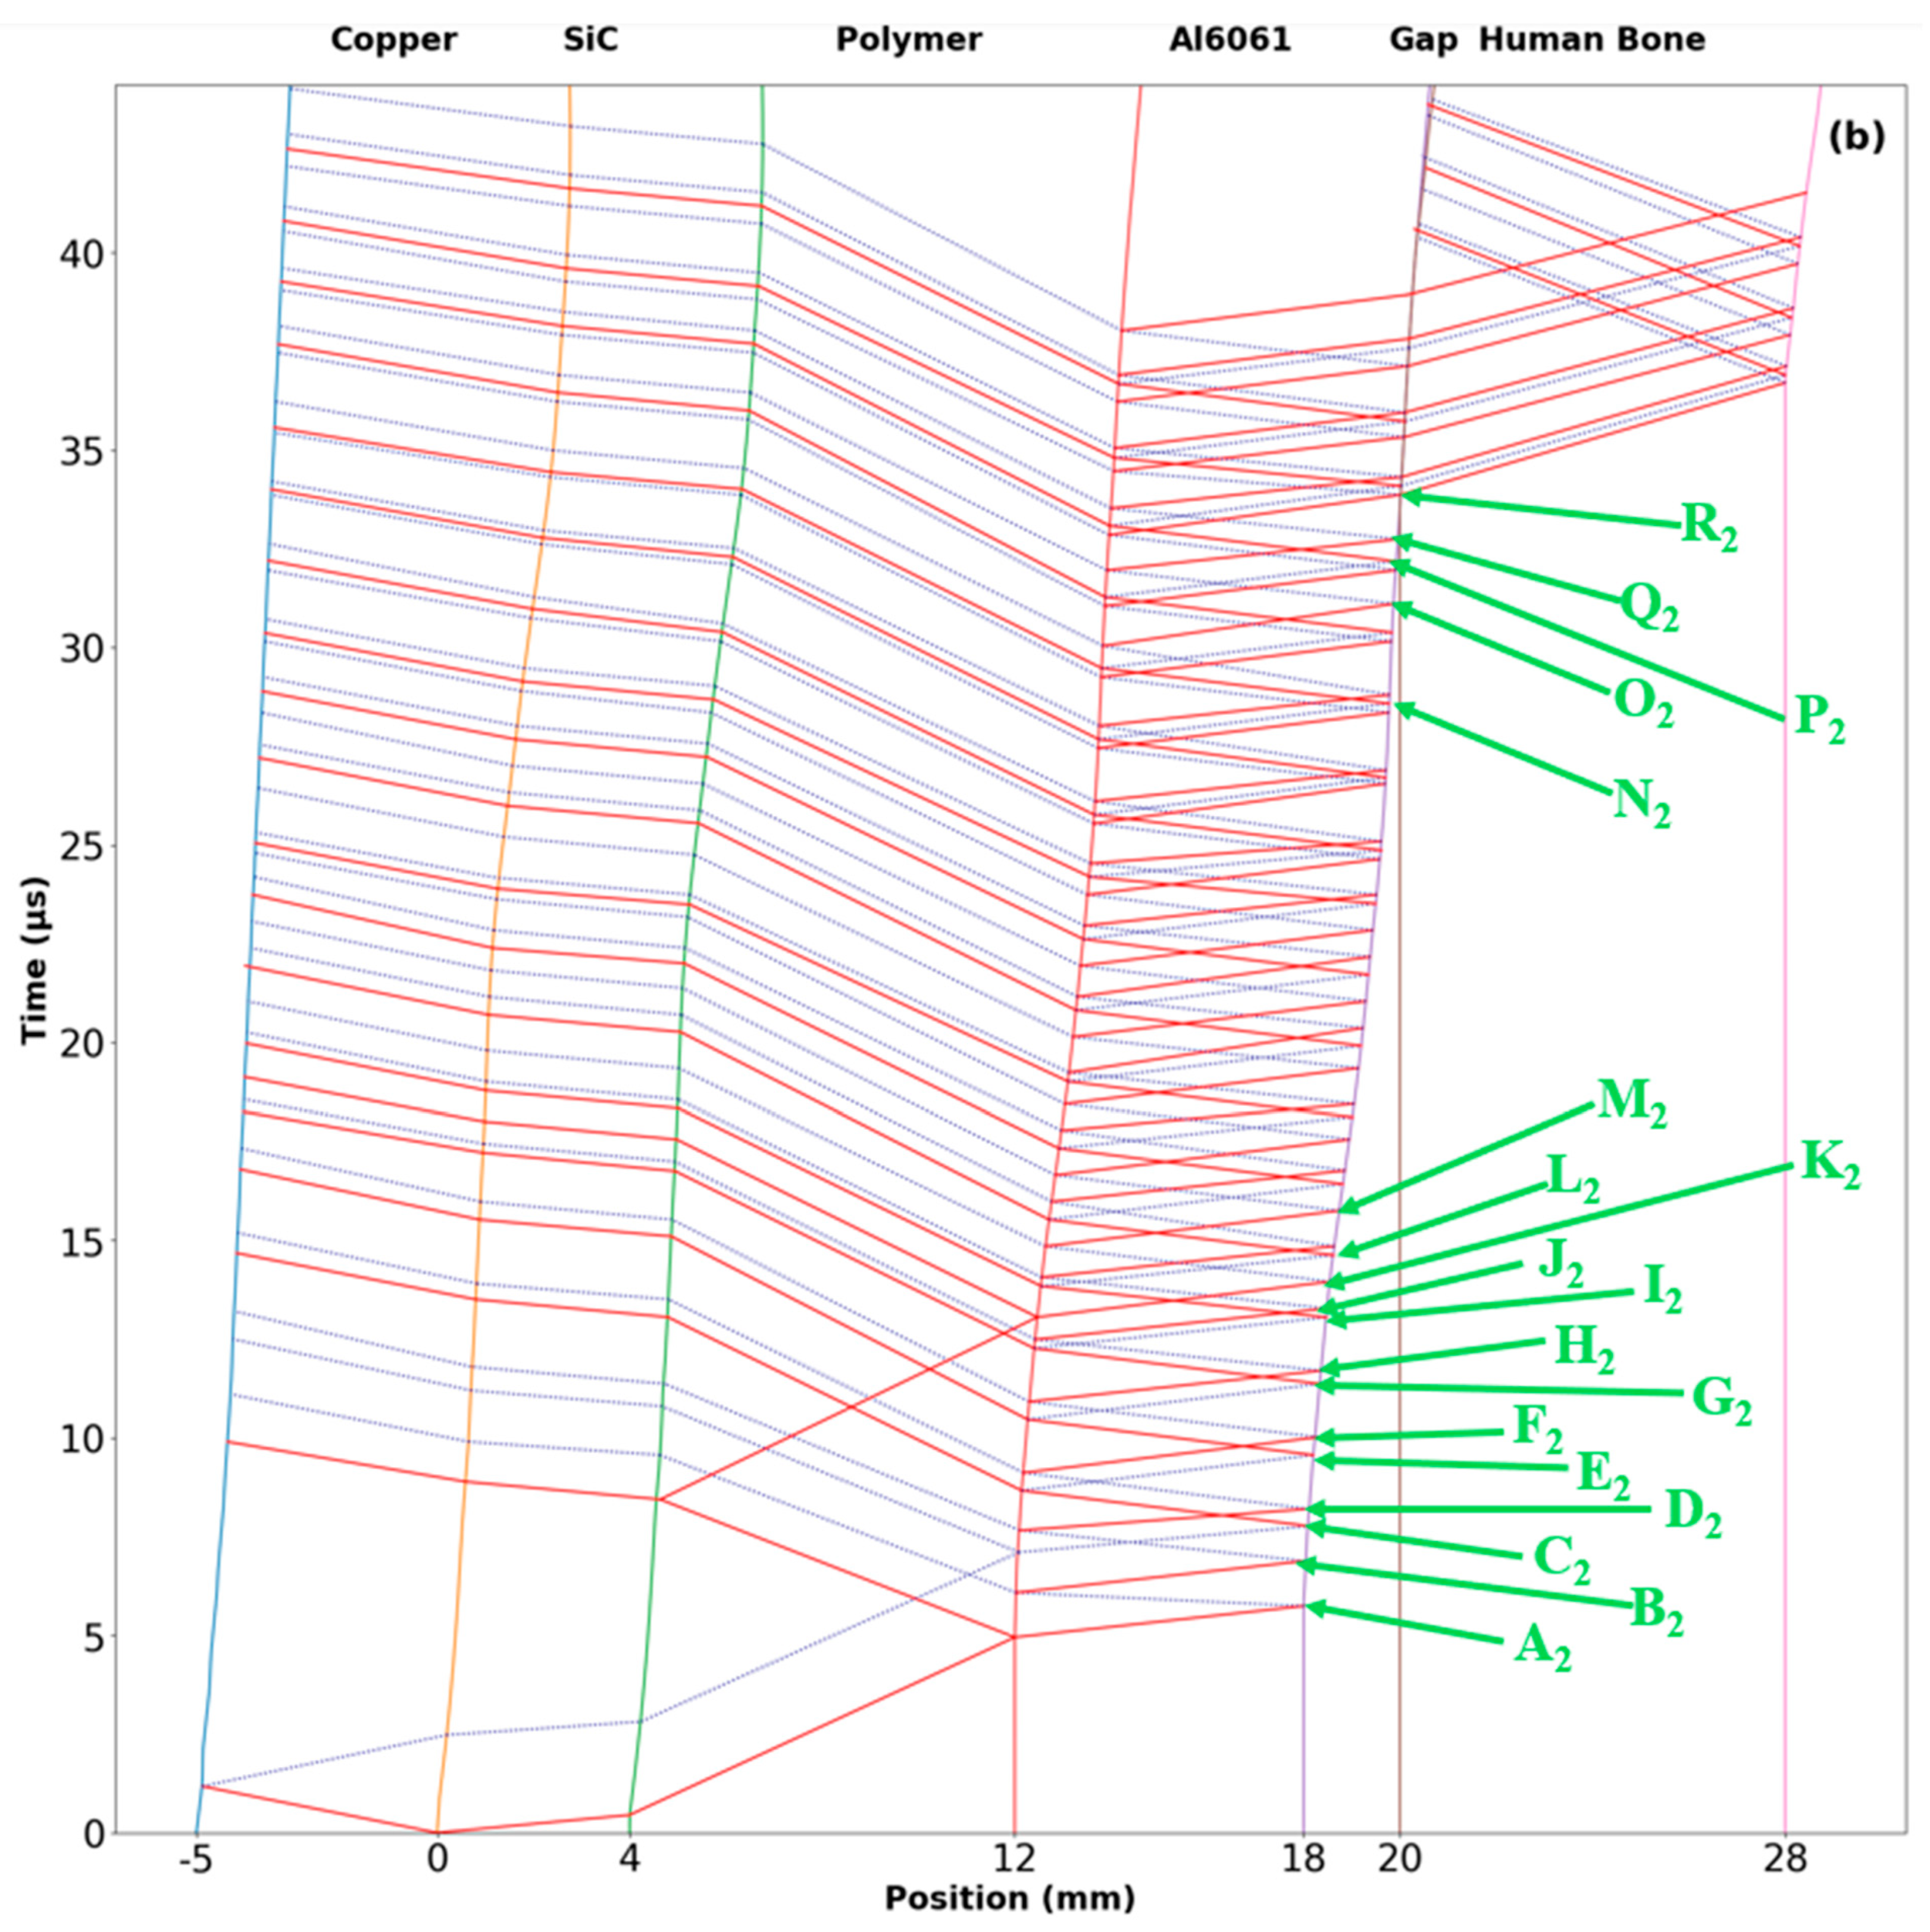
In the 2 mm case, the sequence of compressive and release wave arrivals follows the same trend as in the 1 mm case from points A2 to M2 (123 m/s). The larger gap allows the composite layer to travel farther than 1 mm case before reaching the protected target. During this interval, several release waves reach the free surface of Al 6061 while the layer is still moving forward, reducing the FSV much more than in the 1 mm case. This results in the lowest point in FSV at N2. After reaching N2, a series of compressive waves followed by weak release waves from N2 to Q2 causes the surface velocity to rise slightly, producing a small peak at Q2 just before the gap closes at around 33.75 µs (at R2) with an impact velocity of 45.45 m/s. The magnitude of the compressive wave at Q2 just before impact in the 2 mm case is smaller than in the 1 mm case (M1); the composite layer arrives at the target with a significantly reduced impact velocity. This lower velocity directly results in the weakest midplane response for the protected target. Increasing the gap distance to 2 mm fundamentally alters the timing of wave interactions, resulting in the lowest transmitted load among the three gap distances examined. Unlike the 1 mm case, the x-t diagram for the 2 mm configuration shows a significant shift in the position of the compressive and release waves after M2. Because the gap is now larger, the reflected release wave has sufficient time to interact with and attenuate the compressive wave before it reaches the target, resulting in a lower transmitted impulse to the protected target. Also, in the x-t diagram, the compressive wave is immediately followed by the release wave near the time of contact, thereby minimizing the compressive wave’s strength throughout the CPM configuration. When the gap is increased further to 3 mm, the transmitted load partially recovers, resulting in higher midplane velocity and stresses than in the 2 mm case but lower than in the 1 mm case.
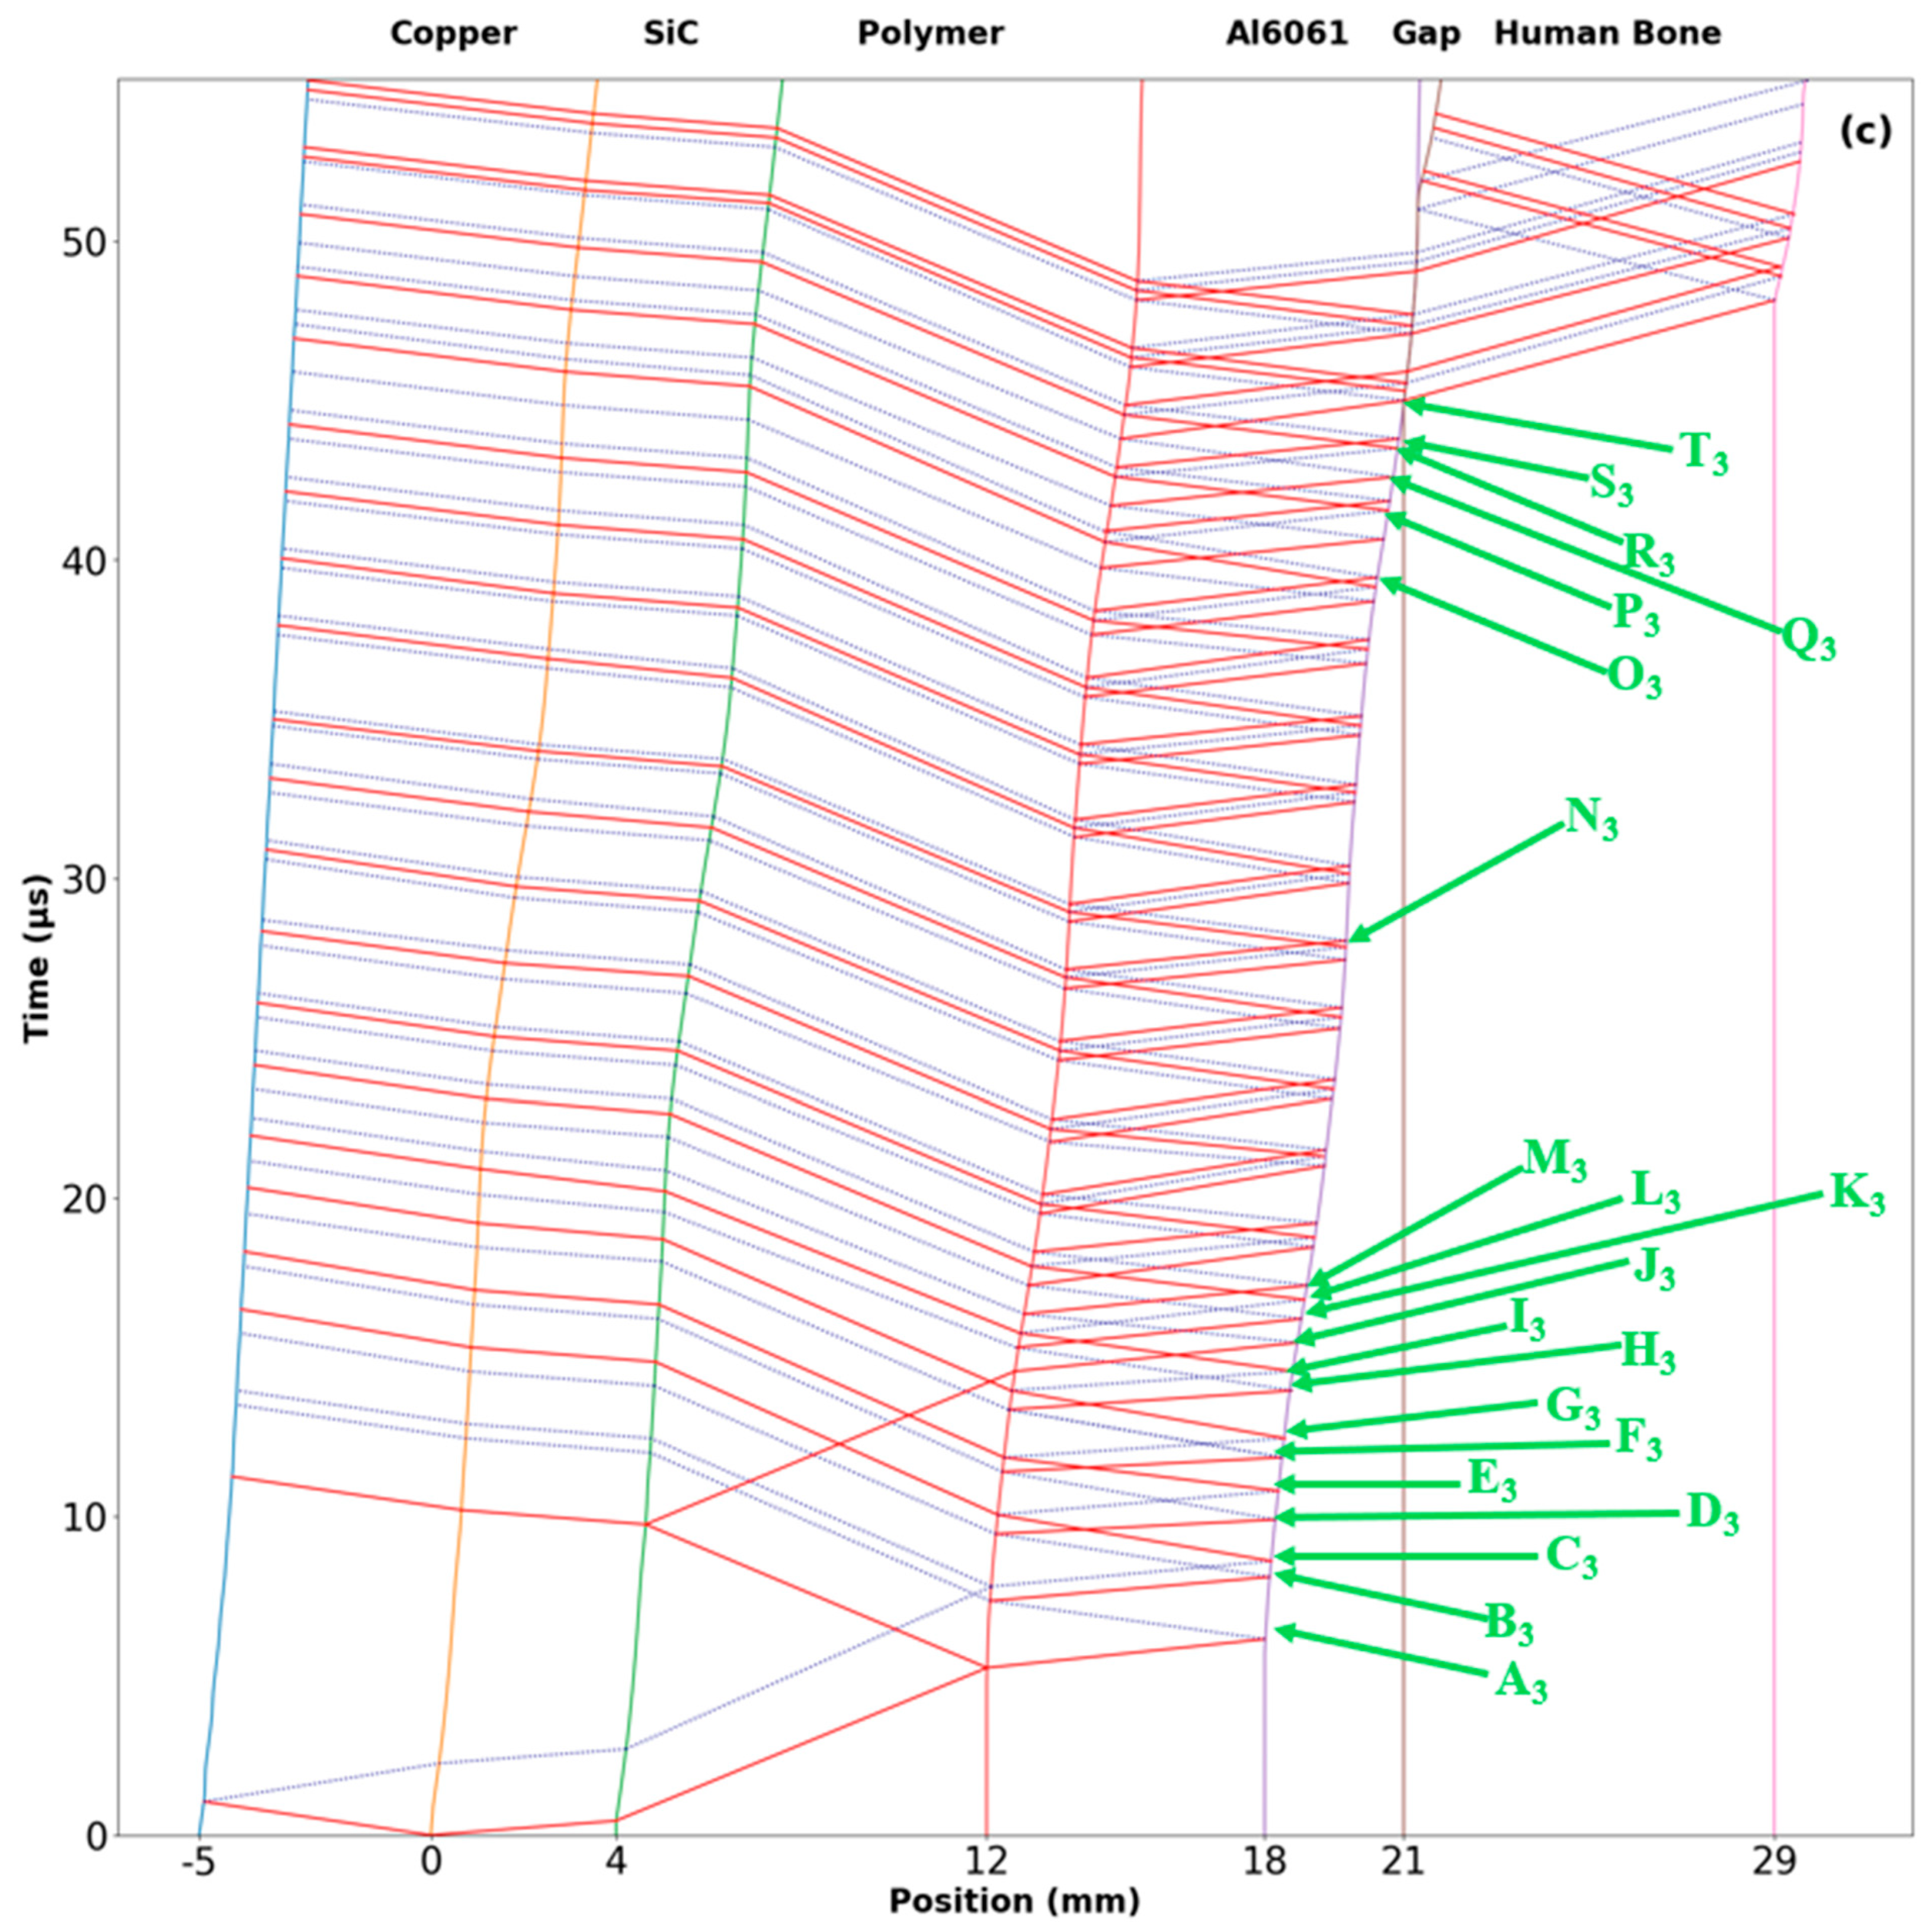
In the 3 mm case, the FSV follows the same pattern observed in the 2 mm configuration up to point N3. Because the 3 mm gap is larger, the composite layer takes longer to close the gap than in the 2 mm case. After N3, several compressive waves arrive at the CPM free surface from N3 to O3. The arrival of strong compressive waves again increases the FSV, reaching a second compressive peak at O3, where the velocity rises to about 120 m/s. Following this peak, release waves arrive at P3 and R3, reducing the FSV and producing a slight downward oscillation in the velocity profile. The 3 mm case shows a higher compressive velocity immediately before impact, with no significant unloading, compared to the 2 mm case (Q3 > Q2). As a result, the high magnitude compression occurs very close to the moment of contact, and the CPM free surface closes the gap at around 45 µs (T3) with an impact velocity of 73.58 m/s. Finally, the impact velocity trend aligns with the midplane response of the protected target (1 > 3 > 2 mm), indicating that the target’s loading is primarily governed by the impact velocity set by the wave interactions within the CPM gap. The difference in midplane velocity at the examined gap distances is because of the strength and timing at which compressive and release waves interact within the CPM configuration before the gap closes.


4. Conclusions

In this work, numerical simulations were performed in Abaqus/Explicit to investigate the effect of the gap distance on shock transmission in a layered composite armor system. The simulation was conducted in two configurations. At first, single-layer configurations were simulated across 1–10 mm gaps to understand the material’s effect on shock-wave propagation and the impact response of the protected target. The results revealed that the gap effect is material-dependent, with Al 6061 and SiC showing a decrease in the target midplane velocity as the gap distance increases. However, the PC layer showed an inconsistent variation with gap distance. The difference in trend arises from the combined effects of impedance mismatch and wave speed between the impactor and the PC layer. The gap effect analysis was then extended to the CPM configuration over a 1–10 mm range, revealing that the combined composite impact response cannot be predicted from a single-layer configuration alone. The detailed analysis of the representative gaps of 1–3 mm showed that the transmitted shock loading is controlled by the material properties, shock impedance, stress-wave timing, and the sequence of compressive and release waves that reach the free surface of the CPM layer before contacting the protected target. The FSV profiles and displacement-time (x-t) diagrams confirmed that these wave cycles determine the impact velocity at which the CPM composite contacts the protected target. Among the three gap-distance cases, the 1 mm gap produced the highest impact velocity due to the arrival of a strong early compressive wave before impact with the protected target. In contrast, the 2 mm gap produced the lowest impact velocity because the compressive stress wave is immediately followed by a release wave near the time of contact with the protected target, thereby minimizing its strength. The 3 mm gap results in a higher impact velocity than the 2 mm gap because it closes later, allowing the strong compressive waves to arrive just before contact with minimal unloading. The midplane velocity follows the same pattern as the impact velocity because of the magnitude of the transmitted shock wave imparted to the target at contact. A higher impact velocity generates a stronger transmitted shock wave and, consequently, a larger midplane velocity in the target, and vice versa. For the CPM configuration and impact condition investigated in this study, the 2 mm gap was the optimum gap distance that most effectively mitigated the shock loading imparted to the protected target. This study demonstrates that the gap effect in multilayered composite armor is nonlinear and depends not only on gap size but also on material properties, impedance mismatch, wave speeds, and strength and timing of the wave interactions.
This research provides insight into how gap distance affects dynamic load transmission in layered composite armor systems and highlights its importance in the design and optimization of composite configurations for impact-mitigation applications. Building on this foundation, future work should focus on extending the modeling framework to incorporate damage models for the layered material, enabling a more realistic assessment of protective performance. Such damage models would provide further insights into how material degradation and spallation influence the transmitted shock loading and the response of the protected target, particularly under higher impact conditions. Also, the incorporation of compressible, energy-absorbing foam materials between armor and target systems may be considered a means of further enhancing shock mitigation through controlled deformation and energy dissipation.

Supplementary Materials

The following supporting information can be downloaded at https://www.mdpi.com/article/10.3390/jcs10070366/s1, The material model parameters and equation of state inputs used in the Abaqus/Explicit material property definitions are summarized in Tables S1–S4. Table S1: Material parameters of the J-C model with Mie–Grüneisen EOS for OFHC-Cu and Al 6061; Table S2: Material parameters of the JH-2 model for SiC; Table S3: Material parameters of the modified DSGZ model for PC; Table S4: Material parameters of the elastic EOS model for the simulated human bone-protected target.

Author Contributions

Conceptualization, S.P. and S.J.; methodology, S.P.; software, S.P., P.O. and H.Z.; validation, P.O., H.Z. and S.J.; formal analysis, S.P.; investigation, S.P. and S.J.; data curation, S.P.; writing—original draft preparation, S.P. and S.J.; writing—review and editing, P.O., H.Z., A.M.R., M.K.S., S.L. and S.J.; supervision, S.J., A.M.R., S.L. and M.K.S.; project administration, M.K.S. and S.L.; funding acquisition, S.J. All authors have read and agreed to the published version of the manuscript.

Funding

The research was supported by the U.S. Army Corp of Engineers, Engineering Research and Development Center (ERDC) Grant No. W912HZ2420037, and the National Science Foundation through Grant No. 2429027.

Data Availability Statement

The raw data supporting the conclusions of this article will be made available by the authors on request.

Acknowledgments

S.J. acknowledges support from U.S. Army Corp of Engineers, Engineering Research and Development Center (ERDC) Grant No. W912HZ2420037, and National Science Foundation through Grant No. 2429027. The use of trade, product, or firm names in this article is for descriptive purposes only and does not imply endorsement by the U.S. Government. The tests described, and the resulting data presented herein, were obtained from research conducted under the Installations and Operational Environments Program of the United States Army Corps of Engineers—Engineer Research and Development Center. Permission was granted by the Chief of Engineers to publish this information. The findings of this report are not to be construed as an official Department of the Army position unless so designated by other authorized documents.

Conflicts of Interest

The authors declare no conflicts of interest.

Nomenclature

The following acronyms and abbreviations are used in the manuscript:
CPMCeramic–Polymer–Metal
FSVFree Surface Velocity
VUMATVectorized User Material
DSGZDuan, Saigal, Greif, and Zimmerman model
EOSEquation of State
J-CJohnson–Cook material model
HELHugoniot Elastic Limit
JH-2Johnson–Holmquist ceramic material model
OFHC-CuOxygen-Free High-Thermal-Conductivity copper
PCPolycarbonate
SiCSilicon Carbide
Al 6061Aluminum 6061
FEMFinite Element Method

References

  1. Alam, S.; Shakar, S. Ballistic Impact Performance of Triangular Corrugated Core Sandwich Composite Armor. Int. J. Compos. Mater. 2021, 11, 20211102. [Google Scholar]
  2. Signetti, S.; Ryu, S.; Pugno, N.M. Impact Mechanics of Multilayer Composite Armors: Analytical Modeling, FEM Numerical Simulation, and Ballistic Experiments. Compos. Struct. 2022, 297, 115916. [Google Scholar] [CrossRef]
  3. Alam, S.; Nguyen, D. An Investigation of the Ballistic Impact Behavior of Multi-Layered Armor Structure. J. Reinf. Plast. Compos. 2025, 44, 1357–1374. [Google Scholar]
  4. Ben-Dor, G.; Dubinsky, A.; Elperin, T. Effect of Air Gap and Order of Plates on Ballistic Resistance of Two Layered Armor. Theor. Appl. Fract. Mech. 1999, 31, 233–241. [Google Scholar] [CrossRef]
  5. Saleem, I.A.; Abed, M.S.; Ahmed, P.S. Numerical and Experimental Study of Hybrid Composite Body Armor. Eng. Technol. J. 2021, 39, 1681–1687. [Google Scholar] [CrossRef]
  6. He, Y.; Jia, N.; Zhou, J.Q.; Jiao, Y.; Lei, H. Designing SiC Ceramic Composite Armor Structure to Resist Multiple Impacts from Armor-Piercing Incendiary Bullets. Int. J. Impact Eng. 2025, 203, 105367. [Google Scholar]
  7. Ong, C.W.; Boey, C.W.; Hixson, R.S.; Sinibaldi, J.O. Advanced Layered Personnel Armor. Int. J. Impact Eng. 2011, 38, 369–383. [Google Scholar] [CrossRef]
  8. Jena, P.K.; Savio, S.G.; Kumar, K.S.; Madhu, V.; Mandal, R.K.; Singh, A.K. An Experimental Study on the Deformation Behavior of Aluminium Armour Plates Impacted by Two Different Non-Deformable Projectiles. Procedia Eng. 2017, 173, 222–229. [Google Scholar] [CrossRef]
  9. Bragov, A.; Antonov, F.; Morozov, S.; Khominich, D. Numerical Optimization of Multi-Layered Composite Armor. In Proceedings of the Conference on Structural Inference in Statistics, Potsdam, Germany, 17–19 September 2013; Volume 17, pp. 27–28. [Google Scholar]
  10. Choudhury, S.; Yerramalli, C.S.; Guha, A.; Ingle, S. Prediction and Mitigation of behind Armor Blunt Trauma in Composite Plate Armor Using Rubber Backing or Air Gaps. Eur. J. Mech.-A/Solids 2022, 93, 104533. [Google Scholar] [CrossRef]
  11. Liu, J.; Long, Y.; Ji, C.; Liu, Q.; Zhong, M.; Zhou, Y. Influence of Layer Number and Air Gap on the Ballistic Performance of Multi-Layered Targets Subjected to High Velocity Impact by Copper EFP. Int. J. Impact Eng. 2018, 112, 52–65. [Google Scholar] [CrossRef]
  12. Zhang, W.; Deng, Y.F.; Cao, Z.S.; Wei, G.; Zhang, B.X. Effect of Air Gap on Penetration of Double-Layered A3 Steel Shields against Hemispherical-Nosed Projectiles. Binggong Xuebao/Acta Armamentarii 2011, 32, 325–329. [Google Scholar]
  13. Zhang, H.; Rajendran, A.M.; Shukla, M.K.; Nouranian, S.; Al-Ostaz, A.; Larson, S.; Jiang, S. Simulation of the Dynamic Responses of Layered Polymer Composites under Plate Impact Using the DSGZ Model. J. Compos. Sci. 2024, 8, 159. [Google Scholar] [CrossRef]
  14. Duan, Y.; Saigal, A.; Greif, R.; Zimmerman, M.A. A Uniform Phenomenological Constitutive Model for Glassy and Semicrystalline Polymers. Polym. Eng. Sci. 2001, 41, 1322–1328. [Google Scholar] [CrossRef]
  15. Graff, K.F. Wave Motion in Elastic Solids; Courier Corporation: North Chelmsford, MA, USA, 2012; ISBN 0-486-13957-3. [Google Scholar]
  16. Johnson, G.R.; Holmquist, T.J. An Improved Computational Constitutive Model for Brittle Materials. In Proceedings of the AIP Conference Proceedings; American Institute of Physics: College Park, MD, USA, 1994; Volume 309, pp. 981–984. [Google Scholar]
  17. Johnson, G.R. A Constitutive Model and Data for Metals Subjected to Large Strains, High Strain Rates and High Temperatures. In Proceedings of the 7th International Symposium on Ballistics, The Hague, The Netherlands, 19–21 April 1983; pp. 541–547. [Google Scholar]
  18. Mie, G. Zur Kinetischen Theorie Der Einatomigen Körper. Ann. Phys. 1903, 316, 657–697. [Google Scholar] [CrossRef]
  19. Grüneisen, E. Theorie Des Festen Zustandes Einatomiger Elemente. Ann. Phys. 1912, 344, 257–306. [Google Scholar] [CrossRef]
  20. Grujicic, M.; Bell, W.C.; Pandurangan, B.; He, T. Blast-Wave Impact-Mitigation Capability of Polyurea When Used as Helmet Suspension-Pad Material. Mater. Des. 2010, 31, 4050–4065. [Google Scholar]
  21. Silicon Carbide SiC Material Properties. Available online: https://accuratus.com/silicar.html (accessed on 22 April 2026).
Figure 1. Schematic representation of the CPM-target configuration and the corresponding Abaqus/Explicit finite element model showing layer arrangement, boundary conditions, gap location, and mesh discretization.
Jcs 10 00366 g001
Figure 2. Flowchart of the simulation and analysis used in the present study.
Jcs 10 00366 g002
Figure 3. Midplane velocity profiles of the protected target for (a) SiC, (b) Al 6061, (c) PC, and (d) CPM layer at different gap sizes.
Jcs 10 00366 g003
Figure 6. Midplane (a,b) velocity, and (c,d) stress profiles of the protected target at different gaps of 1, 2, and 3 mm under impactor velocities of 100 m/s (solid lines) and 300 m/s (dashed lines).
Jcs 10 00366 g006
Figure 7. Bar-chart comparison of the protected target response for CPM configurations at different gap distances: (a) comparison of midplane velocity at impactor velocities of 100 and 300 m/s, and (b) comparison of midplane stress at impactor velocities of 100 and 300 m/s.
Jcs 10 00366 g007
Figure 8. FSV profiles for CPM layer at different gap distances: (a) 1, (b) 2, and (c) 3 mm.
Jcs 10 00366 g008
Figure 9. x-t diagrams of wave propagation in the CPM configuration (a) 1, (b) 2, and (c) 3 mm.
Jcs 10 00366 g009aJcs 10 00366 g009bJcs 10 00366 g009c
Table 1. Material properties and constitutive models used in numerical simulations.
MaterialYoung’s Modulus (GPa)Density ( ρ )
kg/m3
Longitudinal Speed ( c L )
m/s
Impedance ( ρ c L )
kg/(mm2s)
Constitutive Model
Copper (OFHC-Cu)1178960425438.12Johnson–Cook model +
Mie–Grüneisen EOS
Silicon Carbide (SiC)407.4321511,55937.16JH-2
Polycarbonate (PC)2.1115018492.13DSGZ (VUMAT)
Aluminum T6 (Al 6061)68.92700614916.60Johnson–Cook model +
Mie–Grüneisen EOS
Simulated Human Bone6.7141224363.44Elastic EOS
Disclaimer/Publisher’s Note: The statements, opinions and data contained in all publications are solely those of the individual author(s) and contributor(s) and not of MDPI and/or the editor(s). MDPI and/or the editor(s) disclaim responsibility for any injury to people or property resulting from any ideas, methods, instructions or products referred to in the content.