Article

Preparation and Investigating the Physical, Mechanical and Thermal Performances of Sand/Soil/Recycled HDPE Composites


by
Etienne Malbila
1,2,*,
Decroly Djoubissié Denouwé
3,
Sabour Compaore
1,
Dieudonné Dabilgou
2 and
Adamah Messan
3
1
Ecole Supérieure d’Ingénierie (ESI), Université Yembila Abdoulaye TOGUYENI (UYAT), Fada N’Gourma BP 54, Burkina Faso
2
Laboratoire d’Energies Thermiques Renouvelables (LETRE), Université Joseph KI-ZERBO, Ouagadougou 03 BP 7021, Burkina Faso
3
Laboratoire Eco-Matériaux et Habitat Durable (LEMHaD), Institut International de l’Ingénierie de l’Eau et de l’Environnement (2iE), Ouagadougou 01 BP 594, Burkina Faso
*
Author to whom correspondence should be addressed.
J. Compos. Sci. 2026, 10(7), 362; https://doi.org/10.3390/jcs10070362
Submission received: 16 April 2026 / Revised: 26 May 2026 / Accepted: 29 May 2026 / Published: 7 July 2026
(This article belongs to the Section Composites Modelling and Characterization)

Abstract

The recycling of waste into materials is a form of recovery that offers a double advantage, such as eco-sustainable sanitation and the availability of new ecological construction materials in Civil Engineering. The present study aimed to develop a composite eco-material based on sand, soil and recycled plastic waste melted using a Scheffler solar concentrator (SSC). Then, two types of mix were formulated: a sand/PW mix with ratios of 75/25, 70/30, 65/35 and 60/40, and a sand/soil/PW mix with a ratio of 60/30/10. The SSC enabled an internal melting temperature of 172.42 °C to be reached. Specimens measuring 4 × 4 × 16 cm3 were made and tested using 3-point bending, compression, capillary absorption and thermal tests. The best mechanical resistance was obtained with the 65/35 ratio of the sand/PW mix, with average values of 12.15 MPa in 3-point bending and 23.96 MPa in compression. This composite eco-material had a water absorption rate of 0.4% and a thermal diffusivity of 0.36 mm2/s. On the other hand, the sand/PW/laterite mix had a mechanical strength of 10.1 MPa in 3-point bending and 22.83 MPa in compression, with a water absorption rate of 2.3% and a thermal diffusivity of 0.44 mm2/s. In addition to these initial results, we plan to analyze the effect of thermal shock or wetting-drying cycles on the durability of this composite eco-material. As these properties comply with the established standards, the sand/soil/recycle HPDE composites can be used for applications such as pavers and tiles for interior flooring, and hollow and solid blocks.

1. Introduction

The history of humanity has always been a story of human resilience in the face of nature. Nowadays, plastic waste (PW) and its impact on the environment and on living conditions are attracting the most attention and have become a major concern [1,2,3]. For several decades now, plastic waste (PW) has been gradually transforming planet Earth and aquatic system into an open-air rubbish tip, causing unprecedented environmental pollution that threatens ecosystems and biodiversity, as well as human health [4]. In 2016, global plastic waste production amounted to 53 kg of waste per capita and approximately two billion tonnes of carbon dioxide emissions [5]. If this trend continues, packaging alone will account for more than 300 million tonnes of plastic by 2050. Currently, only 14% of plastic packaging is collected for recycling (compared to 58% for paper and 70–90% for iron and steel). In Burkina Faso, population growth, lifestyle and consumption patterns have led to the production of large quantities of solid household and similar waste (SHSW). With a specific production of 0.62 kg/person/day and a population of 20,487,979 in 2019 [6], the amount of MSW produced is estimated at 12,702 tonnes/day, or 1473 tonnes/day of solid waste and 44 tonnes/day of flexible waste [5].
With this proliferation of waste, various efforts have been made in plastic waste recycling, and several studies have been undertaken on the possibilities of recycling it into construction materials. Investigations into the possibility of combining it with other raw materials to obtain composites have been reported, notably with sand, gravel and laterite [7,8,9]. and the effect of the incorporation of PW on concrete behavior [10]. While some studies have evaluated the suitability of PW as a binder in aggregate/plastic mixtures, others have addressed the practical implications of the composite results of these mixtures. In this regard, composite materials based on a granular matrix (sand) and PW as a binder have been developed for road surfacing and indoor and outdoor flooring [11,12]. In addition, sand/plastic mixtures can be used as materials for the production of paving stones and bricks [13,14,15,16]. These products resulting from plastic waste-based composites are lightweight and economically low-cost and present benefits [4,17,18,19,20]. Tchehouali et al. (2014) [21] studied the influence of adding clay to a sand-plastic mixture on the cooling kinetics and physical and mechanical characteristics of the composite material. They found that the increase in compressive strength is proportional to the clay content, with the opposite trend for tensile strength.
So, the recycled plastic has the potential to enhance various construction materials, such as roofing tiles, paving blocks, and insulation [2]. These studies revealed that the developed composites exhibit commendable mechanical properties, especially flexural and compression resistance, and minimal water absorption [22]. The usage of plastic waste for construction purposes will significantly rectify the sustainability of our environment and also be regarded as a trustworthy source of materials for applying in conventional materials such as concrete and asphalt [23].
From multi-criteria analysis, Malbila et al. (2024) concluded that the main components of eco-friendly paving stones are plastic waste, glass waste and aggregates [23] and these findings emphasize the importance of optimizing material formulation and processing parameters to enhance overall performance [18].
From these various studies [21], particularly on the material recovery sector for PW, it appears that the most commonly used energy source is butane gas for melting, and wood or coal, which are not clean energy sources and therefore not sufficiently environmentally friendly. The novelty of the present study is the use of a clean energy source, namely Scheffler solar concentrator (SSC), for melting plastic waste and the mechanical mixing device. Among the renewable sources of energy, solar energy offers a practical solution for the energy problem, which is clouding the prospects of mankind [24]. This study therefore aims to develop an eco-material named sand/soil/recycled HPDE composite.

2. Materials and Methods

2.1. Raw Materials

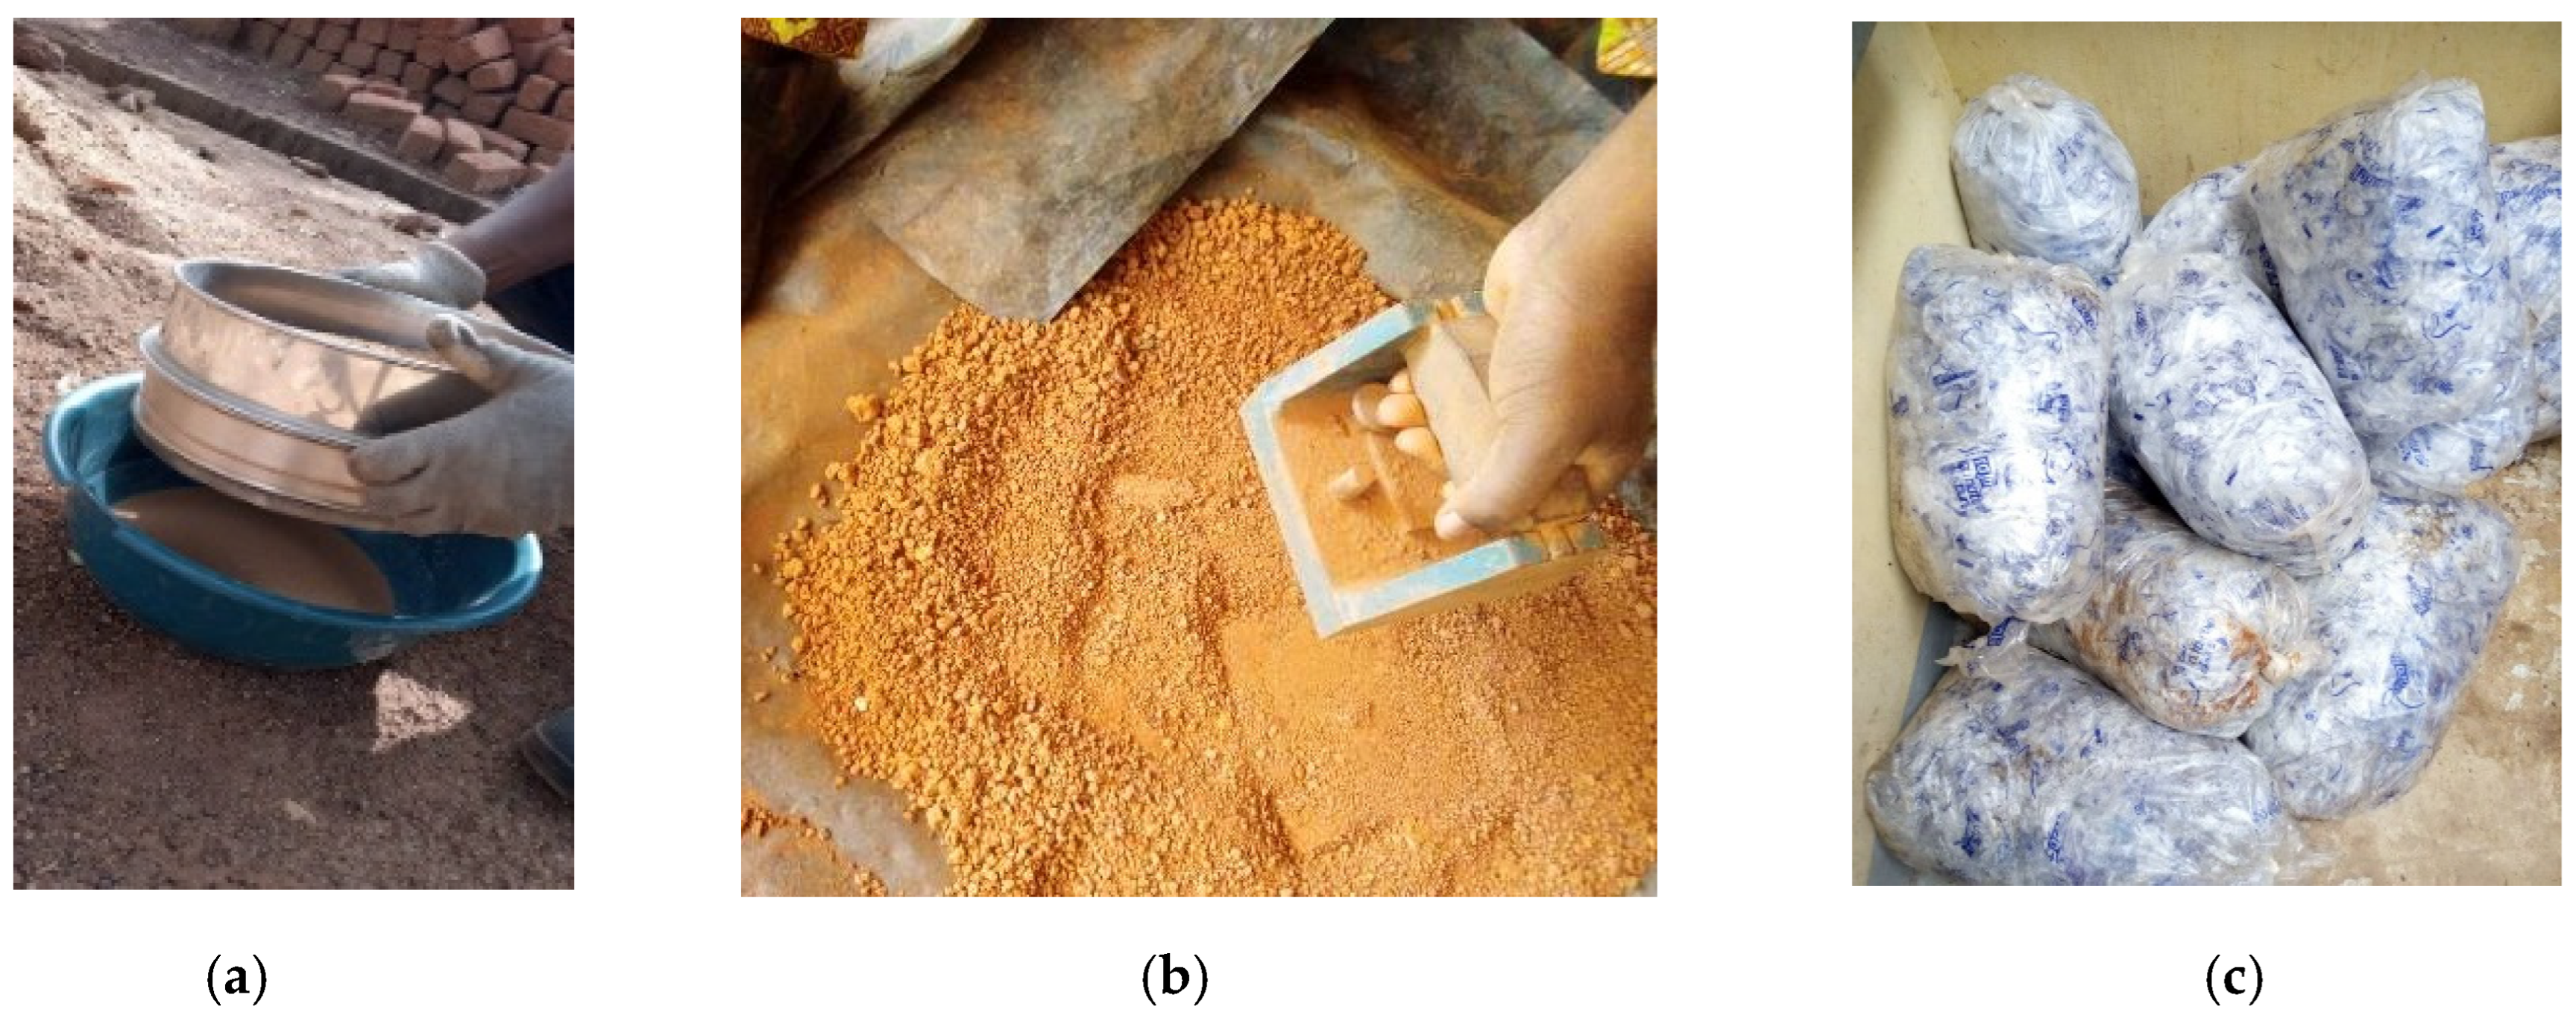
The raw materials used in this study were natural sand, laterite soil and plastic waste (PW) as shown in Figure 1 below. The sand and laterite soil were obtained from a site in Fada N’Gourma area with respectively a Global Positioning System (GPS) coordinates of 12.05600 N; 0.34610 E and 12.10020 N 0.34710 E. The PW was the high-density polyethylene type and collected from the BARAJI Society.
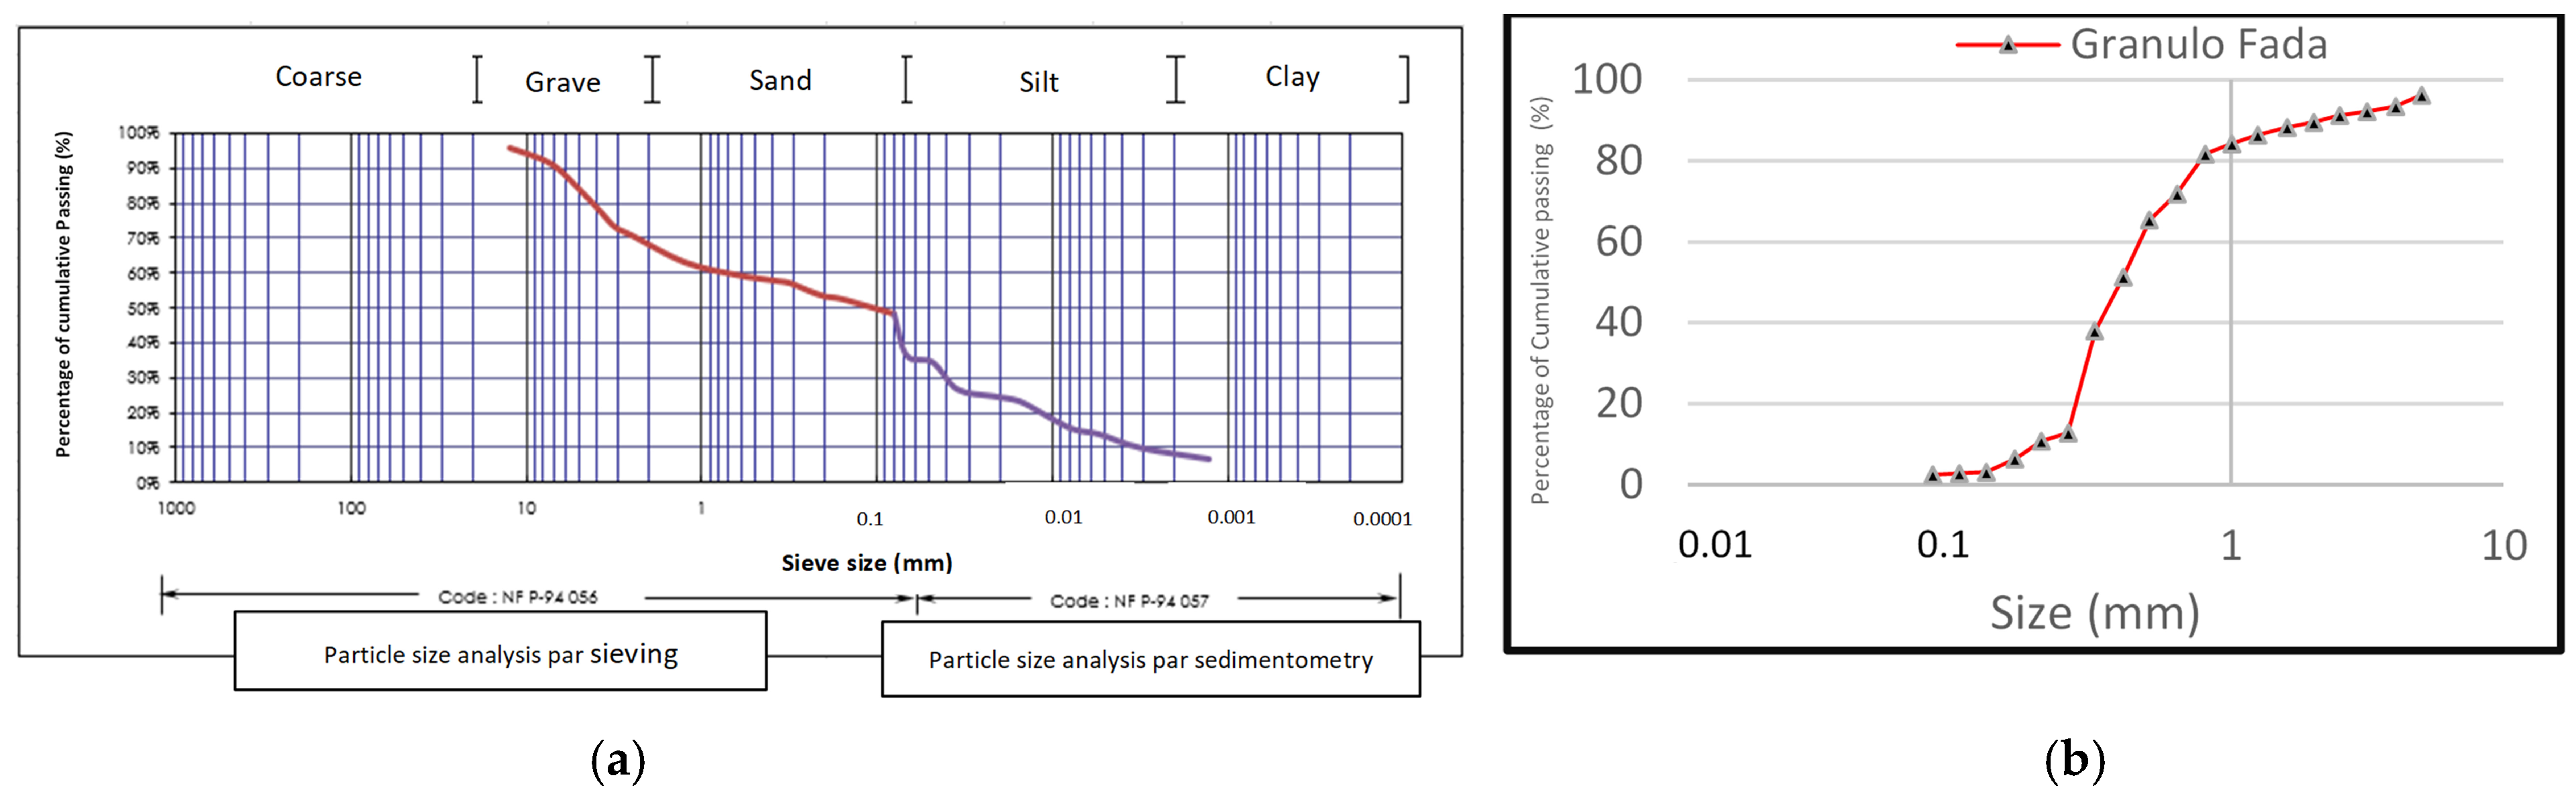
The characteristics of the sand, plastic and laterite soil used in this study are presented in Table 1 and Table 2 and Figure 2 below. The physical characteristics of the sand and the lateritic soil are, respectively, a coefficient of uniformity of 0.42 and 26.66, finesse modulus of 2.15 and 1.24. According to standard NF EN 933-1 [25] and NF EN 13043 [26], the sand is in granular class of 0/2.5 and the laterite soil is composed by 40% of gravel, 45% of sand and less than 20% of fines elements and clay. According to standard EN 12620 [27] the sand has a majority of fines particle and uniform particle size.

2.2. Methods

2.2.1. Solar Power Source Device Installation and Operation

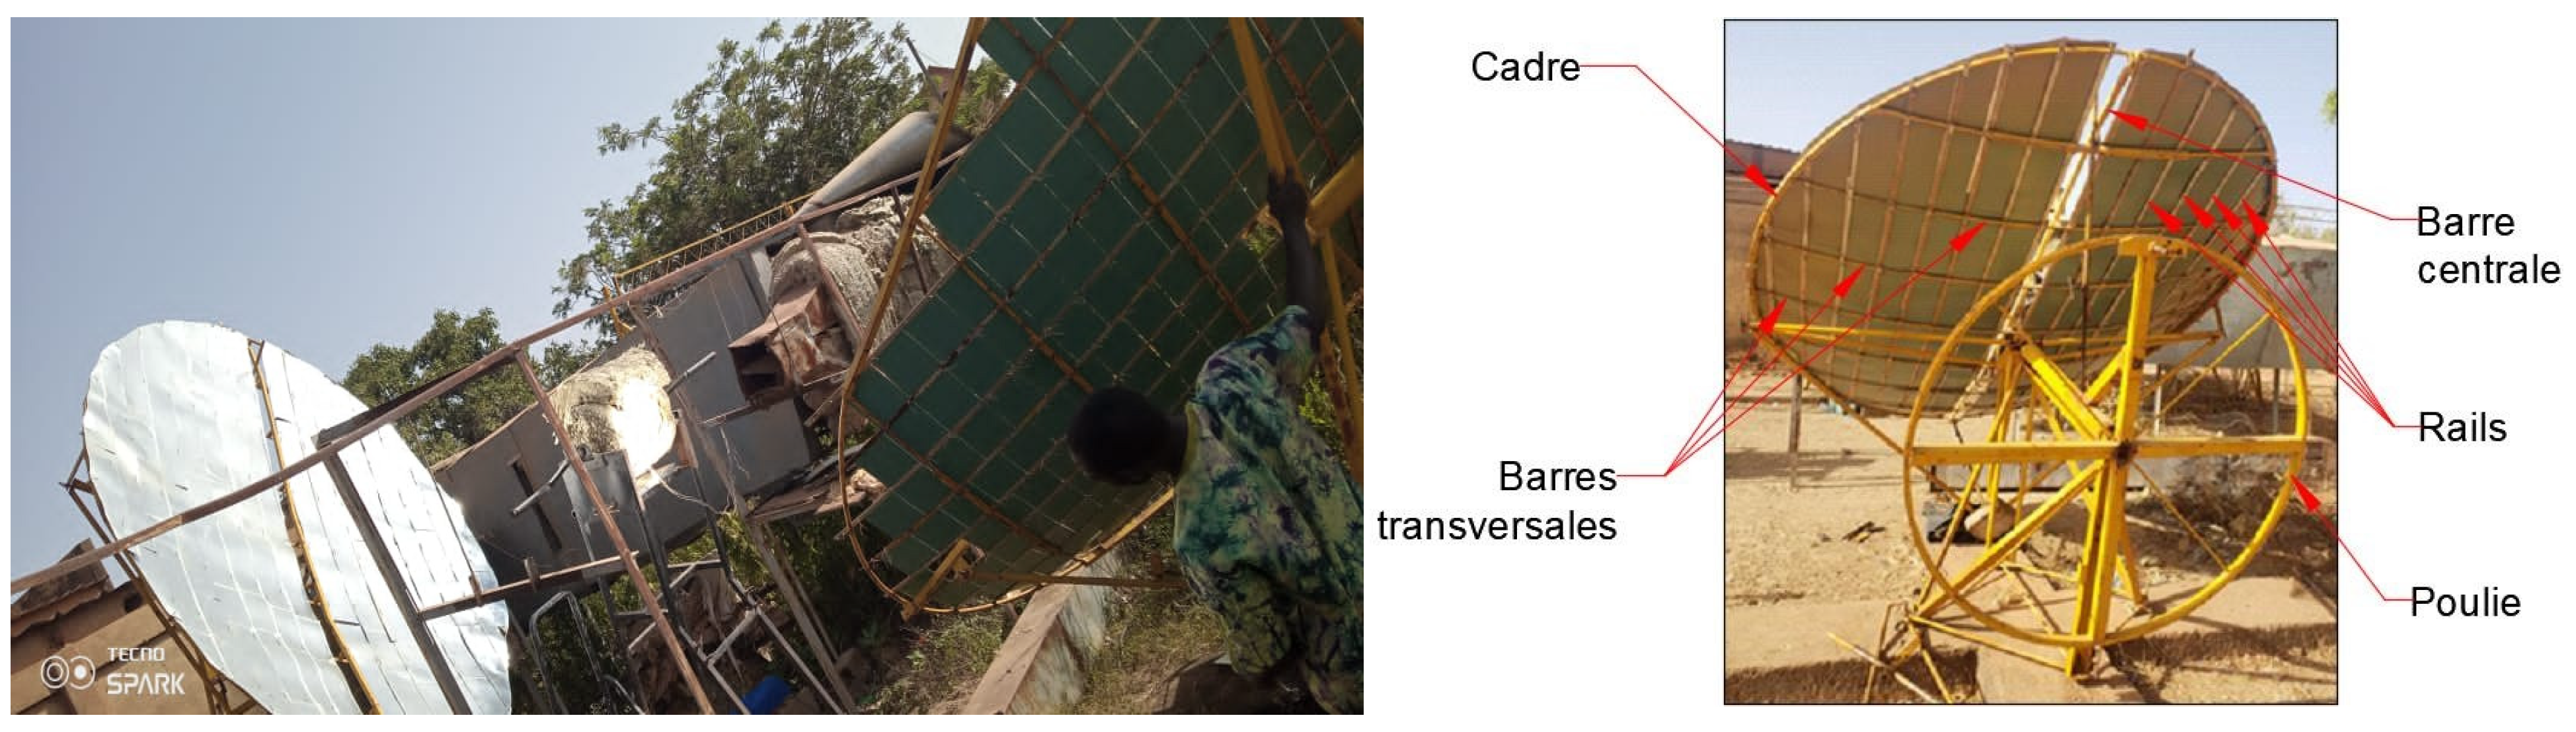
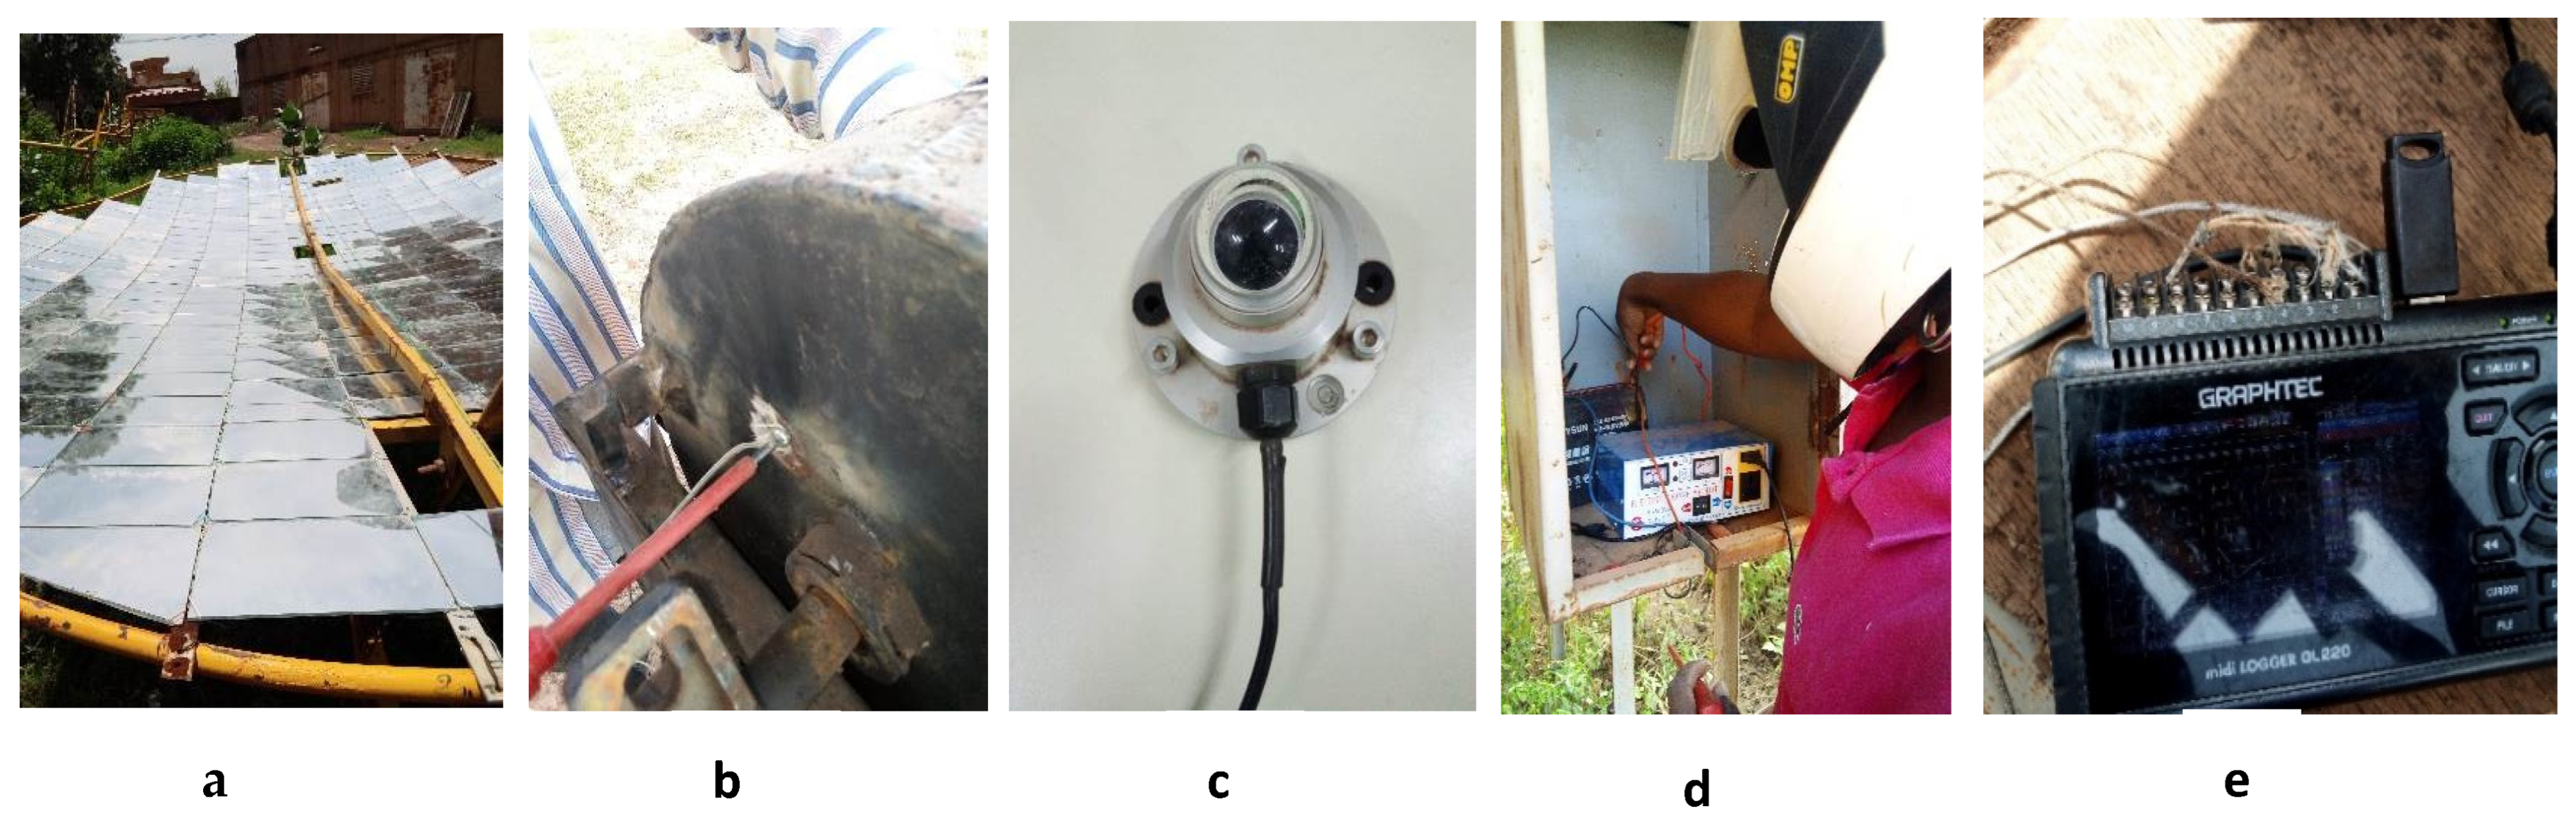
The experimental fusion unit used in this study is located in Saaba in Ouagadougou area and comprises a pair of 16 m2 mobile Scheffler primary reflectors sharing a fixed receiver and equipped with glass mirror (m.e.v) and aluminum mirror (m.e.a) (Figure 3 and Figure 4). The receiver is positioned between the two dishes, 1.10 m above the ground and inclined at 12.38° latitude in the north-south direction. The focal length is chosen to be 2.69 m and the calculated focal point is approximately 1.43 m from the ground on the vertical axis.
The North-facing Scheffler Reflector (RSDN) reflects incident radiation northwards, and the South-facing Scheffler Reflector (RSDS) reflects incident radiation southwards. What they have in common is a fixed receiver. The heat flux arriving from the primary reflectors is concentrated on two absorbing surfaces of the receiver, each facing each primary reflector. The heat accumulated by the hot surfaces is then transferred by conduction to the polymer matrix.
In the operation of the device, no-load (no lift testing) and load experiments of PW melting were carried out as part of this study. Type J and K thermocouples linked to a data logger, in particular the GRAPHTEC midi LOGGER GL220, were used to measure the temperature evolution during the operation, temperature in the melting chamber(TI), and the temperature of the outer wall of receiver, respectively, on the north side (TN) and the south side (TS).
The data logger was powered by a photovoltaic energy source, and a battery and converter were used for this purpose. A USB key was inserted into the data logger port to automatically record all data in Excel format for later analysis and processing. For the experiment, it was decided to automatically measure temperatures at a time step of five (05) minutes.
The experimental set-up was calibrated over two days by means of no-load and load tests, in order to record temperature trends over the course of the day and estimate the most favorable periods for PW melting. It also enabled us to check the efficiency of the insulation and revealed a huge heat leakage through the small pores left by the thermocouples. For better insulation, silicone was used to waterproof these pores (Figure 5), which considerably reduced heat loss. Once calibration was complete, it was time to implement the device in the production of the new composite of sand, laterite soil and plastic waste.

2.2.2. Composite Preparation and Experimental Design

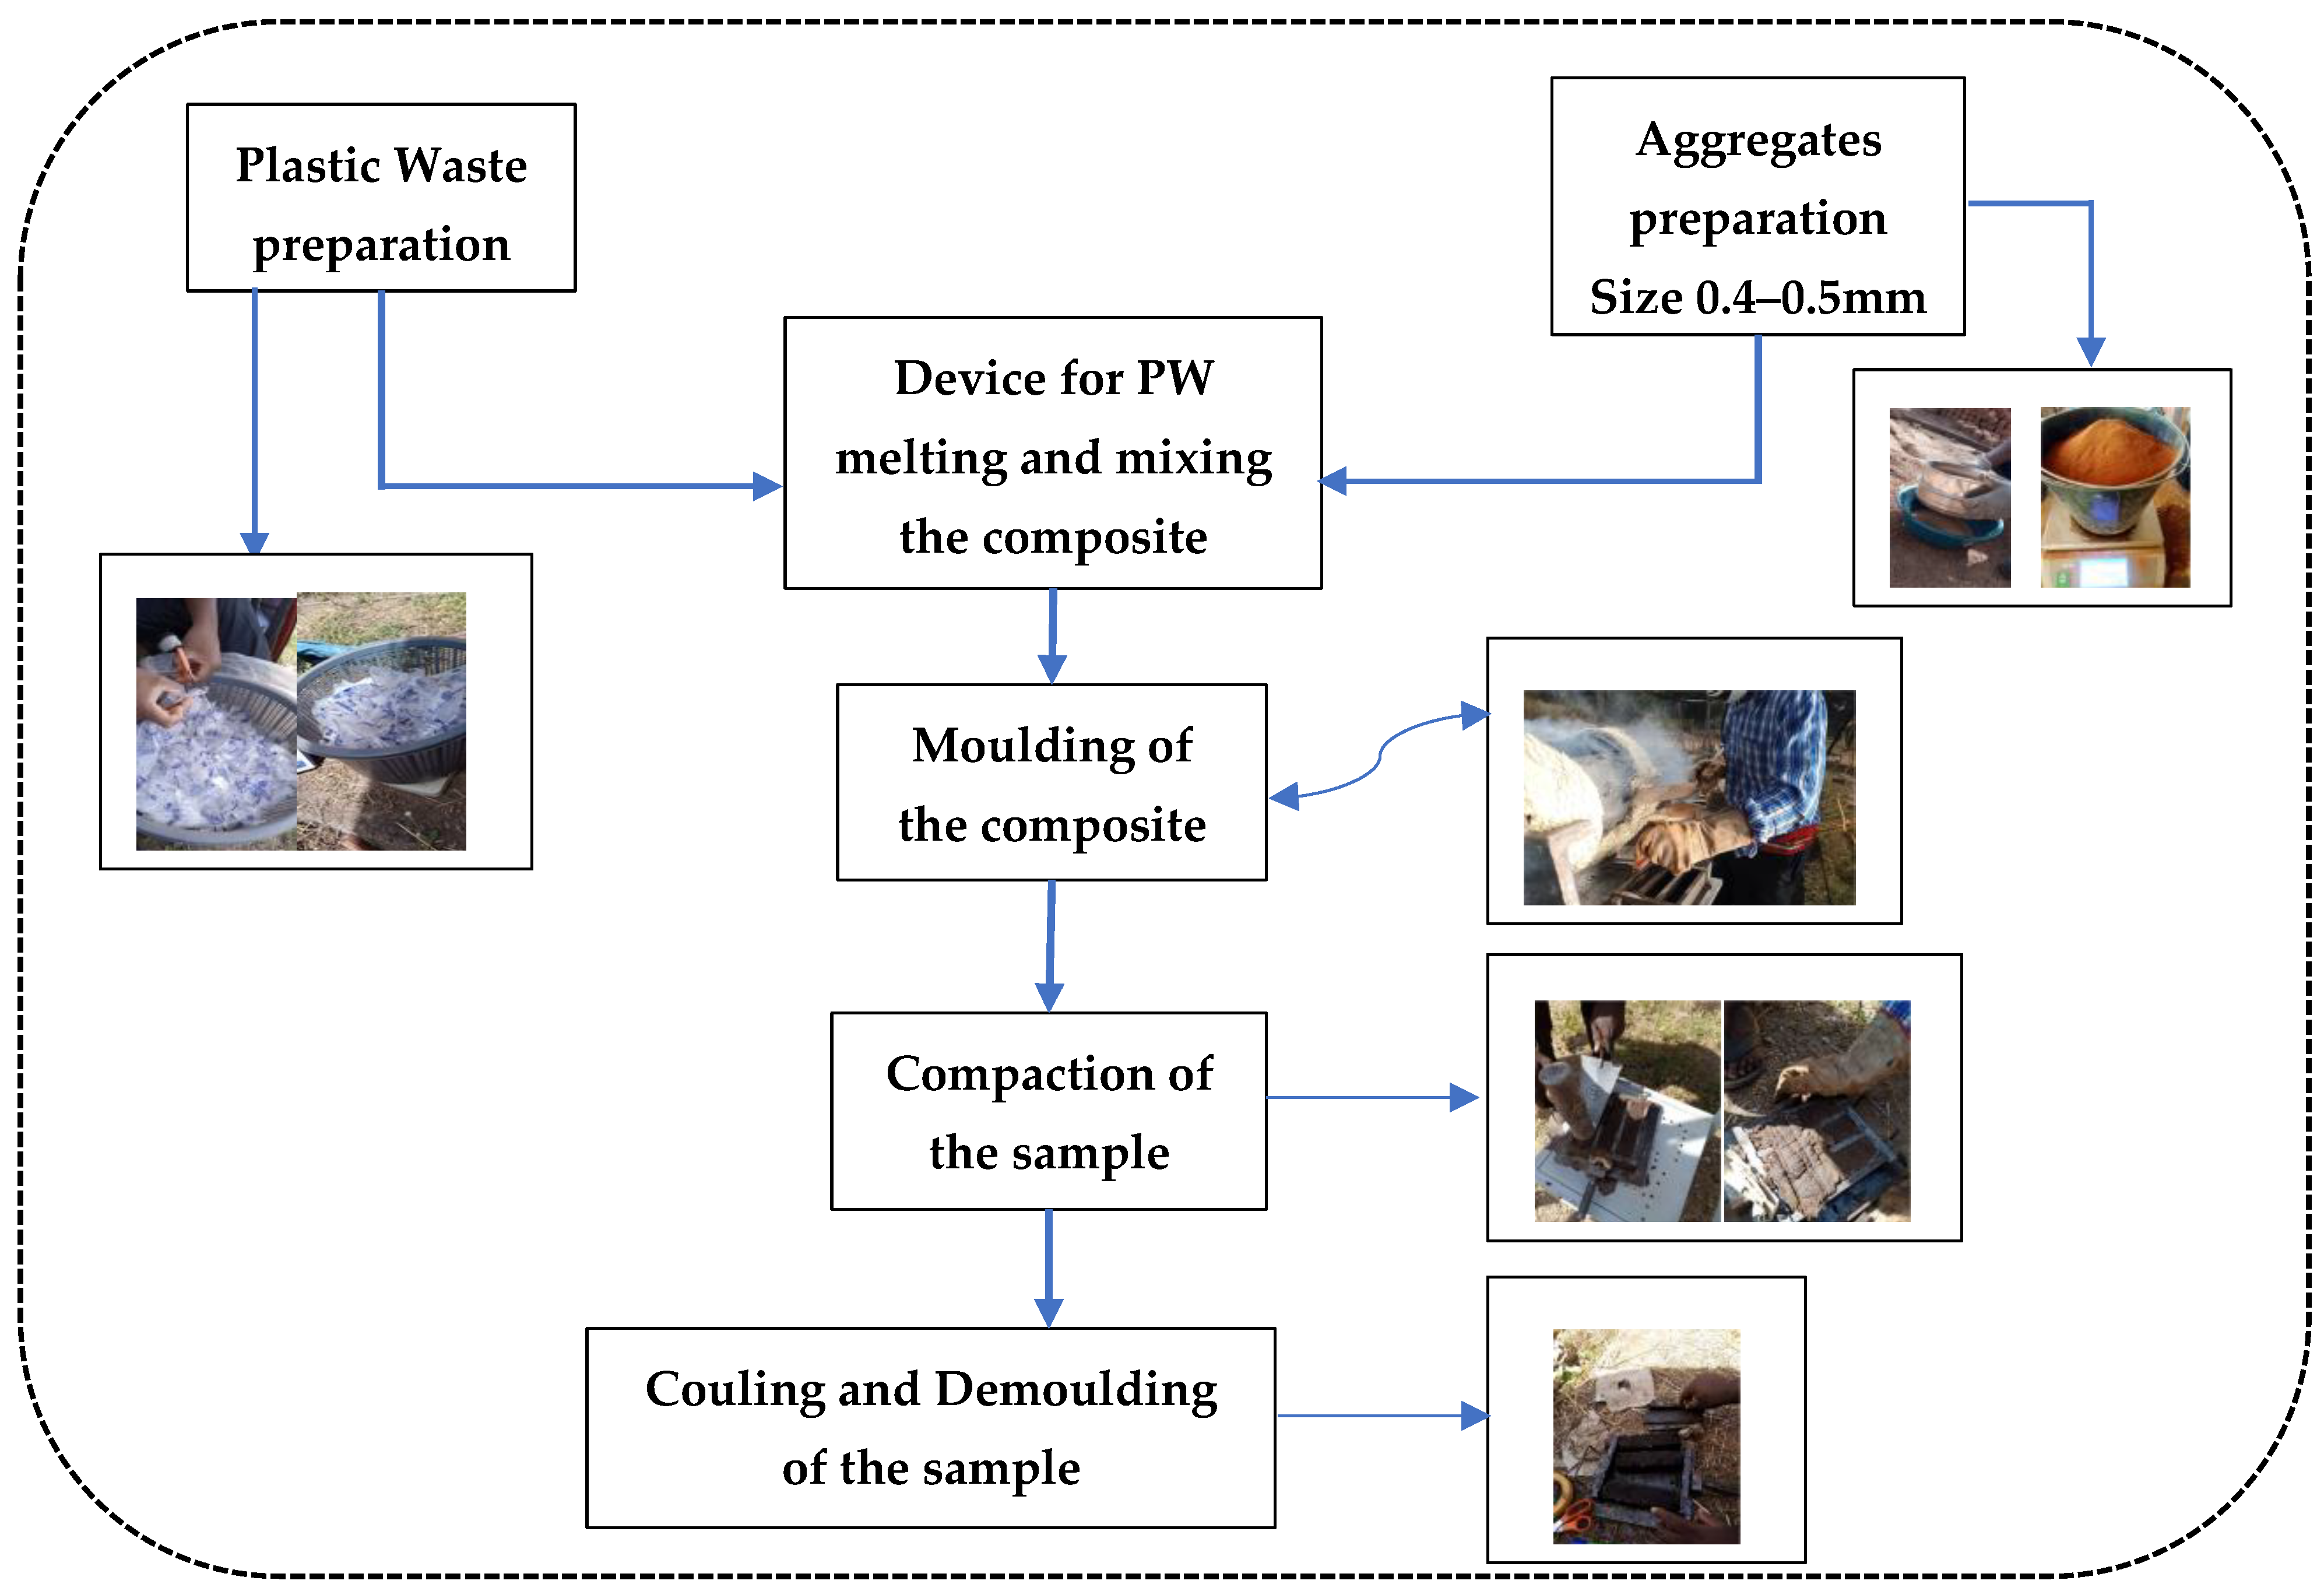
The graphical design of the composite formulation is presented in Figure 5. The ratios and the quantities of the raw materials are summarized, respectively, in Table 3 and Table 4. The raw materials are mixed in mass ratio which are obtained by applying Equation (1) below.
M p = n × P ( % ) × M t
With M p , the mass of PW in the mix, n, the number of samples, P ( % ) the ratio of PW in the mix and M t , the theoretical mass of the sample.
The plastics wastes were first cleaned of dust and dirt and submitted to sun dried for 24 h. After that, they were cut into a small size, weighed, and then immediately introduced into the receptor before the Scheffler panels were aligned on it. The plastics wastes are melted at an internal temperature of approx 200 °C. During the entire process, every 15 min the Scheffler panels are redirected towards the focal point of the receiver to keep the internal temperature constant, due to the path of the sun. Once the plastic waste has melted, we introduce the aggregate (sand, laterite), followed by simultaneous mixing for around 10 to 15 min.
When mixing becomes increasingly easy in both directions of rotation of the receptor (lever arm), we start molding. The molds are pre-lubricated to facilitate demolding. This operation must be carried out as quickly as possible so that the paste does not solidify too much before compaction.
Table 3. Ratio of the components of each formulation type.
Formulation TypeF1
(75%/25%)
F2
(70%/30%)
F3
(65%/35%)
F4
(60%/40%)
F5
(60%/30%/10%)
Plastic waste25%30%35%40%30%
Sand75%70%65%60%60%
Laterite soil0%0%0%0%10%
Number of sample1515151515
Table 4. Quantity of raw material by formulation type.
Formulation TypeF1
(75%/25%)
F2
(70%/30%)
F3
(65%/35%)
F4
(60%/40%)
F5
(60%/30%/10%)
Total
Plastic waste2.12.422.823.222.4212.98
Sand6.15.635.234.824.8326.64
Laterite soil00000.810.81
Total8.28.058.068.048.06
Moulding is carried out at moderate pressure, using a hammer and trowel to minimize voids in the composite. Finally, the samples are cooled to room temperature of around 45 °C in the open air.

2.2.3. Physical Behaviour of the Composite

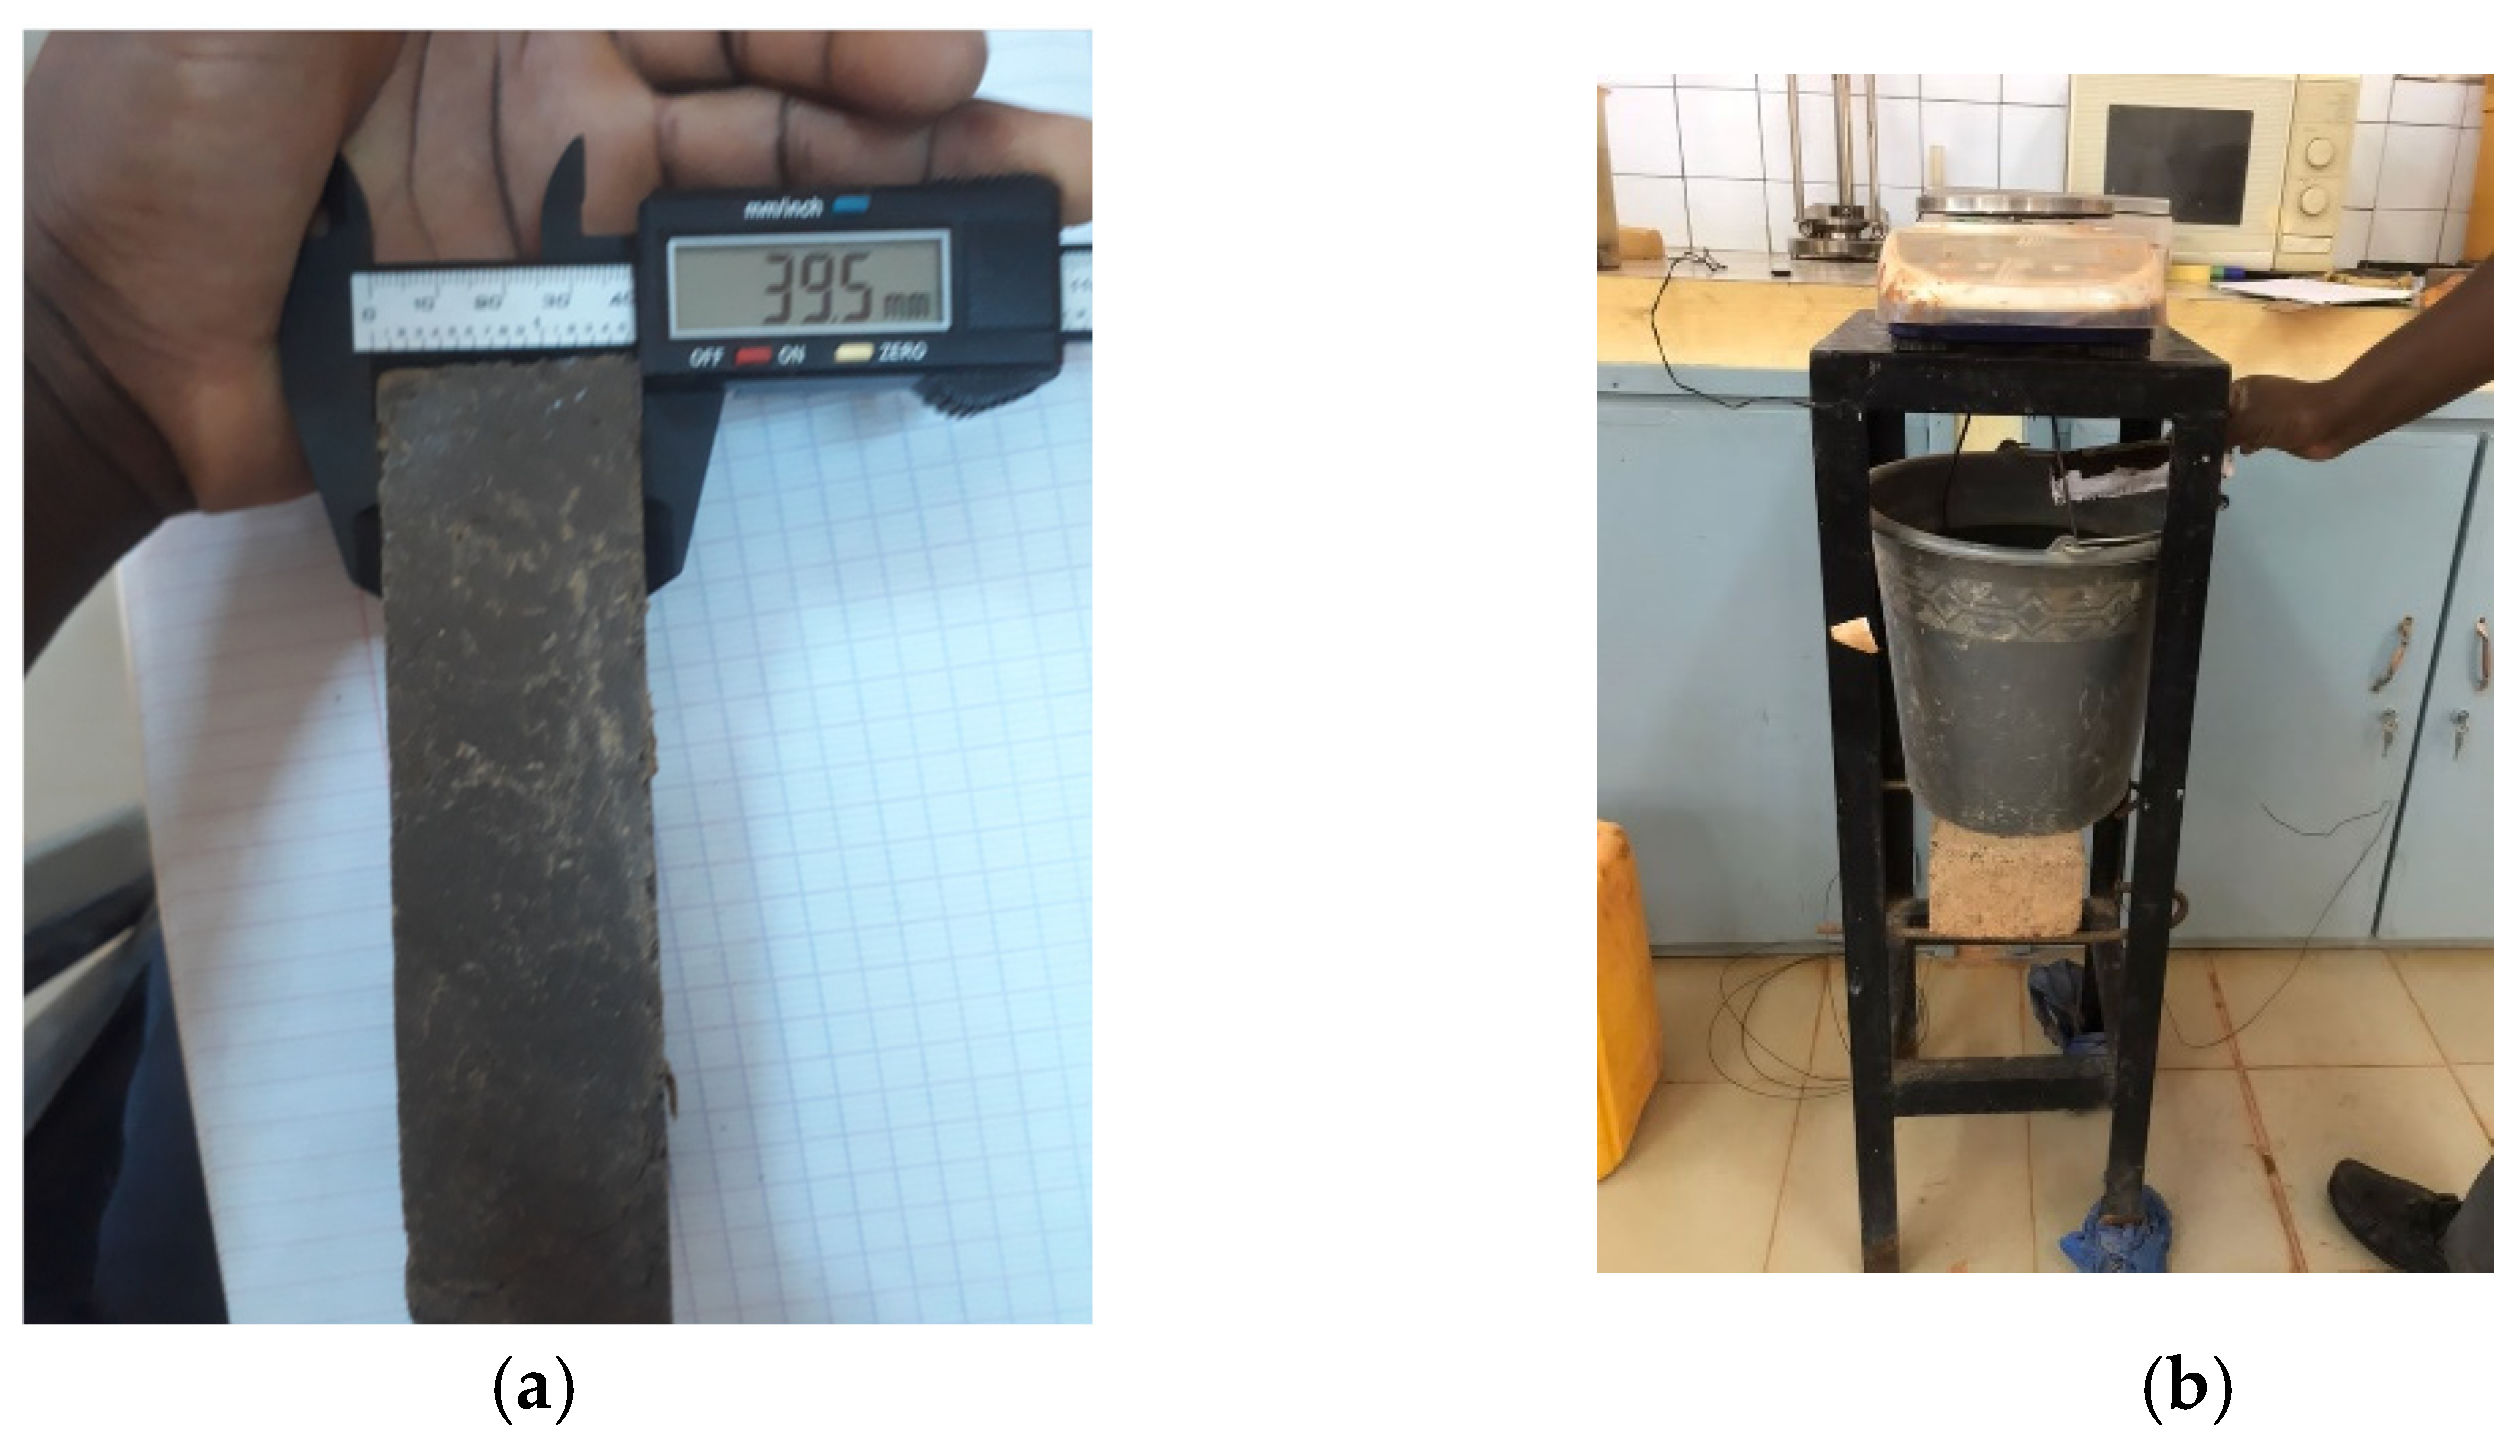
The characterization of the composite sample consisted of the determination of the density, the withdrawal, the water absorption and porosity. Apparent density on prismatic specimens was determined in accordance with DIN 18947 [28], using a digital caliper and a 0.001 g precision digital balance (Figure 6). Three specimens were weighed and their dimensions determined to calculate their densities according to Equation (2):
ρ g · c m 3 = m v
With, m (in g) the dry mass of the sample and v (cm3) the volume of the sample.
The linear shrinkage (α in %) of the mortars was obtained from the difference between the initial (molds) and final (composite blocks) lengths measured after demolding on three prismatic specimens (4 × 4 × 16 cm) in following standard DIN 18947 [28]. The linear shrinkage (α in %) was determined by Equation (3).
α % = l l 0 = l 0 l l 0
where, l0 = length of the mold and l, length of the dray sample.
The capillary absorption and the absorption by total immersion of the composite sample are determined following respectively the standard AFPC—AFREM [29,30] and the standard NF EN 14617-1 [31]. Then, the coefficient of capillary absorption (Cac in kg/m2), the coefficient of water absorption of each block (Cb) and the water absorption (Hp) by total immersion are obtained by applying the Equations (4)–(6) below:
C a c =   M h M d S
With Mh (in g) the mass of the humid sample (in g), Md (in g) the mass of the dry sample at 60 °C (g) and S (in cm2), the surface of the sample in contact with water.
C b = 100   ×   M S × t = 100   ×   ( P 1 P 0 ) S × 10
With, M (in g), the mass of absorbed water by the sample, S (cm2), the immersed surface of the sample and t (in mn), the immersion time.
H p = M h M d M d × 100
Porosity is the cause of many disadvantages in materials, mainly permeability and reduced mechanical strength. The test was carried out according to standard NF P18-459. Porosity is the cause of numerous problems, the main ones being permeability and a reduction of mechanical properties of materials. It is determined in accordance with standard. The calculation of the water accessible porosity (Pw in %) of the composite, expressed as a volume percentage, is given by Equation (7):
P w = M a i r . s a t M d M a i r . s a t M w . s a t . × 100
With, Mair.sat, (in kg) the air saturated mass of the sample, Md, the mass of dried sample, Mw.sat, the saturated mass of the sample.
After hydrostatic weighing (Figure 6), the bulk density ( ρ a p p kg/m3) is determined using the Equation (8), below:
ρ a p p = M d × ρ w M a i r . s a t M w . s a t
Figure 6. Instrumentation on the specimen (a) Measurement of the dimensions and (b) Hydrostatic Weighing System.
Jcs 10 00362 g006

2.2.4. Mechanical and Thermal Behaviour of the Composite

(1)
Abrasion test
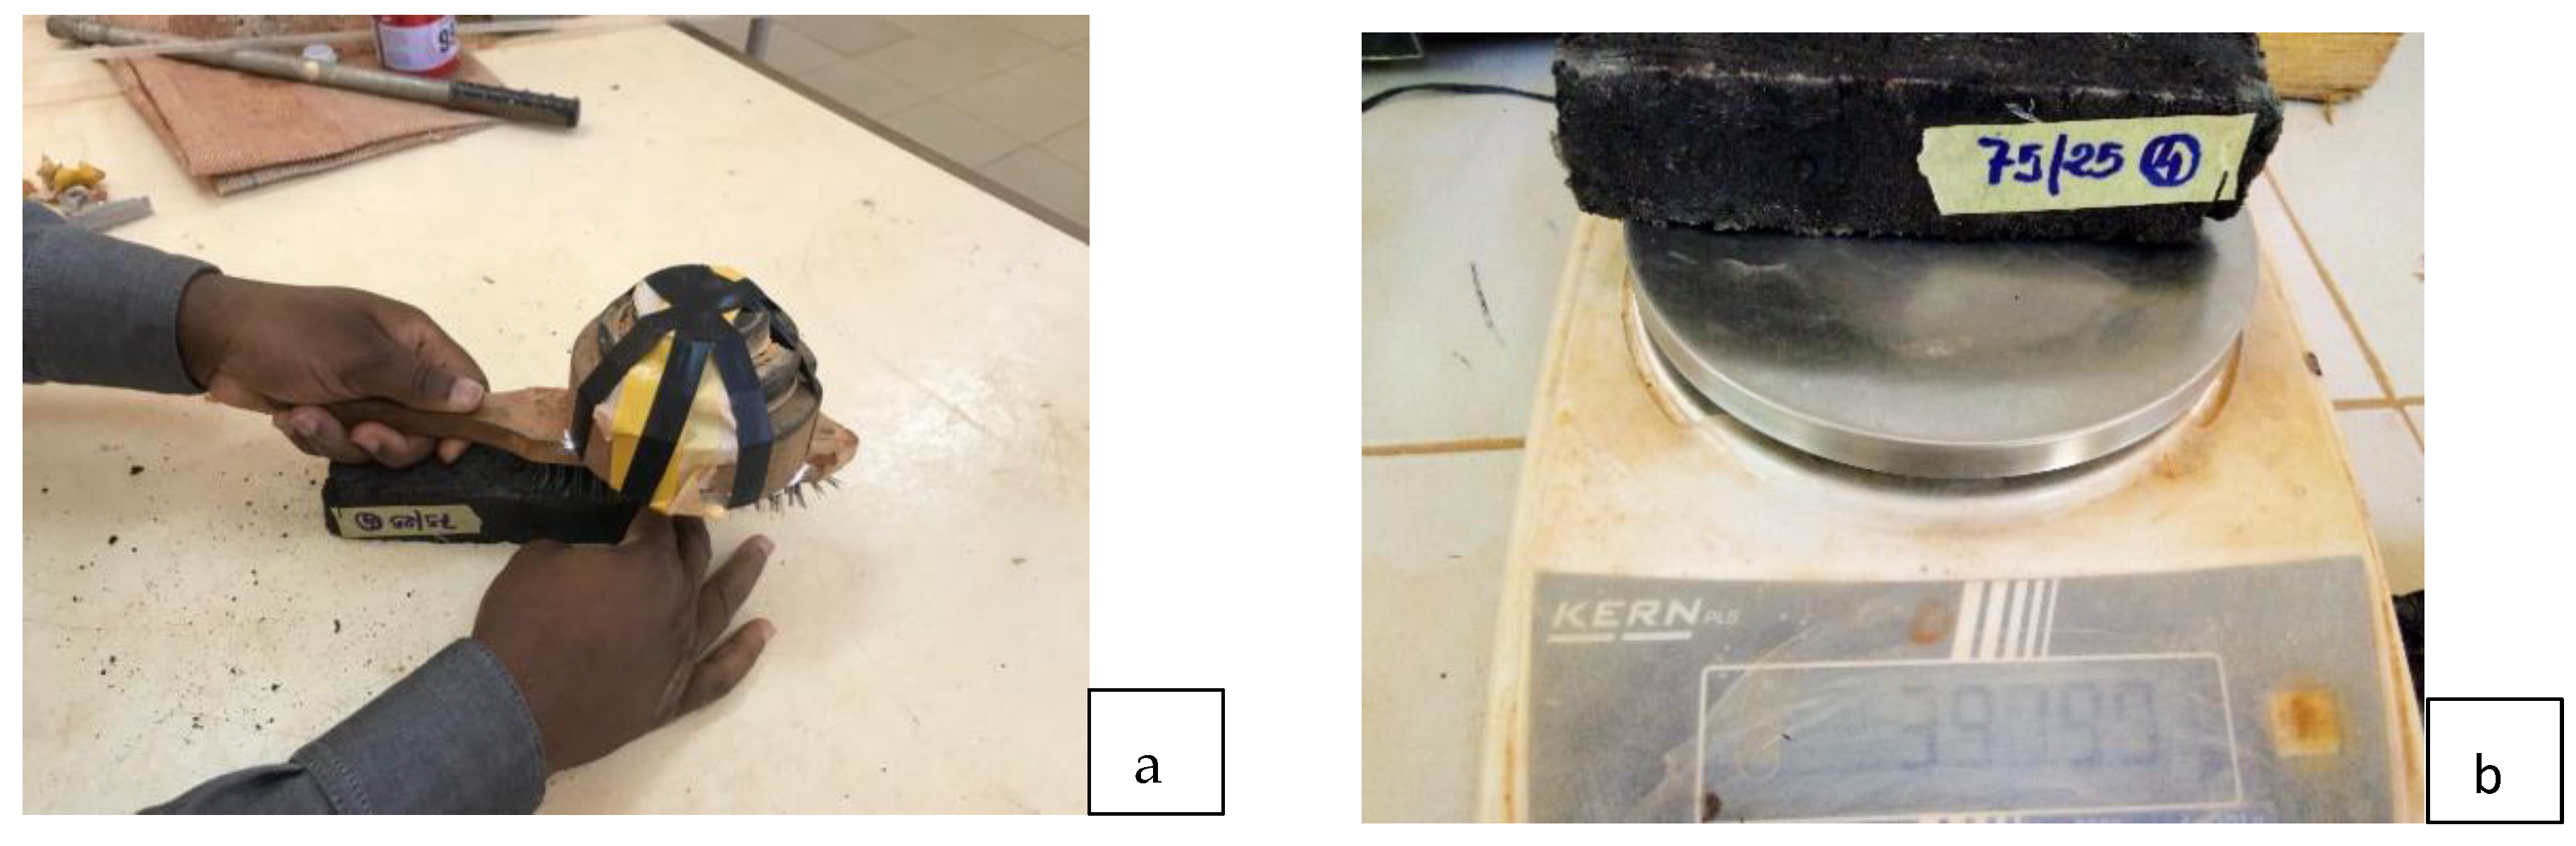
The purpose of the abrasion resistance test is to simulate the composite’s behavior concerning the various erosions eventually caused by human activities or wind. This test is carried out using a steel wire brush loaded with 3 kg to simulate these effects. Brushing is applied on the face of the composite blocks and along their entire length, at the rate of one return stroke per second for one minute (i.e., 60 return strokes) without applying any vertical force to the brush during handling.
These effects are simulated and measured (Figure 7), and the abrasion coefficient (Cab in cm2/g) is conventionally determined by Equation (9), where Mo (g) and Mf (g) are the mass of the sample, respectively, before and after abrasion and S (cm2) is the abraded section of the sample.
C a b = S M 0 M f
(2)
Thermal and mechanical characterization
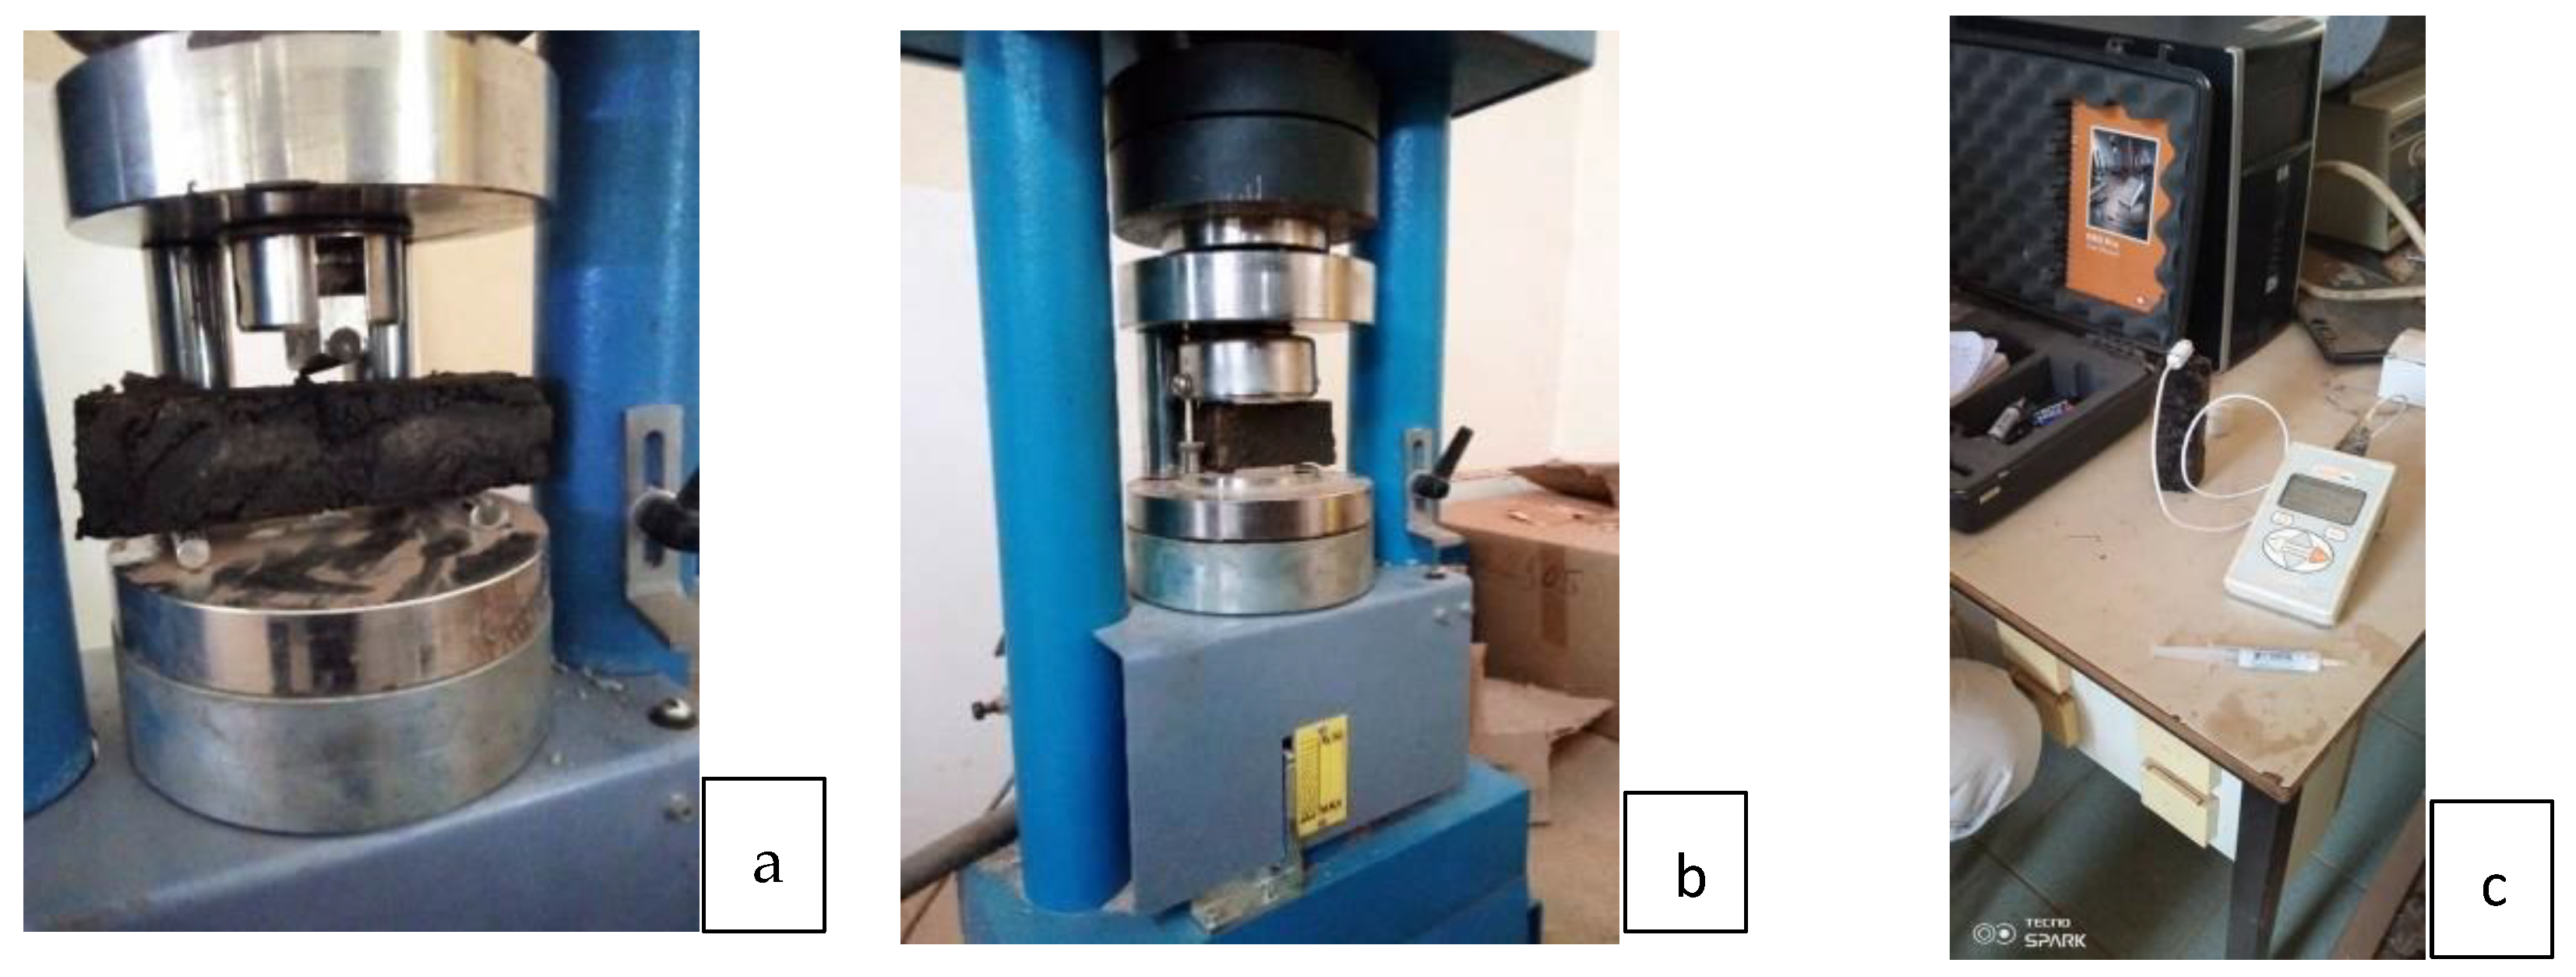
The mechanical characterization concerned the determination of Compressive and Three-point bending strength of the composite sample (Figure 8a,b). The three-point test is conducted referring to standard EN 196-1 [32]. The composite flexural strength, Rf (MPa) and compressive strength, Rc (MPa), were calculated using Equations (10) and (11). With Ff and Fc the applied charge (kN), l, the length (m) of the sample, and S, the surface (cm2).
R f ( M P a ) = ( 1.5 × F f × l )   /   b 3
R c = F c / S
The composite thermal characterization was conducted by using the thermal conductivity meter KD2 Pro Decagon© (Figure 8c). This device can measure at same time the value of thermal conductivity (λ) from 0.1 to 2 W/m·K, volumetric thermal capacity (C) from 0.5 to 4 MJ/m3·K and thermal diffusivity (α) from 0.1 to 1 mm2/s.

3. Results and Discussion

3.1. Setting up and Calibration of the Experimental Device

Following installation of the solar energy collection, PW melting and mixing equipment, we carried out calibration experiments under no-load and full-load conditions. The results are presented in Figure 9 and Figure 10 below.
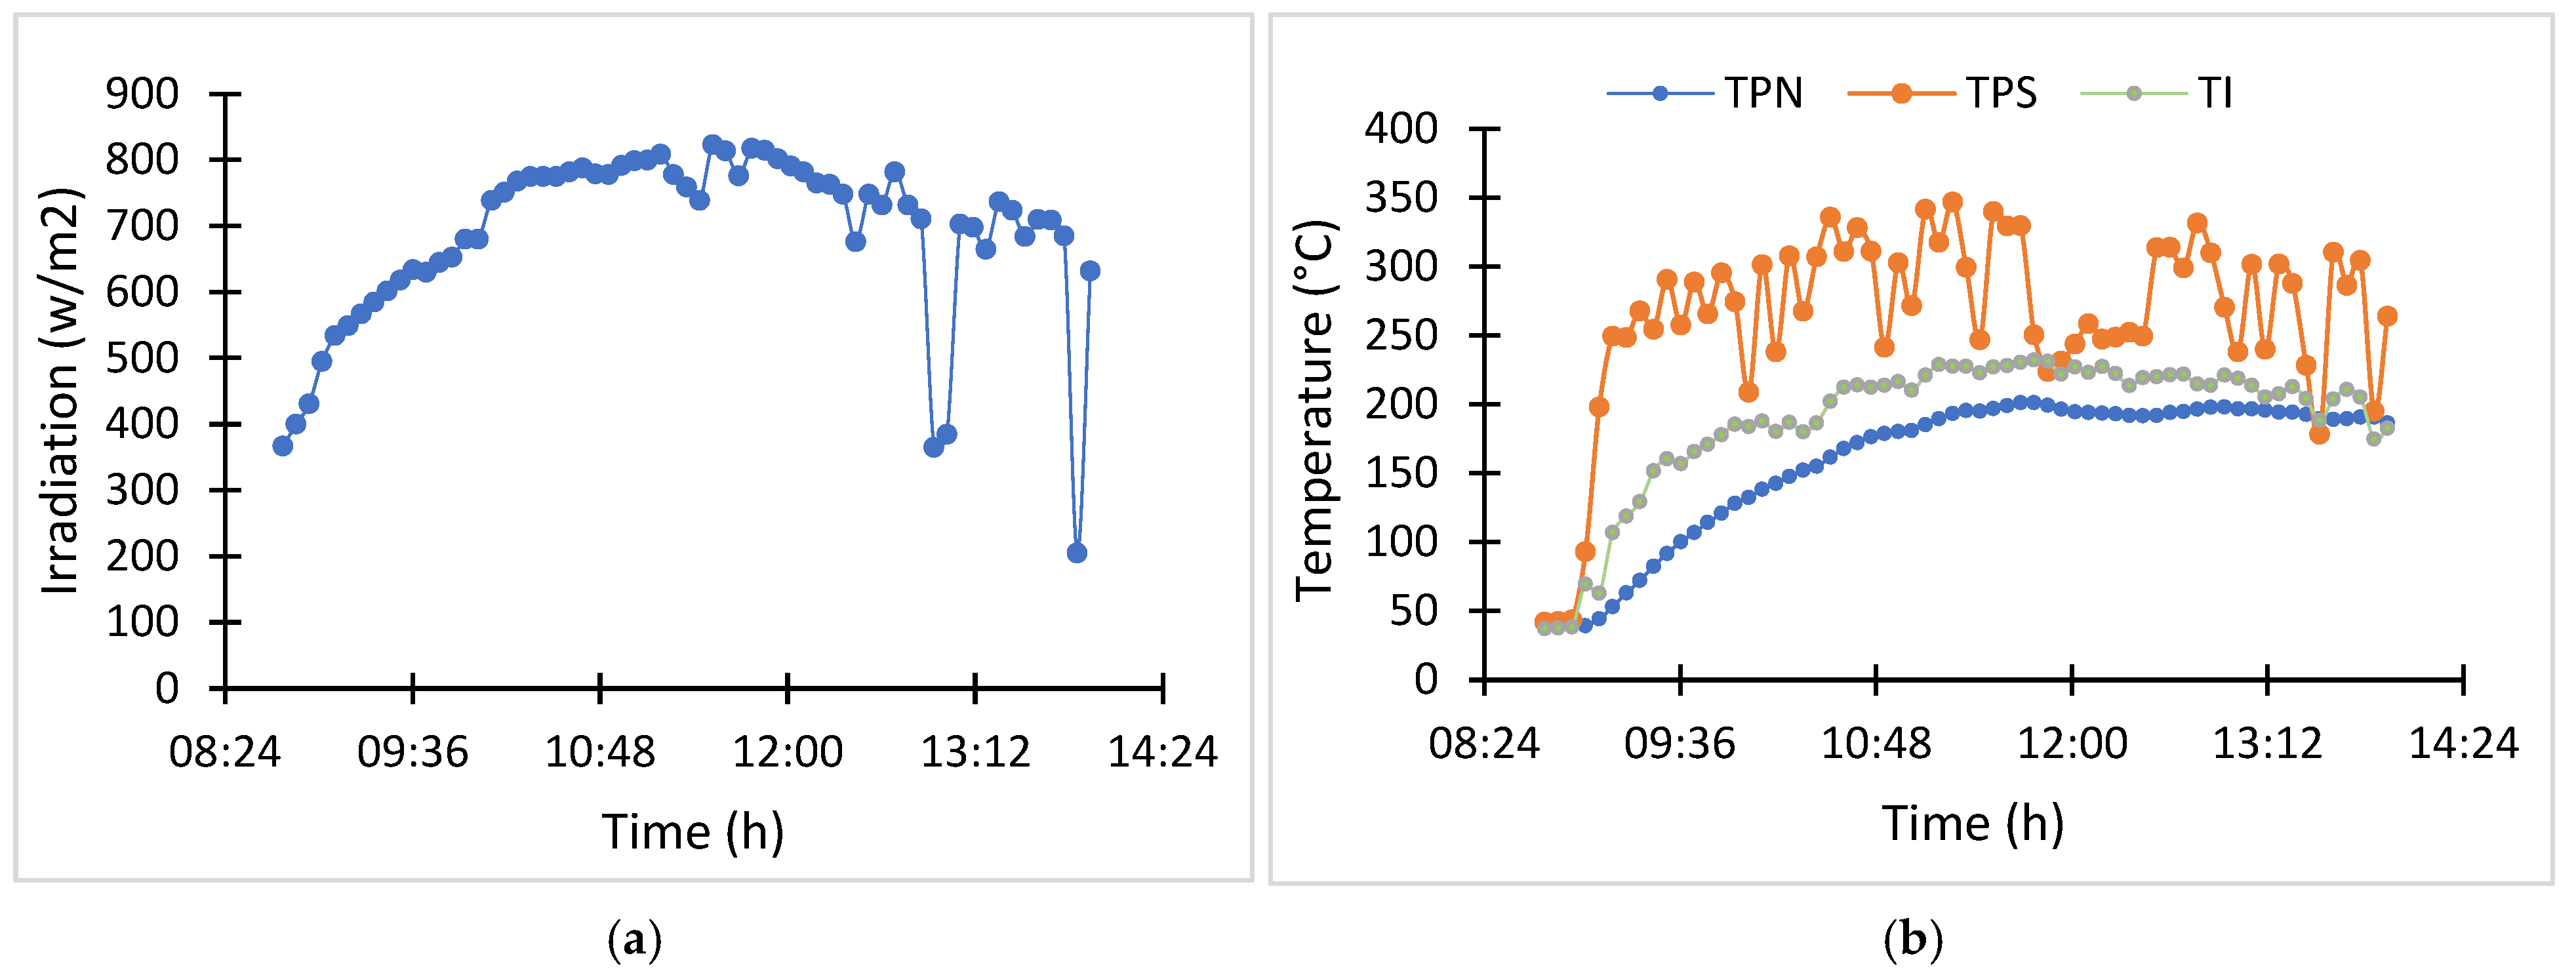
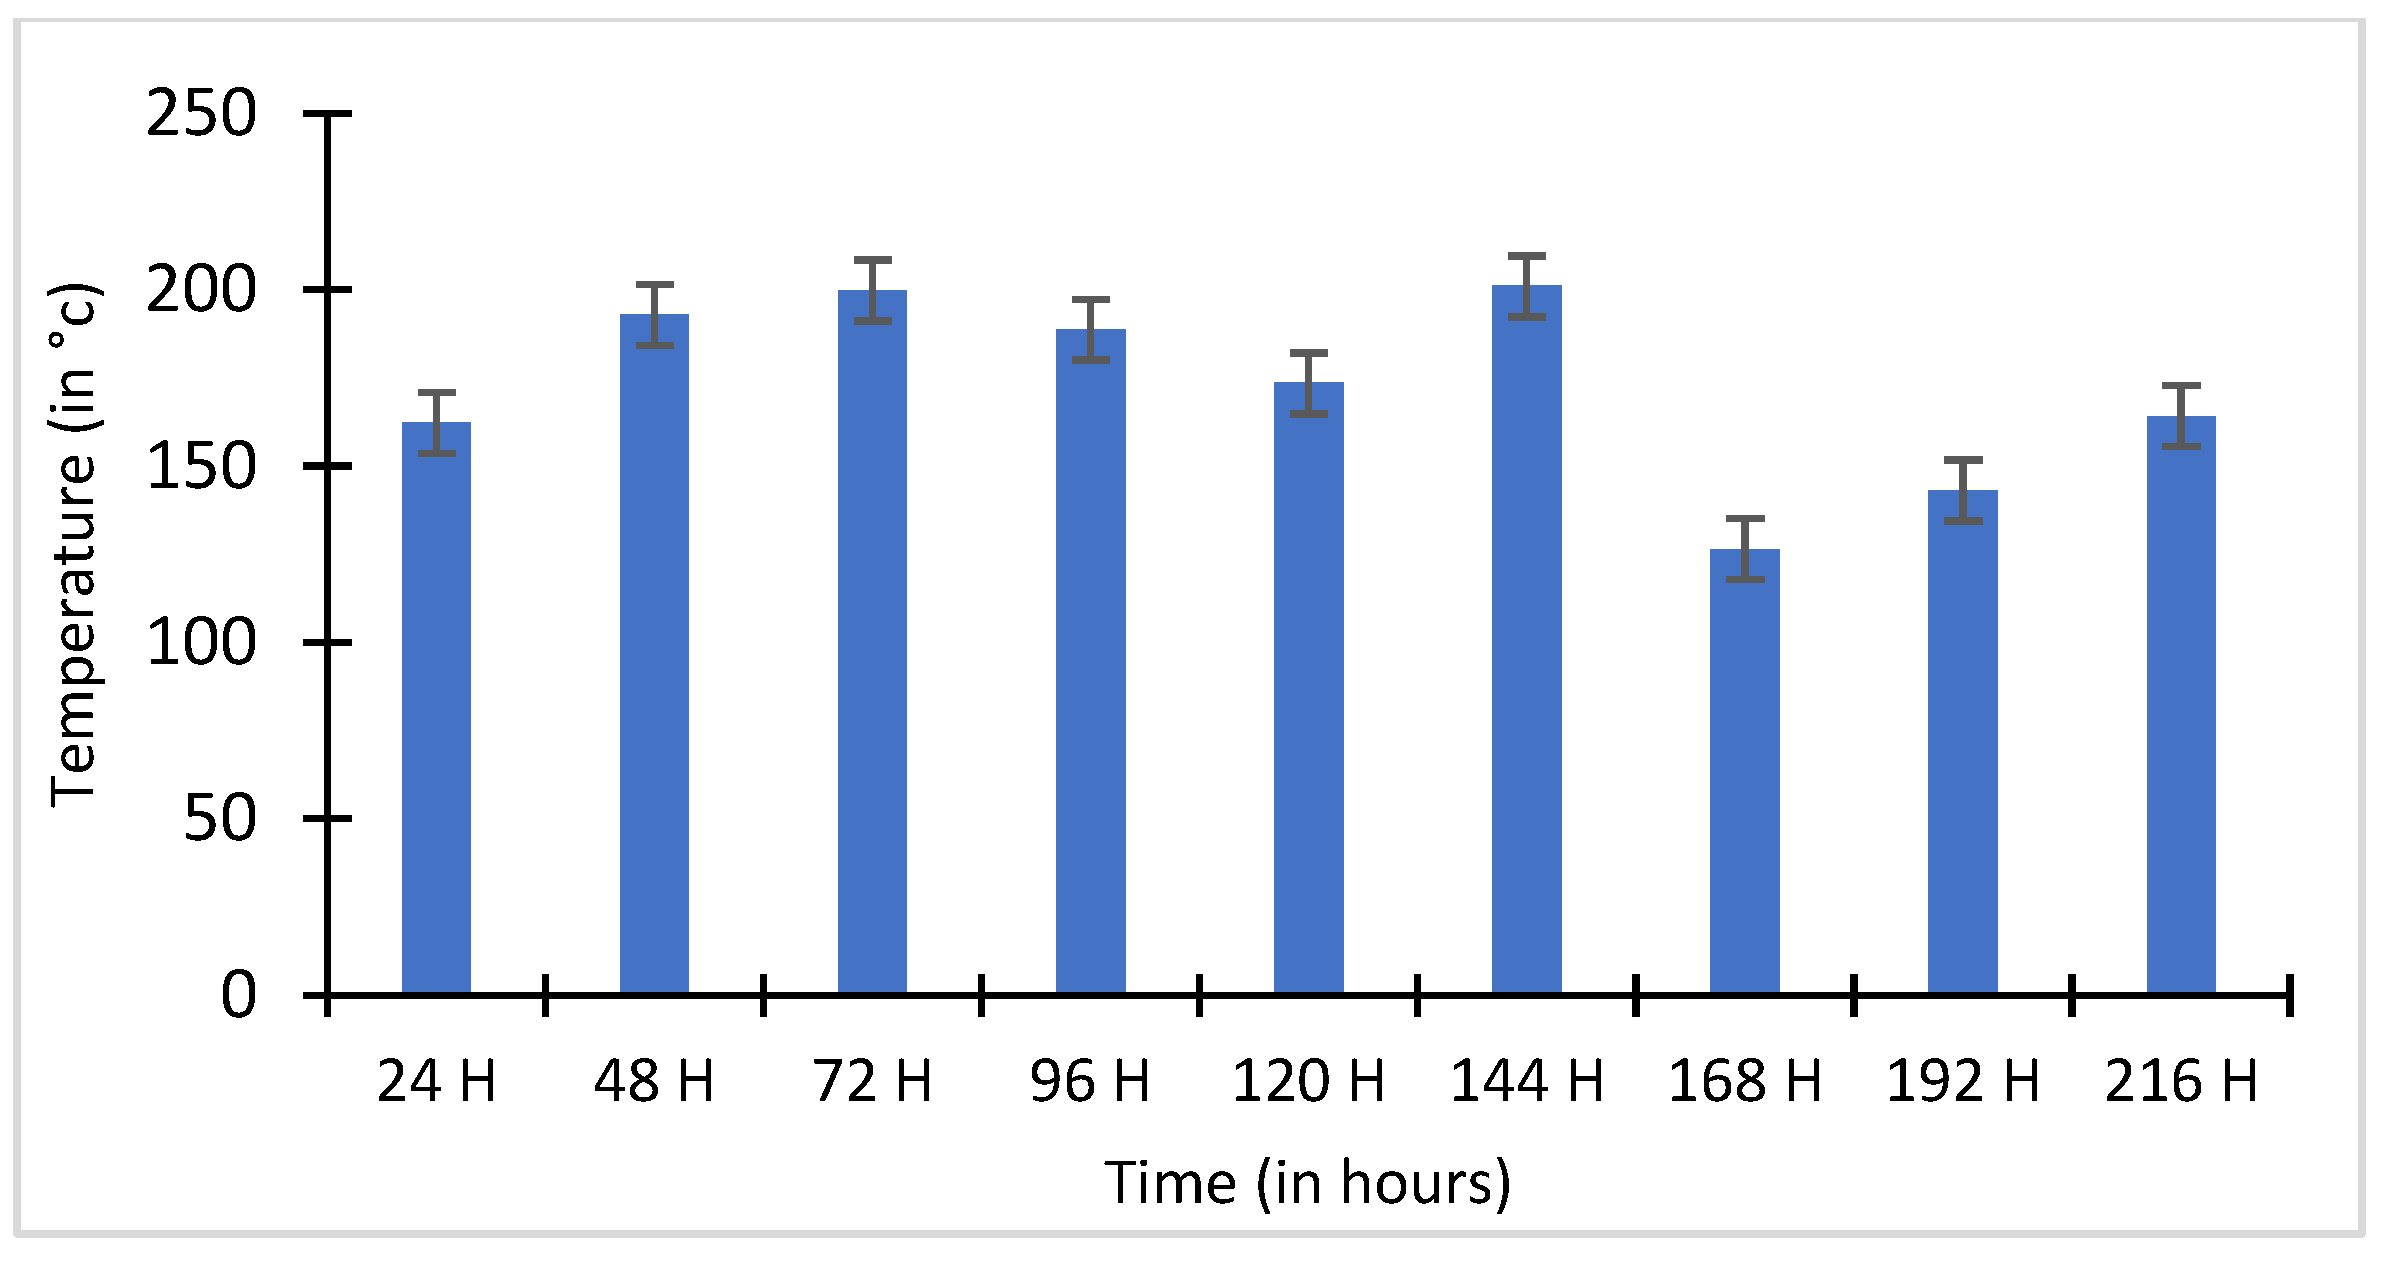
Over a period of 7 h, an average internal temperature of 189.23 °C was obtained at the receiver with an average solar radiation of 686.22 W/m2, as shown in Figure 10. The energy is supplied by the pair of RSDN (North-facing Scheffler Reflector) in aluminium mirror (m.e.a) and RSDS (South-facing Scheffler Reflector) in m.e.v. The curves in Figure 9b show that the TPNs remain almost lower than the TPSs and are carried respectively by the energy supplied by the RSDN in m.e.a and the RSDS in m.e.v. The high reflectivity of the glass mirrors can explain this performance.
The optimal internal temperature is around 200 °C, and the mean internal temperature obtained during the composite formulation procedure is 172.42 °C. The temperature evolution indicated that in case of Ouagadougou area, the best period to record optimal internal temperature is in the range from 10 h to 13 h A.M.

3.2. Physical Characteristics of the Composite Specimen

3.2.1. Dry Density and Withdrawal of the Composite Specimen

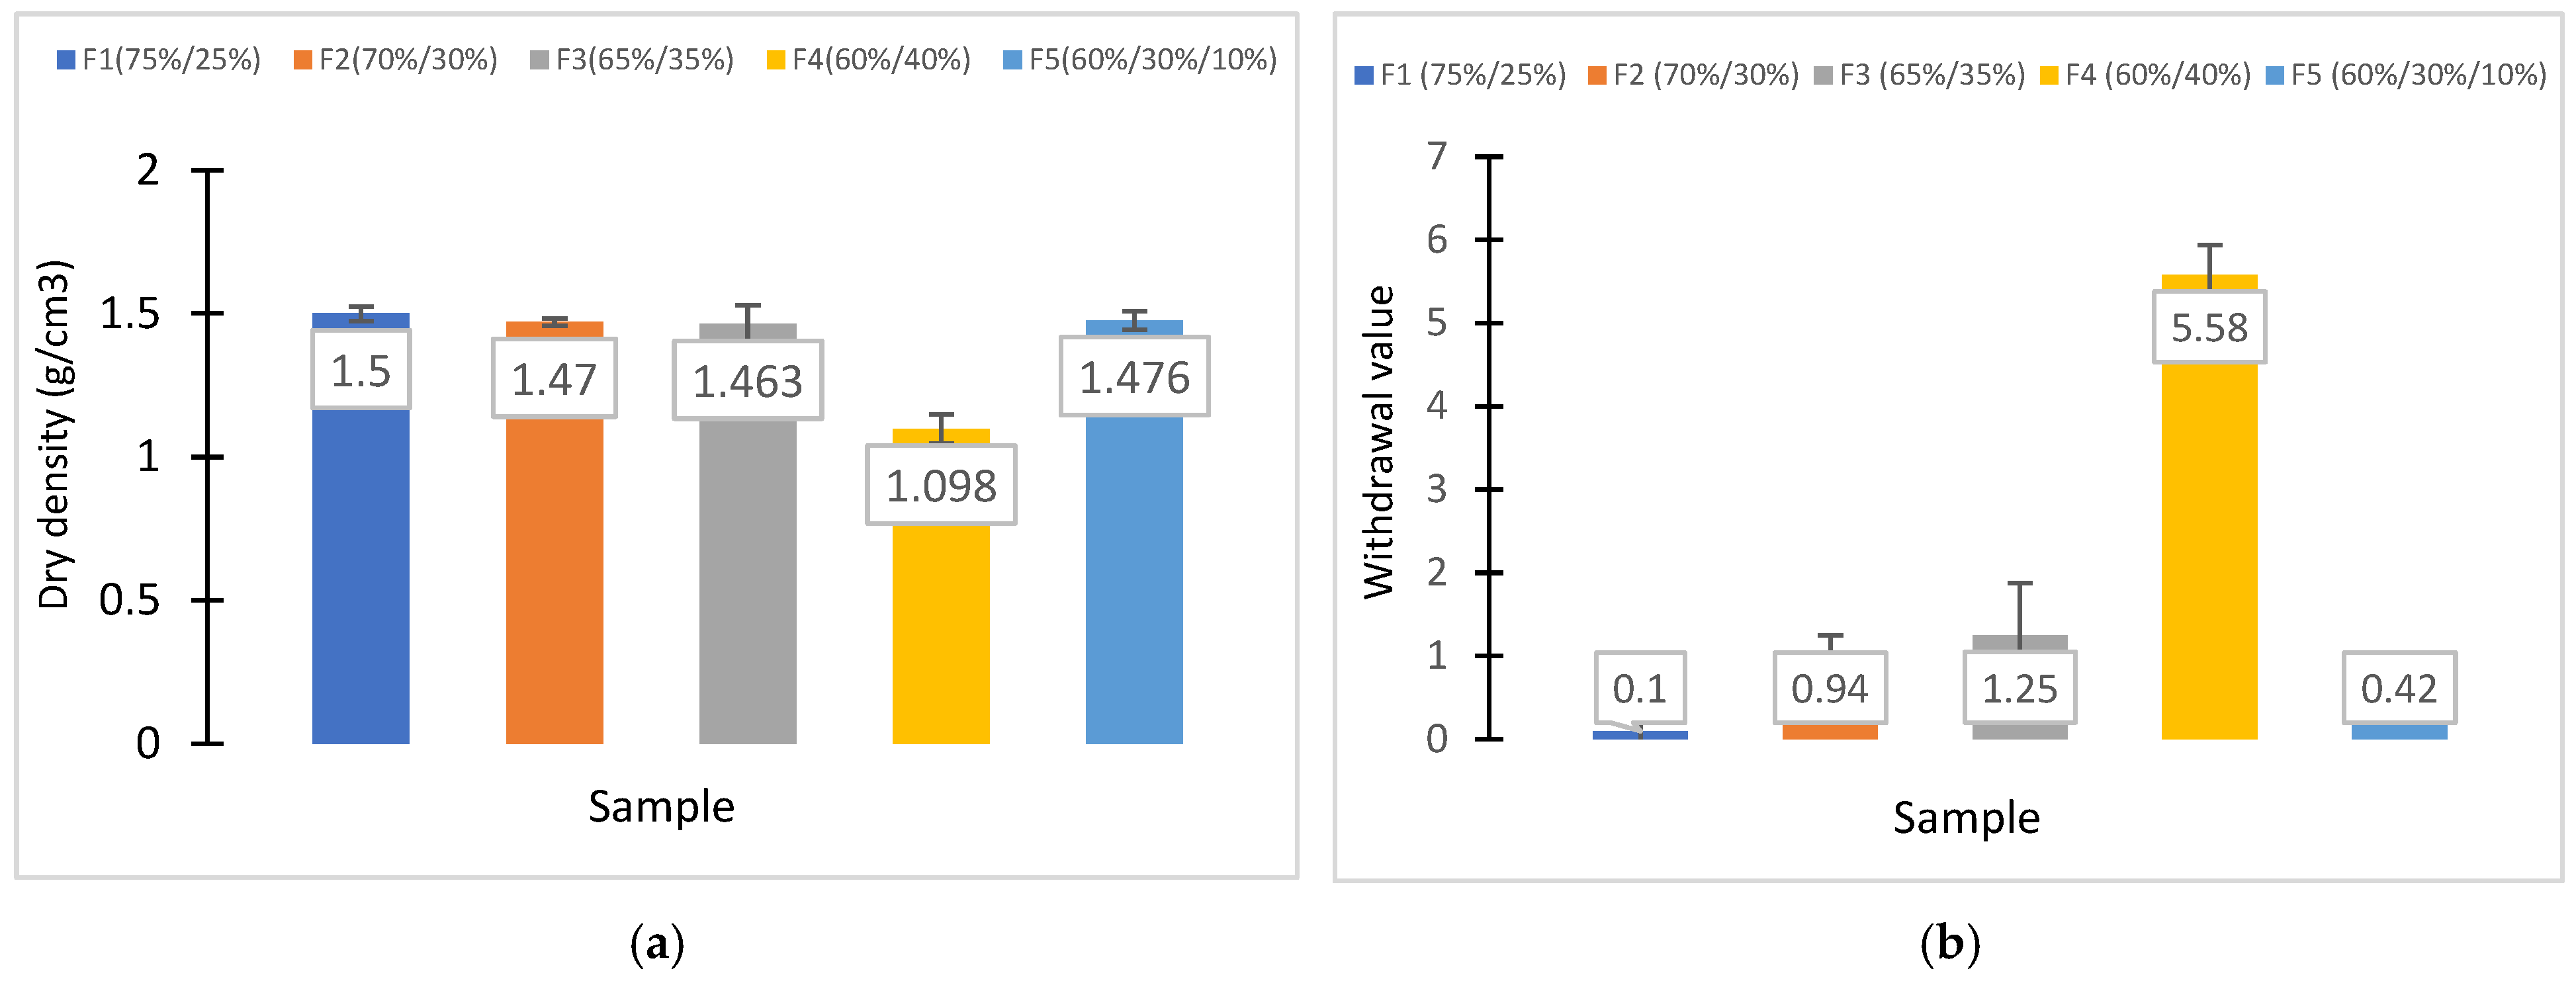
Figure 11 shows a decrease in density as the plastic waste content increases. This decrease is due to the material’s plastic-like properties, which have a lower density (0.96 g/cm3) than sand’s (1.5 g/cm3).
There is a noticeable increase in the shrinkage rate of the samples as the plastic waste content increases. The shrinkage is due to the contraction of the plastic as it cools. The higher the plastic waste content, the greater the shrinkage and the more cracks appear in the material.

3.2.2. Water Accessible Porosity

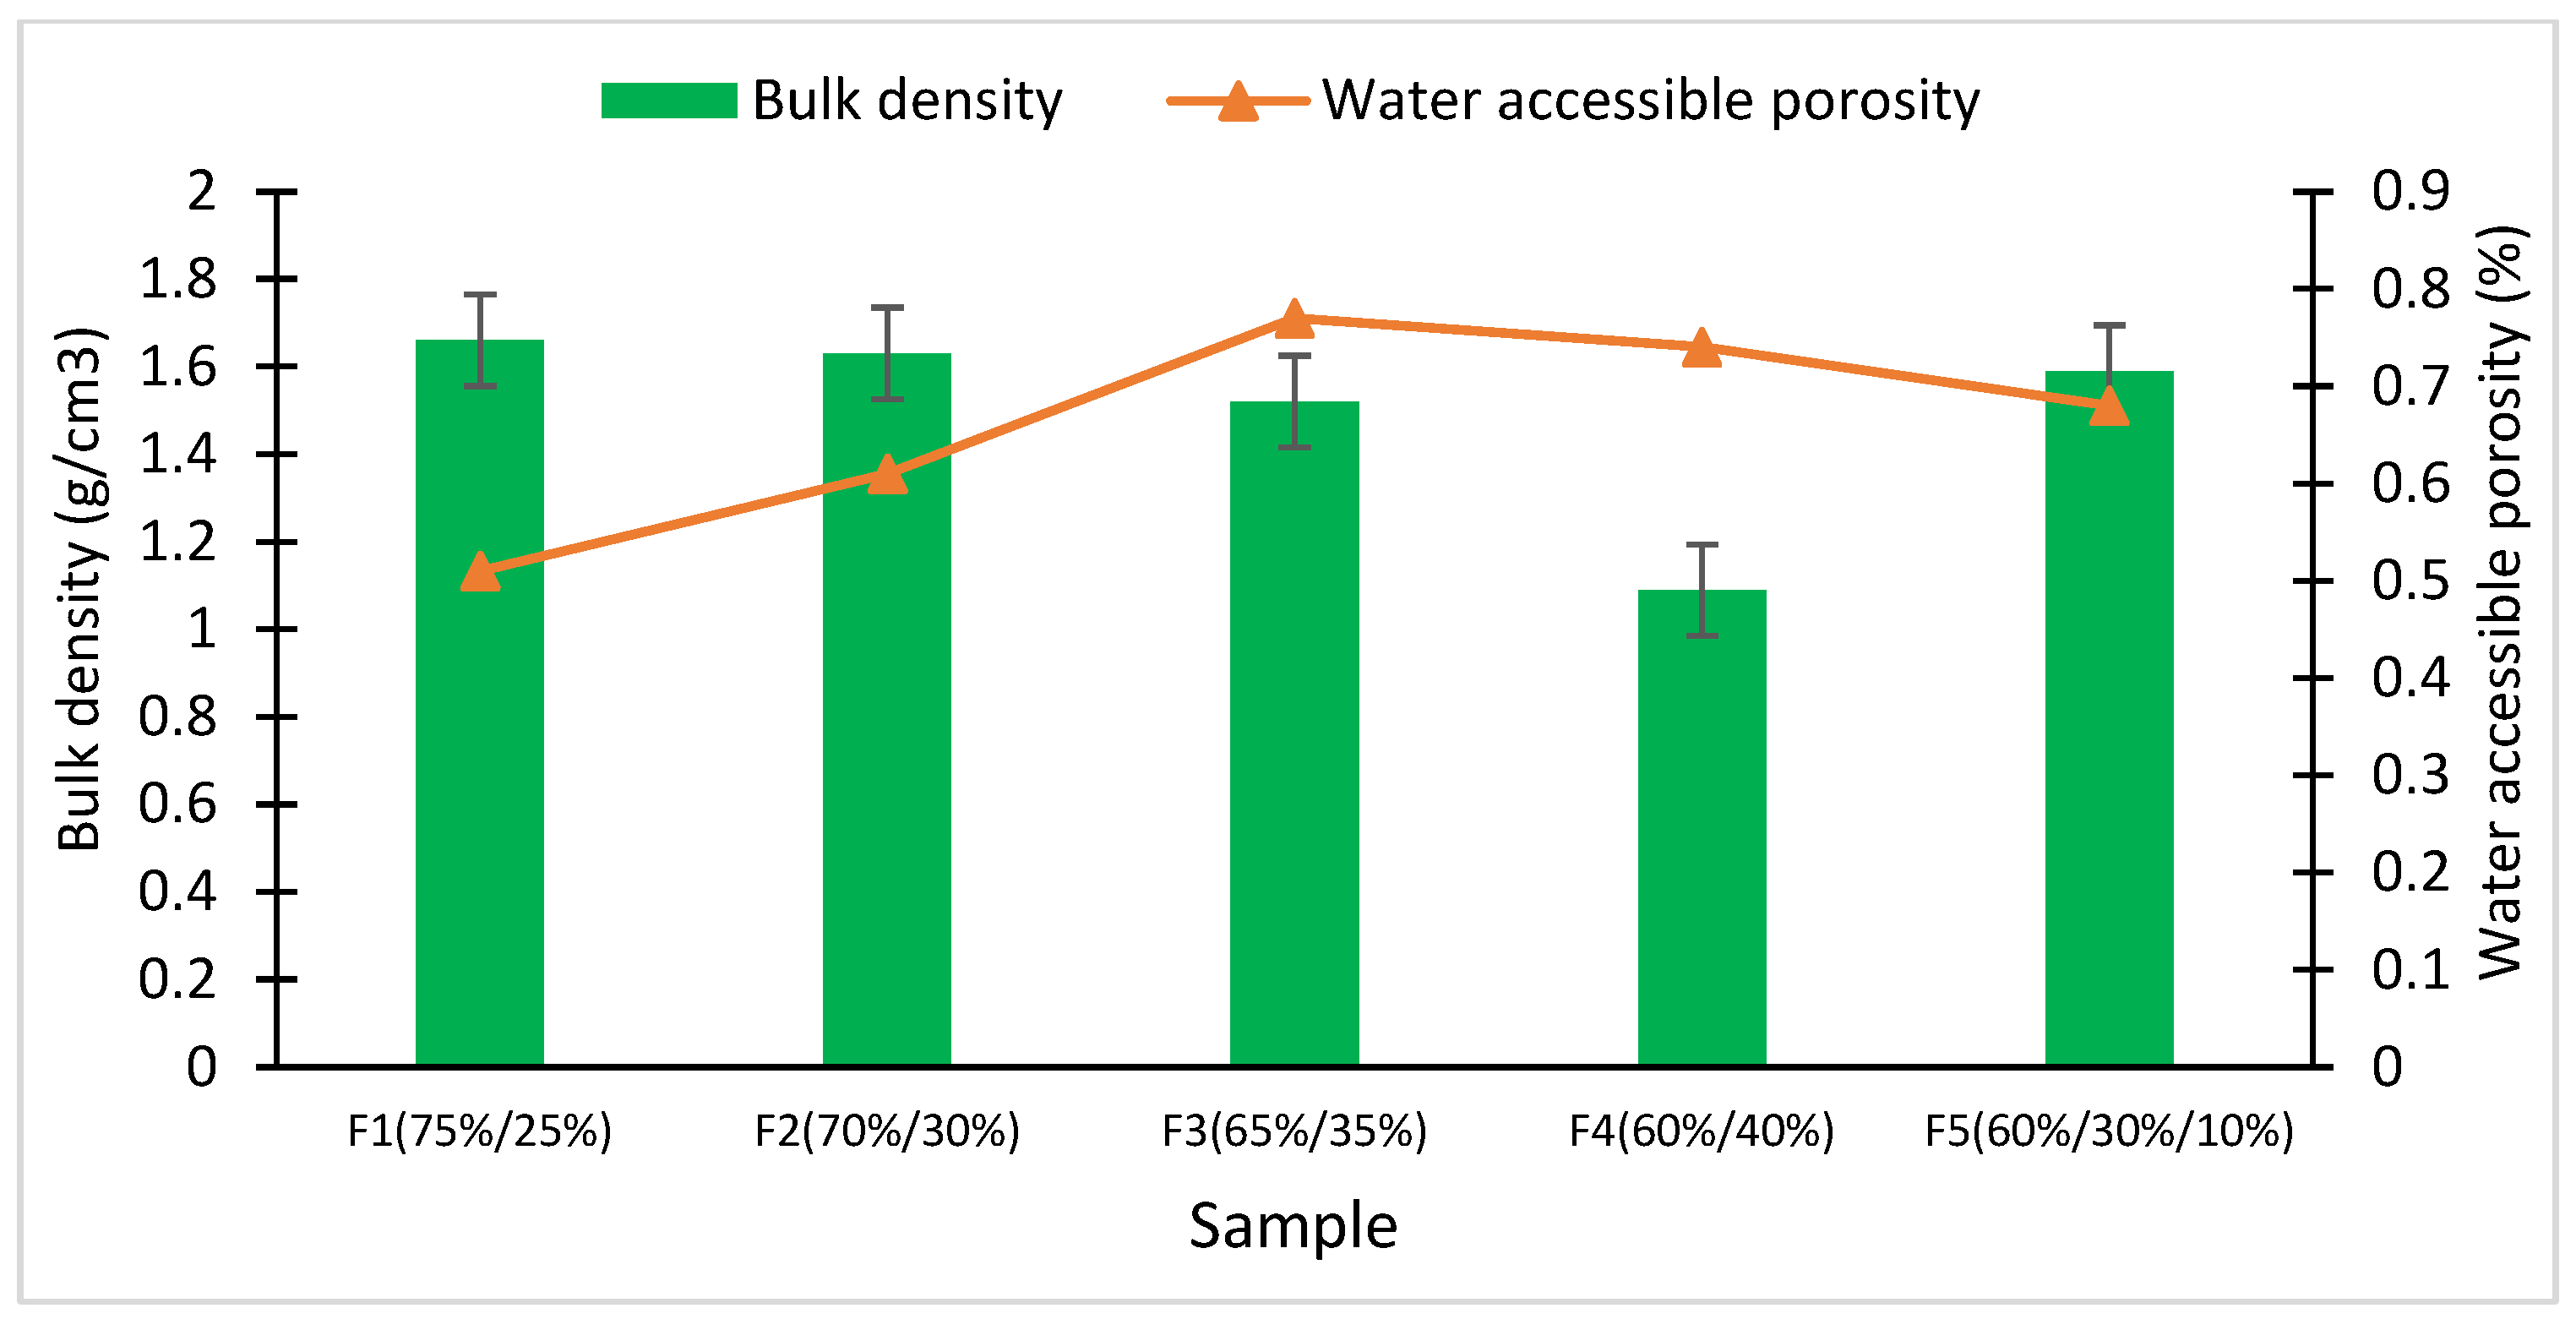
Material porosity is linked to its density, as shown in Figure 12. The denser the composite (1.66 kg/m3), the fewer pores it has (0.51%). Conversely, the less dense it is (1.09 kg/m3), the more porous it is (0.74%). This observation can be explained by the good adhesion between the filler (sand) and the matrix (HDPE) in our products (excellent mixture stability), and the porosity test gave satisfactory results with values ranging from 0.51 to 0.77%. The role of binders is to ensure that the material does not absorb water. In addition, compaction using a hammer and trowel further eliminates voids and pores that could store water. Figure 12 shows that the density decreases with the increase in the rate of PW in the mixture, and the maximum value of accessible porosity is 0.77% with composite F3, 65 wt% of sand/35 wt% of PW.
The loading of laterite soil as partial replacement of sand in the mixture has a positive impact on the fines particles and reduces the composite porosity.

3.2.3. Water Absorption

Figure 13 and Figure 14 present the composite behavior in contact with water, by capillary and by total immersion, and its sorptivity is summarized in Table 5.
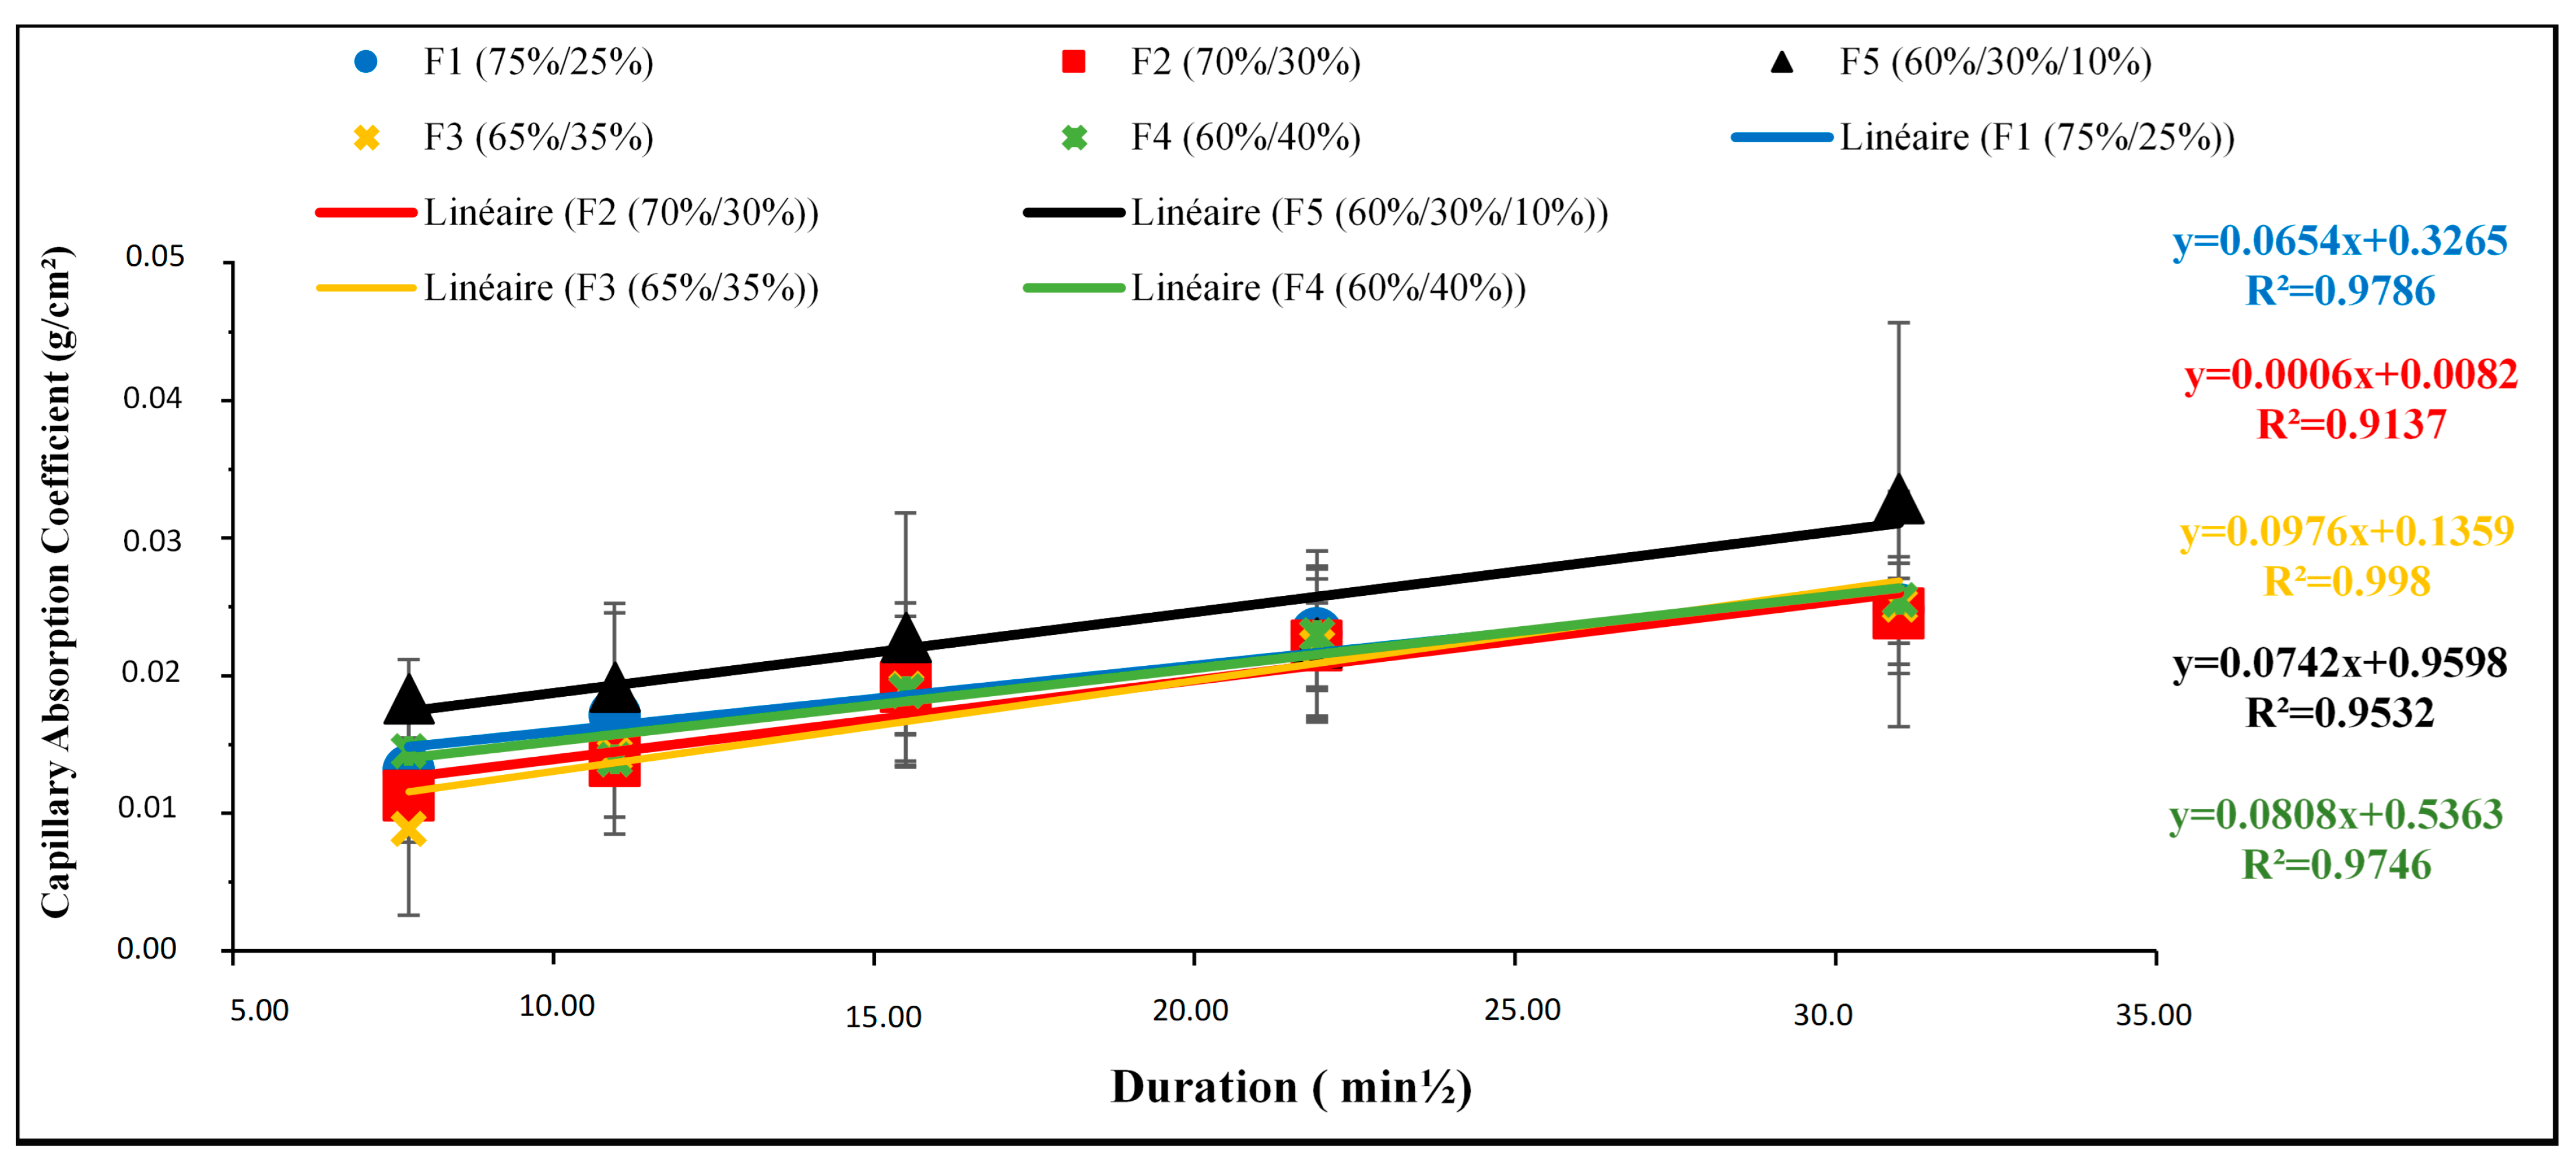
Figure 13 presents the composite capillary absorption from 1 to 24 h and allows us to appreciate the sorptivity of water as a function of the composite internal structure. The sorption coefficient of specimen F2 (70%/30%) and F3 (65%/35%) is, respectively, 0.0006 and 0.0976, resulting in a rapid evolution in capillary water rise in specimen F3 (65%/35%) compared to specimen F2 (70%/30%). This can be explained by the densification in specimen F2 (70%/30%), which reduces its porous structure compared to specimen F3 (65%/35%).
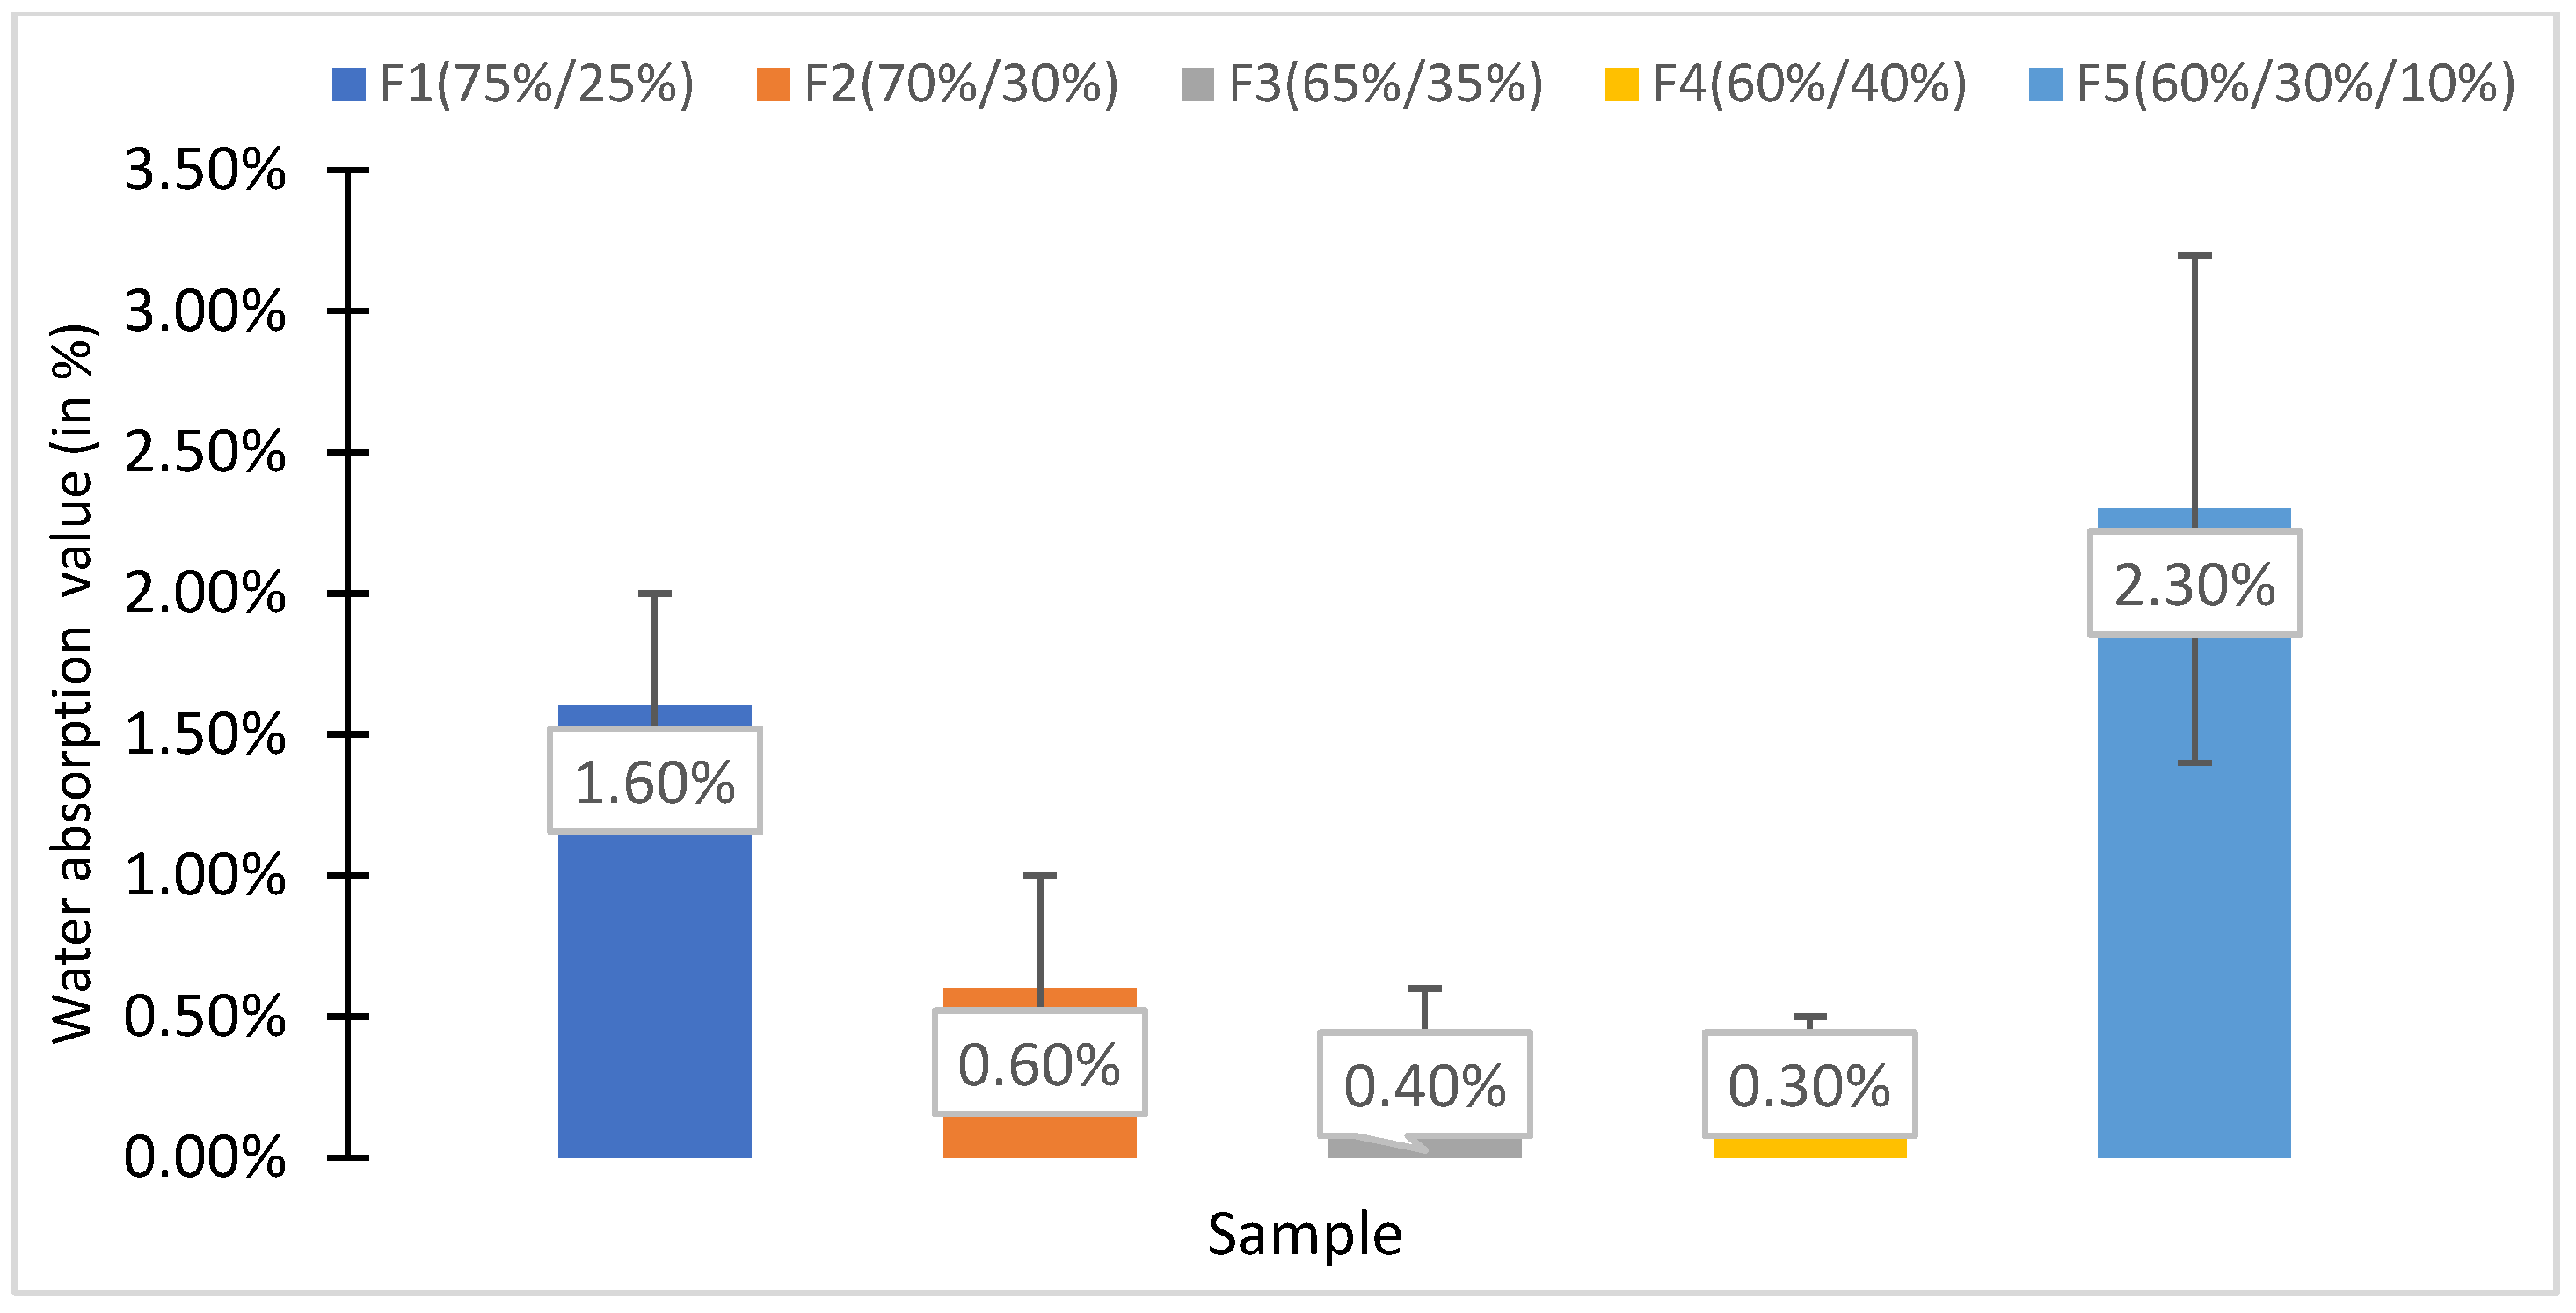
The analysis of results presented in Figure 14 and Table 5 shows the decreasing of water absorption by total immersion from 1.6% to 0.3% when the ratio of PW in the mix increases from 25 wt% to 40 wt%. This is due to the hydrophobic nature of plastic, which prevents water from entering the composite. F5 (60%/30%/10%) composite has high water absorption with the addition of laterite soil, which is a material that is highly sensitive to water.

3.3. Mechanical Characteristics of the Composite

3.3.1. Abrasion Test

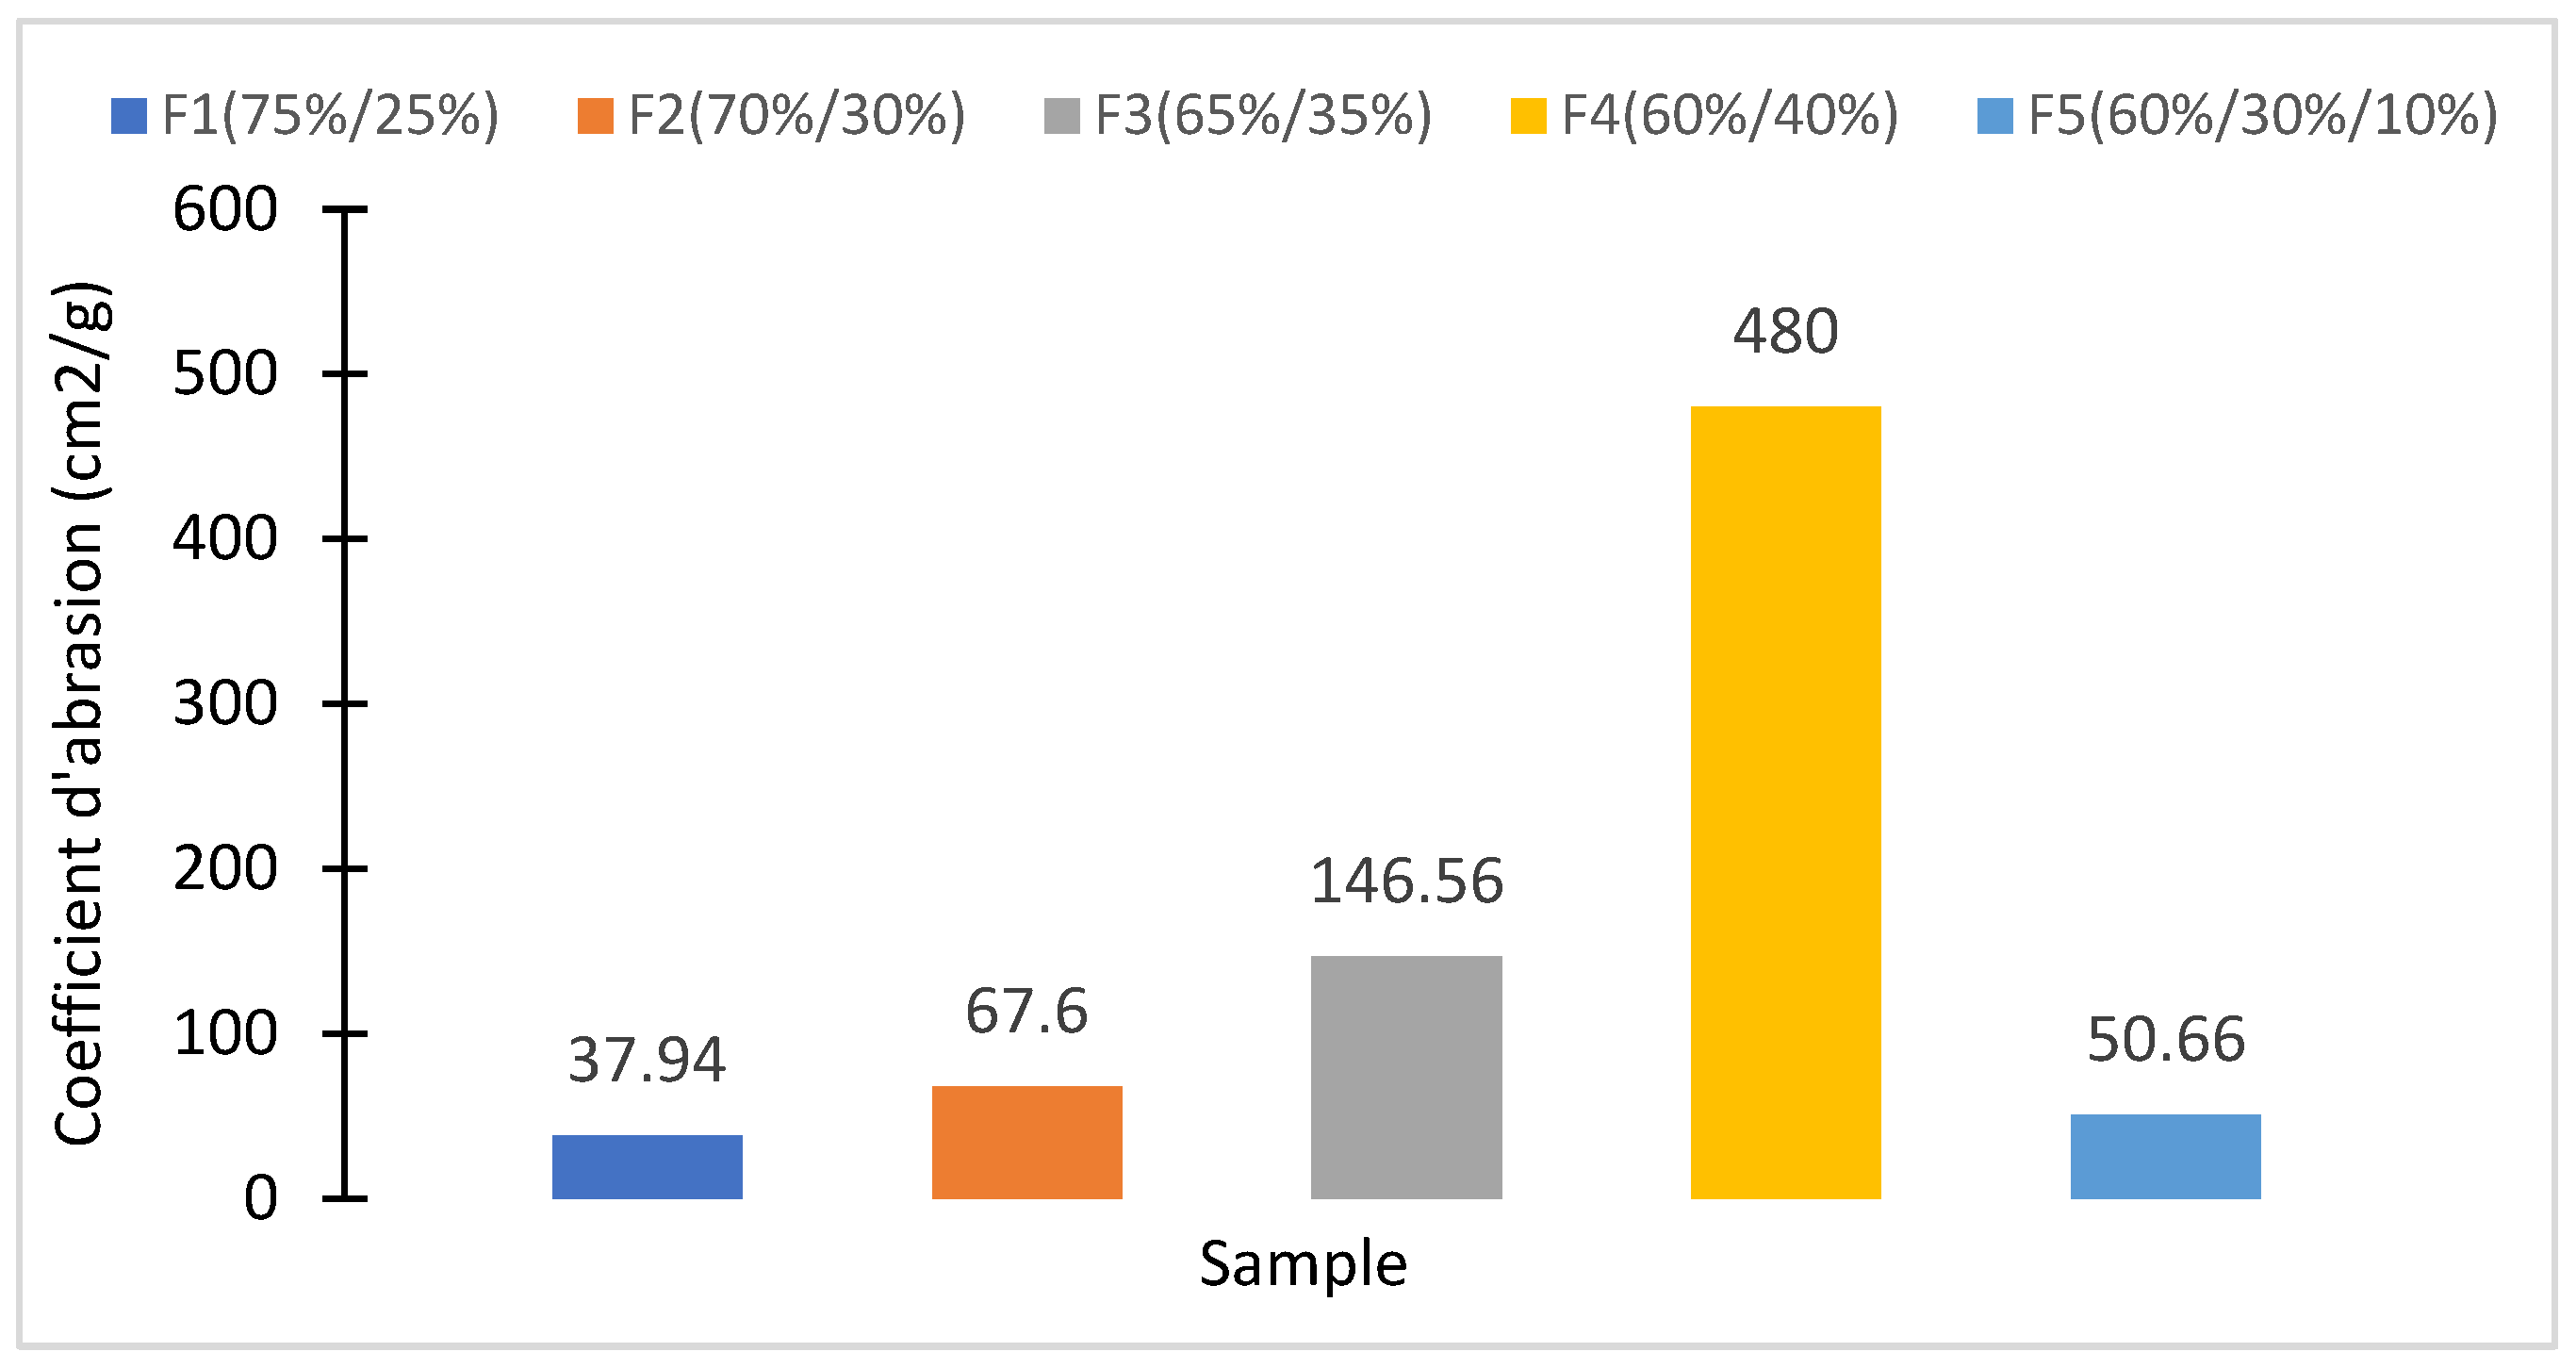
Figure 15 shows the evolution of abrasion coefficient (Ca), which ranges from 37.94 cm2/g–480 cm2/g depending on the loading rate of PW in the mixture.
The abrasion coefficient (Ca) decreases while the PW rate increases from 25 wt%–40 wt% in the composite mix, with the grains’ consolidation in contact with the melted plastic. The supplementary load of 10 wt% of laterite soil in mix F5 (60%/30%/10%) impacts the abrasion coefficient, which is less (50.66 cm2/g) in comparison to the specimen F2 (70%/30%) with the same rate of sand in the mixture. This observation must be further investigated with several rates of laterite in the mix. The low consolidation of the composite F4 is due to the increase in PW rate in the mixture and its impact on the repartition of the fillers.

3.3.2. Flexural and Compressive Strength

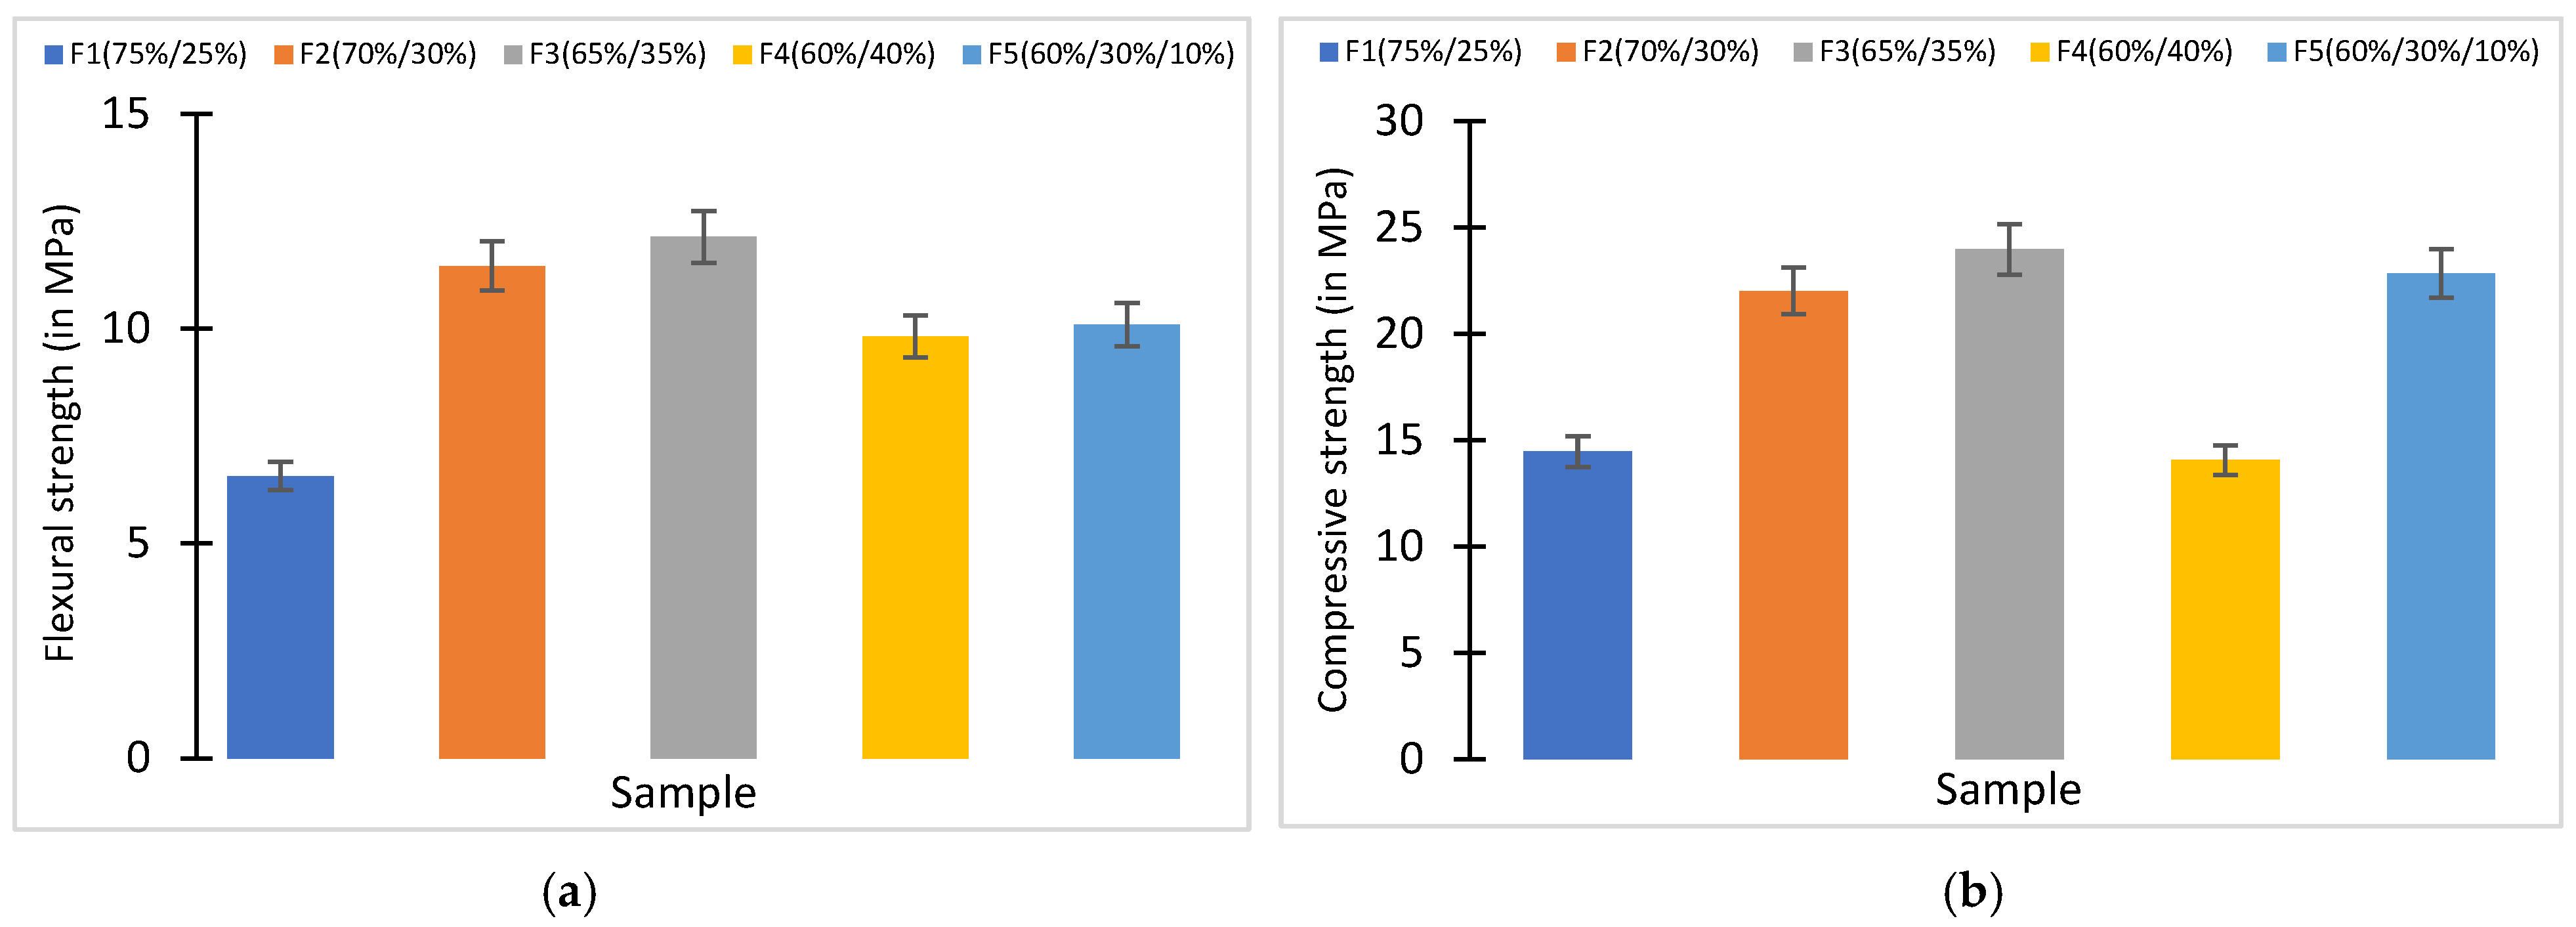
Figure 16 presents the flexural strength (Figure 16a) and the compressive strength (Figure 16b) with the maximum value obtained with the composite specimen F3 of 35 wt% PW and 65 wt% of sand.
For the composite with 25 wt% of PW, the compressive and flexural strengths are low because the quantity of melted plastic in the mixture is insufficient to bind the grains of sand.
On the opposite, when the quantity of plastic waste exceeds 35 wt%, there is too much plastic waste in the mixture, which affects the technical quality of the material, because the mechanical strength of plastics is lower than that of the sand [8,12]. The tests on pavers made of sand and plastic obtained by fusion in Ouagadougou show very low mechanical strength for the same percentages of sand and binder compared with our samples. Indeed, for a sand/plastic ratio of 70/30, the compressive strength of their pavers is 2.41 MPa, whereas with our process, the compressive strength is 22.01 MPa [10].
Furthermore, we noted that the compressive strength and flexural strength of the composite decrease with the loading of 10 wt% of laterite soil in the mixture in partial replacement of sand. Then, for this composite specimen F5 (60%, 30%, 10%), the compressive and flexural strengths are 22.83 MPa and 10.1 MPa, respectively, and an increase of 3.72% and decrease of 11.86% compared to specimen F2 (70%, 30%). In fact, laterite soil particles are very fine (4–5 µm), they intercalate between the coarse grains of sand, and contribute to resisting constraints. These fine particles increase the force opposing the stress and result in an increase in both compressive and flexural strength.

3.4. Thermal Characteristics of the New Composite

3.4.1. Thermal Conductivity (λ)

The conductivity of HDPE polymer is lower than that of sand. Thus, when the plastic waste content in the composite increases, plastics tend to slow down. Thermal conductivity is the ability of a material to conduct heat. It is a physical quantity that characterizes the behavior of materials during heat transfer by conduction. The figure shows the variation in thermal conductivity of the samples.
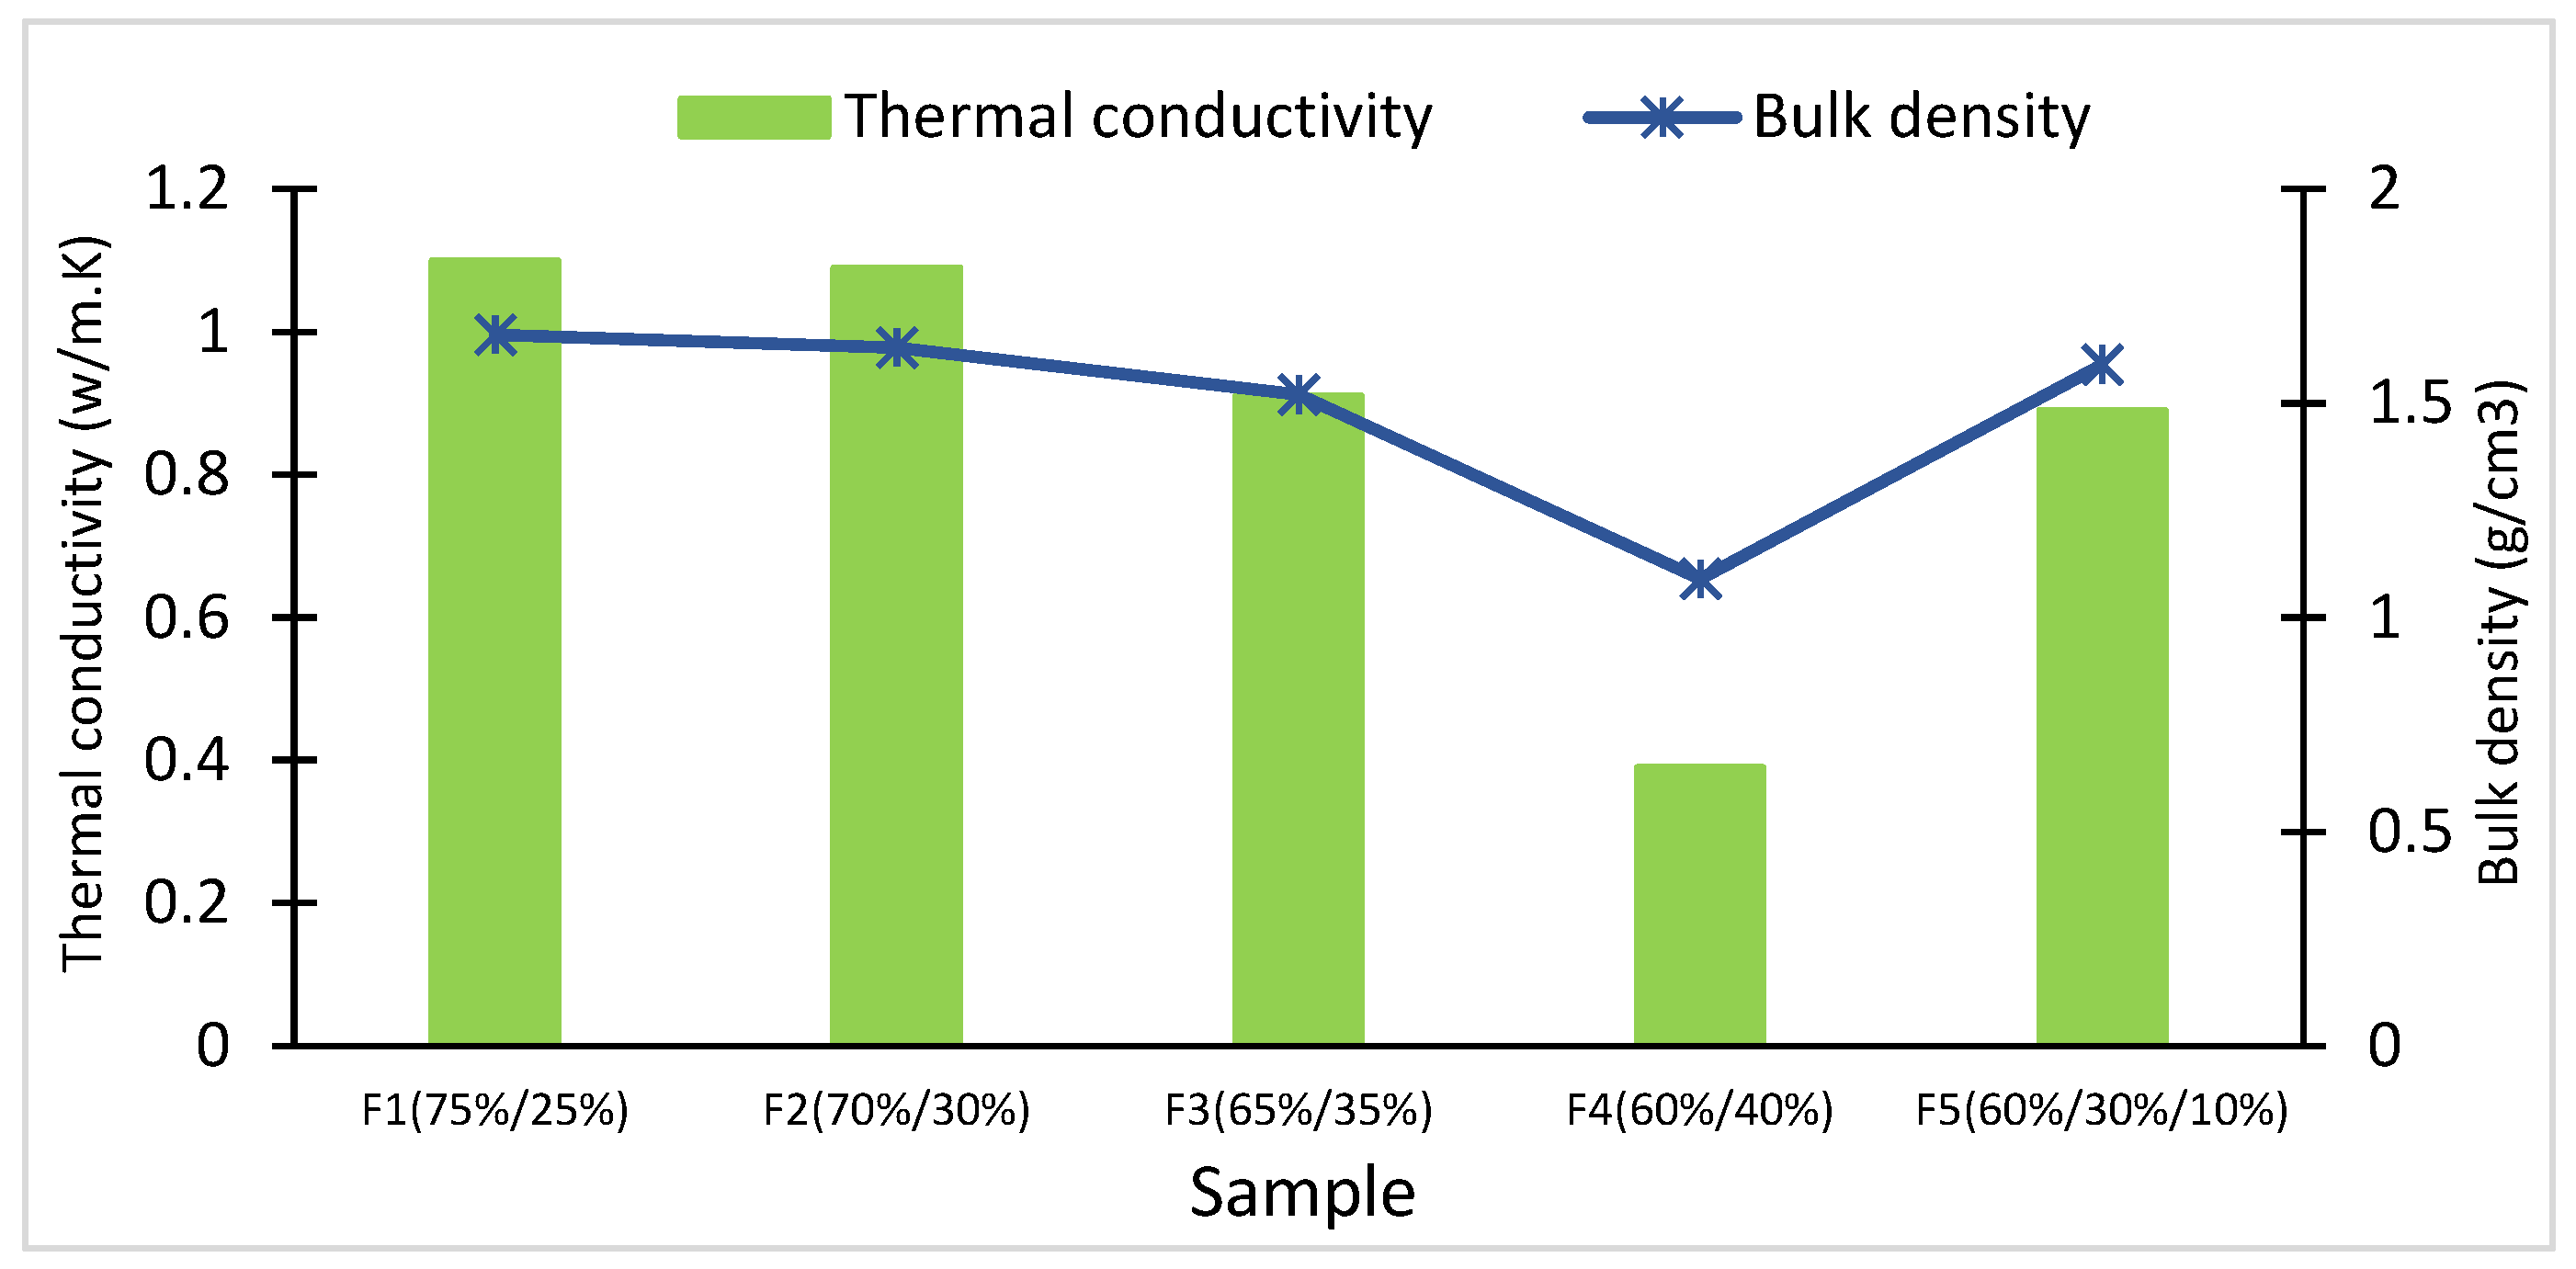
From Figure 17, we note that the increase in PW in the mix results from the decrease in thermal conductivity of the composite. This can be explained by the polymer thermal conductivity and the composite densities. The conductivity of HDPE polymer is lower than that of sand. Thus, when the plastic waste content in the composite increases, plastics tend to slow down the propagation of thermal heat compared to sand, which reduces the overall conductivity of the composite. Furthermore, Figure 17 shows that as the bulk density of the composite decreases, the thermal conductivity also decreases. This thermal behavior is probably due to the change in the compactness of the composite. These results corroborate those obtained by [7,33]. Thermal conductivity, mechanical strength, and density are the critical parameters that must be taken into account when choosing thermal insulation materials for buildings.

3.4.2. Heat Capacity and Thermal Diffusivity

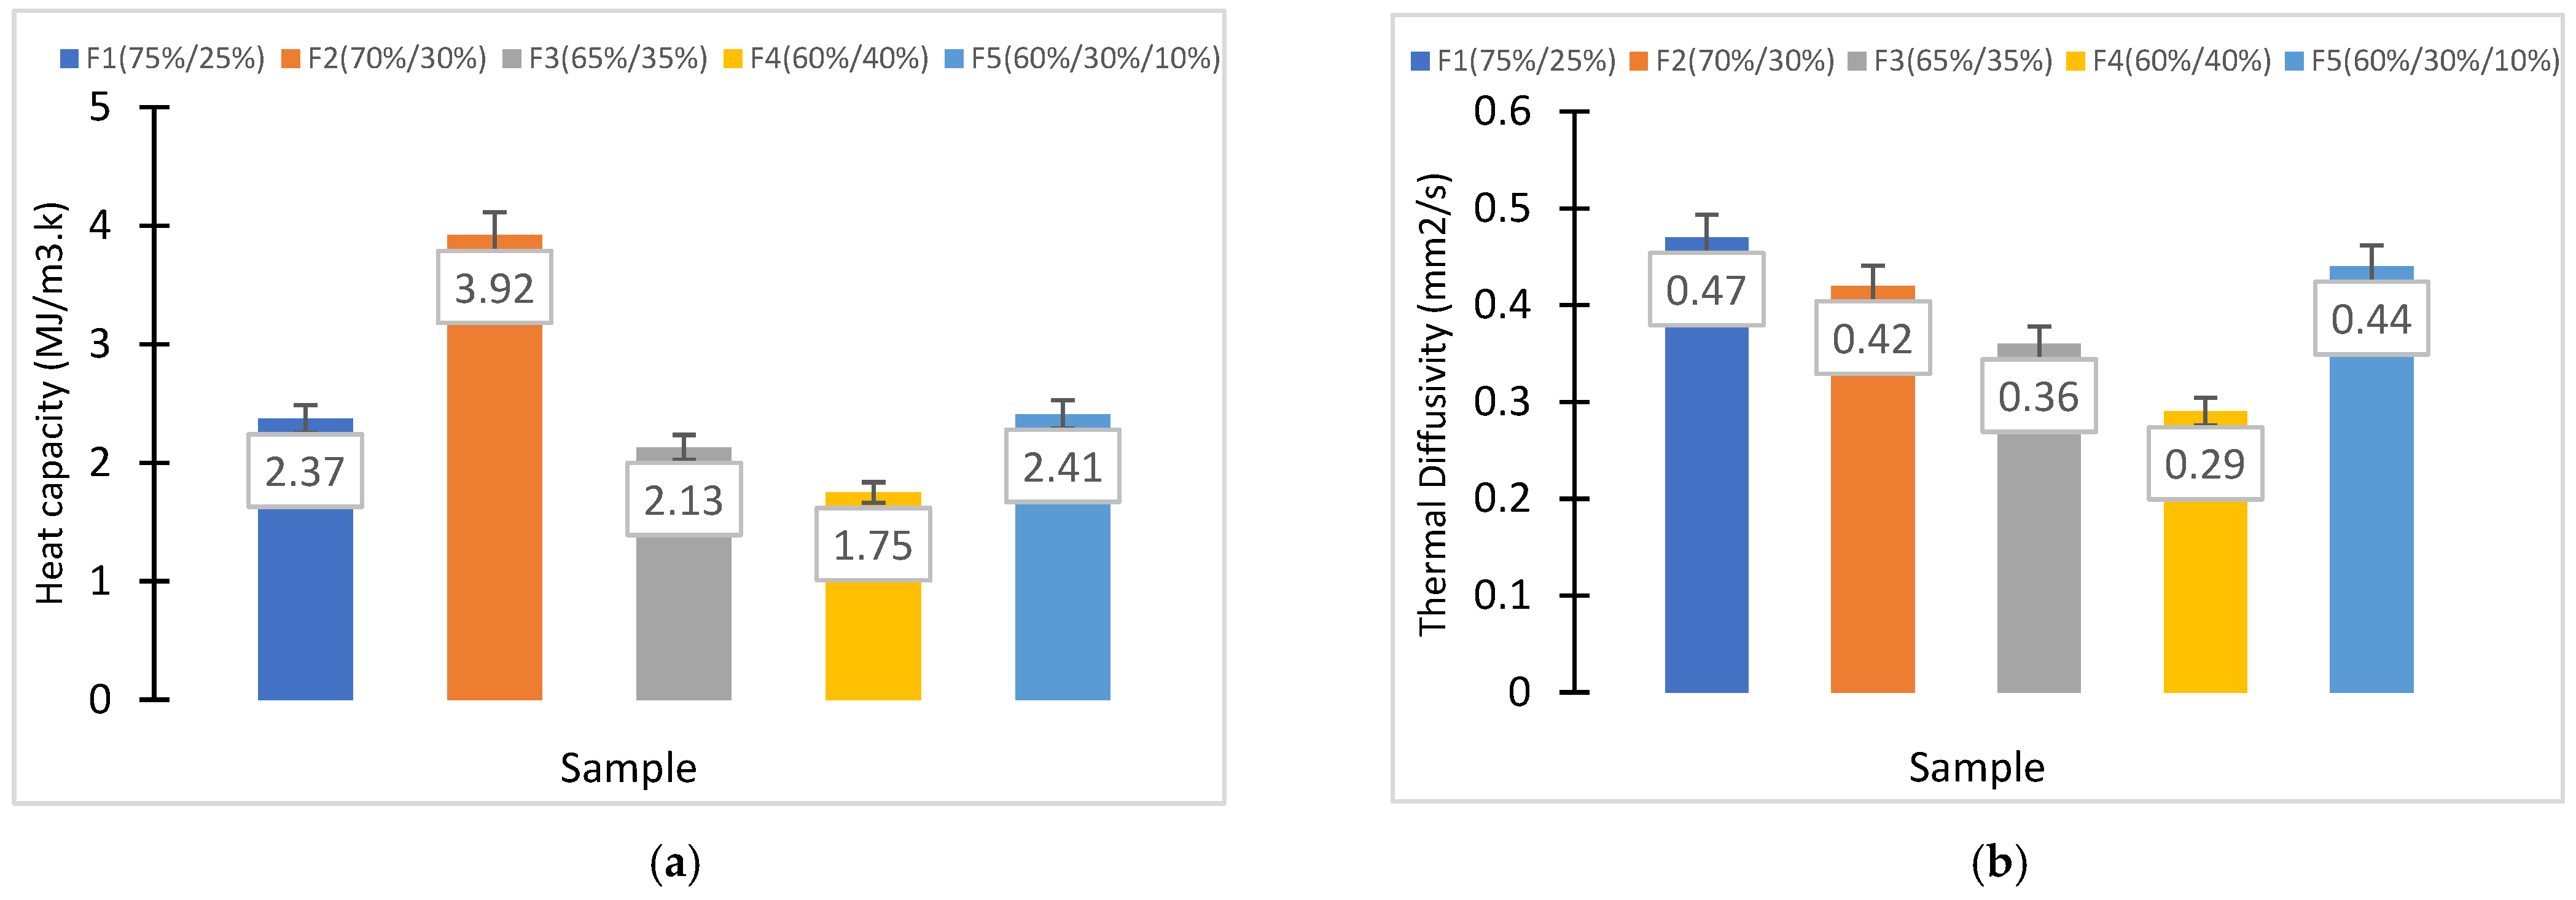
Figure 18 presents the composite thermal capacity and thermal diffusivity.
Figure 18a, we noted that the thermal capacity decreases when the rate of PW increases from 25 wt% to 30 wt% and inversely when the rate of PW varies from 30 wt% to 40 wt% in the mixture. The decreasing tendency of the thermal capacity with the increase of PW in the mixture was observed respectively with polyurethane foam and high-density polyethylene by [17,34]. The maximal value of thermal capacity (3.92 MJ/m3·K) is obtained at 30 wt% loading of PW in the mixture. This statement can be due to an error during the operation in the laboratory.
Figure 18b reveals that the thermal diffusivity changes with the rate of PW in the mix, and their values decrease inversely proportionally to the PW rate. The average value of thermal diffusivity ranges from 0.47 to 0.29 mm2/s when the rate of PW ranges from 25 wt% to 40 wt%. This observation can be explained by the low thermal diffusivity of polyethylene (0.17 mm2/s) than those of the sand (≥0.41 mm2/s) [35], then with the increasing of the rate of PW in the mixture, the composite behavior follows the plastic thermal diffusivity. The composite F4 (60%/40%) presents the lowest thermal diffusivity and thermal capacity, so a better thermal isolation property. The loading of laterite soil (10 wt%) as partial replacement of sand in the mixture increases the thermal diffusivity and the thermal capacity of the composite F5 (60%/30%/10%).

4. Implications for Practice and Research of the New Composite

The characteristics of the best composite are summarized in Table 6 below.

4.1. Paving Stones for Road

Pavers are blocks of stone, concrete or terracotta, commonly used as pavements for occasional or continuous traffic, pedestrian zones, parking lots and industrial areas [36]. Pavers are classified according to traffic type in standards NF P 98-082, NF P 98-335 [37]. According to standards NF EN 12390-3 [38], NF EN 1339 [39] and depending on traffic, the minimum compressive strength required for pavers is set at 20 MPa. Formulations with (30 wt%, 35 wt%) of plastic waste and those with 10% laterite fall within this framework, as they have compressive strengths of 22.01 MPa, 23.96 MPa and 22.83 MPa, respectively. As for flexural strength, standards require a minimum strength of 3.5 MPa. However, we achieved a minimum strength of 6.57 MPa using 25 wt% of PW in the mixture. With regard to water absorption resistance, standards tolerate absorption of between 3% and 7%. The absorption achieved with our materials is between 1.6 and 0.3%. This is well below the requirements of EN 771-1 [40], NF EN 206 + A2 [41]. This large difference is due to the plastic matrix, which is hydrophobic [12].
On the basis of the strengths obtained, we can then propose the various materials from formulations F2 (70%/30%), F3 (65%/35%) and F5 (60%/30%/10%) for use as class T5 traffic pavers.

4.2. Soil Pavement

A floor covering is a construction material, natural or manufactured, that covers the floor. Like any other covering, it serves as protection or decoration, but is specifically adapted to withstand the passage of people and animals [12].
According to standards NF DTU 52.1 P1-2 [42], NF DTU 54.1 P1-1 [43] and NF EN 13451-1 [44], flooring materials are classified according to stress. According to the standards, the minimum compressive and flexural strengths are set at 16 and 4 MPa, respectively. By comparing them with the results obtained, we can propose formulations F2 (70%/30%), F3 (65%/35%) and F5 (60%/30%/10%) as P3-type coatings. In terms of aesthetics, materials from formulation F5 (60%/30%/10%) are more suitable, as they have a nice texture, due to the addition of laterite.

4.3. Brick

All the composite samples show satisfactory mechanical strengths in relation to the standard for the use of hollow and solid breeze-blocks. The minimum compressive strength of our materials is 14.06 MPa, well above the minimum tolerances of 4 MPa for hollow blocks and 8 MPa for solid blocks. On the other hand, only the F4 (60%/40%) formulation (0.29) complies with the thermal diffusivity value recommended for mud bricks (0.28–0.34).

5. Conclusions

This work is part of a wider context of plastic waste recovery, which is nowadays a matter of concern for everyone. The transformation of waste into materials is a form of recovery that offers a double advantage: it contributes to the eco-sustainable sanitation of the living environment of rural and peri-urban populations, and also to the availability of new ecomaterials in Civil Engineering. The main conclusions that can be drawn from this research work are:
  • The average temperature of 172.45 °C, and a mean duration of 3 h as heating time are the two parameters to soften the HDPE plastic waste;
  • The porosity of the composite specimen ranges from 0.51 to 0.77% and is related to its density. The best value is obtained with the specimen F1 material (75%/25%), which is denser (1.66 kg/m3) and then presents the fewest pores (0.51%);
  • Water absorption decreases (from 1.6 to 0.3%) with increasing HDPE plastic waste content (25 wt% to 40 wt%). This is due to the hydrophobic nature of plastic, which prevents water from entering the material;
  • Mechanical strengths increase (from 6.56 to 12.15 MPa for flexural strength and from 14.46 to 23.96 MPa for compressive strength) with the increasing of HDPE plastic waste content up to 35 w%, before decreasing;
  • Increasing the proportion of plastic waste (25 wt% to 40 wt%) in the composite mixture improves its thermal insulation performance;
  • Addition of laterite soil as partial replacement of sand in the mixture reveals that it enhances the mechanical strengths (10.1 MPa for flexural, 22.83 MPa for compressive) of the samples, but also increases the water absorption of the samples (2.3%). Moreover, it gives the sample a more aesthetic appearance than the other samples.
A comparison of the mechanical, physical and thermal strengths of the obtained new composite, with those of cladding materials such as pavers and tiles for interior flooring, and hollow and solid blocks, shows that they can be used, as they comply with the established standards, and even better than the prescriptions of the standards.

Author Contributions

Conceptualization, E.M.; Methodology, EM, D.D.D. and S.C.; Software, S.C., D.D. and E.M.; Validation, E.M. and A.M.; Formal analysis, S.C., D.D.D. and E.M.; Investigation, S.C. and D.D.; Data curation, S.C.; Writing—original draft, E.M.; Supervision, A.M. All authors have read and agreed to the published version of the manuscript.

Funding

This research received no external funding.

Data Availability Statement

The original contributions presented in this study are included in the article. Further inquiries can be directed to the corresponding author.

Acknowledgments

The authors acknowledge International Institute of Water and Environmental Engineering (2iE) for the internship and the tests in laboratory. Eco-Materials & Sustainable Habitats Laboratory (LEMHaD), the Laboratoire de Physique, Chimie de l’Environnement (LPCE) of Université Joseph KI ZERBO for thermal testing device.

Conflicts of Interest

The authors declare no conflict of interest. The funders had no role in the design of the study; in the collection, analyses, or interpretation of data; in the writing of the manuscript; or in the decision to publish the results.

Abbreviations

The following abbreviations are used in this manuscript:
TambAmbiant Temperature in [°C]
TITemperature in the melting chamber during in [°C]
TPNTemperature of receptor North external wall in [°C]
TPSTemperature of receptor South external wall in [°C]
ρDensity in g/cm3
TfMelting Temperature in °C
αThermal Expansion Coefficient
ϑPoisson’s ratio
CpHeat Capacity or specific heat at constant pressure in [MJ/m3·K]
EYoung’s Modulus in [N/ m m 2 ]
RfFlexural strength in [MPa]
RcCompressive strength in [MPa]
bWidth of the square section of the prism [mm]
FForce in [N]
σStress in [MPa]
TTemperature in [°C]
λThermal Conductivity in [W/m·K]

References

  1. Tufa, M.; Tafesse, D.; Tolosa, S.; Murgan, S. Study of sand-plastic composite using optimal mixture design of experiments for best compressive strength. Mater. Today Proc. 2021, 47, 480–487. [Google Scholar] [CrossRef]
  2. Agrawal, R.; Singh, S.K.; Singh, S.; Prajapat, D.K.; Sudhanshu, S.; Kumar, S.; Ðurin, B.; Šrajbek, M.; Gilja, G. Utilization of PlasticWaste in Road Paver Blocks as a Construction Material. CiviEng 2023, 4, 1071–1082. [Google Scholar] [CrossRef]
  3. Atiku, J.U.; Atoshi, A.M.; Alheri, A.; Aaron, A.K.; Dass, P.M. Study on Some Mechanical Properties of Waste PET and Sand Composites. J. Sci. Artif. Intell. 2025, 2, 311–324. [Google Scholar] [CrossRef]
  4. El-Metwally, Y.S.; Dewidar, K.M.; Ismail, M.R.; El-Mahallawi, I.S. A Review on Sustainable Disposal of Plastic Waste by Integration in Construction Materials. Civ. Eng. Archit. 2023, 11, 714–725. [Google Scholar] [CrossRef]
  5. Dabilgou, D. Optimisation Energétique du Processus de Fusion des Déchets Plastiques par Concentration Solaire Scheffler. Ph.D. Thesis, Université Joseph KI ZERBO, Ouagadougou, Burkina Faso, 2022. [Google Scholar]
  6. Institut National de la Statistique et de la Démographie (INSD). Cinquième Recensement Général de la Population et de l’Habitation du Burkina Faso, Rapport Annuel 2019. Available online: https://www.insd.bf/fr/file-download/download/public/2073 (accessed on 28 May 2026).
  7. Gouasmi, M.; Benosman, A.; Taïbi, H.; Belbachir, M.; Senhadji, Y. The physico-thermal properties of mortars made of composite aggregates PET-siliceous sand. J. Mater. Environ. Sci. 2016, 7, 409–415. [Google Scholar]
  8. Rijalalaina, R.; de Dieu, R.J.; Maholy, M.; Oliva, A.J.; Phillipe, A.; Fréderic, R.; Lala, e.A. Valorisation à l’échelle pilote des déchets plastiques pour la fabrication de matériaux de construction. Mada-Hary 2014, 2, 54–69. [Google Scholar]
  9. Amey, K.; Samah, O.-D.; Neglo, K.; P’Kla, A.; Sounsah, K.; Amoussou, K.; Vianou, A. Study of Durability of Siliceous Sand Based Mortars in Togo, and of Binder of Plastic Bags of the Kind “Voltic”: Hydrocarbons’ Effect. J. Miner. Mater. Charact. Eng. 2018, 6, 25–37. [Google Scholar] [CrossRef]
  10. Safer, O.; Chaib, O.; Mostefa, A.H.; Dahmane, M.; Amer, A.A.M.; Salhi, M.; Benadouda, M.; Latroch, N.; Safa, A. Effect of the incorporation of plastic waste on the mechanical properties of composite materials. Stud. Eng. Exact. Sci. 2024, 5, 2529–2564. [Google Scholar] [CrossRef]
  11. Ndepete, C.P.; Zaguy-Guerembo, R.; Gbongo, A.M.D.; Regakouzou, L.M.-P.; Namndouta, V.O.N.; Kpeou-Kolengue, J. Valorisation des déchets plastiques en matériaux de construction. ESJ Nat./Life/Med. Sci. 2022, 18, 317–329. [Google Scholar] [CrossRef]
  12. Traore, B. Elaboration et Caractérisation D’une Structure Composite (Sable et Déchets Plastiques Recyclés): Amélioration de la Résistance par des Charges en Argiles. Ph.D. Thesis, Université Félix Houphouët-Boigny, Abidjan, Côte d’Ivoire, 2018. [Google Scholar]
  13. Singh, A.; Srivastava, A.K.; Singh, G.; Singh, A.D.; Singh, H.K.; Kumar, A.; Singh, G.K. Utilization of Plastic Waste for Developing Composite Bricks and Enhancing Mechanical Properties: A Review on Challenges and Opportunities. Adv. Polym. Technol. 2023, 2023, 6867755. [Google Scholar] [CrossRef]
  14. Saïfoullah, D.; Pahimi, A.L.; Gové, A.; Housseini, J.D. Valotisation des déchets plastiques dans la production des matériaux de construction: Cas des pavés dans la ville de Garoua( Nord Cameroun). Am. J. Innov. Res. Appl. Sci. 2020, 10, 215–221. [Google Scholar]
  15. Khan, F.J.; Gurav, S.N. Design and Fabrication of Plastic Recycling Machine and Testing of Its Products. Mach. Des. 2024, 47, 300–304. [Google Scholar]
  16. Dinesh, S.; Dinesh, A.; Kirubakaran, K. Utilisation of waste plastic in manufacturing of bricks ans pavers blocks. Int. J. Appl. Eng. Res. 2016, 11, 364–368. [Google Scholar]
  17. Badache, A.; Benosman, A.S.; Senhadji, Y.; Mouli, M. Thermo-physical and mechanical characteristics of sand-based lightweight composite mortars with recycled high-density polyethylene (HDPE). Constr. Build. Mater. 2018, 163, 40–52. [Google Scholar] [CrossRef]
  18. Mekideche, S.; Rokbi, M.; Rahmouni, Z.E.A.; Phiri, R.; Rangappa, S.M.; Siengchin, S. Manufacture and characterization of lightweight sand-plastic composites made of plastic waste and sand: Effect of sand types. Int. J. Lightweight Mater. Manuf. 2025, 8, 53–65. [Google Scholar] [CrossRef]
  19. Clement, M.; Krishnakumar, P.; Athipathy, M.; Vijayakumar, M. An Experimental Study on Bricks Manufactured using M-Sand, Saw Dust and Recycled Plastic. Int. J. Adv. Res. Eng. Technol. 2019, 10, 171–178. [Google Scholar]
  20. Roobankumar, R.; SenthilPandian, M. A review of utilization of waste polyurethane foam as lightweight aggregate in concrete. Heliyon 2024, 10, e40479. [Google Scholar] [CrossRef] [PubMed]
  21. Tchehouali, D.A.; Kowanou, H.; Amey, K.; Sanya, E.A.; Tosse, F. Mise au point et caractérisation physique et mécanique d’un materiau a base du sable argileux lie par des déchets plastiques fondus. J. Rech. Sci. Univ. Lomé 2014, 16, 189–197. [Google Scholar]
  22. Hassan, M.; Ahmed, A.; Ahmed, R.; Siddiqui, A.; Tanoli, M.; Ali, R. Mechanical and microstructural characterization of recycled plastic waste in sustainable building applications. Constr. Unique Build. Struct. 2025, 115, 11506. [Google Scholar]
  23. Malbila, E.; Koungwe, A.G.L.; Toguyeni, D.Y. Multicriteria analysis of the components of ecological paving stones made from plastic and glass waste, and granular reinforcements. Open Ceram. 2024, 18, 100604. [Google Scholar] [CrossRef]
  24. Dawange Sahebrao, S. Renewable Energy Technology: A Case Study of Solar Steam Cooking System at Shri Saibaba Sansthan Trust, Shirdi, MS, India. Int. Res. J. Sci. Eng. 2018, 1–6. [Google Scholar]
  25. NF EN 933-1; Essais Pour Déterminer les Caractéristiques Géométriques des Granulats—Partie 1: Détermination de la Granularité-Analyse Granulométrique par Tamisage. AFNOR Editions. 2012. Available online: https://www.boutique.afnor.org/fr-fr/norme/nf-en-9331/essais-pour-determiner-les-caracteristiques-geometriques-des-granulats-part/fa163900/39221 (accessed on 28 May 2026).
  26. NF EN 13043; Granulats Pour Mélanges Hydrocarbonés et Pour Enduits Superficiels Utilisés Dans la Construction des Chaussées, Aérodromes et D’autres Zones de Circulation. AFNOR Editions 2003. Available online: https://www.boutique.afnor.org/fr-fr/norme/nf-en-13043/granulats-pour-melanges-hydrocarbones-et-pour-enduits-superficiels-utilises/fa046926/21788 (accessed on 28 May 2026).
  27. EN 12620-2002; Aggregagtes Concretes. CEN2008. Available online: https://standards.iteh.ai/catalog/standards/cen/27c8e34e-993f-4b1a-989f-8a3263dbe9fb/en-12620-2002a1-2008?srsltid=AfmBOoqsijJg5GRjKlHZMEBve2OIkLNXH4gY-0q7xNMwadmh0k5AU5W_ (accessed on 28 May 2026).
  28. DIN 18947:2024–03; Earth Plasters–-Requirements, Test and Labelling. DIN 2024. Available online: https://www.dinmedia.de/en/standard/din-18947/376331481 (accessed on 28 May 2026).
  29. AFPC-AFREM. Essai de carbonatation accélérée, Mesure de l’épaisseur de béton carbonaté, Mode opératoire recommandé par l’AFREM. In Proceedings of the Compte Rendu des Journées Techniques AFPC-AFREM Durabilité des Bétons, Toulouse, France, 11–12 December 1997; pp. 153–158. [Google Scholar]
  30. Ntimugura, F.; Sore, S.; Bello, L.; Messan, A. The Influence of Metakaolin from Saaba (Burkina Faso) over Physico-Mechanical and Durability Properties of Mortars. Open J. Civ. Eng. 2024, 7, 389–408. [Google Scholar]
  31. NF EN 14617-1; Pierre Agglomérée-Méthodes D’essai—Partie 1: Détermination de la Masse Volumique Apparente et du Coefficient D’absorption D’eau. AFNOR Editions. 2013. Available online: https://www.boutique.afnor.org/fr-fr/norme/nf-en-146171/pierre-agglomeree-methodes-dessai-partie-1-determination-de-la-masse-volumi/fa124459/26369 (accessed on 28 May 2026).
  32. NF EN 196-1; 2016-Methods of Testing Cement—Part 1: Determination of Strength. AFNOR Editions. 2016. Available online: https://www.boutique.afnor.org/en-gb/standard/nf-en-1961/methods-of-testing-cement-part-1-determination-of-strength/fa184622/57803 (accessed on 28 May 2026).
  33. Boumhaout, M.; Boukhattem, L.; Hamdi, H.; Benhamou, B.; Nouh, F.A. Thermomechanical characterization of a bio-composite building material: Mortar reinforced with date palm fibers mesh. Constr. Build. Mater. 2017, 135, 241–250. [Google Scholar] [CrossRef]
  34. Mounanga, P.; Gbongbon, W.; Poullain, P.; Turcry, P. Proportioning and characterization of lightweight concrete mixtures made with rigid polyurethane foam wastes. Cem. Concr. Compos. 2008, 30, 806–814. [Google Scholar] [CrossRef]
  35. Buntebarth, G. Thermal properties of sand and mineral flours. SN Appl. Sci. 2020, 2, 396. [Google Scholar] [CrossRef]
  36. CERIB. Voirie et Aménagements Publics—Guide de Conception des Ouvrages Réalisés à Partir de Pavés, Dalles, Bordures et Caniveaux Préfabriqués en Béton; CERIB Expertise Concrète, France, Novembre 2019–206.E_V2; Available online: https://www.cerib.com/wp-content/uploads/2020/06/206E_Guide-conception-voirie_2019_BDliens.pdf (accessed on 28 May 2026).
  37. NF P98-335; Urban Pavements—Assembly of Concrete Paving Blocks and Flagstones, of Terracotta Paving Blocks and of Natural Stone Paving Blocks and Flagstones. AFNOR Editions 2007. Available online: https://www.boutique.afnor.org/en-gb/standard/nf-p98335/urban-pavements-assembly-of-concrete-paving-blocks-and-flagstones-of-terrac/fa144226/29362 (accessed on 28 May 2026).
  38. NF EN 12390-3; Essais Pour Béton Durci—Partie 3: Résistance à la Compression des Eprouvettes. AFNOR Editions. 2019. Available online: https://fr.scribd.com/document/944174237/NF-EN-12390-3-Essais-pour-beton-durci-Partie-3-resistance-a-la-compression-des-eprouvettes (accessed on 28 May 2026).
  39. NF EN 1339; Dalles en Béton—Prescriptions et Méthodes D’essai. AFNOR Editions. 2004. Available online: https://www.boutique.afnor.org/fr-fr/norme/nf-en-1339/dalles-en-beton-prescriptions-et-methodes-dessai/fa029772/22591 (accessed on 28 May 2026).
  40. NF EN 771-1+A1; Specification for Masonry Units—Part 1: Clay Masonry Units. AFNOR Editions. 2015. Available online: https://cdn.standards.iteh.ai/samples/59817/98625663fedd4974a4d25cb6134ed826/SIST-EN-771-1-2011-A1-2015.pdf (accessed on 28 May 2026).
  41. NF EN 206+A2; Béton-Spécification, Performances, Production et Conformité. AFNOR Editions. 2021. Available online: https://www.boutique.afnor.org/fr-fr/norme/nf-en-206-a2/beton-specification-performances-production-et-conformite/fa201846/238491 (accessed on 28 May 2026).
  42. NF DTU 52.1 P1-2-DTU 52.1; Travaux de Bâtiment—Revêtements de sol Scellés—Partie 1-2 : Critères Généraux de Choix des Matériaux. AFNOR Editions. 2020. Available online: https://www.eurochap33-beton.fr/PDF/DTU52.1.pdf (accessed on 28 May 2026).
  43. NF DTU 54.1-P1-1; Building Works—Cast In Situ Synthetic Resin Flooring—Part 1-1: Contract Bill of Technical Model Clauses. AFNOR Editions. 2018. Available online: https://www.boutique.afnor.org/en-gb/standard/nf-dtu-541-p11/dtu-541-building-works-cast-in-situ-synthetic-resin-flooring-part-11-contra/fa190175/323111 (accessed on 28 May 2026).
  44. NF EN 13451-1+A1; Équipement de Piscine—Partie 1: Exigences Générales de Sécurité et Méthodes D’essai Pour les Equipements Installés Dans des Piscines à Usage Public. AFNOR Editions. 2024. Available online: https://www.boutique.afnor.org/fr-fr/norme/nf-en-134511-a1/equipement-de-piscine-partie-1-exigences-generales-de-securite-et-methodes-/fa188188/58119 (accessed on 28 May 2026).
Figure 1. Raw materials (a) Sand, (b) Laterite soil and (c) Plastic waste.
Jcs 10 00362 g001
Figure 2. Particle size distribution of raw materials from de Fada N’Gourma (a) sand and (b) laterite soil.
Jcs 10 00362 g002
Figure 3. Layout of solar fusion device at Saaba (latitude 12.38°, longitude −1.43°).
Jcs 10 00362 g003
Figure 4. Main components of the energy source device (a) Reflectors mirrors (b) Thermocouples (c) Scanning Pyranometer (d) Battery connection with converter and (e) Datalogger.
Jcs 10 00362 g004
Figure 5. Flow chart of composite formulation design.
Jcs 10 00362 g005
Figure 7. Experimental application of the abrasion test (a) Brushing of the sample and (b) Weighing the sample after brushing.
Jcs 10 00362 g007
Figure 8. Experimental devices for Thermal and Mechanical tests (a) Three-point bending, (b) Compressive strength and (c) Thermal Conductivity meter KD2 Pro Decagon.
Jcs 10 00362 g008
Figure 9. (a) Daytime irradiation in case of no lift testing and (b) Temperature evolution (TPN, TPS, TI).
Jcs 10 00362 g009
Figure 10. Evolution of infernal temperature or temperature of plastic waste melting.
Jcs 10 00362 g010
Figure 11. Value of (a) dry density and (b) Withdrawal of the composite (g/cm3).
Jcs 10 00362 g011
Figure 12. Evolution of bulk density and water accessible porosity of the specimen.
Jcs 10 00362 g012
Figure 13. Evolution of the coefficient of Capillary absorption of the composite specimen.
Jcs 10 00362 g013
Figure 14. Water Absorption by total immersion (%).
Jcs 10 00362 g014
Figure 15. Value of the Abrasion coefficient of the prepared specimen.
Jcs 10 00362 g015
Figure 16. Mechanical properties (a) Flexural strength and (b) Compressive strength.
Jcs 10 00362 g016
Figure 17. Variation of thermal conductivity as a function of bulk density of the sample.
Jcs 10 00362 g017
Figure 18. Thermal properties of the sample (a) Thermal capacity and (b) Thermal diffusivity.
Jcs 10 00362 g018
Table 1. Sand properties.
PropertiesBulk Density ρ M   a p p (g/cm3)Absolute Density
ρ M   a b s (g/cm3)
Compacity
(%)
Moisture Content (%)Sand Equivalence Coefficient (%)
Visual MethodPiston Method
Sand1.52.657.690.2087.6592.78
Table 2. Plastic Properties.
PropertiesDensity
(g/cm3)
Module E (GPa)Tf or Tr
(°C)
Tensile Strength
(daN mm2)
Tensile Elongation at Break (%)
PEHD0.941–0.9600.8–1.2124–1352–4600–800
Table 5. Evolution of the sportivity of the composite.
SamplesSorptivity [kg·m2/h1/2]Water Absorption by Total Immersion (%)
F1 (75%/25%)0.06541.60%
F2 (70%/30%)0.00060.60%
F3 (65%/35%)0.09760.40%
F4 (60%/40%)0.08080.30%
F5 (60%/30%/10%)0.07422.30%
Table 6. Récapitulatif des résultats des essais d’échantillons.
Formulation TypeFlexural Strength (MPa)Compressive Strength (MPa) Water Accessible Porosity (%)Water Absorption (%)Thermal Conductivity (W/m·K)
F1 (75%/25%)6.5714.460.511.61.11
F2 (70%/30%)11.4622.010.610.61.10
F3 (65%/35%)12.1523.960.770.40.91
F4 (60%/40%)9.8214.060.740.30.39
F5 (60%/30%10%)10.0922.830.682.30.89
Disclaimer/Publisher’s Note: The statements, opinions and data contained in all publications are solely those of the individual author(s) and contributor(s) and not of MDPI and/or the editor(s). MDPI and/or the editor(s) disclaim responsibility for any injury to people or property resulting from any ideas, methods, instructions or products referred to in the content.