1. Introduction
Conducting polymers are useful model materials for studying charge transport in partially ordered organic solids. Polyaniline (PANI) remains one of the most studied members of this class because it can be prepared electrochemically, switched between different oxidation states, and protonated to form the conducting emeraldine salt. In this state, charge transport is commonly described in terms of polarons and bipolarons distributed along finite conjugated segments. The optical and electrical response of a PANI film, however, is not determined by the polymer backbone alone. Chain packing, protonation heterogeneity, interchain hopping, local disorder, and the quality of the polymer/filler interface all affect the measured bandgap, Urbach tail, refractive index, dielectric response, and conductivity. A single observable, such as a Tauc-derived optical gap or a room-temperature conductivity value, is therefore insufficient to define the electronic state of a PANI nanocomposite [
1,
2,
3,
4,
5,
6,
7,
8,
9,
10,
11,
12,
13,
14,
15,
16,
17,
18,
19,
20,
21,
22,
23,
24,
25,
26,
27,
28,
29,
30,
31,
32,
33,
34,
35,
36].
Electrochemical deposition is an important route for preparing PANI nanocomposite films because polymerization, doping, film growth, and nanoparticle incorporation can occur during the same controlled electrochemical step. When PANI is grown potentiostatically on transparent conducting substrates from acidic electrolytes, the film properties can be adjusted through deposition potential, deposition time, electrolyte composition, nanoparticle dispersion, and substrate condition [
37,
38,
39,
40,
41,
42]. Compared with ex situ blending or drop-casting, this approach can improve interfacial contact between the polymer and the inorganic phase and allows related filler chemistries to be compared under similar processing conditions . In the studies considered here, this strategy has been applied to Ag, Mo, CeO
2, Fe
2O
3, Al
2O
3, CuO, Co
3O
4, and CoFe
2O
4 additions, providing a useful comparative basis for examining structure–property relationships in electrodeposited PANI nanocomposites [
34,
43,
44].
The systems selected for detailed comparison should be regarded as representative model datasets rather than an exhaustive survey of all PANI composites. They were chosen because they were prepared by electrochemical deposition or closely related electrochemical routes and because they provide experimental information relevant to the proposed framework, including optical-gap evolution, dc conductivity, Urbach/disorder behavior, dielectric or refractive-index response, crystallinity, nonlinear optical response, or magnetic/mixed-valence functionality. The selected fillers also span distinct physical regimes, including metallic transport-assisted coupling, mobility-limiting interfacial coupling, order-stabilized oxide coupling, wide-bandgap dielectric barrier behavior, and intermediate transition metal oxide/ferrite behavior. Other PANI composites, including carbon-based, oxide-based, chalcogenide-based, MXene-based, and hybrid filler systems, can be analyzed using the same framework once comparable optical, structural, dielectric, and transport data are available.
The compared studies show that changing filler loading does not lead to one universal property trend. In Ag/PANI, Ag addition narrows the effective optical gap, broadens the Urbach tail, strengthens dielectric and free-carrier contributions, produces a non-monotonic third-order nonlinear response, and increases dc conductivity. In Mo/PANI, a similar reduction in optical gap is accompanied by a substantial conductivity loss, showing that low-energy optical states do not necessarily provide continuous transport pathways. In CeO
2/PANI, the Urbach energy decreases and crystallinity improves, indicating a disorder-suppressed response rather than a percolative metallic response. Fe
2O
3/PANI, Al
2O
3/PANI, CuO/PANI, Co
3O
4/PANI, and CoFe
2O
4/PANI provide additional cases in which optical-gap evolution, disorder, and conductivity vary independently [
35,
36,
37,
38,
39,
40,
41,
45,
46,
47].
These contrasts identify a specific problem in the literature. In several studies on conducting-polymer nanocomposites, optical-gap narrowing is treated as indirect evidence of stronger electronic interaction or improved electrical performance. That interpretation is valid only when the new low-energy states are also spatially connected and sufficiently mobile. A lower absorption threshold may instead originate from localized interfacial states, dielectric screening, polaron redistribution, or sub-gap band tails. Conversely, conductivity may increase even when disorder also increases if the filler creates conductive bridges across the polymer network. The relevant question is therefore how filler chemistry and mesoscale connectivity divide the response among interfacial-state formation, dielectric polarization, structural ordering, and mobility-limiting barriers [
21,
22,
23,
34,
35,
36,
37,
38,
39,
40,
41].
This review addresses that problem by separating two contributions that are often discussed together. The optical contribution controls the effective absorption edge, Urbach tail, refractive-index dispersion, dielectric response, and part of the nonlinear optical behavior. The transport contribution controls dc conductivity and depends on intrachain motion, interchain hopping, nanoparticle-assisted bridging, and barrier-limited interfacial transmission. The working hypothesis is that optical changes are mainly governed by charge transfer, dielectric screening, local-field effects, and tail-state formation, whereas dc transport is governed by the balance between carrier generation and mobility loss caused by scattering, aggregation, disrupted chain packing, and incomplete connectivity [
34,
35,
40,
41,
42].
This separation accounts for the different optical–electrical correlations observed in the compared PANI systems. Metallic nanoparticles may reduce both the optical transition threshold and the transport barrier. Redox-active oxides may reduce the optical gap while increasing the transport barrier. Insulating oxides may widen one transition while weakly affecting another, and order-promoting oxides may reduce band-tail disorder despite having large intrinsic bandgaps. The systems reviewed here cover these limiting cases and allow the observed trends to be converted into material-selection criteria [
37,
38,
39,
45,
46,
47].
The main contribution is threefold. First, the review separates optical-gap renormalization from transport efficiency. Second, it introduces a concentration-dependent description that allows fillers to either broaden or narrow the Urbach tail depending on their structural role. Third, it relates linear dispersion, dielectric response, and nonlinear optical behavior to the same interfacial and structural factors that control the absorption edge. These points are then used to classify Ag/PANI, Mo/PANI, CeO
2/PANI, Fe
2O
3/PANI, Al
2O
3/PANI, CuO/PANI, Co
3O
4/PANI, and CoFe
2O
4/PANI into physically distinct regimes [
34,
35,
36,
40,
48,
49,
50,
51,
52,
53,
54,
55,
56].
The paper is organized as follows.
Section 2 defines the scope of the framework.
Section 3 summarizes the experimental trends that motivate the model.
Section 4 introduces the mathematical descriptors for optical-gap evolution, Urbach disorder, dielectric dispersion, nonlinear response, and dc transport.
Section 5 applies the framework to different filler families.
Section 6 and
Section 7 discuss design rules, sensitivity to processing variables, and regime boundaries.
Section 8 outlines limitations and validation experiments, and
Section 9 presents the conclusions.
2. Conceptual Advance and Scope
The central contribution of this work is a dual-control description in which the effective optical gap and the dc transport barrier are allowed to evolve differently with filler loading. The reviewed Ag/PANI, Mo/PANI, CeO
2/PANI, Fe
2O
3/PANI, Al
2O
3/PANI, CuO/PANI, Co
3O
4/PANI, CoFe
2O
4/PANI, and pristine PANI-CSA studies show the need for this separation. Here, the interfacial electronic function describes how a filler shifts or redistributes electronic states near the absorption edge, whereas the transport-topology function describes whether the filler forms conductive bridges, neutral inclusions, or mobility-limiting junctions [
34,
35,
36,
37,
38,
39,
40,
41].
The resulting working principle is that bandgap tuning alone cannot be used as a conductivity predictor. The absorption edge is a spectroscopic measure of accessible transitions, whereas dc conductivity is a kinetic measure of connected carrier motion. Ag/PANI and Mo/PANI illustrate this distinction: both can show optical-gap narrowing, but only a system with favorable transport connectivity shows conductivity enhancement. This distinction also affects the interpretation of Urbach energy, refractive-index dispersion, and nonlinear optical coefficients [
35,
36,
37,
45,
46,
47].
Disorder is treated here as a measurable balance between broadening and ordering. The broadening side is represented by Urbach-tail growth, interfacial defects, local electrostatic fluctuations, and aggregation. The ordering side is represented by lower microstrain, sharper structural coherence, and a narrower distribution of transition energies. Ag/PANI is used as an example in which tail broadening can coexist with higher conductivity. CeO
2/PANI is used as an example in which filler incorporation reduces Urbach energy and microstrain. Al
2O
3/PANI illustrates that improved structural descriptors do not necessarily imply better electrical transport [
35,
36,
40,
41]. The analysis combines optical transitions, Urbach-tail behavior, Wemple–DiDomenico dispersion, dielectric constants, free-carrier contributions, third-order nonlinearity, and dc conductivity because these quantities are often measured together but discussed separately. The purpose is not to replace detailed electronic-structure calculations, but to provide a common interpretation in which the same filler can be evaluated through optical, structural, and transport descriptors [
34,
38,
39,
40,
41,
42,
48], as shown in
Table 1. To clarify the role of this table, it should be regarded as a conceptual roadmap rather than as a complete mathematical definition of the model. The governing equations and individual framework descriptors are introduced and defined in
Section 4; therefore,
Table 1 summarizes how the established single-observable models relate to the physical quantities that are later formalized in the unified framework.
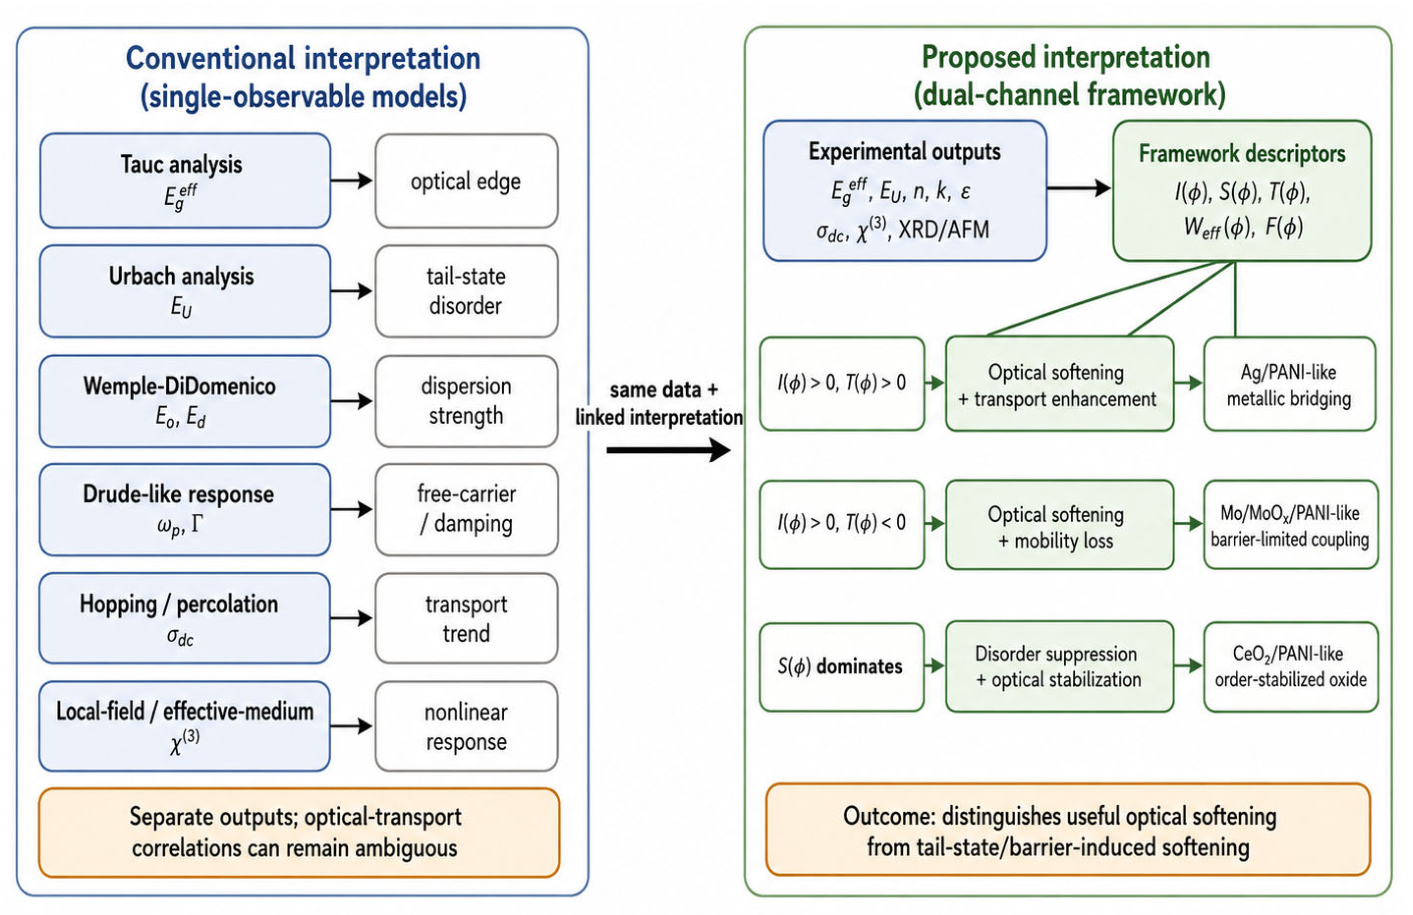
The present framework should be distinguished from the established models commonly used to interpret PANI-based composites. Tauc analysis provides an effective optical transition threshold, but it cannot determine whether the low-energy states responsible for gap narrowing are extended or localized. Urbach analysis quantifies band-tail disorder, but it does not specify whether tail states assist or suppress charge transport. Wemple–DiDomenico dispersion analysis yields oscillator parameters related to electronic polarization and structural coherence, whereas Drude-type descriptions estimate free-carrier or damping contributions to the dielectric response. Similarly, hopping, variable-range-hopping, percolation, and effective-medium models are useful for interpreting conductivity or local-field behavior, but they are usually applied to one property class at a time. The present approach does not discard these models; rather, it connects their experimentally accessible outputs through interfacial electronic, disorder, structural-coherence, and transport-topology descriptors. This integration is needed because optical-gap narrowing, Urbach broadening or narrowing, dielectric enhancement, nonlinear response, and dc conductivity do not necessarily follow the same composition dependence in PANI nanocomposites. To clarify the relationship between the present framework and conventional interpretation models,
Figure 1 compares the standard single-observable treatment with the proposed dual-channel description. Conventional analyses such as Tauc, Urbach, Wemple–DiDomenico, Drude-like, hopping/percolation, and local-field models remain essential for extracting experimental descriptors. However, when used separately, they do not directly explain why similar optical-gap narrowing may be accompanied by either enhanced or reduced dc conductivity. The proposed framework therefore links these outputs through interfacial, disorder, transport, barrier, and coherence descriptors, providing a more unified basis for classifying PANI nanocomposite behavior.
3. Experimental Basis and Comparative Phenomenology
The comparative basis of the model is summarized here before the equations are introduced. Reported Ag/PANI films prepared by electrochemical co-deposition on ITO from an aniline/CSA electrolyte with 5–15 wt.% Ag show optical-gap reduction from about 1.98 eV for pristine PANI to about 1.19 eV at the highest Ag loading, together with an increase in dc conductivity from about 1.0 to 7.0 S cm
−1. The corresponding nonlinear-optics data show Urbach broadening, dielectric-dispersion changes, free-carrier contributions, and a nonlinear response that peaks at an intermediate composition rather than at the highest Ag content. These observations indicate that metallic fillers can improve both optical absorption and transport only within a loading range where aggregation and disorder do not dominate [
1,
2,
3,
4,
5,
6,
7,
8,
9,
10,
11,
34,
35,
36,
37,
38,
39,
40,
41,
42].
The Mo/PANI series reveals the most important contrast. Under closely related electrochemical growth conditions, Mo nanoparticle incorporation also drives substantial bandgap narrowing, from roughly 2.49 eV for pristine PANI to roughly 1.22 eV at 30 wt.% Mo. Yet the room-temperature conductivity decreases from approximately 0.85 to 0.01 S cm−1. Structurally, the films still display signatures of ordering and interfacial coordination, and optically the red-shifted absorption edge indicates stronger low-energy transitions. If one equated gap narrowing with transport enhancement, such a dataset would be paradoxical. The paradox disappears once one accepts that the optical-gap change is controlled by the accessibility of interfacial and tail states, whereas conductivity depends on whether those states participate in connected transport pathways or instead increase scattering and localization. Mo/MoOx therefore acts as an electronically active filler with an unfavorable transport topology. It should be noted that the pristine PANI optical-gap values quoted for the Ag/PANI and Mo/PANI datasets are not intended to represent a single invariant bandgap of PANI. The value of approximately 1.98 eV corresponds to the pristine PANI reference within the Ag/PANI series, whereas the value of approximately 2.49 eV corresponds to the pristine PANI reference within the Mo/PANI series. In electrochemically deposited PANI films, the Tauc-derived gap is an effective optical threshold that is sensitive to protonation level, oxidation state, dopant environment, deposition potential and time, film thickness, chain packing, structural order, local disorder, and the selected fitting region. Accordingly, each nanocomposite family is evaluated relative to its own pristine reference film prepared and analyzed under the corresponding experimental conditions. The comparison made here therefore concerns the direction and magnitude of filler-induced gap evolution within each series, rather than an absolute comparison between independently prepared parent PANI films.
The CeO2/PANI system introduces a third regime. CeO2 loading tunes the optical response while decreasing Urbach energy and reducing microstrain, indicating that the band-edge landscape becomes less disordered rather than more disordered. In addition, crystallinity improves with increasing CeO2 content. The optical gaps remain tunable, but the system is better described as order-stabilized than as disorder-broadened. This implies that the filler contributes more strongly to structural regularization and dielectric stabilization than to the creation of broad sub-gap states. This behavior is consistent with the proposed framework but is not captured by simpler descriptions in which all nanoparticles are assumed to introduce generic defect states into the polymer.
The Fe
2O
3/PANI and Al
2O
3/PANI papers help define the oxide side of the design space. In Fe
2O
3/PANI, the hybrid structure modifies crystallinity and optical behavior while sustaining attractive functionality for optoelectronic and supercapacitor-related applications. In Al
2O
3/PANI, two optical transitions are resolved and the higher-energy gap widens noticeably with increasing alumina loading, while conductivity drops as expected for the addition of a wide-bandgap dielectric phase. These trends indicate that large-gap oxides can act as physical barriers that interrupt conjugation and charge transport even when they improve packing or alter refractive behavior. Such systems are especially useful for theory because they show that the sign of the optical-gap change may differ across the distinct transitions of PANI and that structural ordering does not automatically translate into electrical improvement [
1,
2,
34,
35,
36,
37,
38,
39,
40,
41,
45,
46,
47].
Additional CuO/PANI, Co3O4/PANI, CoFe2O4/PANI, pristine PANI-CSA, and CeO2/PANI studies are used as supporting context rather than as fully identical datasets. CuO/PANI provides a semiconducting oxide comparison, Co3O4/PANI and CoFe2O4/PANI extend the discussion to mixed-valence and magnetic oxides, and pristine PANI-CSA gives a reference for the structural quality achievable in the polymer without a second phase. These systems are not assumed to have identical processing histories; instead, they are used to test whether the same optical-transport separation remains useful across related PANI composites.
The comparative trends can be summarized without assuming a single universal rule. First, the effective optical gap can decrease or increase depending on the transition being analyzed and the filler chemistry. Second, the Urbach tail may broaden or narrow depending on whether defects or ordering dominate. Third, conductivity can decrease even when the absorption edge red-shifts. Fourth, refractive-index dispersion and nonlinear optical coefficients depend on both filler loading and microstructure. Fifth, crystallinity or reduced microstrain does not guarantee improved transport unless the ordered regions form connected pathways. The framework below is designed to account for these five observations together.
4. Unified Theoretical Framework
4.1. Physical Basis of the Model
The model treats electrochemically deposited PANI nanocomposites as heterogeneous conducting-polymer films containing a proton-doped PANI host and an inorganic nanophase. The host contains benzenoid and quinoid segments, protonation-stabilized polarons and bipolarons, finite conjugation lengths, and imperfect interchain overlap. Without added filler, optical gap, Urbach tail, dielectric response, and dc conductivity depend on doping level, chain packing, free volume, substrate-induced morphology, and local potential fluctuations. Filler incorporation can then alter the response through charge transfer, dielectric screening, local-field enhancement, structural templating or disruption, sub-gap state formation, and changes in transport connectivity. In the present model, mechanisms supported directly by the cited measurements are distinguished from hypotheses that require additional validation.
For compact notation, the filler response is represented by two effective functions. The interfacial electronic function, I(φ), describes how a filler of loading φ changes the polymer density of states and optical polarization. It can be constrained experimentally from shifts in Eg, changes in EU, and variations in refractive-index or dielectric parameters. The transport-topology function, T(φ), describes how the same filler affects connected charge transport. It can be constrained from dc conductivity, activation energy, impedance response, or spatially resolved conductivity mapping. Ag is expected to give positive I(φ) and T(φ), Mo/MoOx can give strong I(φ) but weak or negative T(φ), Al2O3 gives weak transport assistance, and CeO2 contributes mainly through ordering and dielectric stabilization.
This decomposition prevents optical observables from being used as direct substitutes for transport observables. Localized low-energy states can reduce the optical absorption threshold without contributing to dc conduction if they are isolated or strongly scattered. Conversely, a conductive filler may improve connectivity even while broadening the absorption edge. The model therefore evaluates each filler by asking how I(φ) and T(φ) modify the measured optical and electrical responses.
4.2. Effective Optical-Gap Renormalization
The optical gap obtained from Tauc analysis is treated as an effective transition threshold rather than as the intrinsic bandgap of an ideal PANI chain. In a nanocomposite film, this threshold is affected by the polymer electronic levels, the density of interfacial states, dielectric screening, and the width of the absorption tail. The effective gap is written as
where
Eg0 is the reference optical gap of pristine PANI prepared under the same protonation and growth conditions,
ΔEct(φ) represents the transition-energy reduction associated with interfacial charge transfer or orbital overlap between PANI and the filler,
ΔEscr(φ) accounts for dielectric-screening effects,
ΔEtail(φ) represents apparent gap narrowing caused by tail or defect states, and
ΔEloc(φ) is a localization penalty introduced when conjugation is interrupted or insulating inclusions block delocalization.
Equation (1) is a bookkeeping expression rather than a claim that all terms have the same magnitude. In Ag/PANI, charge transfer, screening, and tail-state contributions can all lower the effective transition threshold while metallic particles also assist transport. In Mo/PANI, the optical-lowering terms are present, but conductivity data indicate that many of the additional states are localized or barrier-forming. In Al2O3/PANI, the localization term and wide-gap barrier character can dominate at least one transition. In CeO2/PANI, the smaller tail contribution is consistent with the reported decrease in Urbach energy.
Thus, a lower effective gap is interpreted only as evidence for easier optical excitation, not automatically as evidence for improved electronic quality. Distinguishing useful delocalization from defect-state broadening requires Equation (1) to be considered together with the disorder and transport terms below.
4.3. Urbach-Tail Disorder and the Ordering Parameter
The Urbach tail is modeled in the standard exponential form:
where
EU is the Urbach energy. For a composition-dependent film series, the measured
EU is written as a sum of broadening terms and an ordering term:
In Equation (3), EU0 is the Urbach energy of pristine PANI, Aφ represents first-order broadening from interfacial defects and local electrostatic fluctuations, and Bφ2 represents additional broadening associated with clustering or filler-rich regions. The term C S(φ) describes ordering effects that narrow the distribution of local transition energies by improving chain packing, reducing microstrain, or stabilizing the local protonation environment.
This form allows the Urbach tail to either broaden or narrow with filler loading. In Ag/PANI, the broadening terms dominate and EU increases. In CeO2/PANI, the ordering term can exceed the broadening terms, producing a lower EU. In Al2O3/PANI, the balance may depend on composition because some loadings can improve structural metrics while still reducing conductivity. The equation is therefore intended to describe competing contributions rather than a universal monotonic trend.
One may interpret S(φ) as an emergent measure of how well the inorganic phase templates or stabilizes the PANI network during electrochemical growth. A filler with oxygen-vacancy-assisted interfacial coupling, a favorable surface charge, or a morphology that promotes alignment of polymer chains may increase S(φ). By contrast, a filler that disrupts polymer continuity or creates wide variations in local protonation may leave S(φ) small. This distinction is essential because it shows that disorder is not a scalar consequence of loading alone but a result of the structural role played by the filler during film formation.
4.4. Transport Barrier and dc Conductivity
The room-temperature dc conductivity of PANI nanocomposite films should be treated as an effective multi-channel transport response rather than as a single-carrier semiconductor quantity. Protonated emeraldine salt PANI commonly supports hole-like polaronic and bipolaronic transport along finite conjugated segments and through interchain hopping, whereas metallic or semiconducting fillers may introduce electron-assisted transport, interfacial charge-transfer pathways, or filler-mediated bridging between polymer-rich domains. Accordingly, the conductivity can be expressed in a more general two-carrier form as
where
p(φ) and n(φ) are the effective hole-like and electron-like carrier populations and
μh(φ) and μe(φ) are their corresponding mobilities. This form explicitly recognizes that the carrier types contributing to conductivity may have different mobilities and may respond differently to filler loading. More generally, the composite conductivity can be written as a sum over transport channels,
where
ci(φ) and μi(φ) represent the effective carrier concentration and mobility of the
i-th transport channel. These channels may include PANI-based polaron/bipolaron hopping, electron-assisted filler transport, interfacial charge transfer, and percolative or tunneling contributions across the polymer/filler network.
To retain the physical meaning of transport barriers while avoiding a single-mobility assumption, each channel mobility may be written as
where
Weff,i(φ) is the effective activation barrier associated with that transport channel. The effective barrier can be decomposed as
where
Wh,i is the intrinsic hopping barrier associated with the PANI morphology;
Wi,i is the interfacial barrier at polymer/filler junctions;
Wa,i is the penalty associated with aggregation, trapping, or blocked pathways; and
Wb,i is the beneficial bridging contribution that lowers the effective distance or energetic barrier for carrier transfer between conducting domains. Larger
Wh,i, Wi,i, and Wa,i reduce the mobility of the relevant channel, whereas a larger
Wb,i enhances transport by improving interdomain connectivity.
The effective carrier population in a given channel can also change with filler loading. For example, metallic particles may increase electron-assisted conduction or interfacial charge transfer, whereas protonated PANI remains dominated by polaronic/bipolaronic transport on the polymer backbone. At the same time, a filler may create localized or trapped states that are optically active but do not contribute efficiently to dc transport. This distinction is essential because a decrease in the Tauc-derived optical gap indicates easier optical excitation but does not necessarily imply a higher dc conductivity. Conductivity enhancement requires not only additional carriers or low-energy states but also sufficient carrier mobility and connected transport pathways.
This generalized description explains the contrast between Ag/PANI and Mo/MoOx/PANI. In Ag/PANI, metallic Ag can provide electron-assisted bridging and improve charge redistribution between PANI-rich regions, so the beneficial bridging term can reduce the effective transport barrier and increase the measured dc conductivity. In Mo/MoOx/PANI, interfacial states may reduce the optical transition threshold, but if these states are localized or associated with strong interfacial scattering, trapping, or incomplete connectivity, the effective transport barrier increases and the conductivity decreases. Thus, optical-gap narrowing and dc conductivity enhancement are not equivalent responses; they depend on different combinations of carrier density, mobility, localization, interfacial barriers, and transport topology.
4.5. Linear Optical Dispersion and Dielectric Response
The refractive-index dispersion is described using the Wemple–DiDomenico single-oscillator relation:
In this expression,
Eo is the oscillator energy and
Ed is the dispersion energy.
Eo is expected to follow the effective transition scale, whereas
Ed reflects the strength of electronic polarization and short-range structural coherence. An increase in
Ed can result from stronger interfacial polarizability, improved ordering, or both; it should not be interpreted as a direct measure of dc transport quality [
21,
34,
43,
44].
The dielectric function is obtained from the complex refractive index, ε = ε1 + iε2 = (n + ik)2, giving ε1 = n2 − k2 and ε2 = 2nk. These terms separate polarization storage from optical loss. Large effective dielectric constants and free-carrier signatures, such as those reported for high Ag loading, therefore indicate strong polarization or carrier response but do not by themselves identify the composition with the best transport or nonlinear performance.
The long-wavelength carrier contribution can be represented by adding a Drude-like term:
where
εb(ω,φ) is the bound-electron background,
ωp(φ) is an effective plasma frequency, and
Γ(φ) is an effective damping rate. A filler can increase
ωp by improving free-carrier coupling, or reduce the useful free-carrier response if trapping dominates.
Γ is expected to increase when scattering and heterogeneity increase. Ag/PANI is therefore closer to a strong free-carrier regime, whereas Mo/PANI and dielectric oxide systems are more likely to be damping- or barrier-dominated.
4.6. Third-Order Nonlinear Response
where
L(φ) is the local-field factor,
Π(φ) is the effective electronic polarizability, and
F(φ) is a structural coherence factor.
L(φ) can be constrained from refractive-index and effective-medium analysis,
Π(φ) from oscillator strength or dielectric response, and
F(φ) from roughness, aggregation, XRD coherence, or Urbach broadening. The expression is semi-phenomenological: it summarizes how nonlinear response increases when the local field and polarizability grow faster than the structural penalties caused by aggregation and disorder.
Equation (10) explains why Kerr coefficients and third-order susceptibilities can peak at intermediate filler loading. A moderate loading of well-dispersed metallic particles can increase L(φ) and Π(φ) while F(φ) remains high. At larger loadings, aggregation or screening can reduce F(φ), lowering the useful nonlinear response even when the total metal content is larger. The same reasoning may apply to oxide fillers when surface states enhance polarization without breaking polymer continuity.
4.7. Summary of the Governing Competition
The governing competition can be stated in conventional terms. Filler incorporation first changes the optical-state distribution by charge transfer, dielectric screening, and tail-state formation. It then either improves or disrupts the connectivity required for dc transport. A filler may therefore improve both optical absorption and transport, improve optical absorption while degrading transport, or suppress disorder without providing strong transport assistance. Ag/PANI, Mo/PANI, CeO2/PANI, and Al2O3/PANI illustrate these different cases.
4.8. Illustrative Application of the Equations to Reported PANI-Composite Data
The equations above are intended to provide practical descriptors that can be evaluated from experimentally reported quantities. Their use can be illustrated by comparing Ag/PANI and Mo/PANI, because both systems show strong optical-gap narrowing but opposite conductivity trends. In Ag/PANI, the reported effective optical gap decreases from approximately 1.98 eV for pristine PANI to approximately 1.19 eV at the highest Ag loading. The net change, Delta Egeff = −0.79 eV, corresponds to an optical-gap reduction of approximately 40%. Within Equation (1), this negative change represents the combined contribution of interfacial charge transfer, dielectric screening, and tail-state formation, partially opposed by any localization penalty.
The same Ag/PANI series can be used to illustrate the transport part of the model. The dc conductivity increases from approximately 1.0 to 7.0 S cm−1. If the conductivity change is expressed through Equation (4) and the mobility term in Equation (5), and if the carrier concentration is assumed to remain constant as a first approximation, the effective transport-barrier change can be estimated as ΔWeff = −kBT ln[σ(φ)/σ0]. At 300 K, the sevenfold increase in conductivity gives an ΔWeff of approximately −0.050 eV. This negative value indicates that Ag addition lowers the effective transport barrier, consistent with a positive bridging contribution, Wb(φ), in Equation (6).
Mo/PANI provides the opposite case. The optical gap decreases from approximately 2.49 eV for pristine PANI to approximately 1.22 eV at 30 wt.% Mo, giving ΔEgeff = −1.27 eV. Equation (1) therefore indicates strong optical-state renormalization. However, the conductivity decreases from approximately 0.85 to 0.01 S cm−1. Applying the same first-order estimate to Equation (5) gives an ΔWeff of approximately +0.115 eV at 300 K. Thus, although the optical gap decreases more strongly in Mo/PANI than in Ag/PANI, the transport barrier increases. This example demonstrates why optical-gap narrowing alone cannot be used as evidence of improved charge transport.
Urbach-energy data can be interpreted in an analogous way using Equation (3). If EU increases with filler loading, as observed for Ag/PANI, the terms A(φ) and B (φ)2 associated with interfacial disorder, local potential fluctuations, and aggregation dominate over the ordering term C S(φ). If EU decreases with filler loading, as reported for CeO2/PANI together with improved crystallinity and reduced microstrain, the ordering contribution C S(φ) is larger than the broadening terms. Equation (3) therefore converts the sign of ΔEU into a diagnostic indicator of whether a filler acts mainly as a disorder-generating or order-stabilizing component.
The nonlinear response can also be interpreted using Equation (10). In the Ag/PANI nonlinear-optics dataset, the third-order response reaches a maximum at an intermediate composition rather than at the highest Ag content. This behavior is consistent with an initial increase in the local-field factor, L(φ), and the electronic polarizability term, π(φ), followed by a decrease in the structural coherence factor, F(φ), when aggregation, scattering, or excessive disorder becomes significant. Thus, Equation (10) provides a practical explanation for why the optimum nonlinear response does not necessarily coincide with the maximum filler loading.
These examples show how the model can be applied without requiring complete microscopic parameter extraction. Measured
Eg values constrain Equation (1), Urbach energies constrain Equation (3), conductivity trends constrain Equations (4)–(6), and nonlinear optical trends constrain Equation (10). The resulting signs and relative magnitudes of the terms are sufficient to classify a filler as transport-assisted, mobility-limiting, or order-stabilizing, and they provide a practical basis for comparing future PANI nanocomposite datasets (
Table 2).
5. Material-Specific Interpretation of the Unified Framework
5.1. Ag/PANI: Metallic Bridging with Disorder-Assisted Optical Softening
Ag/PANI represents the clearest case in which the interfacial electronic function and the transport-topology function are both positive. Silver nanoparticles possess intrinsically high electrical conductivity, strong electronic polarizability, and localized plasmonic behavior in the visible range. Once incorporated into a protonated PANI matrix, they can act as charge-mediating nodes that reduce the effective separation between conducting polymer domains. In the language of Equation (6), the beneficial bridging term Wb increases rapidly, while the interfacial barrier term Wi remains comparatively low because the metal/polymer junction supports charge redistribution rather than acting as an insulating obstacle. At the same time, Ag modifies the optical channel by increasing local polarization, strengthening dielectric screening, and introducing a denser set of low-energy transitions near the absorption edge. Therefore ΔEct, ΔEscr, and ΔEtail are all positive and significant in Equation (1).
This interpretation is consistent with the reported Ag/PANI trends. The optical gap decreases with loading, EU increases, the dielectric response grows, and conductivity rises by severalfold. These observations imply that Ag introduces additional low-energy interfacial states while also forming sufficiently connected pathways for carrier motion. At excessive loading, however, aggregation can lower F(φ), which accounts for the non-monotonic nonlinear optical response.
Ag/PANI is therefore classified as a transport-assisted metallic-coupling regime. The experimental signatures are optical-gap narrowing, increasing conductivity, a broader Urbach tail, stronger dielectric or free-carrier response, and a nonlinear-optical maximum at a finite metal loading. This regime is useful when both low-energy absorption and improved charge transport are required.
5.2. Mo/PANI: Optically Active but Mobility-Limiting Interfacial Coupling
Mo/PANI provides a clear counterexample to the assumption that a smaller optical gap necessarily produces higher conductivity. Reported Mo/PANI films show a strong red-shift of the absorption edge with increasing Mo content, whereas conductivity decreases by nearly two orders of magnitude. This behavior is consistent with a filler that has a strong interfacial electronic function but an unfavorable transport-topology function. Under acidic oxidative conditions, Mo nanoparticles may present partially oxidized MoOx-rich surfaces that interact with the amine and imine functionalities of PANI. Such interfaces can stabilize localized polaronic states or induce low-energy transitions, making ΔEct and ΔEtail sizeable in Equation (1).
However, the same interface can act as a mobility-limiting junction. The oxidized surface is not a metallic bridge equivalent to Ag; instead, it introduces barriers, scattering centers, and possibly dead-end states that contribute to absorption but not to transport. In Equation (6),
Wi and
Wa therefore dominate over
Wb. Furthermore, if the polymer chains partially wrap around the filler without establishing coherent interdomain pathways, the nanocomposite acquires many electronically interesting boundaries but few genuinely conductive shortcuts. The result is an optical edge that shifts to lower energy while the effective transport barrier rises [
7,
8,
9,
10,
11,
34,
35,
36,
37,
38,
39,
45,
46,
47].
This regime is classified as optically active but mobility-limiting interfacial coupling. It is expected when a semiconducting or partially oxidized filler creates low-energy interfacial states but does not form continuous conductive pathways. The prediction should be applied cautiously and tested by conductivity, impedance, and spatially resolved potential mapping because surface oxidation, dispersion quality, and PANI protonation can shift a filler between regimes.
5.3. CeO2/PANI: Order-Stabilized Oxide Coupling
CeO2/PANI shows that a filler can regularize the optical landscape instead of broadening it. Cerium oxide combines oxygen-vacancy-mediated polarizability with defect chemistry and surface redox behavior, yet reported CeO2/PANI films show reduced Urbach energy, improved crystallinity, and lower microstrain. This implies that the ordering contribution C S(φ) in Equation (3) dominates over the broadening terms Aφ + Bφ2 across the investigated composition range. The filler still participates in the optical channel, but it stabilizes the band-edge environment rather than roughening it. The interpretation of CeO2/PANI as an order-stabilized oxide-coupling regime is based on experimental reports showing that CeO2 incorporation modifies the optical response while reducing Urbach energy and microstrain and improving crystallinity. These measured trends support the view that, in this system, filler-induced ordering and dielectric stabilization outweigh broadening by interfacial disorder. Accordingly, the CeO2/PANI classification is not inferred only from oxide chemistry, but from the combined optical, structural, and disorder-related data reported for the corresponding films.
Within the unified framework, CeO2 therefore belongs to an order-stabilized oxide-coupling regime. The interfacial electronic function I(φ) is nonzero because the filler changes the optical constants and dielectric behavior, but the interfacial states do not manifest primarily as a broad Urbach tail. Instead, they appear to be accompanied by improved local packing or strain relaxation. This may arise if CeO2 particles provide heterogeneous nucleation sites that encourage more regular chain organization during electrodeposition or if their surface chemistry moderates electrostatic fluctuations in the protonated PANI matrix.
The practical implication is important: not every oxide filler should be viewed as a transport blocker or a disorder source. Some oxides may be selected specifically to suppress band-tail disorder while preserving useful optical tunability. In device terms, this regime may be advantageous for applications that require stable linear optical performance, reduced defect-related absorption loss, controlled refractive behavior, and moderate conductivity. It also suggests a route for co-filler design, where an order-promoting oxide is combined with a transport-promoting metallic phase to decouple disorder control from mobility enhancement.
5.4. Al2O3/PANI and Wide-Gap Barrier Oxides
Al2O3/PANI provides an instructive case because alumina is a strongly dielectric, wide-gap oxide. Reported Al2O3/PANI films show that one optical transition changes only slightly while the higher-energy transition widens and conductivity decreases with loading. In the present framework, alumina contributes mainly through dielectric perturbation, interruption of conjugation, and barrier formation. The localization penalty, ΔEloc(φ), becomes significant, especially for transitions that depend on long-range π overlap, while the transport-topology function is negative because the oxide does not bridge polymer domains electronically. Conductive pathways are therefore diluted or interrupted, so Weff rises and conductivity falls. The Al2O3/PANI interpretation is supported by experimental data showing two resolved optical transitions, a noticeable widening of the higher-energy transition with alumina loading, and a systematic decrease in dc conductivity. These observations are consistent with the role of Al2O3 as a wide-bandgap dielectric inclusion that perturbs optical transitions and interrupts charge-transport pathways. The reported structural-ordering changes are therefore interpreted together with conductivity data because improved crystallinity alone does not necessarily imply improved electrical connectivity.
At the same time, the Al2O3/PANI study indicates that structural ordering metrics such as crystallite size may improve at higher loadings. This is not inconsistent with reduced conductivity. Structural ordering in XRD does not automatically imply a lower transport barrier if the ordered regions are separated by insulating inclusions or if the relevant conduction path still requires crossing wide-gap interfaces. This observation is conceptually valuable because it emphasizes that crystallinity and electrical functionality are different measures. A film can appear structurally more ordered yet electronically less conductive if the ordering occurs around domains that are not well coupled for transport.
The wide-gap barrier oxide regime represented by Al2O3/PANI is therefore characterized by decreasing conductivity, possible widening of one or more optical transitions, and refractive or dielectric modifications that are substantial despite weak transport assistance. Such fillers may still be desirable in multilayer photonic or sensor architectures where electrical insulation, optical tuning, chemical stability, or mechanical reinforcement are more important than maximizing conductivity.
5.5. Fe2O3/PANI, CuO/PANI, Co3O4/PANI, and CoFe2O4/PANI: Mixed-Valence and Magnetic Oxide Regimes
Transition metal oxides and ferrites are grouped here only as a working category because they combine semiconducting behavior, mixed valence, magnetic response, and surface redox activity. Fe2O3/PANI, CuO/PANI, Co3O4/PANI, and CoFe2O4/PANI are therefore expected to lie between the CeO2-type order-stabilized regime and the Mo-type mobility-limiting regime, but their exact position must be determined from each dataset. Relevant evidence includes oxide/PANI level alignment, oxide dispersion, surface oxidation state, microstrain, and whether carriers can cross oxide-rich junctions. The discussion of Fe2O3/PANI, CuO/PANI, Co3O4/PANI, and CoFe2O4/PANI is now presented as a comparison of experimentally reported transition metal oxide and ferrite systems. The proposed intermediate positioning of these materials between order-stabilized and mobility-limited regimes is based on reported changes in optical response, crystallinity, dielectric behavior, conductivity, magnetic or mixed-valence character, and oxide/PANI interfacial interactions. Because these systems differ in dispersion state, oxidation chemistry, and transport connectivity, their classification is treated as dataset-dependent and should be refined as additional measurements become available.
CuO is a p-type semiconducting oxide with strong visible-light interaction, so CuO/PANI is expected to contribute more directly to low-energy optical transitions than Al2O3/PANI. Co3O4 and CoFe2O4 add mixed-valence and spin-dependent effects that can alter interfacial charge redistribution and local polarization. Fe2O3, especially when highly dispersed, can modify crystallinity, dielectric behavior, and specific capacitance-related properties. In all such systems, the present theory predicts that the most informative experimental question is whether the oxide acts predominantly as an electronic perturbation center, a structural template, or a transport obstacle. The answer will dictate the signs of ΔEtail, S(φ), and Weff.
This mixed-valence oxide/ferrite domain is particularly promising for future work because it may support multifunctional behavior not easily achieved with purely metallic or purely dielectric fillers. For example, a ferrite nanoparticle may enhance optical absorption and dielectric loss while also offering magnetic-field responsiveness or pseudocapacitive activity. The unified framework developed here can be extended to such systems by preserving the same two-function logic and adding any field-coupled order parameters required by the application.
5.6. Regime Map and Comparative Classification
The reviewed studies can be arranged on a regime map with two practical axes: the interfacial electronic effect, I(φ), and the transport-connectivity effect, T(φ). Ag/PANI lies in the transport-assisted metallic region. Mo/PANI lies in the optically active but mobility-limited region. CeO2/PANI represents the order-stabilized oxide region. Al2O3/PANI is close to the wide-gap barrier oxide limit, while Fe2O3/PANI, CuO/PANI, Co3O4/PANI, and CoFe2O4/PANI occupy intermediate positions that depend on dispersion, oxidation state, and interface chemistry. The map should be used as a screening guide rather than as a substitute for full experimental optimization.
This classification reduces the observed behavior to three experimentally testable modes: optical-edge softening with mobility gain, optical-edge softening with mobility loss, and optical-edge stabilization with disorder suppression. These modes provide a concise explanation for the contrasting trends reported across the PANI nanocomposite systems considered here.
6. Predictive Design Rules and Future Hypotheses
6.1. Filler Selection by Interfacial Electronic Function and Transport Topology
The framework can guide filler selection by evaluating two measurable factors: the magnitude of the interfacial electronic response, I(φ), and the sign of the transport-connectivity response, T(φ). I(φ) can be estimated from optical-gap shifts, Urbach energy, dielectric response, and oscillator parameters. T(φ) can be estimated from dc conductivity, activation energy, impedance, and spatially resolved current mapping. Metallic nanoparticles, redox-active oxides, wide-bandgap dielectrics, and ferrites can then be classified according to how they affect optical-gap tuning and charge-transport continuity.
For a conductive coating with enhanced low-energy absorption, the preferred filler should have both positive I(φ) and positive T(φ), as expected for well-dispersed metallic or highly conductive semiconducting phases. For nonlinear optical layers, the useful composition is the one that increases local field and polarizability while keeping F(φ) high. For stable dielectric or refractive coatings, the preferred filler should increase S(φ) and keep ΔEtail(φ) limited. These criteria connect filler selection to measurable optical and electrical parameters rather than to chemical intuition alone.
A simple screening metric can express optical tuning relative to transport penalty:
Larger M(φ) values indicate stronger effective optical tuning per unit transport penalty. The metric is not intended to be universal; it is a first-pass comparison that should be refined using measured conductivity, activation energy, Urbach energy, and dielectric-loss data.
6.2. Loading Windows and the Concept of a Mesoscale Optimum
Optimal filler loading should be treated as a finite window rather than as a monotonic target. In the optical channel, the optimum may occur at the maximum of local-field-enhanced χ3, the strongest useful increase in Ed, or the largest favorable shift in the absorption edge. In the transport channel, it occurs while Wb still exceeds the combined growth of Wi and Wa. The Ag/PANI nonlinear-optics data provide one example in which the best nonlinear response occurs before the maximum filler content.
These considerations have direct implications for the design of future experiments. Composition-dependent studies should include narrower concentration intervals near the expected optimum, rather than relying on two or three widely spaced loading levels from which monotonic trends may be overinterpreted. The optimum composition for dc conductivity may differ from that for nonlinear optical response or minimum Urbach energy, indicating that a given filler can exhibit more than one application-dependent operating window. Compositions that are unfavorable for one property should therefore not be dismissed without considering their performance in other functional metrics. Accordingly, filler optimization in PANI nanocomposites is more appropriately treated as a multi-parameter problem governed by the combined evolution of I(φ), T(φ), and S(φ).
The width of the useful loading window is also expected to depend on particle-size distribution and deposition kinetics. Nanoparticles with a narrow size distribution and good dispersion stability are likely to delay aggregation-related increases in Wₐ(φ), thereby preserving a broader composition range over which beneficial interfacial effects can dominate. In contrast, broad particle-size distributions or unstable nanoparticle dispersions in the electrolyte may accelerate aggregation, reduce the structural coherence factor, F(φ), and narrow the accessible optimum window. Thus, even for the same nominal filler chemistry, differences in dispersion quality and electrochemical growth conditions may shift the boundaries between optical, transport, and disorder-dominated regimes.
6.3. Predictions for Co-Filler Strategies
The framework also suggests co-filled PANI systems as testable hypotheses rather than established design rules. Because optical-gap reduction, disorder control, and dc transport depend on different terms, a single filler may not optimize all three. A metallic phase such as Ag could provide transport bridging and local-field enhancement, whereas an oxide such as CeO2 could improve structural ordering and limit band-tail broadening. An Ag/CeO2/PANI film would therefore be worth testing to determine whether the conductive advantage of Ag can be retained while reducing the disorder penalty.
Similarly, a small amount of Al2O3 could be used to adjust mechanical or refractive behavior if a second conductive filler maintains transport continuity. Ferrite or CuO-like phases could be introduced when magnetic, catalytic, or pseudocapacitive functionality is required. The key experimental test is whether one component mainly increases Wb while another increases S(φ), without producing excessive increases in Wi or Wa.
Such co-filler strategies are especially relevant for PANI because electrochemical deposition can, in principle, incorporate multiple dispersed phases within one electrolyte. The range of reported single-filler systems indicates that additional design space remains available. The framework is therefore not only retrospective; it also suggests experimentally testable combinations for future hybrid films.
6.4. Predictions for Temperature, Frequency, and Time-Domain Measurements
The existing papers are dominated by room-temperature dc measurements and steady-state optical characterization, yet the theory makes specific predictions for more advanced measurements. First, temperature-dependent conductivity should distinguish more clearly between bridge-assisted transport and barrier-limited hopping. In a metallic-bridge regime such as Ag/PANI, the effective activation energy inferred from Arrhenius or variable-range-hopping analysis should decrease with loading up to the useful optimum. In a mobility-limiting regime such as Mo/PANI, the activation energy or effective hopping barrier should rise. In order-stabilized oxide regimes, activation energy may show weak or non-monotonic behavior depending on how much the order parameter compensates for the barrier terms.
Broadband dielectric spectroscopy could be used to examine whether
ωp(φ) and
Γ(φ) follow the trends predicted by Equation (9). Fillers that enhance free-carrier coupling are expected to shift the dielectric crossover and modify low-frequency dielectric loss differently from fillers that primarily affect bound-electron polarization. In addition, ultrafast pump–probe spectroscopy or time-resolved photoconductivity measurements could help determine whether filler-induced low-energy states contribute to transient carrier mobility or act mainly as trapping centers. Such measurements would provide a direct experimental basis for distinguishing optical-gap softening associated with improved transport from optical-gap softening accompanied by mobility suppression [
34,
35,
36,
37,
38,
39,
40,
41,
42,
48,
49,
50].
Spatially resolved techniques such as conductive atomic-force microscopy or Kelvin probe force microscopy could test the topology part of the model directly. Connected Ag-rich paths should appear as higher-conductance or lower-barrier regions across the film. MoOx-rich interfaces, if they act mainly as traps or barriers, should instead appear as potential inhomogeneities without long-range connectivity. These measurements would provide a direct test of the proposed transport-topology function.
6.5. Hypotheses for Unexplored Fillers
The framework can be used to generate hypotheses for fillers not yet examined systematically in electrochemically deposited PANI films. MXenes such as Ti3C2Tx or Nb2CTx may show positive I(φ) and T(φ) if oxidation and restacking are controlled. Sulfides such as MoS2 or WS2 may lower the effective optical gap through interfacial charge transfer but will require dispersion control to avoid transport penalties. Graphene nanoplatelets and functionalized carbon nanotubes are expected to improve transport connectivity, although their optical contribution will depend on defect density, functional groups, and PANI wrapping.
These examples should be regarded as experimentally testable hypotheses. Metallic or highly conductive two-dimensional fillers are likely candidates when both nonlinear optical response and conductivity are required. CeO2-like or selected dielectric oxides are more appropriate when stable optical behavior and reduced disorder are the main targets. Mixed systems combining a disorder-suppressing oxide with a transport-assisting filler provide a possible route to decouple bandgap engineering from mobility engineering.
7. Mathematical Consequences, Sensitivity Analysis, and Regime Boundaries
7.1. Coupled Derivatives as Diagnostic Criteria
The equations become more useful when their derivatives with respect to filler loading are compared. The sign of dEgeff/dφ indicates optical-edge softening or hardening, dσ/dφ indicates transport improvement or degradation, and dEU/dφ indicates whether disorder is increasing or decreasing. A compact regime code can therefore be assigned: Ag/PANI has dEgeff/dφ/dφ < 0, dσ/dφ > 0, and dEU/dφ > 0; Mo/PANI has dEgeff/dφ/dφ < 0 and dσ/dφ < 0; CeO2/PANI has dEU/dφ < 0 with weaker transport improvement. A small derivative-sign table should accompany this analysis when numerical datasets are available.
A useful correlation slope can be defined as R = (dσ/dφ)/(dEgeff/dφ). Because dEgeff/dφ is negative when the optical edge softens, R < 0 corresponds to optical softening with conductivity gain, as in Ag/PANI. R > 0 corresponds to optical softening with conductivity loss, as in Mo/PANI. Values near zero indicate that optical changes have little transport consequence. This parameter is a comparative descriptor rather than a material constant.
The disorder-transport competition can similarly be described by Q = (dσ/dφ)/(dEU/dφ). Positive Q indicates that conductivity and tail broadening rise together, as in Ag/PANI over part of the measured range. Negative Q may occur when disorder decreases while conductivity remains weakly changed, as expected for order-stabilized oxides. The value of Q should be interpreted only after confirming that EU was extracted from the same spectral region for all samples.
7.2. When Does Bandgap Narrowing Stop Helping?
Bandgap narrowing becomes functionally useful only when the new low-energy states increase the product
n(φ)μ(φ) in Equation (4). Decoupling begins when the optical edge continues to soften but the carrier-density-mobility product no longer increases. This condition can be written as
Equation (12) defines the onset of optical-transport decoupling. It means that additional optical states are present, but they are too localized, too strongly damped, or too poorly connected to improve dc transport. The condition is consistent with Mo/PANI and may also occur in over-loaded Ag/PANI or in oxide-rich films where interfacial polarization does not create conductive continuity.
A second threshold concerns nonlinear optics. If
χ3 is written as in Equation (10), the optimum nonlinear composition is reached when
This condition states that the relative gains from local-field and polarizability enhancement are balanced by the structural penalty. It explains why nonlinear optical maxima may occur with a finite filler content and should be tested by measuring χ3 over closely spaced compositions rather than assuming that the largest loading is optimal.
A third threshold separates order-promoting and disorder-promoting filler behavior. From Equation (3), the crossover occurs when
Below this crossover, filler-induced ordering narrows the absorption tail more strongly than defects broaden it. Above it, defect generation or aggregation dominates. Identifying this crossover experimentally would help determine the loading range in which a nominally benign filler begins to degrade the band-edge landscape.
7.3. Sensitivity to Particle Size, Oxidation State, and Protonation
The equations are intentionally compact, but several variables must be controlled experimentally before the parameters can be compared across studies. Particle size affects interfacial area, charge transfer, dielectric screening, and local-field effects. Smaller particles can increase ΔEct and ΔEscr, but they can also increase Wi and Wa if they aggregate or react strongly with the electrolyte. Larger conductive particles may provide mesoscale bridging but reduce specific interfacial area. The model therefore predicts a composition- and chemistry-dependent size optimum rather than a universal preference for the smallest filler.
Oxidation state is equally critical. The contrast between Ag and Mo demonstrates that a filler’s bulk identity is not enough; what matters is the actual electronic character of the surface presented to the protonated PANI during growth. A nominally metallic particle coated by an insulating or redox-active oxide shell may shift from the transport-assisted regime toward the mobility-limiting regime. This insight is especially relevant for transition metals, MXenes, and sulfides whose surfaces are chemically labile under oxidative acidic conditions. The theory predicts that controlling surface chemistry through ligand engineering, pre-passivation, or electrolyte composition may change T(φ) more dramatically than changing nominal loading alone.
Finally, protonation level modulates all channels because it sets the baseline density of polarons and bipolarons in the PANI host. A strongly protonated, well-ordered PANI matrix may benefit more from conductive bridges because its intrinsic Wh is already moderate, whereas a poorly protonated matrix may remain transport-limited regardless of filler choice. Thus, filler selection should ideally be optimized together with acid strength, counter-ion identity, and deposition potential. This is another reason why the present framework is best viewed as a mesoscale theory of composite function rather than a purely filler-centric theory.
7.4. Theoretical Implications for Model-Building Beyond This Paper
Although the equations in this manuscript are semi-phenomenological, they provide a foundation for more formal modeling. Density functional theory calculations could estimate charge-transfer tendencies and interfacial density of states for selected filler/PANI motifs, thereby helping parameterize ΔEct and ΔEtail. Kinetic Monte Carlo methods could model how conductive bridges and barrier interfaces alter Weff across realistic morphologies. Effective-medium theories could refine the dielectric channel by distinguishing percolative and non-percolative contributions to ε(ω,φ). Time-dependent density-functional or many-body perturbation methods could, in principle, connect interfacial excitations to nonlinear susceptibility. The present framework does not replace such methods; it organizes the experimental questions they should answer.
In this respect, the framework is scalable. It can interpret the experimental trends summarized in the cited studies while remaining compatible with more microscopic calculations. Application-oriented nanocomposite papers often remain empirical, whereas purely computational studies may not always connect directly to measurable composite trends. The present framework occupies an intermediate level by linking observable optical and transport quantities to effective interfacial and topological descriptors.
8. Limitations and Validation Roadmap
The framework has several limitations. First, it is not a first-principles description of each filler/PANI interface. The reviewed systems differ in particle size, oxidation state, morphology, and optical modeling procedure. The equations are therefore intended to describe composite-level trends rather than atomistic electronic structure. Their parameters should be treated as effective descriptors until they are extracted from targeted measurements or simulations.
A second limitation is that the present theory is built from room-temperature and predominantly steady-state observables. Parameters such as Weff, ωp, Γ, and F(φ) summarize processes that are likely temperature-dependent, frequency-dependent, and morphology-dependent. In future work, variable-temperature conductivity, impedance spectroscopy, and time-resolved optical methods should be used to map how these parameters evolve beyond the static conditions emphasized in the cited studies. Such measurements would allow the theory to be developed from a classification framework into a parameterized predictive model.
A third limitation concerns morphology. The present framework assumes that nanoparticle loading can be represented by a single scalar,
φ, but real films possess size distributions, aggregation states, anisotropies, and substrate-mediated gradients. A fully quantitative theory would therefore need microstructural descriptors such as aggregate size, nearest-neighbor distribution, connectivity statistics, and depth-dependent composition. Nonetheless, the use of a scalar loading variable is justified at the level of conceptual unification because the main objective here is to explain why entire classes of fillers behave differently, not to fit every experimental point with atomistic specificity [
34,
35,
36,
37,
38,
39,
40,
41,
42,
45,
46,
47,
48,
49,
50,
57,
58,
59,
60].
These limitations define a clear validation roadmap. First, temperature-dependent four-point-probe or van der Pauw conductivity measurements should be combined with hopping model analysis to determine whether the activation energy or variable-range-hopping parameter evolves as predicted for each filler regime. Second, dielectric spectroscopy over a broad frequency window should be used to separate bound-electron polarization from free-carrier loss and to test the effective Drude contribution in Equation (9). Third, spatially resolved conductive and potential-mapping microscopies should be employed to visualize whether conductive bridges, trap-rich interfaces, or order-promoting domains dominate the mesoscale network.
Fourth, X-ray photoelectron spectroscopy and electron microscopy with elemental mapping should be used to quantify oxidation states and interfacial distributions, especially for fillers like Mo where a surface oxide shell may decisively control transport behavior. Fifth, Raman or ultraviolet photoelectron spectroscopy could help connect the evolution of polaron and bipolaron signatures to the terms Δnpol and ΔEct in the theory. Sixth, if future co-filler systems are pursued, the theory predicts that systematic comparison of single-filler and dual-filler films will reveal whether one component primarily changes Wb and the other primarily changes S(φ). That would be one of the strongest possible validations of the present conceptual framework.
Despite these limitations, the framework provides a coherent way to relate optical-gap shifts, Urbach-tail evolution, dielectric dispersion, nonlinear response, and dc conductivity within the same physical language. Its intended scope is not a universal microscopic solution for every filler/PANI interface, but a comparative model anchored to experimentally observed trends across related electrochemically deposited PANI nanocomposites.
9. Conclusions
This review has developed a comparative framework for electrochemically deposited PANI nanocomposite thin films. The main conclusion is that optical-gap evolution, Urach-tail behavior, dielectric dispersion, nonlinear response, and dc conductivity cannot be reduced to a single filler-loading trend. The response is better described by two coupled functions: an interfacial electronic function that changes the density of optically accessible states and a transport-connectivity function that determines whether those states assist or block long-range charge motion.
The same framework explains why nonlinear optical response can peak at an intermediate loading and why co-filler systems may be useful when transport enhancement and disorder suppression are required simultaneously. These conclusions are hypotheses that should be tested with temperature-dependent conductivity, impedance spectroscopy, spatially resolved current mapping, and systematic single-filler versus co-filler comparisons.
Ag/PANI is interpreted as a transport-assisted metallic-coupling case because optical softening and conductivity enhancement occur together. Mo/PANI is interpreted as an optically active but mobility-limiting case because the absorption edge shifts to lower energy while the transport barrier increases. CeO2/PANI illustrates order-stabilized oxide coupling; Al2O3/PANI represents the wide-gap barrier oxide limit; and Fe2O3/PANI, CuO/PANI, Co3O4/PANI, and CoFe2O4/PANI occupy intermediate oxide or ferrite regimes.
The practical message is that a smaller optical gap in a PANI nanocomposite should not be treated as direct evidence of better charge transport. The decisive factor is the balance between interfacial electronic states and transport barriers. This balance provides a more reliable basis for choosing filler chemistry, controlling loading, and designing future PANI-based optoelectronic and photonic composites.