The effects of uniform, linear, and nonlinear temperature distributions on frequency, mode shapes, and thermally induced forces are comparatively analyzed. Based on this, the coupled influence of the temperature field with the power-law index, slenderness ratio, and boundary conditions is further investigated.
4.2.1. Effects of the Temperature Field
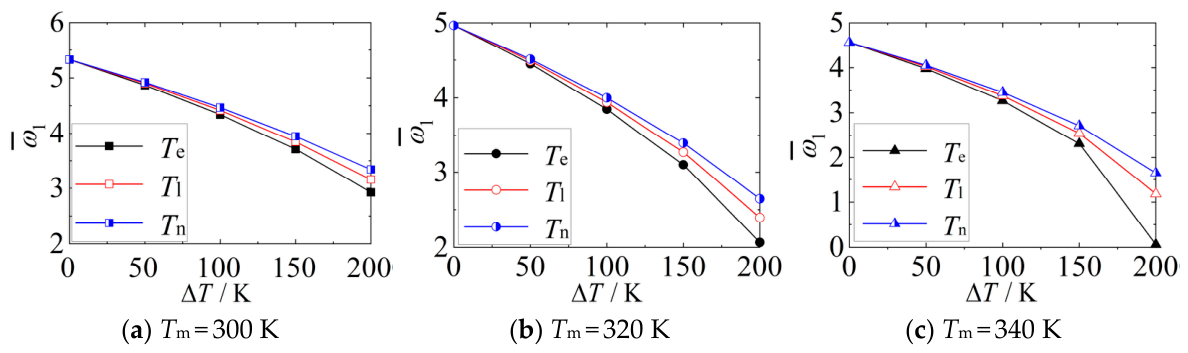
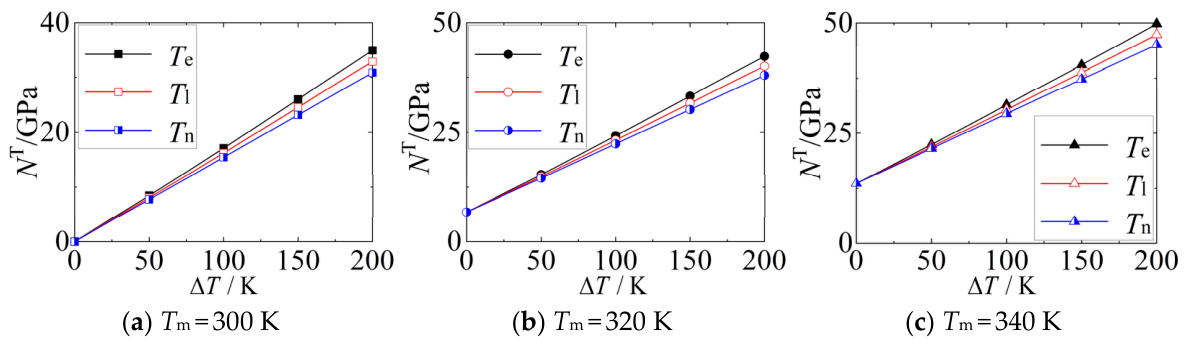
Temperature elevation reduces the natural frequency of FG beams. The variation curves differ under various temperature fields and distribution patterns. Therefore, the variation laws of and the corresponding thermally induced forces NT are investigated in this section under uniform (Te), linear (Tl), and nonlinear temperature fields (Tn) by varying temperature difference . Pz = 2, L/h = 20, T0 = 300 K.
According to the expression of
NT (Equation (16)),
NT depends not only on structural parameters such as E, α, and
, but also on the temperature field pattern,
Tc and
Tm, i.e., on the environmental temperature difference (
Tm −
T0) and temperature difference (
Tc −
Tm). Hence,
Figure 7 presents the variation in
with respect to
Tc and
Tm under uniform
Te, linear
Tl, and nonlinear temperature fields
Tn.
Figure 8 shows the corresponding variation in
NT.
From
Figure 7, under all three temperature fields,
decreases with increasing
, and the overall trend is similar. As shown in the vibration governing Equation (12),
NT affects only coefficient
A3, which governs displacement along the beam’s height direction
z. At relatively low temperatures, the magnitude of
NT is smaller than the shear stiffness coefficient
Cxz. Under all three temperature fields,
A3 remains positive, with only its value changing, resulting in a similar mechanism by which
NT influences
. Quantitatively,
NT is smallest under the nonlinear temperature field and largest under the uniform field. As shown in
Figure 7,
decreases slowest and remains highest under the nonlinear temperature field, whereas it is opposite for the uniform one, and the rate of
reduction increases with larger
. The linear temperature field lies between the two, closer to the uniform case. As
increases,
NT increases linearly, with the fastest growth observed under the uniform field, the slowest under the nonlinear field, and intermediate behavior under the linear field. This phenomenon arises because the additional temperature field induces axial compressive stress due to thermal expansion, leading to a reduction in equivalent stiffness—known as the stress-softening effect—where a greater
NT results in a lower
.
From Equations (3), (4), (7), and (16),
NT depends not only on material properties but also on the ambient temperature difference and
. Under the three temperature fields, the effect of ambient temperature difference on
NT is identical. Therefore, in
Figure 7 and
Figure 8, when only
Tm varies, the variation in
with
follows a similar trend across all three temperature fields, and the corresponding
NT curves exhibit the same slope (
Figure 8). For different values of
Tm, the
NT curves shift vertically without changing shape. Physically, this occurs because, although the beam’s overall temperature increases or decreases, the form of the temperature distribution remains unchanged—only a vertical shift in the temperature profile is introduced.
To better analyze the influence of temperature-dependent material properties on
,
Table 5,
Table 6 and
Table 7 compare the changes in
and t
NT under two cases: one where material properties vary with temperature (temperature-dependent), and the other where they remain constant (temperature-independent).
Table 5.
Comparison of under multiple boundary conditions.
Table 5.
Comparison of under multiple boundary conditions.
| SS | CC |
|---|
| L/h | Present | Ref. [34] | Ref. [33] | L/h | Present | Ref. [34] | Ref. [33] |
| 10 | 2.7018 | 2.7003 | 2.701 | 10 | 5.8690 | - | 5.875 |
| 30 | 2.7381 | 2.7379 | 2.738 | 30 | 6.1754 | - | 6.177 |
| 100 | 2.7423 | 2.7423 | 2.742 | 100 | 6.2136 | - | 6.214 |
Table 6.
Effects of temperature-dependent and temperature-independent material properties on .
Table 6.
Effects of temperature-dependent and temperature-independent material properties on .
| | Temperature-Dependent | Temperature-Independent | Relative Change |
|---|
| /K | Te | Tl | Tn | Te | Tl | Tn |
|---|
| 0 | 5.3279 | 5.3279 | 5.3279 | 5.3279 | 5.3279 | 5.3279 | 0.00% | 0.00% | 0.00% |
| 50 | 4.8682 | 4.901 | 4.9196 | 4.8721 | 4.8913 | 4.9058 | 0.08% | −0.20% | −0.28% |
| 100 | 4.3391 | 4.4148 | 4.4647 | 4.3691 | 4.4117 | 4.4438 | 0.69% | −0.07% | −0.47% |
| 150 | 3.7119 | 3.8469 | 3.9476 | 3.8001 | 3.8733 | 3.9279 | 2.38% | 0.69% | −0.50% |
| 200 | 2.9256 | 3.154 | 3.3396 | 3.1292 | 3.2466 | 3.333 | 6.96% | 2.94% | −0.20% |
Table 7.
Effects of temperature-dependent and temperature-independent material properties on NT.
Table 7.
Effects of temperature-dependent and temperature-independent material properties on NT.
| | Temperature-Dependent | Temperature-Independent | Relative Change |
|---|
| /K | Te | Tl | Tn | Te | Tl | Tn |
|---|
| 0 | 0 | 0 | 0 | 0 | 0 | 0 | 0.00% | 0.00% | 0.00% |
| 50 | 8.4454 | 8.0547 | 7.732 | 8.3354 | 7.9998 | 7.745 | −1.30% | −0.68% | 0.17% |
| 100 | 17.1025 | 16.222 | 15.443 | 16.6708 | 15.9996 | 15.49 | −2.52% | −1.37% | 0.30% |
| 150 | 25.9587 | 24.506 | 23.14 | 25.0062 | 23.9994 | 23.235 | −3.67% | −2.07% | 0.41% |
| 200 | 35.0005 | 32.909 | 30.831 | 33.3416 | 31.9991 | 30.98 | −4.74% | −2.76% | 0.48% |
In a uniform temperature field, the temperature-independent thermally induced force NT is smaller than that in the temperature-dependent case, leading to an increase in . In a linear temperature field, when the temperature difference is small, the variation in material properties with temperature is negligible, and the effect of NT dominates. In this scenario, the NT under the temperature-independent case is small, which would theoretically result in a higher . However, due to the combined effects of E, α, and ν, remains almost unchanged, or even slightly lower than that in the case with temperature-dependent material properties. In a nonlinear temperature field, the temperature dependence of thermal conductivity k alters the temperature distribution, resulting in a lower NT in the case with temperature-dependent material properties compared to that with constant material properties. Consequently, is higher when considering temperature-dependent material properties.
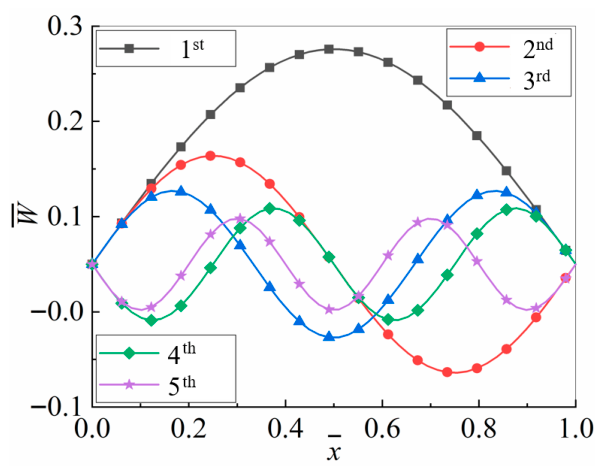
The mode shapes of the beam remain nearly unchanged when
Tm,
, and temperature field profile are varied. The first five mode shapes under a nonlinear temperature field with
Tm = 320 K and
= 100 K are shown in
Figure 9, corresponding to the natural frequencies
= 3.9979,
= 19.9502,
= 45.4985,
= 79.6868,
= 121.2926, respectively.
From
Figure 9, the first five mode shapes of the FG beam exhibit a similar form and variation pattern to those of a homogeneous beam. In the mode shape expression, temperature changes primarily affect the coefficient of the second-order derivative term of the transverse displacement function. In the governing equation, this corresponds to the first-order derivative term of the mode shape function, which has negligible influence on the mode shape itself. Consequently, the overall mode shape remains essentially unchanged under varying temperatures.
The results indicate that decreases with increasing NT. Under a uniform temperature field, the beam experiences the maximum NT and thus the lowest ; under a nonlinear temperature field, NT is minimal, resulting in the highest ; the linear temperature field yields intermediate values. For a given temperature profile, varying the ambient temperature merely shifts the temperature distribution and NT curve vertically, without altering their shape or slope. The mode shapes are minimally affected by temperature, remaining nearly unchanged when the Tm, , or temperature field profile is varied.
4.2.2. Effects of the Power-Law Index
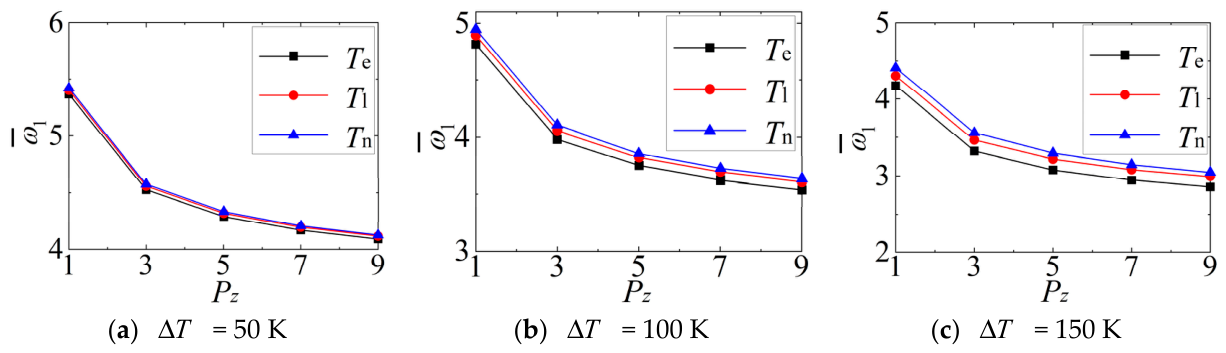
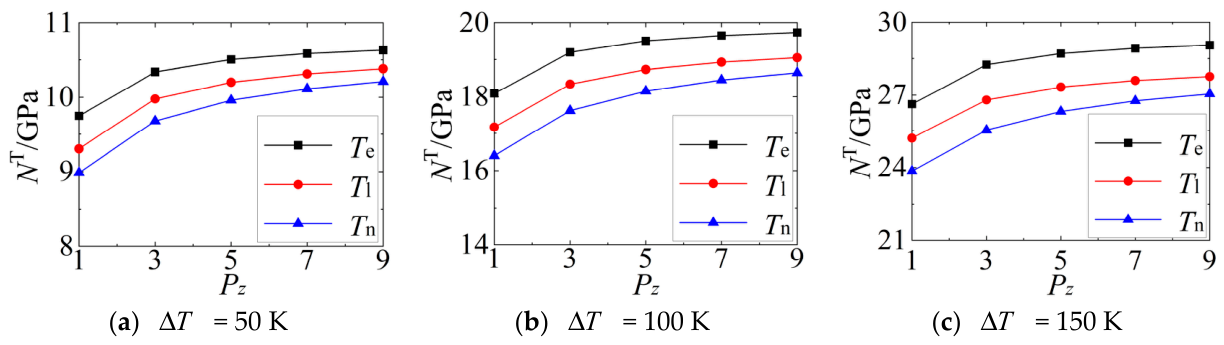
The influence of the power-law index Pz and temperature difference on the natural frequencies and thermally induced forces NT of an FG beam under uniform (Te), linear (Tl), and nonlinear temperature fields (Tn) is investigated in this section.
Since the distribution form of the temperature field is solely determined by and is independent of Tm. Without loss of generality, Tm is assumed to be constant (Tm = T0 + 5 K), and the analysis focuses on the influence of .
The effect of
Pz and
on
and
NT under uniform, linear, and nonlinear temperature fields are shown in
Figure 10 and
Figure 11.
From
Figure 10, under both uniform and nonlinear temperature fields,
decreases with increasing
Pz, and the rate of decline diminishes as
Pz increases. Correspondingly,
NT increases with
Pz, but the rate of increase gradually reduces (
Figure 8). This behavior arises because
Pz represents the volume fraction of the ceramic phase: when
Pz = 0, the FG becomes pure ceramic, characterized by high
E, low
, and high stiffness, resulting in higher
. As
Pz increases, the metallic component gradually dominates, reducing the overall stiffness and consequently lowering
.
From Equation (16),
NT relates to material properties of
E,
, and
, with
E having the most significant influence. As
Pz increases,
NT also increases, but the rate of increase gradually decreases, a trend most pronounced under the nonlinear temperature field. Meanwhile,
NT remains most stable under the uniform temperature field. According to Equations (3), (4), (7), and (16),
NT can be decomposed into two components: one associated with the ambient temperature difference and the other with
. When isolating material effects, the ambient temperature difference term is constant, while the
term depends on the temperature field profile, yielding a constant
NT under uniform conditions, a quadratic function of coordinate
z under linear conditions, and a more complex expression under nonlinear conditions. This analytical result is confirmed in
Figure 11: under the nonlinear temperature field, both temperature distribution and material parameters jointly influence
NT and
, whereas under the uniform field, the force depends only on the material gradient. In the linear case, the trend of
NT variation resembles that under uniform conditions, but its magnitude is closer to the nonlinear case. The mode shapes of the beam remain nearly unchanged when varying
Pz.
At low
, the
variation curves with respect to
Pz are similar across all three temperature fields. As
increases, the influence of
and temperature field profile becomes more pronounced.
under the nonlinear temperature field decreasing most slowly and remaining the highest, accompanied by the smallest
NT. In the uniform temperature field, the rate of
change with
Pz remains constant when varying
, resulting in nearly parallel curves. This is because, in the uniform case, the temperature distribution is independent of
Pz; varying
Pz only alters the magnitude of
NT, which changes gradually (
Figure 11) and is nearly proportional to
, leading to parallel
trends. Similarly, in the linear temperature field, the distribution is also independent of
Pz, so
NT variation closely resembles that under uniform conditions. However, due to its magnitude being closer to the nonlinear case, the
response aligns more with the nonlinear field. Under the nonlinear temperature field, the rate of
decrease intensifies with increasing
. Here, the temperature distribution depends on both
and
Pz, and
Pz has a significant effect on
. As
increases,
NT rises rapidly—approaching the level observed under uniform conditions—resulting in an accelerated decline in
.
The above results indicate that the temperature-induced term, analogous to a stiffness coefficient, is added to the stiffness-relating tensile force and neutral-axis strain due to thermal effects, primarily influencing the transverse displacement in the governing equations, with its impact varying according to the magnitude of NT. Conclusions: (1) Under uniform, linear, and nonlinear temperature fields, NT increases with the Pz, but the growth rate gradually decreases; correspondingly, decreases as Pz increases, and the rate of decline diminishes with higher Pz. (2) At low , the variation curves with respect to Pz are similar across all three temperature fields; as increases, the influence of and the temperature field profile on becomes more pronounced. (3) under the nonlinear temperature field decreases most slowly, consistently remaining the highest, while NT remains the smallest; as increases, the rate of decrease intensifies. (4) The variation trend in the linear temperature field resembles that under the uniform field, but its magnitude is closer to the nonlinear case. (5) Under the uniform temperature field, the rate of change with Pz remains nearly constant when varying , resulting in nearly parallel curves.
4.2.3. Effects of the Slenderness Ratio
The influence of slenderness ratio and
on
and
NT under different temperature fields are investigated in this section. To eliminate dimensional effects, dimensionless parameters are defined as
, where
denotes the elastic modulus of the top-surface material at
Tc = 300 K.
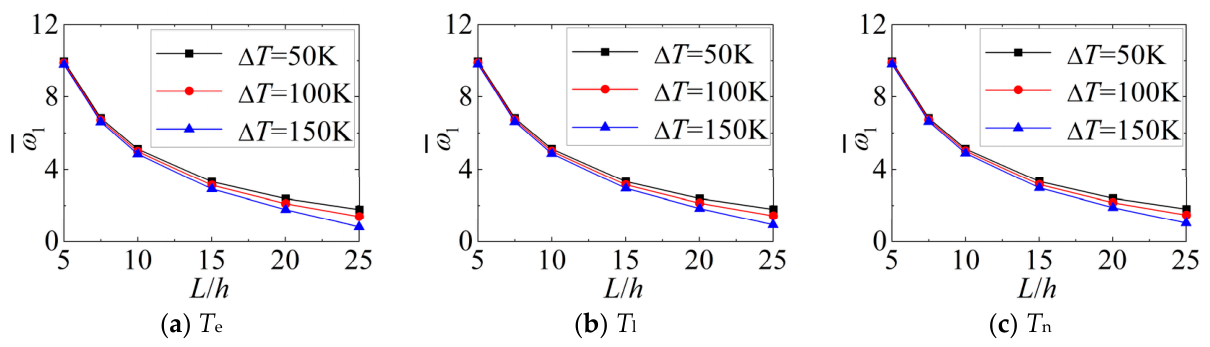
Figure 12 presents the variation in
with the slenderness ratio
L/
h under uniform (
Te), linear (
Tl), and nonlinear (
Tn) temperature fields, with varying
.
As shown in
Figure 12, the variation in
with
L/
h is highly similar under the three temperature fields.
decrease as
L/
h increases, and the rate of decline diminishes at higher
L/
h. This is because, with constant h and increasing
L, the beam’s equivalent
E is reduced due to geometric changes, leading to a lower
.
As shown in
Figure 12, at the same
L/
h,
under the linear temperature field is consistently the highest while that under the uniform temperature field is the lowest. The differences among the three
increase with rising
. According to Equation (16), with identical
Pz and
L/
h,
NT primarily depends on the temperature distribution pattern, being maximum under uniform temperature field and minimum under nonlinear temperature field. This aligns with the conclusion in
Section 4.2.1, indicating that, under a nonlinear temperature field, the beam’s
NT is the lowest and its
is least affected by temperature variations.
Under the same , as L/h increases, the differences in among the three temperature fields gradually enlarge. Although for a given Pz, NT, defined in Equations (3), (4), (7) and (16), remains constant under the same temperature field and —regardless of L/h—the influence of L/h extends beyond a single term in the equation. As shown in Equation (20), it is coupled with coefficients related to sectional stiffness, sectional mass moment of inertia, and the magnitude of NT. Therefore, is primarily altered by the geometric configuration of the material.
The above results indicate that, under the three temperature fields, the variation in with L/h is highly similar. The decreases as L/h increases, and the differences in grow larger with increasing L/h. Under the same temperature distribution pattern and identical , NT remains constant and is independent of L/h.
4.2.4. Effects of the Boundary Conditions
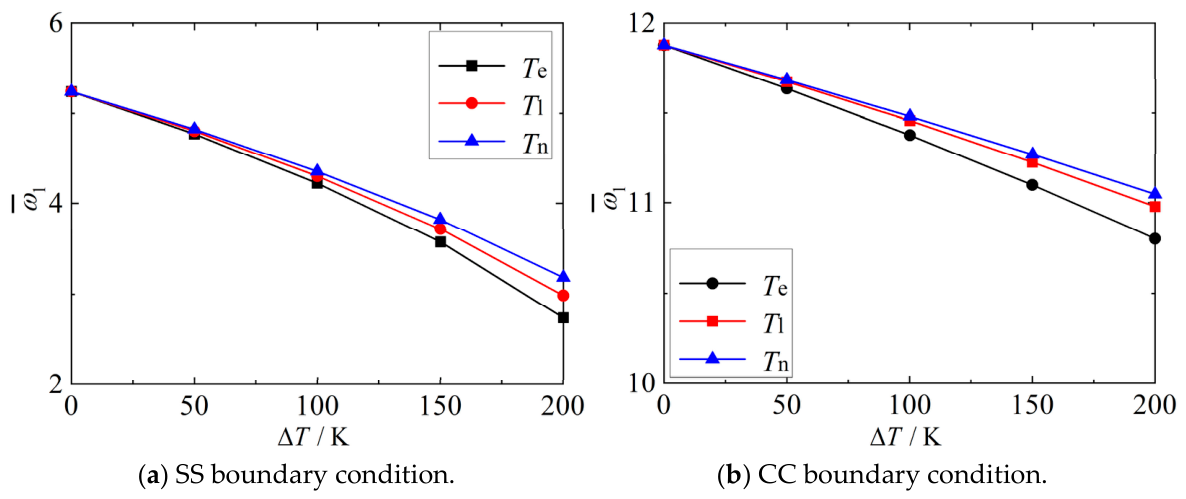
The influence of boundary conditions on and NT is investigated under different temperature fields and .
Figure 13 shows the variation of
under SS and CC boundary conditions with changing
in uniform, linear, and nonlinear temperature fields.
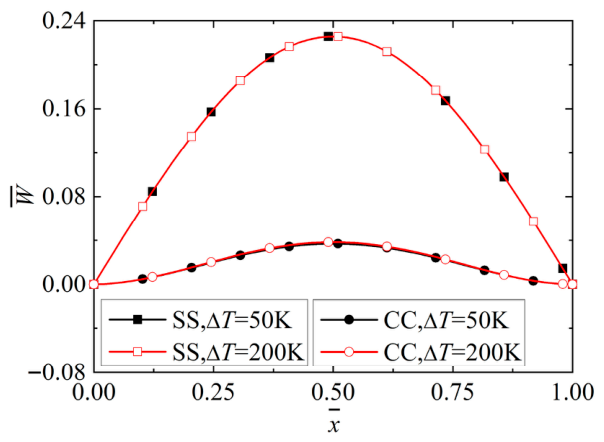
Figure 14 presents the corresponding mode shapes.
As shown in
Figure 13, under both boundary conditions,
decreases with increasing
. For a given boundary condition,
corresponding to the nonlinear temperature field is consistently the highest, while that under the uniform temperature field is the lowest, and
in the linear temperature field is closer to that under the nonlinear field—consistent with the conclusion in
Section 4.2.1. Under the CC boundary condition,
exhibits an approximately linear decline with rising
, whereas under the SS boundary condition, the rate of decrease increases with
, particularly under the uniform temperature field where the decline is the most rapid.
As indicated in
Figure 14, the mode shapes remain essentially unchanged with varying
. With increasing
, thermal expansion occurs in the structure. Under CC boundary conditions, the fixed supports constrain axial, shear, and bending deformations, resulting in smaller displacements and less sensitivity of
to temperature variations. In contrast, under SS boundary conditions, the absence of moment restraint allows for larger flexural deformation, leading to a reduction in equivalent stiffness and a more pronounced decrease in
as
increases.
The above results demonstrate that under the CC boundary condition, exhibits a more stable variation trend with increasing . In contrast, due to the absence of moment restraint, under the SS boundary condition, displays a significantly higher sensitivity to changes in .