Article

Mechanical and Shrinkage Properties of Two-Dimensional Aligned Steel Fiber-Reinforced Micro-Expansive Concrete


School of Civil and Transportation Engineering, Hebei University of Technology, Tianjin 300401, China
*
Author to whom correspondence should be addressed.
J. Compos. Sci. 2026, 10(5), 271; https://doi.org/10.3390/jcs10050271
Submission received: 20 March 2026 / Revised: 12 May 2026 / Accepted: 15 May 2026 / Published: 17 May 2026
(This article belongs to the Section Fiber Composites)

Abstract

In this study, the two-dimensional aligned steel fiber-reinforced micro-expansive concrete (2D) was prepared, aiming to address the inherent vulnerabilities of concrete, such as early-age shrinkage cracking and low tensile ductility. For this purpose, the steel fibers and expansive agent were utilized. Furthermore, the planar rotating magnetic field was used to randomly distribute the steel fibers in a two-dimensional plane. In order to verify its superior mechanical and shrinkage properties, the compressive, fracture and drying shrinkage tests were carried out. The results demonstrate that the 2D alignment method enhances the fiber utilization efficiency. Compared with fiber-free groups, the compressive strength and fracture parameters of specimens incorporating steel fibers were improved. Furthermore, compared with randomly distributed steel fiber-reinforced micro-expansive concrete (RD), the 2D alignment method made the cubic compressive strength and fracture energy improve 8–14.2% and 19.4–110%, respectively. Additionally, the advantage of the fiber 2D alignment method was also reflected in the inhibition of drying shrinkage. Compared with normal concrete, the 180-day shrinkage strain of the 2D1.2 group was reduced to 200 με (only 19.5% of that of normal concrete, or 30.6% of that of micro-expansive concrete). Mechanistically, these superior performances are fundamentally governed by a coupling effect: chemical shrinkage compensation and physical alignment constraint.

1. Introduction

As the most widely used building material globally, concrete is indispensable in major infrastructure such as pavements, bridges, tunnels and dams due to its superior compressive performance and durability [1]. However, the inherent defects of concrete, such as early-age shrinkage cracking and insufficient tensile performance, lead to structural failure caused by cracking during service, thus shortening the service life [2]. Therefore, it is urgent to develop high-performance concrete with both shrinkage cracking resistance and high mechanical properties.
At present, adding expansive agent is a mature and effective technical approach in practical engineering to improve the shrinkage cracking resistance performance of concrete [3,4]. As a dual-expansion source modified material, sulfoaluminate–calcium oxide composite expansive agent rapidly compensates for plastic shrinkage and chemical shrinkage through the hydration of CaO to form Ca(OH)2 at an early age, and continuously compensates for drying shrinkage through the growth of AFt crystals at middle and late stages [5]. It has strong adaptability to curing conditions and has been widely used in shrinkage-compensating concrete [6].
In terms of the loading cracks due to the low tensile performance of concrete, the steel fibers are always utilized to bridge cracks [7,8]. However, the stress in the service structure is constant and regular. Only the steel fibers that are parallel with the direction of the main stress can play a role in the reinforcing effect, thereby improving the bearing capacity of the structure. In other words, the fibers that are not parallel with the main stress exhibit limited reinforcing efficiency [9,10]. In order to maximize the reinforcing efficiency of randomly distributed fibers, some technologies were utilized to adjust the fiber orientation to make all fibers aligned along the direction of the main stress. As a result, the aligned steel fiber-reinforced concrete (ASFRC) was successfully prepared [11,12,13]. In terms of the plate components, such as pavements and bridge decks, the principal stress of structures is random in a two-dimensional plane. The randomly distributed steel fiber concrete is not appropriate because the fibers that are perpendicular to the two-dimensional plane can not play a role in reinforcement. In this scenario, the optimal solution is to utilize two-dimensionally aligned steel fiber-reinforced cement-based composites (2D-ASFRC), in which the steel fibers are randomly distributed within a two-dimensional plane [14,15]. By this method, the multi-directional stress requirement of structures can be met [16]. Existing studies have confirmed that two-dimensionally arranged steel fibers contribute to the improvement of flexural performance [14], dynamic compressive performance [15], punching shear performance [17] and fracture performance [18] of concrete.
When expansive agents are incorporated alongside steel fibers, they can exert the effect of “shrinkage compensation-fiber reinforcement”. Further, the two-dimensional alignment of steel fibers can maximize the reinforcement efficiency of fibers. However, the current literature primarily focuses on the mechanical performance of randomly distributed steel fiber-reinforced micro-expansive concrete [19,20,21]. There remains a notable lack of research regarding the mechanical and shrinkage properties of two-dimensional aligned steel fiber-reinforced micro-expansive concrete. These research gaps limit the engineering popularization and application of this composite material.
In this paper, the two-dimensional aligned steel fiber-reinforced micro-expansive concrete (2D) specimens with different fiber contents were designed, and tests on cubic compressive strength, prism uniaxial compressive strength, three-point bending fracture and drying shrinkage performance were systematically carried out. The mechanical properties, such as compressive strength, stress–strain characteristics, fracture toughness, fracture energy and drying shrinkage strain were analyzed and compared with those of randomly distributed steel fiber-reinforced micro-expansive concrete (RD) specimens. The authors hope that this work can provide an experimental basis and theoretical reference for the engineering application of 2D.

2. Experimental Program

2.1. Raw Materials

In this study, the P·O 42.5 cement with a true density of 3093 kg/m3 and specific surface area of 360 m2/kg was adopted. Class II fly ash with a density of 2342 kg/m3 and 28 d activity index of 73.3% was used, with a dosage of 15%. Natural river sand (fineness modulus 2.7, apparent density 2640 kg/m3) and 5–20 mm continuous graded crushed stone (apparent density 2740 kg/m3, mud content 0.3%) were utilized as aggregates. UEA-I sulfoaluminate–calcium oxide composite expansive agent with a specific surface area of 375 m2/kg, 7 d water-limited expansion rate of 0.043% and 28 d compressive strength of 49.2 MPa was adopted. The steel fibers with a length of 13 mm, a diameter of 0.2 mm, tensile strength of 2850 MPa and density of 7.8 × 10³ kg/m3 were used. Polycarboxylate high-performance water reducer (water reduction rate 25%, dosage 1%) was utilized to adjust the workability of the mixture.

2.2. Specimen Preparation

2.2.1. Mix Proportion Design

Normal concrete (NC) and micro-expansive concrete (MEC) were designed as reference groups, with randomly distributed steel fiber-reinforced micro-expansive concrete (RD) and two-dimensional aligned steel fiber-reinforced micro-expansive concrete (2D) as test groups. The steel fiber volume fractions (Vf) were 0.4%, 0.8% and 1.2%, with a total of 8 mix proportions. The water–binder ratio and sand ratio of each group were kept consistent, and only the dosage of expansive agent, steel fiber content and distribution form were changed. The mix proportions are shown in Table 1.

2.2.2. Specimen Preparation and Curing

The compressive performance, three-point bending fracture performance and drying shrinkage performance were investigated in this study, in which the compressive performance contains cubic compressive test and the prism compressive test. The specimen size, specimen quantity and curing condition for each test were listed in Table 2. It should be pointed out that the effect of age on the cubic compressive strength was also investigated.
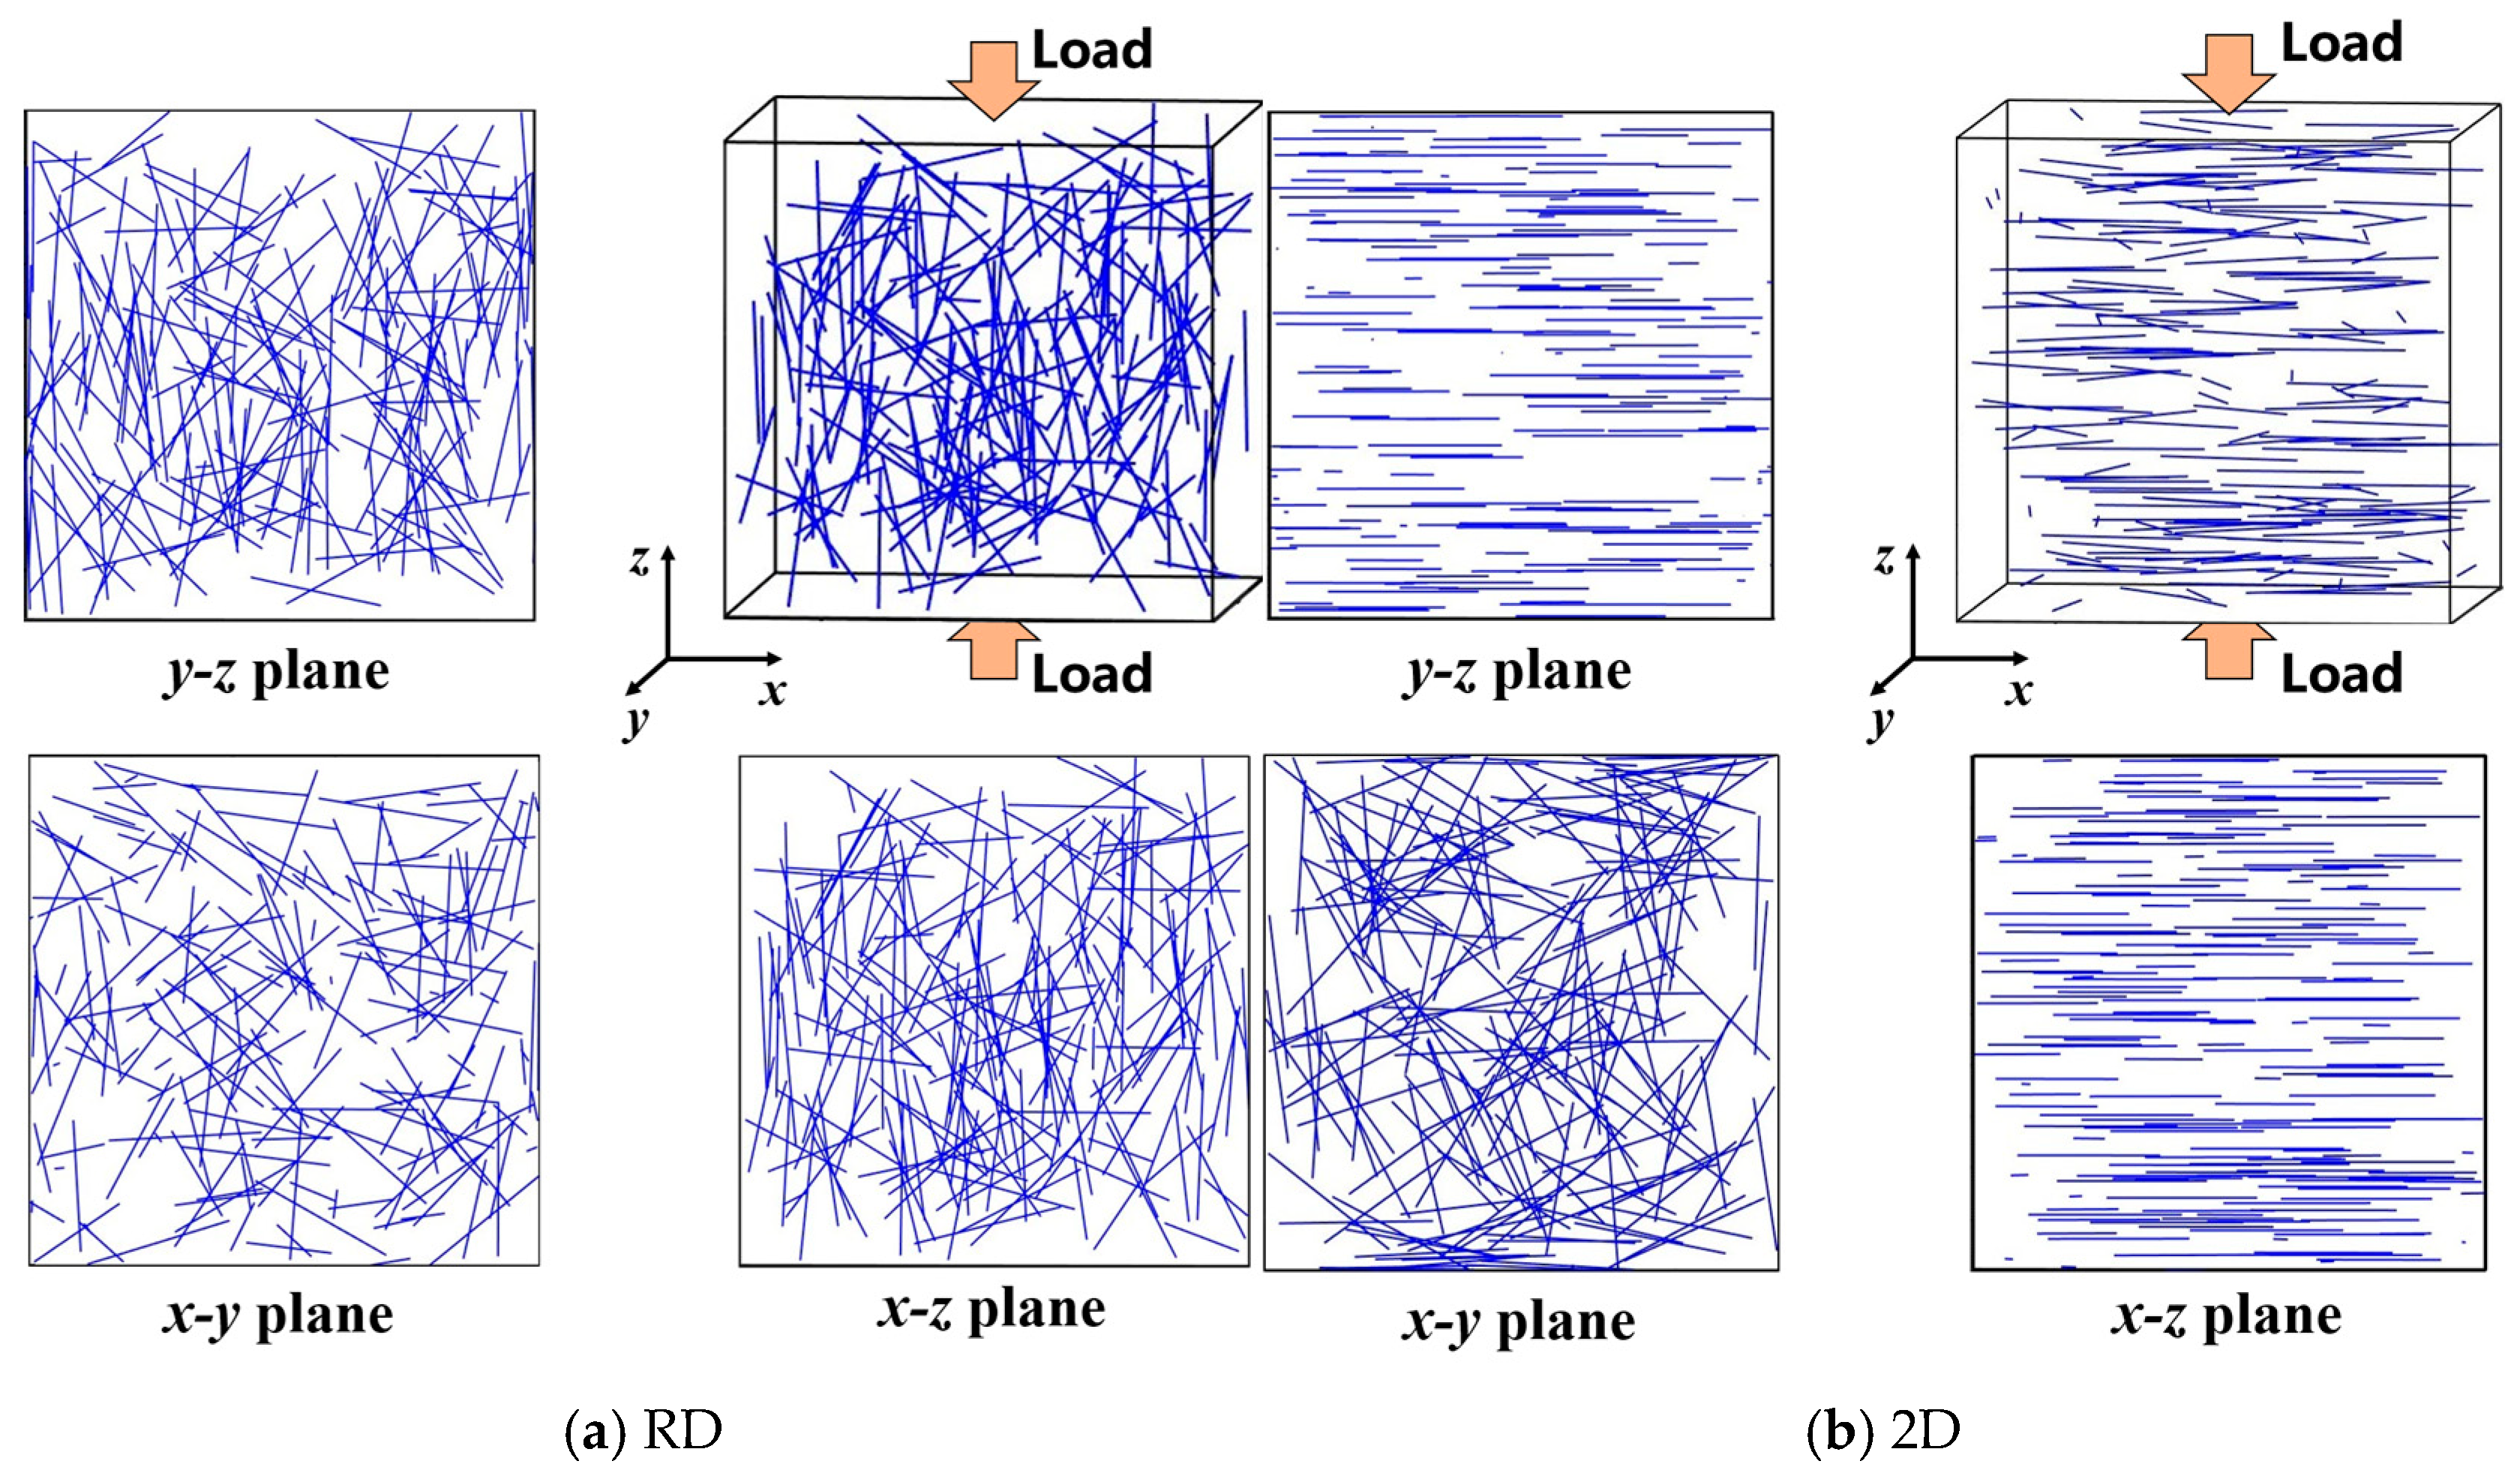
The fresh mixtures of NC, MEC, RD and 2D were prepared following conventional mixing protocols. For the 2D specimens, fiber alignment was applied immediately after casting. The fiber alignment was achieved utilizing a planar rotating magnetic field technique. Specifically, a symmetrical three-phase alternating current with a frequency of 50 Hz was supplied to three sets of closed coils arranged at 120° intervals to generate a uniform rotating magnetic field with a magnetic induction intensity of approximately 1.5 × 10⁻⁴ T. The rotating magnetic field was applied for a duration of 60 s. Driven by the induced magnetic torque, the steel fibers rotated around the longitudinal axis of the specimen and eventually aligned uniformly within a 2D cross-sectional plane, which can be seen in Figure 1. Comprehensive details regarding this magnetic alignment methodology can be found in References [14,15,16]. The RD specimens were prepared under identical conditions but without the application of the magnetic field. The fiber distribution types of RD and 2D are presented in Figure 2 [16]. It can be seen that the fibers in RD were three-dimensional, randomly distributed in the concrete matrix, while the fibers in 2D were two-dimensional, randomly distributed in a two-dimensional plane.
Specimens were left to stand for 24 h after molding and then demolded. The cubic and prism specimens were cured in a standard curing room (temperature 20 ± 1°C, relative humidity ≥ 90%) to the specified age. Fracture specimens were tested after 28 days of curing under the same conditions. Drying shrinkage specimens were cured in a standard curing room for 48 h after demolding, and then transferred to a constant temperature and humidity environment (temperature 20 ± 1°C, RH = (60 ± 5)%) for continuous curing for 180 days.

2.3. Test Methods

2.3.1. Mechanical Performance Test

The compressive performance test was conducted in accordance with GB/T 50081-2019 [22]. For cubic compressive strength, the 100 × 100 × 100 mm3 specimen size was selected, and a 0.5 MPa/s loading rate was determined. The final compressive strength was the average value of three specimens. The relative position between the fiber orientation and loading direction has a significant effect on compressive performance [16]. As demonstrated in Figure 2, the fibers were aligned perpendicular to the load direction to maximize the reinforcing effect. The RD was an isotropic material and did not specify its compression surface.
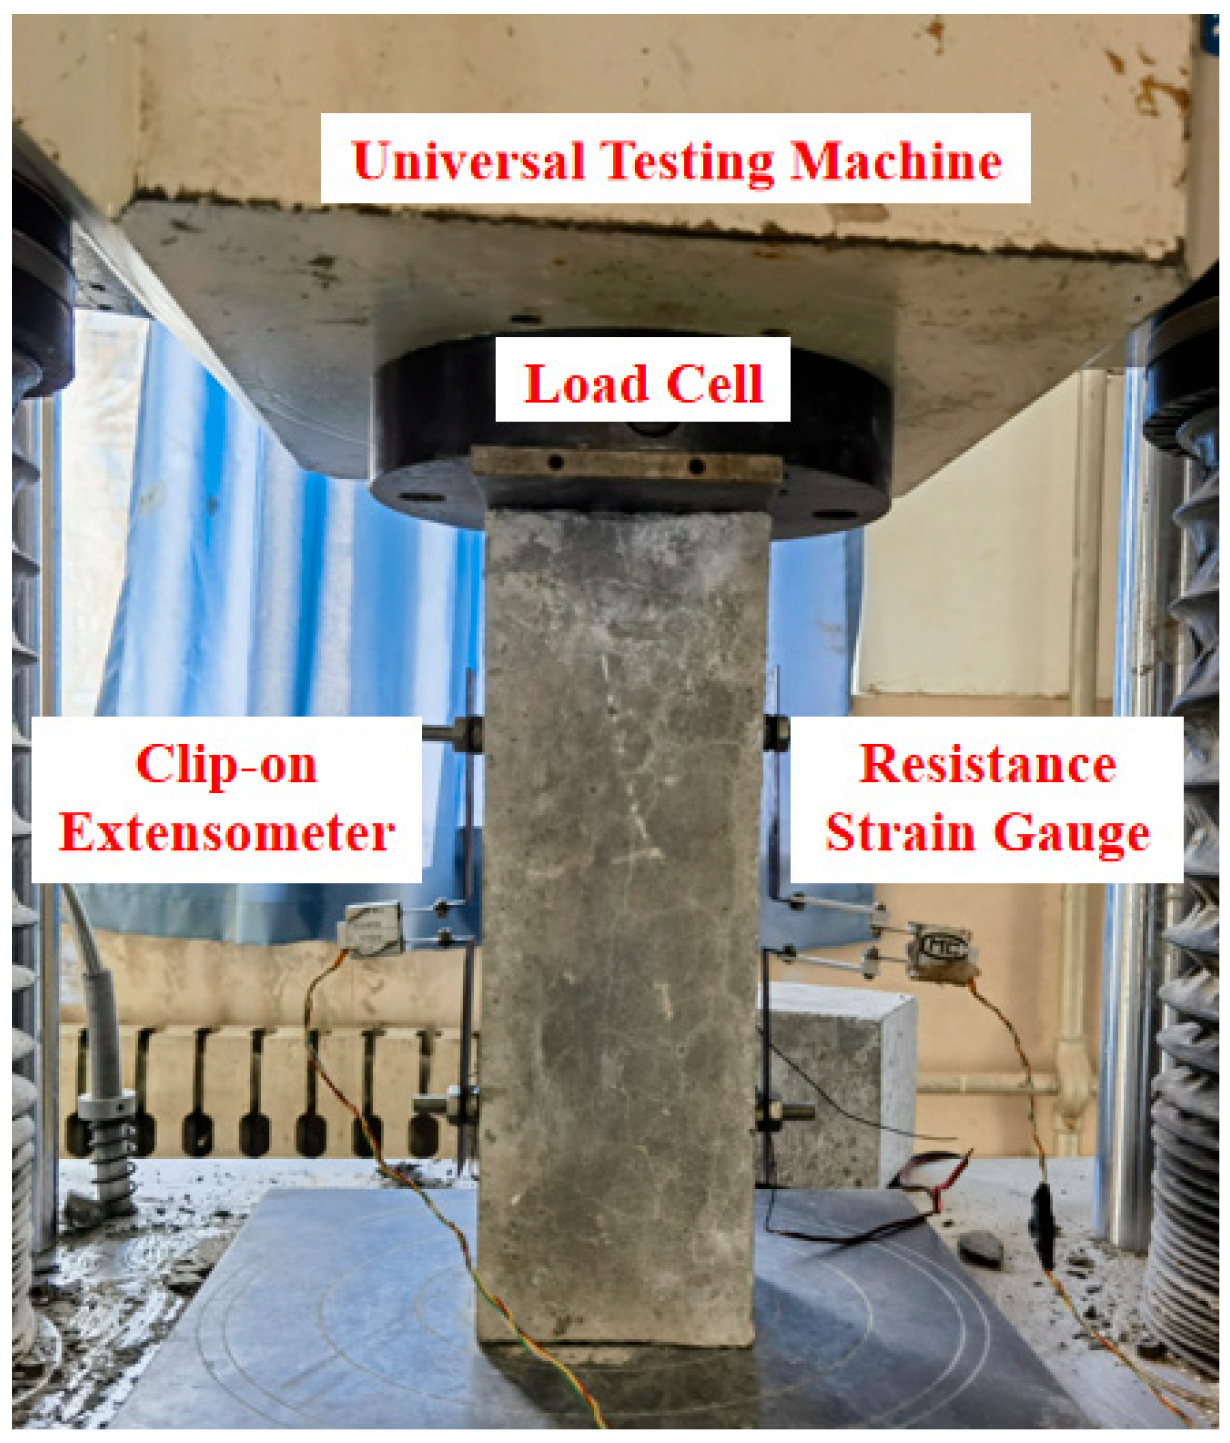
The prism uniaxial compression test was carried out with a 2000 kN servo-hydraulic testing machine, and the loading rate was 0.4 mm/min. Both ends of the specimen were ground, and the strain gauges were arranged to collect uniaxial strain and draw stress–strain curves. The digital image correlation (DIC) method was utilized to capture the full-field deformation. The loading diagram of the prism uniaxial compression test can be seen in Figure 3. Similar to the cubic compressive strength test, the fibers were aligned perpendicular to the load direction.

2.3.2. Fracture Performance Test

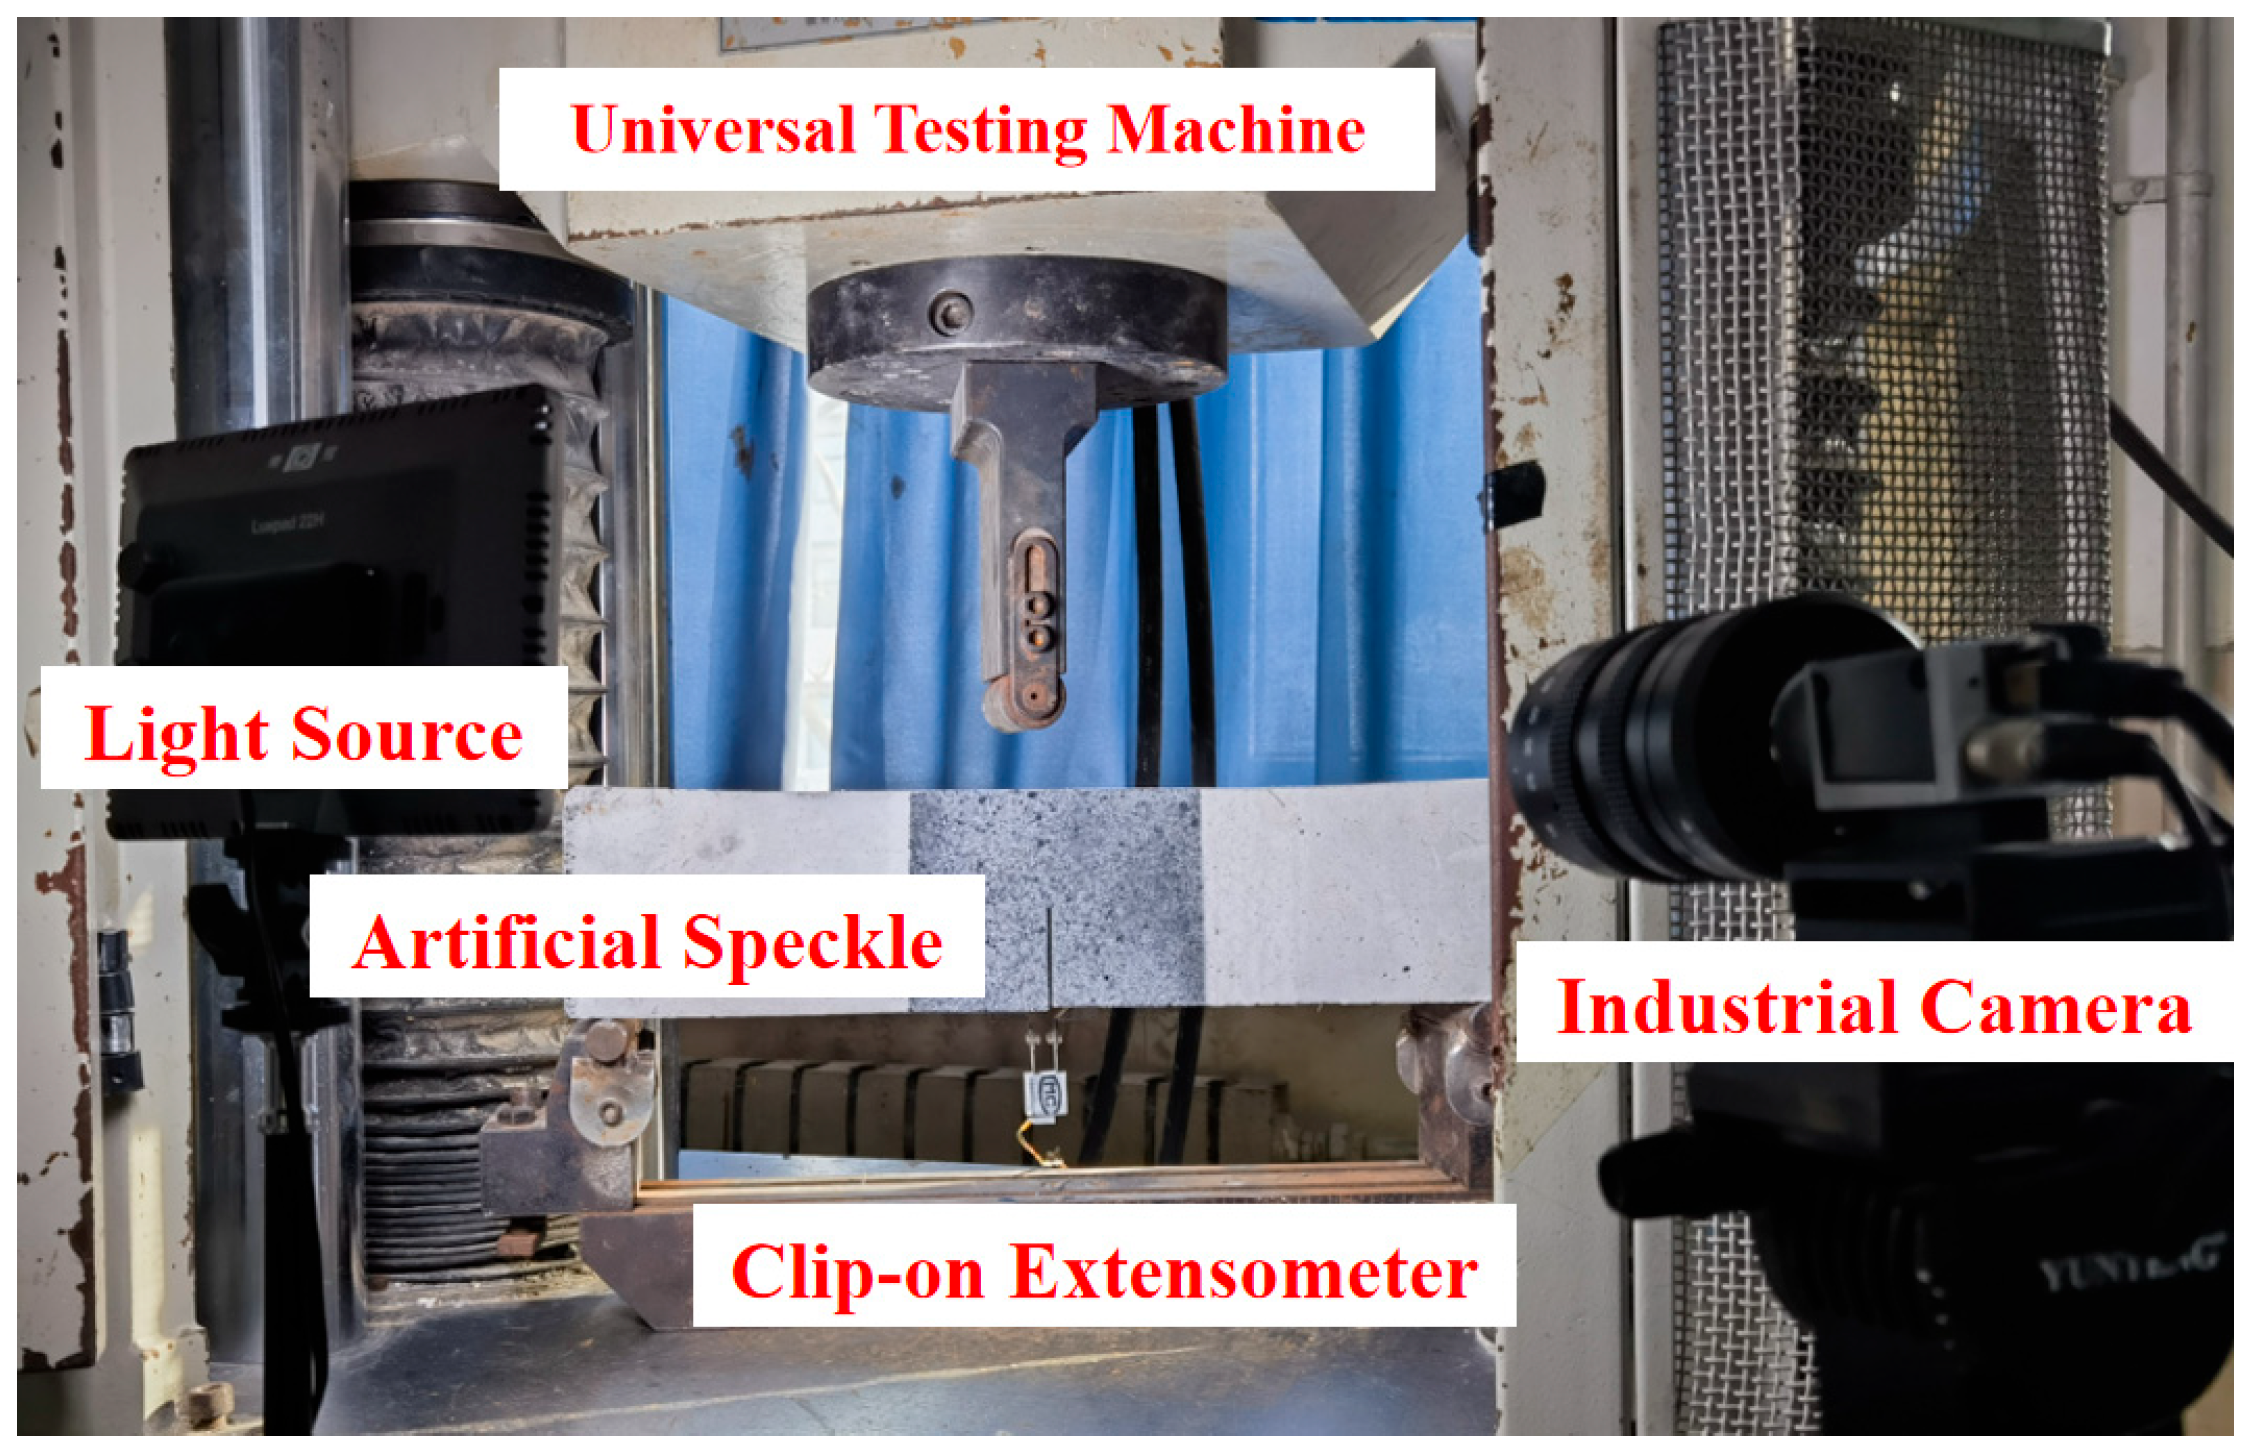
In accordance with RILEM specifications [23], a 2000 kN servo-hydraulic testing machine was used with a displacement-controlled loading rate of 0.15 mm/min. Load (P), crack mouth opening displacement (CMOD) and mid-span deflection (δ) were collected by load sensors and clip-on extensometers. The loading diagram of the three-point bending fracture test is shown in Figure 4. Similar to the compressive test, the flexural load was perpendicular to the fiber alignment plane.

2.3.3. Shrinkage Performance Test

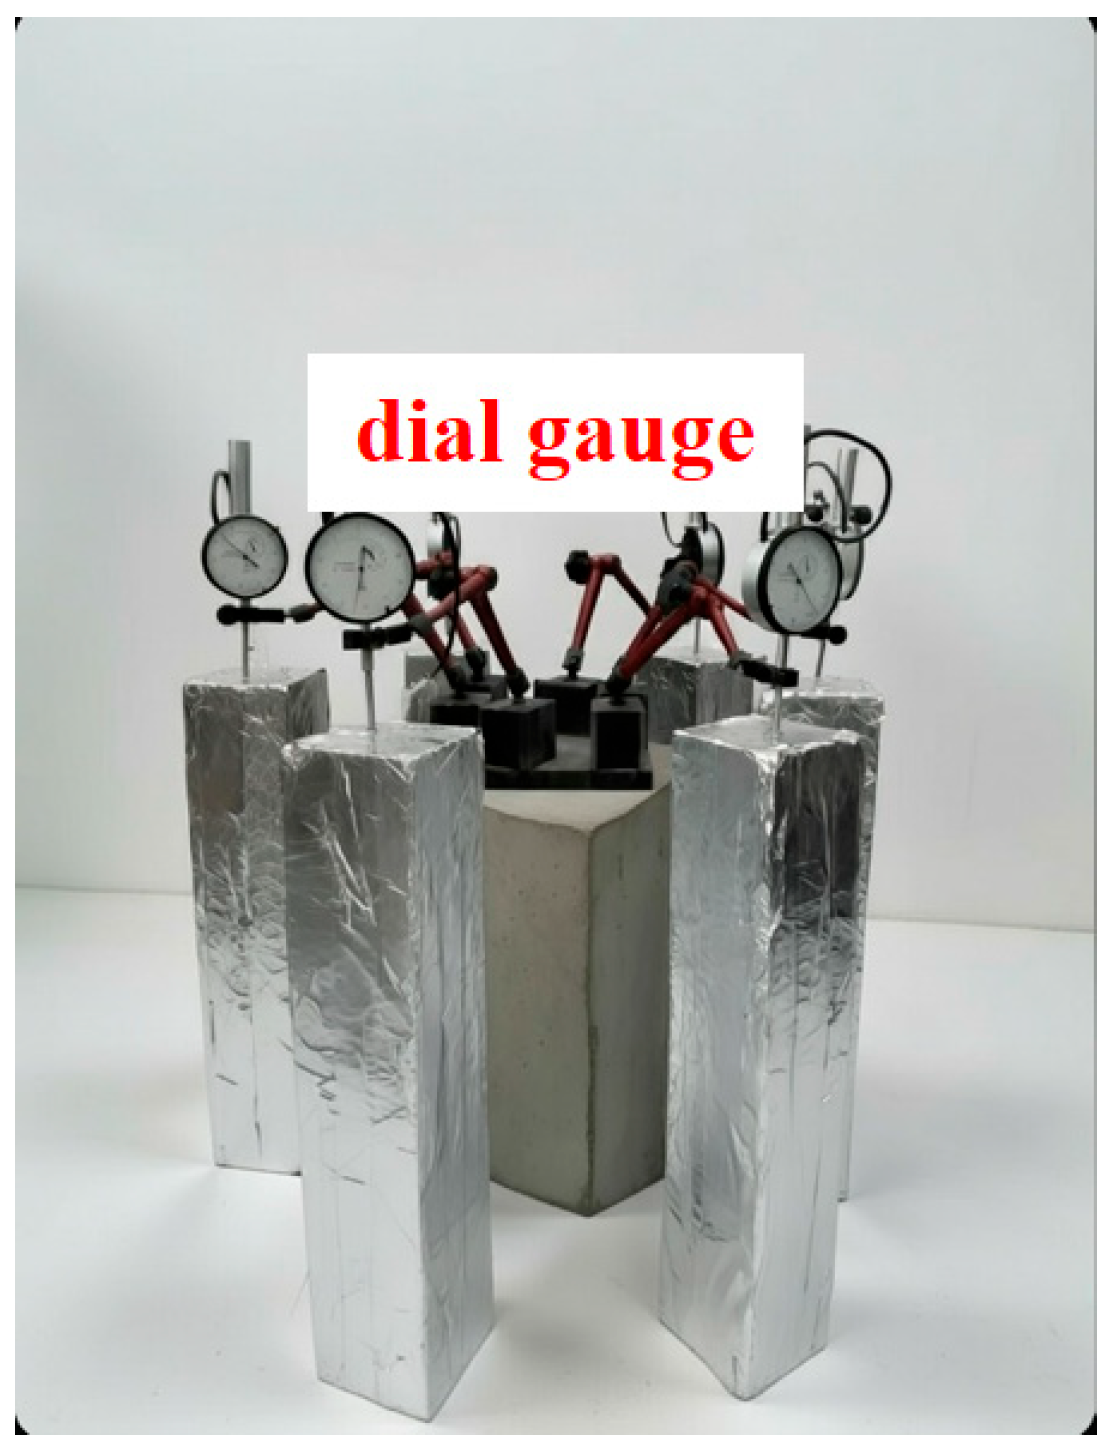
Drying shrinkage test was carried out in accordance with JG/T 472-2015 [24]. As seen in Figure 5, the specimen surface was covered with plastic film after casting and demolded after 24 h. Immediately after demolding, the specimen was moved to a standard curing room for 48 h, and then placed in a constant temperature and humidity environment (20 ± 1°C, RH = (60 ± 5)%) to measure the initial length. The length of the specimen at different ages (timed from moving into the constant temperature and humidity chamber) was measured by a dial indicator (accuracy 0.01 mm). The drying shrinkage strain was calculated according to Equation (1), and the test results were the average value of three specimens.
ε d s , t = L t L 0 L 0
where εds,t is the drying shrinkage value (με) of concrete at age t(d), Lt and L0 are the length of the specimen at age t(d) and the initial length of the specimen, respectively. In this study, L0 = 515 mm.

3. Results

3.1. Compressive Strength

3.1.1. Cubic Compressive Strength

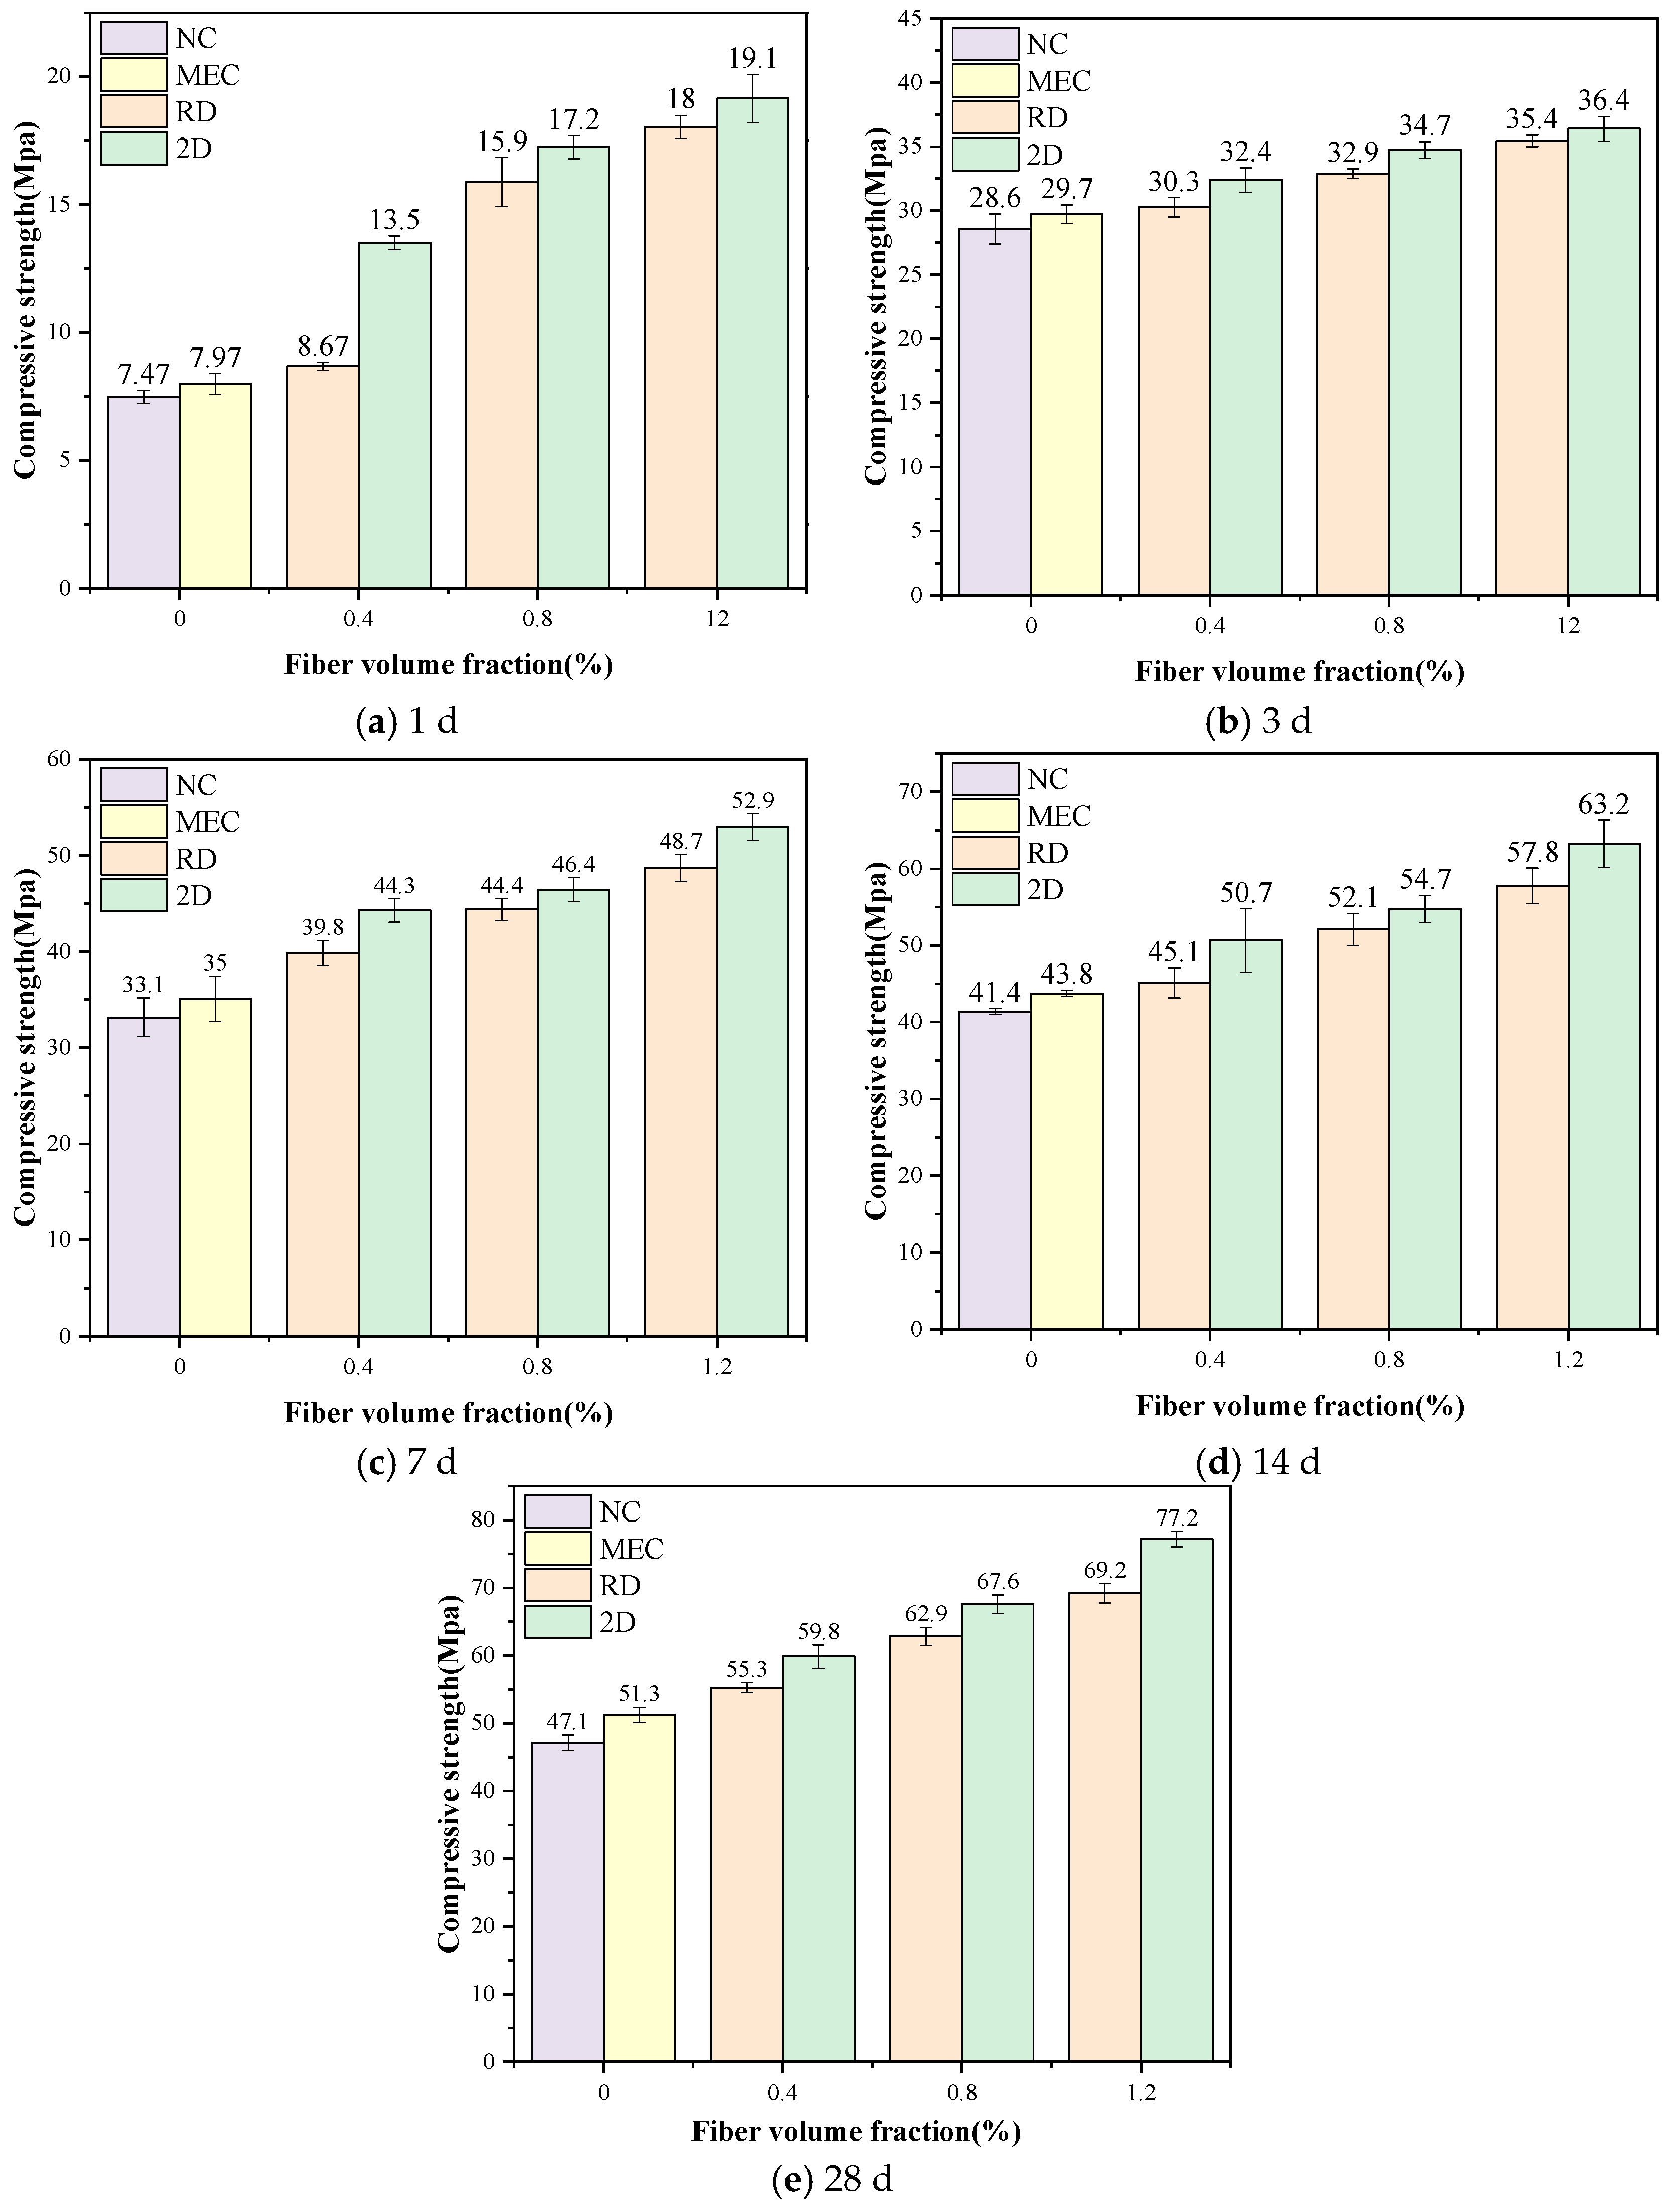
The development of cubic compressive strength for all groups across different curing ages (1 d to 28 d) is illustrated in Figure 6. Overall, the compressive strength of each group exhibits a continuous increase with curing age. Furthermore, all the incorporation of the expansive agent, the increase in steel fiber content, and the application of fiber two-dimensional alignment technology can progressively enhance the strength of the concrete.
The compressive strength of the MEC group is increased by 6.7% at 1d, 3.8% at 3 d, 5.7% at 7 d and 5.8% at 14d compared to the NC group. By 28 days, the MEC group reaches 51.3 MPa, which is 8.9% higher than the NC group (47.1 MPa). The incorporation of steel fibers progressively enhanced the compressive strength. For the 2D groups, the compressive strength of the 2D1.2 group was 12.3% higher than that of the 2D0.4 group at 3 d, 19.4% higher at 7 d, and 29.1% higher at 28 d. The absolute strength difference between the 2D1.2 and 2D0.4 groups expanded from 4.0 MPa at 3 d to 17.4 MPa at 28 d.
Under identical fiber contents, the fiber 2D aligned distribution type outperforms the fiber random distribution (RD) type. At 28 days, the compressive strengths of the 2D0.4, 2D0.8, and 2D1.2 groups are 8.2%, 9.0%, and 14.2% higher than their corresponding RD counterparts.
The progressive increase in the strength differential between the 2D1.2 and 2D0.4 groups with curing age (from 4.0 MPa at 3 d to 17.4 MPa at 28 d) can be explained by the evolution of the fiber–matrix interfacial transition zone (ITZ). At early ages, the cement hydration is insufficient, and the fiber pull-out resistance is governed primarily by weak physical friction. As the expansive agent hydrates to form AFt and Ca(OH)2, the radial compressive stress at the fiber–matrix interface increases, elevating the equivalent interfacial shear strength, thereby fully mobilizing the high tensile strength of the steel fiber and amplifying the contribution of a higher fiber volume fraction. Similar observations regarding the increasing reinforcement efficiency of steel fibers with matrix maturity have been reported in previous studies on conventional SFRC [25,26]. This “age-amplification effect” is more pronounced in the 2D configuration because the aligned fibers provide a more uniform and continuous restraint against lateral Poisson expansion [16].

3.1.2. Uniaxial Compressive Strength and Failure Mode

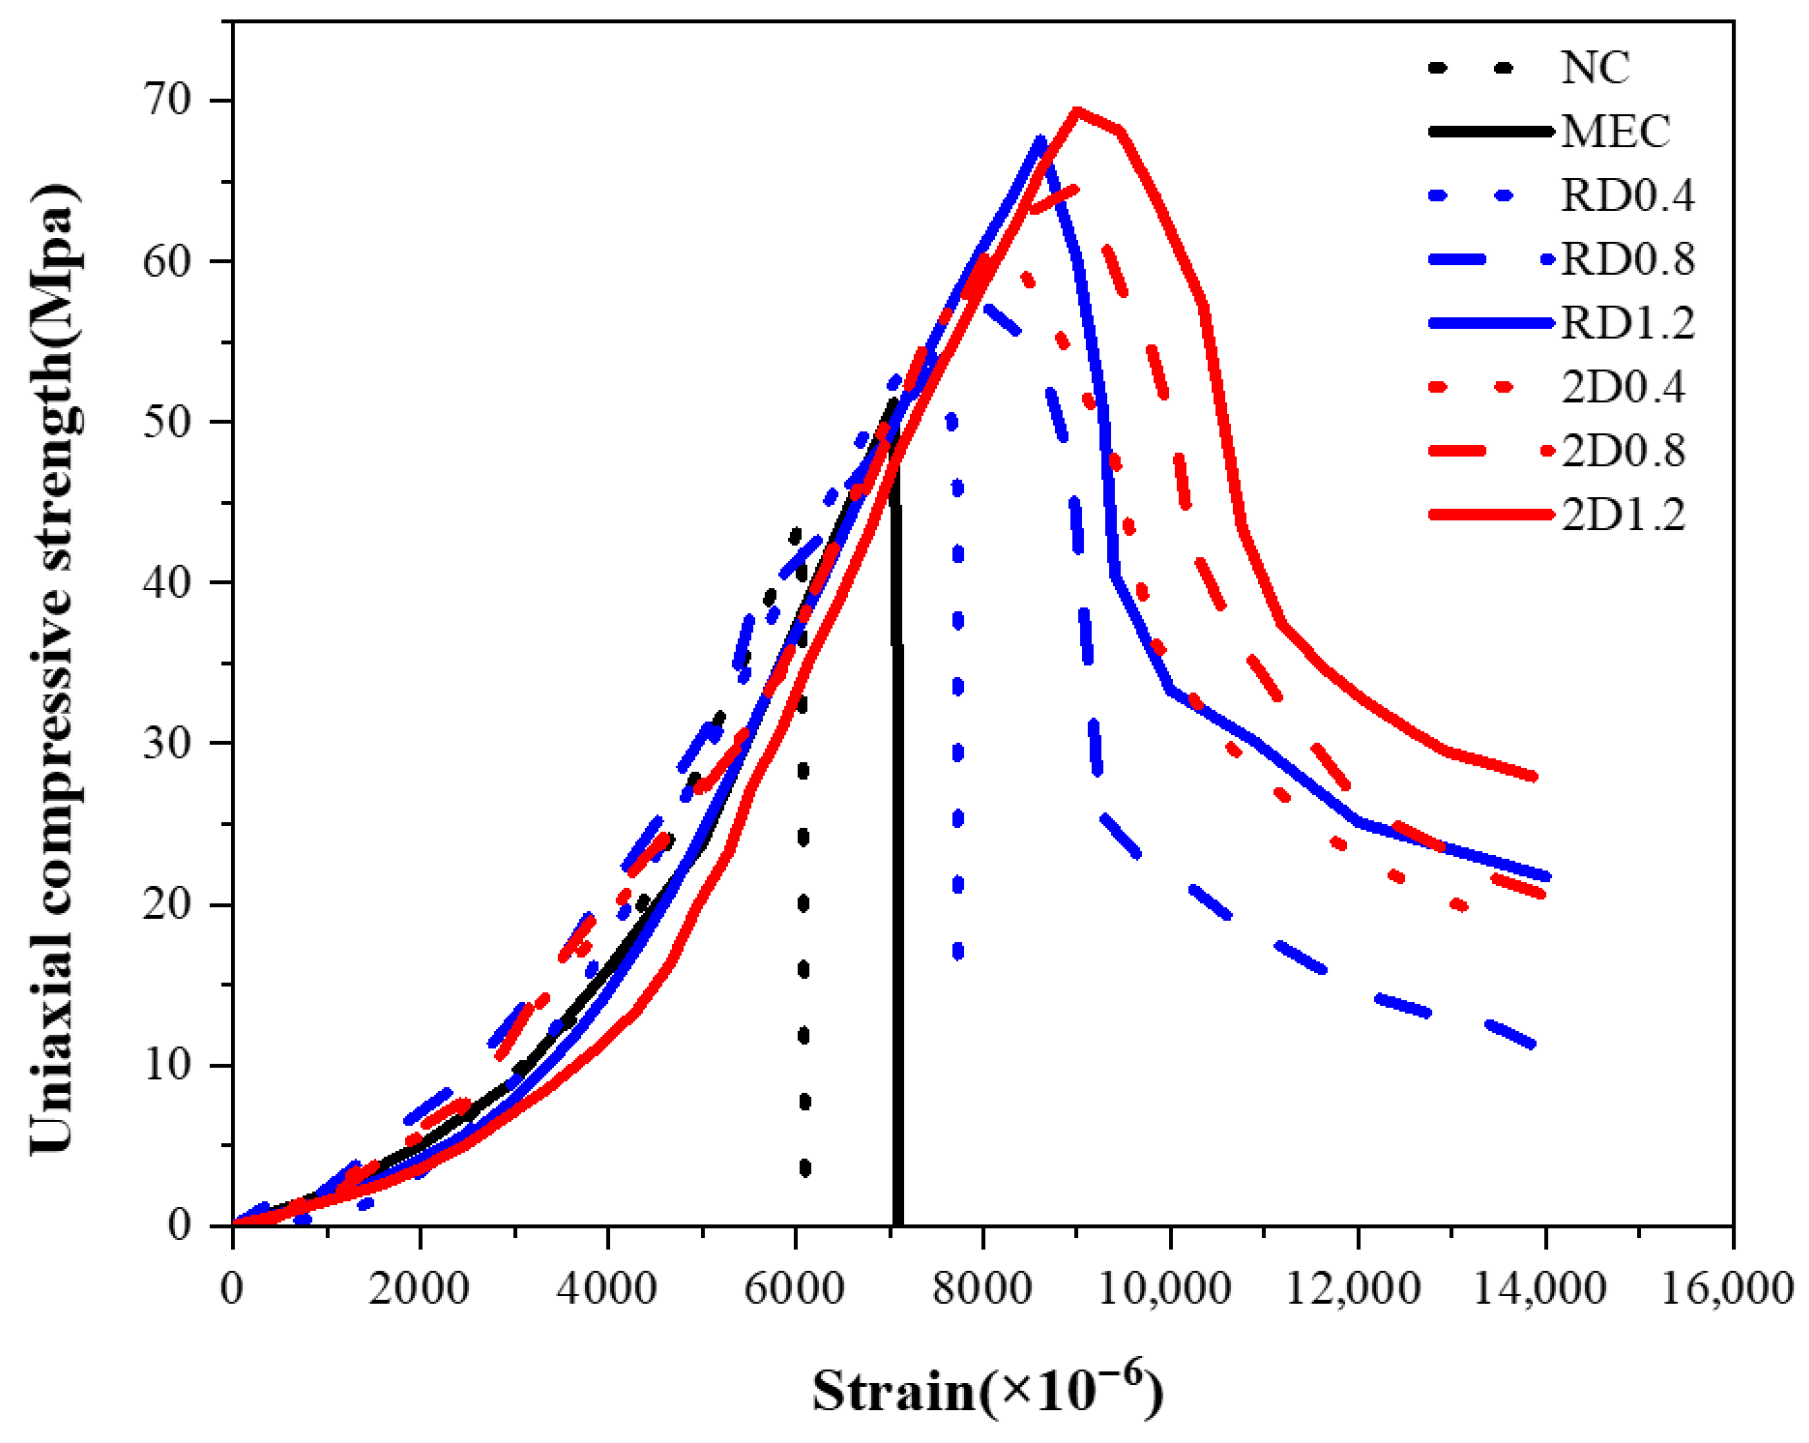
The 28-day uniaxial compressive stress–strain curves for the prisms of each group are presented in Figure 7. The non-fiber groups (NC and MEC) exhibited a precipitous drop in stress after reaching the peak, whereas the steel fiber-reinforced groups (RD and 2D) displayed a much gentler descending branch and maintained a significant residual load. At an identical fiber dosage, the 2D specimens demonstrated a higher peak compressive stress and a superior post-peak bearing capacity compared to the RD specimens. Notably, the curve of the 2D0.4 specimen largely coincided with that of the RD-0.8 specimen.
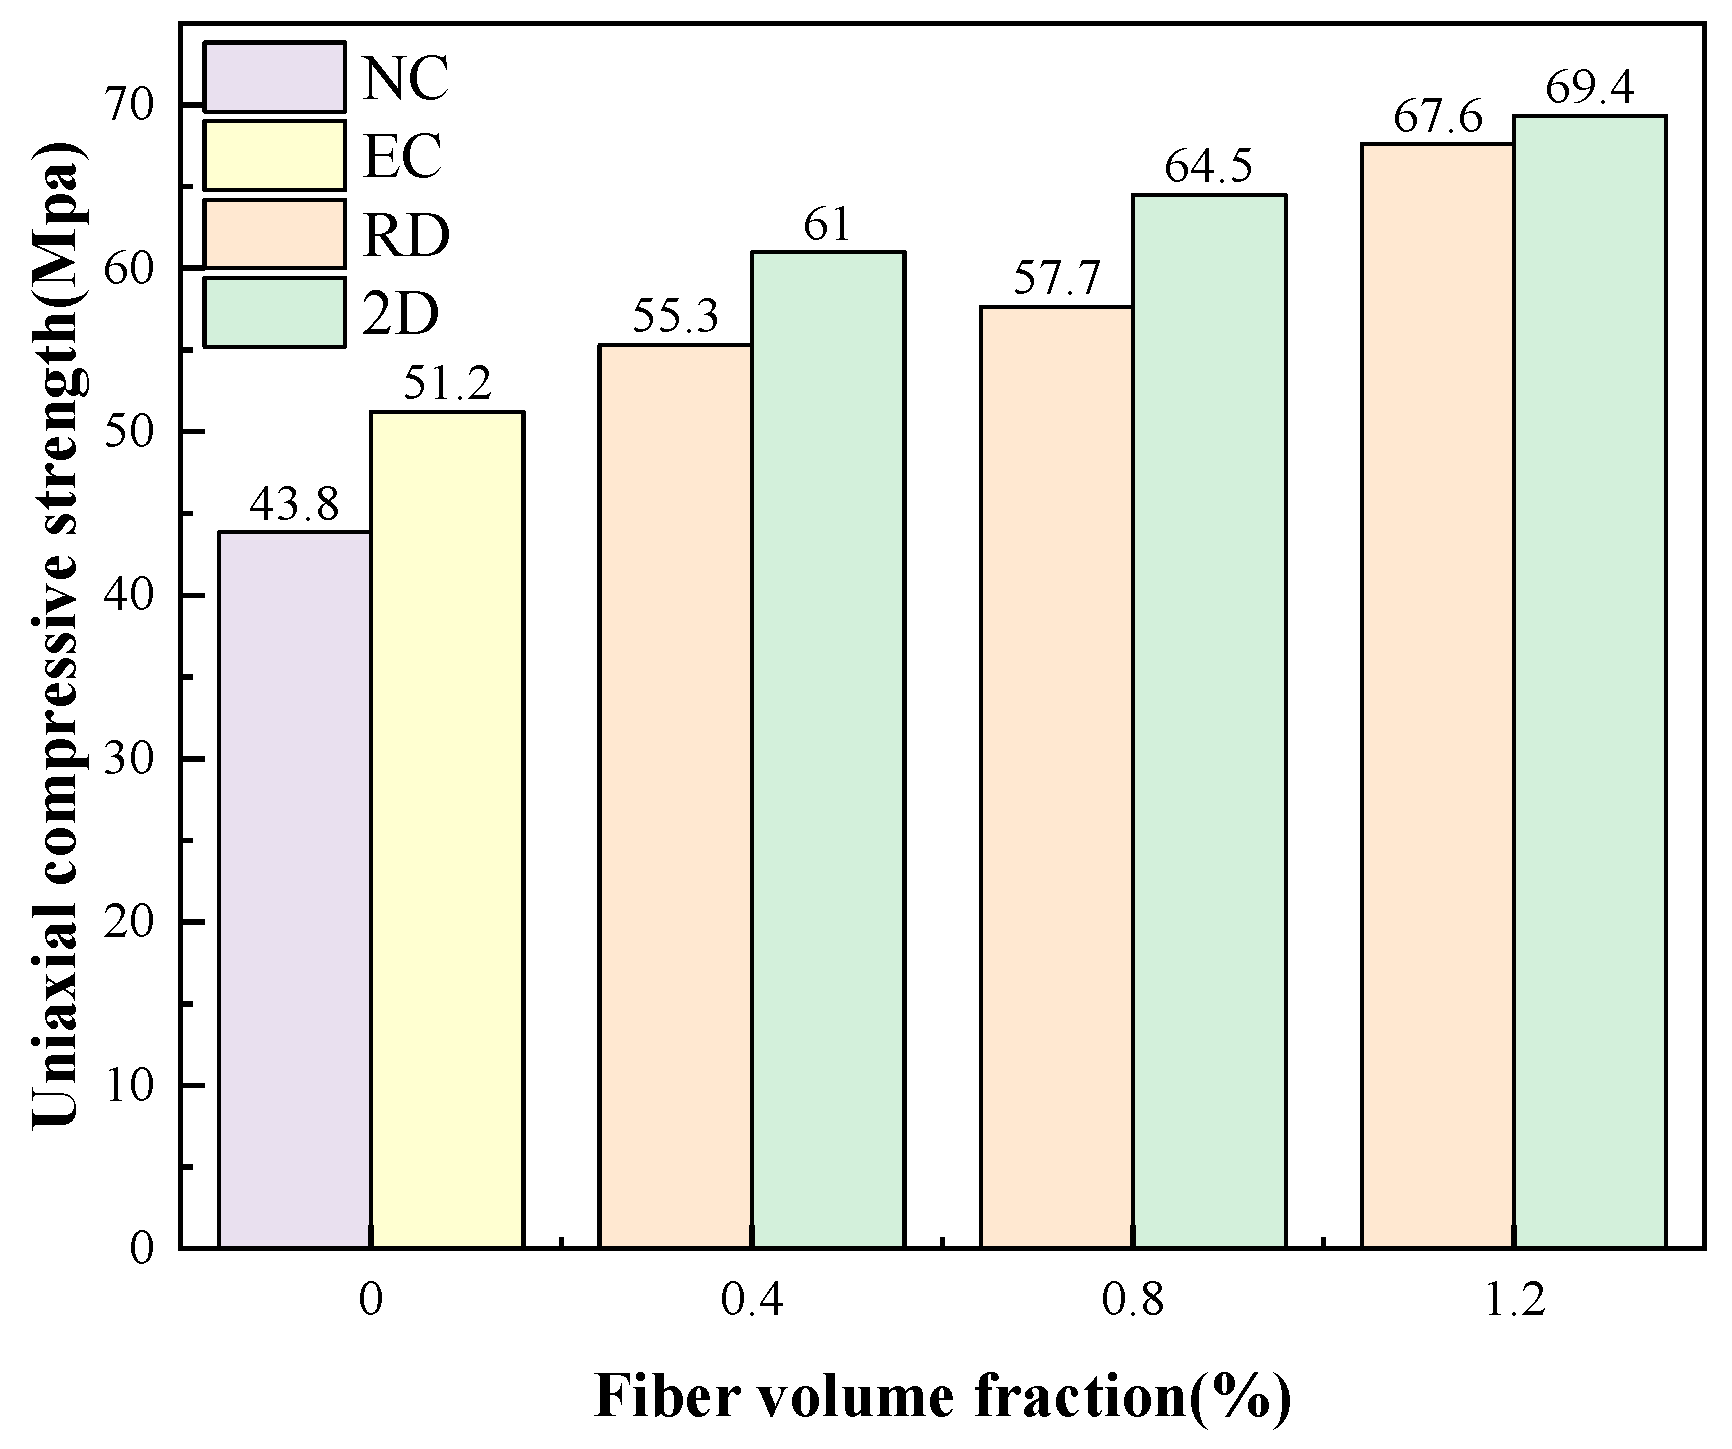
The 28-day uniaxial compressive strength results are summarized in Figure 8. The uniaxial compressive strength of the MEC group (51.2 MPa) was 16.9% higher than that of the NC group (43.8 MPa). For both the RD and 2D groups, the uniaxial compressive strength increased as the steel fiber volume fraction rose from 0.4% to 1.2%. Specifically, the strength of the RD group increased from 55.3 MPa to 67.6 MPa (a 22.2% increment), while the 2D group increased from 61.0 MPa to 69.4 MPa (a 13.8% increment). Compared to the RD specimens, the 2D specimens exhibited strength increments of 10.3%, 11.8%, and 2.6% at fiber contents of 0.4%, 0.8%, and 1.2%, respectively.
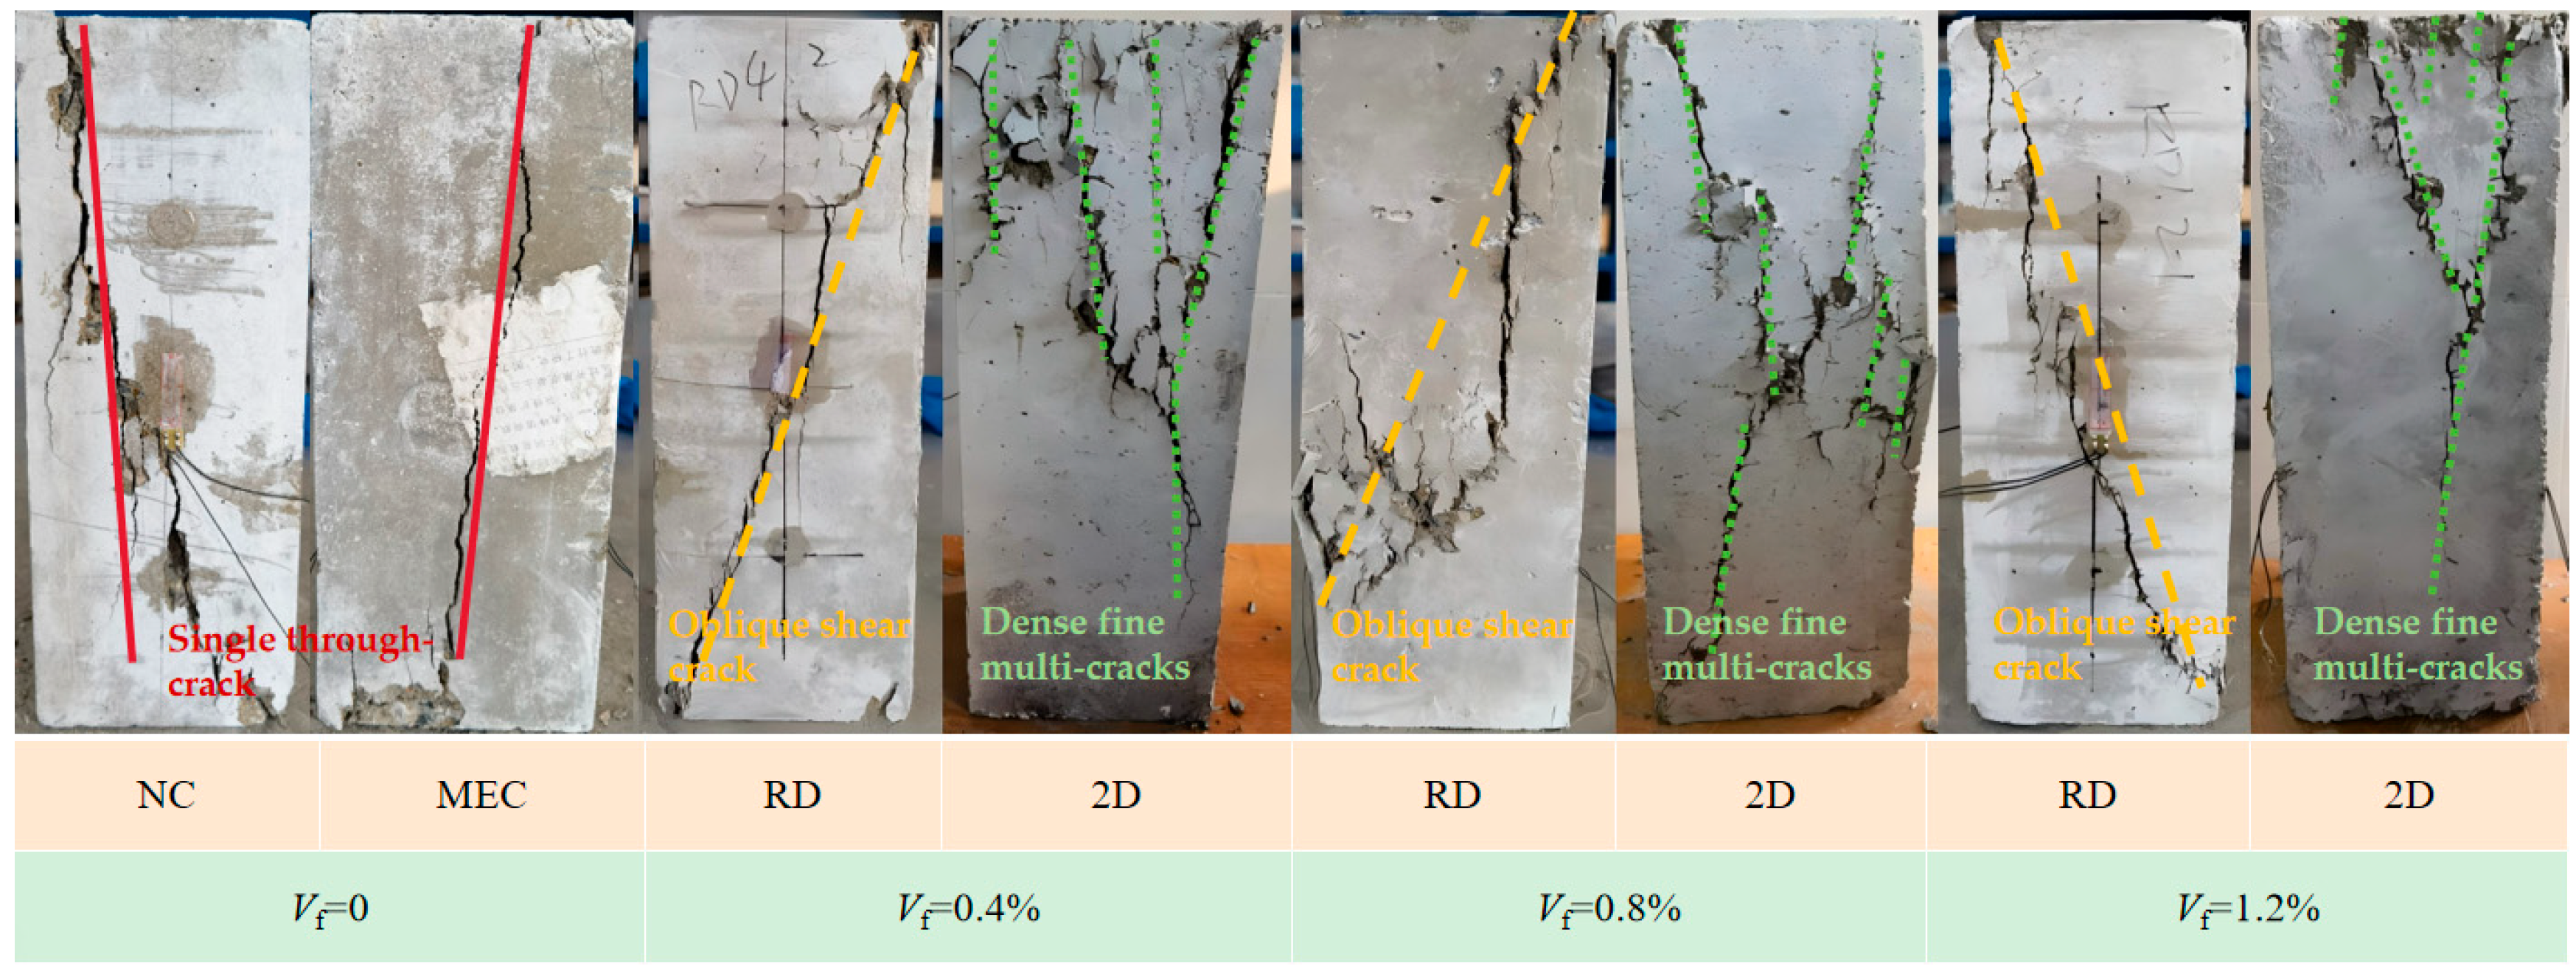
The compressive failure modes of the prisms are illustrated in Figure 9. The non-fiber reference groups (NC and MEC) exhibited a typical brittle failure mode, characterized by the sudden formation of a single dominant vertical through-crack that rapidly propagated from top to bottom, splitting the specimen into distinct pieces with minimal lateral deformation. In contrast, the RD groups displayed an oblique shear failure pattern, in which 2–3 macroscopic inclined cracks formed along the principal shear plane. Although the steel fibers bridged these cracks to maintain structural integrity, crack propagation remained concentrated along a narrow band. Notably, the 2D groups exhibited a distinct multi-crack ductile failure mode, characterized by the development of a dense network of fine, discontinuous micro-cracks distributed over a broad region of the specimen. Instead of coalescing into a single failure plane, these micro-cracks initiated at multiple locations and propagated slowly, reflecting the uniform lateral confinement provided by the two-dimensionally aligned fiber network. This transition from brittle splitting to multi-crack ductile failure is of practical significance, as it indicates enhanced energy dissipation capacity and structural integrity retention under compressive overload.

3.2. Fracture Test

3.2.1. Whole Process Curve of Crack Propagation

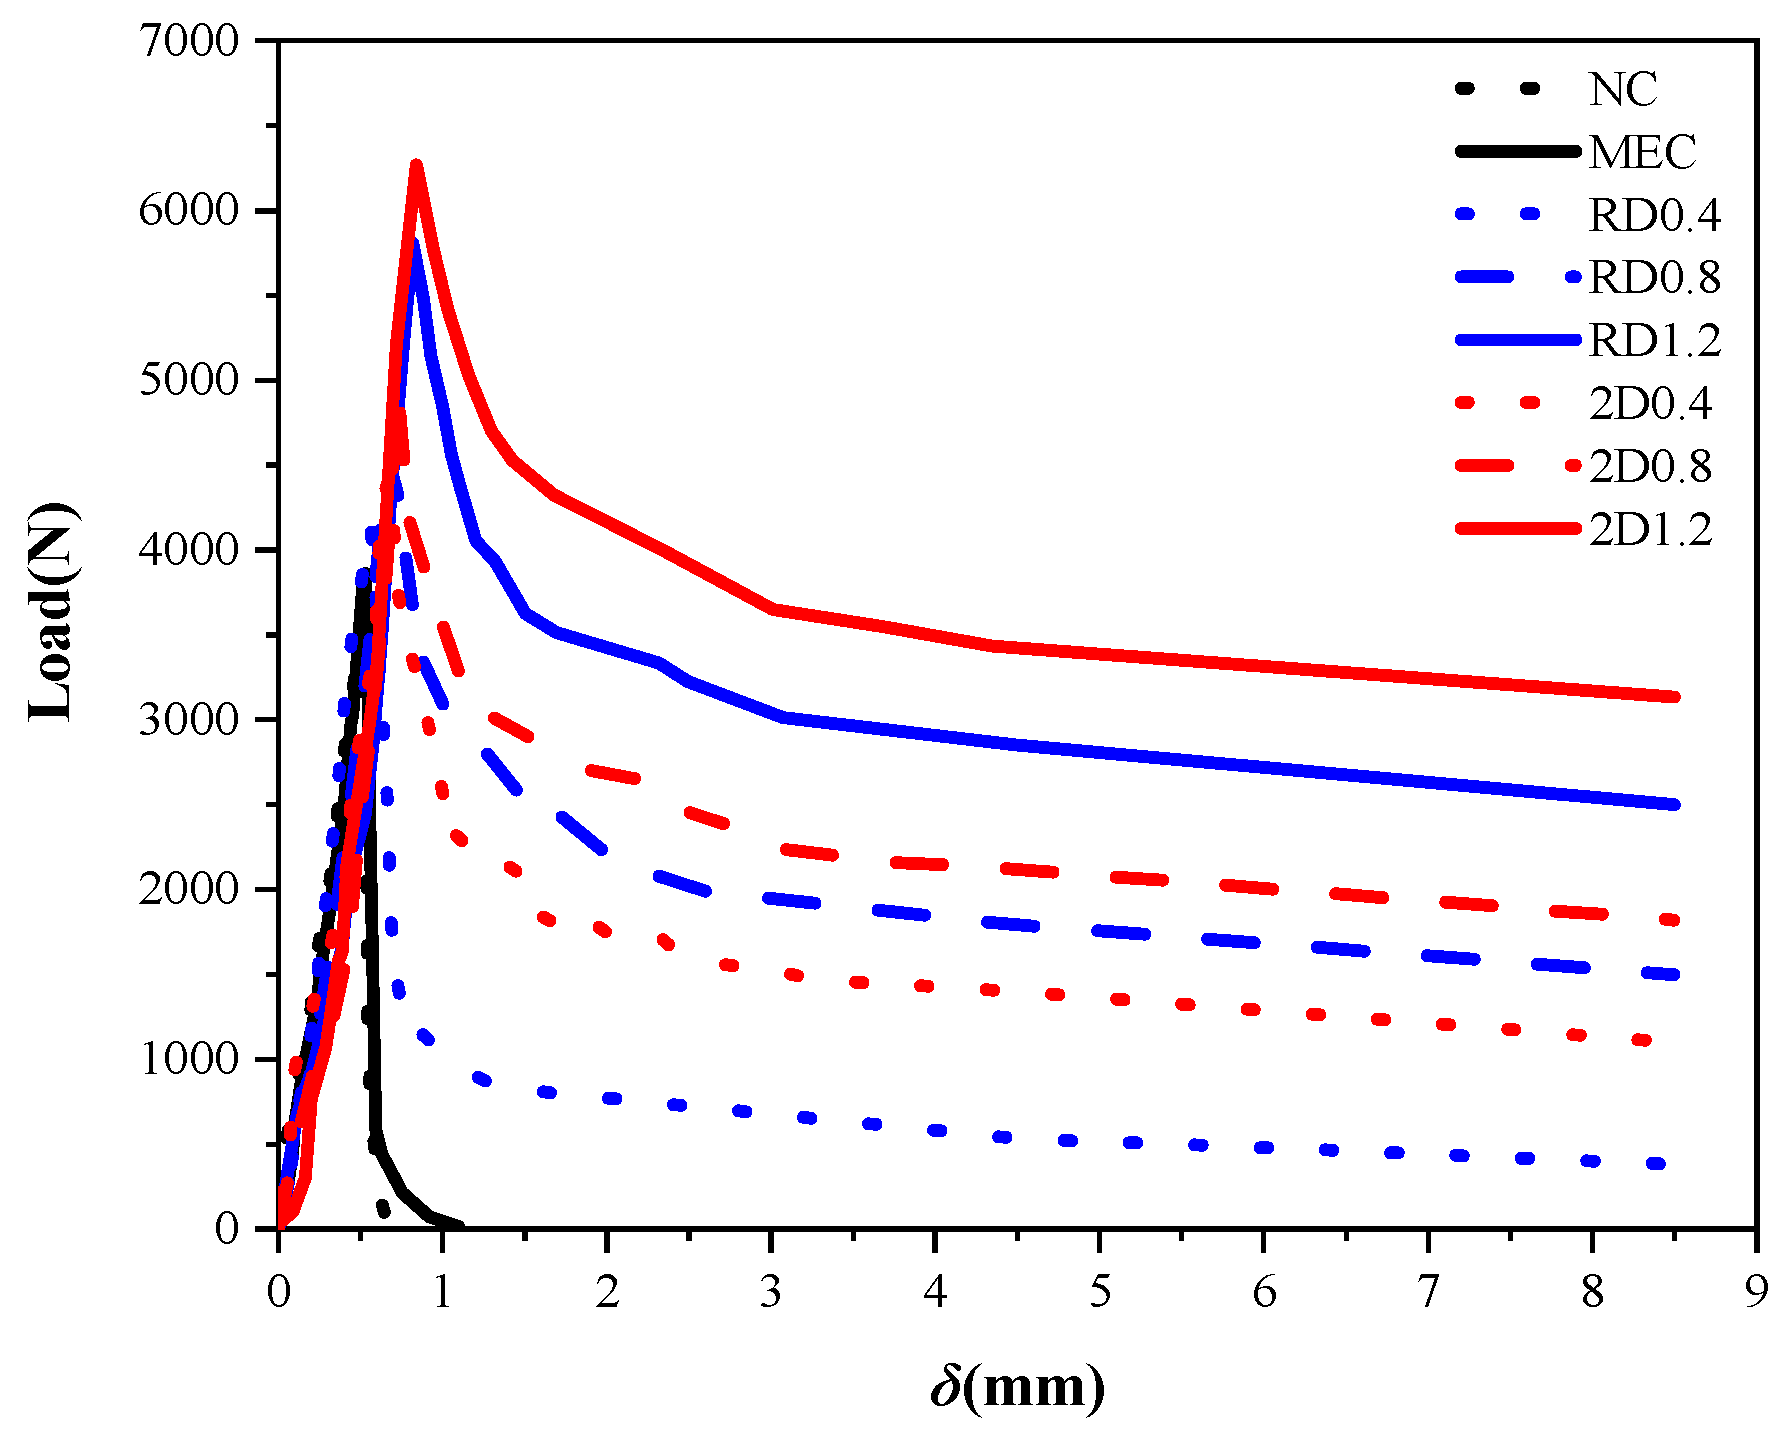
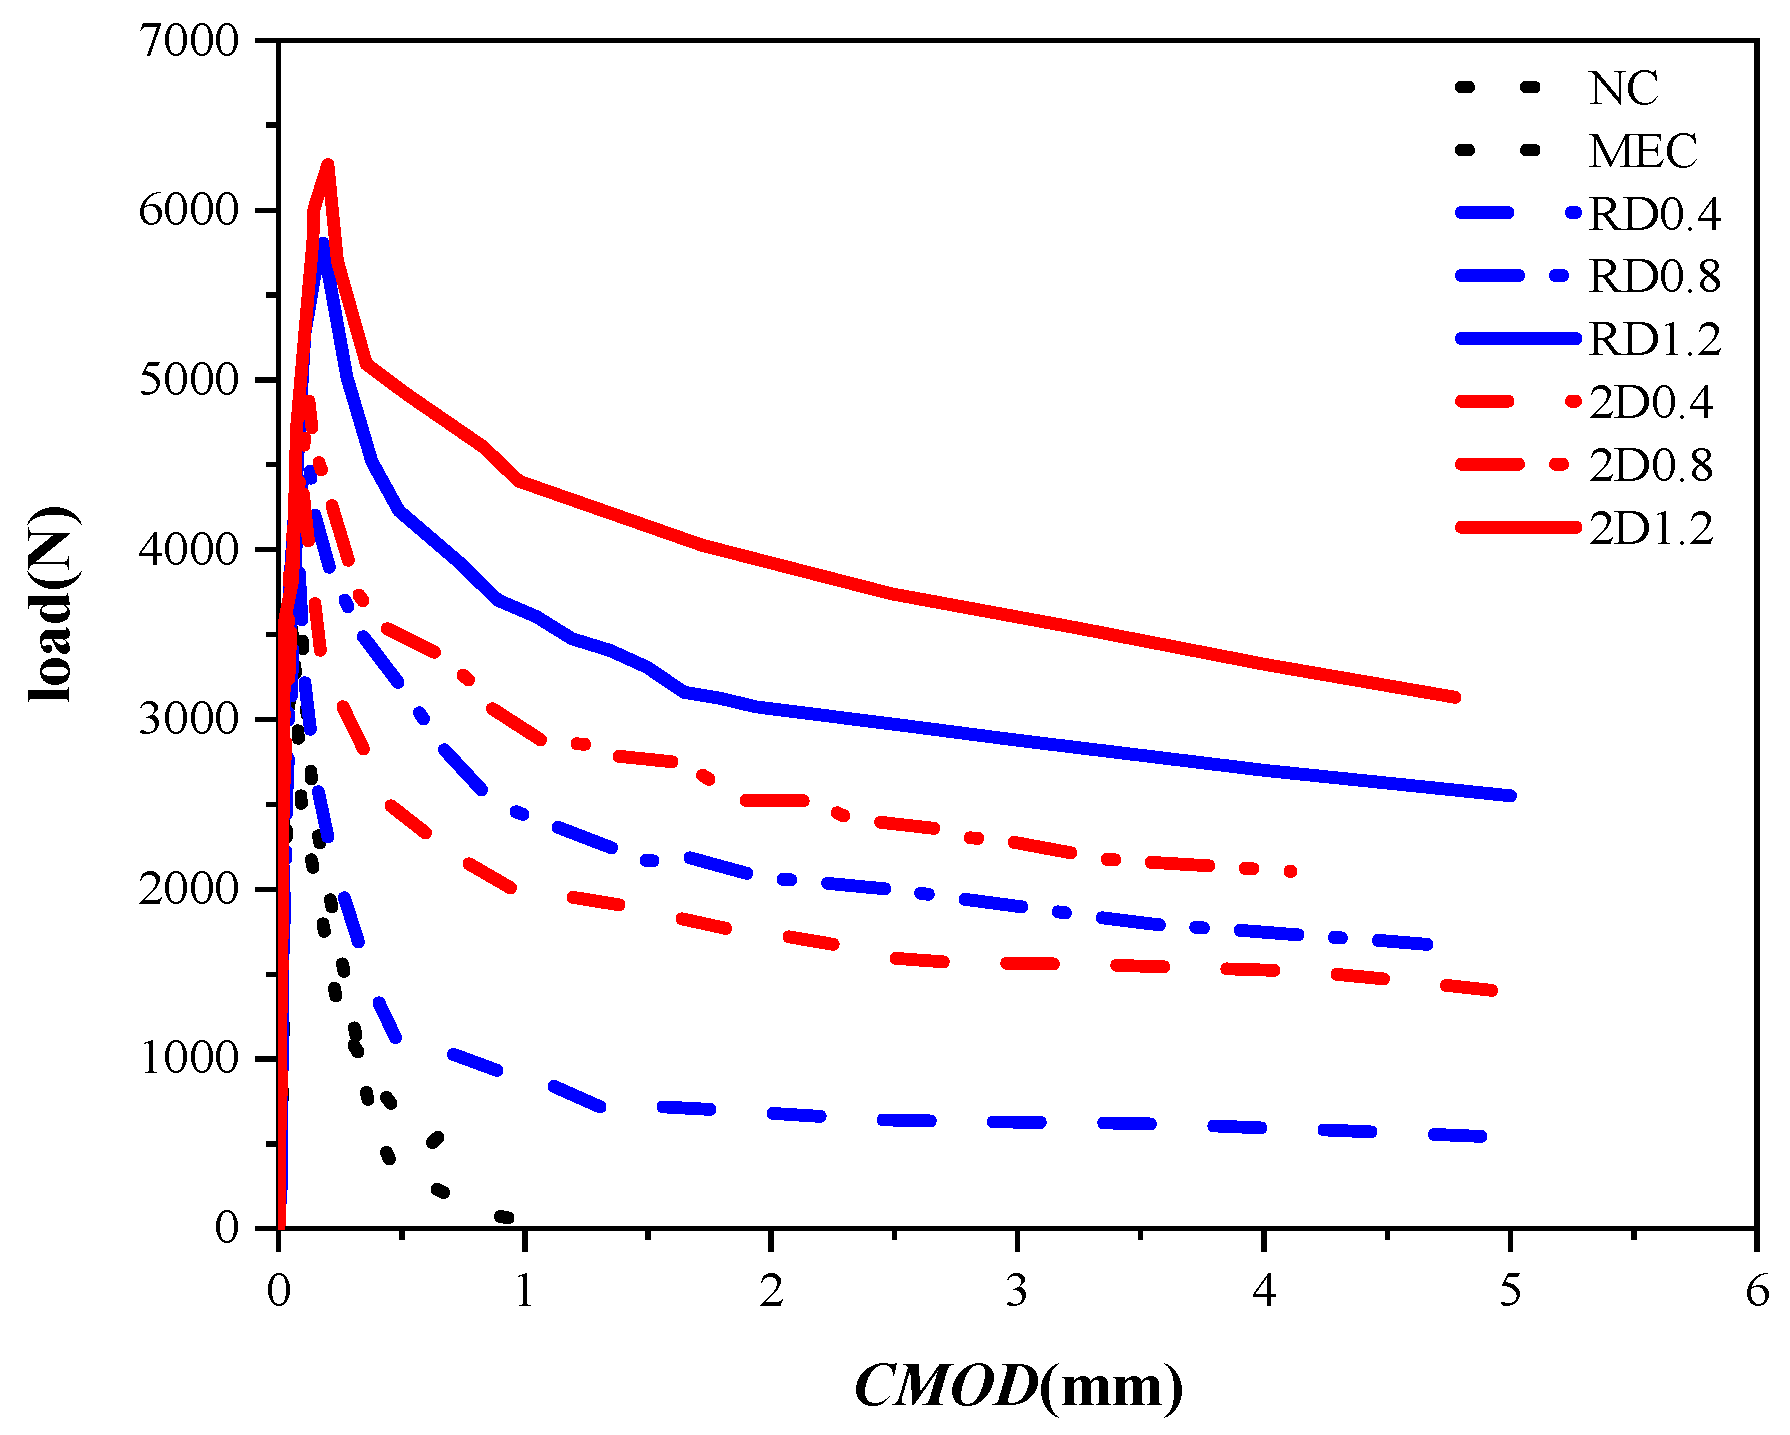
The load-deflection (P-δ) and load-crack mouth opening displacement (P-CMOD) curves obtained from the three-point bending fracture tests are presented in Figure 10 and Figure 11, respectively. The load responses exhibit remarkable differences among the groups, and the entire fracture process can be broadly divided into four distinct stages: linear elastic growth, elastoplastic development, unstable crack propagation, and post-peak instability failure.
During the linear elastic stage, the ascending slopes of all curves were nearly identical. Upon entering the elastoplastic stage, the non-fiber groups (NC and EC) rapidly deviate from linearity with a sharply decelerating load growth rate. In contrast, the nonlinear segments of the steel fiber-reinforced groups (RD and 2D) were prolonged. The 2D groups, in particular, sustain load increments at substantially higher displacements compared to the RD groups. After the peak load, the non-fiber groups exhibited a precipitous drop in load with virtually no residual bearing capacity, while the steel fiber groups displayed a much gentler descending branch and maintained a significant residual load. Under the same fiber content, the 2D specimens exhibited higher initial cracking loads (Pini), peak loads (Pmax), and post-peak residual loads. The peak load of the 2D0.4 group approached that of the RD0.8 group. Furthermore, the critical values of CMOD (CMODc) and mid-span deflection (δc) at peak load increased with increasing fiber content.

3.2.2. Initial Crack and Peak Load

The measured initial cracking load (Pini) and peak load (Pmax) for each group in the fracture tests are summarized in Table 3.
Compared to the NC group, the MEC group exhibits increases of 4.8% and 7.9% in Pini and Pmax, respectively. For both the RD and 2D groups, Pini and Pmax increased as the fiber volume fraction rose from 0.4% to 1.2%. At the same fiber contents, the 2D groups consistently outperformed the RD groups. The Pini and Pmax of the 2D1.2 group were 2.7% and 7.9% higher than those of the RD1.2 group, respectively.

3.2.3. Flexural Toughness

The flexural toughness of concrete was characterized by residual flexural strength (fR,i) and equivalent flexural strength (feq,i), which are two key indicators specified in the standard test method for fiber-reinforced concrete [27]. The calculation formulas of the two indicators are as follows:
f R , i = M R , j W R , i = 3 P R , i S 2 B b 0 2
f e q , 2 = 3 2 D B Z , 2 f 0.50 S B b 0 2 = 3 F 2 S 2 B b 0 2 ,   f e q , 3 = 3 2 D B Z 3 f 2.50 S B b 0 2 = 3 F 3 S 2 B b 0 2
where PR,i represents the residual load corresponding to the i-th specified deflection; S is the span length of the bending specimen; B and b0 are the width and height of the specimen’s cross-section, respectively; the equivalent loads F2 and F3 are the average forces corresponding to the regions D B Z , 2 f and D B Z , 3 f in the P-δ curve; D B Z , 2 f represents the energy absorption value contributed by steel fibers to the matrix concrete at the mid-span deflection δ2 (δ2 = δL + 0.65 mm); D B Z , 3 f represents the energy absorption value contributed by steel fibers to the matrix concrete at the mid-span deflection δ3 (δ3 = δL + 2.65 mm). The test results of fR,i and feq,i for all groups are summarized in Table 4 and Table 5, respectively. It is evident that the steel fiber content and distribution form exert an extremely significant regulatory effect on the flexural toughness of concrete [27]. Both fR,i and feq,i increased with increasing fiber content. Under the same fiber content, the 2D group exhibited substantially higher values than the RD group. The fR,1 (CMOD = 0.5 mm) of the 2D1.2 group was 18.5% higher than that of the RD1.2 group. The feq,2 of the 2D0.8 group was 9.8% higher than that of the RD0.8 group.

3.2.4. Fracture Toughness and Fracture Energy

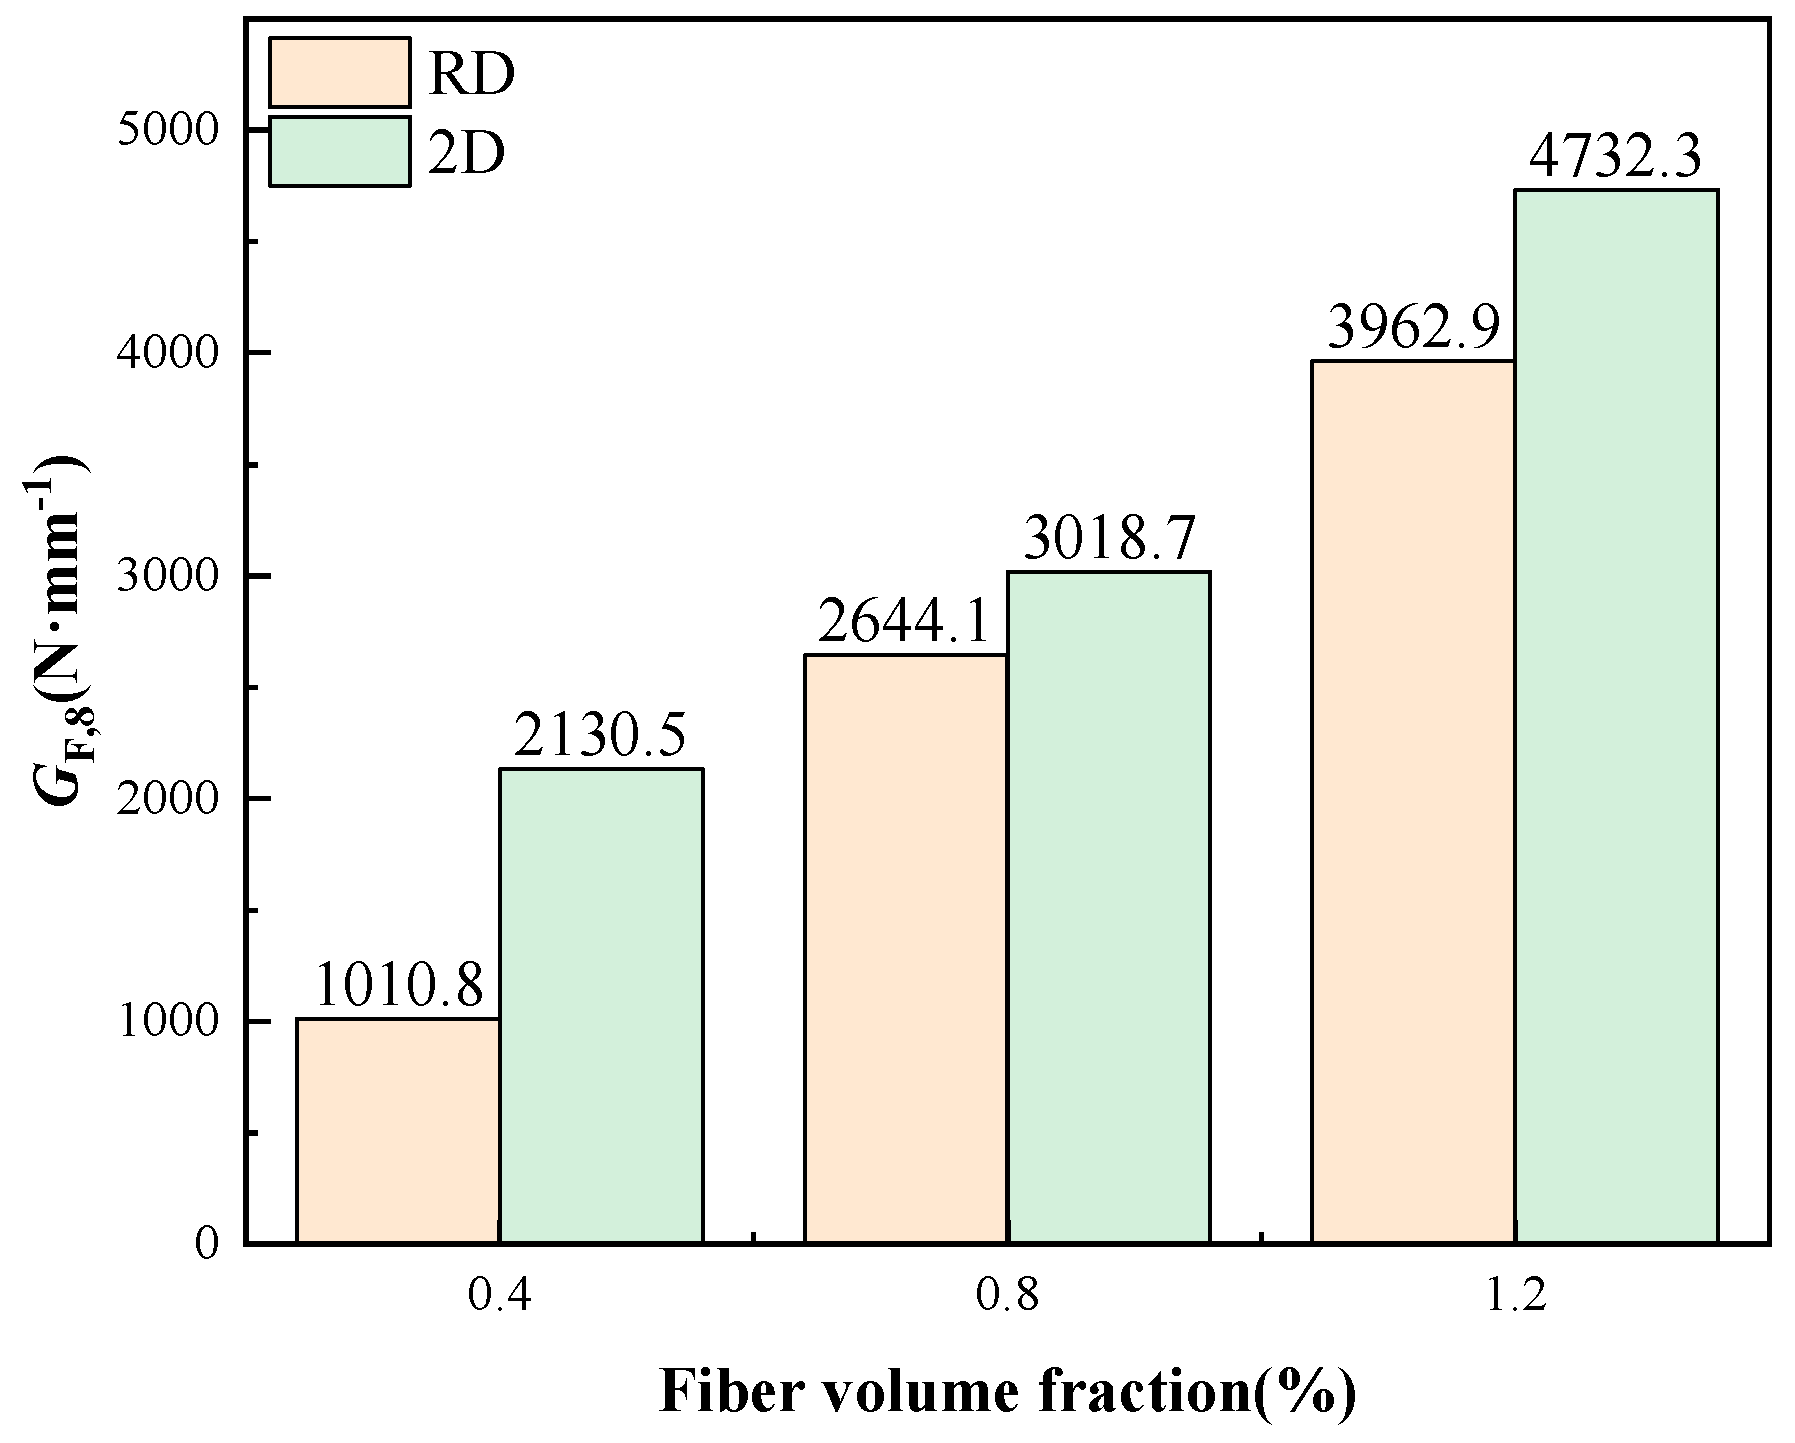
The double-K fracture model [28] was used to calculate the initial fracture toughness (Kini) and unstable fracture toughness (Kun), and the results are shown in Table 6. The fracture energy (GF) is illustrated in Figure 12.
According to the theory of linear elastic fracture mechanics, the stress intensity factor K can be determined by Equation (4) [29], the effective crack length a and the correlation coefficient f1 can be calculated by Equation (5) [30] and Equation (6) [29], respectively, where h0 represents the knife-edge thickness of the clip-on extensometer, the elastic modulus E can be obtained using Equations (7) and (8) [31]. The initial compliance Ci is derived from the elastic region of the ascending branch in the P-CMOD curve. By substituting Pini corresponding to the initial crack length a0, and Pmax corresponding to the critical effective crack length ac into Equation (4), the initial fracture toughness Kini and unstable fracture toughness Kun can be obtained, respectively.
K = 3 P S 2 B D 2 a f 1 β
a = 2 π D + h 0 arctan E × B × C M O D 32.6 P 0.1135 h 0
f 1 β = 1.99 β 1 β 2.15 3.93 β + 2.7 β 2 1 + 2 β 1 β 3 / 2 , β = a + h 0 D + h 0
E = 24 P × a 0 C M O D × B × D f α 0
f α 0 = 0.76 2.28 α 0 + 3.87 α 0 2 2.04 α 0 3 + 0.66 1 α 0 2 , α 0 = a 0 / D
The calculated Kini and Kun values are presented in Table 6. Both Kini and Kun increased with fiber content from 0.4% to 1.2%. The Kini and Kun of the 2D1.2 group were 2.7% and 36.6% higher than those of the RD1.2 group, respectively. The fracture energy (GF) is illustrated in Figure 12. Fracture energy increased with fiber content, and the 2D group exhibited higher energy absorption capacity at each fiber content. The fracture energy of the 2D1.2 group was 19.4% higher than that of the RD1.2 group.

3.3. Shrinkage Performance

3.3.1. Early-Age Drying Shrinkage

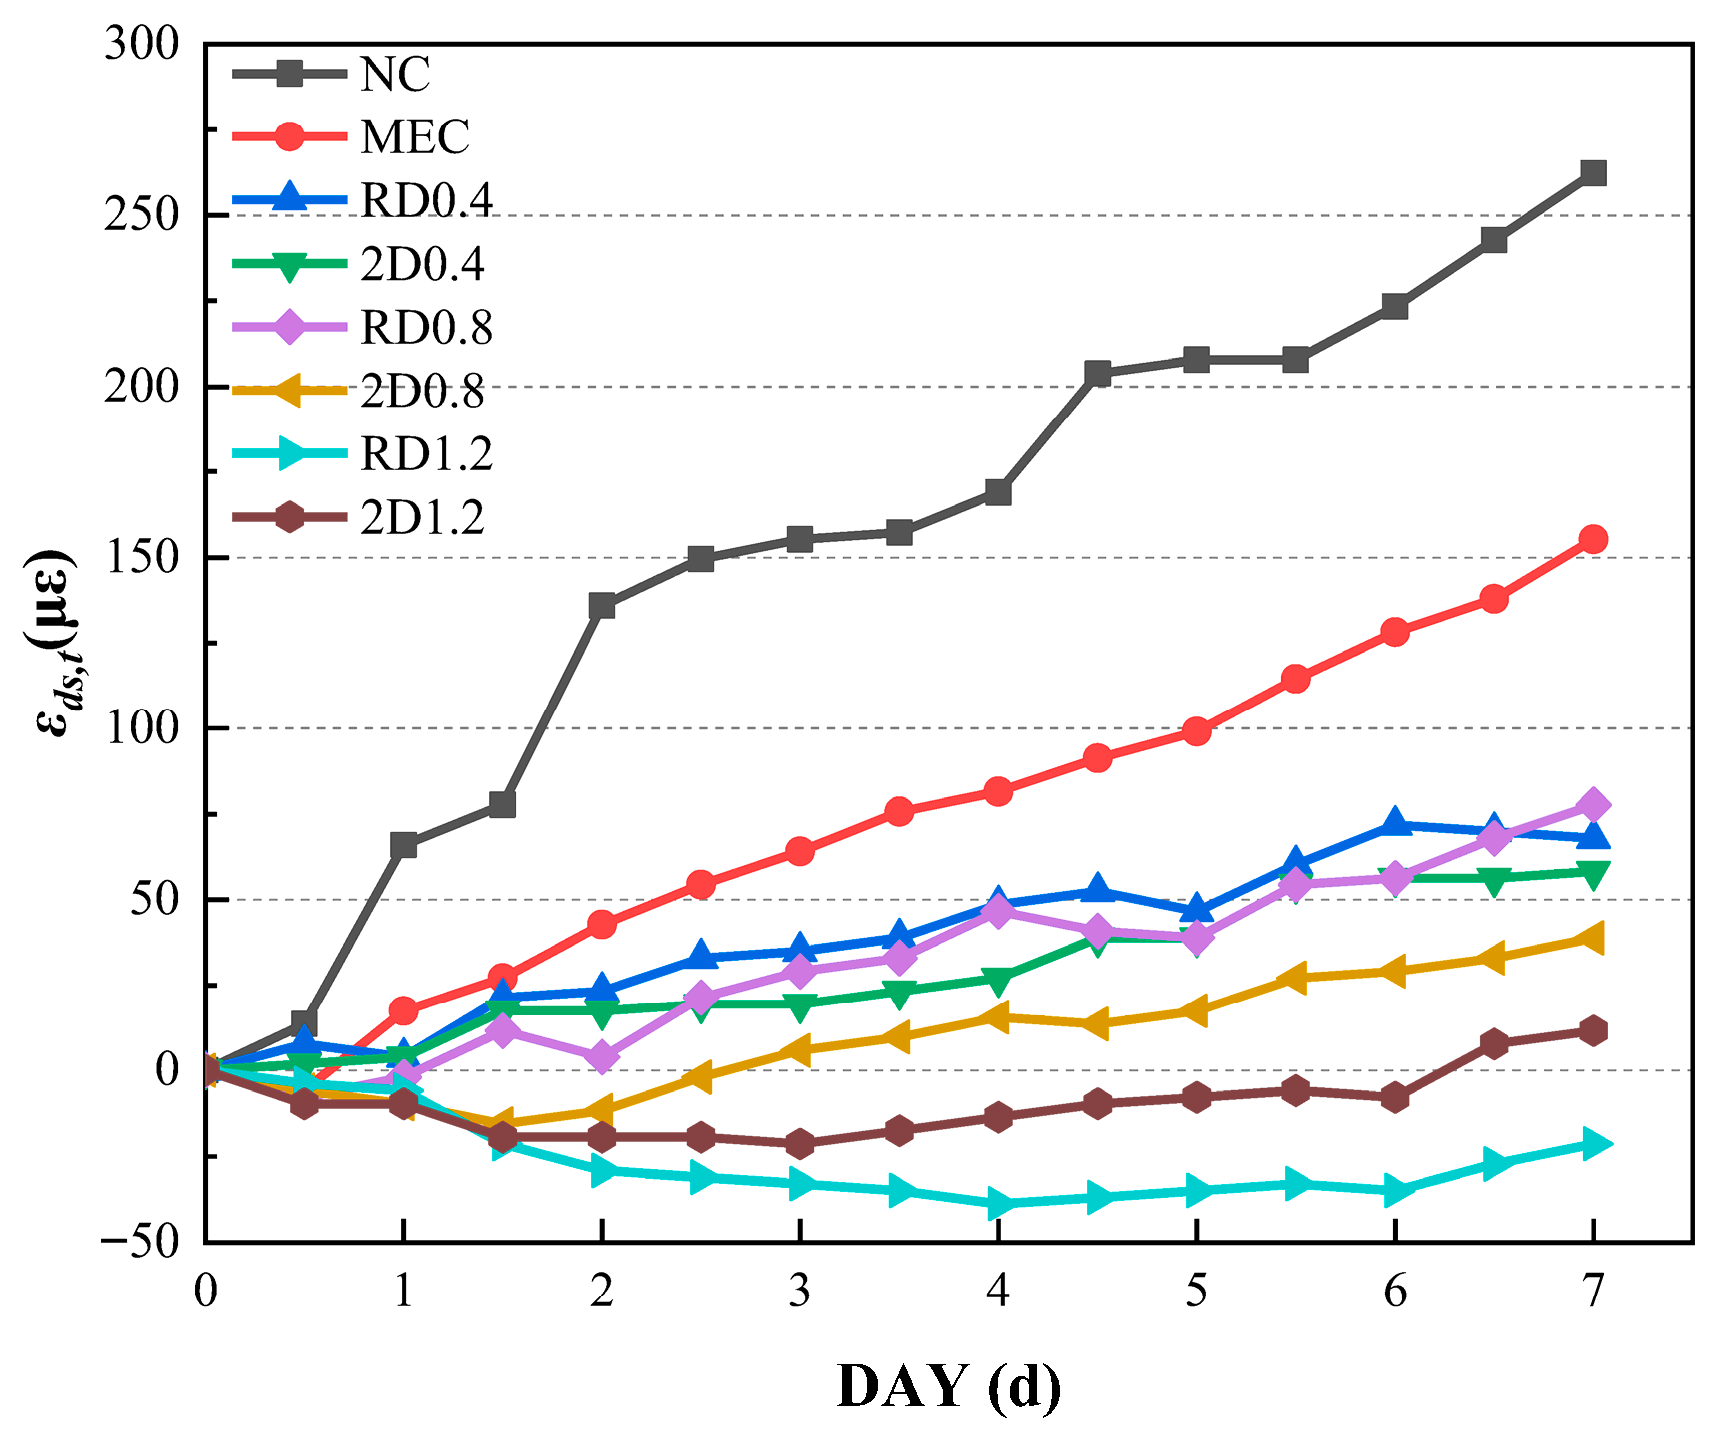
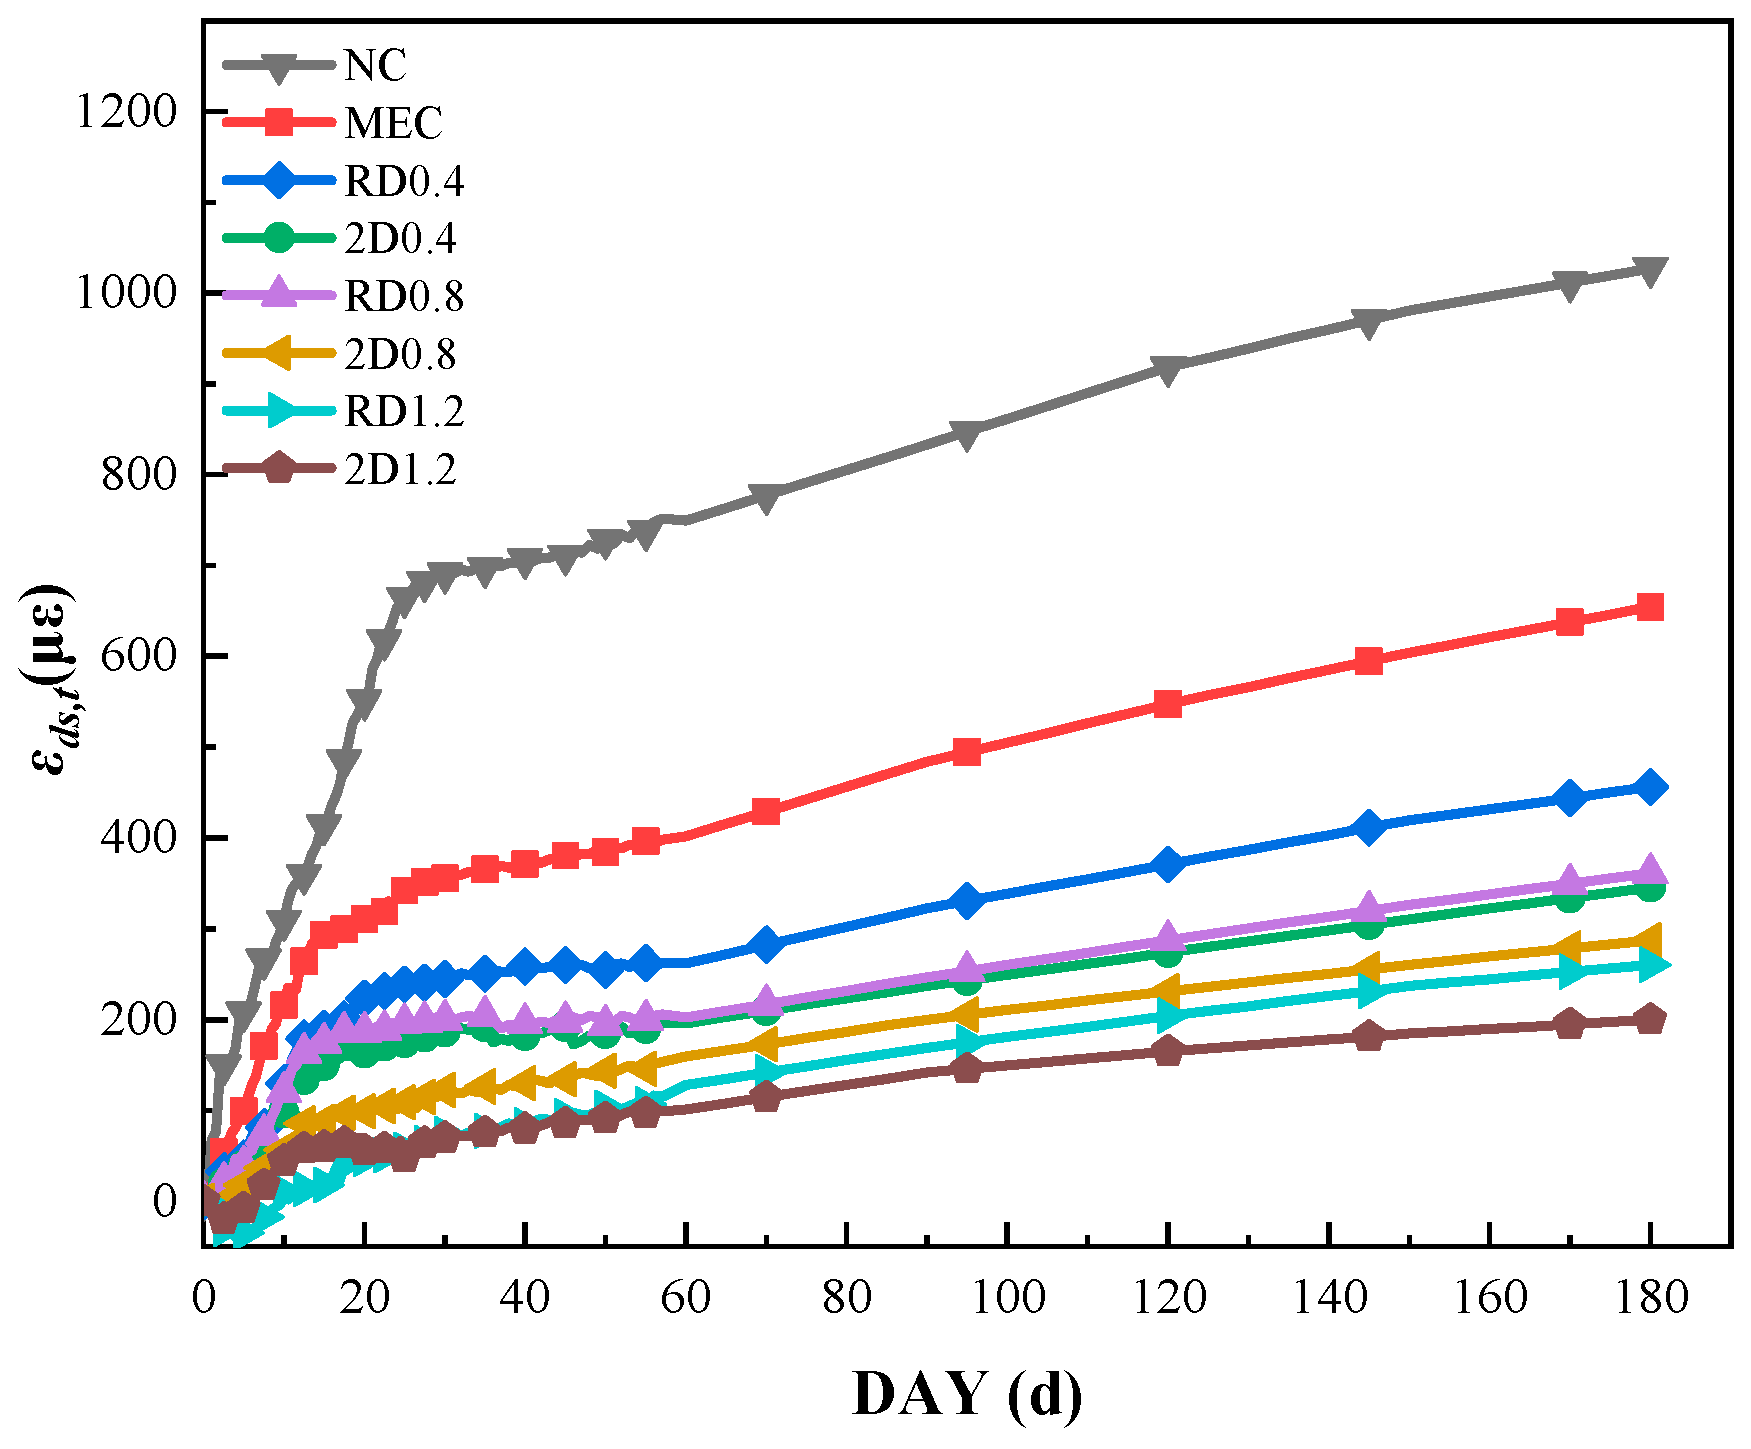
The variation in early-age (0–7 d) drying shrinkage strain is presented in Figure 13. The NC group exhibited a 7 d shrinkage strain of 262 με, whereas the MEC group exhibited a strain of 155 με (a 40.7% decrease). Between 1d and 5d, the RD1.2 and 2D1.2 groups, as well as the 2D0.8 group at very early ages, exhibited negative shrinkage strains (i.e., net volumetric expansion). At 7 d, the shrinkage strains of the 2D0.4, 2D0.8, and 2D1.2 groups were 14.3%, 50.0%, and lower (net expansion vs. low positive value) than their RD counterparts, respectively.

3.3.2. Long-Term Drying Shrinkage

The long-term drying shrinkage strains over a 180-day period are plotted in Figure 14. The shrinkage behavior of all groups exhibited a two-stage evolution: an initial rapid development (1–28 d) followed by gradual deceleration and eventual stabilization (28–180 d). The maximum 180d shrinkage strain was observed in the NC group (1027 με), whereas the MEC group registered a strain of 654 με, a reduction of 36.3%. The 2D1.2 group exhibited the lowest 180 d shrinkage strain of 200 με, corresponding to only 19.5% of that of the NC group and 30.6% of that of the MEC group. For the moderate dosages (0.4% and 0.8%), the 2D groups consistently exhibited lower shrinkage strains than their RD counterparts throughout the entire 180 d period. Specifically, the 180 d shrinkage strains of the 2D0.4 and 2D0.8 groups were 24.3% and 20.4% lower than those of the corresponding RD groups, respectively. At the high dosage of 1.2%, the shrinkage strain of the 2D1.2 group was 23.1% lower than that of the RD1.2 group at 180 d.

4. Discussion

4.1. Coupling Mechanism of Chemical Compensation and Physical Alignment

The improved compressive strength and volume stability of the 2D composite reflect two interacting mechanisms: chemical shrinkage compensation by the expansive agent and physical constraint from the in-plane aligned fiber network.
At the micromechanical level, the key lies in how the interfacial shear strength (τ) evolves within the fiber–matrix interfacial transition zone (ITZ). In normal concrete, early-age chemical shrinkage induces a radial tensile stress at the fiber periphery, weakening the initial bond and promoting interfacial micro-cracking. The expansive agent converts this tensile stress into a radial compressive pre-stress through the crystallization pressure generated by the formation of Ca(OH)2 and ettringite (AFt). The hydration products of the expansive agent actively compensate for early-age shrinkage deformation and optimize the overall compactness of the matrix [32]. According to the Coulomb friction model (τ = μ·σn), this radial pre-stress elevates the fiber pull-out resistance by a factor proportional to the expansion strain. Consequently, the enhanced interfacial confinement minimizes initial interfacial defects [33] and ensures that the strength advantage of the 2D configuration (e.g., the 14.2% higher compressive strength of 2D1.2 over RD1.2 at 28d) is sustained rather than degraded by interfacial micro-cracking. This coupling enables the mechanical confinement of the steel fibers to be fully utilized, leading to consistent compressive strength development throughout the curing process.
The expansive agent works in stages: early hydration of CaO offsets plastic and chemical shrinkage, while prolonged AFt crystallization counteracts drying shrinkage over the long term. The 2D fiber network amplifies this chemical compensation by providing continuous in-plane restraint. Acting as internal “stirrups”, the aligned fibers resist the lateral Poisson expansion of the matrix [16]. In the first few days of curing, the stiff fiber network restrains the matrix from expanding freely, so part of the chemical expansion energy is stored as internal compressive pre-stress. When the specimens are later exposed to drying, this stored pre-stress is released gradually. The result, visible in Figure 13, is a net expansion (negative strain) in the high-fiber-content groups during the first 1–5 d. We term this the “delayed expansive energy release” mechanism. It appears specific to the 2D configuration and plays a central role in the long-term volume stability of the composite.

4.2. Micromechanical Origin of Enhanced Fracture Energy in 2D Alignment

The more gradual post-peak softening and larger critical displacement seen in the 2D groups reflect the higher fiber orientation effective factor (ηθ) that the two-dimensional alignment produces. This factor captures how efficiently fibers bridge cracks, based on the angle between each fiber axis and the fracture plane normal: the larger ηθ is, the greater the proportion of fibers that are well-oriented to resist crack opening [34]. According to previous experimental statistics on identical matrix mixtures, the average ηθ of 2D aligned specimens is approximately 0.65, whereas that of RD specimens is only 0.58 [34]. This represents a relative increase of approximately 12% in fiber bridging efficiency.
Beyond orientation, the 2D alignment also increases the total count of fibers crossing the fracture plane. Earlier work on the same matrix [34] found 14–28% more fibers on the fracture surfaces of 2D specimens than on those of RD specimens at equal fiber volume fractions. Together, a higher fiber count and a higher orientation factor mean more effective bridging fibers per unit crack area. In the post-peak stage, therefore, the 2D composite activates a denser, better-oriented fiber network that sustains higher residual loads and delays the final drop in capacity. Because the slope of the descending branch determines fracture energy, and the residual load at a given deflection defines residual flexural strength, the shift from a 3D isotropic fiber distribution to a 2D in-plane random one translates directly into the 19.4–110% higher fracture energy measured for the 2D specimens.

4.3. Comparative Analysis with Existing Studies

The gains from 2D alignment in this study match or exceed those reported for comparable fiber-reinforced systems. Specifically, the 19.4–110% increase in fracture energy (GF) for our concrete with coarse aggregate is considerably larger than the 24–53% improvement in flexural toughness measured on 2D-SFRC without coarse aggregate [18,34]. A likely reason is that the larger aggregates create a more tortuous crack path, forcing cracks to intersect and activate more of the aligned fibers within the fracture process zone. Yu et al. [18] showed through mesoscale simulations that fiber angles in 2D-SFRC fall mainly between 0° and 30°, and that a perfectly planar alignment (0° to the slab normal) would raise the flexural performance further still. Since the fibers in this study were aligned by the same rotating-field technique, there is room to further optimize the process and extract additional mechanical performance.
On the shrinkage side, the 2D1.2 group reached only 200 με at 180 d, an 80.5% drop from the 1027 με recorded for NC. By comparison, expansive agents alone typically reduce shrinkage by 40–60% [5,6]; the much larger reduction seen here points to the extra restraint that the 2D fiber network supplies. The delayed release of expansive energy observed in the first 1–5 d (Figure 13) has not, to our knowledge, been documented for RD, and may represent a distinct advantage of the 2D configuration for applications where volume stability is critical.

4.4. Recommended Fiber Dosage for Engineering Applications

The choice of fiber volume fraction involves a trade-off among mechanical performance, shrinkage control, and material cost. At 0.4%, the 2D0.4 group achieved notable gains over the RD0.4 group—8.1% higher compressive strength at 28 d and 24.3% less 180 d shrinkage. However, its fracture energy (2130.5 N·mm−1) remained below that of the RD0.8 group (2644.1 N·mm−1), indicating that the fiber content was still too low to fully exploit the bridging capacity of the 2D network under flexural loading. At 1.2%, the 2D1.2 group delivered the highest compressive strength (14.2% above RD1.2), the largest fracture energy, and the lowest 180 d shrinkage (200 με). Yet the incremental benefit over the 0.8% dosage was modest in several respects: the gain in compressive strength relative to RD was 14.2% at 1.2% vs. 9.0% at 0.8%, and the 180 d shrinkage advantage over RD narrowed from 20.4% at 0.8% to 23.1% at 1.2%. With fiber cost roughly proportional to volume fraction, moving from 0.8% to 1.2% increases the steel fiber expenditure by 50%, while the additional performance gains taper off.
At 0.8%, the 2D0.8 group achieved a 9.0% higher compressive strength and 50.0% lower 7 d shrinkage strain than the RD0.8 group, while its fracture energy surpassed that of the RD1.2 group. This dosage, therefore, captures most of the benefits of 2D alignment while keeping the fiber cost within a practical range. For planar structural applications such as bridge decks and pavements, where multi-directional cracking resistance, long-term dimensional stability, and economic feasibility must all be satisfied, a 2D aligned steel fiber volume fraction of 0.8% is recommended.

5. Conclusions

In this study, the mechanical and shrinkage properties of two-dimensional aligned steel fiber-reinforced micro-expansive concrete (2D) were systematically investigated. Based on mechanical tests and long-term shrinkage monitoring, the following main conclusions can be drawn:
(1)
The combination of the expansive agent and steel fibers enhances the compressive performance of the concrete, exhibiting a pronounced “age-amplification effect” as curing progresses. The fiber 2D aligned distribution consistently outperforms the fiber random distribution (RD). By acting as continuous internal “stirrups,” the 2D aligned fibers highly restrict the lateral Poisson’s expansion of the matrix. Consequently, the 28-day uniaxial compressive strength of the 2D groups is up to 11.8% higher than that of their RD counterparts under identical fiber contents.
(2)
The 2D alignment technology drastically improves the fracture toughness and flexural ductility of the composite. The 2D0.4 group achieves an equivalent peak load and fracture energy to the RD0.8 group, demonstrating that 2D alignment can save approximately 50% of the steel fiber dosage without compromising the material’s toughness.
(3)
The 2D composite exhibits exceptional volume stability. The highly rigid 2D fiber network restrains the early-age chemical expansion of the matrix, converting it into internal pre-stress and inducing a unique “delayed expansive energy release” mechanism (macroscopically observed as net expansion between 1 and 5 days). Ultimately, the 2D1.2 group reduces the 180-day drying shrinkage to a mere 200 με, representing an 80.5% reduction compared to the baseline normal concrete (NC).
(4)
The superior comprehensive performance of the composite is fundamentally governed by a coupling mechanism: chemical shrinkage compensation (via the expansive agent) and physical alignment constraint (via 2D aligned fibers). Considering the balance among crack resistance, mechanical enhancement, and economic feasibility, a two-dimensional aligned steel fiber volume fraction of 0.8% is recommended as the optimal dosage for planar structural applications (e.g., bridge decks and pavements).

Author Contributions

L.Q.: Supervision, funding acquisition, conceptualization, resources. J.M.: Formal analysis, writing—original draft, Q.G.: Investigation, software. M.B.: Validation, writing—review and editing, methodology. All authors have read and agreed to the published version of the manuscript.

Funding

This research was funded by the National Science Fund for Distinguished Young Scholars grant number 52425803 and Nature Science Foundation of Hebei Province grant number E2023202268. And the APC was funded by Nature Science Foundation of Hebei Province.

Data Availability Statement

Data will be made available on request.

Conflicts of Interest

The authors declare that they have no known competing financial interests or personal relationships that could have appeared to influence the work reported in this paper.

References

  1. Afsoosbiria, H.; Machowska, A. Development of sustainable concrete using by-products as a green material, and potential solutions for sustainability in mass concrete construction—Comprehensive review. Sustainability 2025, 17, 9983. [Google Scholar] [CrossRef] [Scilit]
  2. Kurup, D.S.; Mohan, M.K.; Van Tittelboom, K.; De Schutter, G.; Santhanam, M.; Rahul, A. Early-age shrinkage assessment of cementitious materials: A critical review. Cem. Concr. Compos. 2024, 145, 105343. [Google Scholar] [CrossRef] [Scilit]
  3. Calvo, J.G.; Revuelta, D.; Carballosa, P.; Gutiérrez, J. Comparison between the performance of expansive SCC and expansive conventional concretes in different expansion and curing conditions. Constr. Build. Mater. 2017, 136, 277–285. [Google Scholar] [CrossRef] [Scilit]
  4. Liu, F.; Shen, S.-L.; Hou, D.-W.; Arulrajah, A.; Horpibulsuk, S. Enhancing behavior of large volume underground concrete structure using expansive agents. Constr. Build. Mater. 2016, 114, 49–55. [Google Scholar] [CrossRef] [Scilit]
  5. Li, B.; Zhang, L.; Shen, Y.; Zhang, G.; Wang, C.; Li, Z.; Gao, C. Syneristic effects of polypropylene fiber and expansive agent on early age volume stability of concrete. J. Build. Eng. 2024, 95, 110056. [Google Scholar] [CrossRef] [Scilit]
  6. Li, C.; Shang, P.; Li, F.; Feng, M.; Zhao, S. Shrinkage and mechanical properties of self-compacting SFRC with calcium-sulfoaluminate expansive agent. Materials 2020, 13, 588. [Google Scholar] [CrossRef] [Scilit]
  7. Zeng, W.; Ding, Y.; Zhang, Y.; Dehn, F. Effect of steel fiber on the crack permeability evolution and crack surface topography of concrete subjected to freeze-thaw damage. Cem. Concr. Res. 2020, 138, 106230. [Google Scholar] [CrossRef] [Scilit]
  8. Tiberti, G.; Minelli, F.; Plizzari, G.A.; Vecchio, F.J. Influence of concrete strength on crack development in SFRC members. Cem. Concr. Compos. 2014, 45, 176–185. [Google Scholar] [CrossRef] [Scilit]
  9. Wang, S.; Jiang, Z.; Fang, Z.; Chen, H.; Yang, S. Improved fiber orientation method and pure mode-i fracture performance of ultra-high performance concrete with aligned fibers. Cem. Concr. Res. 2026, 203, 108186. [Google Scholar] [CrossRef] [Scilit]
  10. Du, J.; Zhang, F.; Xiao, H.; Poh, L.H. Influence of matrix strengthening, interface enhancement and fiber orientation on the flexural behavior and damage evolution of UHPC. Cem. Concr. Compos. 2026, 168, 106494. [Google Scholar] [CrossRef] [Scilit]
  11. Mu, R.; Li, H.; Qing, L.; Lin, J.; Zhao, Q. Aligning steel fibers in cement mortar using electro-magnetic field. Constr. Build. Mater. 2017, 131, 309–316. [Google Scholar] [CrossRef] [Scilit]
  12. Song, Q.; Yu, R.; Shui, Z.; Wang, X.; Rao, S.; Lin, Z.; Wang, Z. Key parameters in optimizing fibres orientation and distribution for ultra-high performance fibre reinforced concrete (UHPFRC). Constr. Build. Mater. 2018, 188, 17–27. [Google Scholar] [CrossRef] [Scilit]
  13. Huang, H.; Gao, X.; Li, L.; Wang, H. Improvement effect of steel fiber orientation control on mechanical performance of UHPC. Constr. Build. Mater. 2018, 188, 709–721. [Google Scholar] [CrossRef] [Scilit]
  14. Wang, X.; Xu, B.; Mu, R.; Qing, L.; Liu, Y.; Chen, X.; Chen, J.; Lei, Z. Flexural properties of a 2d-distributed steel fiber reinforced cement-based composite two-way slab. J. Build. Eng. 2023, 73, 106792. [Google Scholar] [CrossRef] [Scilit]
  15. Mu, R.; Cheng, Q.; Zhao, Q.; Wang, X.; Liu, Y.; Qing, L.; Chen, J. Dynamic compressive properties of 2d-aligned steel fiber reinforced cement-based composites. Constr. Build. Mater. 2024, 425, 135893. [Google Scholar] [CrossRef] [Scilit]
  16. Bi, M.; Qing, L.; Mu, R.; Li, M. Compression behavior of 1d and 2d aligned steel fiber reinforced cement-based composites. Compos. Struct. 2025, 371, 119510. [Google Scholar] [CrossRef] [Scilit]
  17. Mu, R.; Mei, S.; Chen, J.; Wang, X.; Liu, N.; Chen, X.; Qing, L.; Shi, Y. Effect of steel fiber orientation on punching shear resistance of steel fiber reinforced cementitious composites round slabs. J. Build. Eng. 2024, 89, 109289. [Google Scholar] [CrossRef] [Scilit]
  18. Yu, K.; Hu, Y.; Mu, R.; Xing, P.; Zhao, N.; Qing, L. The effects of the 2d aligned fibers on the fracture properties of steel fiber reinforced cementitious composite slab: Simulation and experimental validation. Eng. Struct. 2025, 335, 120305. [Google Scholar] [CrossRef] [Scilit]
  19. Abbas, M.A.; Ran, X.; Musleh, A.A.; Li, P. Synergistic effect of expansive agent and steel fiber on interfacial performance and axial compression behavior of UHPC-filled steel tube columns. Constr. Build. Mater. 2025, 470, 140543. [Google Scholar] [CrossRef] [Scilit]
  20. Chen, H.; Zhang, G.; Ding, Q.; Yang, J.; Zhu, J.; Qi, D. Effect of expansive agent on lightweight micro-expansive ultra-high performance concrete: Properties, microstructure, and interfacial bonding in concrete-filled steel tube. Constr. Build. Mater. 2025, 462, 139996. [Google Scholar] [CrossRef] [Scilit]
  21. Zhang, Y.; Feng, H.; Shah, S.Y.; Xin, H. Effect of shrinkage-mitigating additive and curing condition on flexural and fracture behavior of ultra-high-performance concrete (UHPC) unnotched beam. Constr. Build. Mater. 2024, 445, 137890. [Google Scholar] [CrossRef] [Scilit]
  22. GB/T 50081-2019; Standard for Test Methods of Mechanical Properties of Ordinary Concrete. China Building Industry Press: Beijing, China, 2019.
  23. RILEM TC 162-TDF: Test and design methods for steel fibre reinforced concrete; bending test. Mater. Struct. 2002, 35, 579–582. [CrossRef] [Scilit]
  24. JG/T 472-2015; Steel Fiber Reinforced Concrete. China Standards Press: Beijing, China, 2015.
  25. Ran, J.; Li, T.; Chen, D.; Shang, L.; Li, W.; Zhu, Q. Mechanical properties of concrete reinforced with corrugated steel fiber under uniaxial compression and tension. Structures 2021, 34, 1890–1902. [Google Scholar] [CrossRef] [Scilit]
  26. Zheng, J.; Qi, L.; Zheng, Y.; Zheng, L. Mechanical properties and compressive constitutive model of steel fiber-reinforced geopolymer concrete. J. Build. Eng. 2023, 80, 108161. [Google Scholar] [CrossRef] [Scilit]
  27. Khan, S.; Qing, L.; Ahmad, I.; Mu, R.; Bi, M. Investigation on fracture behavior of cementitious composites reinforced with aligned hooked-end steel fibers. Materials 2022, 15, 542. [Google Scholar] [CrossRef] [Scilit] [PubMed]
  28. Yin, X.; Li, Q.; Wang, Q.; Reinhardt, H.-W.; Xu, S. The double-k fracture model: A state-of-the-art review. Eng. Fract. Mech. 2023, 277, 108988. [Google Scholar] [CrossRef] [Scilit]
  29. Tada, H.; Paris, P.C.; Irwin, G.R. The Stress Analysis of Cracks Handbook; Del Research Corporation: Hellertown, PA, USA, 1973. [Google Scholar]
  30. Xu, S.; Reinhardt, H.W. A simplified method for determining double-k fracture parameters for three-point bending tests. Int. J. Fract. 2000, 104, 181–209. [Google Scholar] [CrossRef] [Scilit]
  31. Shah, S.P. Determination of fracture parameters (KSIC and CTODc) of plain concrete using three-point bend tests. Mater. Struct. 1990, 23, 457–460. [Google Scholar] [CrossRef] [Scilit]
  32. Wei, F.; Zhang, F.; Gao, L.; Wang, R.; Ren, X.; Zhang, D. Mechanical properties and micromorphology of calcium oxide expansion agent on river sand/machine-made sand concrete. Adv. Civ. Eng. 2022, 2022, 9407640. [Google Scholar] [CrossRef] [Scilit]
  33. Aghaee, K.; Han, T.; Kumar, A.; Khayat, K.H. Mechanism underlying effect of expansive agent and shrinkage reducing admixture on mechanical properties and fiber-matrix bonding of fiber-reinforced mortar. Cem. Concr. Res. 2023, 172, 107247. [Google Scholar] [CrossRef] [Scilit]
  34. Qing, L.B.; Bi, M.D.; Mu, R.; Xing, P. Preparation and mechanical properties of 2D-aligned steel fiber reinforced concrete. J. Chin. Ceram. Soc. 2023, 51, 1210–1218. (In Chinese) [Google Scholar]
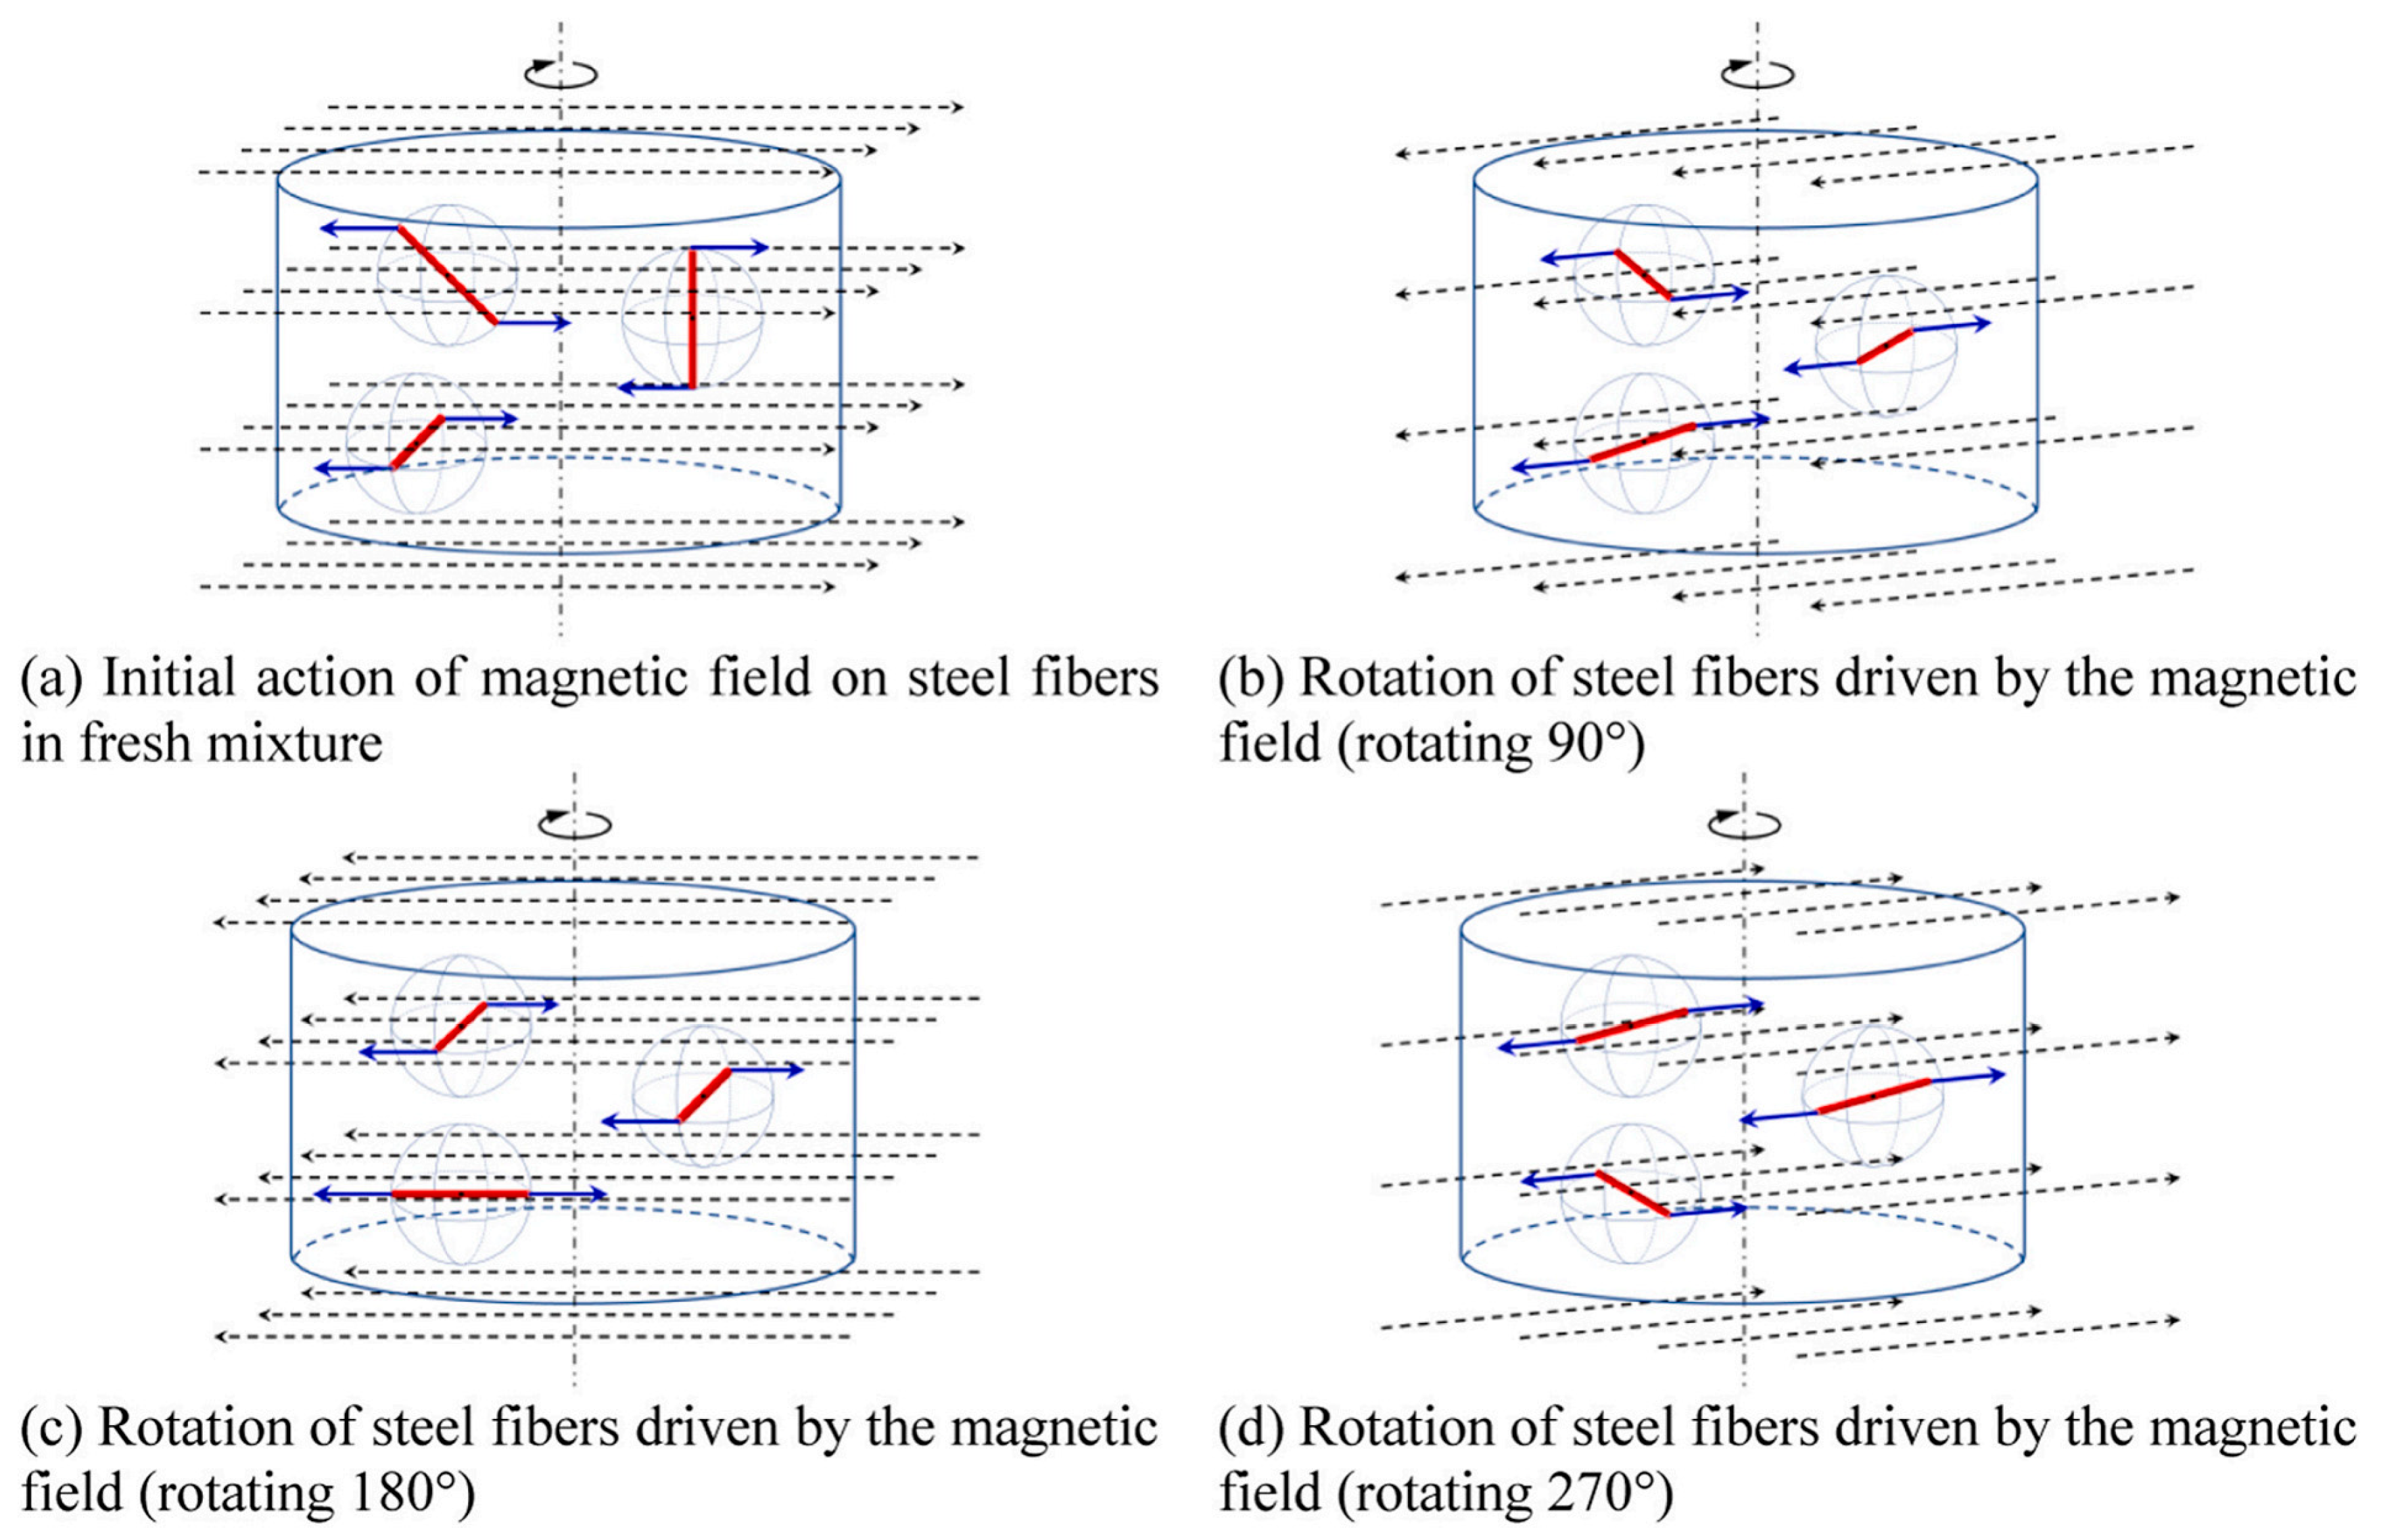
Figure 1. A schematic diagram of steel fibers rotating in a rotating magnetic field [15].
Jcs 10 00271 g001
Figure 2. The fiber distribution types of RD and 2D specimens [16].
Jcs 10 00271 g002
Figure 3. The loading diagram of the prism uniaxial compression test.
Jcs 10 00271 g003
Figure 4. The loading diagram of the three-point bending fracture test.
Jcs 10 00271 g004
Figure 5. The loading diagram of the drying shrinkage test.
Jcs 10 00271 g005
Figure 6. Test results of cubic compressive strength at different ages.
Jcs 10 00271 g006
Figure 7. Uniaxial compression stress–strain curves of prisms in each group.
Jcs 10 00271 g007
Figure 8. Test results of the uniaxial compressive strength of prisms in each group.
Jcs 10 00271 g008
Figure 9. Compression failure modes of prisms in each group.
Jcs 10 00271 g009
Figure 10. P-δ curves of each group.
Jcs 10 00271 g010
Figure 11. P-CMOD curves of each group.
Jcs 10 00271 g011
Figure 12. Fracture energy test results of each group.
Jcs 10 00271 g012
Figure 13. Early-age shrinkage test results.
Jcs 10 00271 g013
Figure 14. Drying shrinkage test results.
Jcs 10 00271 g014
Table 1. Mix proportions of steel fiber-reinforced micro-expansive concrete (kg/m3).
Group NameWaterCementFly
Ash
SandCoarse AggregateWater
Reducer
Expansive
Agent
Steel
Fiber
NC151416838389984.1--
MEC15137575838998550-
RD0.41513757583899855031.2
2D0.41513757583899855031.2
RD0.81513757583899855062.4
2D0.81513757583899855062.4
RD1.21513757583899855093.6
2D1.21513757583899855093.6
Table 2. Specimen design of micro-expansive steel fiber-reinforced concrete.
PerformanceTest ItemSpecimen Size/mmQuantityCuring Condition
MechanicalCubic compressive test100 × 100 × 100120(20 ± 1) °C
RH ≥ 90%
Uniaxial compressive test100 × 100 × 30024
FractureFracture test440 × 100 × 10024
ShrinkageDrying shrinkage test100 × 100 × 51524(20 ± 1) °C
RH = (60 ± 5)%
Table 3. Key parameters measured in the fracture test of each group.
No.CMODc/mmδc/mmPini/kNPmax/kN
NC0.0650.5192.6883.579
MEC0.0780.5292.8183.860
RD0.40.0750.5642.9104.150
RD0.80.1240.6962.9504.540
RD1.20.1810.8193.4955.806
2D0.40.0940.6803.0734.428
2D0.80.1320.7223.1754.966
2D1.20.2020.8403.5906.268
Table 4. Residual flexural strength of each group/MPa.
No.fR,1 (0.5 mm)fR,2 (1.5 mm)fR,3 (2.5 mm)fR,4 (3.5 mm)
RD0.417.8712.0710.6010.33
RD0.853.2339.4333.2529.97
RD1.270.4855.1352.7546.48
2D0.439.2330.6726.5025.53
2D0.857.5746.2039.7836.45
2D1.283.5269.6362.3057.97
Table 5. Equivalent flexural strength of each group/MPa.
No.feq,2feq,3
RD0.41.351.27
RD0.87.8331.68
RD1.210.6841.31
2D0.46.8430.19
2D0.88.6034.88
2D1.212.2545.25
Table 6. Fracture toughness test results of each group.
No.Elastic Modulus E/GPaKini/MPa·m1/2Kun/MPa·m1/2
RD0.413.3550.7291.234
RD0.815.9230.7401.893
RD1.221.6590.8763.175
2D0.420.1610.7701.828
2D0.824.3150.7962.641
2D1.230.1220.9004.338
Disclaimer/Publisher’s Note: The statements, opinions and data contained in all publications are solely those of the individual author(s) and contributor(s) and not of MDPI and/or the editor(s). MDPI and/or the editor(s) disclaim responsibility for any injury to people or property resulting from any ideas, methods, instructions or products referred to in the content.