Article

Assessing the Environmental Sustainability of Agro-Waste Fiber-Reinforced PLA Composites Through Life Cycle Assessment

1
Department of Mechanical and Industrial Engineering, Indian Institute of Technology Roorkee, Roorkee 247667, Uttarakhand, India
2
Department of Manufacturing and Civil Engineering, Norwegian University of Science and Technology, 2815 Gjøvik, Norway
*
Authors to whom correspondence should be addressed.
J. Compos. Sci. 2026, 10(5), 228; https://doi.org/10.3390/jcs10050228
Submission received: 11 March 2026 / Revised: 4 April 2026 / Accepted: 16 April 2026 / Published: 24 April 2026

Abstract

Agricultural residues and agro-waste are increasingly recognized as valuable reinforcements for sustainable composite materials. Natural fibers derived from these biomasses offer biodegradability, low density, renewability, and potential environmental benefits. However, their performance and sustainability depend strongly on extraction, surface treatment, and processing conditions. Therefore, evaluating the environmental emissions associated with natural fiber biocomposites is essential before claiming sustainability advantages. In this research, flax, jute, kenaf, and bagasse fibers were extracted and treated using an eco-friendly sodium bicarbonate solution, then incorporated into polylactic acid (PLA) matrix to fabricate biocomposites via injection molding. A life cycle assessment (LCA) was conducted using the ReCiPe midpoint (H) method, with a functional unit defined as “per kg” of manufactured biocomposite. The results revealed that jute fiber composites generated the highest emissions across several impact categories, including climate change (1.290 × 101 kg CO2-Eq), terrestrial ecotoxicity (6.327 × 101 kg 1,4-DCB-Eq), human toxicity: carcinogenic effects (1.923 kg 1,4-DCB-Eq), and fossil resource use (3.202 kg oil-Eq). Jute also showed a 3.6% increase in terrestrial ecotoxicity and a 19.5% increase in land compared to flax, although it exhibited a 6.5% lower impact related to bagasse. A ±20% electricity-consumption sensitivity analysis further highlighted the dependence of environmental impacts on processing energy demand.

1. Introduction

Fiber-reinforced polymer composites (FRPCs) have enhanced mechanical and wear properties compared to conventional composites, making them a preferred option. They often exhibit superior wear resistance and enhanced strength compared to other materials. Furthermore, these FRPCs outperform individual materials since they are both durable and very lightweight [1,2]. They possess superior capabilities to endure repeated loads, absorb vibrations, and resist chemical degradation compared to other materials [3]. Moreover, FRPCs exhibit elevated specific strength, exceptional electrical insulation under specified conditions, and considerable stiffness. Consequently, FRPCs are used across many fields, including energy and sustainability applications, marine and water sports equipment, industrial and mining sectors, transportation, aerospace, and building activities [2,4,5,6]. The ability to modify the characteristics of FRPCs according to specific needs is another notable benefit of their use. By adjusting the ratios of reinforcement and filler within the polymer matrix, one can control the composite’s final properties to meet application-specific needs. Asoodeh et al. [7] incorporated short glass fibers into the polypropylene matrix to examine the impact of reinforcement on the rheological and mechanical characteristics of the resulting composites. The glass fiber concentrations were maintained at 20%, 30%, and 40% (w/w), resulting in enhanced rheological and mechanical qualities with increasing glass fiber content.
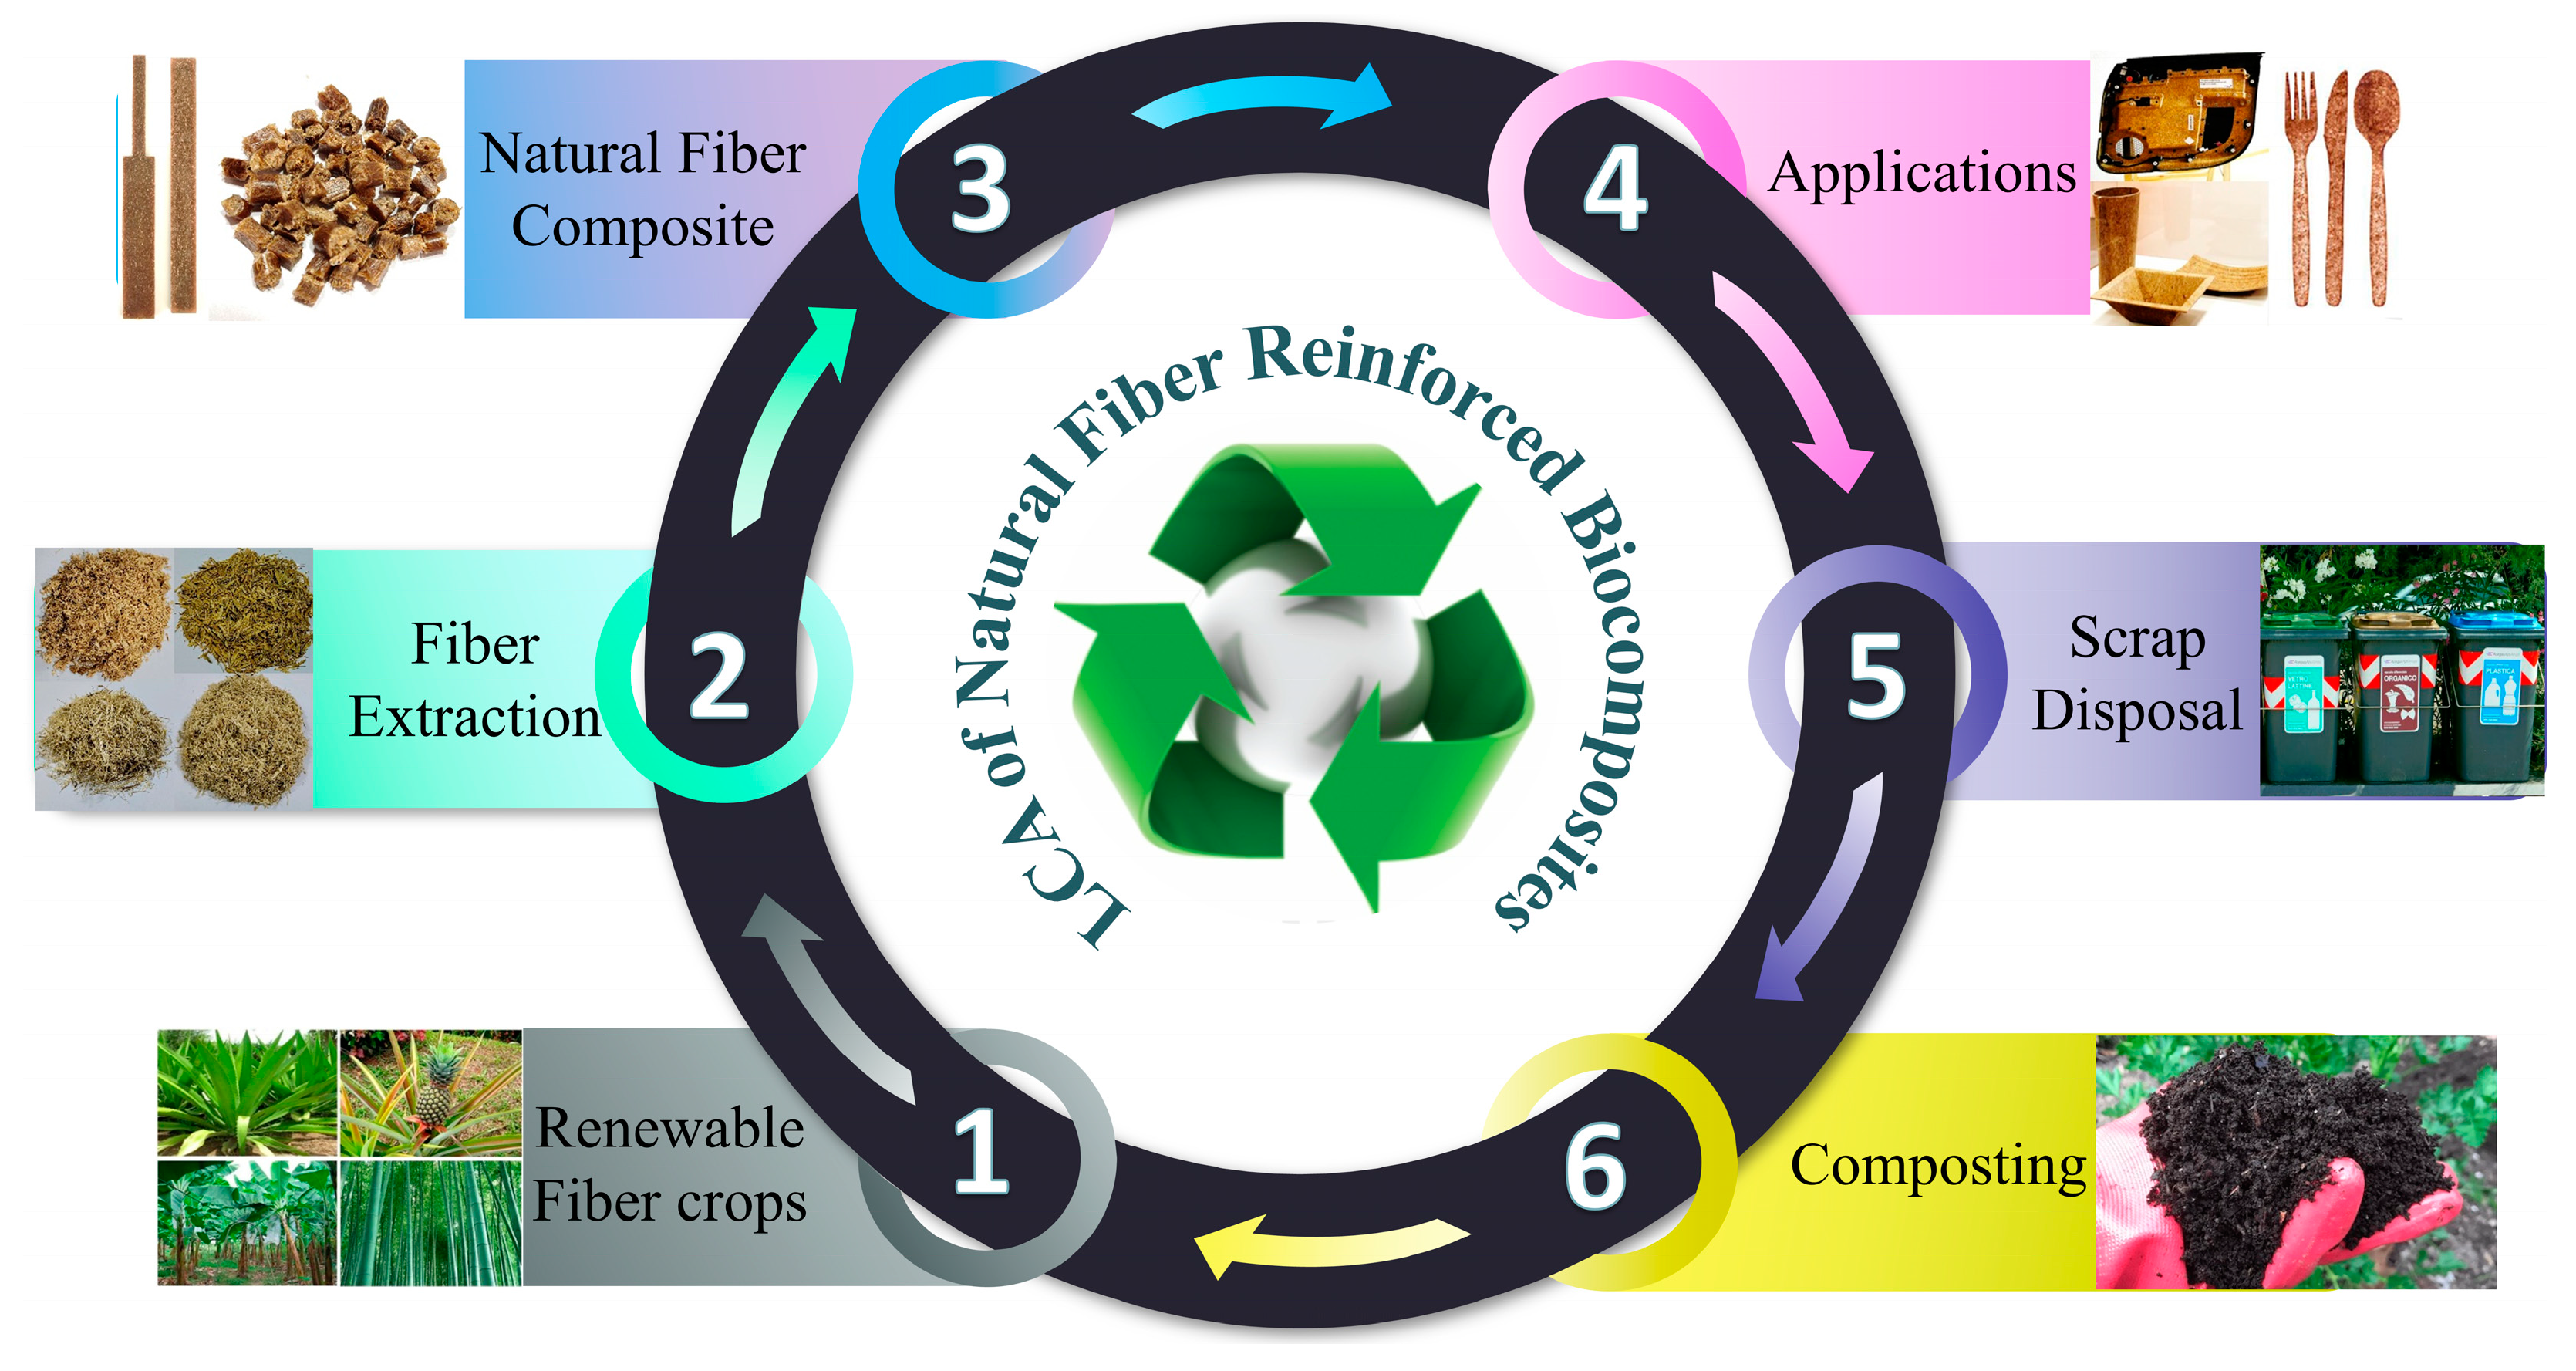
Moreover, these attributes are affected by the chosen manufacturing method, process parameters, and the types of matrices and reinforcement employed. Reinforcement may vary depending on its size, shape (cylindrical or spherical), and nature (synthetic or natural). The reinforcements that are employed in FRPCs can be in the form of whiskers, particles, structural fibers, or fibrous fibers [8]. Fibers derived from natural resources and man-made (synthetic) fibers are the two main categories of reinforcing materials used in composites. Synthetic fibers are defined as those derived from non-renewable sources, such as carbon, aramid, nylon, acrylic, etc. On the other hand, natural fibers have emerged as a potential alternative to synthetic fibers in advanced materials, driven by demand for lightweight, environmentally friendly materials [9,10,11]. The challenges of weight reduction and environmental considerations have prompted researchers to investigate natural fiber-reinforced composites as sustainable alternatives to conventional synthetic fiber-reinforced composites. Additionally, natural fibers offer a unique ecological perspective compared to synthetic fibers. In terms of availability, synthetic fiber resources are naturally restricted. Moreover, the low cost, abundant availability, high strength, and stiffness of natural fibers make them a suitable choice for various industrial applications in construction, aerospace, and automotive industries [2,12,13]. Natural fibers such as banana, bagasse, sisal, kenaf, flax, and jute offer a variety of advantages, including biodegradability, renewability, acoustic insulation, and a lower impact on equipment due to their lower abrasiveness [2,14]. Nayak et al. [15] incorporated plant-based rattan fiber into an epoxy matrix for lightweight automotive applications using the hand-lay-up method. The research examined mechanical, thermal, and morphological characteristics, revealing improvements attributed to fiber reinforcement. The rattan fiber was reinforced at weight fractions of 5 to 30%, with the 20% weight fraction exhibiting the superior mechanical properties. Similarly, Wagh et al. [16] enhanced flax and sisal fibers for bumper beam applications in the automobile industry. The fiber concentration of flax fibers was maintained at 43% by weight, while sisal fibers were at 30% by weight in epoxy resin. The findings indicated a 90% improvement in tensile attributes and a 17% increase in flexural properties for flax fiber compared to sisal fiber-reinforced composites. The study also showed a 38.2% increase in weight reduction compared with conventional aluminum bumpers. Despite these advantages, natural fiber composites have several limitations, such as water absorption and weak fiber-matrix adhesion due to the hydrophilicity of fibers and poor compatibility between the fiber nature and the matrix [17,18]. To overcome the disadvantages of natural fiber composites, their surfaces are chemically modified. Kumar and Singh [19] treated sisal fibers with oxalic acid at concentrations of 2%, 5%, and 8% (w/v) and assessed the outcomes using FTIR, TGA, XRD, and single-fiber tests. The treatment process enhances tensile strength by 60% relative to untreated fibers for the 8% treatment solution. Furthermore, the thermal degradation and molecular structure of the fibers enhanced post-oxalic acid treatment. Chaitanya and Singh [20] treated sisal fibers with an eco-friendly sodium bicarbonate solution at 24, 72, 120, and 168 h. The sisal fibers showed improvement post-treatment, and the highest thermal and mechanical characteristics were observed at 120 h of treatment. Beyond 120 h, the fibers fibrillated, reducing the properties of sisal fiber-reinforced composites. In another study, Yadav et al. [21] treated banana and bagasse fibers with alkaline treatment and electroless coating to modify their surfaces. Surface modification improves the mechanical, thermal, water-absorption, and flammability properties of banana and bagasse fibers. The environmental impact of these modification techniques was also assessed using life cycle assessment (LCA). The life cycle of natural fiber-reinforced biocomposites is illustrated in Figure 1.
LCA is a widely used methodological approach for assessing the environmental impacts of products and raw materials throughout their life cycles. In the context of polymer composites, LCA poses a systematic framework for quantifying material and energy flows as well as related emissions, enabling comparisons across various material systems based on stated assumptions [22]. With growing interest in natural fiber-reinforced biocomposites as sustainable alternatives to conventional composites, LCA has become critical for assessing whether the use of bio-based reinforcements yields environmental benefits [11]. Several studies have shown that the environmental performance of natural fiber composites is substantially influenced by parameters such as fiber origin, extraction technique, surface modification, and processing conditions [22,23,24]. Yadav and Singh [25] extracted banana and bagasse and modified their surface with natural and chemical treatments prior to biocomposite fabrication. The environmental impacts of eco-friendly and chemical treatments were assessed using LCA at the ReCiPe midpoint H. The boundary conditions include fiber types, fiber concentration, fiber extraction, fiber surface modification, biocomposite fabrication, and the observed improvement in environmental effects from eco-friendly surface modifications, as well as the use of eco-friendly surface modifications as an alternative to traditional chemical treatment processes. The existing LCA studies of natural fiber-reinforced biocomposites are presented in Table 1.
After thoroughly examining the aforementioned research, this study aims to reinforce several agrowaste natural fibers (flax, kenaf, jute, and bagasse) with a biodegradable PLA matrix via injection molding to manufacture biocomposites. These fibers underwent identical processing for extraction and fabrication methods. However, they originate from diverse sources, possess distinct structural properties, and follow different supply chain routes. Flax is a superior bast fiber, jute serves as a conventional/traditional reinforcement, kenaf functions as a hybrid bast-core system, and bagasse is an agricultural and industrial byproduct. This option enables a systematic examination of how variations in the source of raw materials, from cultivated fibers to fibers derived from waste, influence environmental performance, while maintaining a consistent processing and application framework. The environmental effects of multiple natural fibers have been analyzed using LCA in OpenLCA. The life cycle inventory includes material selection, fiber surface modification, energy usage, material transportation, biocomposite manufacturing, and waste generation. A sensitivity analysis was conducted to assess the robustness of emissions under varying electricity intensity.

2. Materials and Methods

2.1. Raw Materials

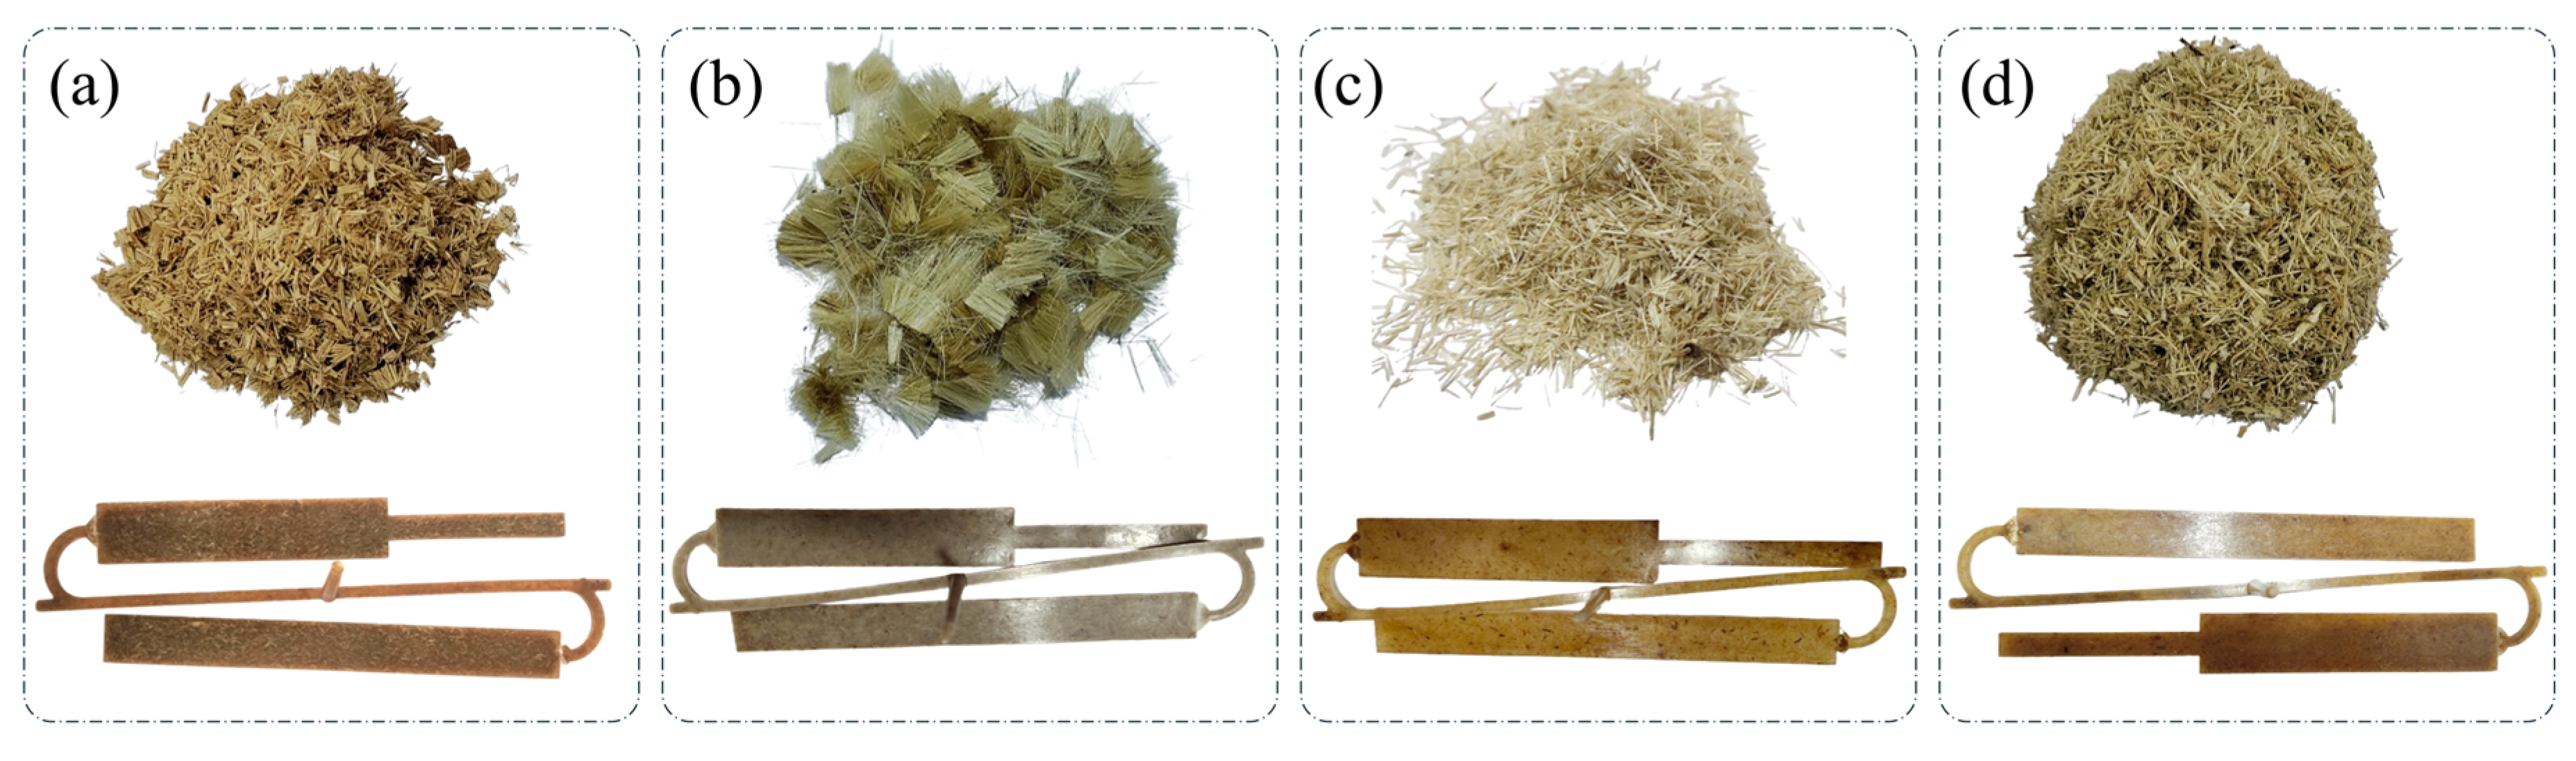
Flax, kenaf, jute, and bagasse in plant form were obtained from Yadav Trading Company, Sahibabad, Ghaziabad, Uttar Pradesh, India (Figure 2). The plants underwent water retting for 45 days, after which the fibrous material was physically removed from the metal combs. The recovered fibers were subsequently rinsed with tap water and dried in a hot air oven at 70 °C for 6 h. The dried fibers are further chopped using a grinder to the required length (less than 4 mm). Injection molding grade PLA (Ingeo 3052D) was acquired from Nahata Plastics, New Delhi, India, in pellet form. The pellets were desiccated at 50 °C for 5 h in a hot air oven to remove excess moisture.

2.2. Eco-Friendly Treatment

For surface modification of natural fibers, an eco-friendly treatment using sodium bicarbonate (HIMEDIA, TC230, Thane, India) was used. Sodium bicarbonate, also known as baking soda, is a widely used and simple chemical. It is inexpensive, readily available, and less harmful than harsh chemicals. As a result, sodium bicarbonate is increasingly being used to modify the surface of natural fibers [20,33]. Natural fibers contain wax, lignin, hemicellulose, and non-cellulosic elements on their surfaces, which reduces bonding with the polymer matrix [34]. By treating fibers with sodium bicarbonate, the surface becomes somewhat rougher and cleaner, thereby improving interfacial adhesion. In this study, a 10% sodium bicarbonate solution (w:v) was used to soak the fibers, with a 1:30 fiber-to-solution ratio. The fibers were soaked in a sodium bicarbonate solution for 10 h at room temperature. The fibers were then removed from the solution and rinsed with running water to maintain a pH of 7. The fibers were then dried in a hot-air oven for 6 h at 70 °C to obtain treated, dried natural fibers.

2.3. Biocomposite Fabrication

The biocomposites were fabricated via injection molding on an Electronica Futura 60 Injection molding machine (Electronica Plastic Machines Pvt Ltd (EPM), Pune, India). Injection molding is the simplest composite manufacturing process for small- to medium-sized parts with complex geometries and high precision. The fibers and PLA were mixed and poured into the injection molding machine barrel through a hopper with a charging speed of 40 rpm and a pressure of 50 MPa. The fibers and PLA were melted by the band heaters, then amalgamated and pushed through an extrusion screw. The barrel temperature was maintained at 165 °C, 175 °C, 185 °C, and 190 °C from the hopper to the nozzle. The molten mixture was injected into the mold via the nozzle at 90 MPa injection pressure and 110 rpm. The molten mixture within the mold was allowed to cool for 30 s before being ejected by the ejectors to obtain the fabricated biocomposite (Figure 3).

2.4. Life Cycle Assessment (LCA) Goal and Scope

This study assesses the environmental impact of four natural fibers as reinforcements in a PLA matrix. The nomenclature and LCA scenarios are listed in Table 2. The assessment primarily aims to evaluate variations in environmental impacts when using different natural fibers as reinforcement, while maintaining a consistent PLA matrix. All biocomposite systems underwent identical fiber extraction and pretreatment processes to ensure consistency across the study. Using a single extraction route for all fibers minimizes variability arising from processing conditions, thereby highlighting the influence of fiber type on overall environmental impact. The findings of this study are primarily beneficial to researchers and material developers, enabling them to understand the comparative sustainability of natural fiber-reinforced PLA biocomposites under uniform, controlled processing conditions. The study examines the environmental impact of natural fibers, while the integration of mechanical, thermal, and water absorption properties of the developed biocomposites, as they relate to LCA, was not addressed in this research.
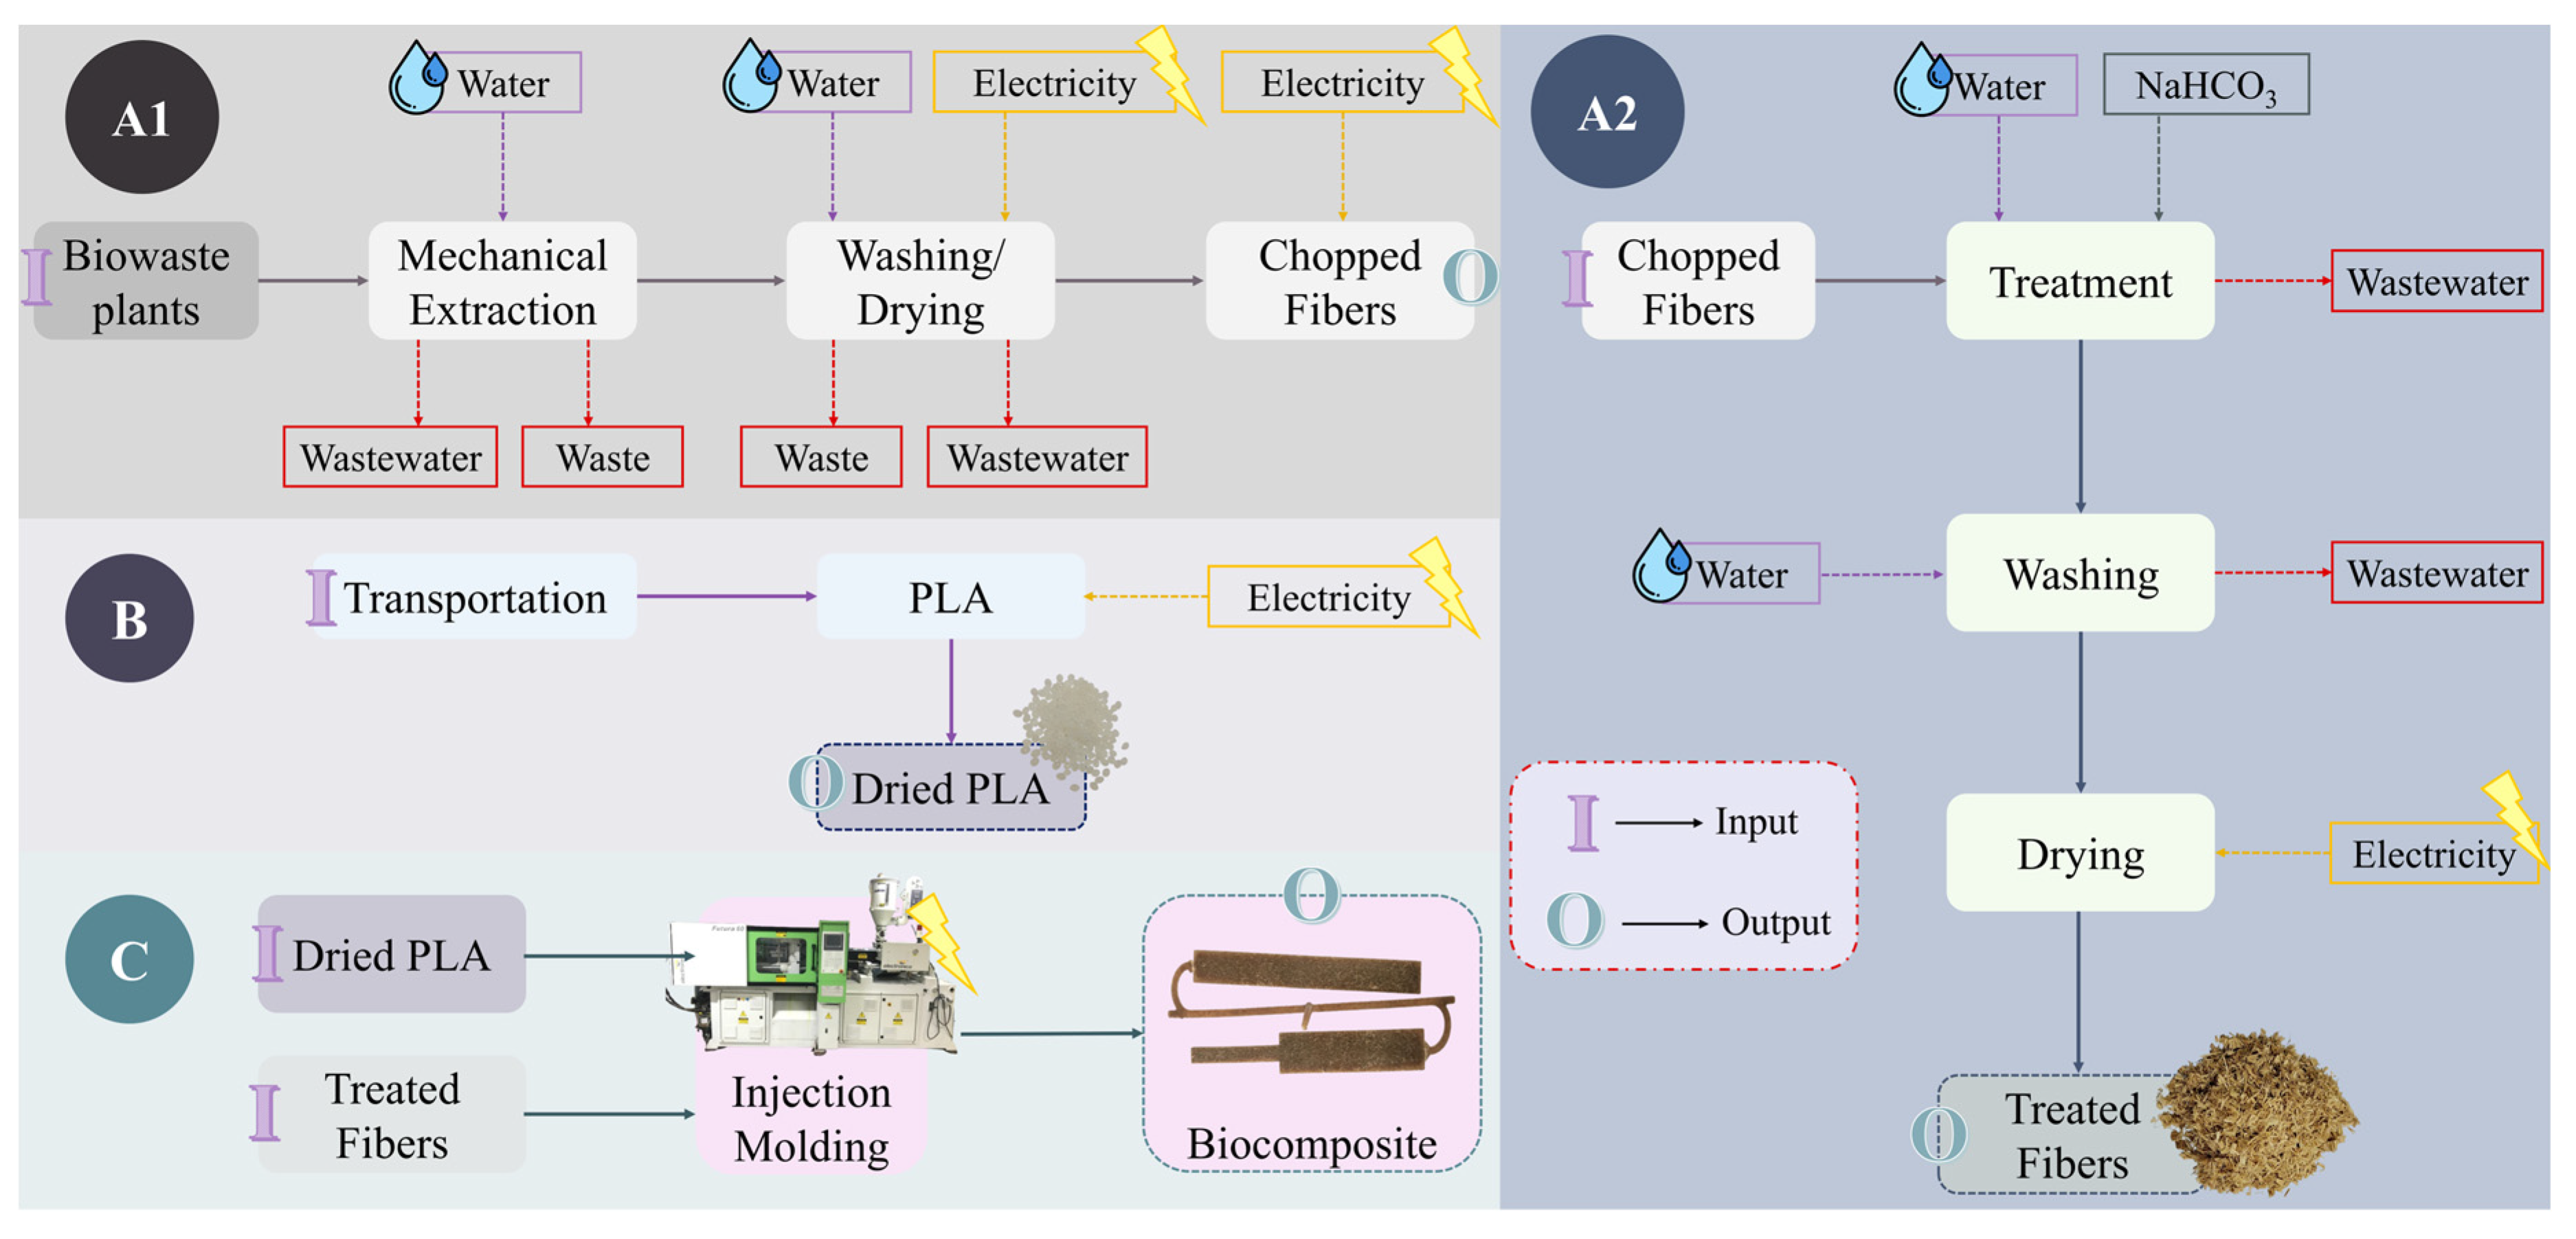
The functional unit was defined as “per kilogram” of the manufactured biocomposites. The boundary condition was consistent with international standards (ISO 14040 [35], ISO 14044 [36]), and cradle-to-gate pathways were selected from raw material procurement to final biocomposite fabrication (Figure 2). The end-of-life management of biocomposites was excluded, as these fibers are derived from agro-waste, which can be landfilled or composted post-use. Moreover, these biocomposites enhance soil quality rather than degrade after landfilling.

2.5. Life Cycle Inventory

The data utilized in this work was collected from different processes and sources. The details of raw materials procurement are mentioned in the above sections. The data associated with fiber extraction, chopping, eco-friendly treatment, energy inputs, and biocomposite fabrication were derived from experimental procedures. The remaining data was sourced from AgriBalyse v3.10 and Ecoinvent v3.11 (accessible in OpenLCA 2.4.1). For the impact assessment, the ReCiPe 2016 v1.03 midpoint (H) methods were employed, as they effectively evaluate 18 impact categories, including the Lazy/On-demand calculation type. The impact categories include Climate change (CC) (kg CO2-Eq), land use (LU) (m2*a crop-Eq), water use (WU) (m3), terrestrial acidification (AT) (kg SO2-Eq), particulate matter formation (PMF) (kg PM2.5-Eq), ozone depletion (OD) (kg CFC-11-Eq), freshwater eutrophication (EPF) (kg P-Eq), marine eutrophication (EPM) (kg N-Eq), freshwater ecotoxicity (ETF) (kg 1,4-DCB-Eq), marine ecotoxicity (ETM) (kg 1,4-DCB-Eq), terrestrial ecotoxicity (ETT) (kg 1,4-DCB-Eq), carcinogenic human toxicity (HTC) (kg 1,4-DCB-Eq), non-carcinogenic human toxicity (HTNC) (kg 1,4-DCB-Eq), photochemical oxidant formation: human health (PFHH) (kg NOx-Eq), photochemical oxidant formation: terrestrial ecosystems (PFTE) (kg NOx-Eq), energy resources: non-renewable, fossil (ERNR) (kg oil-Eq), material resources: metals/minerals (MRM) (kg Cu-Eq), ionizing radiation (IR) (kBq Co-60-Eq) [17]. The ReCiPe midpoint (H) technique has been widely utilized in recent research on natural fibers, biomaterials, and biocomposites. Table 3 presents the life cycle inventory (LCI) for the extraction, cleaning, and processing of flax, jute, kenaf, and bagasse fibers. The fiber extraction and surface modification (eco-friendly treatment) were standardized across all fibers to ensure consistency and assess the environmental impact of the fibers. The LCI for the treatment process and PLA preparation is presented in Table 4 and Table 5, respectively. The LCI for biocomposite fabrication is stated in Table 6.
Table 6. LCI for the fabrication of natural fiber reinforced PLA biocomposites.
Input
MaterialUnitValueReferenceHypothesis
Eco-friendly treated Flax/Jute/Kenaf/Bagasse fiberskg1ProcessAssume as input from the output of Table 4.
Transported and dried PLAkg3ProcessAssume as input from the output of Table 5.
Electricity, medium voltage (Injection Molding Machine)kWh2.72Ecoinvent v3.11The Northern Indian electrical grid supply was used.
Output
MaterialUnitValueReferenceHypothesis
Natural fiber-reinforced PLA biocompositekg4ProcessFunctional output

2.6. Sensitivity Analysis

A sensitivity analysis was conducted to evaluate the impact of electricity consumption on environmental emission outcomes. Electricity is the primary contributor to the impact categories associated with fiber extraction, fiber treatment, PLA processing, and biocomposite fabrication. Electricity consumption was altered by ±20% for the sensitivity analysis. In the increased scenario, electricity usage increased by 20%, whereas in the reduced scenario, electricity consumption decreased by 20%. This analysis aimed to assess the stability of the comparative ranking of fiber composite systems in response to variations in energy demand, while maintaining all other parameters constant.

3. Results and Discussion

3.1. Overall Impact Analysis

This study analyzes the environmental effects of flax, jute, kenaf, and bagasse fiber-reinforced PLA biocomposites across 18 impact categories under cradle-to-gate parameters. The boundary conditions include similar parameters for all four fibers, including fiber extraction, fiber treatment, PLA preparation, and biocomposite fabrication. The system encompasses water use, energy usage, and waste generation at each stage. The contribution of PLA is consistently uniform across all biocomposites, attributable to the uniform matrix content, suggesting that the selection of natural fiber is essential in determining the environmental profile of the composite material.
The cumulative effect of treatment, electricity consumption, and PLA processing is shown in Table 7, Table 8, Table 9 and Table 10. The variation in life-cycle effect is attributed to the physical characteristics of natural fibers, including PLA, the extraction methodology, and the production technology used. According to Table 7, Table 8, Table 9 and Table 10, the F/PLA biocomposite has the lowest overall environmental effect (1.01638 × 10²), whereas the B/PLA (1.03802 × 10²) demonstrates the greatest. The discrepancies are not attributable to process-related changes but are entirely dependent on the strength and stiffness of natural fibers, the specific plant portion from which they are derived, moisture content, lignocellulose, and the composition of non-cellulosic constituents [37]. In the areas of acidification (AT) and particulate matter formation (PMF), the overall effect values for J/PLA are elevated (Table 8), but the values for B/PLA are diminished (Table 10). The elevated nitrogen and sulfur emissions resulting from the retting process and wastewater regeneration for certain bast fibers may account for this tendency [38]. Research results indicate that natural fibers that require extended retting times or more intensive washing processes are likely to produce higher levels of acidifying emissions. Freshwater and marine ecotoxicity indicate that the composite system may pose a threat to aquatic life. Freshwater ecotoxicity refers to potential risks to rivers, lakes, and other freshwater environments, whereas marine ecotoxicity refers to likely effects on marine and ocean ecosystems [37,39]. These impact categories do not imply that fibers or composites are inherently dangerous. Instead, they indicate how much emissions may be caused by activities such as fiber extraction, washing, treatment, energy use, and chemical synthesis throughout their existence. The current research shows that J/PLA composites have relatively high values in both freshwater and marine ecotoxicity categories. Bast fiber jute contains a higher concentration of non-cellulosic components, making it more vulnerable to processing in areas associated with ecotoxicity [40]. Their higher ratings suggest a greater risk to aquatic environments throughout their life cycle. In the ReCiPe midpoint method, freshwater eutrophication (EPF) and marine eutrophication (EPM) reflect the potential nutrient enrichment of aquatic environments resulting from emissions associated with the composite life cycle. Freshwater eutrophication is mainly phosphorus-related, while marine eutrophication is nitrogen-related and affects marine and ocean ecosystems [40]. J/PLA (1.222 × 10⁻² kg P-Eq, 3.094 × 10⁻³ kg N-Eq) signifies the most significant emissions of freshwater and marine eutrophication relative to other fibers. The F/PLA, K/PLA, and B/PLA release roughly 19% less phosphorus-based material than J/PLA. Conversely, J/PLA has nitrogen content that is 13.46%, 24.05%, and 32.06% greater than that of F/PLA, K/PLA, and B/PLA, respectively. Jute cultivation requires greater fertilizer inputs, which immediately increases phosphorus and nitrogen content, rendering jute rich in these nutrients.

3.2. Major Categories Impact Analysis

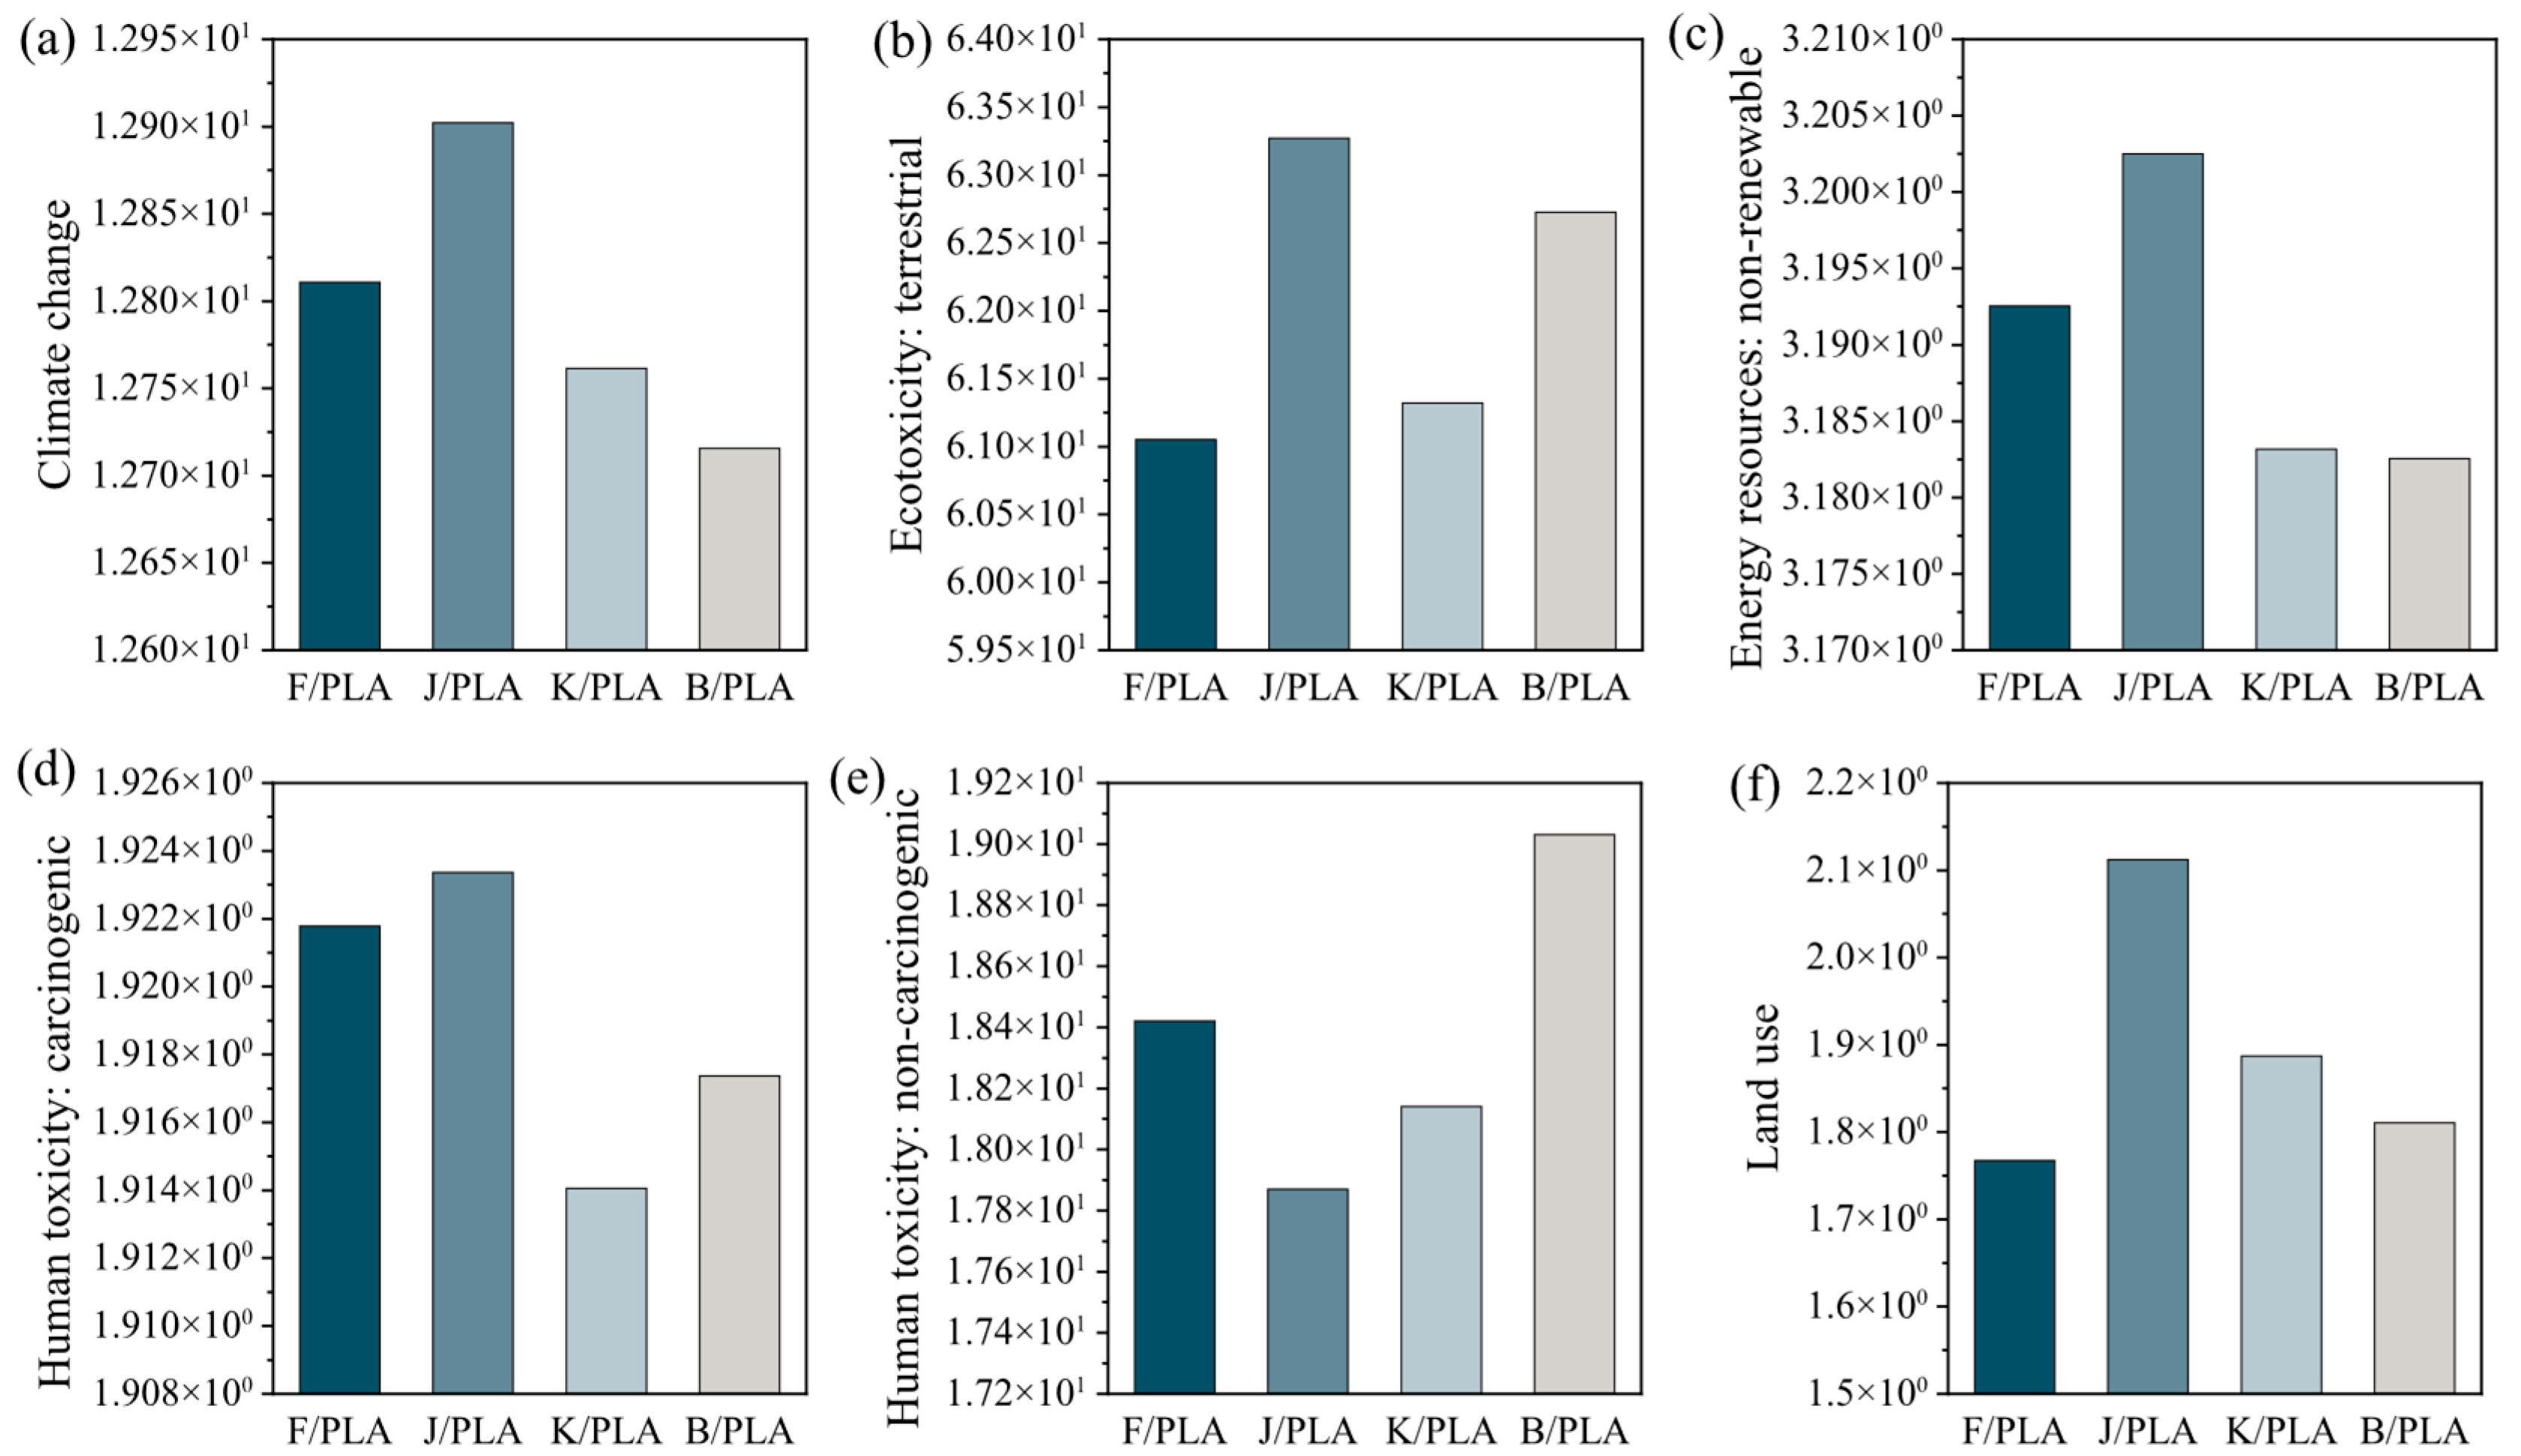
The primary categories that significantly affect environmental effects are climate change (CC), ecotoxicity: terrestrial (ETT), non-renewable fossil energy resources (ERNR), human toxicity: carcinogenic (HTC), human toxicity: non-carcinogenic (HTNC), and land use (LU). The results of these six categories are depicted in Figure 4 for all four LCA scenarios. However, the carbon footprint of F/PLA exceeds that of B/PLA, since flax fiber produces greater quantities of CO2 and other greenhouse gases during its manufacturing, extraction, and processing stages [41].
The variation in CC among F/PLA (1.281 × 101 kg CO2-Eq), J/PLA (1.290 × 101 kg CO2-Eq), K/PLA (1.276 × 101 kg CO2-Eq), and B/PLA (1.272 × 101 kg CO2-Eq) is under 1%. J/PLA exhibited the highest emission values for terrestrial ecotoxicity (ETT) and fossil energy (ERNR). Terrestrial ecotoxicity exemplifies the detrimental effects on soil microbes, earthworms, insects, plants, and vegetation [42]. The minimal ecotoxicity is recorded for F/PLA (6.105 × 101 kg 1,4-DCB-Eq), with increases of 3.63%, 0.45%, and 2.7% for J/PLA, K/PLA, and B/PLA, respectively. The lowest fossil energy emissions are recorded for B/PLA, whereas J/PLA shows a 0.63% increase, representing the greatest emissions. The emission from energy resources: non-renewable, fossils pertain to the utilization of fossil energy in electricity generation, chemical processes, and drying energy generated from coal and fossil fuels [38]. Human toxicity: carcinogenic (HTC) and human toxicity: non-carcinogenic (HTNC) denote the potential health risks to human health throughout the life cycle of biocomposites [43]. Carcinogenic emphasizes cancer-related risks, whereas non-carcinogenic refers to other non-cancerous health risks to humans. J/PLA (1.923 kg 1,4-DCB-Eq) demonstrated the highest level of carcinogenic human toxicity, while B/PLA (1.903 × 101 kg 1,4-DCB-Eq) revealed the highest level of non-carcinogenic human toxicity. Although jute fiber and bagasse fibers are agricultural residues, their emissions can be attributed to retting, washing, and the type of energy used for fiber processing, which amplifies upstream energy-related and chemical emissions. The land use (LU) statistics indicate that the fiber systems are more distinctly differentiated from one another. J/PLA has the greatest overall influence (2.112 m2a crop-Eq), followed by K/PLA (1.887 m2a crop-Eq) and B/PLA (1.811 m2a crop-Eq), whilst F/PLA (1.767 m2a crop-Eq) has the minimal effect on land usage. This outcome is logically consistent from a technical perspective, since the intensity of agricultural cultivation and anticipated biomass yield significantly influence land use [44]. Numerous studies indicate that fiber derived from agricultural waste, such as flax, has a lower impact on land use than that from primary fiber crops.

3.3. Environmental Hotspot

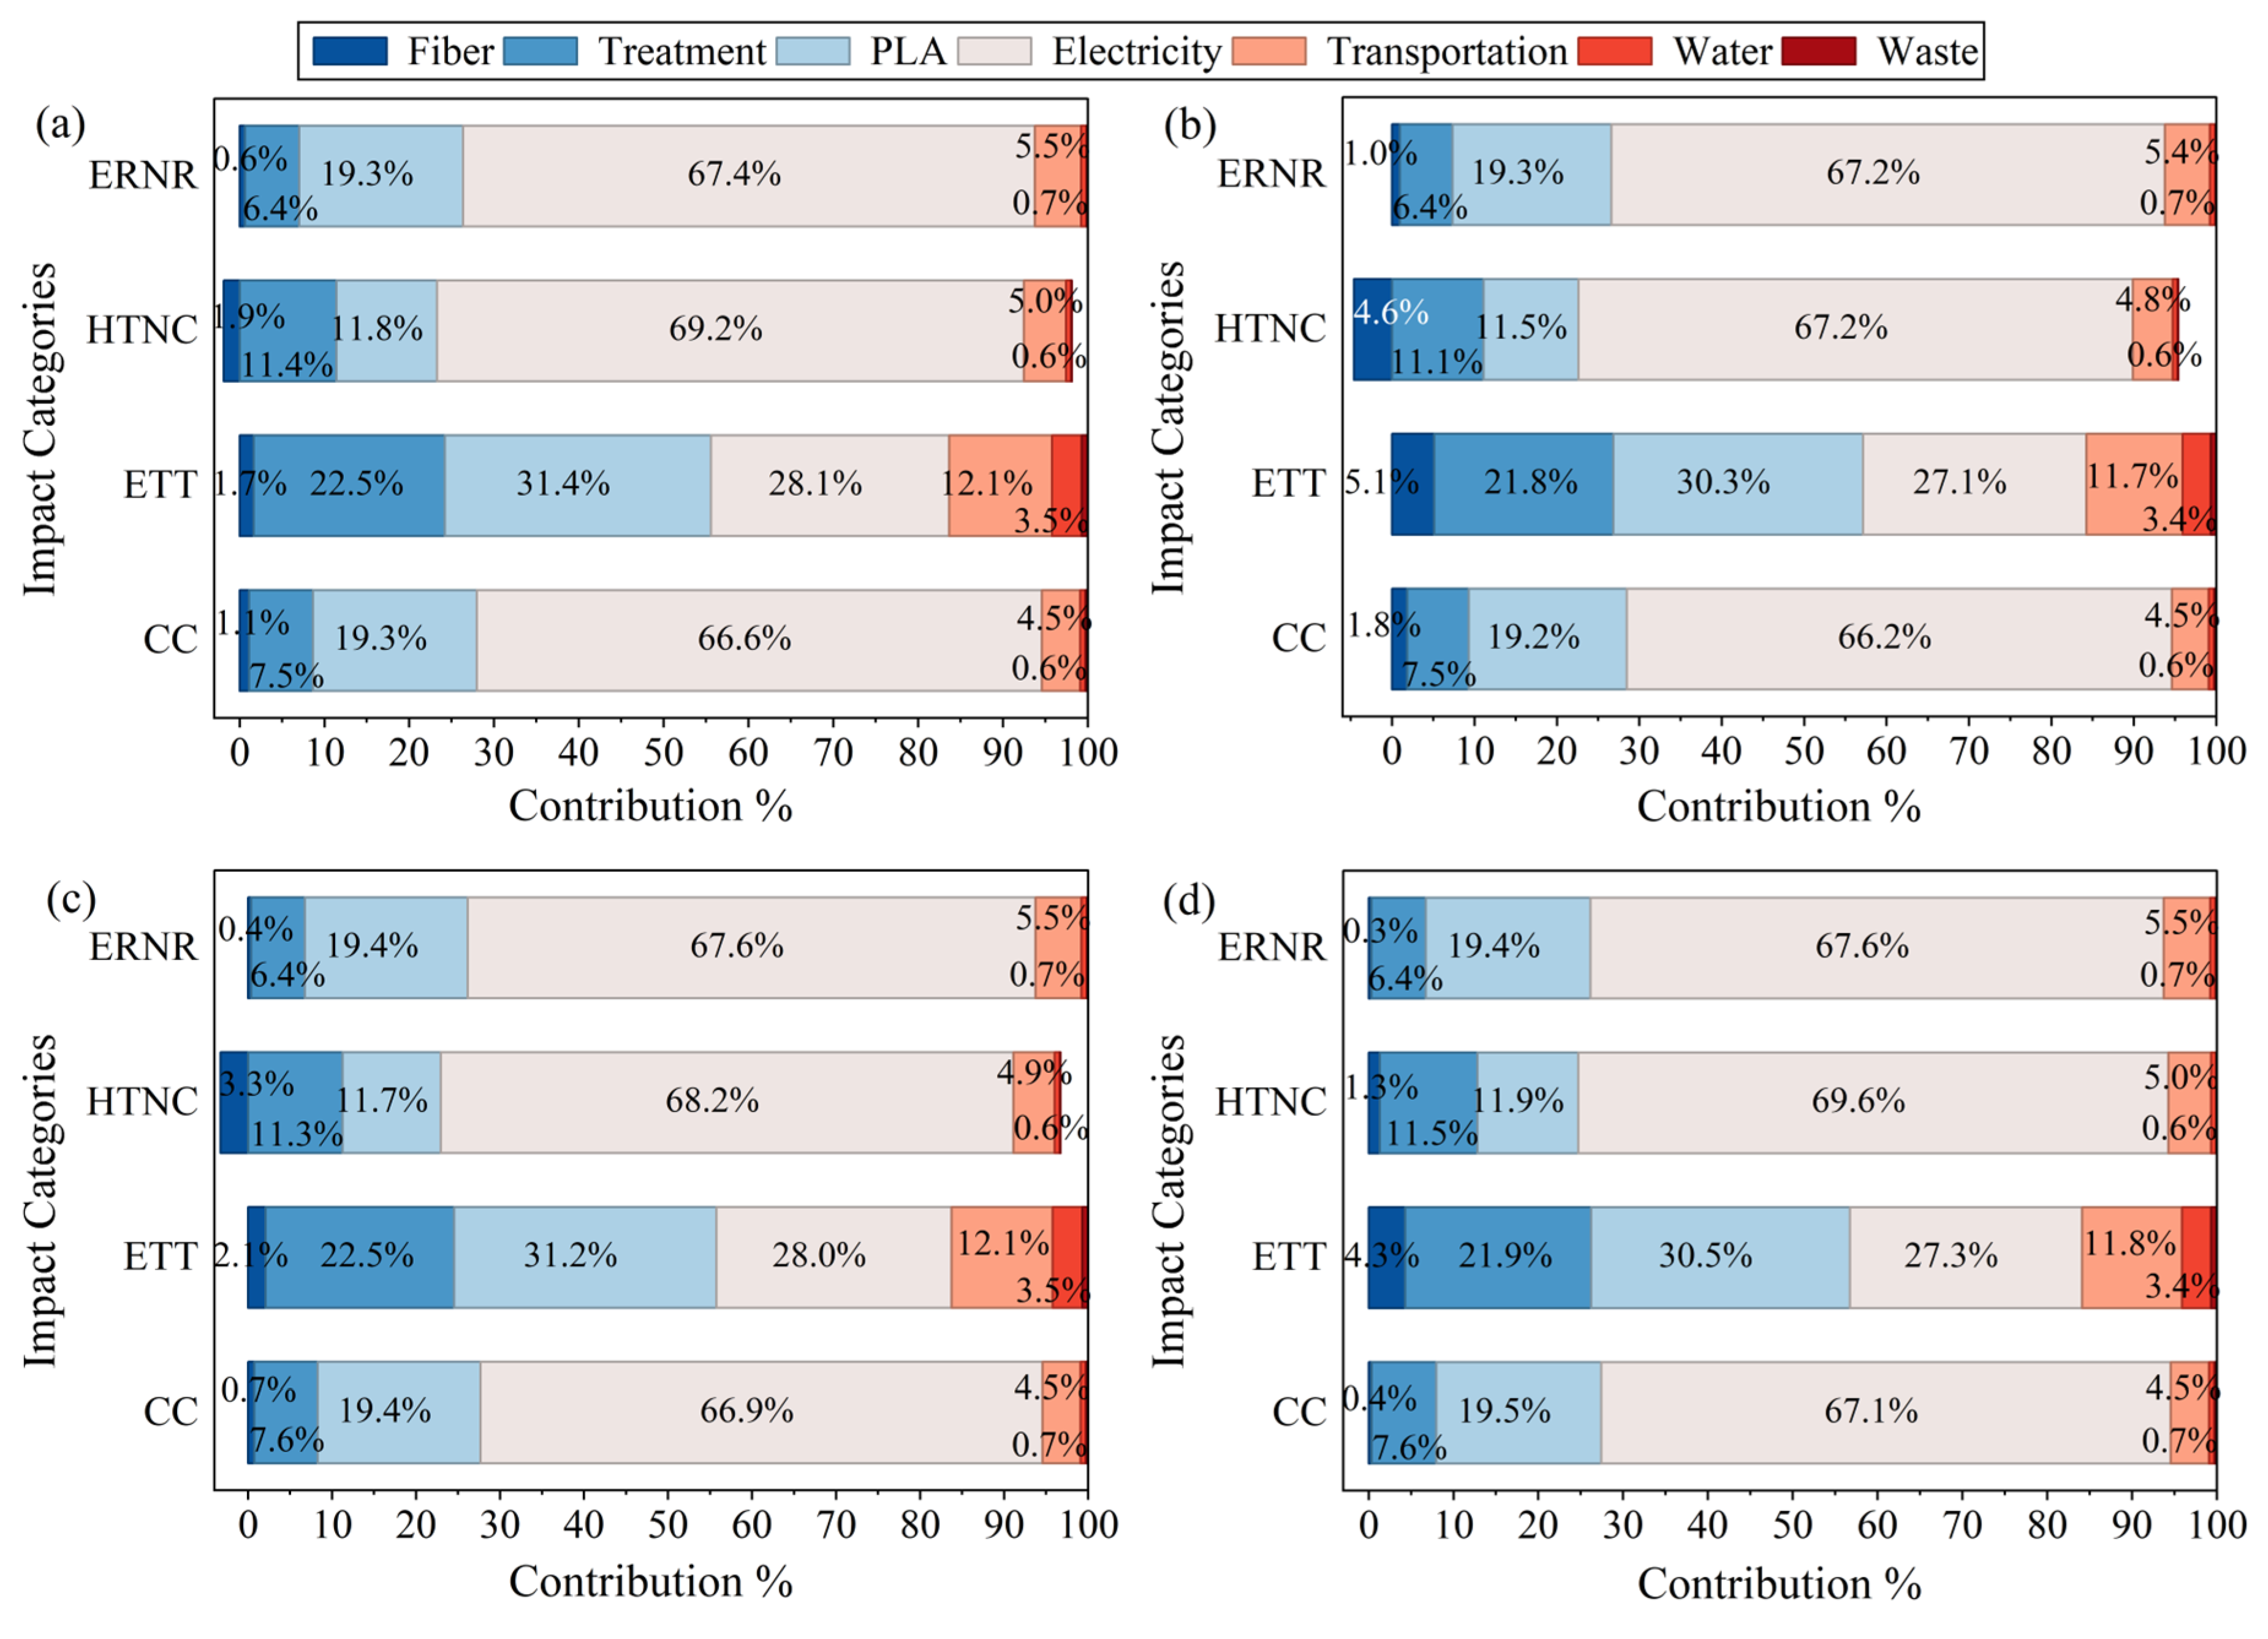
The percentage contributions of F/PLA, J/PLA, K/PLA, and B/PLA to climate change (CC), ecotoxicity: terrestrial (ETT), non-renewable fossil energy resources (ERNR), and human toxicity: non-carcinogenic (HTNC) are depicted in Figure 5.
The primary contribution is attributed to electricity, as the processes of biocomposite fabrication, fiber extraction, and the drying of PLA and fibers require energy. The impact categories, such as CC, ERNR, and HTNC, account for up to 69% of electricity, whereas ETT accounts for up to 28%. This discrepancy occurs because terrestrial ecotoxicity is attributed to pesticides, chemicals, metals, and soil emissions, while emissions from CC, ERNR, and HTNC are associated with energy-intensive processes and fossil fuel consumption. The energy used in this research is sourced from the Northern Indian grid, which is generally generated from coal and other fossil fuels rather than renewable resources [25]. The following significant contribution is noted from PLA, which serves as the base material for biocomposite fabrication and constitutes 75% by weight in each produced biocomposite. Although it is a bio-based polymer, its extraction and processing necessitate energy and chemicals. The third-highest contribution has been reported for eco-friendly fiber treatment with sodium bicarbonate, reaching up to 23% across various scenarios. Its average contribution is up to 20% in most cases. Despite sodium bicarbonate being a mild, environmentally benign chemical, its industrial processing requires upstream electricity and fossil-fuel-based energy [20]. Moreover, sodium bicarbonate treatment entails water-intensive processing that consumes significant water resources and produces wastewater, thereby increasing human toxicity, eutrophication, and ecotoxicity. The minimum contribution percentages are stated for fibers, water, and waste generation. The contribution of water and waste is below 1%, whereas the contribution of fibers can reach up to 5% in numerous scenarios. The fibers are derived from plants, and their cultivation and extraction from agricultural crops elevate emissions. Overall, electricity consumption is highest, and it can be reduced by using clean energy or renewable sources such as solar and wind. Yadav et al. [25] observed similar trends in electricity consumption during biocomposite manufacturing incorporating chemically and naturally treated banana and bagasse fibers. Similarly, many studies observed a similar trend of energy contribution, including Moyaert et al. [45], Quintana et al. [46], Yadav et al. [21], and Firdaus et al. [47].

3.4. Fiber-Specific Environmental Impact Analysis

A more distinct differentiation among flax, jute, kenaf, and bagasse biocomposites becomes apparent when the overall impact results are analyzed from a fiber-specific viewpoint across the chosen midpoint categories. The consistent processing conditions indicate that the variations in total impact are primarily attributable to fiber-dependent attributes, including extraction efficiency, biomass source, and agricultural intensity. The impact of fibers on climate change accounted for less than 2% across all biocomposites (Figure 5). The disparity in emissions from fibers was greatest for jute fibers and least for bagasse fibers. When compared to bagasse fibers, jute fibers showed a 393% increase, flax a 200.9% increase, and kenaf a 96.5% increase. Non-renewable energy resources exhibit the same trend as climate change. On the other hand, this trend is inverted for non-carcinogenic human toxicity, as bagasse exhibits the highest emissions, while jute demonstrates the lowest, with a difference of 127.7%. The percentage contributions of fibers to non-renewable energy resources and non-carcinogenic human toxicity are less than 1% and 5%, respectively, of total environmental emissions. Flax fibers exhibited elevated emissions in categories associated with water consumption and ecotoxicity due to the intensive retting process, which typically requires extended water exposure and multiple washing stages to attain satisfactory fiber quality [31,48]. Jute exhibited significant effects on climate change, land use, acidification, and non-renewable energy resource categories, which are associated with increased fertilizer input and land occupation per unit of fiber mass during cultivation. Kenaf generally occupies an intermediate position across nearly all impact categories, indicating a balanced environmental profile and demonstrating efficient retting behavior compared to other bast fibers, as well as a higher biomass yield per hectare. These attributes result in moderate effects on land use, climate change, and toxicity-related categories [42]. Bagasse fiber has a minimal impact in categories such as climate change, non-renewable energy resources, water usage, and land use, as it is an agricultural byproduct rather than a primary cultivated fiber [49]. The lack of land use and diminished agricultural inputs upstream substantially decreases its environmental impact across various categories. Among the primary impact categories, kenaf and flax fibers had the lowest total emissions compared to bagasse and jute fibers. The selection of fibers is not solely determined by fiber emissions; it also considers the relative impact of fibers on the overall environmental emissions generated by the biocomposites within the same system boundaries.

3.5. Sensitivity Analysis

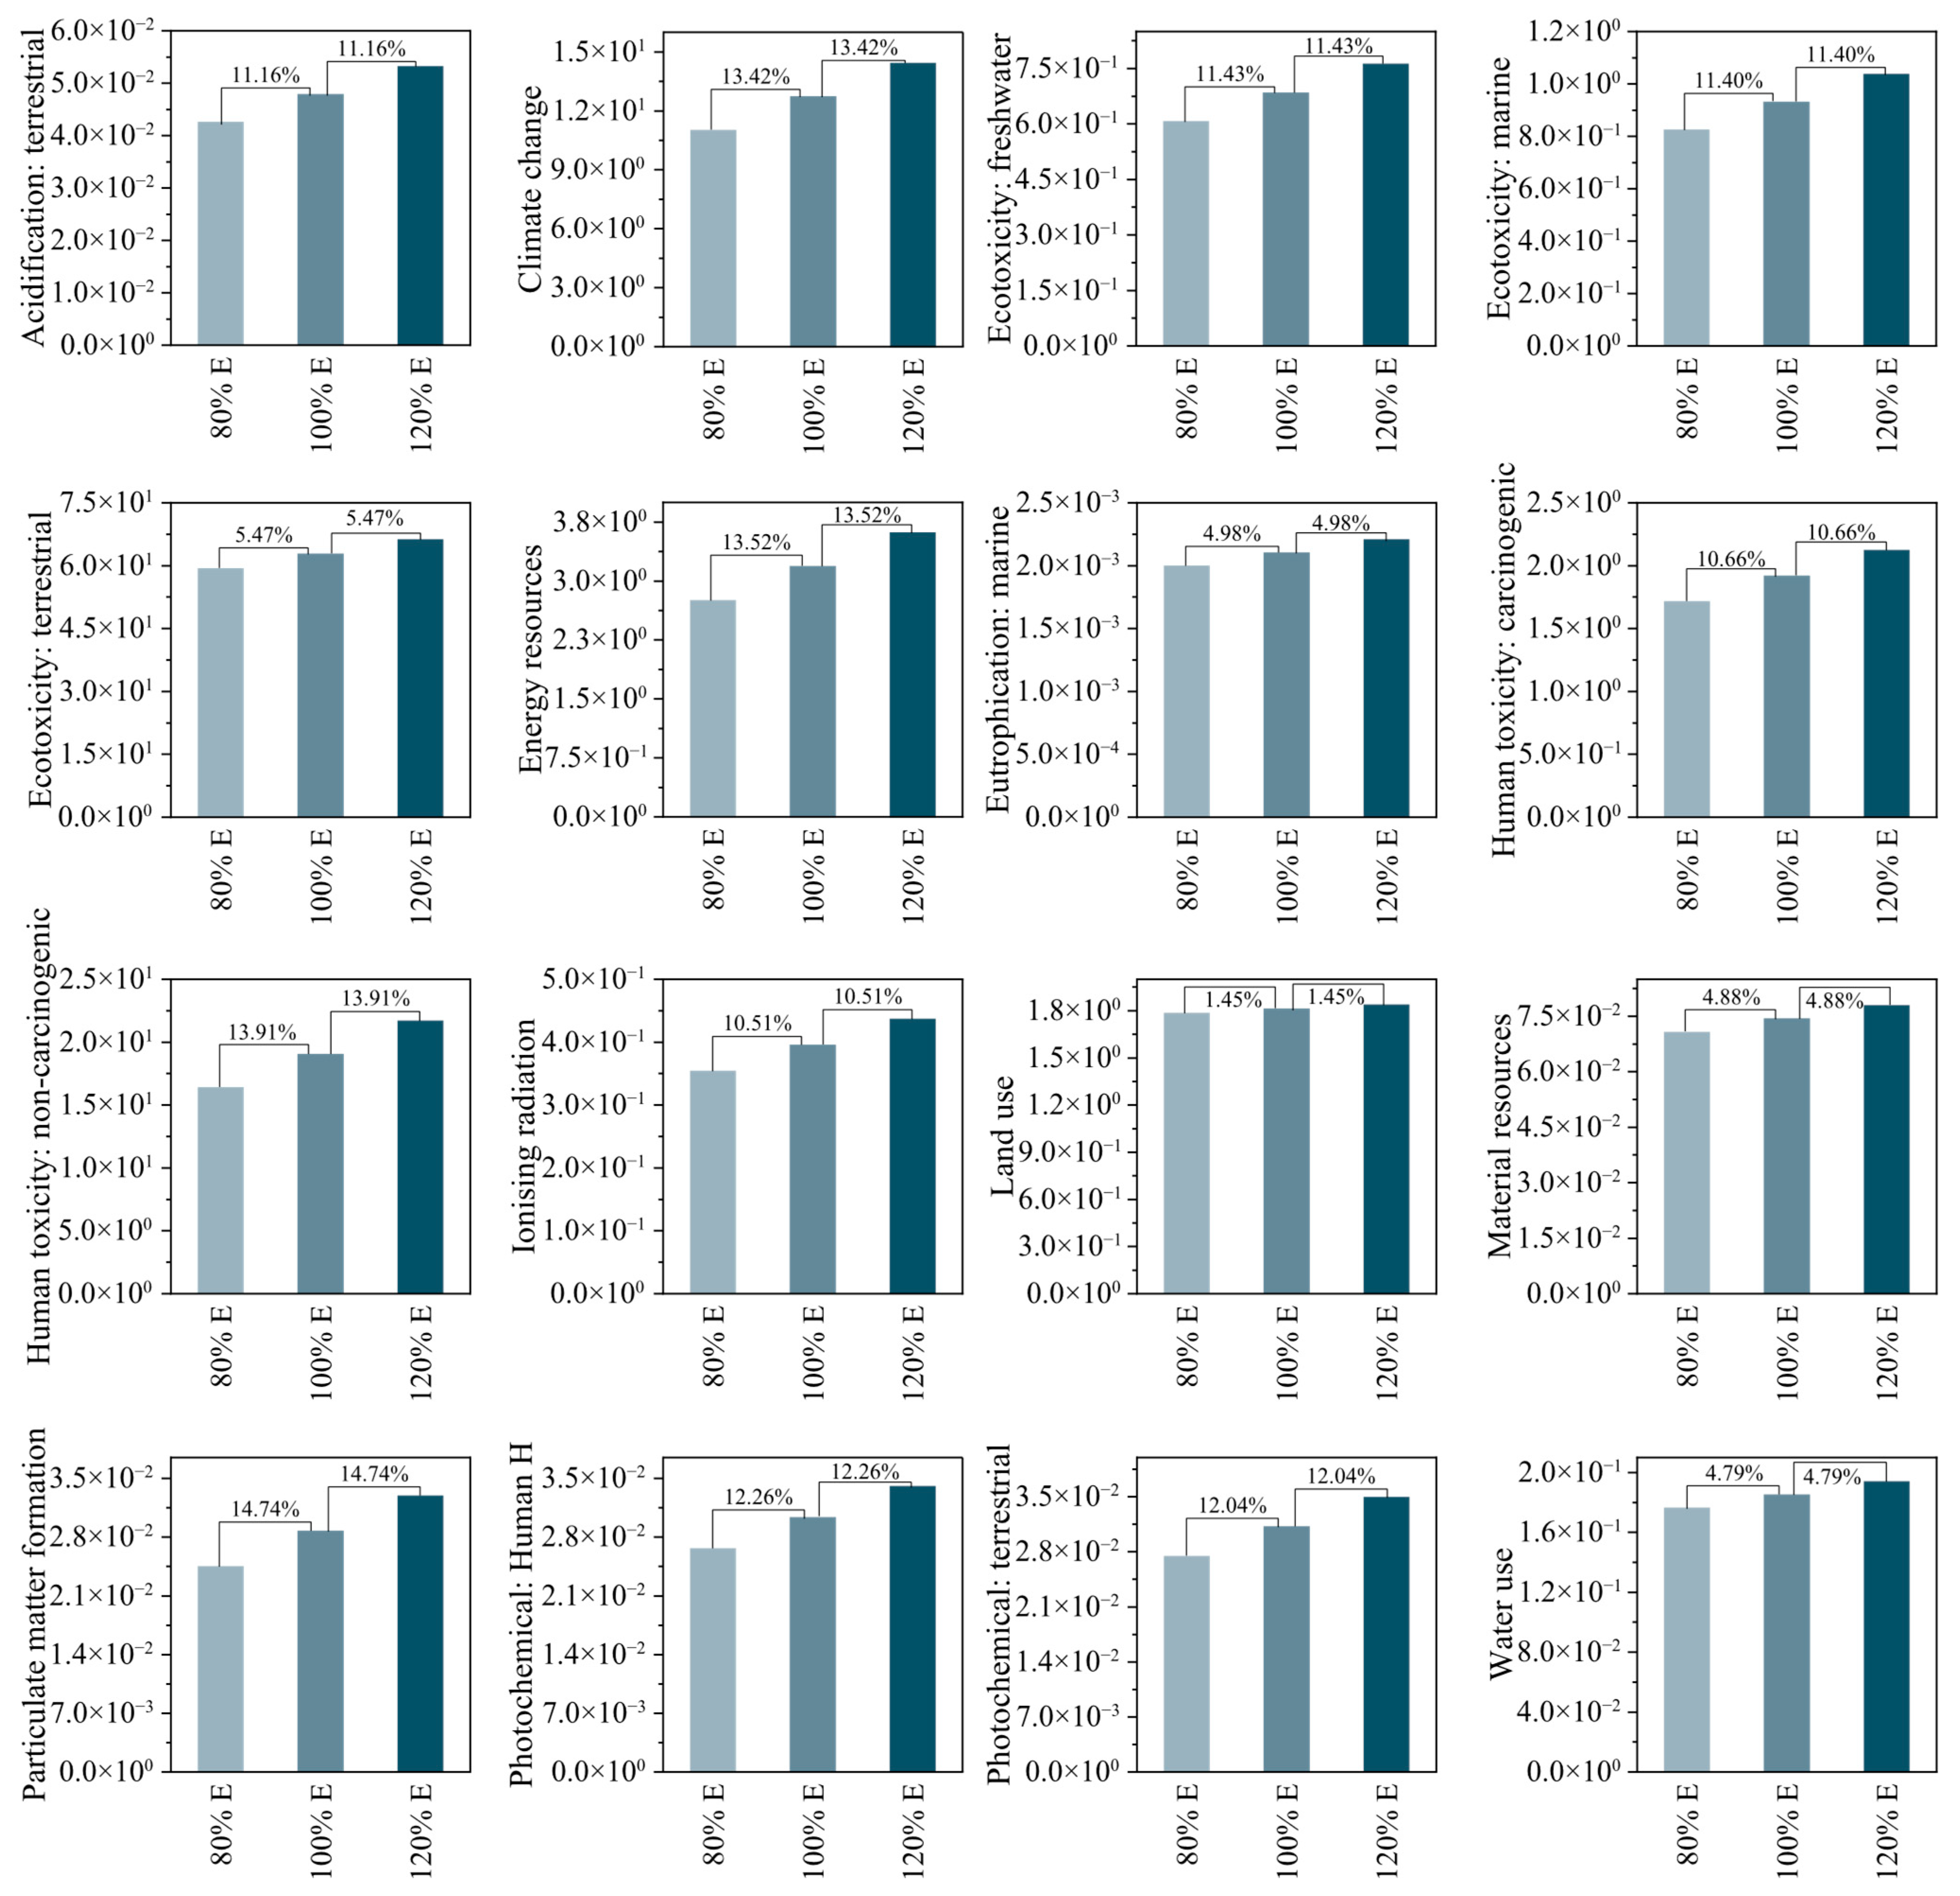
The results from Section 3.3 were thoroughly analyzed, and it was determined that electricity was the major contributor to environmental emissions. In order to evaluate the robustness of the comparative ranking of biocomposites, the electricity consumption was varied by ±20% for sensitivity analysis. Throughout the analysis, the other parameters, including fibers, treatment, PLA, transportation, water consumption, and waste generation, remain constant. In the reduced and enhanced scenarios, the electricity consumption decreased by 20% and increased by 20%, respectively. In Figure 6, the original electricity consumption was defined as 100% electricity (base scenario), while the reduced scenarios were represented by 80% electricity and the increased scenarios by 120% electricity. The sensitivity analysis results indicated that the increment and decrement percentage values were identical across all impact categories. This behavior illustrates a linear system with boundaries between environmental impact and electricity consumption. The relative ranking remained consistent, despite significant variations in the absolute values for the reduced and increased electricity scenarios. In both the base scenario and the reduced and increased scenarios, the emission ranking (base case, 100% electricity) remains unchanged. This confirms that the comparative conclusions of the study are robust, even when electricity demand undergoes reasonable fluctuations. Therefore, the comparison between fiber systems remains constant, despite the fact that the absolute environmental impacts are based upon the amount of energy consumed, even if the consumption of electricity fluctuates by ±20%. Additionally, previous research by Ita-Nagy et al. [49] observed a similar trend, in which changes in electricity source and energy recovery assumptions led to moderate yet consistent variations across all impact categories. Specifically, altering the composition of electricity sources resulted in a variation of approximately 11–12% in global warming impacts, supporting the assumption that Life Cycle Assessment outcomes are linear and responsive to energy inputs.

4. Conclusions

In the current study, agricultural crop residues and agro-waste were used to extract natural fibers using the retting process. Flax, jute, kenaf, and bagasse fibers were treated with environmentally friendly sodium bicarbonate to modify their surfaces. Following eco-friendly treatment, these fibers were incorporated into a PLA matrix to fabricate natural fiber-reinforced PLA biocomposites. The life cycle assessment (LCA) of reinforced PLA biocomposites made with flax (scenario 1), jute (scenario 2), kenaf (scenario 3), and bagasse (scenario 4) was conducted using OpenLCA. The ReCiPe 2016 v1.03 midpoint (H) method was employed for the analysis, with “per kg” of manufactured biocomposite as a functional group. To assess the impact of natural fibers, treatment methods, and biocomposite fabrication, the same boundary conditions were applied to all fibers in the cradle-to-gate system. The boundary conditions included fiber extraction, fiber washing, fiber drying, fiber surface modification, biocomposite fabrication, energy consumption, water usage, waste generation, and wastewater. The results showed that the bagasse fiber-reinforced biocomposite had the highest overall emissions. However, the bagasse fiber-reinforced biocomposite had the lowest global warming potential. Among the six major impact categories studied (climate change, ecotoxicity: terrestrial, non-renewable fossil energy resources, human toxicity: carcinogenic, human toxicity: non-carcinogenic, and land use), the jute fiber reinforced biocomposite had the highest emissions. In terms of human toxicity, bagasse fibers have had the greatest impact. These observations primarily concerned fibers, and the factors that influence fiber-related emissions include crop cultivation conditions, pesticide use, land use, and fertilizer application. Furthermore, the majority of the contribution was allocated to electricity use, up to 69%. Electricity was generated from coal and other fossil fuels rather than renewable sources, and it can be reduced by using clean energy sources such as solar and wind. The sensitivity analysis was conducted for ±20% variations in electricity consumption relative to the baseline scenario. The results remain consistent for both decreased and increased electricity consumption scenarios, indicating system robustness and a linear relationship between environmental emissions and electricity consumption.
This study encompasses the LCA of PLA biocomposites reinforced with flax, bagasse, jute, and kenaf fibers, examining the effects of fiber cultivation, extraction, surface modification, biocomposite production, and energy consumption. This work can be enhanced by integrating additional natural fibers and employing fiber surface modification techniques. Additionally, industrial-grade natural fibers and surface modification techniques can be employed for LCA in conjunction with life cycle costing (LCC). Diverse fiber extraction methodologies are also employed for LCA and LCC. The LCA of these various methodologies can facilitate the production of low-emission, sustainable biocomposites by enabling the selection of suitable fibers, extraction techniques, fiber surface modifications, and cost reductions.


Author Contributions

Conceptualization, V.Y. and S.C.D.; methodology, V.Y. and S.C.D.; software, V.Y.; validation, A.D. and S.C.D.; formal analysis, V.Y.; investigation, V.Y.; resources, A.D.; data curation, V.Y.; writing—original draft preparation, V.Y.; writing—review and editing, A.D. and S.C.D.; visualization, V.Y., A.D. and S.C.D.; supervision, A.D.; project administration, A.D. All authors have read and agreed to the published version of the manuscript.

Funding

This research received no external funding.

Data Availability Statement

Data will be made available on request.

Conflicts of Interest

The authors declare no conflicts of interest.

References

  1. Dhilip, J.D.J.; Raghunathan, V.; Mohan, R.; Ayyappan, V.; Rangappa, S.M.; Siengchin, S. Mechanical and flammability properties of ultrasonically processed silane-treated areca-banana fiber-reinforced epoxy composites for lightweight applications. Biomass Convers. Biorefinery 2025, 15, 13693–13706. [Google Scholar] [CrossRef]
  2. Das, S.C.; Srivastava, C.; Grammatikos, S. Accelerated aging of natural fiber composites (NFCs), their fabrication methods, industrial applications, challenges, and future directions: An overview. J. Nat. Fibers 2025, 22, 2540480. [Google Scholar] [CrossRef]
  3. Raghunathan, V.; Gnanasekaran, S.; Ayyappan, V.; Devanathan, L.S.; Mavinkere Rangappa, S.; Sienghcin, S. Sustainable characterization of brake pads using raw/silane-treated Mimosa pudica fibers for automobile applications. Polym. Compos. 2024, 45, 10204–10219. [Google Scholar] [CrossRef]
  4. Arena, M.; Ambrogiani, P.; Raiola, V.; Bocchetto, F.; Tirelli, T.; Castaldo, M. Design and qualification of an additively manufactured manifold for aircraft landing gears applications. Aerospace 2023, 10, 69. [Google Scholar] [CrossRef]
  5. Tengsuthiwat, J.; Raghunathan, V.; Ayyappan, V.; Techawinyutham, L.; Srisuk, R.; Yorseng, K.; Rangappa, S.M.; Siengchin, S. Lignocellulose sustainable composites from agro-waste Asparagus bean stem fiber for polymer casting applications: Effect of fiber treatment. Int. J. Biol. Macromol. 2024, 278, 134884. [Google Scholar] [CrossRef]
  6. Devadiga, D.G.; Bhat, K.S.; Mahesha, G. Sugarcane bagasse fiber reinforced composites: Recent advances and applications. Cogent Eng. 2020, 7, 1823159. [Google Scholar] [CrossRef]
  7. Asoodeh, F.; Aghvami-Panah, M.; Salimian, S.; Naeimirad, M.; Khoshnevis, H.; Zadhoush, A. The effect of fibers’ length distribution and concentration on rheological and mechanical properties of glass fiber–reinforced polypropylene composite. J. Ind. Text. 2022, 51, 8452S–8471S. [Google Scholar] [CrossRef]
  8. Yadav, V.; Singh, S. A comprehensive review of natural fiber composites: Applications, processing techniques and properties. Mater. Today Proc. 2022, 56, 2537–2542. [Google Scholar] [CrossRef]
  9. de Azevedo, A.R.; Cruz, A.S.; Marvila, M.T.; de Oliveira, L.B.; Monteiro, S.N.; Vieira, C.M.F.; Fediuk, R.; Timokhin, R.; Vatin, N.; Daironas, M. Natural fibers as an alternative to synthetic fibers in reinforcement of geopolymer matrices: A comparative review. Polymers 2021, 13, 2493. [Google Scholar] [CrossRef]
  10. Khan, T.; Sebaey, T.A.; Muthukumar, C.; Rao, H.I.; Shahroze, R.M.; Parthasarathy, V. Prediction of the tensile properties of biocomposites: A review of micro-mechanical models. Biomass Convers. Biorefinery 2025, 15, 13123–13141. [Google Scholar] [CrossRef]
  11. Das, S.C.; La Rosa, A.D.; Grammatikos, S.A. Life cycle assessment of plant fibers and their composites. In Plant Fibers, Their Composites, and Applications; Elsevier: Amsterdam, The Netherlands, 2022; pp. 457–484. [Google Scholar]
  12. Sanjay, M.; Siengchin, S.; Parameswaranpillai, J.; Jawaid, M.; Pruncu, C.I.; Khan, A. A comprehensive review of techniques for natural fibers as reinforcement in composites: Preparation, processing and characterization. Carbohydr. Polym. 2019, 207, 108–121. [Google Scholar] [CrossRef]
  13. Das, S.C.; La Rosa, A.D.; Goutianos, S.; Grammatikos, S.A. Flax fibers, their composites and application. In Plant Fibers, Their Composites, and Applications; Elsevier: Amsterdam, The Netherlands, 2022; pp. 209–232. [Google Scholar]
  14. Sanjay, M.; Madhu, P.; Jawaid, M.; Senthamaraikannan, P.; Senthil, S.; Pradeep, S. Characterization and properties of natural fiber polymer composites: A comprehensive review. J. Clean. Prod. 2018, 172, 566–581. [Google Scholar] [CrossRef]
  15. Nayak, S.; Rout, P.K.; Jena, P.K. Investigation of mechanical, thermal and morphological properties of rattan fiber-reinforced polymer composites to produce lightweight material for automotive industries. Therm. Adv. 2025, 2, 100014. [Google Scholar] [CrossRef]
  16. Wagh, J.P.; Malagi, R.R.; Madgule, M. Investigative studies on natural fiber reinforced composites for automotive bumper beam applications. J. Reinf. Plast. Compos. 2025, 44, 2524–2534. [Google Scholar] [CrossRef]
  17. Yadav, V.; Singh, S.; Rajput, V.S.; Sharma, B. development and characterization of PLA based bio-polymer for bio-medical applications. In Advanced Materials for Biomedical Applications: Development and Processing; Springer: Berlin/Heidelberg, Germany, 2023; pp. 225–235. [Google Scholar]
  18. Yadav, V.; Singh, S. Advanced flame-retardant poly-lactic acid biocomposites reinforced with eco-friendly electroless coated fibers: Performance evaluation of thermal, mechanical, and water absorption properties. Int. J. Biol. Macromol. 2025, 327, 147308. [Google Scholar] [CrossRef] [PubMed]
  19. Kumar, K.S.; Singh, I. Sustainable oxalic acid treatment of lignocellulosic fibers for ensuring improved performance of treated fibers based bio PBS composites. Int. J. Biol. Macromol. 2025, 294, 139507. [Google Scholar] [CrossRef]
  20. Chaitanya, S.; Singh, I. Sisal fiber-reinforced green composites: Effect of ecofriendly fiber treatment. Polym. Compos. 2018, 39, 4310–4321. [Google Scholar] [CrossRef]
  21. Yadav, V.; Singh, S.; Singh, S.; Powar, S. Life cycle assessment of chemically treated and copper coated sustainable biocomposites. Sci. Total Environ. 2024, 948, 174474. [Google Scholar] [CrossRef]
  22. Grubb, C.A.; Kardos, M.; Mokhtarnejad, M.; Henken, W.J.; Chen, J.; Michaud, J.; Keffer, D.J.; Jin, M.; Mainka, H.; Harper, D.P. Life cycle assessment of paper-based composites as replacement for an injection Molded polypropylene automotive door component. Sustain. Mater. Technol. 2025, 46, e01725. [Google Scholar] [CrossRef]
  23. Balcioglu, G.; Fitzgerald, A.M.; Rodes, F.A.; Allen, S.R. Data quality and uncertainty assessment of life cycle inventory data for composites. Compos. Part B Eng. 2025, 292, 112021. [Google Scholar] [CrossRef]
  24. Wasti, S.; Kamath, D.; Armstrong, K.; Clarkson, C.; Tekinalp, H.; Ozcan, S.; Vaidya, U. Life cycle assessment of coir fiber-reinforced composites for automotive applications. J. Clean. Prod. 2024, 485, 144368. [Google Scholar] [CrossRef]
  25. Yadav, V.; Singh, S. Eco-friendly surface treatment of biowaste fibers for sustainable biocomposites manufacturing: A life cycle assessment-based alternative to chemical processing. J. Clean. Prod. 2025, 535, 147107. [Google Scholar] [CrossRef]
  26. Sun, W.; Liang, B. Life Cycle Assessment of Pyrolysis Carbonization and Application Processes of Sugarcane Bagasse. BioEnergy Res. 2026, 19, 28. [Google Scholar] [CrossRef]
  27. Xu, J.; Kang, A.; Wu, Z.; Kou, C.; Zhang, Y.; Xiao, P. Crack resistance and environmental benefits of recycled aggregate asphalt mixture reinforced with waste chopped fibers of different types and characteristic parameters: An analysis of fracture evolution and life cycle assessment. Constr. Build. Mater. 2026, 513, 145461. [Google Scholar] [CrossRef]
  28. Bianchi, I.; Forcellese, A.; Taha, I. Comparative LCA of fully biobased and synthetic polymer composites accounting for fiber treatment. J. Clean. Prod. 2025, 530, 146846. [Google Scholar] [CrossRef]
  29. Soto-Barrera, V.C.; Begambre-González, F.; Vellojín-Muñoz, K.E.; Fernandez-Hoyos, D.F.; Torres-Bejarano, F.M. Life cycle assessment of biocomposite production in development stage from coconut fiber utilization. Sustainability 2025, 17, 8338. [Google Scholar] [CrossRef]
  30. Arya, M.; Skrifvars, M.; Khalili, P. Performance and life cycle assessment of composites reinforced with natural fibers and end-of-life textiles. J. Compos. Sci. 2024, 8, 196. [Google Scholar] [CrossRef]
  31. Gonzalez, V.; Lou, X.; Chi, T. Evaluating environmental impact of natural and synthetic fibers: A life cycle assessment approach. Sustainability 2023, 15, 7670. [Google Scholar] [CrossRef]
  32. Seile, A.; Spurina, E.; Sinka, M. Reducing global warming potential impact of bio-based composites based of LCA. Fibers 2022, 10, 79. [Google Scholar] [CrossRef]
  33. Chaitanya, S.; Singh, I. Ecofriendly treatment of aloe vera fibers for PLA based green composites. Int. J. Precis. Eng. Manuf.-Green Technol. 2018, 5, 143–150. [Google Scholar] [CrossRef]
  34. Yadav, V.; Singh, S.; Garg, M.P.; Akhai, S. Effect of natural Sapindus mukorossi treatment process on bio-waste bagasse fibers for biocomposite fabrication and application purposes. Ind. Crops Prod. 2024, 219, 119066. [Google Scholar] [CrossRef]
  35. ISO 14040; Environmental Management—Life Cycle Assessment—Principles and Framework. ISO: Geneva, Switzerland, 2006.
  36. ISO 14044; Environmental Management—Life Cycle Assessment—Requirements and Guidelines. ISO: Geneva, Switzerland, 2006.
  37. An, D.; Na, J.; Song, J.; Jung, J. Size-dependent chronic toxicity of fragmented polyethylene microplastics to Daphnia magna. Chemosphere 2021, 271, 129591. [Google Scholar] [CrossRef]
  38. Feng, Q.; Wang, Y.; Xia, Z.; Xu, X.; Wang, L. Carbon footprint evaluation of cellulosic fiber textile and garment. Cellulose 2025, 32, 2889–2900. [Google Scholar] [CrossRef]
  39. Summerscales, J.; Dissanayake, N.P. Allocation in the life cycle assessment (LCA) of flax fibres for the reinforcement of composites. In Advances in Natural Fibre Composites: Raw Materials, Processing and Analysis; Springer: Berlin/Heidelberg, Germany, 2017; pp. 223–235. [Google Scholar]
  40. Gorrepotu, S.R.; Debnath, K.; Mahapatra, R.N. Life cycle assessment of surface-modified fiber–reinforced composites. In Surface Modification and Coating of Fibers, Polymers, and Composites; Elsevier: Amsterdam, The Netherlands, 2025; pp. 543–562. [Google Scholar]
  41. Yadav, R.; Sugha, A.; Bhatti, M.S.; Kansal, S.K.; Sharma, S.K.; Mandal, T.K. The role of particulate matter in reduced visibility and anionic composition of winter fog: A case study for Amritsar city. RSC Adv. 2022, 12, 11104–11112. [Google Scholar] [CrossRef] [PubMed]
  42. Clement, E.; Bravin, M.N.; Avadi, A.; Doelsch, E. Experimental evaluation of zinc and copper terrestrial ecotoxicity prediction by life cycle assessment in agricultural recycling of livestock effluent. Environ. Sci. Technol. 2025, 59, 4122–4132. [Google Scholar] [CrossRef] [PubMed]
  43. Poranek, N.; Pikoń, K.; Generowicz-Caba, N.; Mańka, M.; Kulczycka, J.; Marinis, D.; Farsari, E.; Amanatides, E.; Lewandowska, A.; Sajdak, M. Comparative LCA analysis of selected recycling methods for carbon fibers and socio-economic analysis. Materials 2025, 18, 2660. [Google Scholar] [CrossRef]
  44. Liu, S.; Liu, J.; Gao, Y.; Xi, B.; Chen, Z.; Chang, S.; Gao, S.; Zhao, G.; Weng, X.; Jia, L. Plantation model of soapberry (Sapindus mukorossi Gaertn.) in Southeast China in relation to environmental impact effect based on a life cycle assessment. BioEnergy Res. 2022, 15, 1342–1354. [Google Scholar] [CrossRef]
  45. Moyaert, C.; Fozer, D.; Kovacs, A.; Nimmegeers, P.; Billen, P. Prospective life cycle assessment of end-of-life pathways for polylactic acid: Evaluating environmental trade-offs and technology learning potential. Sustain. Prod. Consum. 2026, 64, 15–36. [Google Scholar] [CrossRef]
  46. Quintana, A.; Alba, J.; Del Rey, R.; Guillén-Guillamón, I. Comparative Life Cycle Assessment of gypsum plasterboard and a new kind of bio-based epoxy composite containing different natural fibers. J. Clean. Prod. 2018, 185, 408–420. [Google Scholar] [CrossRef]
  47. Firdaus, R.; Harun, S.N.; Hanafiah, M.M.; Nasri, N.F. Evaluating bioenergy pathways for sustainable rice straw utilization in Malaysia: A life cycle perspective. Resour. Conserv. Recycl. 2026, 229, 108831. [Google Scholar] [CrossRef]
  48. Ramesh, M.; Deepa, C.; Kumar, L.R.; Sanjay, M.; Siengchin, S. Life-cycle and environmental impact assessments on processing of plant fibres and its bio-composites: A critical review. J. Ind. Text. 2022, 51, 5518S–5542S. [Google Scholar] [CrossRef]
  49. Ita-Nagy, D.; Vázquez-Rowe, I.; Kahhat, R.; Quispe, I.; Chinga-Carrasco, G.; Clauser, N.M.; Area, M.C. Life cycle assessment of bagasse fiber reinforced biocomposites. Sci. Total Environ. 2020, 720, 137586. [Google Scholar] [CrossRef]
Figure 1. Life cycle of natural fiber-reinforced biocomposites.
Jcs 10 00228 g001
Figure 2. Flax fibers and flax/PLA biocomposites (a), jute fibers and jute/PLA biocomposites (b), kenaf fibers and kenaf/PLA biocomposites (c) and bagasse fibers and bagasse/PLA biocomposites (d).
Jcs 10 00228 g002
Figure 3. LCA boundary conditions for: (A1) fiber extraction, (A2) eco-friendly treatment, (B) PLA, and (C) biocomposite manufacturing.
Jcs 10 00228 g003
Figure 4. Impact assessment of all four fibers for: (a) climate change, (b) ecotoxicity: terrestrial, (c) energy resources: non-renewable, (d) human toxicity: carcinogenic, (e) human toxicity: non-carcinogenic, and (f) land use.
Jcs 10 00228 g004
Figure 5. Contribution percentage on impact categories comparison for: (a) flax fiber biocomposites, (b) jute fiber biocomposites, (c) kenaf fiber biocomposites, and (d) bagasse fiber biocomposites.
Jcs 10 00228 g005
Figure 6. Sensitivity analysis for electricity consumption.
Jcs 10 00228 g006
Table 1. Existing LCA studies of natural fiber-reinforced biocomposites.
Author/YearFiber UsedLife System BoundaryLCA MethodLCA Focus
Sun and Liang (2026) [26]BagasseCradle-to-graveCML 2001, GWP 100LCA focuses on the carbon-negative potential of bagasse-derived biochar and investigates environmental trade-offs across multiple impact categories, and incorporates sensitivity and uncertainty analyses.
Xu et al. (2026) [27]Basalt, polyesterCradle-to-graveCumulative Energy Demand, GWP 100The LCA uses a performance-integrated approach to assess the environmental benefits of fiber-reinforced recycled asphalt mixtures, which improve fracture energy and crack resistance, extend service life and reduce maintenance.
Bianchi et al. (2025) [28]Flax, glassCradle-to-graveCumulative Energy Demand, ReCiPe Midpoint (H)Performed an LCA to evaluate conventional and bio-based composites produced through vacuum-assisted infusion and injection molding techniques.
Soto-Barrera et al. (2025) [29]Coconut (coir)Cradle-to-gateIPCC 2021 GWP 100, ReCiPe midpoint (H)Conducted LCA on coconut fiber-reinforced polyester composites with six different fiber weight percentages ranging from 2 to 30%.
Arya et al. (2024) [30]FlaxCradle-to-gateReCiPe midpoint (E)Performance and LCA of recycled polyester and polyamide in flax fabric composites to reduce waste in the textile industry.
Gonzalez et al. (2023)
[31]
Jute, flax, silk, organic cotton, traditional cotton, and polyesterCradle-to-gateReCiPe Midpoint (I)Conducted LCA to analyze the impact of six fibers on the environment.
Seile et al. (2022) [32]Hemp, flaxCradle-to-gateCML-IA-baseline Analyzes various nitrogen fertilization scenarios for flax and hemp cultivation. Additionally, it contrasts the environmental impact of FRPCs and traditional polyamide composites in automotive applications.
Table 2. Labeling of manufactured biocomposites along with LCA scenarios.
BiocompositesLabelLCA Scenarios
Flax/PLAF/PLAScenario 1
Jute/PLAJ/PLAScenario 2
Kenaf/PLAK/PLAScenario 3
Bagasse/PLAB/PLAScenario 4
Table 3. LCI for fiber extraction.
Input
MaterialUnitValueReferenceHypothesis
Flax/Jute/Kenaf/Bagassekg4Ecoinvent v3.11For natural fibers, the respective harvested plants were modeled.
Tap Water (retting)l100Ecoinvent v3.11Indian municipal water was presumed.
Tap Water (washing)l50Ecoinvent v3.11Indian municipal water was presumed.
Electricity, low voltage (chopping for 0.42 h)kWh1.05Ecoinvent v3.11The Northern Indian electrical grid supply was used.
Electricity, low voltage (drying, air oven for 6 h at 70 °C)kWh16.2Ecoinvent v3.11The Northern Indian electrical grid supply was used.
Transportationtkm0.48Ecoinvent v3.11A light commercial vehicle was modeled for transportation.
Output
MaterialUnitValueReferenceHypothesis
Chopped Flax/Jute/Kenaf/Bagasse fiberskg1ProcessFunctional output
Waste
Waste (biowaste, garden waste)kg2Ecoinvent v3.11Garden waste was generated during chopping and fiber cleaning.
Wastewater (unpolluted)l150Ecoinvent v3.11Water only contains surface impurities.
Table 4. LCI for eco-friendly treatment of fibers.
Input
MaterialUnitValueReferenceHypothesis
Chopped Flax/Jute/Kenaf/Bagasse fiberskg1ProcessAssume as input the output of Table 2.
Sodium bicarbonatekg3Ecoinvent v3.11NaHCO3 was considered an industrial-grade material for fiber treatment, sourced from the global market.
Tap Water (eco-friendly solution)l30Ecoinvent v3.11Indian municipal water was presumed.
Tap Water (washing)l70Ecoinvent v3.11Indian municipal water was presumed.
Electricity, low voltage (drying, air oven for 6 h at 70 °C)kWh16.2Ecoinvent v3.11The Northern Indian electrical grid supply was used.
Output
MaterialUnitValueReferenceHypothesis
Eco-friendly treated Flax/Jute/Kenaf/Bagasse fiberskg1ProcessFunctional output
Waste
Wastewater (unpolluted)l70Ecoinvent v3.11Water only contains surface impurities
Wastewater (starch waste)l30Ecoinvent v3.11Water contains lignin, pectin, and hemicellulose.
Table 5. LCI for transported and dried PLA.
Input
MaterialUnitValueReferenceHypothesis
PLAkg3Ecoinvent v3.11PLA data model for the PLA granulates global market.
Transportationtkm0.59Ecoinvent v3.11A light commercial vehicle was modeled for transportation.
Electricity, low voltage (drying, air oven for 5 h at 50 °C)kWh13.2Ecoinvent v3.11The Northern Indian electrical grid supply was used.
Output
MaterialUnitValueReferenceHypothesis
Transported and dried PLAkg4ProcessFunctional output
Table 7. Environmental impacts produced by “per kg” of flax fiber-reinforced PLA biocomposites.
Impact CategoryTotal ResultTreatmentPLAElectricity
AT4.971 × 10−22.324 × 10−21.561 × 10−21.086 × 10⁻²
CC1.281 × 1014.958 × 1004.296 × 1003.557 × 100
ETF6.776 × 10−13.335 × 10−12.270 × 10−11.171 × 10⁻¹
ETM9.299 × 10−14.557 × 10−13.098 × 10−11.644 × 10⁻¹
ETT6.105 × 1012.832 × 1012.654 × 1016.196 × 100
ERNR3.193 × 1001.203 × 1001.092 × 1008.969 × 10−1
EPF9.913 × 10−33.999 × 10−32.445 × 10−33.470 × 10⁻³
EPM2.677 × 10−31.008 × 10−31.451 × 10−32.180 × 10⁻⁴
HTC1.922 × 1009.210 × 10−15.836 × 10−14.172 × 10−1
HTNC1.842 × 1018.047 × 1005.240 × 1005.134 × 100
IR3.959 × 10−11.315 × 10−11.785 × 10−18.601 × 10⁻²
LU1.767 × 1001.836 × 10−11.530 × 1005.370 × 10−2
MRM7.459 × 10−23.631 × 10−23.225 × 10−26.038 × 10⁻³
OD1.293 × 10−53.556 × 10−68.480 × 10−68.895 × 10⁻⁷
PMF2.901 × 10−21.220 × 10−28.065 × 10−38.743 × 10⁻³
PFHH3.078 × 10−21.242 × 10−21.065 × 10−27.712 × 10⁻³
PFTE3.162 × 10−21.265 × 10−21.119 × 10−27.783 × 10⁻³
WU2.404 × 10−11.188 × 10−11.034 × 10−11.822 × 10⁻²
Table 8. Environmental impacts produced by “per kg” of jute fiber-reinforced PLA biocomposites.
Impact CategoryTotal ResultTreatmentPLAElectricity
AT5.257 × 10−22.610 × 10−21.561 × 10−21.086 × 10⁻²
CC1.290 × 1015.049 × 1004.296 × 1003.557 × 100
ETF6.900 × 10−13.459 × 10−12.270 × 10−11.171 × 10⁻¹
ETM9.500 × 10−14.758 × 10−13.098 × 10−11.644 × 10⁻¹
ETT6.327 × 1013.054 × 1012.654 × 1016.196 × 100
ERNR3.202 × 1001.213 × 1001.092 × 1008.969 × 10−1
EPF1.222 × 10−26.306 × 10−32.445 × 10−33.470 × 10⁻³
EPM3.094 × 10−31.425 × 10−31.451 × 10−32.180 × 10⁻⁴
HTC1.923 × 1009.226 × 10−15.836 × 10−14.172 × 10−1
HTNC1.787 × 1017.495 × 1005.240 × 1005.134 × 100
IR3.965 × 10−11.320 × 10−11.785 × 10−18.601 × 10⁻²
LU2.112 × 1005.286 × 10−11.530 × 1005.370 × 10−2
MRM7.526 × 10−23.697 × 10−23.225 × 10−26.038 × 10⁻³
OD1.389 × 10−54.520 × 10−68.480 × 10−68.895 × 10⁻⁷
PMF2.939 × 10−21.258 × 10−28.065 × 10−38.743 × 10⁻³
PFHH3.080 × 10−21.244 × 10−21.065 × 10−27.712 × 10⁻³
PFTE3.165 × 10−21.268 × 10−21.119 × 10−27.783 × 10⁻³
WU1.939 × 10−17.227 × 10−21.034 × 10−11.822 × 10⁻²
Table 9. Environmental impacts produced by “per kg” of kenaf fiber-reinforced PLA biocomposites.
Impact CategoryTotal ResultTreatmentPLAElectricity
AT4.833 × 10−22.186 × 10−21.561 × 10−21.086 × 10⁻²
CC1.276 × 1014.908 × 1004.296 × 1003.557 × 100
ETF6.741 × 10−13.300 × 10−12.270 × 10−11.171 × 10⁻¹
ETM9.274 × 10−14.532 × 10−13.098 × 10−11.644 × 10⁻¹
ETT6.132 × 1012.859 × 1012.654 × 1016.196 × 100
ERNR3.183 × 1001.194 × 1001.092 × 1008.969 × 10−1
EPF9.953 × 10−34.038 × 10−32.445 × 10−33.470 × 10⁻³
EPM2.350 × 10−36.808 × 10−41.451 × 10−32.180 × 10⁻⁴
HTC1.914 × 1009.133 × 10−15.836 × 10−14.172 × 10−1
HTNC1.814 × 1017.766 × 1005.240 × 1005.134 × 100
IR3.957 × 10−11.312 × 10−11.785 × 10−18.601 × 10⁻²
LU1.887 × 1003.033 × 10−11.530 × 1005.370 × 10−2
MRM7.376 × 10−23.548 × 10−23.225 × 10−26.038 × 10⁻³
OD1.194 × 10−52.568 × 10−68.480 × 10−68.895 × 10⁻⁷
PMF2.893 × 10−21.212 × 10−28.065 × 10−38.743 × 10⁻³
PFHH3.041 × 10−21.205 × 10−21.065 × 10−27.712 × 10⁻³
PFTE3.125 × 10−21.228 × 10−21.119 × 10−27.783 × 10⁻³
WU2.124 × 10−19.083 × 10−21.034 × 10−11.822 × 10⁻²
Table 10. Environmental impacts produced by “per kg” of bagasse fiber-reinforced PLA biocomposites.
Impact CategoryTotal ResultTreatmentPLAElectricity
AT4.783 × 10−22.136 × 10−21.561 × 10−21.086 × 10⁻²
CC1.272 × 1014.862 × 1004.296 × 1003.557 × 100
ETF6.840 × 10−13.400 × 10−12.270 × 10−11.171 × 10⁻¹
ETM9.299 × 10−14.557 × 10−13.098 × 10−11.644 × 10⁻¹
ETT6.273 × 1012.999 × 1012.654 × 1016.196 × 100
ERNR3.183 × 1001.193 × 1001.092 × 1008.969 × 10−1
EPF9.920 × 10−34.005 × 10−32.445 × 10−33.470 × 10⁻³
EPM2.102 × 10−34.330 × 10−41.451 × 10−32.180 × 10⁻⁴
HTC1.917 × 1009.166 × 10−15.836 × 10−14.172 × 10−1
HTNC1.903 × 1018.657 × 1005.240 × 1005.134 × 100
IR3.951 × 10−11.307 × 10−11.785 × 10−18.601 × 10⁻²
LU1.811 × 1002.268 × 10−11.530 × 1005.370 × 10−2
MRM7.428 × 10−23.600 × 10−23.225 × 10−26.038 × 10⁻³
OD1.158 × 10−52.215 × 10−68.480 × 10−68.895 × 10⁻⁷
PMF2.870 × 10−21.189 × 10−28.065 × 10−38.743 × 10⁻³
PFHH3.034 × 10−21.198 × 10−21.065 × 10−27.712 × 10⁻³
PFTE3.119 × 10−21.221 × 10−21.119 × 10−27.783 × 10⁻³
WU1.850 × 10−16.339 × 10−21.034 × 10−11.822 × 10⁻²
Disclaimer/Publisher’s Note: The statements, opinions and data contained in all publications are solely those of the individual author(s) and contributor(s) and not of MDPI and/or the editor(s). MDPI and/or the editor(s) disclaim responsibility for any injury to people or property resulting from any ideas, methods, instructions or products referred to in the content.