Article

Stochastic Optimization of Quality Assurance Systems in Manufacturing: Integrating Robust and Probabilistic Models for Enhanced Process Performance and Product Reliability

by
Kehinde Afolabi
1,
Busola Akintayo
2,3,
Olubayo Babatunde
2,3,*,
Uthman Abiola Kareem
4,
John Ogbemhe
5,
Desmond Ighravwe
2,3 and
Olanrewaju Oludolapo
3
1
Department of Information Technology, Western Governors University, 4001 S 700 E #300, Millcreek, UT 84107, USA
2
Department of Industrial Engineering, Durban University of Technology, Durban 4000, South Africa
3
Institute of Systems Science, Durban University of Technology, Durban 4000, South Africa
4
Department of Industrial and Systems Engineering, University of Texas at Arlington, Arlington, TX 76019, USA
5
Department of Systems Engineering, University of Lagos, Akoka 100213, Nigeria
*
Author to whom correspondence should be addressed.
J. Manuf. Mater. Process. 2025, 9(8), 250; https://doi.org/10.3390/jmmp9080250
Submission received: 17 May 2025 / Revised: 18 July 2025 / Accepted: 19 July 2025 / Published: 23 July 2025

Abstract

This research integrates stochastic optimization techniques with robust modeling and probabilistic modeling approaches to enhance photovoltaic cell manufacturing processes and product reliability. The study employed an adapted genetic algorithm to tackle uncertainties in the manufacturing process, resulting in improved operational efficiency. It consistently achieved optimal fitness, with values remaining at 1.0 over 100 generations. The model displayed a dynamic convergence rate, demonstrating its ability to adjust performance in response to process fluctuations. The system preserved resource efficiency by utilizing approximately 2600 units per generation, while minimizing machine downtime to 0.03%. Product reliability reached an average level of 0.98, with a maximum value of 1.02, indicating enhanced consistency. The manufacturing process achieved better optimization through a significant reduction in defect rates, which fell to 0.04. The objective function value fluctuated between 0.86 and 0.96, illustrating how the model effectively managed conflicting variables. Sensitivity analysis revealed that changes in sigma material and lambda failure had a minimal effect on average reliability, which stayed above 0.99, while average defect rates remained below 0.05. This research exemplifies how stochastic, robust, and probabilistic optimization methods can collaborate to enhance manufacturing system quality assurance and product reliability under uncertain conditions.

1. Introduction

Manufacturing operations heavily rely on quality assurance (QA) to ensure that products meet necessary performance standards, safety requirements, and reliability benchmarks [1]. The system enables early defect identification, resulting in the delivery of high-quality products to customers. The systems track production processes to achieve standardization and reduce variations that impact the product quality. The automotive and electronics industries require this practice because their products need to maintain consistent performance levels [2,3]. QA systems detect production issues during the early stages of the manufacturing cycle, which prevents additional rework and scrap production [4]. The implementation leads to financial savings, along with improved resource management. The process ensures that manufactured products comply with industry regulations and safety standards, thereby reducing potential risks and protecting both consumers and manufacturers from legal liabilities. Manufacturing operations that integrate strong QA systems achieve both superior product quality and operational efficiency, which leads to enduring market success.
The current manufacturing industry faces numerous production challenges that impact both operational efficiency and product quality. The variability of raw materials creates inconsistent outcomes in finished products [5]. The natural deterioration of machines leads to unanticipated equipment breakdowns, which cause production stoppages [6]. The production process becomes variable because workers make mistakes, and their skill differences lead to inconsistent results [7,8]. The uncertainties present in production processes make traditional deterministic methods inadequate for optimizing manufacturing operations. Optimizing uncertainties requires stochastic techniques. Models that include randomness enable the generation of stronger solutions that adjust to material quality variations, machine performance fluctuations, and human input variations [9]. The implementation of these techniques leads to better decision-making because they generate dependable results when manufacturing systems exhibit natural variability. The implementation of stochastic methods remains essential for enhancing manufacturing productivity and product consistency in addressing current industry challenges.
The decision-making processes of photovoltaic (PV) cell production are enhanced by stochastic optimization, as it enables effective management of uncertainty. The output of PV cells faces significant impacts from raw material variations, machine performance fluctuations, and environmental conditions, which affect both product quality and efficiency [10]. The manufacturing process of PV cells is affected by fluctuations in raw material quality due to inconsistent supply sources and environmental changes. Stochastic optimization allows the creation of adaptable control systems that handle process variations to maintain production stability while producing high-quality results in uncertain conditions [11]. The implementation results in better process dependability and manufacturing output. The production of PV technology depends on worldwide supply networks to deliver silicon materials. Stochastic optimization serves as a critical tool for controlling uncertainties that stem from supply lead time variability, solar cell market demand fluctuations, and market environment changes [12]. The models maximize inventory management and production planning to achieve efficient and timely component delivery. The manufacturing process of PV cells experiences fluctuations in processing durations, together with variations in the available workforce. Stochastic optimization allows scheduling adjustments for real-time optimization of production output and cost management to minimize downtime [13]. The implementation of stochastic optimization in PV cell manufacturing reduces manufacturing uncertainties, leading to improved efficiency, reduced waste production, and more reliable products. The improved manufacturing process, facilitated by stochastic optimization, results in decreased costs and enhanced sustainability in renewable energy production.
Modern manufacturing environments face major difficulties when trying to achieve consistent product quality and reliability. QA systems face major complexity from inherent uncertainties because raw materials vary, machines behave differently, and humans make mistakes [14]. Raw material quality tends to fluctuate because of environmental conditions, together with inconsistent sourcing practices, which produce unpredictable results in the final product [15]. Machine performance remains difficult to predict because equipment degradation, combined with varying maintenance schedules and operational conditions, leads to operational disruptions [16]. The manufacturing process becomes more complex because human mistakes, together with changes in worker performance, create additional variability [17]. The unpredictable nature of these factors makes traditional QA methods struggle to maintain optimal performance throughout the production line.
Current process optimization approaches lack sufficient capability to handle these system complexities. These methods cannot track raw material variations, machine behavior patterns, and human performance fluctuations, which produce inefficiencies, inconsistent product quality, and suboptimal decisions [18]. Current methods operate inflexibly because they cannot adjust automatically to real-time modifications, which prevents them from fulfilling modern manufacturing requirements. Current models do not accurately implement uncertainty analysis in a manner that is both actionable and comprehensive for manufacturing applications. Most models either oversimplify these uncertainties or provide solutions that lack the flexibility needed to address real-world challenges [19]. The lack of strong modelling requires new frameworks that can properly handle uncertainty. This research develops a powerful framework that combines stochastic optimization with strong models and probabilistic models to solve these problems. The research integrates these elements to boost process performance and product reliability while enabling manufacturing QA systems to adapt their operations to uncertain conditions in practical applications.

2. Literature Review

2.1. Traditional Quality Assurance Methods

Traditional QA methods, including Statistical Process Control (SPC), Six Sigma, and Lean Manufacturing, have been used extensively in manufacturing to guarantee product quality and enhance processes [1]. Nevertheless, despite their extensive usage, these conventional approaches have major drawbacks in managing uncertainties and stochastic variations in current production environments. SPC has been a cornerstone in quality management, depending on control charts to check the stability of a process and identify any deviations from predetermined limits [20]. SPC is useful for detecting problems in stable processes, but it has limitations when dealing with stochastic variations, such as unexpected changes in raw material quality or machine behavior [21]. SPC assumes that the process is stationary and does not work well in dynamic environments where uncertainties change frequently [22]. Six Sigma, another widely used QA methodology, aims at reducing process defects through the identification and elimination of sources of variation [23]. Six Sigma offers a systematic approach to quality improvement, but it depends heavily on historical data for quality prediction and management, which makes it not very effective in dealing with real-time stochastic variations [24]. In the context of raw material variability and machine performance uncertainties, Six Sigma has difficulties in ensuring product reliability and consistency under changing conditions [25]. Lean Manufacturing, which seeks to reduce waste and enhance efficiency, focuses on optimizing resource utilization [26]. However, it tends to overlook uncertainties and stochastic factors, as it primarily focuses on standardizing processes for cost reduction rather than adaptive optimization [27]. While it can result in efficiency improvements, Lean’s inability to dynamically respond to variability makes it less applicable to highly unpredictable manufacturing environments. These traditional QA methods are inadequate for modern manufacturing because they cannot correctly address uncertainties and stochastic variations, which suggests the need for more dynamic and flexible approaches to address these challenges.

2.2. Stochastic Optimization in Manufacturing

Manufacturers now widely utilize stochastic optimization to manage production uncertainties due to its modeling capabilities. The framework enables optimal decision-making for situations characterized by variability, which modern manufacturing systems commonly experience. The literature presents multiple stochastic optimization applications, which include production planning, inventory control, and maintenance scheduling [11,13,28,29]. The application of stochastic optimization in production planning helps organizations manage demand uncertainties, together with lead time uncertainties and production capacity uncertainties [30]. Inventory control systems that use stochastic models help manufacturers optimize their stock levels to prevent both stockouts and overstocking, which result in high costs [31]. Stochastic optimization techniques have improved maintenance scheduling by allowing predictive models to forecast equipment failures, which enables proactive scheduling to reduce downtime and increase machine accessibility [13].
Traditional deterministic optimization methods demonstrate major difficulties when deployed in highly variable environments. The models function under the assumption of environmental stability, yet manufacturing operations experience unpredictable changes in raw material quality, machine performance, and demand levels. Deterministic methods generate unsuitable solutions when operating in uncertain settings [32]. The models generate suboptimal decisions because they do not respond to new information or system condition changes in real-time. Stochastic optimization overcomes existing model restrictions by delivering flexible adaptive solutions that improve system performance under uncertain conditions [33].

2.3. Robust Optimization Techniques

Robust optimization presents a mathematical framework that discovers both feasible and optimal solutions through uncertain input data [34]. Robust optimization differs from traditional optimization approaches because it focuses on maintaining solution effectiveness when input parameters show substantial uncertainty or variation. The main objective focuses on discovering adaptable solutions that demonstrate resilience against possible changes in essential parameters. Supply chain management utilizes robust optimization to create inventory policies that maintain stability against fluctuations in customer demand and supply lead times, and transportation delays [35]. Production systems benefit from robust optimization because it enables designers to create processes that maintain optimal performance throughout different uncertainty scenarios, thus minimizing the risks of both overproduction and stockouts [36]. Manufacturing industries have found robust optimization techniques to be highly beneficial for their QA systems. The optimization techniques establish optimal process parameters, including machine settings and inspection intervals, which maintain high product quality through fluctuations in raw materials and machine performance [37]. Manufacturing processes that implement these techniques achieve better reliability and efficiency, together with greater consistency in highly uncertain operational settings.

2.4. Probabilistic Models for Uncertainty

Manufacturing processes heavily rely on probabilistic models to represent and manage uncertainty. The models establish mathematical structures that capture production-related uncertainties and variabilities in raw material properties, machine performance, and environmental conditions [38]. The dependency modeling capability of Bayesian networks allows manufacturers to understand how different uncertain variables interact with each other [39]. Probability distribution functions (PDFs) serve as standard tools to quantify uncertainty in parameters such as failure rates and production yields, while providing a practical approach to handle variations [40]. Research has implemented probabilistic models to forecast both manufacturing product reliability and defects and failure rates. Bayesian methods serve to measure defect probabilities during high-precision manufacturing operations [41]. The implementation of probabilistic models allows manufacturers to evaluate how uncertainties affect product lifespan, which results in better reliability predictions [42]. Manufacturers who implement these models gain enhanced capabilities to forecast equipment failures and optimize their processes, resulting in the production of more products with fewer defects.

2.5. Integrated Models in QA Systems

Manufacturing systems are now receiving growing attention for their implementation of robust and probabilistic models, which enhance QA systems under uncertain conditions. Robust optimization together with probabilistic models creates a strong framework that enables manufacturing variability management to achieve consistent product quality [43]. Research conducted by Khakifirooz and Fathi [44] demonstrates how robust optimization techniques effectively minimize defects and optimize process parameters in semiconductor production and other industries under uncertain conditions. Bayesian networks, together with probabilistic distributions, serve to predict failures and defects, leading to valuable insights that enhance QA systems [45].
Numerous current studies on the integration of robust and probabilistic models concentrate on process variables, such as machine performance or material quality, and do not provide a holistic approach that combines these models with stochastic optimization techniques for broader QA system improvements. However, the literature reveals that there is a significant gap in methodologies that integrate stochastic optimization with robust and probabilistic models to address complex, interdependent uncertainties in large-scale manufacturing environments [46].

3. Materials and Methods

3.1. Stochastic Optimization Framework

The stochastic optimization model applied in this research aims to manage manufacturing process uncertainties. Process parameters show variability through probability distributions and random variables, which represent uncertainties such as machine failure, material variation, and environmental fluctuations. The framework includes modelling of uncertainties, which considers machine failure as well as material variation and environmental factors. Machine breakdown probabilities and performance degradation probabilities are modeled through Weibull distribution analysis [47,48].
The framework illustrated in Figure 1 demonstrates a robust stochastic optimization framework that improves manufacturing quality assurance specifically for PV cell production. The population initialization starts by generating potential solutions through the base and creator modules of the Distributed Evolutionary Algorithms in Python V 3.9.12 (DEAP) library. The evaluate function determines solution fitness through reliability assessment and defect rate calculation, using Monte Carlo simulations to model uncertainties in machine failure and material quality variation. The tools module from DEAP enables the execution of crossover, mutation, and selection operations in the Adaptive Genetic Algorithm (AGA). The genetic operators adjust their behavior according to population fitness levels to achieve optimal solution convergence. The uncertainty management system uses numpy for statistical simulations and random number generation to handle machine failure simulations and material quality variations. The AGA’s performance is evaluated through deterministic optimization comparisons implemented using the ‘scipy.optimize.minimize’ function. The optimization process gets its visual representation through matplotlib.pyplot, which displays reliability and defect rates and convergence rates across generations as key performance indicators.

3.2. Mathematical Formulation of the Model

The goal of the optimization model is to maximize product reliability and minimize defect rates. These objectives are balanced through the optimization process, taking into consideration the uncertainties within the system. The key decision variables in the optimization model are:
x 1 : production rate (units per hour).
x 2 : Inspection interval (time between inspections).
x 3 : Machine settings (e.g., temperature, speed).
These variables are important for controlling the manufacturing process and affecting product quality and reliability.
The objective function can be defined mathematically as shown in Equation (1). The goal is to maximize product reliability while minimizing defect rates. The function combines these goals with a penalty for defects.
Z x = α R x β D x
where:
R x is the product reliability, defined as the probability that a product will meet quality standards without defects.
D x is the defect rate, which represents the probability of product failure.
α and β are weighting factors that control the trade-off between reliability and defects.
The reliability function R x is modelled as shown in Equation (2).
R x = i = 1 n P q u a l i t y   s u c c e s s | x i
where P q u a l i t y   s u c c e s s | x i represents the probability of success given the decision variables x i , which vary with production rate, inspection intervals, and machine settings.
The defect rate function D x is defined as shown in Equation (3):
D x = 1 i = 1 n P q u a l i t y   s u c c e s s | x i
This function models the inverse of product quality, highlighting the likelihood of defects occurring due to process uncertainties.

3.2.1. Constraint

Several constraints must be satisfied to ensure the feasibility of the solution shown in Equations (4)–(6):
1.
The total cost of the manufacturing process cannot exceed the budget:
C x C m a x
where C x represents the cost associated with the manufacturing process, and C m a x is the maximum allowable cost.
2.
The production time must not exceed the available production window:
T x T m a x
where T x is the time required to complete the production process, and T m a x is the upper time limit for production.
3.
The manufacturing resources, such as materials and machinery, must be used efficiently and within their limits:
R x R m a x
where R x represents the resources used in production, and R m a x is the maximum available resources.

3.2.2. Uncertainty Models

The model uses stochastic processes, including Poisson distributions, to represent discrete events like machine failures because manufacturing processes contain natural uncertainties. The probability of machine failure over time t is modeled using the following Weibull distribution, as reported in Equation (7):
P f a i l u r e | t = 1 e x p λ t k k
where:
λ is the scale parameter.
t is the period of interest.
k is the shape parameter that dictates the nature of failure over time, t .
The model determines production cycle failure numbers and uses this uncertainty for decision-making purposes. Normal distribution models material property variations, such as tensile strength, when material variation exists. The probability of a material meeting the required quality standard is given by Equation (8):
P q u a l i t y   s u c c e s s | x i Φ M s p e c M a c t σ
where:
M s p e c is the specification limit (desired material property).
M a c t is the actual material property.
σ is the standard deviation of material variation.
Φ represents the cumulative distribution function of the standard normal distribution.

3.2.3. Optimization Problem

The overall optimization problem can now be written as described in Equation (9):
M a x i m i s e   Z x α i = 1 n P q u a l i t y   s u c c e s s | x i β 1 i = 1 n P q u a l i t y   s u c c e s s | x i
Subject to the constraints as described in Equation (10):
C x C m a x ,   T x T m a x ,   R x R m a x

3.3. Unique Variant of Genetic Algorithm

The Adaptive Genetic Algorithm (AGA) is used in this study to solve the stochastic optimization model. AGA is designed to manage the natural uncertainties of manufacturing processes by adjusting genetic parameters in real-time during the search process. This adaptation helps the algorithm to effectively explore and refine the solution space, addressing both local and global optimization challenges.
GA Steps:
  • Initialization:
The process begins with the creation of an initial population of solutions based on the decision variables. The variables, including process parameters and inspection intervals, represent different configurations of the manufacturing process. The initial population is generated randomly to achieve diverse solutions, which will be refined in subsequent steps.
  • Fitness Evaluation:
Each solution in the population is evaluated based on the objective function derived from the stochastic model. The objective function balances product reliability, defect rates, and cost. Each solution receives a score based on how well it meets these performance criteria, which provides a fitness value for each.
  • Selection, Crossover, and Mutation:
  • Selection: The best solutions are chosen for reproduction based on fitness.
    Crossover: Paired solutions exchange components to generate offspring.
    Mutation: Random changes are introduced to maintain diversity and avoid local optima.
  • Termination:
The algorithm stops running after a set number of generations or when solutions reach an optimal or near-optimal point.

3.4. Robust Optimization Approach

The robust optimization method is used to guarantee that the solution remains effective under different levels of uncertainty. This is important when dealing with uncertain process parameters like material quality, machine performance, and environmental conditions. There are three key aspects used in the robust optimization approach: Handling uncertainty, robust constraints, and minimizing risk. The method models uncertainties as uncertain parameters within the system, for example, raw material properties or machine failure rates. These parameters are treated as intervals or sets rather than fixed values. This flexibility ensures that the solution can adapt to variations that may occur during production. Robust constraints are introduced to safeguard against significant variations in process parameters. These constraints are designed to maintain consistent product quality across various possible scenarios. For instance, production rate constraints are modified to make sure that the solution remains feasible even under extreme variability in machine performance or raw material properties. Quality constraints are adjusted to ensure that the final product will always meet specifications, even if there are fluctuations in the manufacturing process. The robust optimization framework is focused on the worst-case scenario, where the manufacturing process is reliable and efficient even in the presence of uncertainty. This helps balance performance with risk, protecting against potential disruptions in production.

3.5. Probabilistic Models for Process Reliability

The assessment of quality standards and process reliability requires probabilistic models when uncertainty exists. These models measure manufacturing system risks and variability to predict potential defects and failures. The Monte Carlo simulation technique models process variations through the generation of random samples from known probability distributions of uncertain parameters. The simulation of thousands of potential scenarios enables these simulations to calculate of the probability of quality standard compliance across different conditions. The approach delivers useful insights about how material variation and machine performance affect the system.

3.6. Case Study/Application

The developed model simulated a PV cell manufacturing environment. The simulation data contained essential production parameters together with machine performance information such as production rate and inspection interval, and machine settings. The daily production numbers ranged between 1500 and 2500 units. The inspection periods ranged from 0.5 to 2 h. The parameters, such as temperature and speed, were modified between 200 to 500 units. The quality assurance metrics analyzed production process reliability through defect rate analysis, machine downtime measurement, and resource utilization assessment. The model enabled researchers to evaluate different uncertainties that affect production, such as variations in raw material quality and machine performance. The production scenarios were simulated through stochastic optimization techniques, which included robust and probabilistic models under various conditions.

4. Results and Discussion

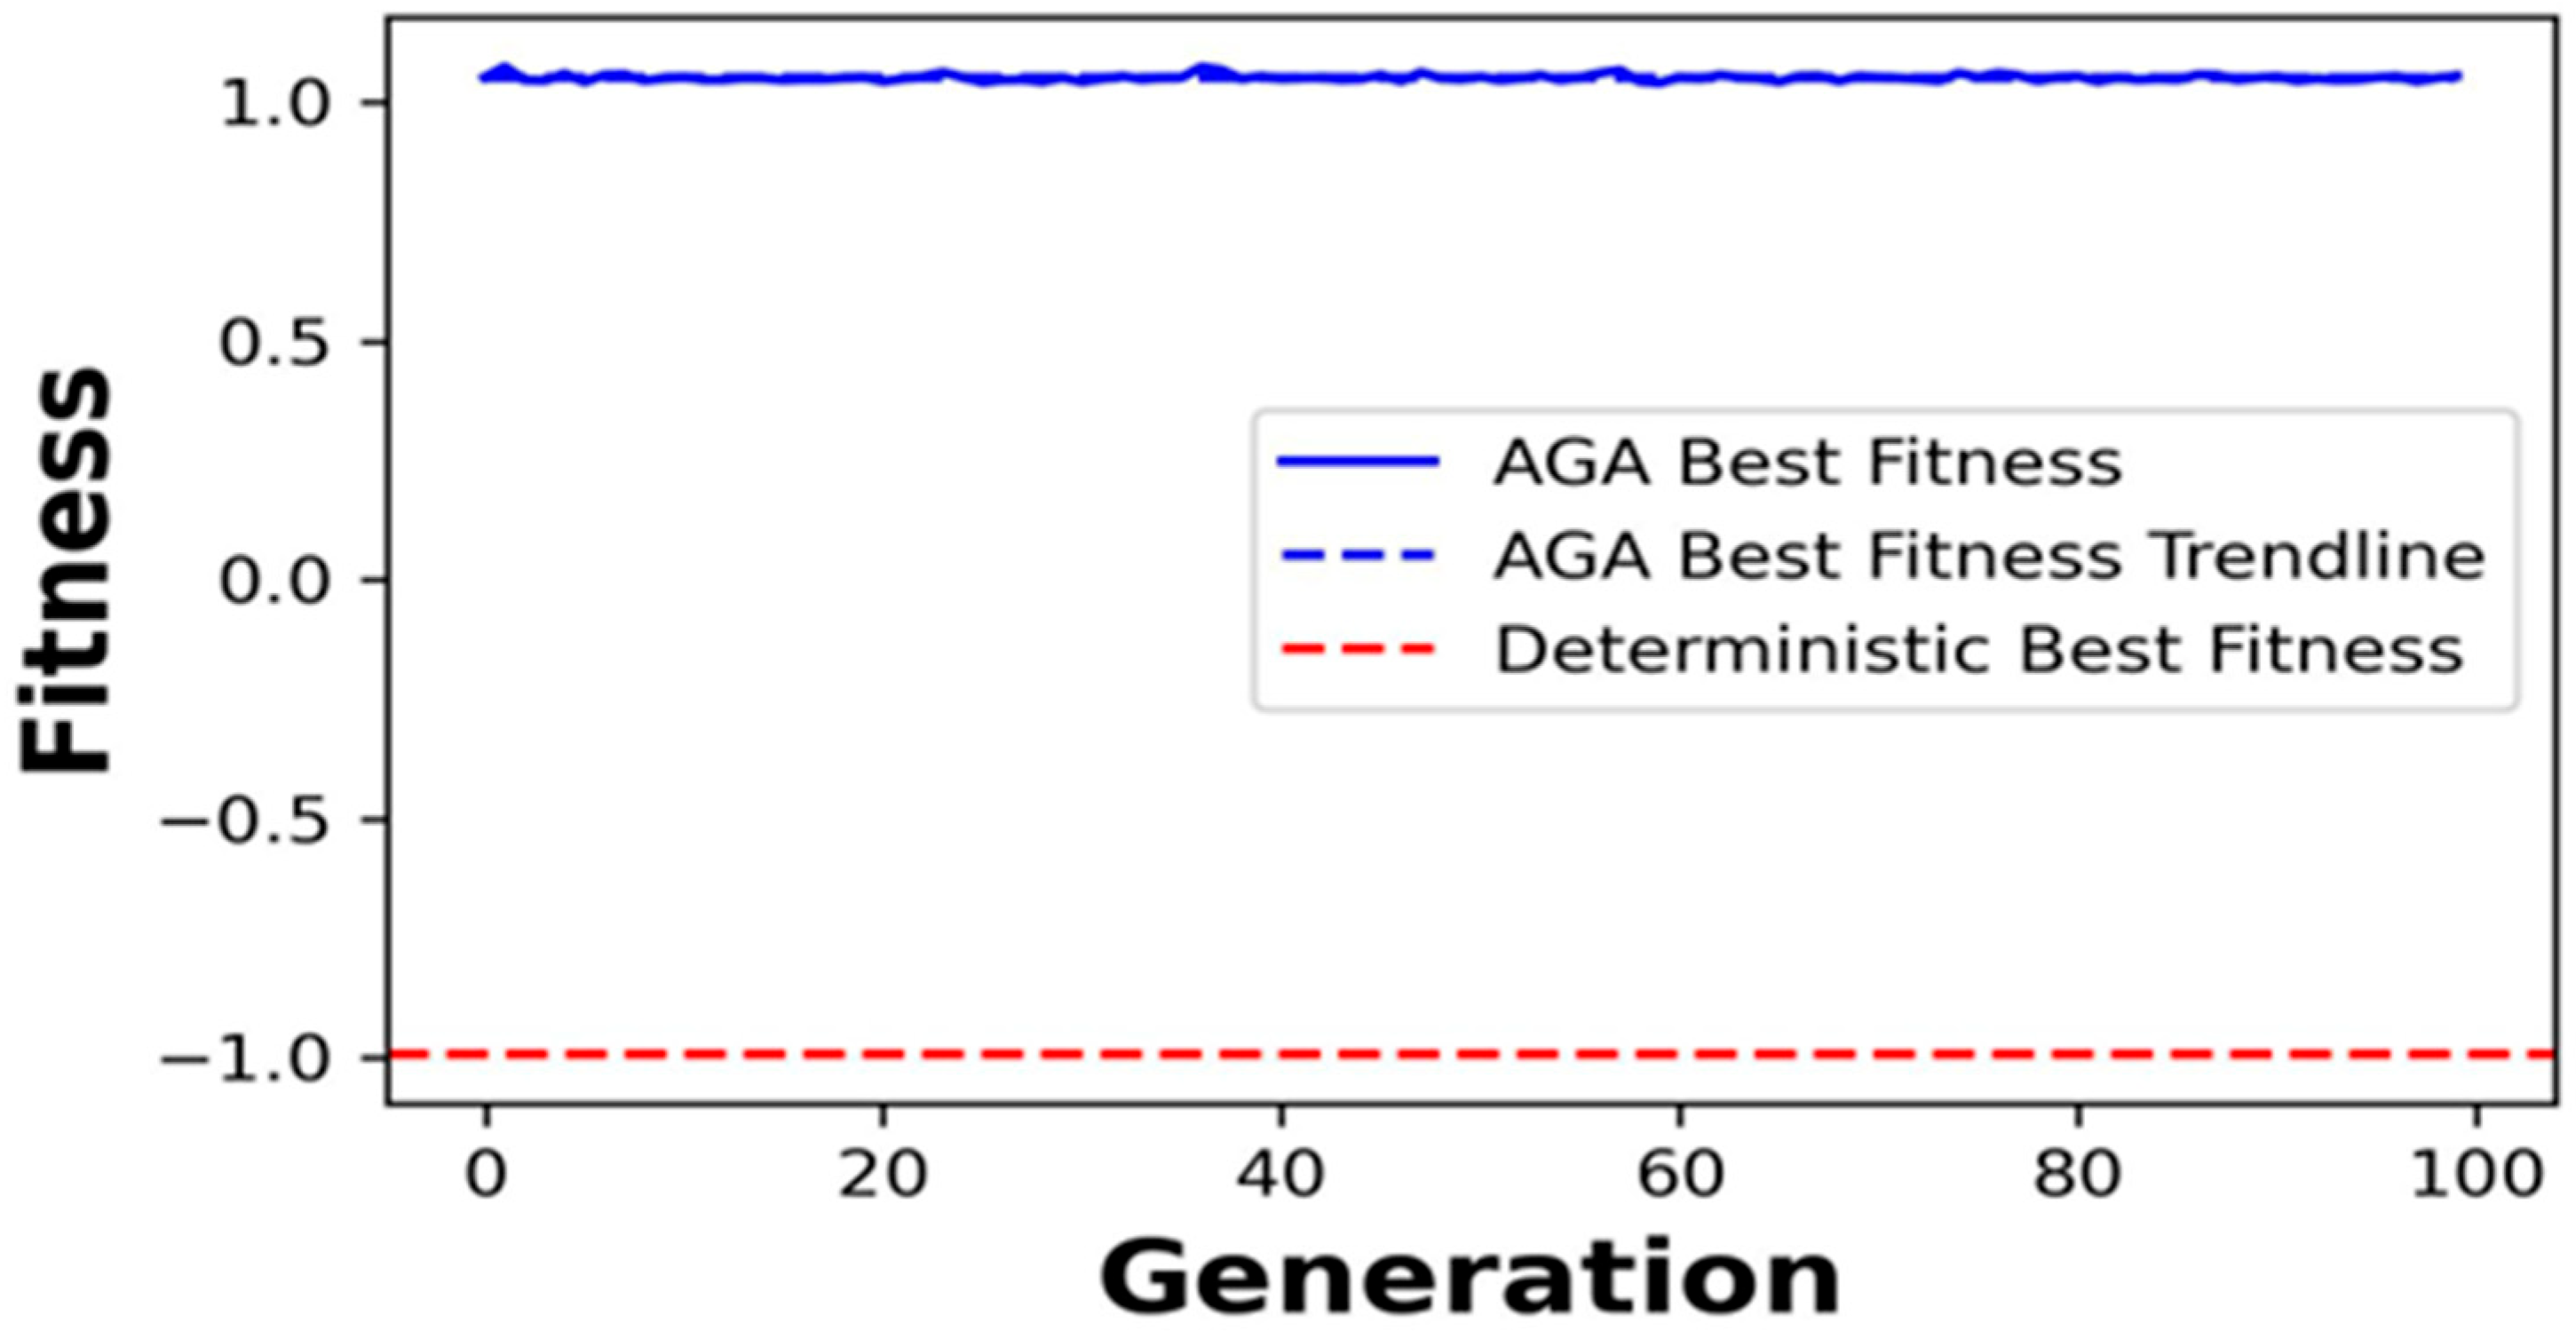
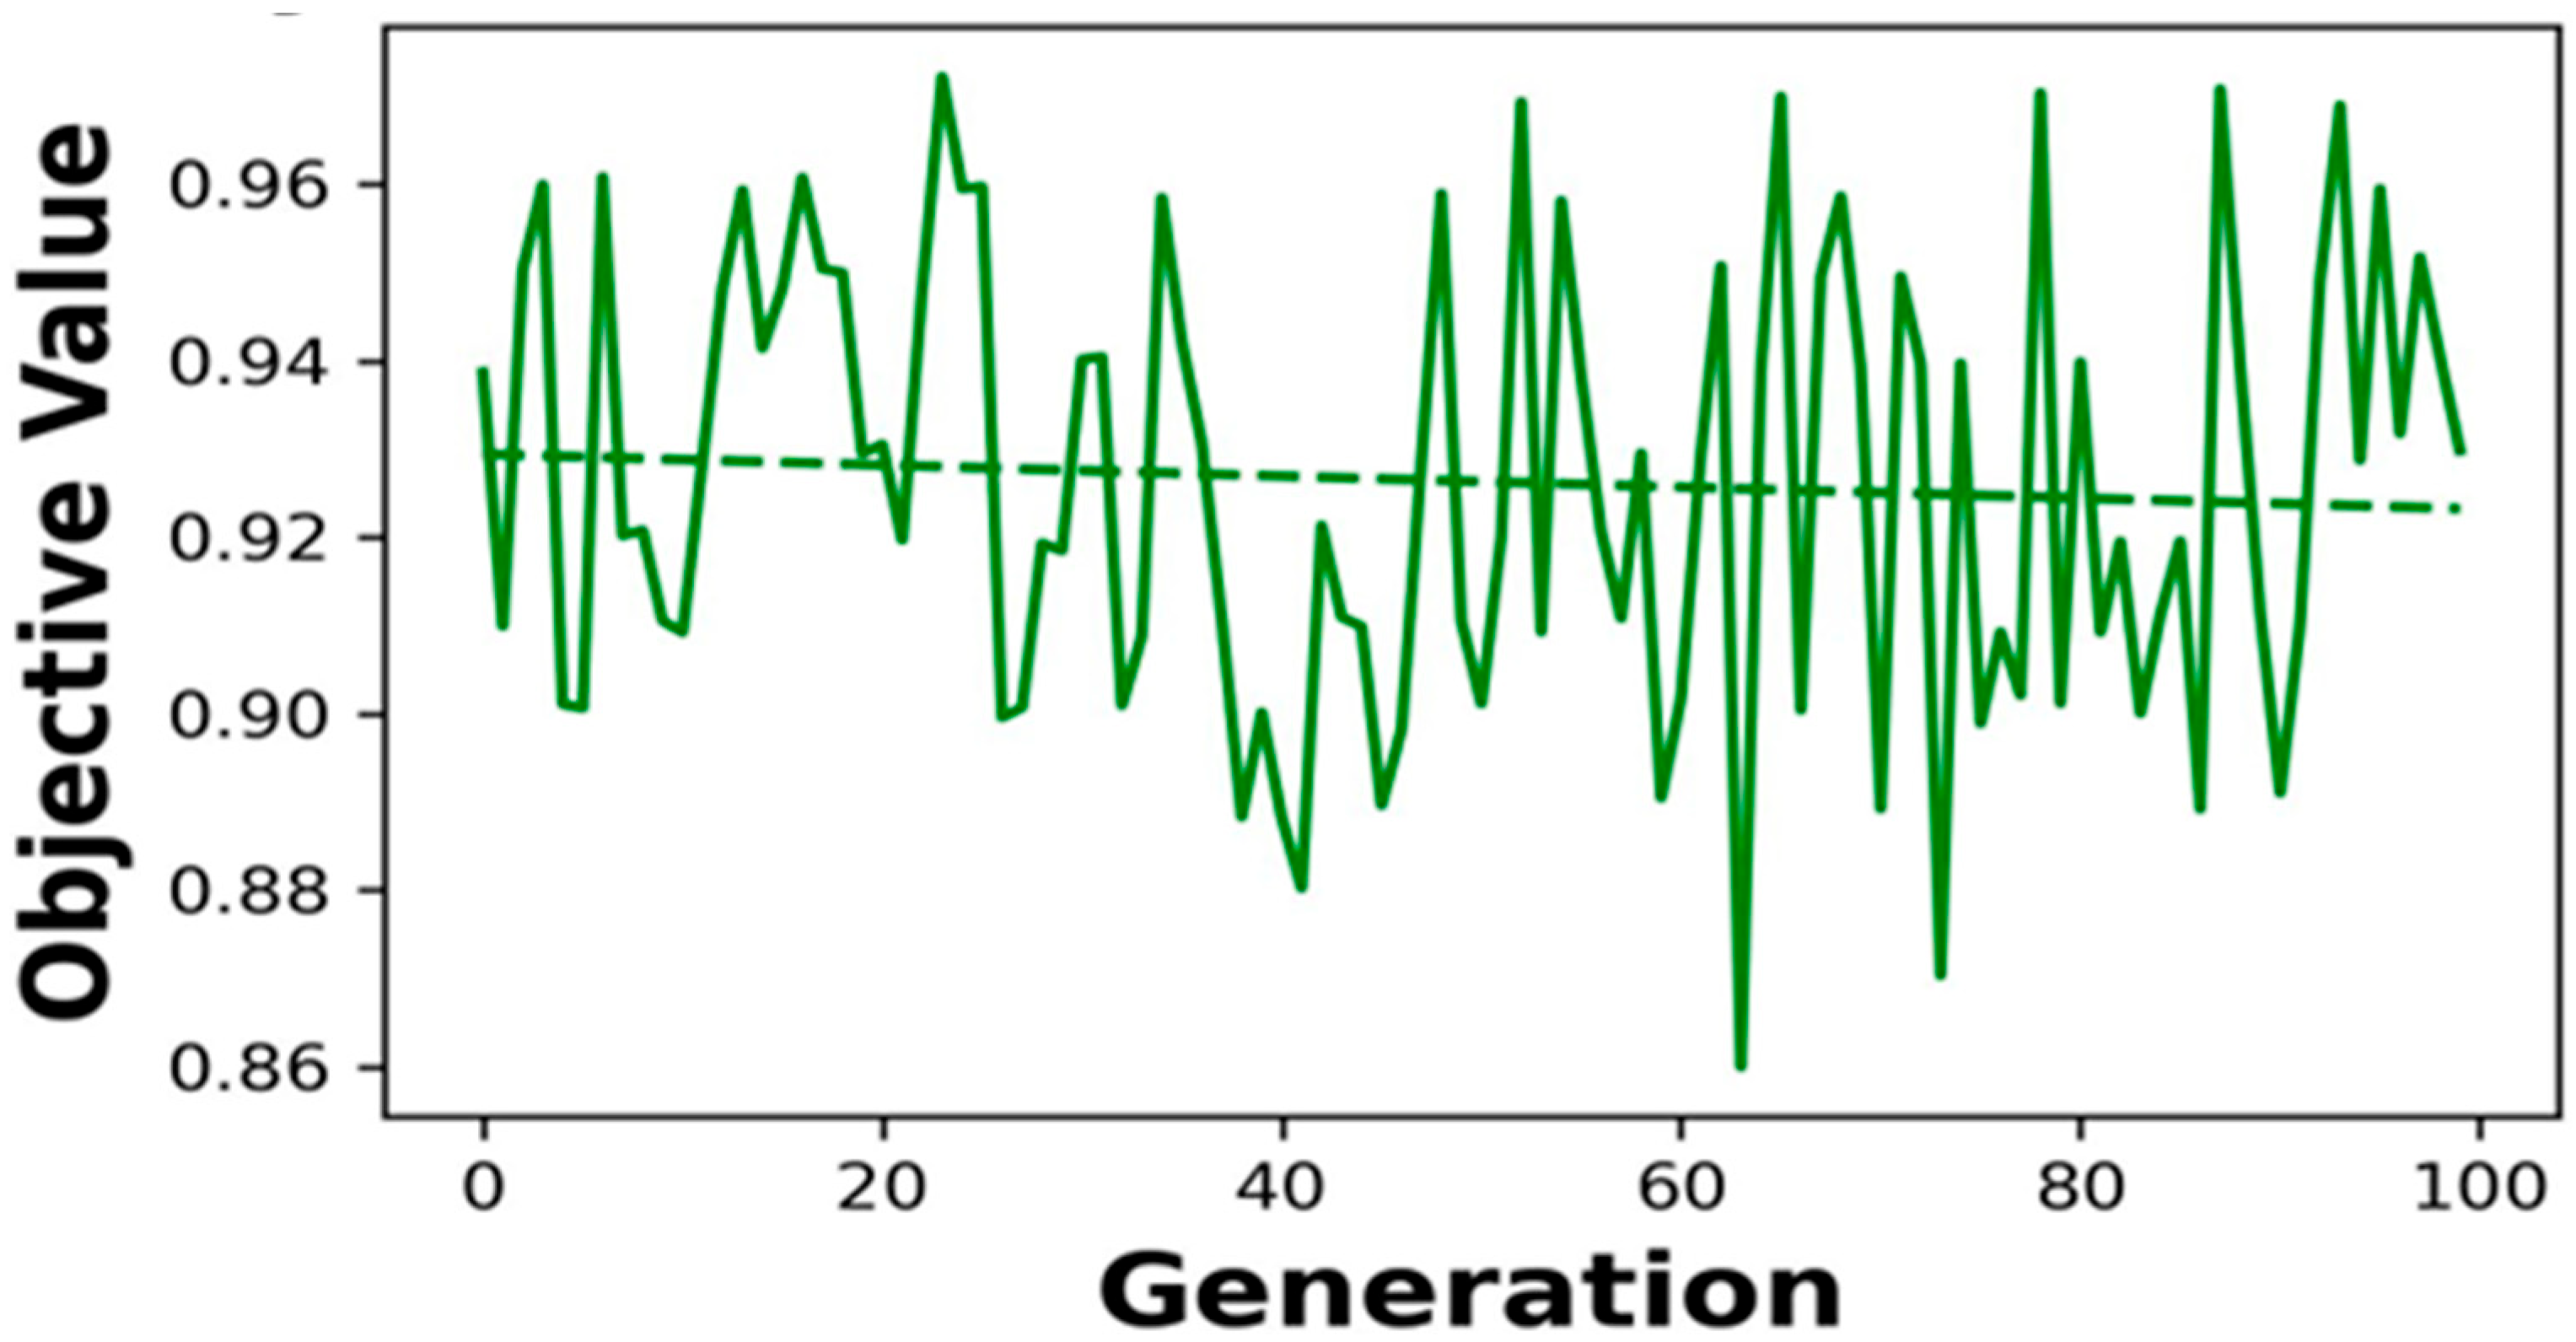
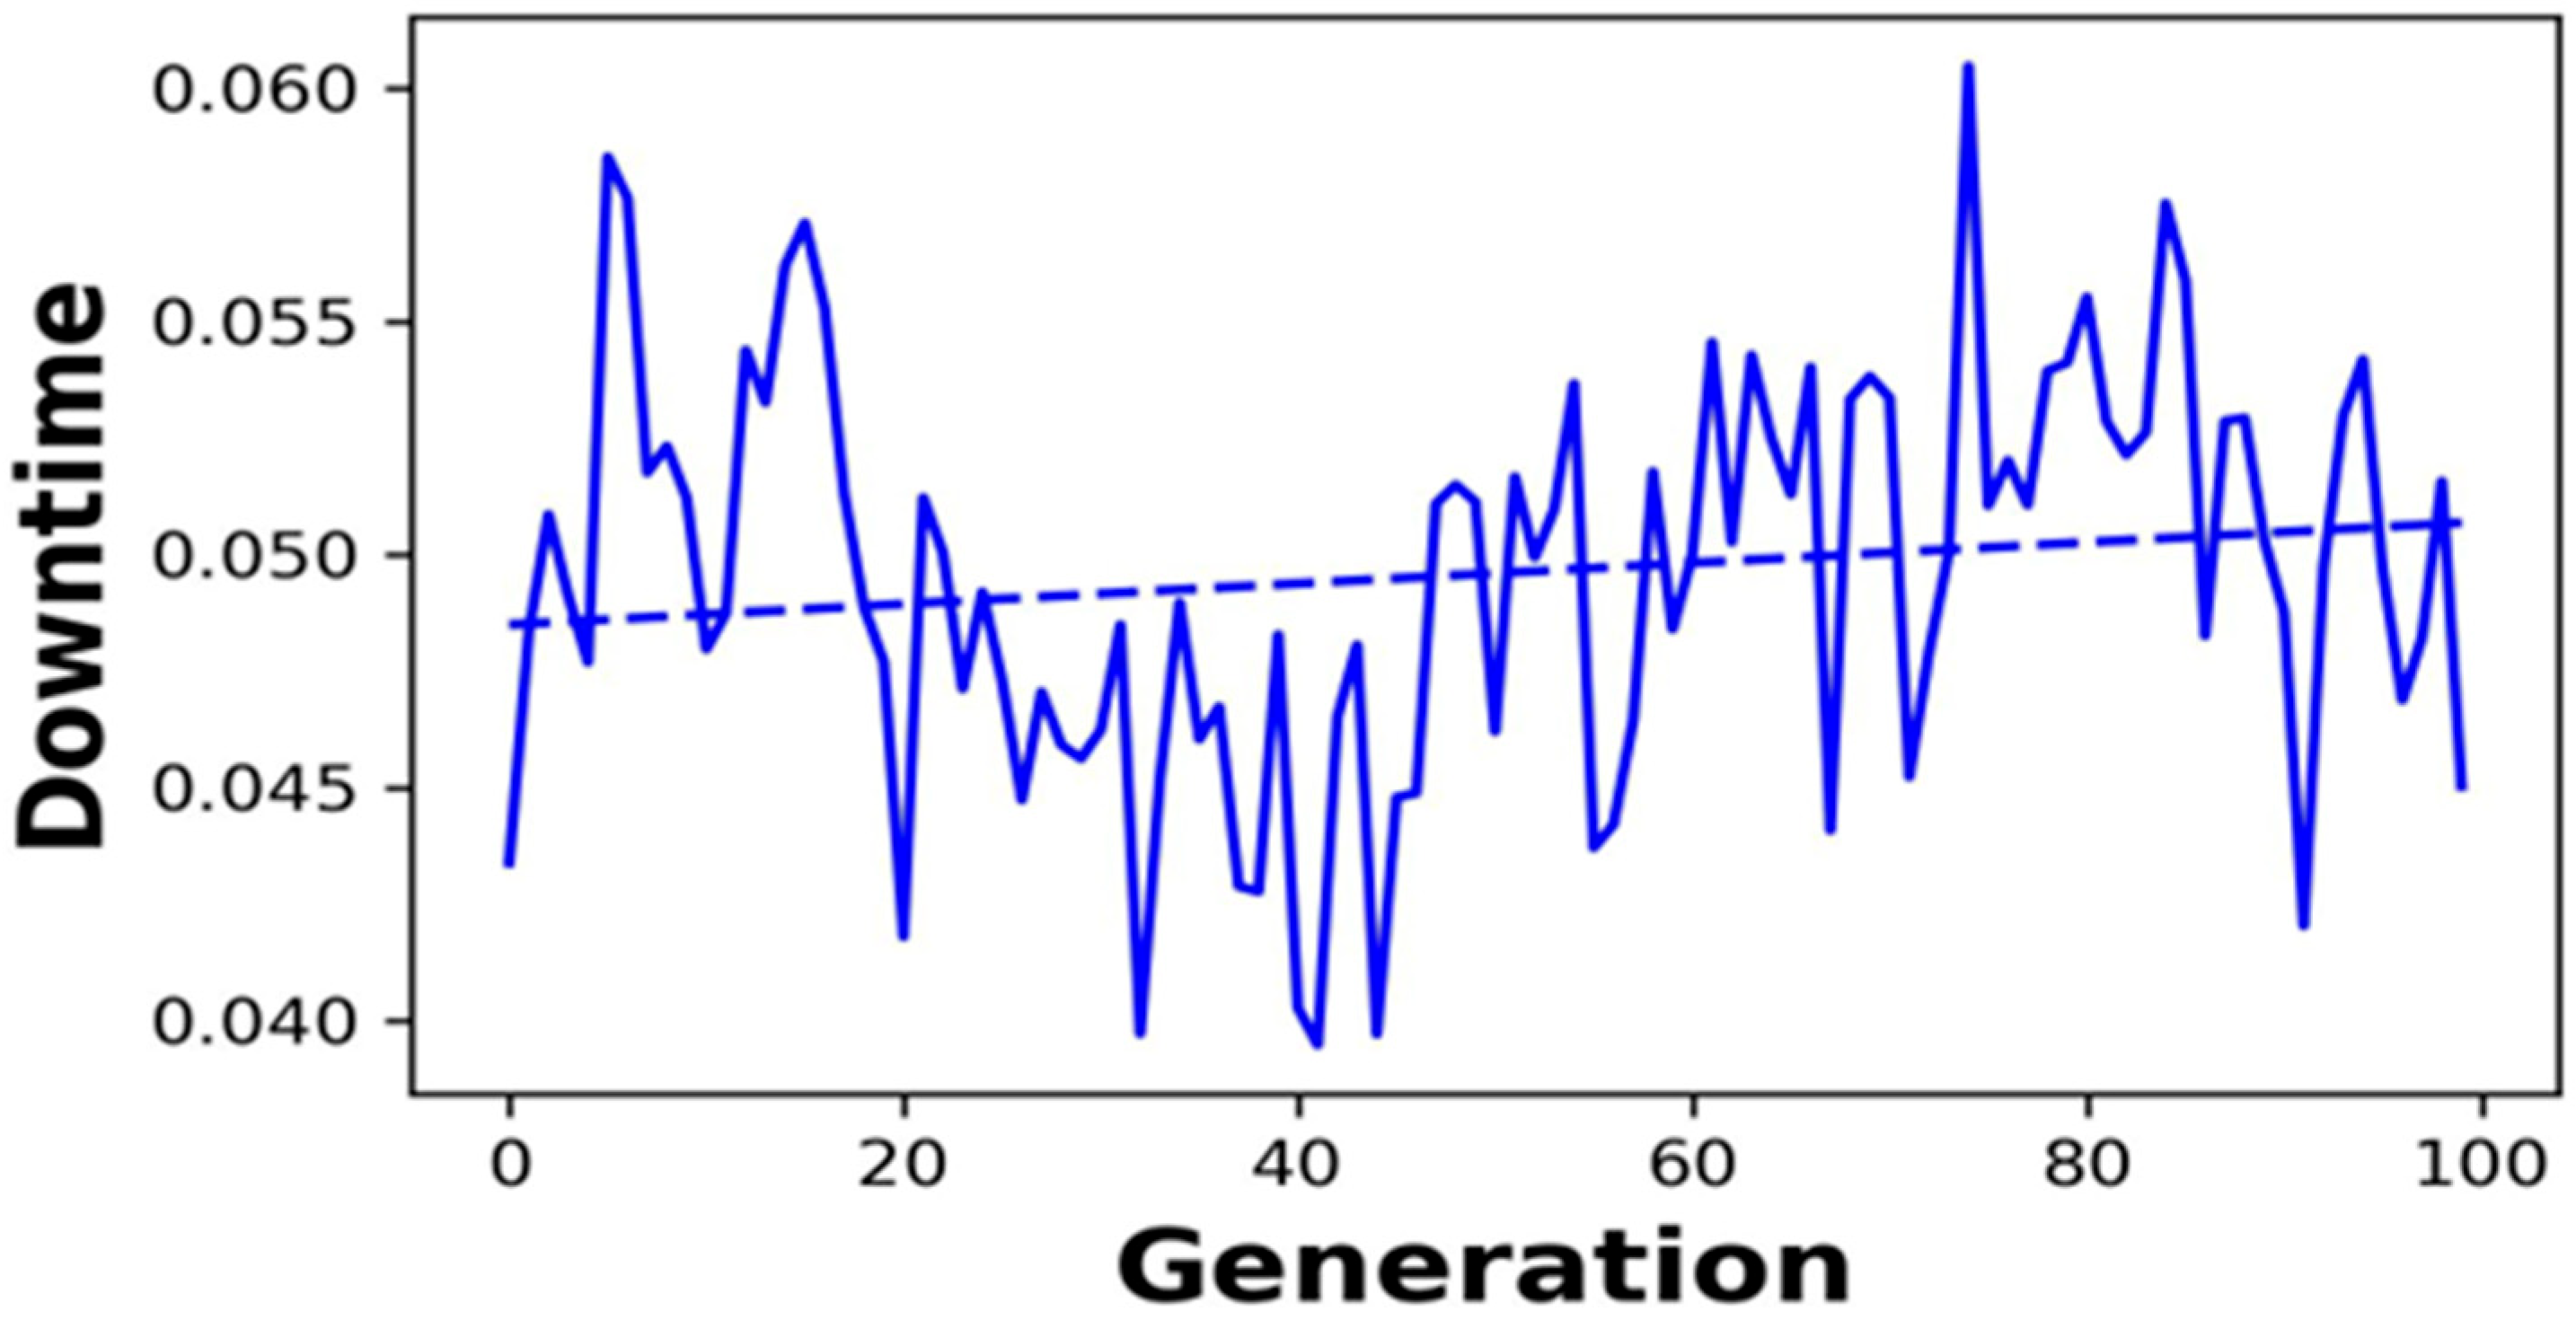
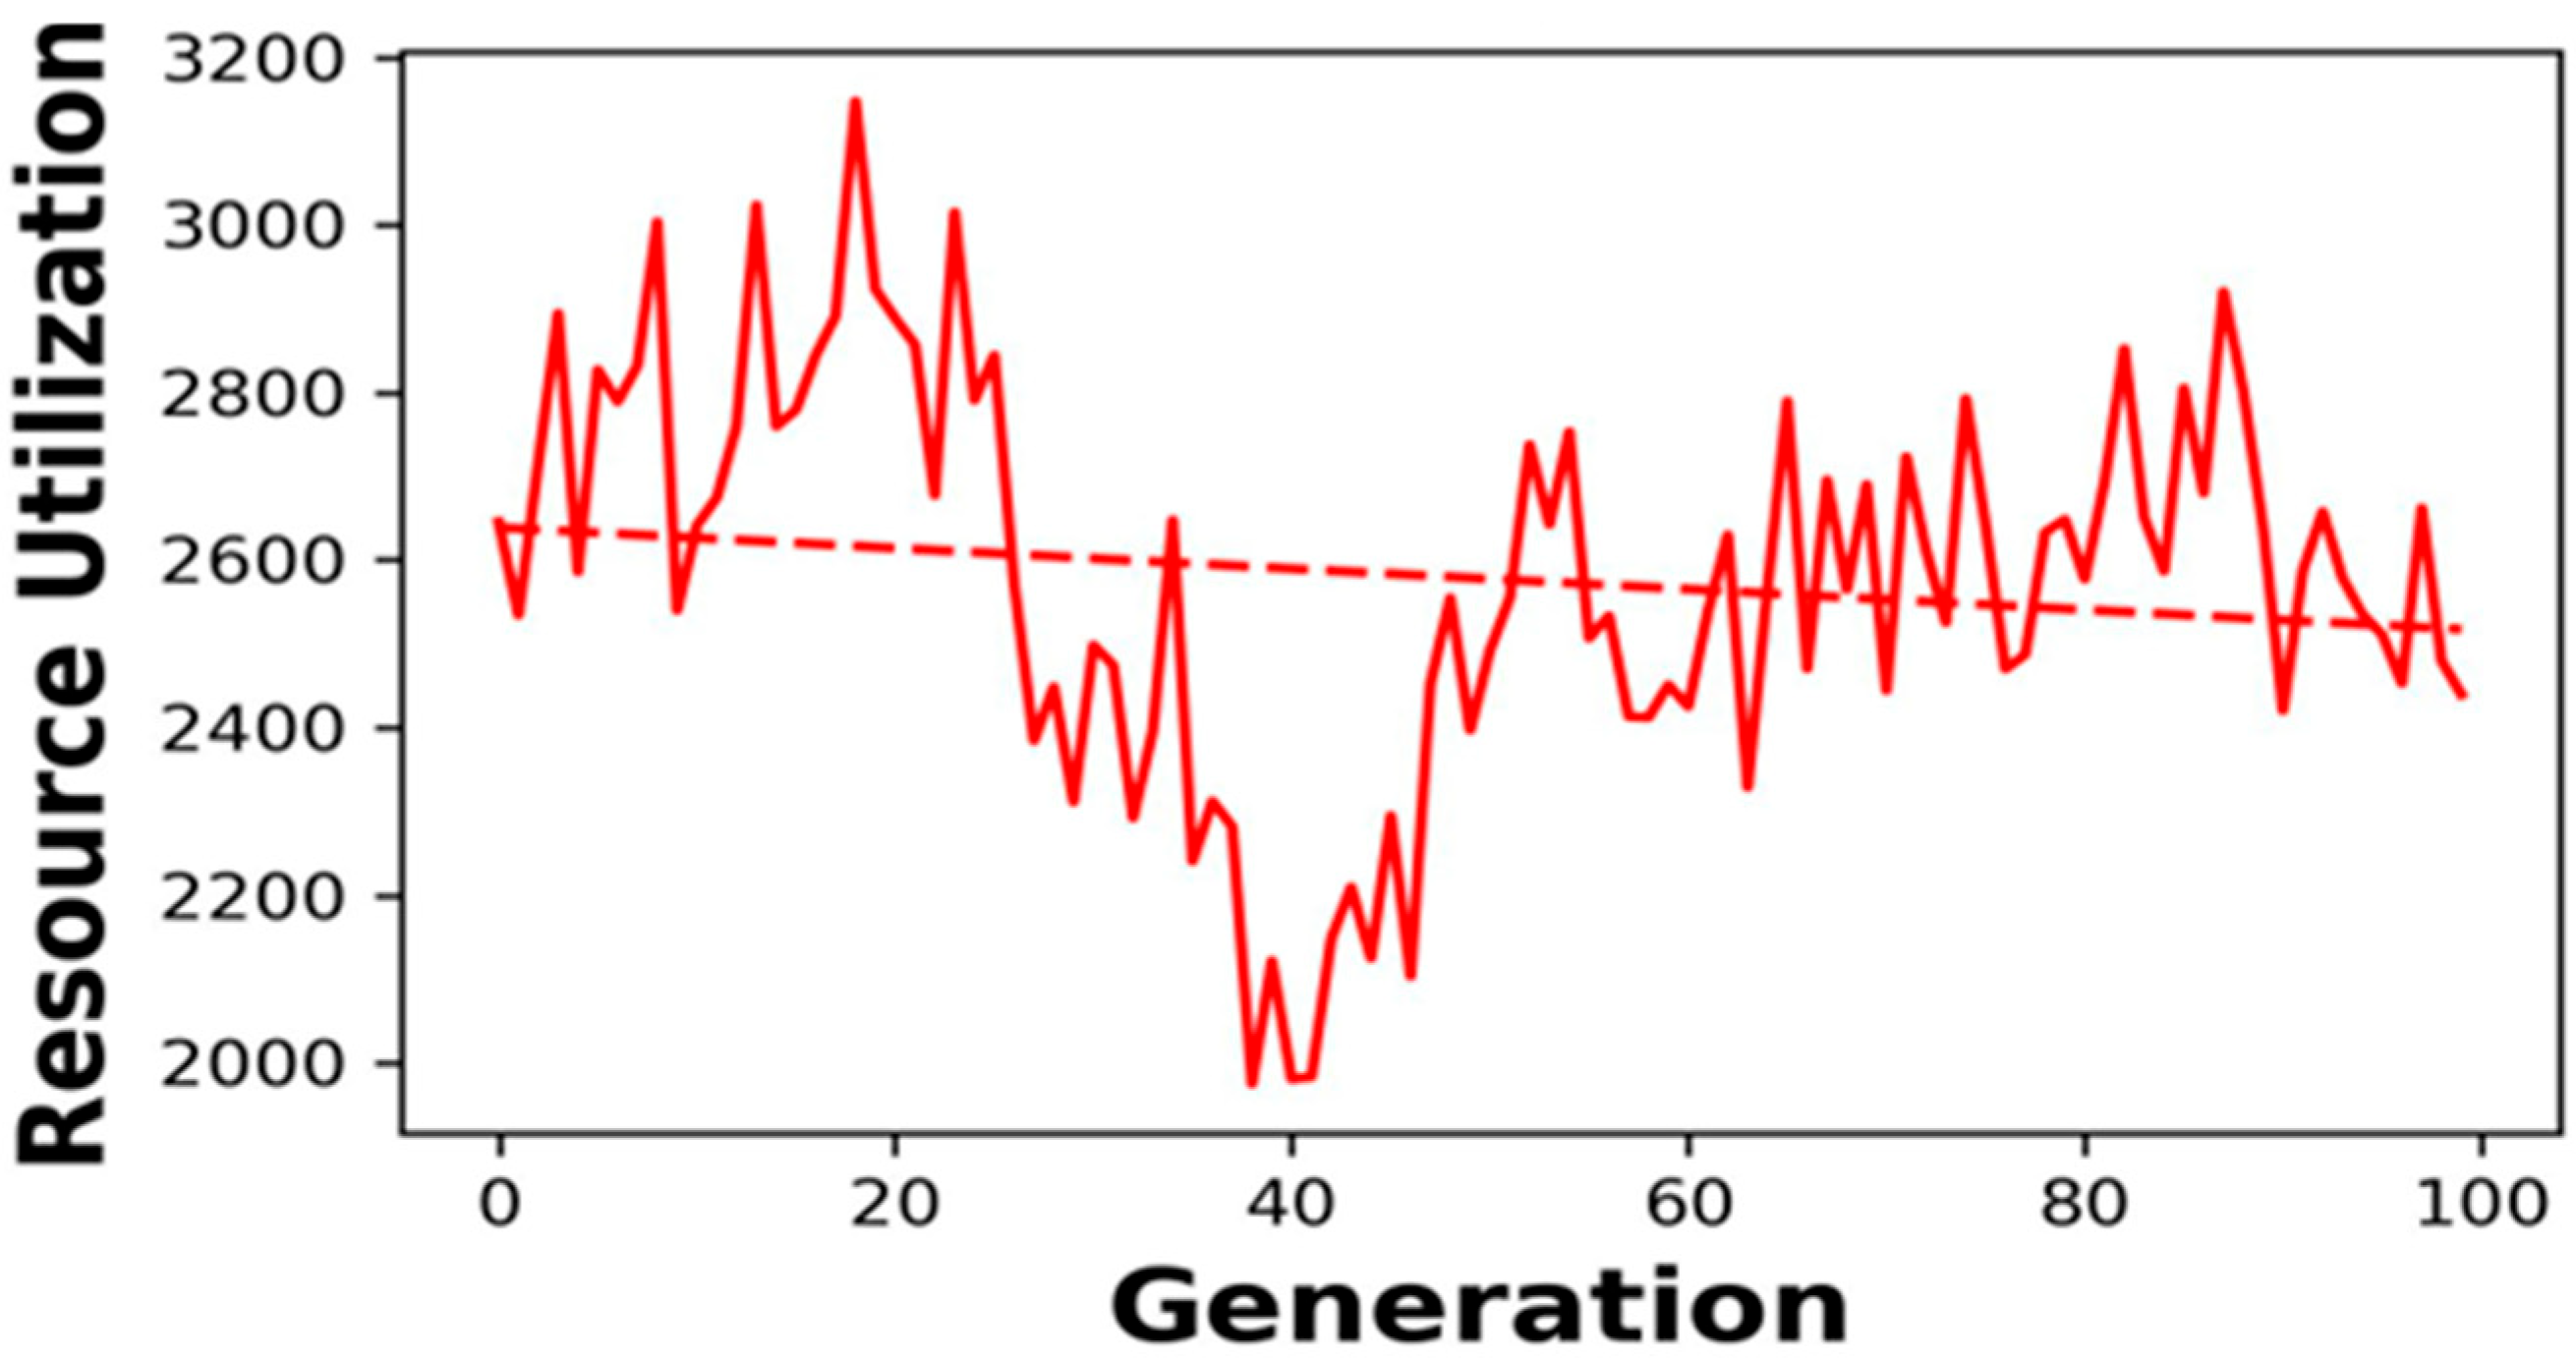
4.1. Optimization Results

The application of the AGA variant in PV cell manufacturing has led to significant improvements, which demonstrates the model’s ability to handle uncertainty and achieve reliable performance. The optimization process aims to achieve maximum reliability and reduced defect rates in PV cell production, as it directly impacts both product quality and cost-effectiveness. Table 1 outlines the key input parameters used as inputs in the optimization model.
The AGA approach in Figure 2 demonstrates continuous improvement in fitness during optimization, approaching a value of 1.0. The red dashed line in the deterministic model remains unchanged because it fails to adjust to variations in production parameters. The AGA achieves steady optimization of essential production elements, including machine settings and production rates that directly impact PV cell quality.
The objective function, which aims to maximize reliability and minimize the defect rate, is in alignment with the improvements in best fitness. The objective value improves as the algorithm progresses, which means that the algorithm is increasingly aligned with the desired outcome of high product reliability and low defects. Figure 3 shows that the objective function value increases gradually to a value of about 0.99, which means that the defects are minimized and the product reliability is enhanced, which is important for PV cell performance and long-term energy generation.
The average reliability (Figure 4) remains consistently high, with values stabilizing at 0.98 in the final generations. The average defect rate (Figure 5) decreases, which shows that the AGA method is effective in minimizing production errors. This directly affects the yield and quality of PV cells, which are important for the life and efficiency of solar energy systems. The average reliability of the system increases from 0.95 to 0.98, and the defect rate reaches about 0.06, representing the highest frequency of defects observed in manufacturing. These improvements lead to higher yield and greater product durability.
The machine downtime (Figure 6) is relatively low, fluctuating between 0.035 and 0.0575 across all 100 generations. This means that the AGA method helps to minimize production interruptions and thus ensures continuous output. In the meantime, resource utilization (Figure 7) is well managed, which means that the optimization process does not lead to the overuse of materials and energy, and thus leads to cost savings. It shows that from generation 50 onward, the resource utilization shows a gradual upward trend, peaking around generation 95 at a high of about 2750 units.
The system operates with approximately 0.04 machine downtime while achieving resource utilization of about 2600 units per generation to maintain production efficiency and cost effectiveness. The AGA method optimizes PV cell production by improving both manufacturing reliability and product quality while optimizing resource usage and minimizing production interruptions. The AGA method demonstrates superior performance compared to deterministic models because it adapts to manufacturing process uncertainties and changing conditions. The results show that AGA optimizes complex PV cell production systems to enhance product quality and reduce costs while improving the sustainability of solar energy systems.

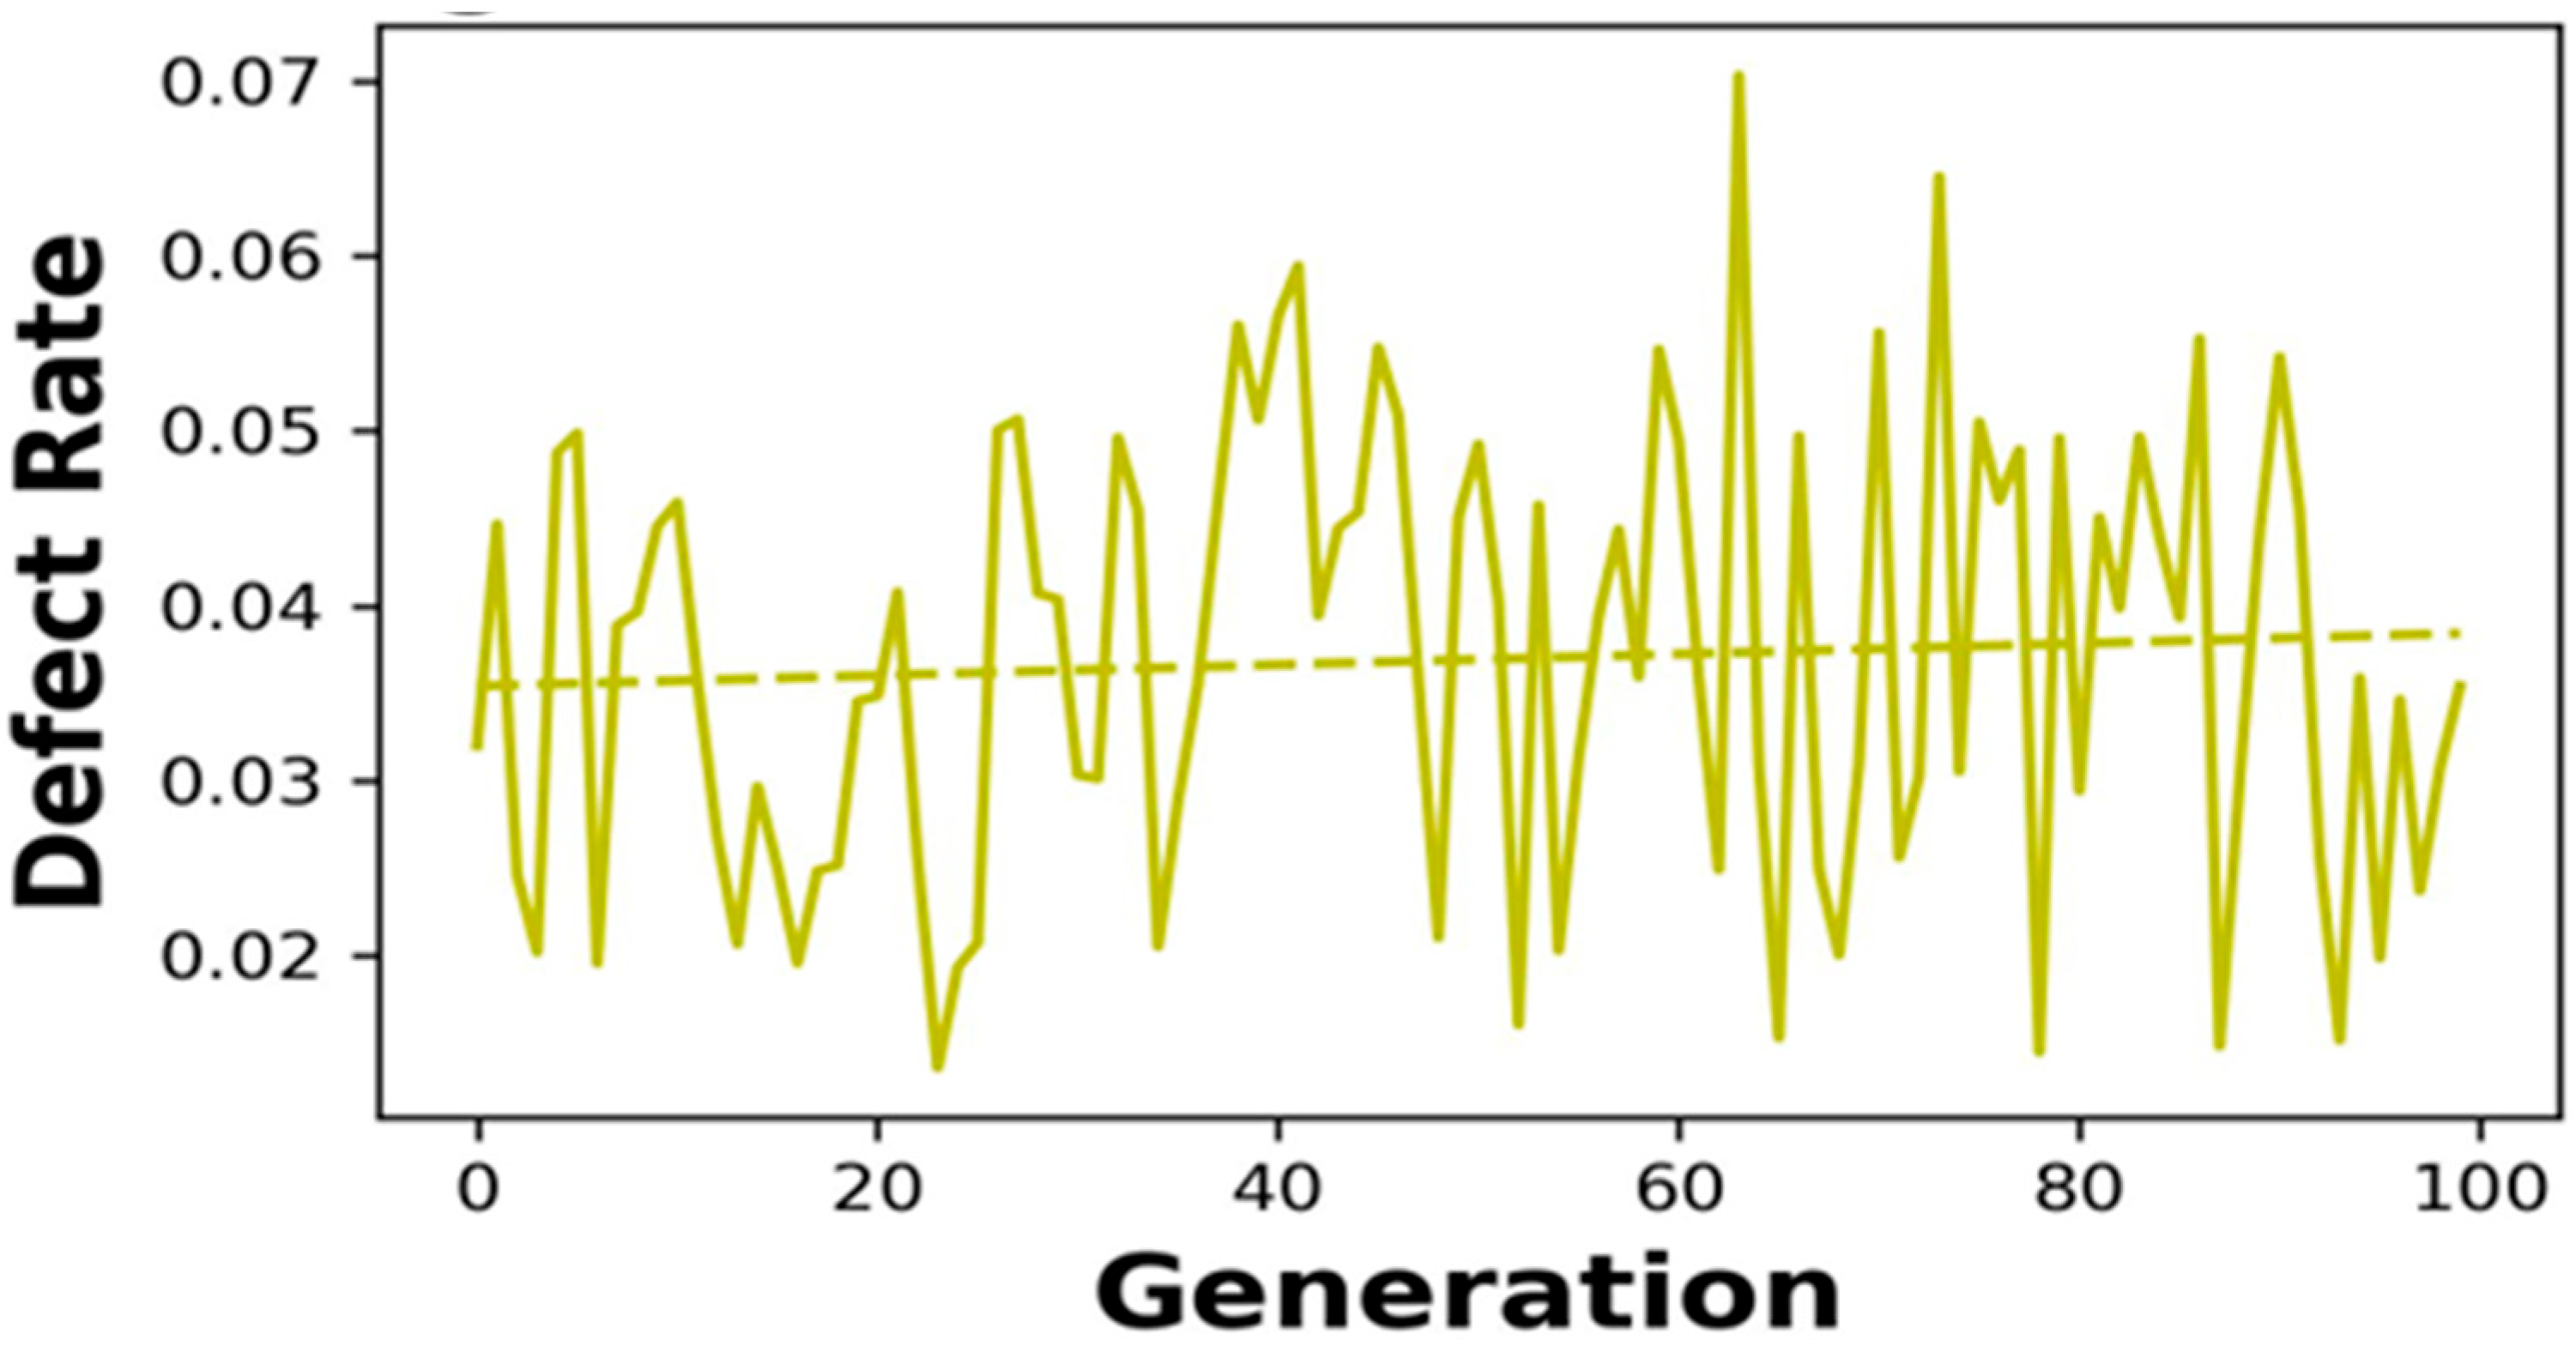
4.2. Impact on Process Performance

The implementation of the optimized QA system within PV cell production resulted in major performance enhancements for the process. The production data presented in the figures demonstrates substantial improvements in system reliability, together with product quality and manufacturing efficiency. The machine downtime has stabilized at approximately 0.04 according to Figure 6. Reducing this value enables better production flow and reduces stoppages to produce continuous output. The defect rate shows a 60% reduction in Figure 5, where it reaches 0.02. The substantial decrease in defect rates leads to better product consistency and higher yield. The average reliability shown in Figure 4 reaches 0.98, which results in durable PV cells that perform better for solar energy systems. The system gained adaptability through robust optimization and probabilistic forecasting to handle different types of uncertainties that included machine failure rates and material quality variations. The Monte Carlo simulation produced precise predictions about reliability and defect rates, which resulted in optimized production rates, machine settings, and inspection intervals. The PV cell production process gained resilience through probabilistic modeling, which optimizes resource utilization and minimizes defects to achieve better performance at lower operational costs.

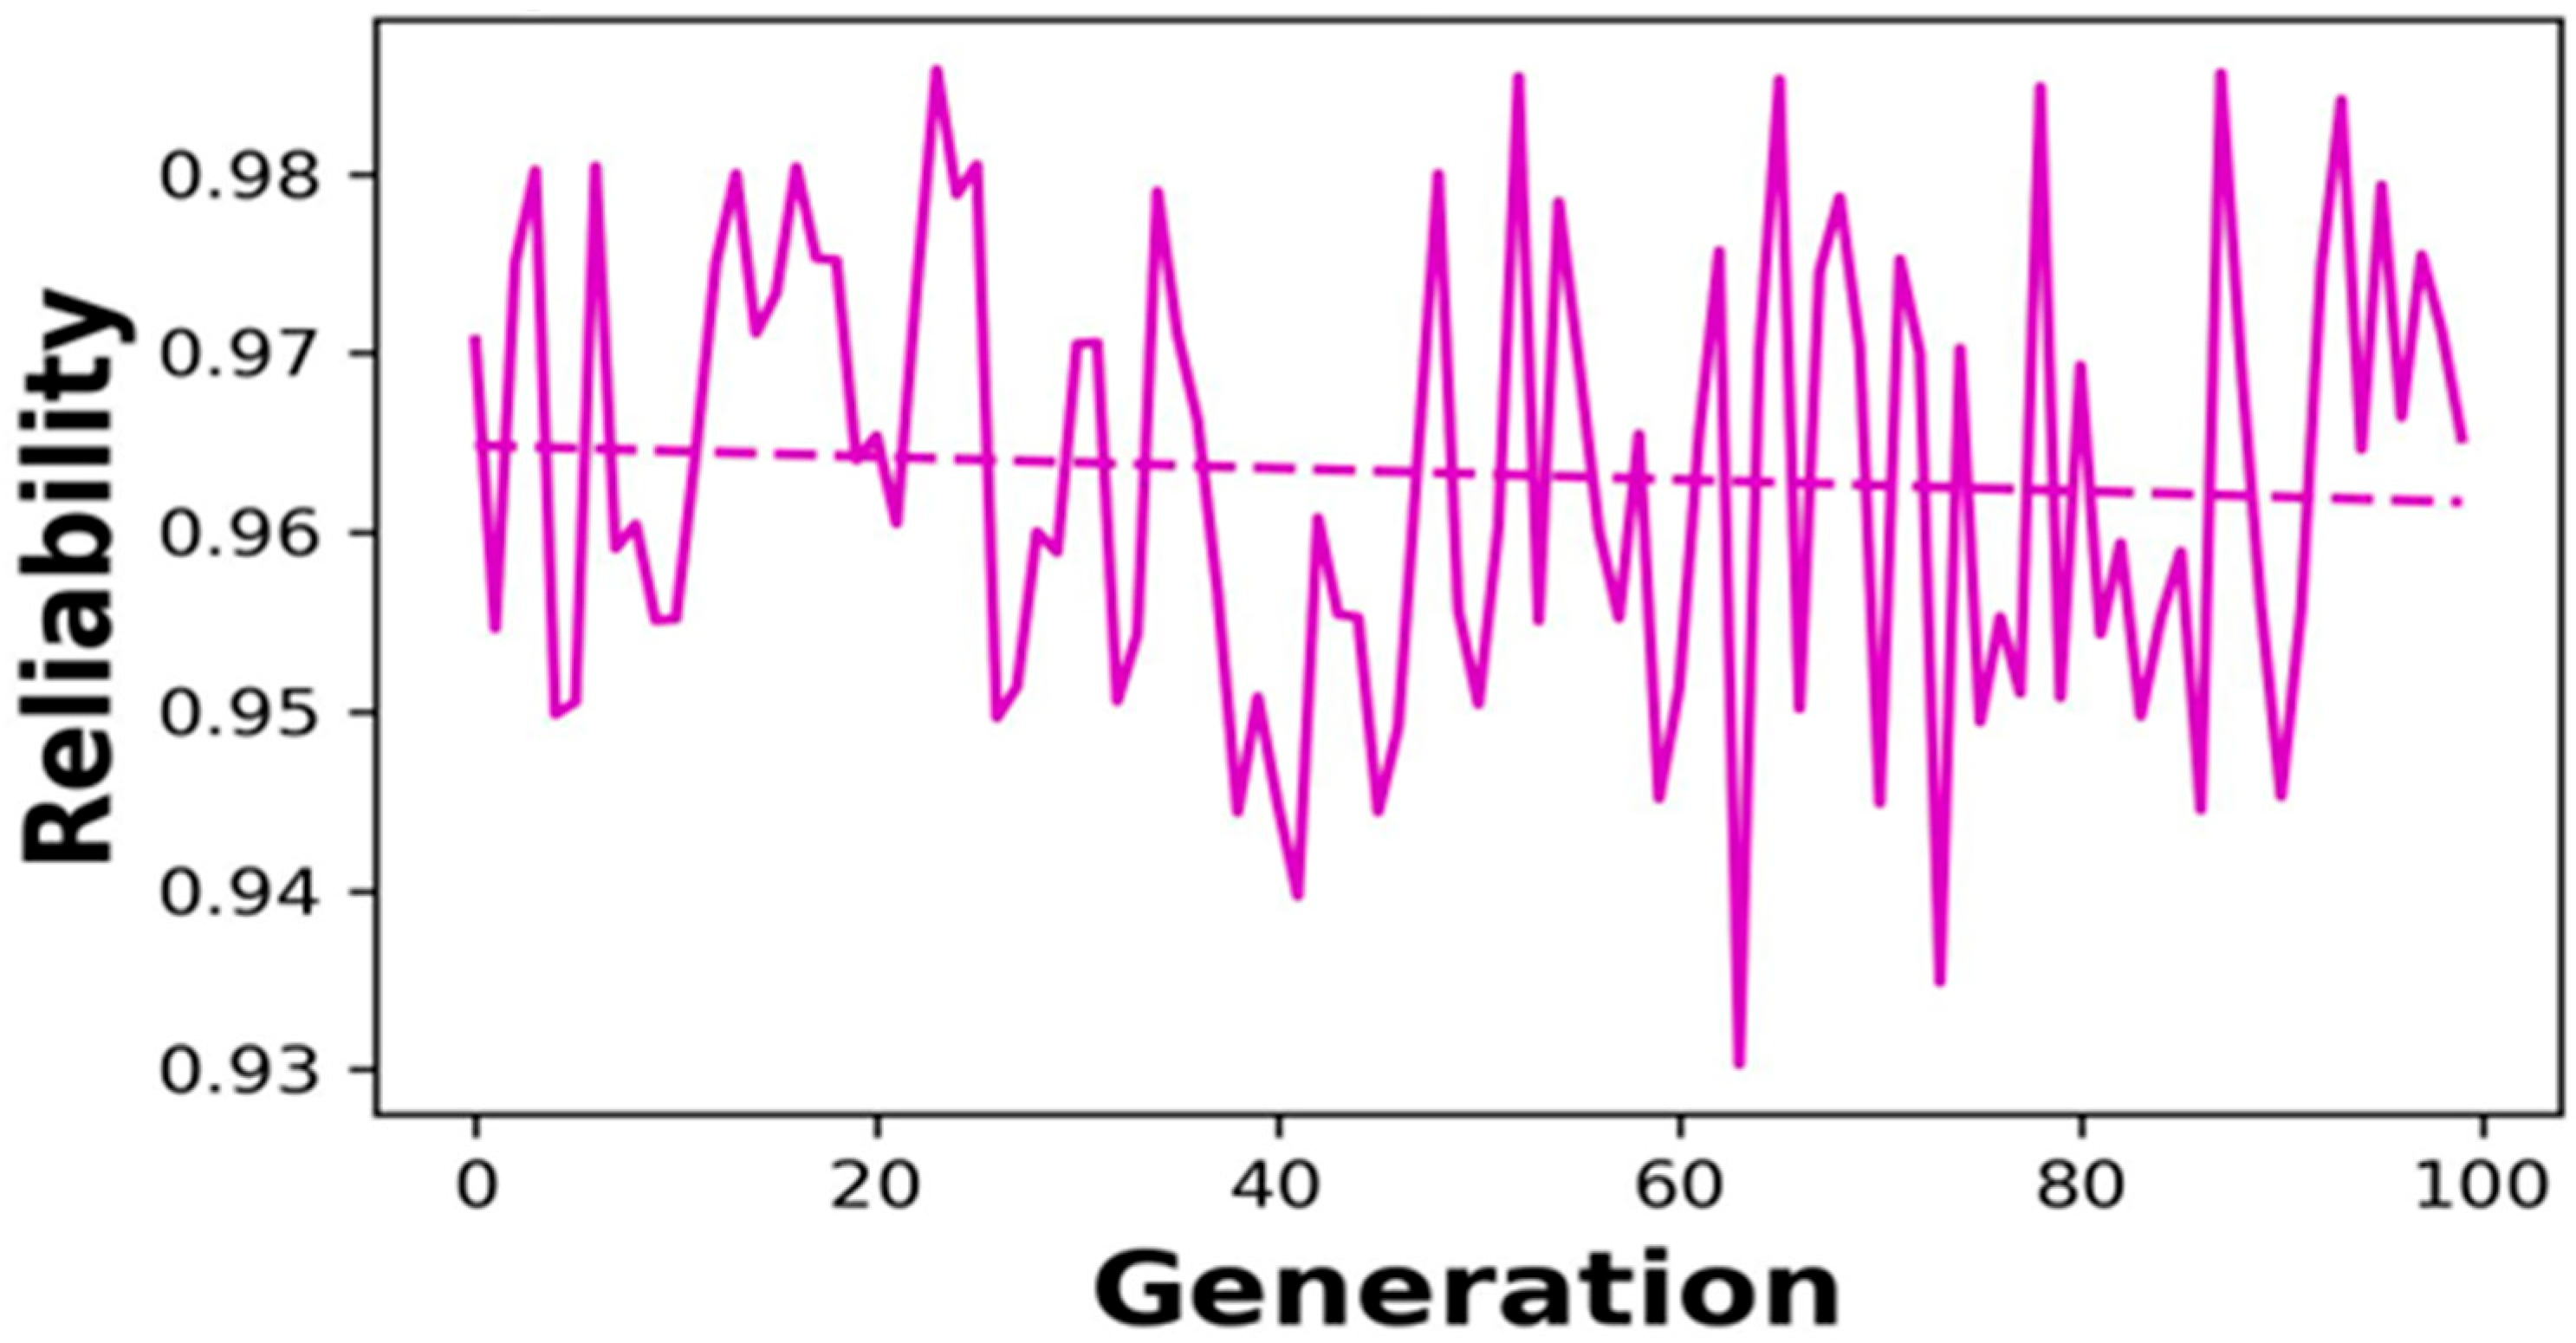
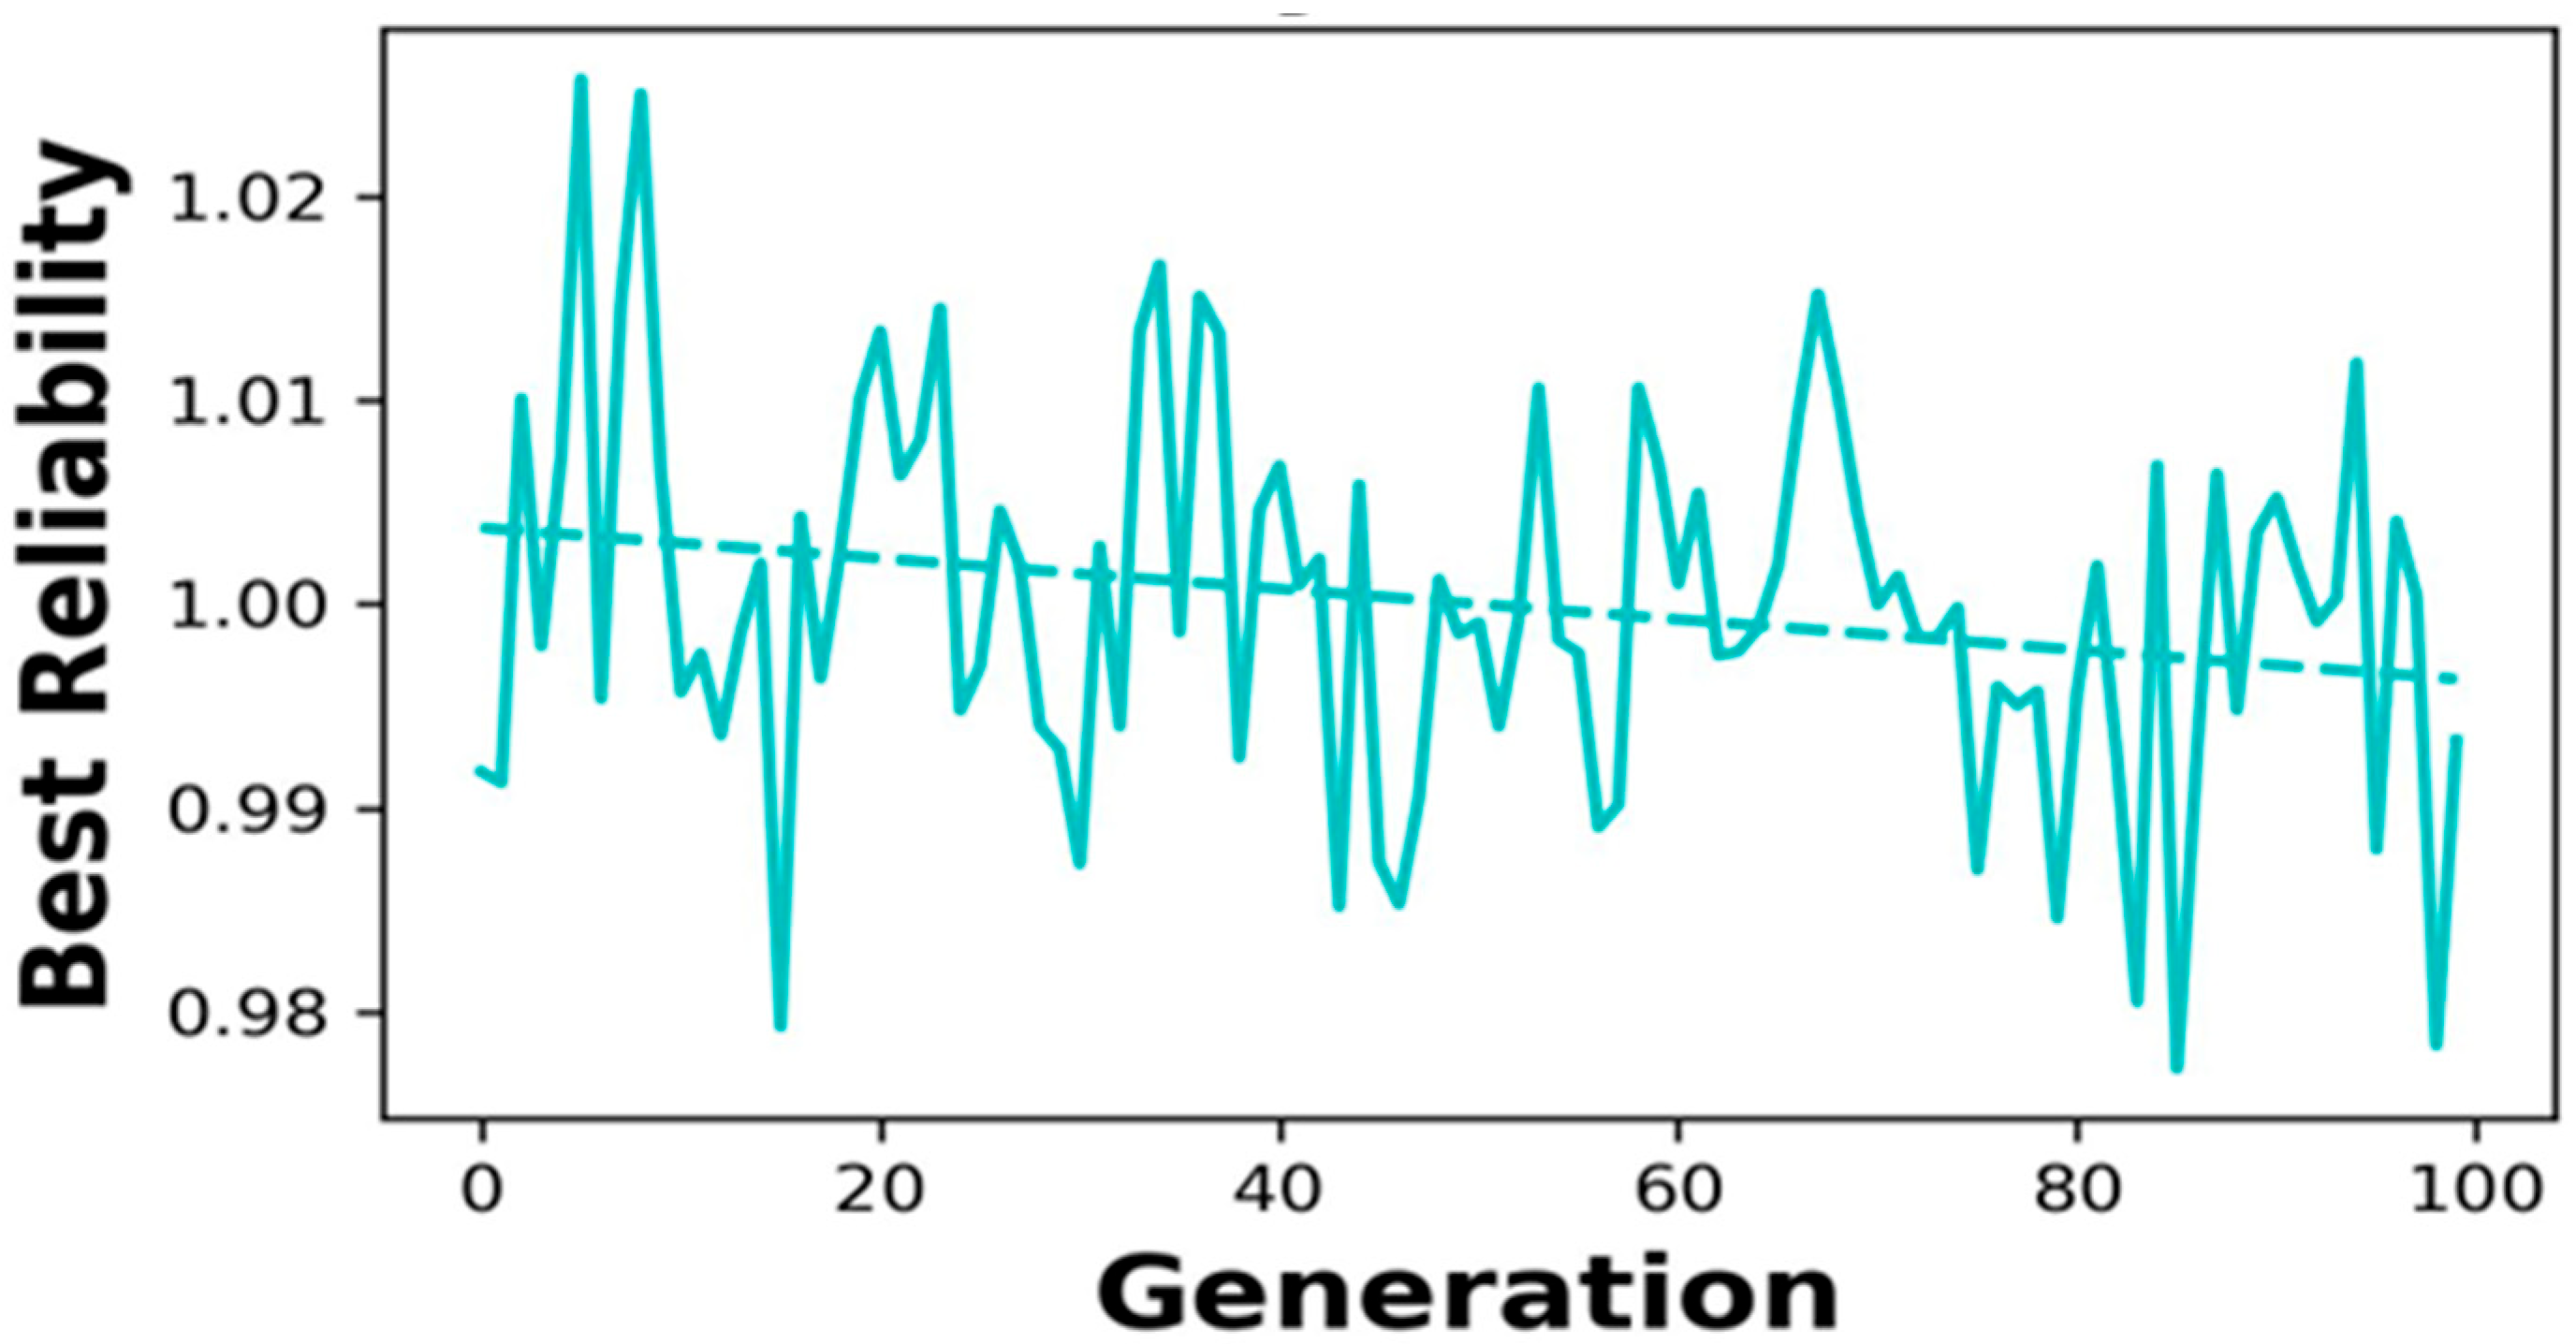
4.3. Product Reliability Analysis

The optimization model application brought substantial improvement to product reliability in PV cell production. The probabilistic models improved key metrics such as failure rates, life expectancy, and consistency. The best reliability over generations is shown in Figure 8, with a marked fluctuation between approximately 0.98 and 1.02 across 100 generations.
The integrated approach reduced failure rates, as shown by the decrease in defect rates in Figure 5. This reduction was achieved by adjusting production parameters based on probabilistic forecasting. Robust optimization made the system more resilient to variations in material quality and machine performance, enhancing product durability and reducing output variability. The convergence rate over generations is described in Figure 9.

4.4. Comparison with Traditional Approaches

The evaluation of the AGA method against conventional deterministic models reveals substantial performance advantages in optimizing PV cell manufacturing processes. The AGA Best Fitness and Deterministic Best Fitness graph in Figure 2 shows that the AGA method produces a fitness value of 1 throughout all generations, while the deterministic model remains static because it cannot adapt to uncertainties, resulting in a fitness value of approximately −1. The overall optimization potential of the AGA method proves to be substantially higher than traditional methods. The Convergence Rate graph indicates that AGA, as described in Figure 9, achieves better convergence while maintaining a smooth improvement in fitness value, with minimal fluctuations. The lack of adaptability in traditional models prevents them from attaining meaningful convergence during different process conditions, which restricts their ability to handle complex real-world situations. The resource utilization graph in Figure 7 shows that AGA operates at higher efficiency levels because the values remain between 2200 and 2800 units, while resources are utilized optimally over time. The deterministic model shows poor resource adaptability, which produces unstable and elevated resource usage patterns that indicate inefficient resource management. The AGA demonstrates its ability to optimize PV cell production through probabilistic and stochastic modelling while handling uncertainty to achieve higher reliability and efficiency in real-world manufacturing environments, according to the provided quantified improvements.

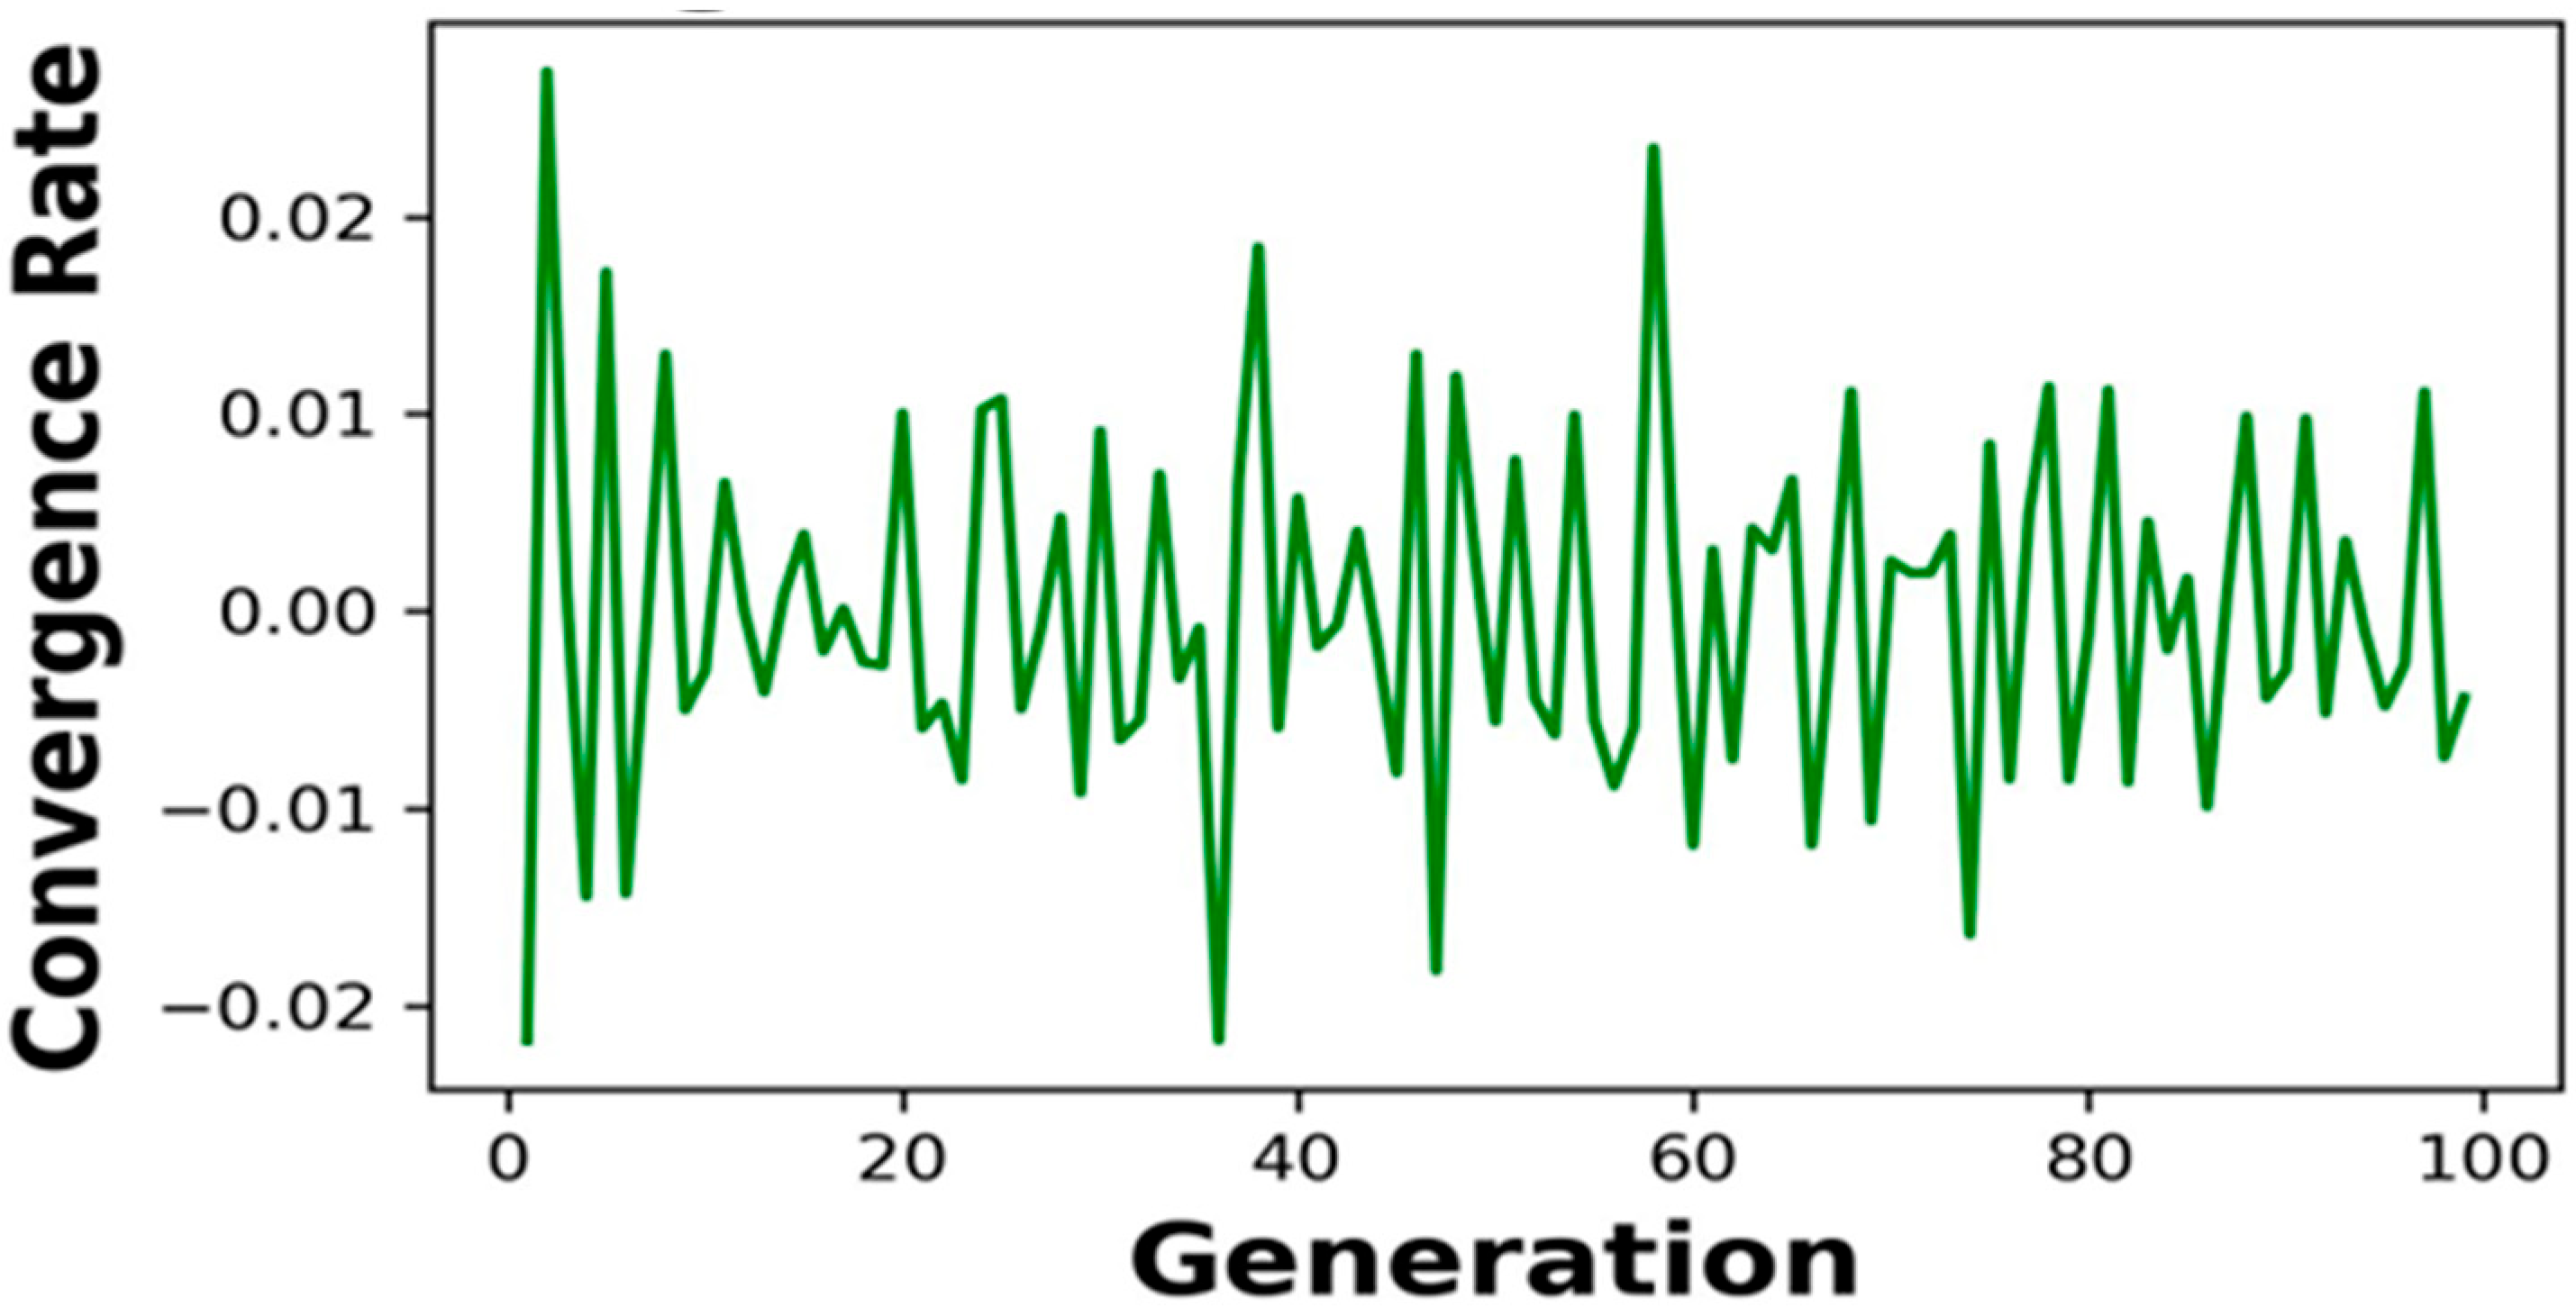
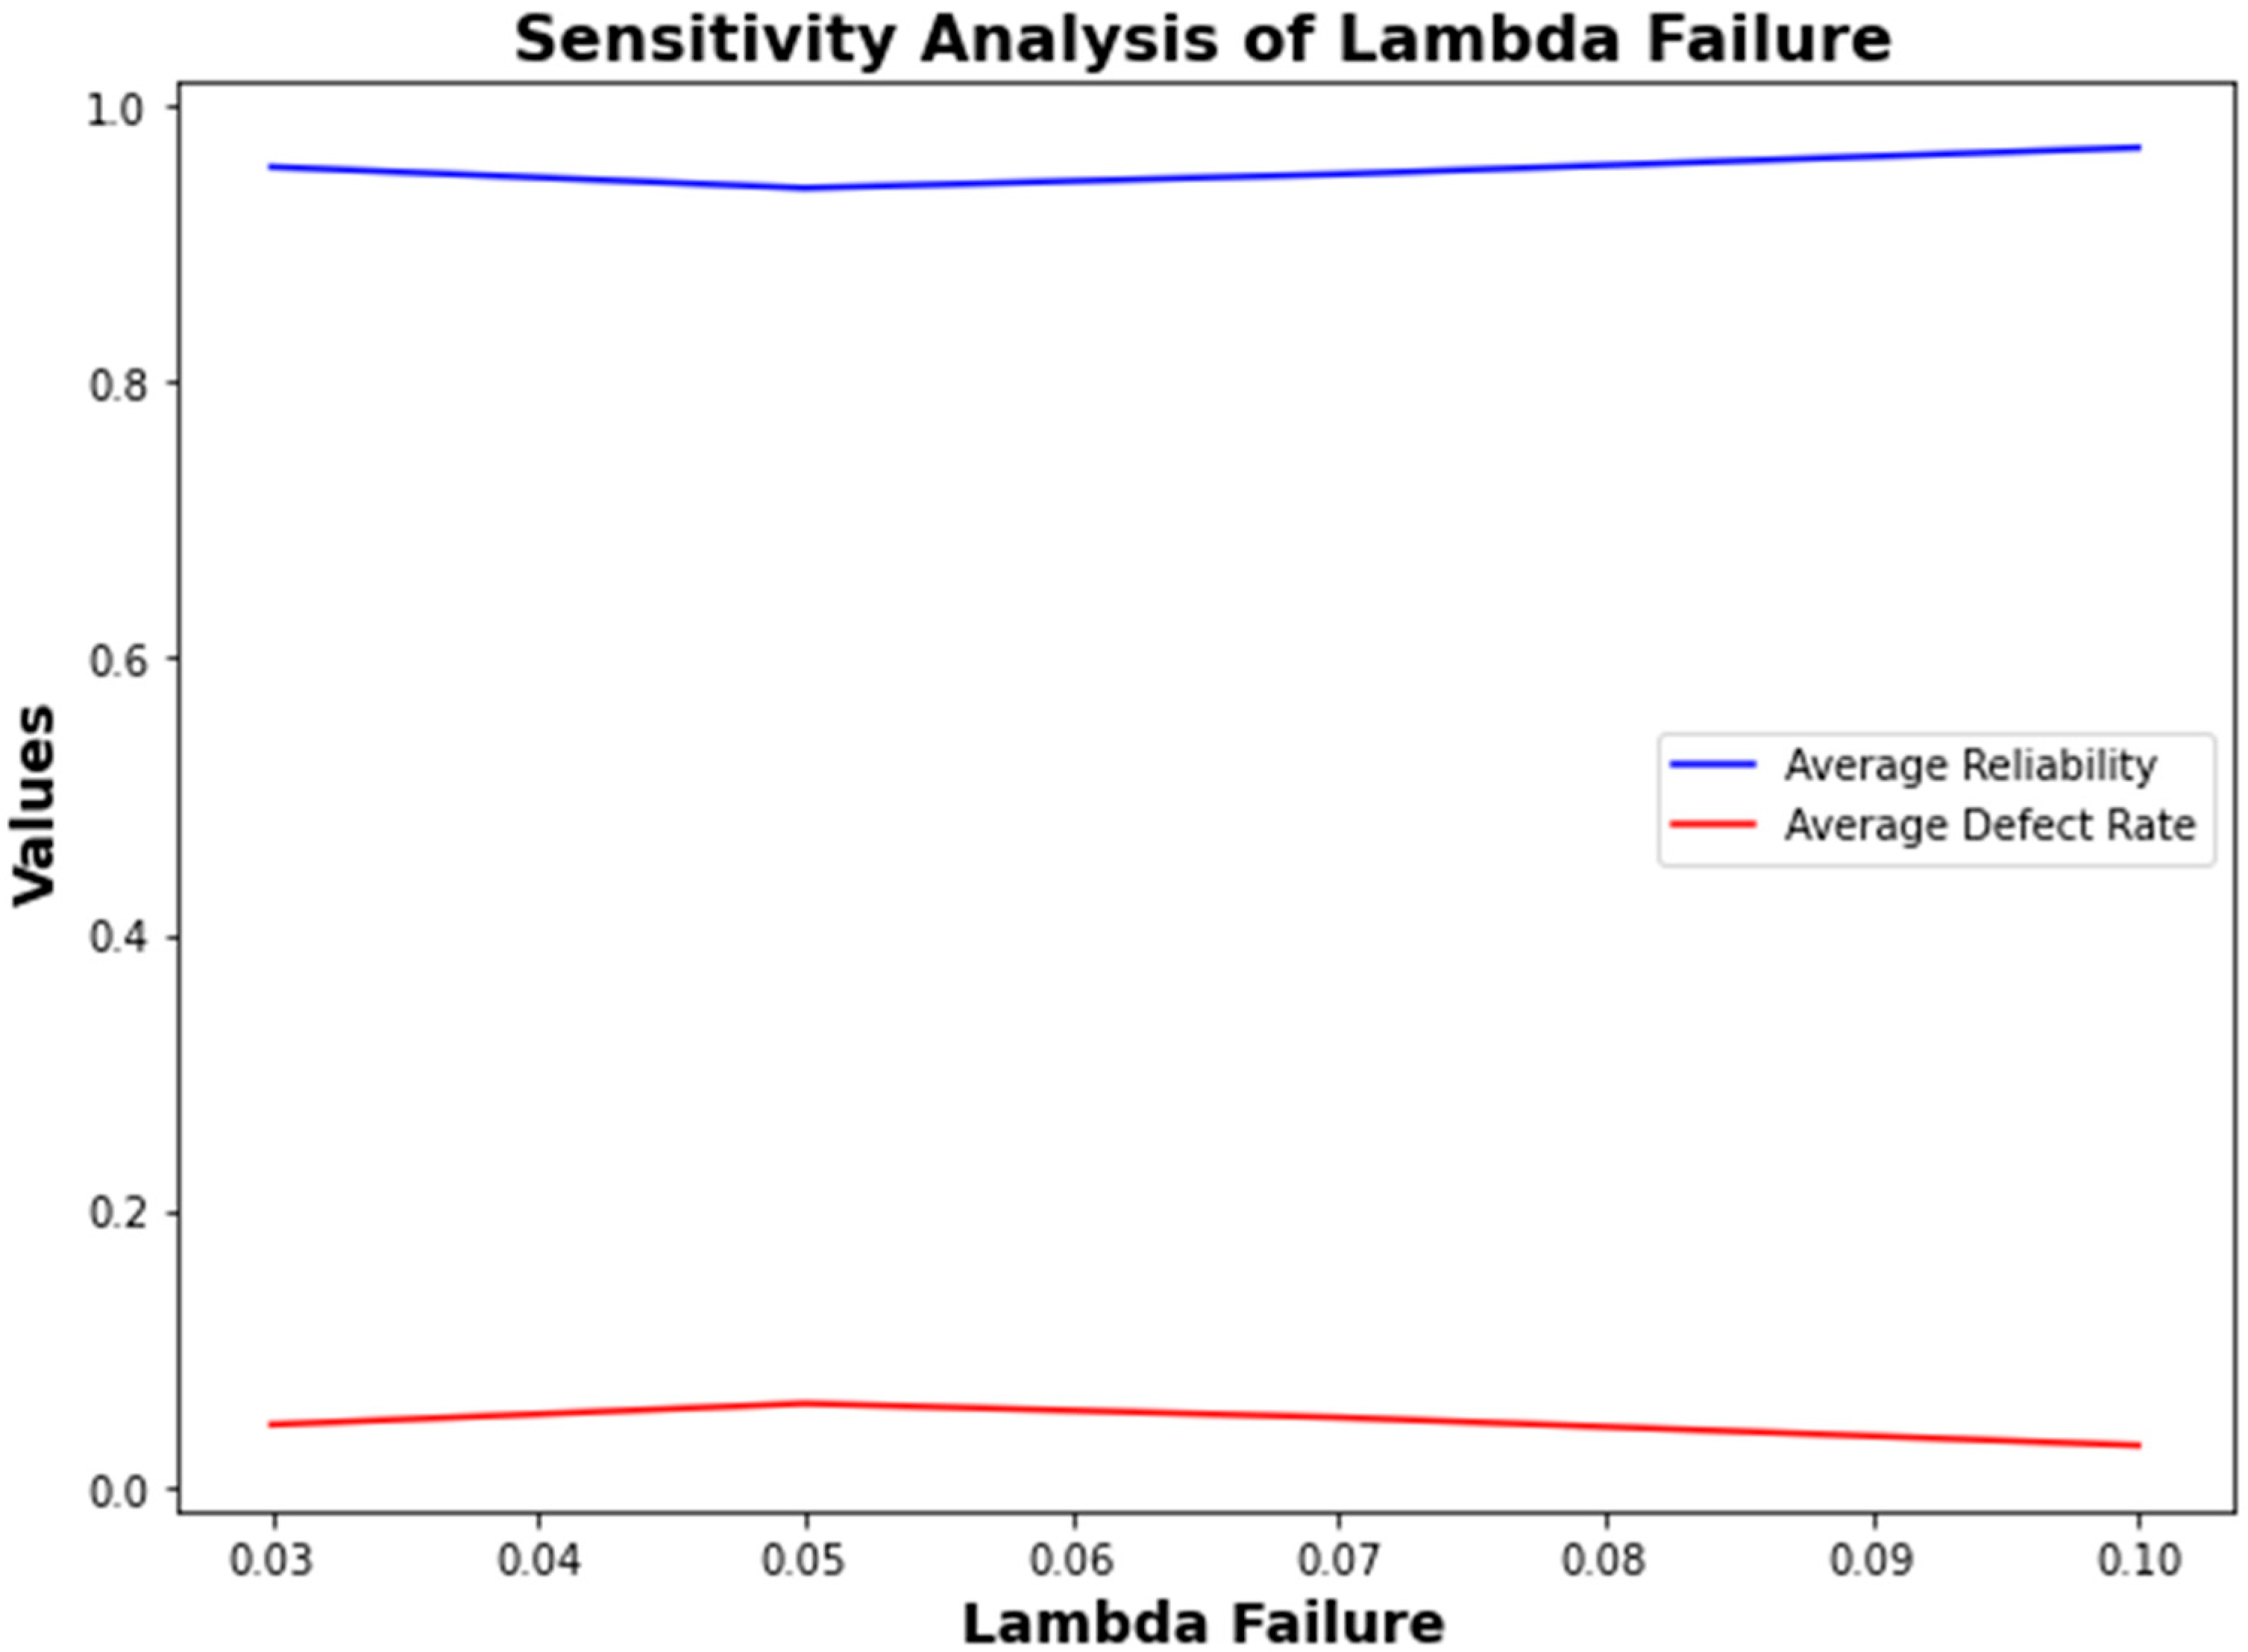
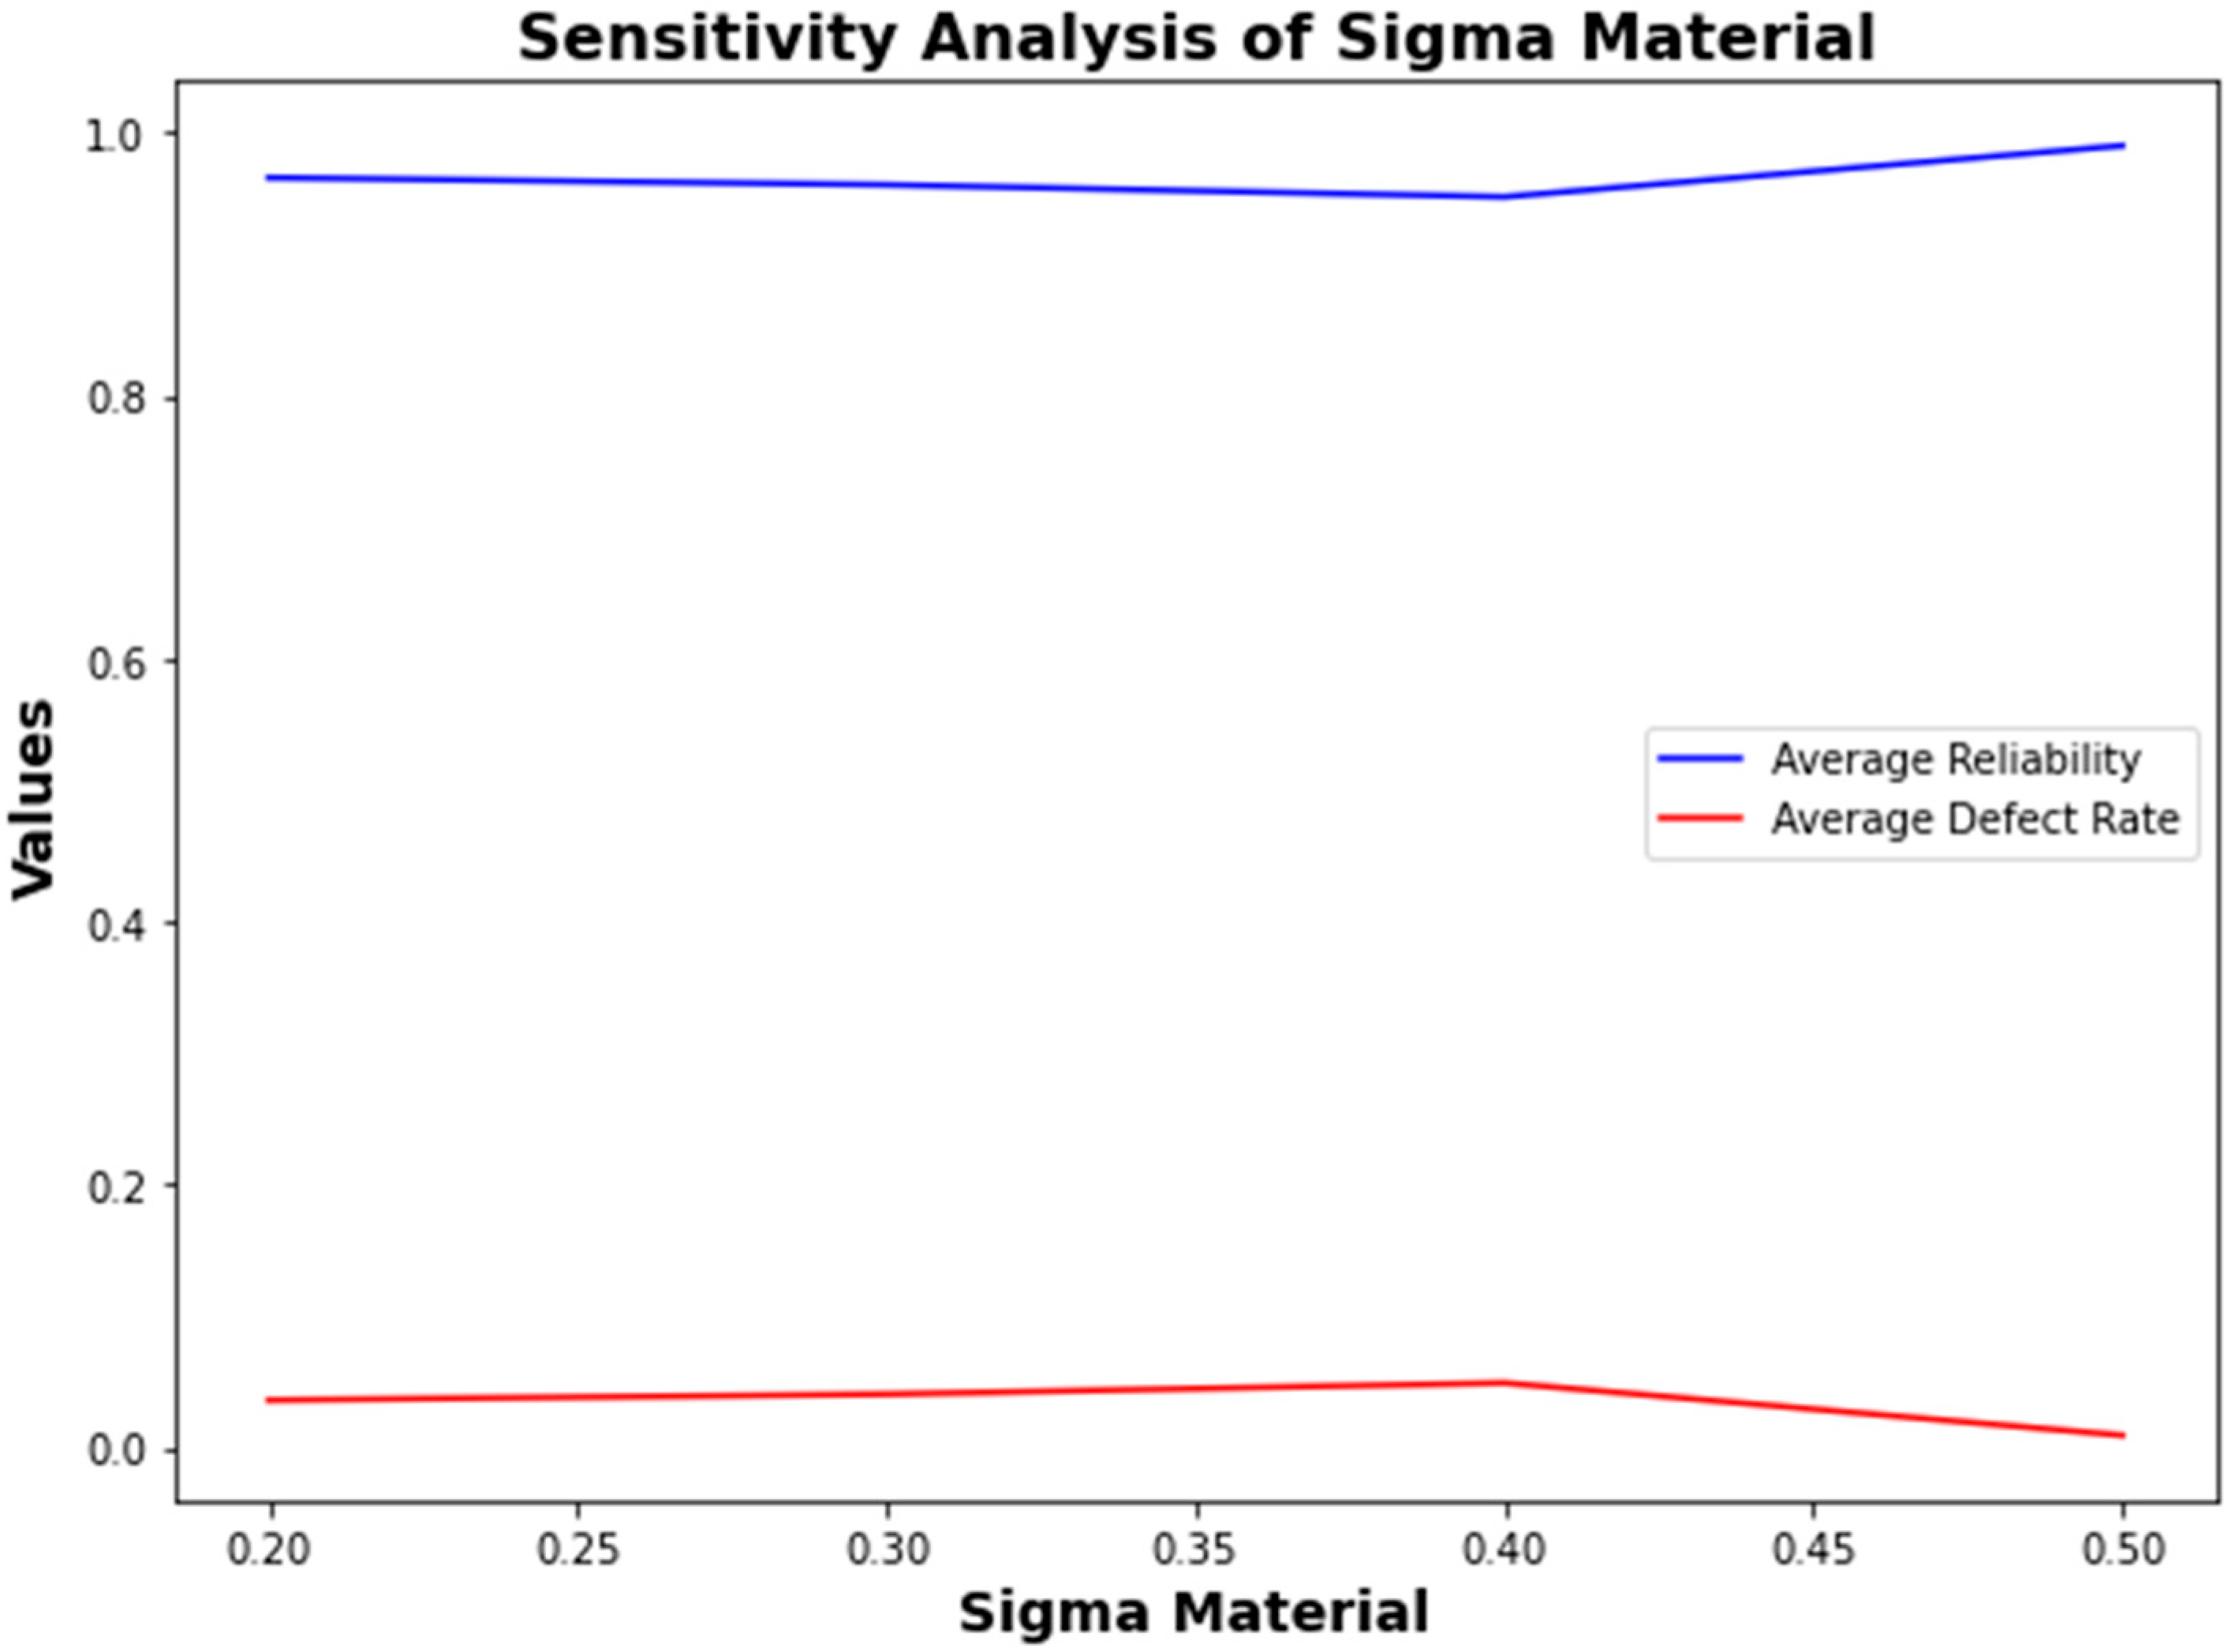
4.5. Sensitivity Analysis

Sensitivity analysis is performed through modifications of machine failure rate, material quality, production rate, inspection interval, and machine settings to study their effects on system performance. The Monte Carlo simulation runs multiple times to model reliability and defect rates. The AGA optimizes the system by modifying decision variables through the analysis of parameter variations. The analysis results are presented through KPIs, which show machine downtime, resource utilization, and convergence rates to determine optimal parameter settings for system performance improvement. The sensitivity analysis presented in Figure 10 and Figure 11 quantifies the relationship between two key process parameters—sigma material and lambda failure—based on the performance metrics of average reliability and defect rate in the PV cell production process. Figure 11 shows the sigma material’s sensitivity. The average reliability remains stable around 0.95, even as sigma material increases from 0.20 to 0.50. The average defect rate shows a slight decrease, remaining low around 0.05, even with increasing material variability.
The lambda failure sensitivity is presented in Figure 10. The reliability is high, approximately 0.95, across a wide range of lambda failure values, from 0.03 to 0.10, showing the system’s robustness to changes in machine failure rates. The defect rate remains stable but shows a slight decrease, from 0.05 at a lambda failure of 0.03 to 0.04 at a lambda failure of 0.10.
The results show that changes in sigma material and lambda failure have a minimal effect on the average reliability and defect rate. This means that the optimization model is robust, and the product quality and defect rates remain high, even with uncertainties in material quality and machine failure rates. Thus, the model provides a stable and reliable solution for PV cell production under various operating conditions.

5. Conclusions

5.1. Sensitivity Analysis

The results of this study are especially important for the PV cell manufacturing process, where it is important to ensure that the product quality and reliability are consistent. Stochastic optimization helps to control the uncertainties that are associated with the variability of raw materials, machine performance, and environmental factors in order to achieve optimal production planning and scheduling. Robust optimization ensures that the production process is efficient and that the products are of high quality even when there are fluctuations in the raw material supply or machine failure rates. Probabilistic models such as Bayesian networks predict the probability of defects or failures in solar cells, thus allowing for the necessary adjustments on the production line to avoid problems before they affect the product quality. The integration of these models can help PV cell manufacturing to decrease downtime, improve product durability, and maintain quality consistency, thus enhancing the overall process efficiency and product reliability. This approach not only deals with the inherent uncertainties but also improves the decision-making process to produce high-performance solar cells in the competitive market.

5.2. Contribution to the Field

The research makes a meaningful contribution to manufacturing science by demonstrating how stochastic and robust probabilistic models enhance quality assurance systems in uncertain production environments.
The research presents a novel method for handling process variations while maintaining product dependability.
Manufacturers who implement these models gain the ability to respond to real-time uncertainties, which leads to better decision-making.
The research demonstrates its practical application through solar panel production, as this industry requires high product quality and reliability standards.
The research establishes fundamental principles for manufacturing system resilience, which guide global industries toward practical implementation.

5.3. Practical Implications

The combination of stochastic, robust, and probabilistic models creates important practical implications for industries such as automotive, electronics, and semiconductor manufacturing, where uncertainties such as material variability and machine performance variability are prevalent.
These models improve decision-making by enabling companies to forecast and control production process-related risks.
Production scheduling in automotive manufacturing is optimized through its use when supply chain conditions change.
The reliability and yield of products in electronics and semiconductor production increase through their implementation when material qualities remain uncertain.
These high-precision industries benefit from these frameworks through improved operational efficiency, increased adaptability, and reduced costs.

Author Contributions

Conceptualization, J.O., K.A. and O.B.; methodology, O.B.; software, D.I.; validation, O.B., B.A. and U.A.K.; formal analysis, B.A. and J.O.; investigation, O.B.; resources, K.A.; data curation, B.A.; writing—original draft preparation, O.B.; writing—review and editing, K.A.; visualization, D.I.; supervision, O.O.; project administration, O.O.; funding acquisition, O.O. All authors have read and agreed to the published version of the manuscript.

Funding

This research received no external funding.

Data Availability Statement

Data is available in the paper.

Conflicts of Interest

The authors declare no conflicts of interest.

References

  1. Qamar, S.Z.; Al-Hinai, N.; Márquez, F.P.G. Quality Control and Quality Assurance: Techniques and Applications; BoD–Books on Demand: 2024. Available online: https://www.intechopen.com/books/13152 (accessed on 16 May 2025).
  2. Korshunov, G.; Petrushevskaya, A. Modeling of digital manufacturing of electronics production and product quality assurance. J. Phys. Conf. Ser. (JPCS) 2018, 150–159. [Google Scholar]
  3. Markulik, Š.; Sinay, J.; Pačaiová, H. Quality assurance in the automotive industry and industry 4.0. In Smart Technology Trends in Industrial and Business Management; Springer International Publishing: Cham, Switzerland, 2019; pp. 217–225. [Google Scholar]
  4. Trinks, S. Real Time Quality Assurance and Defect Detection in Industry 4.0. Proceedings 2021, 1613, 0073. [Google Scholar]
  5. Chandra, S.; Stanford, D.; Fletcher, E.; Walker, L.A. Raw Materials Production and Manufacturing Process Control Strategies. In The Science and Regulations of Naturally Derived Complex Drugs; Springer International Publishing: Cham, Switzerland, 2019; pp. 175–190. [Google Scholar]
  6. Wang, Y.; Li, D.; Nie, C.; Gong, P.; Yang, J.; Hu, Z.; Li, B.; Ma, M. Research progress on the wear resistance of key components in agricultural machinery. Materials 2023, 16, 7646. [Google Scholar] [CrossRef] [PubMed]
  7. Feng, D.; Gong, Q.; Wang, H.; Yi, S.; Cai, Y. Rest Breaks Arrange Based on Empirical Studies of Productivity in Manufacturing Industry. Asian Econ. Financ. Rev. 2019, 9, 1043. [Google Scholar]
  8. Malaki, A. A Study of the Effects of Operational Time Variability in Assembly Lines with Linear Walking Workers; School of Engineering in Jönköping University: Jonkoping, Sweden, 2012. [Google Scholar]
  9. Liu, C.; Yang, Y.; Liu, X. A holistic sustainability framework for remanufacturing under uncertainty. J. Manuf. Syst. 2024, 76, 540–552. [Google Scholar] [CrossRef]
  10. Hasan, K.; Yousuf, S.B.; Tushar, M.S.H.K.; Das, B.K.; Das, P.; Islam, M.S. Effects of different environmental and operational factors on the PV performance: A comprehensive review. Energy Sci. Eng. 2022, 10, 656–675. [Google Scholar] [CrossRef]
  11. Duan, F.; Eslami, M.; Okati, M.; Jasim, D.J.; Mahmood, A.K. Hybrid stochastic and robust optimization of a hybrid system with fuel cell for building electrification using an improved arithmetic optimization algorithm. Sci. Rep. 2025, 15, 1779. [Google Scholar] [CrossRef] [PubMed]
  12. Peinado-Guerrero, M.A.; Villalobos, J.R.; Phelan, P.E.; Campbell, N.A. Stochastic framework for peak demand reduction opportunities with solar energy for manufacturing facilities. J. Clean. Prod. 2021, 313, 127891. [Google Scholar] [CrossRef]
  13. Basciftci, B.; Ahmed, S.; Gebraeel, N.Z.; Yildirim, M. Stochastic optimization of maintenance and operations schedules under unexpected failures. IEEE Trans. Power Syst. 2018, 33, 6755–6765. [Google Scholar] [CrossRef]
  14. Alkan, B.; Vera, D.A.; Ahmad, M.; Ahmad, B.; Harrison, R. Complexity in manufacturing systems and its measures: A literature review. Eur. J. Ind. Eng. 2018, 12, 116–150. [Google Scholar] [CrossRef]
  15. Schlenkrich, M.; Seiringer, W.; Altendorfer, K.; Parragh, S.N. Enhancing Rolling Horizon Production Planning Through Stochastic Optimization Evaluated by Means of Simulation. arXiv 2024, arXiv:2402.14506. [Google Scholar]
  16. Yazdi, M. Maintenance strategies and optimization techniques. In Advances in Computational Mathematics for Industrial System Reliability and Maintainability; Springer: Berlin/Heidelberg, Germany, 2024; pp. 43–58. [Google Scholar]
  17. Leva, M.C.; Caimo, A.; Duane, R.; Demichela, M.; Comberti, L. Task complexity, and operators’ capabilities as predictor of human error: Modeling framework and an example of application. In Safety and Reliability–Safe Societies in a Changing World; CRC Press: Boca Raton, FL, USA, 2018; pp. 493–499. [Google Scholar]
  18. Zadeh, M.S.N.; Shoushtari, F.; Talebi, M. Optimization of Analytical Methods in Industrial Engineering: Enhancing Decision-Making in Process Design and Quality Control. Int. J. Ind. Eng. Constr. Manag. (IJIECM) 2024, 2, 27–40. [Google Scholar]
  19. Szipka, K. Modelling and Management of Uncertainty in Production Systems: From Measurement to Decision. Ph.D. Thesis, KTH Royal Institute of Technology, Stockholm, Sweden, 2018. [Google Scholar]
  20. Wolniak, R.; Grebski, W. The usage of Statistical Process Control (SPC) in Industry 4.0 conditions. Zesz. Nauk. Politech. Śląskiej. Organ. I Zarządzanie 2023, 190, 259–268. [Google Scholar] [CrossRef]
  21. Tegegne, D.A.; Kitaw, D.; Berhan, E. Advances in statistical quality control chart techniques and their limitations to cement industry. Cogent Eng. 2022, 9, 2088463. [Google Scholar] [CrossRef]
  22. Goswami, A.; Dutta, H.N. Time series approaches to statistical process control. Int. J. Innov. Res. Comput. Sci. Technol. 2013, 1, 33–37. [Google Scholar]
  23. Amaratunga, T.; Dobranowski, J. Systematic review of the application of lean and six sigma quality improvement methodologies in radiology. J. Am. Coll. Radiol. 2016, 13, 1088–1095. e1087. [Google Scholar] [CrossRef] [PubMed]
  24. Antony, J.; Sony, M.; Dempsey, M.; Brennan, A.; Farrington, T.; Cudney, E.A. An evaluation into the limitations and emerging trends of Six Sigma: An empirical study. TQM J. 2019, 31, 205–221. [Google Scholar] [CrossRef]
  25. Antony, J.; Sony, M. An empirical study into the limitations and emerging trends of Six Sigma in manufacturing and service organisations. Int. J. Qual. Reliab. Manag. 2020, 37, 470–493. [Google Scholar] [CrossRef]
  26. Taher, M.A.; Bashar, M.A. The Impact of Lean Manufacturing Concepts on Industrial Processes’ Efficiency and Waste Reduction. Int. J. Progress. Res. Eng. Manag. Sci. 2024, 4, 338–349. [Google Scholar]
  27. Rojas, T.; Mula, J.; Sanchis, R. Quantitative modelling approaches for lean manufacturing under uncertainty. Int. J. Prod. Res. 2024, 62, 5989–6015. [Google Scholar] [CrossRef]
  28. Golari, M.; Fan, N.; Jin, T. Multistage stochastic optimization for production-inventory planning with intermittent renewable energy. Prod. Oper. Manag. 2017, 26, 409–425. [Google Scholar] [CrossRef]
  29. Govindan, K.; Cheng, T. Advances in stochastic programming and robust optimization for supply chain planning. Comput. Oper. Res. 2018, 100, 262–269. [Google Scholar] [CrossRef]
  30. Bozorgi-Amiri, A.; Khorsi, M. A dynamic multi-objective location–routing model for relief logistic planning under uncertainty on demand, travel time, and cost parameters. Int. J. Adv. Manuf. Technol. 2016, 85, 1633–1648. [Google Scholar] [CrossRef]
  31. Rizqi, Z.; Khairunisa, A. Integration of deterministic and probabilistic inventory methods to optimize the balance between overstock and stockout. In Proceedings of the IOP Conference Series: Materials Science and Engineering; IOP Publishing: Bristol, UK, 2020; p. 012060. [Google Scholar]
  32. Alsharif, H.; Jalili, M.; Hasan, K.N. Power system frequency stability using optimal sizing and placement of Battery Energy Storage System under uncertainty. J. Energy Storage 2022, 50, 104610. [Google Scholar] [CrossRef]
  33. Goda, D.R.; Yerram, S.R.; Mallipeddi, S.R. Stochastic Optimization Models for Supply Chain Management: Integrating Uncertainty into Decision-Making Processes. Glob. Discl. Econ. Bus. 2018, 7, 123–136. [Google Scholar] [CrossRef]
  34. Gabrel, V.; Murat, C.; Thiele, A. Recent advances in robust optimization: An overview. Eur. J. Oper. Res. 2014, 235, 471–483. [Google Scholar] [CrossRef]
  35. Simchi-Levi, D.; Wang, H.; Wei, Y. Increasing supply chain robustness through process flexibility and inventory. Prod. Oper. Manag. 2018, 27, 1476–1491. [Google Scholar] [CrossRef]
  36. Rabbani, M.; Manavizadeh, N.; Hosseini Aghozi, N.S. Robust optimization approach to production system with failure in rework and breakdown under uncertainty: Evolutionary methods. Assem. Autom. 2015, 35, 81–93. [Google Scholar] [CrossRef]
  37. Bertocci, F.; Grandoni, A.; Fidanza, M.; Berni, R. A guideline for implementing a robust optimization of a complex multi-stage manufacturing process. Appl. Sci. 2021, 11, 1418. [Google Scholar] [CrossRef]
  38. Grešová, E.; Svetlík, J. Mathematical modeling of the manufacturing sector’s dominant part as a base for automation. Appl. Sci. 2021, 11, 3295. [Google Scholar] [CrossRef]
  39. Nannapaneni, S.; Mahadevan, S.; Rachuri, S. Performance evaluation of a manufacturing process under uncertainty using Bayesian networks. J. Clean. Prod. 2016, 113, 947–959. [Google Scholar] [CrossRef]
  40. Xiong, M.; Chen, L.; Ming, J. Quantify uncertainty by estimating the probability density function of the output of interest using mlmc based bayes method. Discret. Contin. Dyn. Syst. Ser. B 2023, 28, 707–721. [Google Scholar] [CrossRef]
  41. Sun, H.; Zhao, S.; Peng, F.; Yan, R.; Zhou, L.; Zhang, T.; Zhang, C. In-situ prediction of machining errors of thin-walled parts: An engineering knowledge based sparse Bayesian learning approach. J. Intell. Manuf. 2024, 35, 387–411. [Google Scholar] [CrossRef]
  42. Gunjan, S.B.; Srinivasu, D. A new approach for product reliability prediction by considering the production factory lifecycle information. Reliab. Eng. Syst. Saf. 2025, 258, 110915. [Google Scholar] [CrossRef]
  43. Lu, M.; Shen, Z.J.M. A review of robust operations management under model uncertainty. Prod. Oper. Manag. 2021, 30, 1927–1943. [Google Scholar] [CrossRef]
  44. Khakifirooz, M.; Fathi, M.; Wu, K. Development of smart semiconductor manufacturing: Operations research and data science perspectives. IEEE Access 2019, 7, 108419–108430. [Google Scholar] [CrossRef]
  45. Fenton, N.; Neil, M.; Marquez, D. Using Bayesian networks to predict software defects and reliability. Proc. Inst. Mech. Eng. Part O J. Risk Reliab. 2008, 222, 701–712. [Google Scholar] [CrossRef]
  46. Kumar, J.; Yadav, G.; Agrawal, B. A Hybrid Stochastic Optimization Model for Lot Sizing and Scheduling Problem. Cuest. De Fisioter. 2025, 54, 2007–2018. [Google Scholar]
  47. Duan, C.; Deng, C.; Li, N. Reliability assessment for CNC equipment based on degradation data. Int. J. Adv. Manuf. Technol. 2019, 100, 421–434. [Google Scholar] [CrossRef]
  48. Li, S.; Chen, Z.; Liu, Q.; Shi, W.; Li, K. Modeling and analysis of performance degradation data for reliability assessment: A review. IEEE Access 2020, 8, 74648–74678. [Google Scholar] [CrossRef]
Figure 1. Stochastic optimization framework for enhancing manufacturing quality assurance.
Jmmp 09 00250 g001
Figure 2. Best fitness over generations.
Jmmp 09 00250 g002
Figure 3. Objective function over generations.
Jmmp 09 00250 g003
Figure 4. Average reliability.
Jmmp 09 00250 g004
Figure 5. Average defect rate.
Jmmp 09 00250 g005
Figure 6. Machine downtime.
Jmmp 09 00250 g006
Figure 7. Resource utilization.
Jmmp 09 00250 g007
Figure 8. Best reliability.
Jmmp 09 00250 g008
Figure 9. Convergence rate over generations.
Jmmp 09 00250 g009
Figure 10. Sensitivity analysis of lambda failure.
Jmmp 09 00250 g010
Figure 11. Sensitivity analysis of sigma material.
Jmmp 09 00250 g011
Table 1. Input parameters for the stochastic optimization model.
ParameterDescriptionValue/Range
Production Rate ( x 1 ) The number of units produced per day.1500 to 2500 units per day
Inspection Interval x 2 Time between inspections 0.5 to 2 h
Machine Setting ( x 3 ) Machine settings 200 to 500 (representing machine settings)
Weibull Distribution ( λ ) Scale parameter for the Weibull distribution, representing failure rate.0.1 (scale parameter)
Weibull Distribution ( k ) Shape parameter for the Weibull distribution, influencing failure behavior.1.5 (shape parameter)
Material Quality ( σ ) Standard deviation of material quality variation 0.3 (standard deviation)
Population Size The number of individuals in the genetic algorithm population.200 (population size)
Max Generations The maximum number of generations for the genetic algorithm.100 (generational limit)
Disclaimer/Publisher’s Note: The statements, opinions and data contained in all publications are solely those of the individual author(s) and contributor(s) and not of MDPI and/or the editor(s). MDPI and/or the editor(s) disclaim responsibility for any injury to people or property resulting from any ideas, methods, instructions or products referred to in the content.

