Abstract
Manufacturing processes are inherently complex, multi-objective in nature, and highly sensitive to process parameter settings. This paper presents two simple and efficient optimization algorithms—Best–Worst–Random (BWR) and Best–Mean–Random (BMR)—developed to solve both constrained and unconstrained optimization problems of manufacturing processes involving single, multi-, and many-objectives. These algorithms are free from metaphorical inspirations and require no algorithm-specific control parameters, which often complicate other metaheuristics. Extensive testing reveals that BWR and BMR consistently deliver competitive, and often superior, performance compared to established methods. Their multi- and many-objective extensions, named MO-BWR and MO-BMR, respectively, have been successfully applied to tackle 2-, 3-, and 9-objective optimization problems in advanced manufacturing processes such as friction stir processing (FSP), ultra-precision turning (UPT), laser powder bed fusion (LPBF), and wire arc additive manufacturing (WAAM). To aid in decision-making, the proposed BHARAT can be integrated with MO-BWR and MO-BMR to identify the most suitable compromise solution from among a set of Pareto-optimal alternatives. The results demonstrate the strong potential of the proposed algorithms as practical tools for intelligent decision-making in real-world manufacturing applications.
1. Introduction
Manufacturing is the backbone of industrial development, contributing significantly to economic growth, employment, and technological progress. The effectiveness of manufacturing processes is critically influenced by process parameters such as temperature, forces, speed, feed rate, and material flow. These parameters directly impact product quality, energy efficiency, dimensional accuracy, surface finish, and overall productivity. The challenge lies in selecting and fine-tuning these parameters to achieve optimal process performance while minimizing costs and resource wastage. Traditional parameter selection methods, such as trial-and-error or empirical approaches, often result in suboptimal outcomes and extended development cycles. As modern manufacturing embraces digitalization and Industry 4.0, there is a growing need for intelligent and data-driven optimization techniques that can adaptively respond to process complexity and dynamic variability.
Process parameter optimization involves formulating objectives and constraints, developing suitable models, and applying optimization algorithms to identify the best parameter combinations. The number of objectives considered for optimization may be one (i.e., single objective), or more than one (i.e., multiple objectives). Most manufacturing processes have more than one conflicting objectives, such as
- Maximize metal removal rate ↔ Minimize surface roughness
- Maximize efficiency ↔ Minimize cost
- Maximize hardness ↔ Minimize energy consumption
Optimization problems involving four or more objectives are referred to as many-objective optimization problems. For example, for parameters optimization of a wire arc additive manufacturing process, objectives such as the following may be considered:
- Maximize width ↔ Maximize hardness ↔ Minimize substrate distortion ↔ Minimize interlayer waiting time, etc.
In multi- and many-objective scenarios—common in real-world manufacturing—trade-offs must be handled judiciously to ensure balanced solutions across conflicting objectives. Multi- and many-objective optimization methods help identify trade-offs and generate Pareto-optimal solutions, offering flexibility to decision-makers.
Process parameter optimization has spurred a wave of research integrating statistical methods, metaheuristic algorithms, artificial intelligence (AI), and hybrid frameworks. Many researchers have used population-based advanced optimization algorithms (also called metaheuristics) and AI tools for the parameter optimization of different manufacturing processes. Numerous studies have focused on enhancing energy efficiency and optimizing performance in both conventional and advanced manufacturing processes, particularly machining, using a range of traditional and modern optimization techniques [1,2,3,4,5,6,7]. The inherent complexity and variability of additive manufacturing (AM) have driven the growing adoption of artificial intelligence (AI)-based and multi-objective optimization approaches [8,9,10,11,12,13]. In the context of welding processes, recent reviews have highlighted the use of hybrid optimization strategies to improve modeling accuracy and process control [14,15,16]. Additionally, surrogate modeling has emerged as a promising approach for reducing the computational costs associated with high-fidelity simulations [17,18]. While relevant details can be found in the existing literature [1,2,3,4,5,6,7,8,9,10,11,12,13,14,15,16,17,18], they are not elaborated here due to space limitations.
This paper focuses on the application of metaheuristics (also called advanced optimization algorithms) for the optimization of various manufacturing processes. Metaheuristics are particularly useful because of their ability to adapt in complex, high-dimensional landscapes. These heuristic approaches iteratively refine a population of candidate solutions, effectively exploring and exploiting the search space to achieve convergence toward global optima.
The popularity of metaheuristics stems from their numerous strengths—flexibility, independence from gradient information, suitability for multi-objective optimization, global exploration capabilities, and ease of customization [19,20]. However, despite these strengths, metaheuristics also face several limitations that should not be overlooked. One significant drawback is the lack of theoretical guarantees for achieving global optimality in most cases. Additionally, they may exhibit convergence issues, especially when dealing with highly complex, nonlinear, or large-scale optimization problems. Another critical concern is the often considerable dependency on the proper tuning of algorithm-specific parameters, which, if misconfigured, can lead to poor convergence behavior or unnecessarily high computational costs. For example, genetic algorithm (GA) requires tuning of the selection method, crossover and mutation methods, and probabilities; particle swarm optimization (PSO) requires tuning of cognitive and social coefficients and inertia weight; and ant colony algorithm (ACO) requires tuning of pheromone evaporation rate, pheromone and heuristics importances, etc. Although a few parameter-less or parameter-light methods—such as the Jaya algorithm and the Rao family of algorithms—have been developed to overcome this challenge, the majority of metaheuristics still require careful parameter calibration to perform effectively and efficiently [21,22,23]. Improper calibration may lead to suboptimal convergence or excessive computational overhead.
Over the past decade, the landscape of metaheuristics has witnessed an overwhelming influx of novel algorithms, many of which are metaphor-inspired. These include inspirations from natural events, animal behaviors, astronomical phenomena, physical processes, and even cultural practices. While this creativity is commendable, a concerning trend has emerged—many algorithms are developed by loosely associating mathematical models with arbitrary metaphors. Often, these associations lack scientific justification, with the metaphor serving as nothing more than a decorative framework [24,25,26]. Given these observations, the specific objectives of the present work are as follows:
- To establish that effective optimization techniques can be developed without relying on metaphor-based analogies.
- To present two straightforward, metaphor-independent, and parameter-free optimization algorithms—BWR and BMR—along with their multi-objective extensions.
- To assess the convergence behavior and solution precision of the proposed algorithms across single-, multi-, and many-objective optimization problems related to various manufacturing processes, with the aim of identifying potential improvements in outcomes.
- To apply the recently introduced BHARAT (Best Holistic Adaptable Ranking of Attributes Technique) for identifying the most appropriate compromise solution from a Pareto-optimal set in manufacturing process optimization.
The next section describes the proposed algorithms.
2. Materials and Methods: BWR and BMR Algorithms
2.1. Proposed Algorithms for Solving Single-Objective Constrained Optimization Problems
This section delineates the procedural framework of the two newly developed optimization algorithms—Best–Worst–Random (BWR) and Best–Mean–Random (BMR). Both methods operate without relying on metaphorical analogies or algorithm-specific control parameters, focusing instead on simple arithmetic-based search strategies within a population of candidate solutions.
2.1.1. Best–Worst–Random (BWR) Algorithm
Let the objective function be optimized and denoted as f(x), where the goal is either minimization or maximization. Assume that the problem consists of m design variables (indexed by v = 1,2,…,m) and a population of c candidate solutions (or individuals, where k = 1,2,…,c), evolving through iterative updates indexed by i. Each design variable is constrained within predefined bounds: a lower bound Lv and an upper bound Hv. The algorithm begins by randomly generating an initial population of solutions. If any variable exceeds its permissible range, it is clipped to its respective boundary value.
Next, the feasibility of each candidate is checked against the problem’s constraints. If any constraints are violated, appropriate penalty functions are imposed. These penalties +may be static, dynamic, or any other user-defined function. For constraint violation gj(x), a typical penalty is pj(x) = gj(x)2. The penalized objective, denoted M(x), is calculated as follows:
- M(x) = f(x) + ∑pj(x) for minimization
- M(x) = f(x) − ∑pj(x) for maximization
The best solution is the one with the most favorable objective (e.g., the lowest M(x) in minimization), while the worst represents the least favorable. Let Sj,k,i is the vth variable’s value for the kth population in the ith iteration. Also, let the best, worst, mean, and random values of the vth variable during the ith iteration are Sv,b,i, Sv,w,i, Sv,m,i, and Sv,r,i, respectively. Additionally, let n1, n2, n3, and n4 be randomly generated numbers from a uniform distribution in [0, 1], and F be a random factor (either 1 or 2). The candidate solution is updated using the following rules:
Modify the values of Sj,k,i and compute the new values. The new value S’v,k,i is computed using Equation (1), if n4 > 0.5.
S’v,k,i = Sv,k,i + n1,v,i (Sv,b,i − F × Sv,r,i) − n2,v,i (Sv,w,i − Sv,r,i)
Else, S’v,k,i = Hv − (Hv − Lv)n3
Based on the S’v,k,i values, check the constraints gj(x), apply the penalties if applicable, and compute M(x). Compare the new values of M(x) with the corresponding previous values of M(x) during the ith iteration and retain the solutions yielding improved M(x) values for the next iteration.
This process continues until a predefined termination criterion—typically, a maximum number of iterations or function evaluations—is met. Upon completion, the algorithm reports the optimal variable values and corresponding objective functions.
2.1.2. Best–Mean–Random (BMR) Algorithm
The Best–Mean–Random (BMR) algorithm follows a structure very similar to the BWR method, with one key modification in the solution update mechanism. Instead of leveraging the worst solution, the BMR algorithm incorporates the mean value of the population in the updated equation.
S’v,k,i = Sv,k,i + n1,v,i (Sv,b,i − F × Sv.m,i) + n2,v,i (Sv,b,i − Sv,r,i), if n4 > 0.5
Else, use Equation (2).
All subsequent steps—penalty evaluation, objective comparison, and population update—remain identical to those in the BWR algorithm.
Figure 1 shows the flowchart that illustrates the generic process of both the BWR and BMR algorithms.
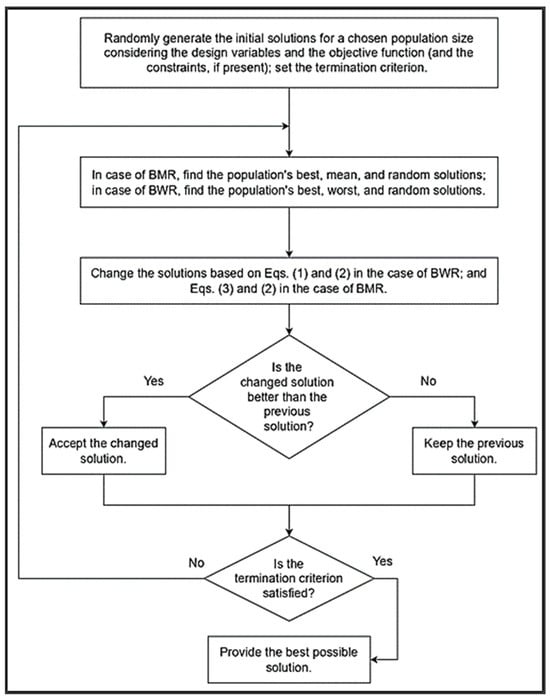
Figure 1.
Generic flowchart of the BWR and BMR algorithms.
2.1.3. Demonstration of the BWR and BMR Algorithms on a Constrained Benchmark Function
Demonstration of the BWR Algorithm
To illustrate the efficacy and internal mechanics of the proposed BWR and BMR algorithms, a well-established benchmark problem—the constrained Himmelblau function—is employed.
The Himmelblau function is defined as Equation (4):
f(x): Minimize (x12 + x2 − 11)2 + (x1 + x22 − 7) 2
Subject to the constraints given by Equations (5) and (6),
g1(x) = 26 − (x1 − 5) 2 − x22
g2(x) = 20 − 4 × x1 − x2
The variable bounds are given by Equation (7):
−5 ≤ x1,x2 ≤ 5.
The known global minimum of this constrained problem is f(x) = 0.
Step 1: The given objective function has two design variables, x1 and x2. A population size of 5 is considered for demonstration. The termination criterion is considered to be 1000 iterations. The solutions are randomly generated and are given in Table 1.

Table 1.
Randomly generated initial population.
Step 2: The best value M(x) of the objective function considering the constraints are identified and shown in Table 1. The best values of x1 and x2 and M(x) are identified and indicated in bold. The worst value of M(x) of the objective function is 442.7301, and it corresponds to solution 3. The worst values of x1 and x2 and M(x) are identified and indicated in italics in Table 1.
Step 3: The best value M(x) of the objective function considering the constraints corresponds to solution 1, as it is a minimization problem. Let the random numbers generated for x1 be n1 = 0.42, n2 = 0.93, n3 = 0.74, and the random numbers generated for x2 be n1 = 0.75, n2 = 0.35, n3 = 0.68. The random number n4 is a randomly generated number during an iteration, and its value decides to use either Equation (1) or Equation (2) for modifying the values of x1 and x2. Let the value of n4 be 0.67 during the first iteration, which is greater than 0.5. Using Equations (1) and (2), the values of x1 and x2 are modified. For example, during the first iteration for candidate solution 1 that interacts randomly with candidate solution 4, the new (i.e., modified) values of x1 and x2 are computes as follows:
S’x1,1,1 = 1.05763 + 0.42 × (1.05763 − 1 × 3.02432) − 0.93 × (4.82116 − 3.02432) = −1.43944
S’x2,1,1 = 1.85684 + 0.75 × (1.85684 − 1 × 3.64295) − 0.35 × (−4.67009 − 3.64295) = 3.42682
The modified values of x1 and x2, the corresponding f(x), g1(x), p1, g2(x), p2, and M(x) are also computed and are given in Table 2. In this iteration, the new values of x1 and x2 for the candidate solutions 1, 2, 3, 4, and 5 are calculated considering the candidate solutions 4, 5, 1, 2, and 3, respectively, as the random solutions to interact.

Table 2.
Modified values of the variables, constraints, penalties, and objective function (first iteration) obtained using the BWR algorithm.
Step 4: The new values of M(x) in Table 2 are compared with the corresponding previous values of M(x) in Table 1 during the first iteration. The best M(x) values are retained, and the corresponding population is given in Table 3.

Table 3.
Updated values of the variables, constraints, penalties, and objective function (first iteration) obtained using the BWR algorithm.
It can be seen that the best value at the end of the first iteration is 32.84193 and the worst value is 171.8241. This shows the improvement in the best solution compared to the randomly generated initial population.
Step 5: Now, considering Table 3 as input, the second iteration can be carried out as the termination criterion is not reached, and so on. The second iteration results are not produced here for space limitations.
Step 6: Suppose the termination criterion of 1000 iterations is reached; the final results at the end of the 1000th iteration are as given in Table 4.

Table 4.
Updated values of the variables, constraints, penalties, and objective function (1000th iteration) obtained using the BWR algorithm.
It can be seen that the optimum solution of 0 is achieved by the proposed BWR algorithm with the optimum values of x1 = 3.584428 and x2 = −1.848126. The convergence graph is shown in Figure 1. The convergence is rapid, with the best result attained by iteration 159 (for a population size of 5), as illustrated in the convergence plot (Figure 2). The number of iterations required to reach 95% optimality is 40.
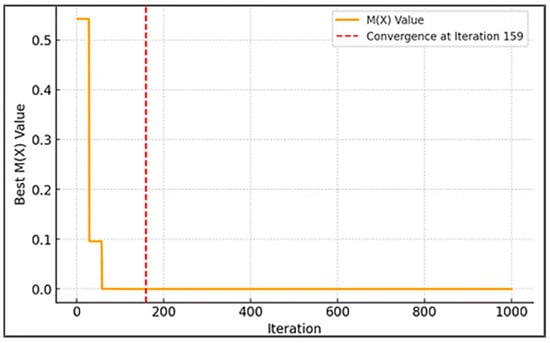
Figure 2.
Convergence graph for the BWR algorithm for the constrained Himmelblau function.
Demonstration of BMR Algorithm
Now, to demonstrate the proposed BMR optimization algorithm, the same constrained Himmelblau function is considered. For comparing its performance with that of the BWR algorithm, the initial population generated in Table 1 is considered and the new values of x1 and x2 are calculated using Equation (3) (or Equation (2), if the values cross the bounds). The mean value of x1 is 3.294428, and the mean value of x2 is 1.03952 (from Table 1). Considering the same random interactions of candidate solutions 1–5 with 4, 5, 1, 2, and 3 like in the BWR algorithm, the new values of the population are given in Table 5. For example, during the first iteration for candidate solution 1 that interacts randomly with candidate solution 4, the new (i.e., modified) values of x1 and x2 are calculated using the BMR algorithm as follows:
S’x1,1,1 = 1.05763 + 0.42 × (1.05763 − 1 × 3.294428) + 0.93 × (1.05763 − 3.02432) = −1.71085
S’x2,1,1 = 1.85684 + 0.75 × (1.85684 − 1 × 1.03952) + 0.35 × (1.85684 − 3.64295) = 1.844692

Table 5.
Modified values of the variables, constraints, penalties, and objective function (first iteration) obtained using the BMR algorithm.
The modified values of x1 and x2, the corresponding f(x), g1(x), p1, g2(x), p2, and M(x) are also computed and are given in Table 5.
The new values of M(x) in Table 5 are compared with the corresponding previous values of M(x) in Table 1 during the first iteration. The best M(x) values are retained, and the corresponding population is given in Table 6.

Table 6.
Updated values of the variables, constraints, penalties, and objective function (first iteration) using the BMR algorithm.
It can be seen that the best value at the end of the first iteration using BMR algorithm is 70.61647 and the worst value is 178.0028. This shows the improvement in the worst solution compared to the randomly generated worst solution of 442.7301, given in Table 1.
Now, considering Table 6 as input, the second generation can be carried out, and so on. Suppose 1000 iterations are carried out with the same population size of 5; the final results at the end of the 1000th iteration are exactly the same as those given in Table 4. The BMR algorithm also obtained the optimum solution of 0 with the optimum values of x1 = 3.584428 and x2 = −1.848126. The convergence graph for the BMR algorithm is shown in Figure 3. However, the BMR algorithm converged faster, reaching the optimal solution by iteration 121, whereas the BWR reached it by iteration 159. The number of iterations required to reach 95% optimality is 25.
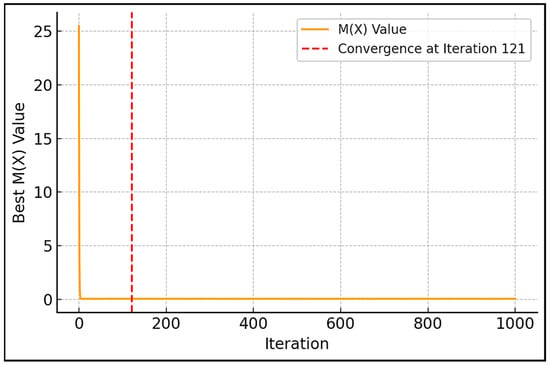
Figure 3.
Convergence graph for the BMR algorithm for the constrained Himmelblau function.
To comprehensively evaluate the performance of the proposed BWR and BMR algorithms, a benchmark suite of 12 constrained engineering optimization problems is selected. These problems were recently addressed by Ghasemi et al. [27] using a metaphor-based technique known as the Flood Algorithm (FLA). Their study involved comparisons with more than 30 optimization algorithms, including methods such as the real-coded genetic algorithm (RCGA), comprehensive learning particle swarm optimization (CLPSO), self-adaptive differential evolution (SADE), ensemble of parameters and mutation strategies in DE (EPSDE), adaptive unified DE (AUDE2), fully informed PSO (FIPSO), orthogonal learning PSO (OLPSO), static heterogeneous PSO (SHPSO), artificial bee colony (ABC), genetic algorithm (GA), gray wolf optimization (GWO), whale optimization algorithm (WOA), and memory-guided sine–cosine algorithm (MG-SCA), among others. These encompassed a wide range of nature-inspired, swarm-based, and hybrid optimization strategies.
For brevity and to avoid redundancy, the mathematical formulations, decision variables, constraints, and bounds of these 12 problems are not reproduced here, as they are thoroughly documented in the original work by Ghasemi et al. [27]. In the present study, the BMR and BWR algorithms are applied to the same set of problems using identical experimental conditions, including 30 independent runs per problem, as employed by Ghasemi et al. [27] for the FLA and the other comparison algorithms. Since the FLA [27] has already claimed superiority over the other algorithms, their results have been omitted from Table 7. It is considered sufficient to evaluate the performance of the BWR and BMR algorithms by comparing them directly with the FLA [27].

Table 7.
Statistical measures obtained using the BWR and BMR algorithms and FLA [27] for 12 constrained single-objective engineering design problems.
The results obtained from the BMR and BWR algorithms are presented in Table 7, with the best-performing values highlighted in bold. Given that the FLA [27] has already demonstrated its superiority over a broad set of optimization algorithms, only the FLA results are retained for comparison in Table 7. This ensures clarity and conciseness while providing a sufficient basis for evaluating the relative performance of the proposed algorithms.
The results now show that the proposed metaphor-free BMR and BWR algorithms consistently outperformed FLA across all 12 problems, thereby surpassing not only FLA itself but also the entire set of algorithms that FLA had previously outperformed. The BWR and BMR algorithms consistently outperformed in all statistical metrics (best, mean, worst, and standard deviation), often with perfect or near-zero variance, indicating superior convergence stability. The key strengths demonstrated by BMR and BWR in this context include exceptional accuracy, stable performance across multiple independent runs, and zero or near-zero standard deviations, confirming robustness. Hence, the BWR and BMR algorithms are considered in this paper for solving real-life constrained manufacturing optimization tasks. For detailed results and comparisons of the benchmark functions, readers are referred to the preprint by Rao and Shah [28] available on arXiv.
It may be noted that the proposed BWR and BMR algorithms are metaphor-less and algorithm-specific control parameter-less. The Jaya algorithm and the three Rao algorithms [23] also possess these features. Hence, Table 8 is presented below to present the novel features of the proposed BWR and BMR algorithms and to differentiate them from the Jaya and Rao algorithms.

Table 8.
Differences between the Jaya, Rao, BWR, and BMR algorithms.
The generalized pseudocodes of the BWR and BMR algorithms are given below in Algorithm 1.
| Algorithm 1. Generalized pseudocodes of the BWR and BMR algorithms. |
| 1: Begin BWR/BMR Algorithm 2: Initialize: 3: -Number of variables: m 4: -Population size: c 5: -Maximum iterations: max_iter 6: -Variable bounds: Lv and Hv for v = 1 to m 7: -Algorithm mode: “BWR” or “BMR” 8: -Optimization goal: “min” or “max” 9: Generate initial population: 10: For k = 1 to c: 11: For v = 1 to m: 12: Sv,k,0 ← random value in [Lv, Hv] 13: Evaluate initial population: 14: For each individual k: 15: Compute objective f(x_k) 16: For each violated constraint gj(x_k): 17: Compute penalty pj(x_k) = gj(x_k)^2 18: Compute penalized objective M(x_k): 19: If goal = “min”: M(x_k) = f(x_k) + ∑ pj(x_k) 20: If goal = “max”: M(x_k) = f(x_k) − ∑ pj(x_k) 21: Set iteration i = 0 22: Repeat until i = max_iter: 23: Identify: 24: - Best solution Sv,b,i: 25: If goal = “min”: lowest M(x) 26: If goal = “max”: highest M(x) 27: - Worst solution Sv,w,i: 28: If goal = “min”: highest M(x) 29: If goal = “max”: lowest M(x) 30: - Mean vector Sv,m,i (mean of each variable across population) 31: - Random solution Sv,r,i (randomly selected from population) 32: For each individual k = 1 to c: 33: For each variable v = 1 to m: 34: Generate random numbers: n1, n2, n3, n4 ∈ [0, 1], F ∈ {1, 2} 35: If n4 > 0.5: 36: If mode = “BWR”: 37: S'v,k,i = Sv,k,i + n1 * (Sv,b,i − F * Sv,r,i) 38: - n2 * (Sv,w,i - Sv,r,i) 39: Else if mode = “BMR”: 40: S'v,k,i = Sv,k,i + n1 * (Sv,b,i − F * Sv,m,i) 41: + n2 * (Sv,b,i - Sv,r,i) 42: Else: 43: S'v,k,i = Hv − (Hv − Lv) * n3 44: Enforce bounds: 45: If S'v,k,i < Lv then S'v,k,i = Lv 46: If S'v,k,i > Hv then S'v,k,i = Hv 47: Evaluate new solution S'_k: 48: Compute f(S'_k) 49: For each violated constraint gj(S'_k): 50: Compute pj(S'_k) = gj(S'_k)^2 51: Compute M(S'_k): 52: If goal = “min”: M(S'_k) = f(S'_k) + ∑ pj(S'_k) 53: If goal = “max”: M(S'_k) = f(S'_k) − ∑ pj(S'_k) 54: Compare with previous M(x_k): 55: If (goal = “min” and M(S'_k) < M(x_k)) or 56: (goal = “max” and M(S'_k) > M(x_k)): 57: Accept S'_k as new solution 58: Increment i ← i + 1 59: Return best solution and its objective value 60: End Algorithm |
3. Materials and Methods: MO-BWR and MO-BMR Algorithms
This section is divided into two sub-sections. The first Section 3.1, describes the multi- and many-objective versions of the BWR and BMR algorithms, and the second Section 3.2, describes the multi-attribute decision-making aspects involved in selecting the best compromise Pareto-optimal solution from among the available non-dominated solutions.
3.1. Multi-Objective and Many-Objective Optimization Using BWR and BMR Algorithms
The multi- and many-objective versions of BWR and BMR are named MO-BWR and MO-BMR, respectively. These algorithms consist of features like elite seeding, fast non-dominated sorting, constraint repairing, penalty application (if constraint repairing does not work), local exploration, and edge boosting features. The procedural steps are briefly given in Table 9.

Table 9.
Procedural steps of the MO-BWR and MO-BMR algorithms.
The generalized pseudocodes of the MO-BWR and MO-BMR algorithms are given below in Algorithm 2.
| Algorithm 2. The generalized pseudocodes of the MO-BWR and MO-BMR algorithms. |
| 1: Begin MO-BWR/MO-BMR Algorithm 2: Step 1: Initialization 3: -Define: 4: •Design variables and bounds Lv, Hv (for v = 1 to m) 5: •Objective functions f1(x), f2(x),…, fM(x) 6: •Constraints gj(x) ≤ 0 (inequality), hj(x) = 0 (equality) 7: •Algorithm-specific mode: “MO-BWR” or “MO-BMR” 8: •Optimization goal: “min” or "max" for each objective 9: •Population size: c 10: •Max iterations: max_iter 11: Step 2: Initialize Population 12: -Generate c random candidate solutions x_k ∈ [Lv, Hv] 13: Step 3: Elite Seeding 14: -Add elite solutions (extremes or known good solutions) to population 15: Step 4: Fast Non-dominated Sorting 16: -For each solution p: 17: Sp ← ∅, np ← 0 18: For each q ≠ p: 19: If p < q: Sp ← Sp ∪ {q} 20: If q < p: np ← np + 1 21: -First front F0 ← {p|np = 0}; assign rank = 0 22: -Repeat for subsequent fronts: 23: For p ∈ Fi: For q ∈ Sp: 24: nq ← nq − 1; if nq = 0 → Fi+1 ← Fi+1 ∪ {q} 25: -Assign Pareto ranks to all individuals 26: Crowding Distance Assignment (per front): 27: -For each objective m: 28: •Sort individuals in front by fm 29: •Set di = ∞ for boundaries 30: •For interior i = 2 to N−1: 31: di += (fm(i+1) − fm(i−1)) / (fm_max − fm_min) 32: Step 5: Constraint Repair 33: -For each solution x: 34: •Clip variables: x_v ← min(max(x_v, Lv), Hv) 35: •Apply inequality repair (resample, projection, etc.) 36: •Apply equality repair (tolerance, solver, projection) 37: •If still infeasible → proceed to penalty 38: Step 6: Apply Penalties 39: -For infeasible solutions: 40: •Compute penalty pj(x) = gj(x)^2 or |hj(x)|^2 41: •Modify objectives: 42: If goal = “min”: f’(x) = f(x) + ∑ pj(x) 43: If goal = “max”: f’(x) = f(x) − ∑ pj(x) 44: Step 7: Objective Function Evaluation 45: -Compute f1(x), f2(x),…, fM(x) for all individuals 46: Step 8: Edge Boosting 47: -Identify edge solutions Xmin,j and Xmax,j for each objective j 48: -Filter non-dominated edge solutions 49: -Perturb each: x’ = x + δ ⋅ sign(r) ⋅ (Hv − Lv) 50: where δ ∈ [0.01, 0.1], r ∼ U(−1, 1) 51: -Insert boosted solutions into population 52: Step 9: Local Exploration 53: -For elite/promising solutions: 54: •Apply small perturbations to explore neighborhood 55: •Add refined candidates to the population 56: Step 10: Population Update (MO-BWR / MO-BMR) 57: -For each individual k and each variable v: 58: Generate n1, n2, n3, n4 ∈ [0, 1], F ∈ {1, 2} 59: If n4 > 0.5: 60: If mode = "MO-BWR": 61: S’_v,k = S_v,k + n1*(S_v,b − F*S_v,r) − n2*(S_v,w − S_v,r) 62: If mode = "MO-BMR": 63: S’_v,k = S_v,k + n1*(S_v,b − F*S_v,m) + n2*(S_v,b − S_v,r) 64: Else: 65: S’_v,k = Hv − (Hv − Lv) * n3 66: Enforce bounds: S’_v,k = min(max(S’_v,k, Lv), Hv) 67: Step 11: Check Termination Criterion 68: -If i ≥ max_iter or other stopping criteria met: 69: Go to Step 13 70: Step 12: Loop 71: -Replace population with selected next-generation candidates 72: -i ← i + 1 73: -Go to Step 5 74: Step 13: Report Pareto-optimal Set 75: -Return non-dominated front with associated objective vectors 76: End MO-BWR/MO-BMR Algorithm |
The total complexity of both MO-BWR and MO-BMR algorithms is the same and is equal to O(I⋅(M.c2 + c⋅(m+tf+tp))), where M is the number of objectives, I is the number of iterations, c is the population size, m is the number of design variables, tf is the time to evaluate the objective and constraints per individual, and tp is the time for penalty calculation (assumed to be proportional to the number of constraints). This reflects quadratic complexity from Pareto sorting, linear complexity in variables and evaluations, and suitability for small to medium population sizes, or scalable with faster sorting variants like the NSGA-III algorithm. In the case of the BWR and BMR algorithms, the total computational complexity is the same and is equal to O(I⋅c⋅(m + tf + tp)), because the only difference between them lies in the update rule (using worst vs. mean), which does not affect asymptotic complexity.
Validation of the MO-BWR and MO-BMR Algorithms for ZDT Functions
To demonstrate the effectiveness of the proposed MO-BWR and MO-BMR algorithms, the standard Zitzler–Deb–Thiele (ZDT) benchmark functions were utilized. These functions are described below.
ZDT1:
f1(x) = x1
g(x) = 1 + 9 × (1/(n − 1)) × Σ xi for i = 2 to n
f2(x) = g(x) × [1 − sqrt(f1(x)/g(x))]
ZDT2:
f1(x) = x1
g(x) = 1 + 9 × (1/(n − 1)) × Σ xi for i = 2 to n
f2(x) = g(x) × [1 − (f1(x)/g(x))^2]
ZDT3:
f1(x) = x1
g(x) = 1 + 9 × (1/(n − 1)) × Σ xi for i = 2 to n
f2(x) = g(x) × [1 − sqrt(f1(x)/g(x)) − (f1(x)/g(x)) × sin(10π × f1(x))]
ZDT4:
f1(x) = x1
g(x) = 1 + 10 × (n − 1) + Σ [xi^2 − 10 × cos(4π × xi)] for i = 2 to n
f2(x) = g(x) × [1 − sqrt(f1(x)/g(x))]
ZDT6:
f1(x) = 1 − exp(−4 × x1) × sin^6(6π × x1)
g(x) = 1 + 9 × (Σ xi for i = 2 to n)^(0.25)/(n − 1)
f2(x) = g(x) × [1 − (f1(x)/g(x))^2]
The application of the MO-BWR and MO-BMR algorithms to the ZDT benchmark problems was carried out using 40,000 function evaluations. The same number of function evaluations were used for comparing the results of non-dominated sorting genetic algorithm III (NSGA-III) for each problem. The number of runs conducted was 30. The codes for the MO-BWR and MO-BMR algorithms were written in Python version 3.12.3 on a laptop with an AMD Ryzen 5 5600H processor and 16 GB DDR4 RAM. The Pymoo library was used for benchmark functions and their true fronts, as well as the NSGA-III.
ZDT1: The optimal Pareto front is as shown in Figure 4.
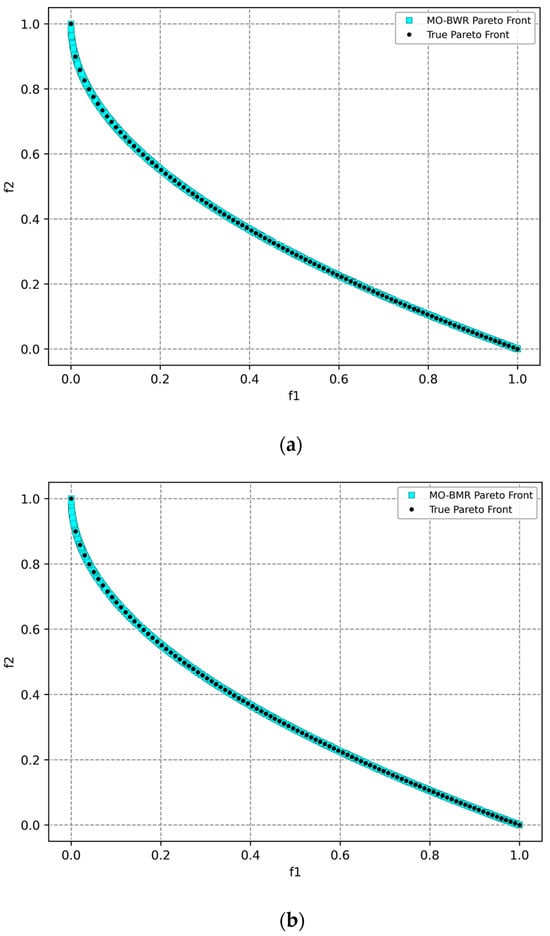
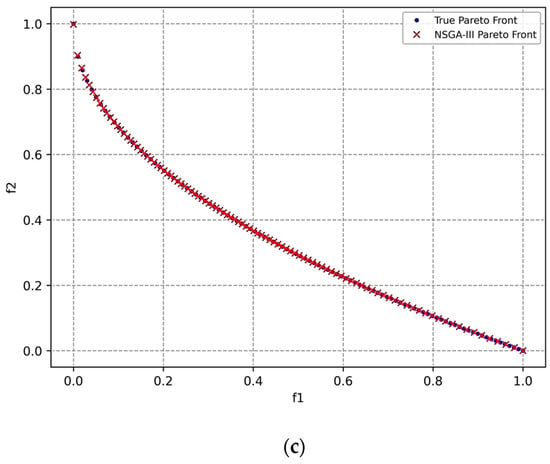
Figure 4.
Pareto front obtained for the ZDT1 function using (a) the MO-BWR algorithm, (b) the MO-BMR algorithm, and (c) NSGA-III.
Then, the following performance metrics were computed, taking the true front as the reference front.
- GD (generational distance): The average distance from the obtained front to the reference Pareto front (ideal value = 0).
- IGD (inverted GD): The average distance from the reference front to the obtained front (ideal value = 0).
- Spacing: Standard deviation of distances between consecutive solutions; measures uniformity of solution distribution (the lower the better).
- Hypervolume: Volume (area in 2D) dominated by the front up to a reference point; combines convergence and diversity (the higher the better).
Table 10 shows the mean performance metrics along with the standard deviation (std. dev.) values after conducting 30 runs of MO-BWR, MO-BMR, and NSAGA-III with reference to the true front.

Table 10.
Mean performance metrics of the algorithms for ZDT1 with reference to the true front after 30 runs.
The MO-BMR is best in IGD and HV, showing excellent coverage and quality. A low standard deviation in HV implies consistent performance. MO-BWR is best in spacing, suggesting a very uniform distribution of points. It is slightly behind MO-BMR in IGD and HV. It shows good performance across all metrics. NSGA-III is best in GD, indicating strong convergence, but only in specific regions. It is not good in IGD and spacing, highlighting non-uniform and incomplete front coverage. Hypervolume is lower than both MO-BMR and MO-BWR.
ZDT2: The optimal Pareto front is as shown in Figure 5.
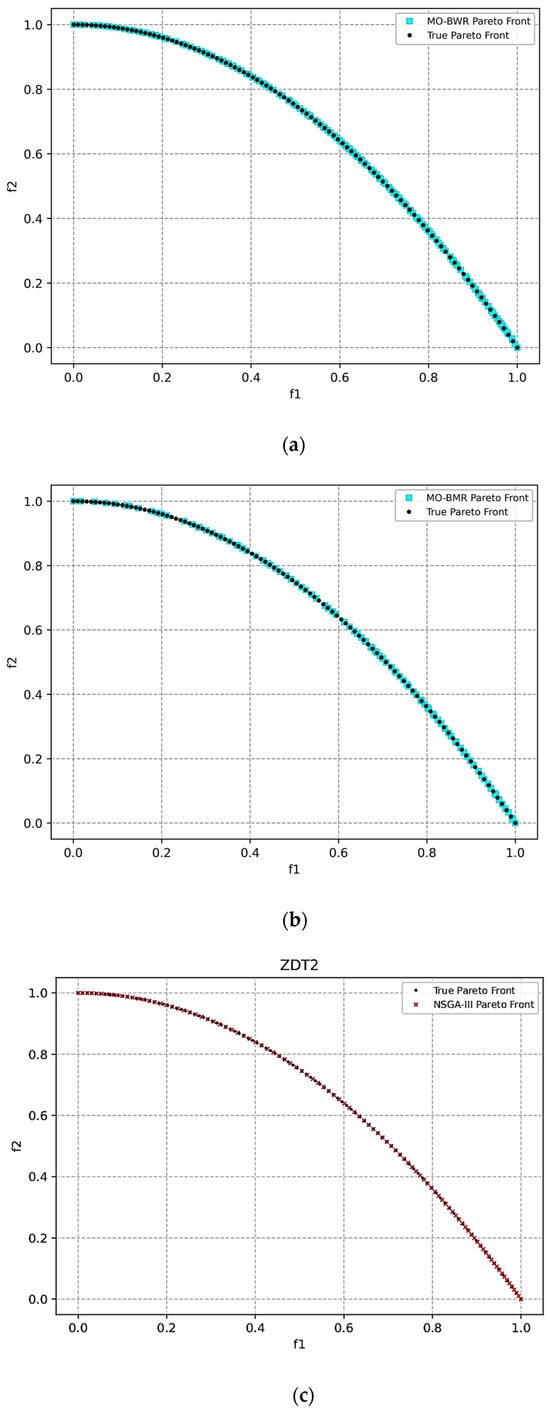
Figure 5.
Pareto front obtained for the ZDT2 function using (a) the MO-BWR algorithm, (b) the MO-BMR algorithm, and (c) NSGA-III.
Table 11 shows the mean performance metrics after conducting 30 runs of MO-BWR, MO-BMR, and NSGA-III with reference to the true front.

Table 11.
Mean performance metrics of the algorithms for ZDT2 with reference to the true front after 30 runs.
MO-BMR is best in IGD and hypervolume, indicating excellent coverage and diversity. MO-BWR is best in spacing, but significantly not good in IGD, likely due to poor spread across the front in some runs. NSGA-III is best in GD, and low variance shows high consistency. However, it is weak in spacing, suggesting clustering or non-uniformity of solutions. It has a competitive hypervolume, though slightly lower than MO-BMR.
ZDT3: The optimal Pareto front is as shown in Figure 6.
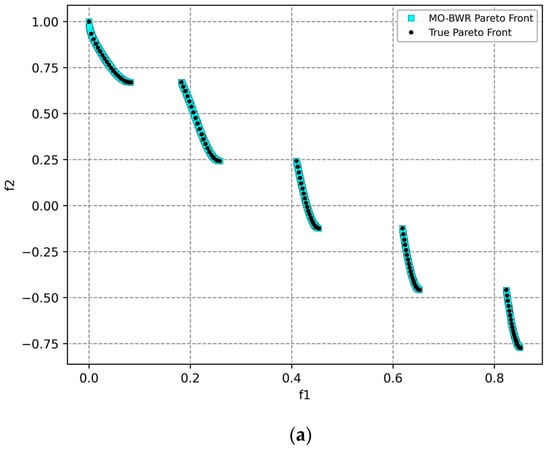
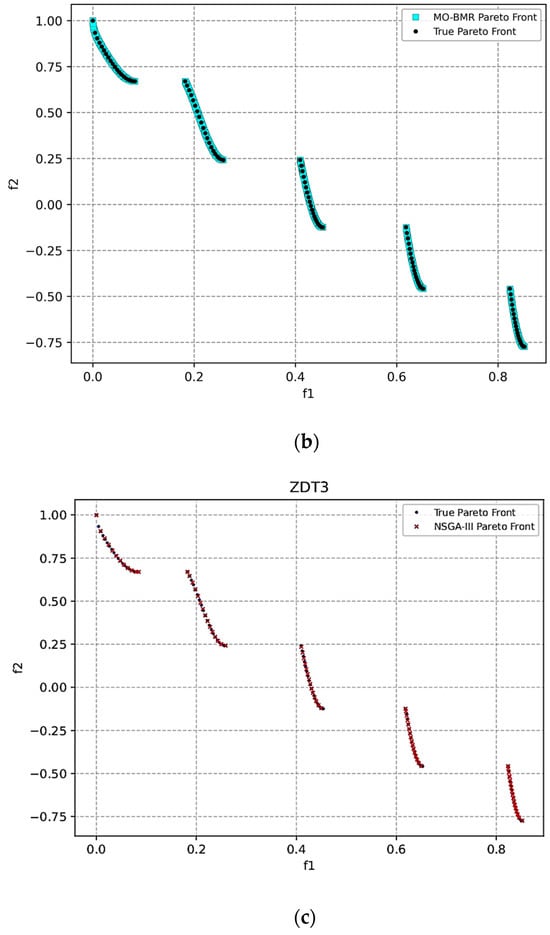
Figure 6.
Pareto front obtained for the ZDT3 function using (a) the MO-BWR algorithm, (b) the MO-BMR algorithm, and (c) NSGA-III.
Table 12 shows the mean performance metrics after conducting 30 runs of MO-BWR, MO-BMR, and NSAGA-III with reference to the true front.

Table 12.
Mean performance metrics of the algorithms for ZDT3 with reference to the true front after 30 runs.
The discontinuous nature of ZDT3 challenges diversity maintenance. MO-BMR is best in IGD, spacing, and hypervolume, showing excellent front coverage, distribution, and trade-off handling. It is slightly behind NSGA-III in GD, but overall is most balanced performer. MO-BWR shows moderate performance across all metrics. NSGA-III is best in GD, meaning strong localized convergence. However, it is not good in IGD and spacing, indicating non-uniformity and incomplete front coverage. Hypervolume is good, but slightly lower than MO-BMR.
ZDT4: The optimal Pareto front is as shown in Figure 7.
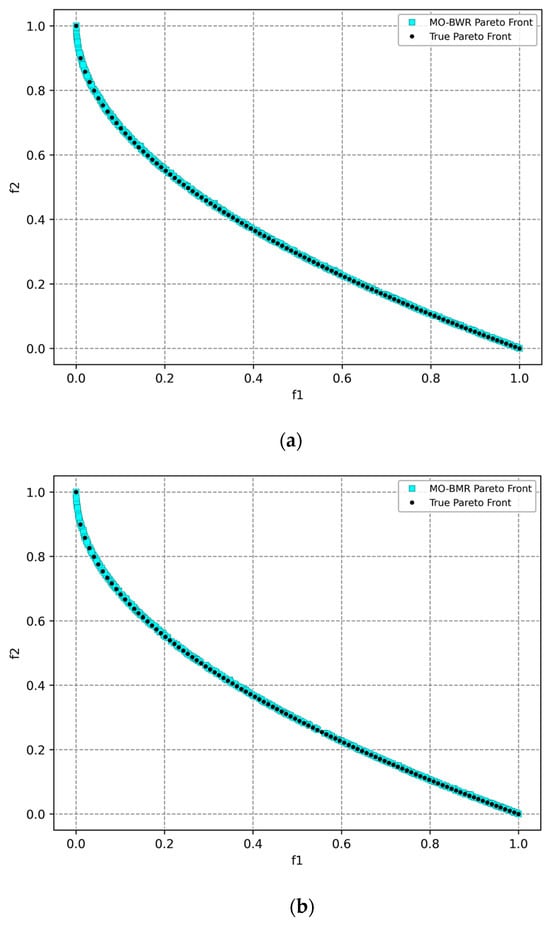
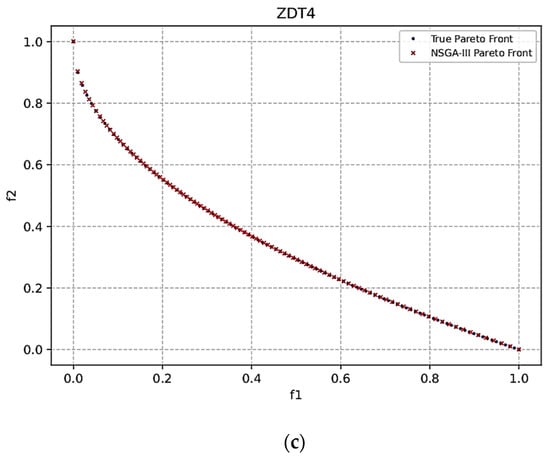
Figure 7.
Pareto front obtained for the ZDT4 function using (a) the MO-BWR algorithm, (b) the MO-BMR algorithm, and (c) NSGA-III.
Table 13 shows the mean performance metrics after conducting 30 runs of MO-BWR, MO-BMR, and NSAGA-III with reference to the true front.

Table 13.
Mean performance metrics of the algorithms for ZDT4 with reference to the true front after 30 runs.
MO-BWR is best in IGD and highest HV, indicating strong convergence and diverse spread along the true front. It is very close to MO-BMR in spacing and GD and offers a well-balanced performance across all metrics. MO-BMR has slightly better spacing than MO-BWR and close in GD and HV, second-best performer overall. NSGA-III achieves the best GD, showing strong convergence in localized regions. However, it does not have good IGD and spacing, implying poor distribution and incomplete front coverage.
The ZDT5 function involves binary numbers; hence, many researchers have not considered it while verifying their algorithms on the ZDT functions. Hence, the ZDT5 function is not considered here.
ZDT6: The optimal Pareto front is as shown in Figure 8.
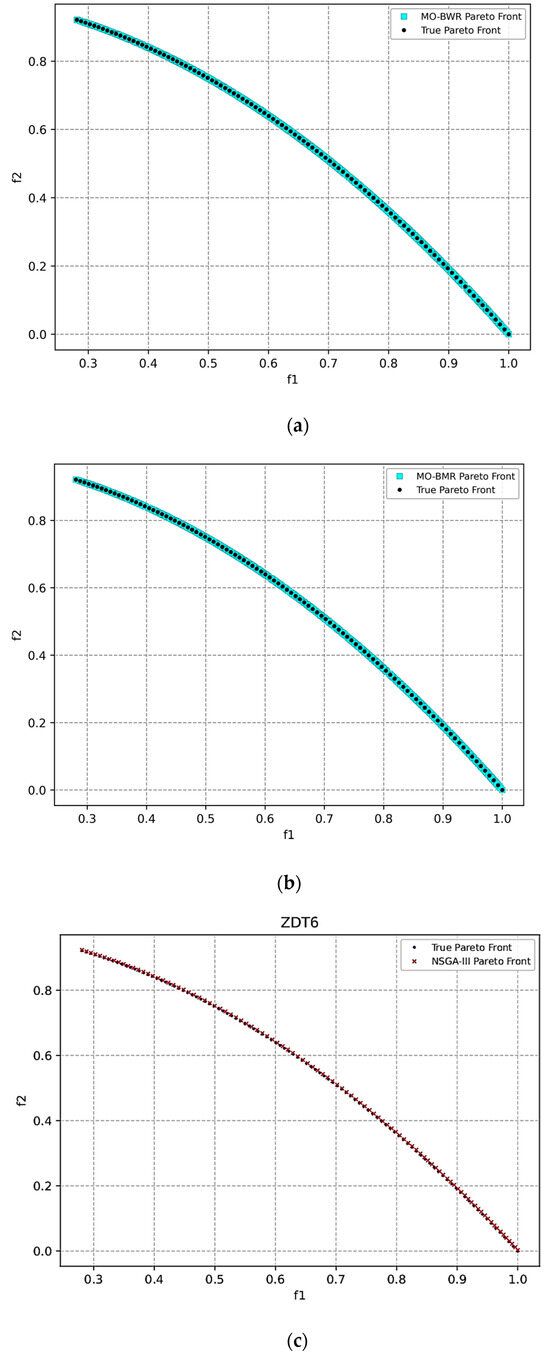
Figure 8.
Pareto front obtained for the ZDT6 function using (a) the MO-BWR algorithm, (b) the MO-BMR algorithm, and (c) NSGA-III.
Table 14 shows the mean performance metrics after conducting 30 runs of MO-BWR, MO-BMR, and NSAGA-III with reference to the true front.

Table 14.
Mean performance metrics of the algorithms for ZDT6 with reference to the true front after 30 runs.
MO-BWR achieves lowest IGD, indicating better coverage and diversity across the true front. It has the highest hypervolume, suggesting the overall best trade-off between convergence and diversity. It performs reasonably well on GD, though slightly behind NSGA-III. MO-BMR is slightly inferior to MO-BWR in all metrics. It is very close in hypervolume, but lags in IGD and spacing. NSGA-III is best in GD and spacing, indicating precise and uniformly spaced solutions near the front. However, its IGD is significantly worse than MO-BWR/BMR, showing poorer coverage of the entire front.
The following observations can be made based on the algorithms’ performance on the ZDT functions.
- GD: NSGA-III is best in GD.
- IGD: MO-BMR is best in 3 cases (ZDT1–ZDT3); MO-BWR is best in ZDT4 and ZDT6.
- Spacing: MO-BWR is best in ZDT1 and ZDT2. MO-BMR is best in ZDT3 and ZDT4. NSGA-III is best in ZDT6.
- Hypervolume: MO-BMR is best in ZDT1–ZDT3; MO-BWR is best in ZDT4 and ZDT6.
MO-BMR shows the most consistent and balanced performance. MO-BWR is also strong in spacing and HV, particularly in ZDT4 and ZDT6. NSGA-III dominates GD, but underperforms in IGD and spacing.
It may be noted from the above discussion that the MO-BWR and MO-BMR algorithms could successfully attempt the standard multi-objective benchmark functions of ZDT group. Similarly, it may be shown that these algorithms can solve the other multi-objective benchmark functions. However, it has already been shown that the BWR and BMR algorithms have been successfully applied to various standard benchmark functions [28] and engineering design problems, and hence there may not be any further need to attempt the benchmark functions. The main aim of the paper is to attempt the multi- and many-objective optimization problems of the manufacturing processes.
It may be noted that the Pareto-optimal solutions are non-dominated type, and each solution is considered a good solution. However, if the decision-maker wishes to give different levels of importance to the objectives, he or she can do it by following a multi-attribute decision-making (MADM) method. Numerous MADM methods have been proposed in the literature. Recently, an MADM method, named BHARAT, has been proposed by Rao [29]. BHARAT is very simple to implement and provides a rational way of assigning weights of importance to the objectives and logically ranks the objectives.
The next sub-section describes BHARAT for selecting the best compromise Pareto-optimal solution out of the available non-dominated Pareto solutions.
3.2. Selection of Best Compromise Pareto-Optimal Solution Using BHARAT for Decision-Making
The Best Holistic Adaptable Ranking of Attributes Technique (BHARAT) was developed by Rao [29] in 2024. The method can be used in single or group decision-making scenarios. It prioritizes simplicity, clarity, and consistency over computational complexity. The steps of BHARAT for multi- or many-objective optimization problems are given below.
Step 1: Define the decision-making problem
- Identify the alternative Pareto-optimal solutions.
- Specify which objectives are beneficial (higher is better) or non-beneficial (lower is better).
Step 2: Assign weights to the objectives
- Rank the objectives based on importance.
- Convert ranks into weights using R-method.
Step 3: Normalize the data of the objectives for the alternative Pareto solutions
- For beneficial objectives (Equation (23)):
xjinormalized = xji/xibest
- For non-beneficial objectives (Equation (24)):
xjinormalized = xibest/xji
Step 5: Compute total score by (Equation (25))
- For each alternative, compute
Step 6: Rank the alternative Pareto-optimal solutions
Higher total score ⇒ better alternative.
The following sections present the application of the BWR and BMR algorithms for single-objective optimization of manufacturing processes, as well as the use of MO-BWR and MO-BMR algorithms for addressing multi- and many-objective optimization problems. Additionally, BHARAT is employed to identify the best compromise solution from the set of Pareto-optimal solutions.
4. Results and Discussion on Application of Proposed Algorithms for the Optimization of Manufacturing Processes
Optimizing manufacturing processes is a high-dimensional, multi-objective, constrained, and nonlinear problem with inherent stochasticity and practical limitations. This complexity justifies the need for advanced metaheuristics, multi-objective frameworks, constraint-handling techniques, and decision-making tools. Hence, the proposed BWR and BMR algorithms are used for the optimization of manufacturing processes, and their applications are described in this section.
4.1. Single-Objective Optimization of Manufacturing Processes Using the BWR and BMR Algorithms
Now, to demonstrate the applicability of the proposed BWR and BMR algorithms for single-objective optimization of manufacturing processes, two case studies are considered.
4.1.1. Optimization of a Friction Stir Processing (FSP) Process
Friction Stir Processing (FSP) is a solid-state surface modification technique derived from friction stir welding. It is primarily used to refine microstructures, homogenize material properties, and incorporate reinforcements into metallic materials without melting them. Figure 9 shows the surface composite produced by the FSP. A rotating tool with a shoulder and pin is plunged into the surface of a metal workpiece. The tool rotates and traverses along the surface while applying downward force. The frictional heat generated softens the material around the pin, causing severe plastic deformation and dynamic recrystallization. As the tool moves, it stirs and refines the material structure, often producing ultrafine grains.
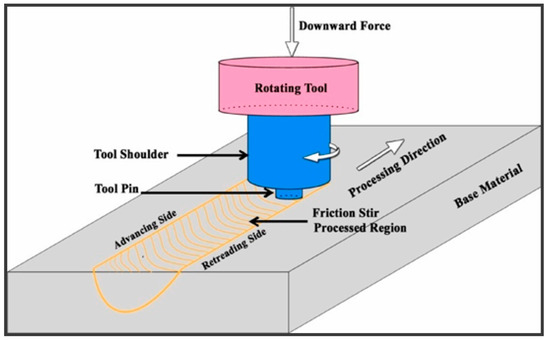
Figure 9.
Surface composite produced using FSP [15].
Mohankumar et al. [16] conducted a multi-fidelity, machine learning-driven metaheuristic optimization of friction stir processing (FSP) aimed at improving the performance of hybrid surface composites (HSCs). The optimization of FSP parameters is crucial for reducing wear loss and enhancing the tribological characteristics of HSCs. In this study, a genetic algorithm (GA) was integrated with response surface methodology (RSM) to optimize the FSP process parameters for AZ31 magnesium alloy surface composites reinforced with yttria-stabilized zirconia (YSZ) and alumina (Al2O3) particles.
AZ31 magnesium alloy was selected as the base material for the friction stir processing (FSP) experiments, with dimensions of 120 × 70 × 5 mm. To produce the hybrid surface composite via friction stir processing, a combination of two ceramic reinforcements—alumina (Al2O3) and yttria-stabilized zirconia (YSZ)—was used. The axial down force applied during the process was controlled indirectly by precisely adjusting the tool’s plunge depth and vertical feed rate. The tool featured a 25 mm shoulder diameter, a 2.7 mm long pin, and a 5.7 mm pin diameter, ensuring efficient stirring of the material and uniform distribution of the reinforcement within the matrix.
A central composite design (CCD) was used, incorporating three key factors—tool rotational speed (TRS), tool traverse speed (TTS), and tool axial force (TAF)—each of which varied across five levels. Twenty experiments were conducted with different combinations of TRS, TTS, and TAF. The data thus obtained facilitated the development of a predictive empirical model for wear loss using the response surface methodology (RSM). Analysis of variance (ANOVA) confirmed the model’s statistical reliability. The genetic algorithm (GA) identified optimal FSP parameters as TRS = 1324.736 rpm, TTS = 123.676 mm/min, and TAF = 12.336 kN, resulting in a minimized wear loss of 2.953 mg. Equation (26) describes the mathematical model of wear loss. The bounds of the variables are described in Equation (27).
Minimize wear loss = f(x) = 44.79626 − 0.040091 × TRS − 0.11481 × TTS
−1.32800 × TAF + 0.000057 × TRS × TTS + 0.000316 × TRS × TAF − 0.001725 ×
TTS × TAF + 0.000011 × TRS2 + 0.000245 × TTS2 + 0.04551 × TAF2
−1.32800 × TAF + 0.000057 × TRS × TTS + 0.000316 × TRS × TAF − 0.001725 ×
TTS × TAF + 0.000011 × TRS2 + 0.000245 × TTS2 + 0.04551 × TAF2
The bounds of the variables are
900 rpm ≤ TRS ≤ 1500 rpm, 60 mm/min ≤ TTS ≤ 160 mm/min, and 6 kN ≤
TAF ≤ 16 kN.
TAF ≤ 16 kN.
The BWR and BMR algorithms are now applied to the friction stir processing to find the optimum values of the parameters (TRS, TTS, and TAF) that give the minimum wear loss. Mohankumar et al. [16] employed a genetic algorithm (GA) to determine the optimal parameters for this problem, using a population size of 100 and 150 iterations, resulting in a total of 15,000 function evaluations. In contrast, to demonstrate the efficiency and effectiveness of the proposed BMR and BWR algorithms in achieving comparable or superior results, the present study utilizes a smaller population size of 25 and 150 iterations, amounting to only 3750 function evaluations.
The optimum value of wear loss (i.e., f(x)) obtained by both the BMR and BWR algorithms is f(x) = 2.95332 mm with the optimal values of TRS = 1324.85 rpm, TTS = 124.02 mm/min, TAF = 12.408 kN. The value of wear loss obtained by the GA used by Mohankumar et al. [16] was f(x) = 2.95338 mm with the optimal values of TRS = 1324.736 rpm, TTS = 123.676 mm/min, and TAF = 12.336 kN. The optimum wear loss value obtained by the BMR and BWR algorithms is slightly better than that given by the GA. Furthermore, unlike the GA used by Mohankumar et al. [16], the BMR and BWR algorithms do not need to tune any algorithm-specific parameters and require a very small number of function evaluations to reach the optimal solution.
Figure 10 shows the convergence graph of the BWR and BMR algorithms. The convergence of the BWR algorithm is faster, and the global optimum value of f(x) = 2.95332 is achieved by both algorithms.
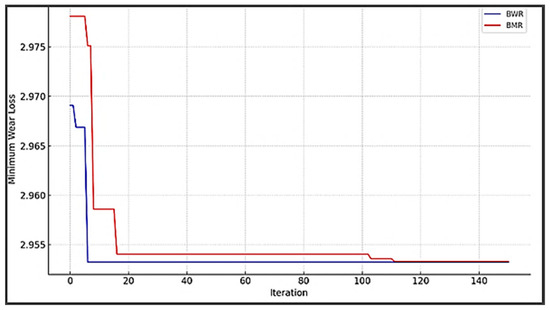
Figure 10.
Convergence behavior of the BWR and BMR algorithms (FSP process).
Both the BMR and BWR algorithms consistently converged to wear loss value of 2.95332 mm, indicating good robustness and reliability. Final convergence curves of both algorithms are extremely close, indicating comparable efficiency. Multiple reruns of 30 of both BWR and BMR resulted in very similar optimal regions. This implies low randomness-induced variance and good repeatability. Both BWR and BMR are effective optimizers for this wear loss minimization problem.
Figure 11 shows the 3D response surface plots for wear loss. These 3D response surfaces illustrate how wear loss varies with changes in the process parameters (TRS, TTS, and TAF) based on the final iteration of the population.
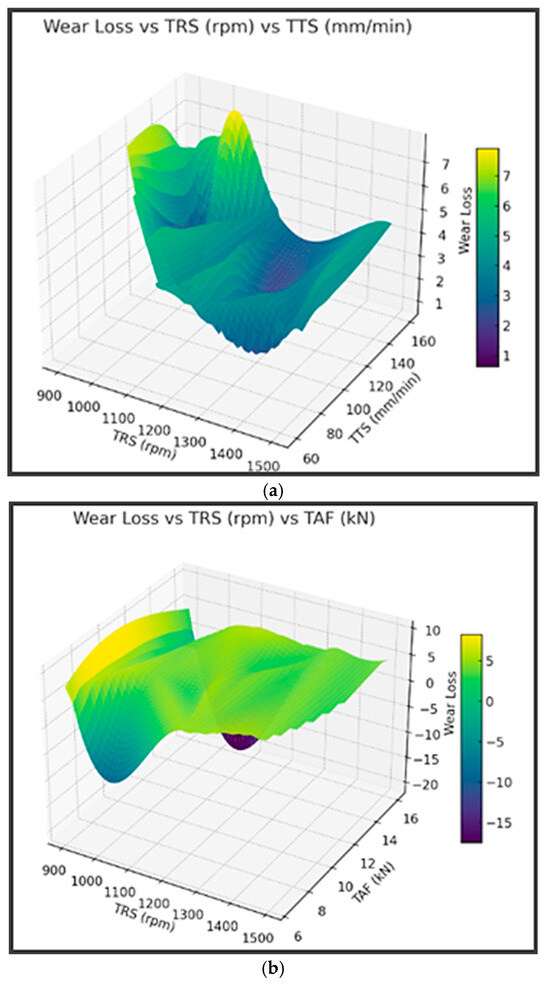
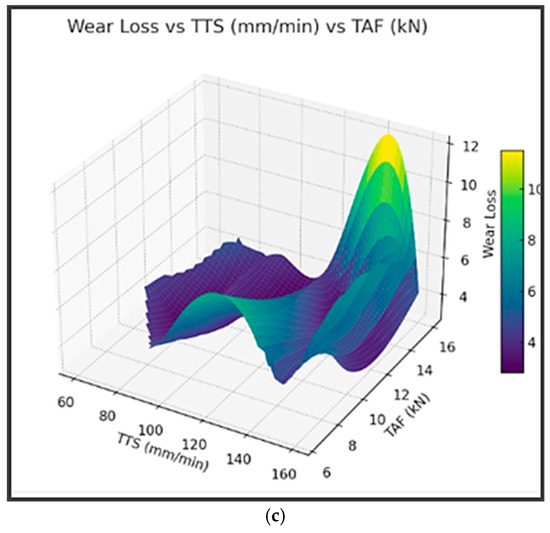
Figure 11.
Response surface plots for wear loss in the FSP process (a) wear loss vs. TRS vs. TTS; (b) wear loss vs. TRS vs. TAF; and (c) wear loss vs. TTS vs. TAF.
It can be observed from Figure 11a that as tool rotational speed (TRS) increases and tool traverse speed (TTS) remains moderate to low, wear loss decreases. Very low TTS values result in higher wear. The optimal region appears to lie at high TRS (around 1400–1500 rpm) and moderate TTS (around 80–100 mm/min). A high spindle speed improves material mixing and bonding in FSP, while too fast a traverse speed may reduce heat input, increasing wear. Also, it can be observed from Figure 11b that the wear loss decreases with increasing TRS and a moderate level of TAF (Tool Axial Force). Very high TAF increases wear loss due to excessive pressure or heat. Wear loss is lowest at high TRS and TAF between 9–12 kN. Axial force must be optimized, not maximized. High TRS helps reduce wear, but excessive force causes damage due to overheating or material expulsion.
Furthermore, it can be observed from Figure 11c that wear loss is minimized in the mid-range of both TTS and TAF (TTS ≈ 80–100 mm/min, TAF ≈ 9–12 kN). Either too low or too high TTS/TAF increases wear loss. There is a sensitive interaction between tool movement speed and the downward force applied; both should be balanced to ensure uniform plastic flow and minimal material damage. Higher spindle speeds and TRS consistently reduce wear loss. Too low or too high values of TTS and TAF will increase wear loss. All three parameters (i.e., TRS, TTS, and TAF) must be carefully tuned in combination, rather than individually optimized.
4.1.2. Optimization of an Ultra-Precision Turning Process
Ultra-precision turning (UPT) plays a vital role in modern manufacturing by enabling the production of components with exceptional dimensional accuracy, superior surface finish, and tight tolerances. While it follows the principles of conventional turning, it is conducted under specialized conditions to achieve significantly higher precision. Though applicable to standard structural materials, there is a growing need to machine hardened steels like AISI D2. In this context, optimizing ultra-precision turning using cubic boron nitride (CBN) tools becomes increasingly important for achieving high-quality machining outcomes.
Tura et al. [5] studied the performance of ultra-precision CBN turning of AISI D2 and determined the optimal process parameters that yield the highest-quality results. Key process variables such as cutting speed (vc), feed (f), and depth of cut (ap) were systematically varied and tested to evaluate their effects on output responses, including surface roughness (Ra) and cutting force (Fc). A full factorial design of experiments was employed to capture the behavior of the process under various conditions. To identify the best combination of machining parameters, a hybrid optimization approach was implemented using genetic algorithm–response surface methodology (GA-RSM) alongside Taguchi–gray relational analysis (GRA). The results demonstrated that the combined GA-RSM and Taguchi-GRA successfully identified the optimal conditions, minimizing surface roughness and cutting forces.
The two objective functions—minimization of surface roughness (Ra) and minimization of cutting force (Fc)—are represented by Equations (28) and (29), respectively. The bounds of the variables are described by Equation (30).
Surface roughness (Ra) = 0.839 − 0.00258 × vc − 6.72 × f −10.4 × ap + 0.000010 × vc × vc
+ 49.20 × f × f + 40.8 × ap × ap + 0.0129 × vc × f + 0.0164 × vc × ap + 82.5 × f × ap −0.425
× vc × f × ap
+ 49.20 × f × f + 40.8 × ap × ap + 0.0129 × vc × f + 0.0164 × vc × ap + 82.5 × f × ap −0.425
× vc × f × ap
Cutting force (Fc) = −5.2 + 0.026 × vc + 357 × f + 695 × ap + 0.000087 × vc × vc −
262 × f × f − 1667 × ap × ap − 1.77 × vc × f −1.77 × vc × ap + 2141 × f × ap + 19.6 × vc ×
f × ap
262 × f × f − 1667 × ap × ap − 1.77 × vc × f −1.77 × vc × ap + 2141 × f × ap + 19.6 × vc ×
f × ap
The bounds of the variables are
75 m/min ≤ vc ≤ 175 m/min, 0.025 mm ≤ f ≤ 0.125 mm, and 0.06 mm ≤ ap ≤ 0.1 mm
Now, the two objectives are individually solved using BWR and BMR algorithms, to demonstrate how these algorithms perform on individual objective functions. Tura et al. [5] used a population size of 1000 and 600 iterations (i.e., function evaluations = 1000 × 600 = 600,000). However, the present work used only a population size of 50 and 500 iterations (i.e., function evaluations = 50 × 500 = 25,000) to show the efficiency of the BWR and BMR algorithms.
First, the surface roughness (Ra) objective is solved individually. Figure 12 shows the convergence graph of the BWR and BMR algorithms for the surface roughness objective function of the ultra-precision turning process. The minimum value of surface roughness (Ra) obtained by both the algorithms is 0.2048 µm, corresponding to the optimal parameter values of vc = 85.08 m/min, f = 0.025 mm, and ap = 0.0961 mm.
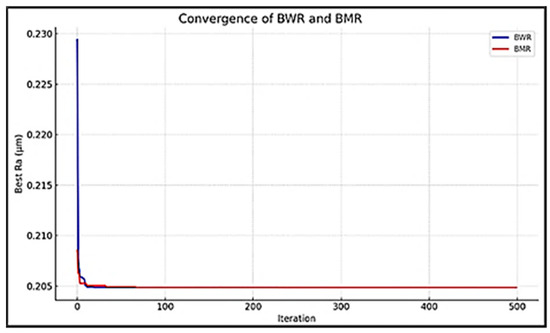
Figure 12.
Convergence behavior of the BWR and BMR algorithms for the surface roughness objective function of the ultra-precision turning process.
The BWR algorithm shows a smooth and stable decrease in Ra across iterations. The intial convergence is modest, reflecting BWR’s explorative nature due to its use of the worst solution for diversity. It reaches the same final Ra (0.2048 µm), but with slightly more iterations than BMR. Its strengths are stability and exploration. The BMR algorithm shows faster improvement in the initial 100–200 iterations, due to the use of population mean rather than the worst solution. It quickly locks onto the optimal region and remains stable. It converges to 0.2048 µm, but in fewer iterations. Its strengths are speed and efficiency. However, it may be slightly more exploitative.
Next, the cutting force (Fc) objective is solved individually. Figure 13 shows the convergence graph of the BWR and BMR algorithms for Fc objective function of the ultra-precision turning process. The minimum value of Fc obtained by both the algorithms is 28.5022 N, corresponding to the optimal parameter values of vc = 175 m/min, f = 0.025 mm, and ap = 0.06 mm. Figure 11 shows the convergence behavior of the BWR and BMR algorithms for the surface roughness objective function of the ultra-precision turning process.
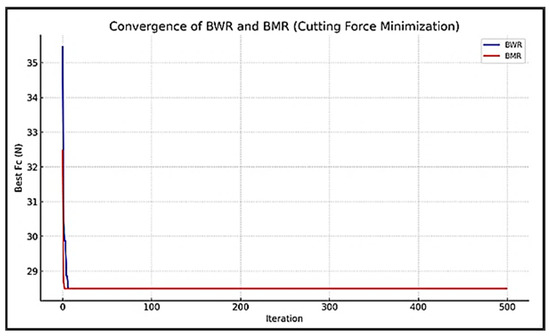
Figure 13.
Convergence behavior of the BWR and BMR algorithms for cutting force objective function of the ultra-precision turning process.
The BWR algorithm shows a steady and consistent improvement in cutting force (Fc) over iterations. It is a moderate descent in the early iterations, reflecting balanced exploration and exploitation. It approaches the minimum Fc gradually, stabilizing after about 350 iterations, and exhibits robust and stable convergence, making it reliable for diverse search spaces. The BMR algorithm demonstrates a faster rate of improvement in the initial 100–200 iterations. By using the population mean instead of the worst individual, BMR accelerates convergence by focusing more on promising regions. It converges rapidly and levels off, reaching optimal Fc sooner than BWR.
In this second example of the optimization of an ultra-precision turning process, the two objectives (i.e., Ra and Fc) are optimized independently, considering them as individual single-objective functions. It can be observed that the values of the optimum variables (i.e., vc, f, and ap) to give a minimum value of Ra will not lead to the minimum vale of Fc. However, in real practice, both the objectives of Ra and Fc are to be considered simultaneously for optimization to find the optimal values of variables that will satisfy both objectives. Then that problem comes under the multi-objective optimization domain, and that will be attempted in the next section. The response surface plots will also be described considering both the objectives simultaneously. The results of MO-BWR and MO-BMR will be compared in the next section with those of Tura et al. [5] obtained using GA.
4.2. Multi-Objective Optimization of Manufacturing Processes Using MO-BWR and MO-BMR Algorithms
Now, to demonstrate the application potential of the proposed MO-BWR and MO-BMR algorithms, two examples of manufacturing processes are presented.
4.2.1. Multi-Objective Optimization of an Ultra-Precision Turning Process with 2 Objectives
In Section 4.1.2, two objectives of an ultra-precision turning process are presented. The two objectives are minimizing the surface roughness (Ra) and minimizing the cutting force (Fc). The two objective functions are expressed by Equations (28) and (29), and the bounds of the three input parameters vc, f, and ap are given by Equation (30). In Section 4.1.2, the two objectives were optimized individually. The minimum value of surface roughness (Ra) obtained by both the algorithms is 0.2048 µm, corresponding to the optimal parameter values of vc = 85.08 m/min, f = 0.025 mm, and ap = 0.0961 mm. The minimum value of Fc obtained by both the algorithms is 28.5022 N, corresponding to the optimal parameter values of vc = 175 m/min, f = 0.025 mm, and ap = 0.06 mm.
However, in actual practice, both the objective functions have to be attempted simultaneously to find the real optimum values of variables. For this purpose, the MO-BWR and MO-BMR algorithms are applied to find out the optimum values of parameters vc, f, and ap. Tura et al. [5] applied GA using a population size of 1000 and 600 iterations (i.e., function evaluations = 1000 × 600 = 600,000). However, the present work used only a population size of 50 and 500 iterations (i.e., function evaluations = 50 × 500 = 25,000) to show the efficiency of the MO-BWR and MO-BMR algorithms. Both MO-BWR and MO-BMR produced 50 non-dominated solutions.
Now, a composite Pareto front that includes all the best solutions of MO-BWR and MO-BWR is formed. This is a non-dominated frontier formed by merging both elite-boosted runs, giving the best trade-off solutions from both MO-BWR and MO-BMR strategies. Table 15 gives the set of 87 non-dominated optimal solutions given by the MO-BWR and MO-BMR algorithms (after removing all the duplicate solutions of the algorithms). Of the 87 non-dominated optimal solutions, 43 belong to MO-BWR and 44 belong to MO-BMR. The scores given in the last two columns are the weighted sums of the normalized objectives computed by summing up the products of multiplication of the normalized data of the objectives with the corresponding weights, as explained in Section 3.2.

Table 15.
Eighty-seven non-dominated and deduplicated optimal solutions provided by the composite front (MO-BWR + MO-BMR) for the ultra-precision turning process.
The graphs showing the Pareto fronts (i.e., non-dominated solutions) for the MO-BWR and MO-BMR algorithms are shown in Figure 14.
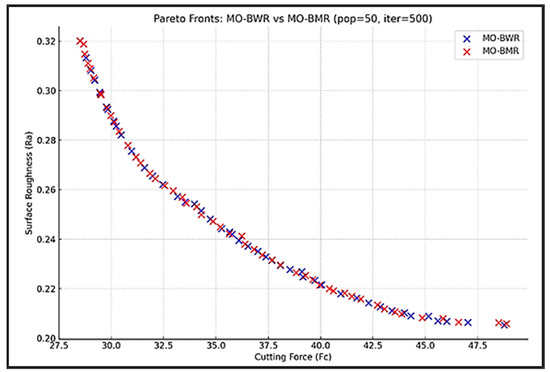
Figure 14.
Pareto fronts obtained by MO-BWR and MO-BMR algorithms for the ultra-precision turning process.
It can be observed from Figure 14 that both MO-BWR and MO-BMR generate a wide spread of solutions, covering a diverse trade-off space between Ra and Fc. The MO-BWR front appears more populated toward low Ra regions, suggesting that it performs better in minimizing surface roughness. The MO-BMR front extends deeper into low Fc regions, indicating stronger performance in minimizing cutting force. MO-BWR solutions tend to cluster around high Fc but very low Ra—suitable for surface finish–critical applications. MO-BMR solutions tend to cluster around moderate Ra and low Fc—preferable for energy-efficient or tool-wear–sensitive scenarios.
Now, the composite Pareto front is considered for reference. The composite Pareto front includes all the best solutions of MO-BWR and MO-BWR. This is a non-dominated frontier formed by merging both elite-boosted runs, giving the best trade-off solutions from both the MO-BWR and MO-BMR strategies. Figure 15 shows the composite Pareto front and the Pareto fronts of MO-BWR and MO-BMR algorithms. However, the Pareto fronts of MO-BWR and MO-BMR algorithms are not visible, as they are completely covered by the composite front.
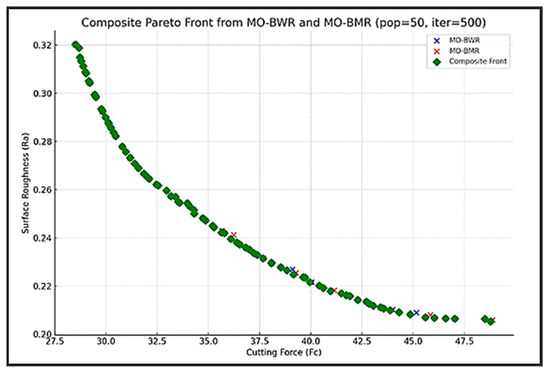
Figure 15.
Pareto front obtained by using th composite front for the ultra-precision turning process.
The entire composite front (consisting of 87 unique solutions), after removing the duplicate solutions, is shared between MO-BWR and MO-BMR—they converged to the same set of non-dominated solutions.
The composite front formed from both MO-BWR and MO-BMR is necessary to capture all truly non-dominated trade-offs. The composite front offers the best trade-offs and flexibility. The focus is on balanced optimization.
Figure 16 shows the response surface plots for Ra and Fc in the ultra-precision turning process.
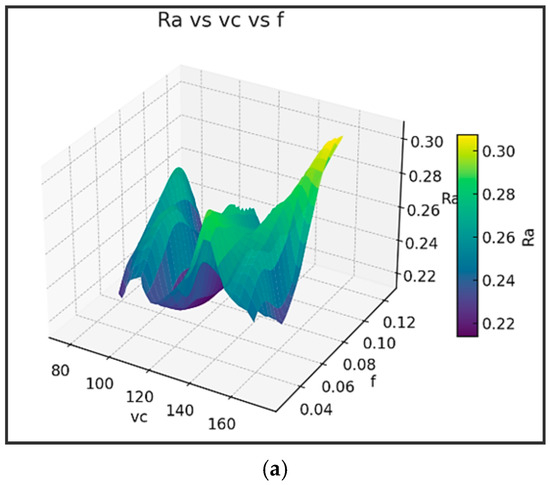
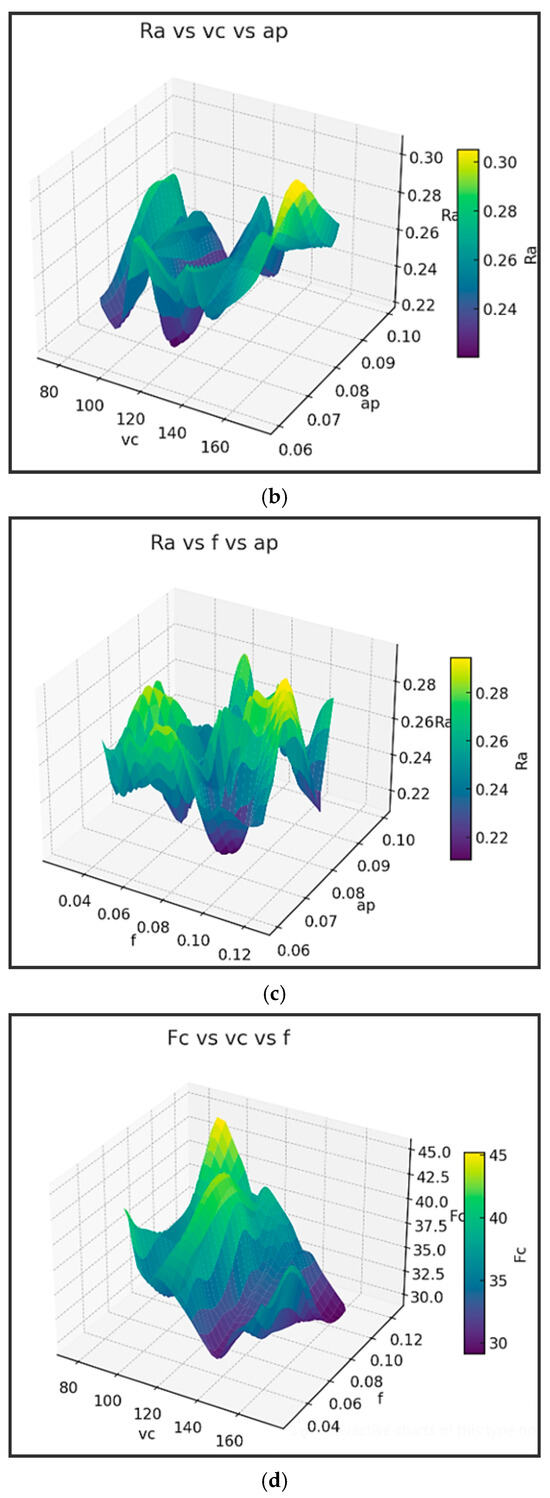
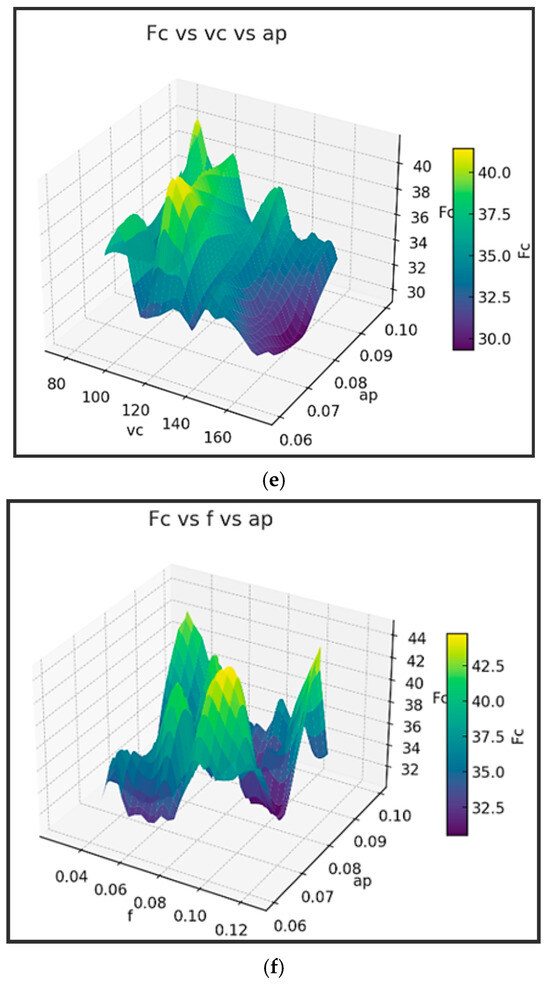
Figure 16.
Response surface plots for Ra and Fc in the ultra-precision turning process (a) Ra vs. vc vs. f; (b) Ra vs. vc vs. ap; (c) Ra vs f vs. ap; (d) Fc vs. vc vs. f; (e) Fc vs vc vs ap; and (f) Fc vs. f vs. ap.
It can be observed from Figure 16a that Ra decreases with increasing vc (cutting speed), especially at a low feed. Low f (feed) is critical for achieving minimal Ra—even more influential than vc. The surface is relatively steep along the f-axis, confirming that Ra is highly sensitive to feed. Figure 16b shows that a higher ap (depth of cut) leads to lower Ra, particularly when combined with high vc. The Ra surface is smooth and gently sloped along the vc-axis, suggesting a moderate influence of cutting speed. The interaction between ap and vc can be exploited for surface finish improvement. Figure 16c shows that Ra is minimized when both f and ap are small, especially when ap is around 0.06–0.07 mm. The plot confirms a strong nonlinear interaction—a small increase in feed can sharply increase Ra, especially at a higher ap.
Further, it can be observed from Figure 16d that Fc increases significantly with f, regardless of vc. Higher vc tends to slightly reduce Fc, but this effect is minor compared to the feed’s impact. The plot surface is nearly flat along vc but sharply rises with f—again confirming feed is the most dominant factor. Figure 16e shows that ap has a strong and direct influence on Fc—higher depth causes much higher cutting forces. Fc is minimized at low ap and moderate-to-high vc. Smoother gradients suggest a controllable interaction between vc and ap. Figure 16f shows that Fc spikes sharply with increasing f and ap. It indicates a multiplicative effect: simultaneously increasing both parameters leads to a steep rise in Fc.
- The parameter vc’s effect on Ra is moderate, slight on Fc, and optimal for both the objectives.
- The effect of f on Ra is very strong, and it is strong on Fc and to be kept low to minimize both the objectives.
- The effect of ap on Ra is moderate, and very strong on Fc, and low ap is optimal for Fc and moderate ap is optimal for Ra.
Choosing the Best Compromise Pareto-Optimal Solution from the Non-Dominated Solutions for the Ultra-Precision Turning Process
BHARAT is applied to find the best compromise Pareto-optimal solution out of the 87 non-dominated solutions of the composite front. The objective values of Fc and Ra are normalized and shown in Table 13. If the decision-maker assigns equal weightages to the objectives Ra and Fc (i.e., wRa = wFc = 0.5), then the scores (i.e., weighted sums) will be as shown in the last but one column of Table 13. For the equal weights of importance of the objectives, the optimal solution suggested is solution number 55 with optimal parameters of vc = 137.9514 m/min, f = 0.049391 mm, and ap = 0.078518 mm, giving an Fc of 31.39718 N and Ra of 0.270814 µm.
However, let the decision-maker assign a rank of 1 to Ra and 2 to Fc. Then, using BHARAT [28], a weightage of 0.6 is assigned to Ra and 0.4 to Fc. Application of these weights obtained by BHARAT to the normalized data of Ra and Fc leads to the scores, as shown in the last column of Table 13. From the scores given in the last column, the optimal solution suggested is solution number 58 with optimal parameters of vc = 99.6543 m/min, f = 0.032536 mm, and ap = 0.075408 mm, giving Fc of 43.87067 N and Ra of 0.20992 µm. Thus, based on the preferences of the decision-maker (or process planner).
The solutions provided by the MO-BWR and MO-BMR algorithms are compared with the solutions provided by Tura et al. [5] using the GA. It is surprising to note that Tura et al. [5] could obtain only 16 Pareto optimal solutions using the GA with a population size of 1000 and 600 iterations! The MO-BWR and MO-BMR algorithms provided many non-dominated solutions that are better than those provided by the GA [5]. The Pareto front given by GA [5] is shown in Figure 17.
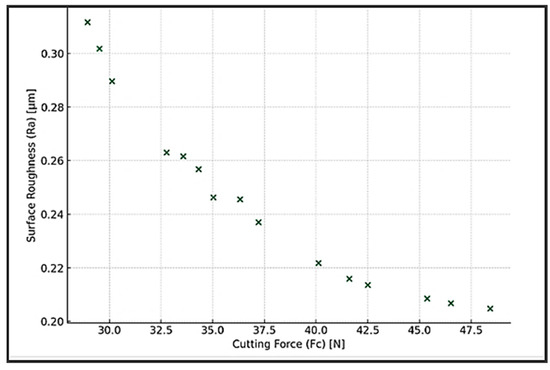
Figure 17.
Pareto front obtained by using GA for the ultra-precision turning process.
Table 16 shows the performance metrics, which reveal that both MO-BWR and MO-BMR algorithms perform better than the GA of Tura et al. [5] and are equally capable of solving this problem. The Pareto front given by GA [5] is inferior to the fronts given by MO-BWR and MO-BMR in terms of GD, IGD, coverage, spacing, spread, and hypervolume.

Table 16.
Performance metrics of MO-BWR, MO-BMR, and GA [5] with reference to the composite front for the ultra-precision turning process.
Also, Tura et al. [5] applied grey relational analysis (GRA) method directly to the experimental data and suggested the optimal parameter values of vc = 175 m/min, f = 0.025 mm, and ap = 0.06 mm for the simultaneous optimization of Ra and Fc. However, that is not a correct judgment. Those optimal parameter values may give a minimum value of Fc as 28.5022 N, but substituting those values in the expression for Ra (i.e., Equation (25)) gives a high Ra value of 0.320205 µm. However, this set of non-dominated solutions (28.5022, 0.320205) is already included in solution no. 44 of the composite front of MO-BWR and MO-BMR given in Table 14. Moreover, giving equal weightages of 0.5 each to Fc and Ra in the present work (which was implicitly done by Tura et al. [5] in their GRA approach) does not choose solution no. 44 (i.e., Fc = 28.5022 N and Ra = 0.320205 µm) as the best compromise. It is considered one of the non-dominated solutions only. Solution no. 55, which offers Fc = 31.39718 N and Ra = 0.270814 µm, corresponding to the optimal parameter values of vc = 137.9514 m/min, f = 0.049391 mm, and ap = 0.078518 mm is more logical to consider as the best compromise Pareto-optimal solution considering Fc and Ra simultaneously.
It may be noted that in the GRA method used by Tura et al. [5], different distinguishing coefficient values yield selection of different alternative non-dominated solutions, and it becomes unclear which solution is to be considered finally. Furthermore, GRA involves a lot of computations. However, the proposed BHARAT is simple and takes into account the decision maker’s preferences to assign the weights to the attributes. The computational process used in BHARAT is simple and more convenient to evaluate and find the best compromise Pareto-optimal solution. The results of this investigation could help the decision-makers (i.e., process planners) on the shop floor to set the optimal input parameters to perform the ultra-precision turning process.
4.2.2. Multi-Objective Optimization of a Laser Powder Bed Fusion (LPBF) Process with 3-Objectives
Laser Powder Bed Fusion (LPBF) is an advanced additive manufacturing (AM) technology that utilizes lasers to produce intricate, high-performance parts. However, its layer-by-layer fabrication approach typically results in extended build times, high energy consumption, and increased CO2 emissions. With the manufacturing sector increasingly prioritizing energy efficiency and environmental sustainability, minimizing the energy footprint of LPBF has become crucial. Nonetheless, there remains a scarcity of research dedicated to optimizing LPBF process parameters in a way that effectively balances energy usage with the quality of the fabricated components.
To address this, Zeng et al. [12] introduced a hybrid optimization framework that integrated Response Surface Methodology (RSM), Multi-Objective Particle Swarm Optimization (MOPSO), and the technique for order preference by similarity to the ideal solution (TOPSIS) method within a multi-attribute decision-making (MADM) approach. The goal was to determine an ideal set of process parameters—laser power (LP), scanning speed (SS), and hatching space (HS)—that could maximize relative density and surface finish while minimizing energy use. Specific energy consumption (SEC) was chosen as the metric to evaluate energy usage in LPBF operations. The study began with a central composite design (CCD) to structure the experiments and develop predictive models for SEC, surface roughness (Ra), and relative density (RD) using RSM. The influence of key process variables on each response was assessed using ANOVA and visualized through 3D surface plots to confirm model validity. Next, the MOPSO algorithm was employed to derive a set of Pareto-optimal solutions based on dominance principles. These solutions were then evaluated using the CRITIC (Criteria Importance Through Inter-criteria Correlation) method for objective weighting, and TOPSIS was applied to rank the solutions for optimality. The results indicated that all response models are highly reliable, with R2 values exceeding 0.94.
The regression models for specific energy consumption (Equation (31)), surface roughness (Equation (32)), and relative density (Equation (33)) have been developed and are given below.
SEC = 317.216578 + 0.292832LP − 0.12473SS − 1585.474184HS − 0.000029LP × SS −
0.345833LP × HS + 0.399375SS × HS − 0.000322LP2 + 0.000028SS2 + 4557.88999HS2
0.345833LP × HS + 0.399375SS × HS − 0.000322LP2 + 0.000028SS2 + 4557.88999HS2
Ra =289.96777 − 0.457769LP − 0.138148SS − 3384.98787HS − 0.000125LP × SS +
0.836188SS × HS + 0.001058LP2 + 0.000046SS2 + 14605.925994HS2
0.836188SS × HS + 0.001058LP2 + 0.000046SS2 + 14605.925994HS2
RD =69.509238 − 0.074212LP + 0.024394SS + 646.565648HS + 0.000017LP × SS −
0.20625SS × HS + 0.000108LP2 − 0.000006SS2 − 2601.997516HS2
0.20625SS × HS + 0.000108LP2 − 0.000006SS2 − 2601.997516HS2
The input parameter bounds for Laser Power (LP), Scanning Speed (SS), and Hatching Space (HS) are defined by Equation (34) as follows:
250 ≤ LP ≤ 310 (W), 1000 ≤ SS ≤ 1400 (mm/s), and 0.07 ≤ HS ≤ 0.09 (mm).
The objectives SEC and Ra are to be minimized and the objective RD is to be maximized. Zeng et al. [12] attempted to solve this multi-objective problem with 3 objectives using a MOPSO algorithm. The population size was taken as 200, and 500 to 3000 iterations were tried. However, to prove that the proposed MO-BWR and MO-BMR algorithms can solve this problem with fewer function evaluations, a population size of 50 and 500 iterations are used in the present work.
Table 17 gives the set of 86 non-dominated Pareto-optimal solutions given by the MO-BWR and MO-BMR algorithms (after removing all the duplicate solutions of the algorithms). Of the 86 non-dominated optimal solutions, 40 belong to MO-BWR and 46 belong to MO-BMR.

Table 17.
Eighty-six non-dominated and deduplicated optimal solutions provided by the composite front (MO-BWR + MO-BMR) for the LPBF process.
The Pareto fronts of the MO-BWR and MO-BMR algorithms and the composite front are shown in Figure 18.
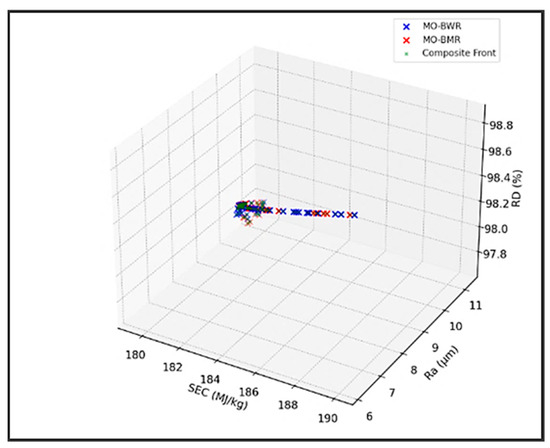
Figure 18.
Pareto fronts obtained using the MO-BWR and MO-BMR algorithms for the LPBF process.
The performance metrics of the MO-BWR, MO-BMR, and MOPSO with reference to the composite front are given in Table 17. Zeng et al. [12] conducted various trials of MOPSO with a population size of 200 and 500, 1000, 1500, 2000, 2500, and 3000 iterations. The authors presented only two performance metrics (i.e., hypervolume and spacing). The better values obtained by them were for 1500 iterations. Hence, those values are kept in Table 18. However, it can be seen that the proposed MO-BWR and MO-BMR algorithms produced much better hypervolume and spacing values compared to the MOPSO algorithm used by Zeng et al. [12]. MO-BMR has better IGD and coverage than MO-BWR, showing closer proximity to the composite front. The MO-BWR achieves higher hypervolume, suggesting better extreme solutions. Composite front expectedly has ideal metrics: GD = 0, IGD = 0, Coverage = 1.

Table 18.
Performance metrics of the MO-BWR, MO-BMR, and GA with reference to the composite front for the laser powder bed fusion (LPBF) process.
Thus, the proposed MO-BWR and MO-BMR algorithms are proved superior to MOPSO used by Zeng et al. [12] for the tri-objective optimization of LPBF process. These algorithms enable the effective selection of LPBF parameters that strike a balance between part quality and energy efficiency, offering a practical tool for engineers aiming to support sustainable advancement in additive manufacturing technologies.
Choosing the Best Compromise Pareto-Optimal Solution from the Non-Dominated Solutions for the LPBF Process
Zeng et al. [12] used the CRITIC method for computing the weights of the three objectives SEC, Ra, and RD. The weights thus obtained were used in the TOPSIS method to choose the best compromise Pareto-optimal solution out of the 200 solutions obtained by them. The authors reported the optimal parameters as follows: LP of 300.8W, SS of 1353.9 mm/s, and HS of 0.085mm, which leads to an SEC of 180.75 MJ/kg, Ra of 8.341 um, and RD of 98.65%. Zeng et al. [12] did not mention the numerical values of those weights anywhere in their paper. Furthermore, they did not provide all 200 MOPSO solutions to verify the optimal solution suggested by them. For fair comparison in multi-attribute decision-making (MADM), the same weights are to be used by the other MADM methods, such as BHARAT. However, as the 200 solutions data of MOPSO and the CRITIC weights are not available in Zeng et al. [12], and hence, a comparison is not possible with the CRITIC-TOPSIS method used by Zeng et al. [12].
Now, BHARAT is applied to find the best compromise Pareto-optimal solution out of the 87 non-dominated solutions of the composite front obtained by the combination of MO-BWR and MO-BMR. The objective values of SEC, Ra, and RD are normalized and shown in Table 18. If the decision-maker assigns equal weightages to the objectives SEC, Ra, and RDR (i.e., wSEC = wRa = wRD) then an average rank of 2 is assigned to each of SEC, Ra and RD (i.e., average of 1, 2, and 3 ranks). Then, using the table given in [28], BHARAT assigns an average weightage of 0.33333 to each of the three objectives. The scores (i.e., weighted sums) are shown in the last but one column of Table 19.

Table 19.
LPBF process input parameters, normalized data of the objectives, and the scores of the non-dominated solutions.
For the equal weights of importance of the three objectives, solution number 26 with optimal parameters of LP = 280.811 W, SS = 1205.406 mm/s, and HS = 0.08027 mm gave an SEC of 187.5223 MJ/kg, Ra of 6.156738 µm, and RD of 98.80513%. This optimal solution is much better than that proposed by Zeng et al. [12] using the CRITIC-TOPSIS method in terms of Ra and RD objectives of the LPBF process.
Now, to demonstrate further, using BHARAT, let the decision-maker assign a rank of 1 to SEC, 2 to Ra, and 3 to RD. Then, using BHARAT [29], a weightage of 0.452 is assigned to SEC, a weightage of 0.301 is assigned to Ra, and 0.247 is assigned to RD. Application of these weights obtained by BHARAT to the normalized data of SEC, Ra, and RD leads to the scores, as shown in the last column of Table 18. From the scores given in the last column, solution number 26 with optimal parameters of LP = 280.811 W, SS = 1205.406 mm/s, and HS = 0.08027 mm giving SEC of 187.5223 MJ/kg, Ra of 6.156738 µm, and RD of 98.80513% is suggested as the best compromise Pareto-optimal solution. This is the same as that obtained by assigning equal weights to the objectives in this particular example.
Zeng et al. [12] applied the CRITIC method to determine the objective weights for three objectives and subsequently used these weights within the TOPSIS framework to identify the best compromise solution. However, it is important to note that the CRITIC method derives weights solely from the objective data without incorporating the preferences of decision-makers. As a result, evaluating and ranking alternative non-dominated solutions using such data-driven weights may lack practical relevance, since the real-world importance of objectives—reflected in the decision-maker’s judgments—is not considered [29]. Additionally, the TOPSIS method involves complex computations that become increasingly cumbersome, with a larger number of objectives and non-dominated alternatives. Moreover, the rankings produced by TOPSIS can vary depending on the normalization technique employed. In contrast, the proposed BHARAT is straightforward, explicitly incorporates decision-maker preferences in assigning attribute weights, and utilizes a simple normalization process, making it more practical and user-friendly for evaluating and identifying the best solution.
4.3. Many-Objective Optimization of Wire Arc Additive Manufacturing (WAAM) Process with 9 Objectives Using MO-BWR and MO-BMR Algorithms
To showcase the broader applicability of the MO-BWR and MO-BMR algorithms in addressing many-objective optimization problems within manufacturing processes, a case study is presented involving the optimization of shape and performance in wire arc additive manufacturing (WAAM) with in-situ rolling of Ti–6Al–4V ELI (Extra Low Interstitial) alloy. Additive manufacturing (AM) offers a promising alternative, using energy sources like lasers, electron beams, or electric arcs, with powder or wire feedstock, to fabricate complex, high-performance metal parts suitable for aerospace applications [13]. Among AM methods, Wire Arc Additive Manufacturing (WAAM) stands out for its high deposition rates, cost-effectiveness, and ability to produce dense components—advantages that make it a strong complement to laser and electron beam methods.
Fu et al. [13] advanced the study by considering a wider range of process parameters and simultaneously optimizing multiple performance metrics, including hardness and grain size. Figure 19 presents a schematic of the WAAM setup for titanium alloy, incorporating integrated in situ rolling. The process was executed on a three-axis motion platform using an EWM Tetrix 551 DC TIG welding system following a predefined toolpath. During deposition, the roller moved synchronously with the welding torch, applying pressure to each layer as it was deposited. The operation took place within a sealed chamber filled with high-purity argon (99.999%), maintaining an oxygen concentration below 100 ppm and water vapor content under 20 ppm to ensure an inert environment. The substrate was a hot-rolled and mill-annealed Ti–6Al–4V plate with dimensions of 150 mm × 20 mm × 11 mm. To facilitate deposition, an electromagnetic coil positioned beneath the clamping plate was used to preheat the substrate. Before the building, the substrate surface was mechanically ground to remove oxide layers and rust, followed by ethanol cleaning for degreasing. A standardized coordinate system was used to define orientation: X-axis for deposition direction, Y-axis for overlap, and Z-axis for build height. Figure 20 demonstrates the result—a well-formed, smooth, multi-pass, multi-layer deposition.
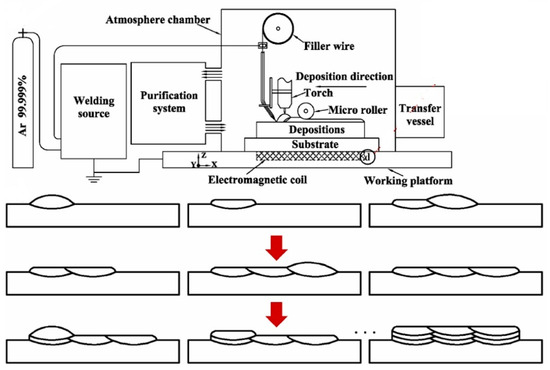
Figure 19.
WAAM process with in situ rolling [13]. Reproduced with permission from Elsevier.
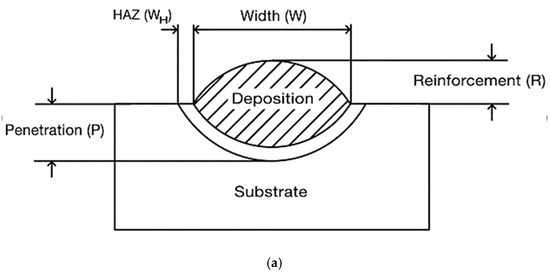

Figure 20.
(a) Measurement of geometric features based on a single-pass, six-layer deposition, and (b) measurement of grain size, hardness, and substrate distortion based on the same configuration [13]. Reproduced with permission from Elsevier.
Figure 20a shows the measurement of geometric features based on a single-pass, six-layer deposition and Figure 20a shows the measurement of grain size, hardness, and substrate distortion based on the same single-pass, six-layer configuration [13].
Fu et al. [13] determined the parameter ranges determined through iterative experimentation, followed by the design of an experimental matrix using response surface methodology (RSM) to reduce the need for extensive numerical simulations. Once the response data were collected through precise measurement techniques, predictive models for the parameters were developed. Multi-objective optimization was then performed, taking into account both the forming efficiency and the requirements of the subsequent in situ rolling process. Additionally, strategies for offset and deformation control were comprehensively integrated to optimize both the geometry and the mechanical properties of Ti–6Al–4V ELI components produced via WAAM with in situ rolling.
The process parameters considered were wire feed rate (w) varying from 2 to 3 m/min, travelling speed (v) varying from 100 to 300 mm/min, current (I) varying from 150 to 210 A, and interlayer temperature (T) varying from 40 to 180 °C. The 9 objectives (i.e., output parameters) were width (W) in mm, reinforcement (R) in mm, the W/R ratio, penetration (P) in mm, substrate distortion (HD) in mm, width of heat-affected zone (WH) in mm, interlayer waiting time (t) in minutes, average grain size (WG) in mm, and Vickers hardness (HV). The following RSM models (Equations (35)–(43)) were developed by conducting 27 experiments for W, R, W/R, P, HD, WH, t, WG, and HV, respectively.
Maximize W = 5.45218 − 7.43333w − 0.0322589v + 0.170628I − 0.0189683T +
0.000057417ν2 − 0.000517589I2 + 0.0433333wI − 0.000151111vI + 0.0000861904νT
0.000057417ν2 − 0.000517589I2 + 0.0433333wI − 0.000151111vI + 0.0000861904νT
Maximize R = 8.29110 + 0.614342w − 0.0230509ν − 0.0478277I + 0.00294998T +
0.0000322826ν2 + 0.0000910714I2 + 0.0000306958νI − 0.0000154689νT
0.0000322826ν2 + 0.0000910714I2 + 0.0000306958νI − 0.0000154689νT
Maximize W/R = −0.942386 − 1.46253w + 0.0134285v + 0.0509107I − 0.0126195T −
0.0000472198ν2 + 0.0000640758νT
0.0000472198ν2 + 0.0000640758νT
Minimize P = 10.4437 − 4.42714w + 0.00864167v − 0.0514444I − 0.026381T +
0.621667w2 + 0.0000117917v2 + 0.000262963I2 + 0.0114286wT − 0.0000991667νI
0.621667w2 + 0.0000117917v2 + 0.000262963I2 + 0.0114286wT − 0.0000991667νI
Minimize HD = 2.45044 + 0.105w − 0.000756667ν − 0.0139306I − 0.0026131T −
0.0000144833ν2 + 0.00005νI
0.0000144833ν2 + 0.00005νI
Minimize WH = −10.6536 + 2.82048w+0.01065v + 0.0754167I + 0.0114728T−
0.256667w2 − 0.000103241I2 + 0.0000330782T2 − 0.0063333wI − 0.00642857wT−
0.0000625vI
0.256667w2 − 0.000103241I2 + 0.0000330782T2 − 0.0063333wI − 0.00642857wT−
0.0000625vI
Minimize t = −14.238 − 0.140705ν + 0.331506I + 0.0514755T + 0.000260673ν2 +
0.000997212T2 − 0.00202897IT
0.000997212T2 − 0.00202897IT
Minimize WG = 18.275 − 3.29283w − 0.0230842v − 0.115857I + 0.0000268647v2 +
0.000227847I2 + 0.00336028wv + 0.0152783wI
0.000227847I2 + 0.00336028wv + 0.0152783wI
Maximize HV = 261.29 − 102.514w − 0.0285042v + 1.61902I + 0.5885T − 0.00038565ν2 −
0.00737986I2 − 0.00101366T2 + 0.475wI + 0.130357wT + 0.00141667vI − 0.00376983IT
0.00737986I2 − 0.00101366T2 + 0.475wI + 0.130357wT + 0.00141667vI − 0.00376983IT
Fu et al. [13] reported that the wire feed rate (w) had the most significant impact on bead width (W) and reinforcement (R); the travel speed (v) most strongly influenced weld geometry (WG); the current (I) had the greatest effect on penetration (P); and the interlayer temperature (T) primarily affected interlayer waiting time (t). Optimization was performed using the response optimizer in Minitab 16, which yielded the optimal parameter settings as w = 2.5 m/min, v = 187 mm/min, I = 178 A, and T = 93 °C.
The MO-BWR and MO-BMR algorithms are now applied to this many-objective problem. A population size of 25 and 1000 iterations are considered for each of the MO-BWR and MO-BMR algorithms. After removing duplicate solutions, a composite front consisting of 45 non-dominated Pareto solutions is produced, as shown in Table 20. The last column indicates by which algorithm that particular solution is obtained.

Table 20.
Non-dominated solutions of the composite Pareto front for the WAAM process.
Table 21 shows the performance metrics.

Table 21.
Performance metrics of the algorithms for the WAAM process with reference to the true front.
Choosing the Best Compromise Pareto-Optimal Solution from the Non-Dominated Solutions for the WAAM Process
Now, to find out the “best compromise” non-dominated pareto solution, considering all the 9 objectives simultaneously, BHARAT is used. Let the decision-maker assign equal importance to all the objectives. In fact, the objective W/R is not required as the objectives W and R are already considered the objectives. Probably, that was why Fu et al. [13] did not consider W/R and considered only the remaining 8 objectives in the multi-objective optimization carried out by them. Hence, here also, only 8 objectives are considered for decision-making using BHARAT. Then, their average rank will be 4.5 (i.e., average of 1, 2, 3, 4, 5, 6, 7, and 8). The corresponding average weight from the BHARAT table [29] is 0.125 for each of these 9 objectives. Table 22 shows the normalized data of the 8 objectives and the BHARAT scores considering equal weightages to all the objectives (scores are shown in the last but one column).

Table 22.
Normalized data of the objectives and the scores of the non-dominated solutions for the WAMM process.
The width (W) is a beneficial objective (i.e., the maximum value is required). Hence, the value of 14.80134 corresponding to solution no. 45 is assigned 1. The other values under the W column are divided by 14.80134 to get the normalized data for W. A similar procedure is followed for other beneficial objectives such as R and HV. The objective substrate distortion (HD) is a non-beneficial objective (i.e., minimum value is required). Hence, the value of 0.668577 corresponding to solution 13 is assigned 1. To get the normalized data of HD for the other solutions in the HD column, this value of 0.668577 is divided by the corresponding HD values of the solutions. A similar procedure is followed for the other non-beneficial objectives such as P, WH, t, and WG. The scores given in the last two columns are computed by summing up the products of multiplication of the normalized data of the objectives with the corresponding weights (as explained in Section 3.2). For example, if all 8 objectives are considered equally important, then an average weight of 0.125 is assigned to each of the objectives. Then, the score of 0.682877 for solution no. 1 is obtained as 0.125 × 0.700346 + 0.125 × 0.535811 + 0.125 × 0.689167 + 0.125 × 0.41176 + 0.125 × 0.61035 + 0.125 × 0.884182 + 0.125 × 0.666927 + 0.125 × 0.964472 = 0.682877. A similar procedure can be followed to calculate the scores of different objectives given different weights. The best compromise solution is the one with the highest score.
Just for more demonstration of BHARAT, let the decision-maker assign equal importance to W, R, and HV. Then, their average rank will be 2 (i.e., average of 1, 2, and 3). The corresponding average weight from the BHARAT table [28] is 0.1718 for each of these 3 objectives. Let the decision-maker consider the remaining objectives of HD, P, WH, t, and WG as secondary and consider them equally important among themselves. Then, their average rank will be 6 (i.e., average of 4, 5, 6, 7, and 8). The corresponding average weight from the BHARAT table [29] is 0.0969 for each of these 5 objectives. The last column of Table shows the scores of the non-dominated solutions using these weights and the normalized data of the non-dominated solutions. By coincidence, this solution is the same as that obtained by assigning equal weights (and unequal weights) to the objectives in this particular example.
From the scores given in the last two columns, solution number 15 with optimal parameters of w = 2.354565 m/min, v = 269.065 mm/min, I = 168.4278 A, and T = 142.9129 °C is suggested as the optimal input parameters for the WAMM process considered. Fu et al. [13] conducted an optimal analysis using the response optimizer in Minitab 16 and reported the optimum parameters as w = 2.5 m/min, v = 187 mm/min, I = 178 A, and T = 93 °C. A comparison of the results is given in Table 23.

Table 23.
Comparison of the results for the WAMM process.
It can be observed that out of the 8 objectives, the present work using MO-BWR and MO- BMR algorithms provides 5 objectives comparatively better than those given by Fu et al. [13]. Thus, solution no. 15 is proved to be the best compromise Pareto-optimal solution for the considered many-objective optimization problem of the WAMM process.
Table 24 presents a comparison of the MO-BWR and MO-BMR algorithms with reference to certain criteria.

Table 24.
General comparison of the MO-BWR and MO-BMR algorithms.
The next section provides conclusions of the present work.
5. Conclusions
In this work, two new optimization algorithms—Best–Worst–Random (BWR) and Best–Mean–Random (BMR)—are proposed, and their capabilities are demonstrated across diverse manufacturing optimization problems. These algorithms are designed to be simple and efficient, operating without metaphorical inspirations or algorithm-specific control parameters that often accompany other metaheuristics.
- The BWR and BMR algorithms are applied to single-objective optimization scenarios involving friction stir processing and ultra-precision turning. The BWR and BMR algorithms demonstrated faster convergence and higher-quality solutions with fewer function evaluations—indicating computational efficiency.
- The multi- and many-objective versions—MO-BWR and MO-BMR—are tested on two- and three-objective optimization problems in the ultra-precision turning and laser powder bed fusion process. The many-objective capabilities of these algorithms are also assessed through a nine-objective problem based on the wire arc additive manufacturing process. When compared with prominent algorithms like GA, PSO, etc., the proposed methods demonstrated excellent solution diversity and convergence behavior.
- The BWR and BMR algorithms and their multi-objective variants show that competitive performance can be achieved without added complexity, offering transparent, interpretable, robust, and versatile tools for optimizing manufacturing processes.
- A key aspect of this study is the integration of BHARAT, a structured MADM tool that, along with the R-method, identifies the most suitable compromise solution from the Pareto-optimal set. This becomes particularly valuable in many-objective problems, where visual interpretation becomes infeasible.
- The results suggest broad applicability of these algorithms to real-world, high-dimensional, and constrained/unconstrained manufacturing challenges. Their potential extends to process optimization in additive manufacturing, tool path planning, welding parameter tuning, multi-axis machining, and thermal processing, as well as their possible integration with machine learning models for data-driven manufacturing.
Author Contributions
Conceptualization, R.V.R.; methodology, R.V.R.; validation, R.V.R.; formal analysis, writing—original draft preparation, R.V.R.; writing—review and editing, J.P.D. and R.V.R. All authors have read and agreed to the published version of the manuscript.
Funding
This research received no external funding to meet the APC.
Data Availability Statement
The original contributions presented in this study are included in the article. Further inquiries can be directed to the corresponding author.
Acknowledgments
The first author acknowledges the Anusandhan National Research Foundation of the Department of Science and Technology (DST), Government of India, for sanctioning the project (grant number MTR/2023/000071). M. V. Harishankar helped with ZDT functions. During the preparation of this manuscript, the first author used ChatGPT 4o for the purposes of drawing certain figures and related interpretations. The authors have reviewed and edited the output and take full responsibility for the content of this publication.
Conflicts of Interest
The authors declare no conflicts of interest.
References
- Abdelaoui, F.Z.E.; Jabri, A.; Barkany, A.E. Optimization techniques for energy efficiency in machining processes—A review. Int. J. Adv. Manuf. Technol. 2023, 125, 2967–3001. [Google Scholar] [CrossRef] [PubMed]
- Prakash, C.; Singh, S.; Basak, A.; Davim, J.P. (Eds.) Numerical Modelling and Optimization in Advanced Manufacturing Processes; Springer: Cham, Switzerland, 2022. [Google Scholar]
- Soori, M.; Asmael, M. A review of the recent development in machining parameter optimization. Jordan J. Mech. Ind. Eng. 2022, 16, 205–223. [Google Scholar]
- Ullrich, K.; von Elling, M.; Gutzeit, K.; Dix, M.; Weigold, M.; Aurich, J.C.; Wertheim, R.; Jawahir, I.S.; Ghadbeigi, H. AI-based optimisation of total machining performance: A review. CIRP J. Manuf. Sci. Technol. 2024, 50, 40–54. [Google Scholar] [CrossRef]
- Tura, A.D.; Isaya, E.O.; Adizue, U.L.; Farkas, B.Z.; Takács, M. Optimization of ultra-precision CBN turning of AISI D2 using hybrid GA-RSM and Taguchi-GRA statistic tools. Heliyon 2024, 10, e31849. [Google Scholar] [CrossRef] [PubMed]
- Sureban, R.; Kulkarni, V.N.; Gaitonde, V. Modern Optimization Techniques for Advanced Machining Processes—A Review. Mater. Today Proc. 2019, 18, 3034–3042. [Google Scholar] [CrossRef]
- Chen, Y.; Hu, S.; Li, A.; Cao, Y.; Zhao, Y.; Ming, W. Parameters optimization of electrical discharge machining process using swarm intelligence: A review. Metals 2023, 13, 839. [Google Scholar] [CrossRef]
- Ciccone, F.; Bacciaglia, A.; Ceruti, A. Optimization with artificial intelligence in additive manufacturing: A systematic review. J. Braz. Soc. Mech. Sci. Eng. 2023, 45, 303. [Google Scholar] [CrossRef]
- Chia, H.Y.; Wu, J.; Wang, X.; Yan, W. Process parameter optimization of metal additive manufacturing: A review and outlook. J. Mater. Inform. 2022, 2, 16. [Google Scholar] [CrossRef]
- Rehman, R.U.; Zaman, U.K.U.; Aziz, S.; Jabbar, H.; Shujah, A.; Khaleequzzaman, S.; Hamza, A.; Qamar, U.; Jung, D.W. Process parameter optimization of additively manufactured parts using intelligent manufacturing. Sustainability 2022, 14, 15475. [Google Scholar] [CrossRef]
- Ali, H.M.A.; Abdi, M. Multi-objective parametric shape optimisation of BCC lattice structures for AM—Maximizing stiffness and minimizing von Mises stress via MOGA. J. Manuf. Mater. Process. 2023, 7, 156. [Google Scholar]
- Zeng, Q.; Wang, K.; Lu, S.; Lu, C.; Li, X. Modeling and optimization of energy consumption, surface quality and relative density in GH3625 superalloy by laser powder bed melting via RSM, MOPSO and CRITIC-TOPSIS. Opt. Laser Technol. 2025, 184, 112411. [Google Scholar] [CrossRef]
- Fu, Y.; Chen, X.; Zhang, M.; Zhou, X.; Li, R.; Bai, X.; Wang, G. Optimization of shape and performance for wire and arc additive manufacturing with in-situ rolling of Ti–6Al–4V ELI alloy. J. Mater. Res. Technol. 2025, 35, 4833–4847. [Google Scholar] [CrossRef]
- Chen, H.; Zhang, B.; Fuhlbrigge, T. Welding process optimization methods: A review. In Transactions on Intelligent Welding Manufacturing; Chen, S., Zhang, Y., Feng, Z., Eds.; Springer: Singapore, 2020. [Google Scholar]
- Palanikumar, K.; Natarajan, E.; Suresh, S.; Mohan, D.G.; Prakash, C.; Kaur, K. Prospects of friction stir processed Mg alloys and composites—Reviews and suggestions. J. Mater. Res. Technol. 2024, 31, 971–997. [Google Scholar] [CrossRef]
- Mohankumar, A.; Packkirisamy, V.; Sagar, P.; Thirugnanasambandam, A. Multi-fidelity machine learning-driven metaheuristic optimization of friction stir processing for enhanced performance in hybrid surface composites. Mater. Today Commun. 2025, 46, 112778. [Google Scholar] [CrossRef]
- Červeňanská, Z.; Kotianová, J.; Važan, P.; Juhásová, B.; Juhás, M. Multi-Objective Optimization of Production Objectives Based on Surrogate Modeling. Appl. Sci. 2020, 10, 7870. [Google Scholar] [CrossRef]
- Kizhakkinan, U.; Duong, P.L.T.; Laskowski, R.; Vastola, G.; Rosen, D.W.; Raghavan, N. Development of a surrogate model for high-fidelity laser powder-bed fusion using tensor train and gaussian process regression. J. Intell. Manuf. 2023, 34, 369–385. [Google Scholar] [CrossRef]
- Simon, D. Evolutionary Optimization Algorithms: Biologically-Inspired and Population-Based Approaches to Computer Intelligence; John Wiley & Sons: Hoboken, NJ, USA, 2013. [Google Scholar]
- Benmamoun, Z.; Fethallah, W.; Ahlaqqach, M.; Jebbor, I.; Benmamoun, M.; Elkhechafi, M. Butterfly Algorithm for Sustainable Lot Size Optimization. Sustainability 2023, 15, 11761. [Google Scholar] [CrossRef]
- Salgotra, R.; Sharma, P.; Raju, S.; Gandomi, A.H. A contemporary systematic review on meta-heuristic optimization algorithms with their MATLAB and Python code reference. Arch. Comput. Methods Eng. 2024, 31, 1749–1822. [Google Scholar] [CrossRef]
- Rajwar, K.; Deep, K.; Das, S. An exhaustive review of the metaheuristic algorithms for search and optimization: Taxonomy, applications, and open challenges. Artif. Intell. Rev. 2023, 56, 13187–13257. [Google Scholar] [CrossRef] [PubMed]
- Rao, R.V. Rao algorithms: Three metaphor-less simple algorithms for solving optimization problems. Int. J. Ind. Eng. Comput. 2020, 11, 107–130. [Google Scholar] [CrossRef]
- Aranha, C.L.C.; Villalón, F.; Dorigo, M.; Ruiz, R.; Sevaux, M.; Sörensen, K.; Stützle, T. Metaphor-based metaheuristics, a call for action: The elephant in the room. Swarm Intell. 2021, 16, 1–6. [Google Scholar] [CrossRef]
- Velasco, L.; Guerrero, H.; Hospitaler, A. A literature review and critical analysis of metaheuristics recently developed. Arch. Comput. Methods Eng. 2024, 31, 125–146. [Google Scholar] [CrossRef]
- Sarhani, M.; Voß, S.; Jovanovic, R. Initialization of metaheuristics: Comprehensive review, critical analysis, and research directions. Int. Trans. Oper. Res. 2023, 30, 3361–3397. [Google Scholar] [CrossRef]
- Ghasemi, M.; Golalipour, K.; Zare, M.; Mirjalili, S.; Trojovsky, P.; Abbuligah, L.; Hemmati, R. Flood Algorithm (FLA): An Efficient Inspired Meta-Heuristic for Engineering Optimization. J. Supercomput. 2024, 80, 22913–23017. [Google Scholar] [CrossRef]
- Rao, R.V.; Shah, R. BMR and BWR: Two simple metaphor-free optimization algorithms for solving real-life non-convex constrained and unconstrained problems. arXiv 2024, arXiv:2407.11149v2. [Google Scholar]
- Rao, R.V. BHARAT: A simple and effective multi-criteria decision-making method that does not need fuzzy logic, Part-1: Multi-attribute decision-making applications in the industrial environment. Int. J. Ind. Eng. Comput. 2024, 15, 13–40. [Google Scholar] [CrossRef]
Disclaimer/Publisher’s Note: The statements, opinions and data contained in all publications are solely those of the individual author(s) and contributor(s) and not of MDPI and/or the editor(s). MDPI and/or the editor(s) disclaim responsibility for any injury to people or property resulting from any ideas, methods, instructions or products referred to in the content. |
© 2025 by the authors. Licensee MDPI, Basel, Switzerland. This article is an open access article distributed under the terms and conditions of the Creative Commons Attribution (CC BY) license (https://creativecommons.org/licenses/by/4.0/).