
Influence and Potential of Additive Manufactured Reference Geometries for Ultrasonic Testing


Abstract
1. Introduction
- Can additive manufacturing be used to manufacture test bodies overcoming current limitations posed by conventional processes while still meeting required specifications?
- Can artificial defects be found in additively manufactured test bodies? And how does the quality of additively manufactured reflectors compare with reflectors manufactured using metal cutting processes?
- How does the layered structure and the rough surface resulting from the manufacturing process influence ultrasonic testing?
2. Materials and Methods
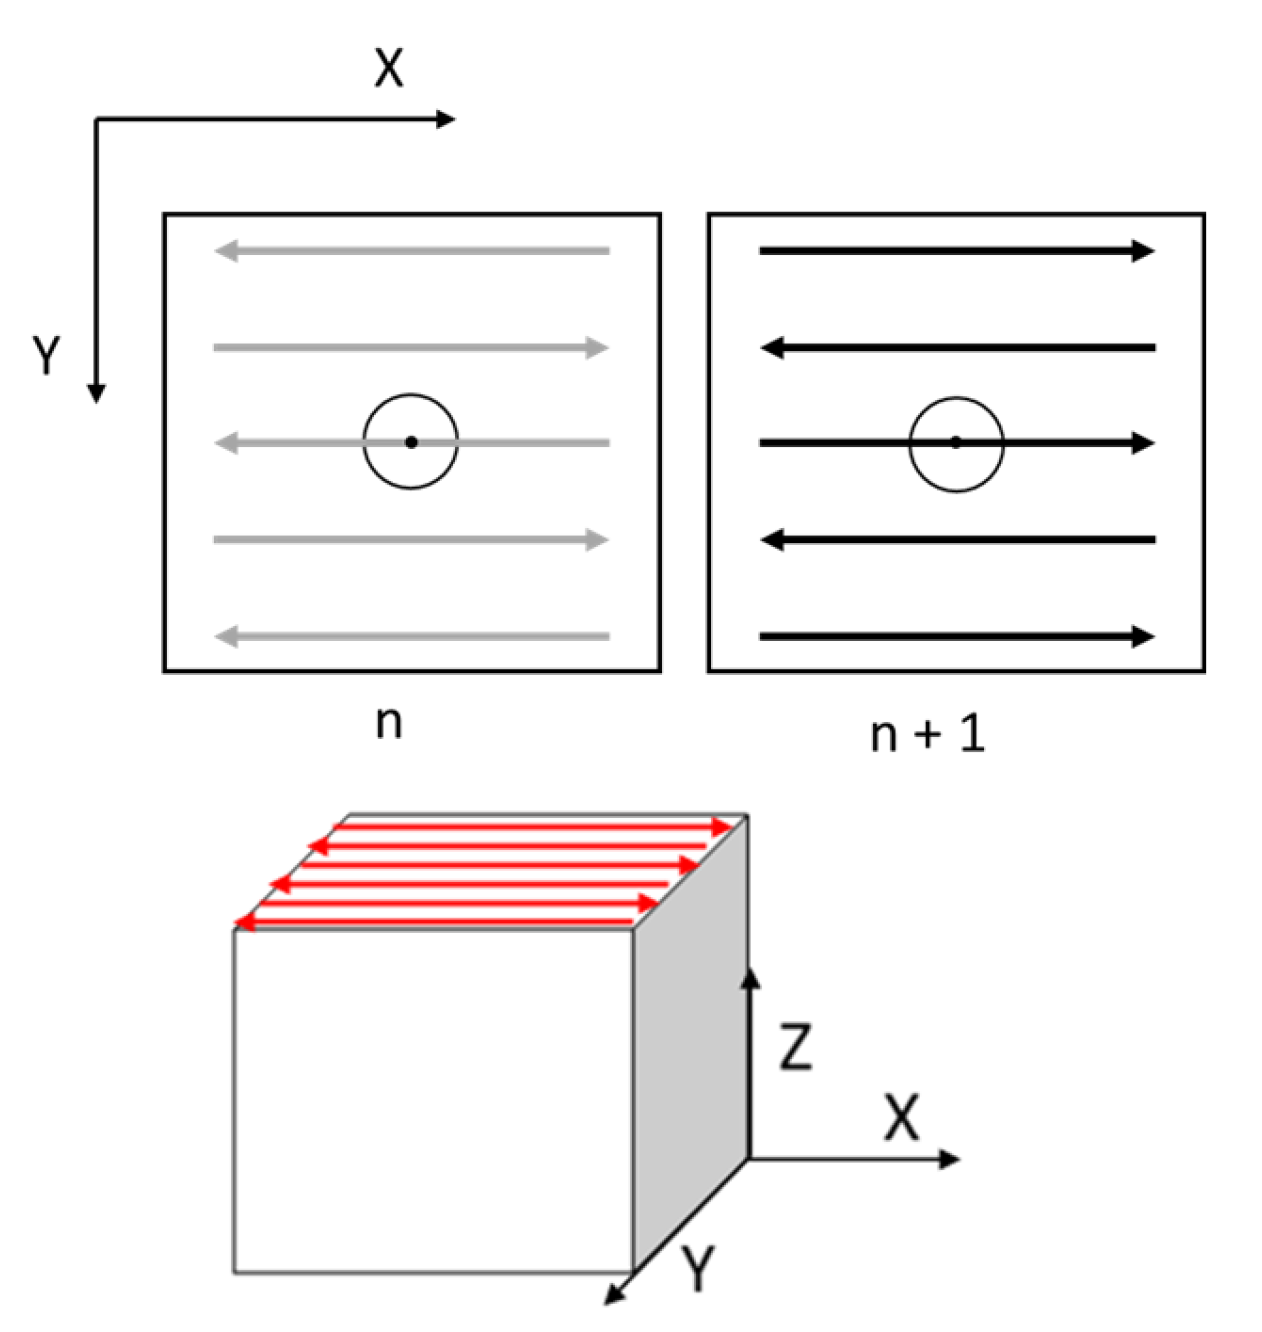
2.1. Investigation of the Influence of Laser Path Orientation on Acoustic Properties
2.1.1. Sample Preparation
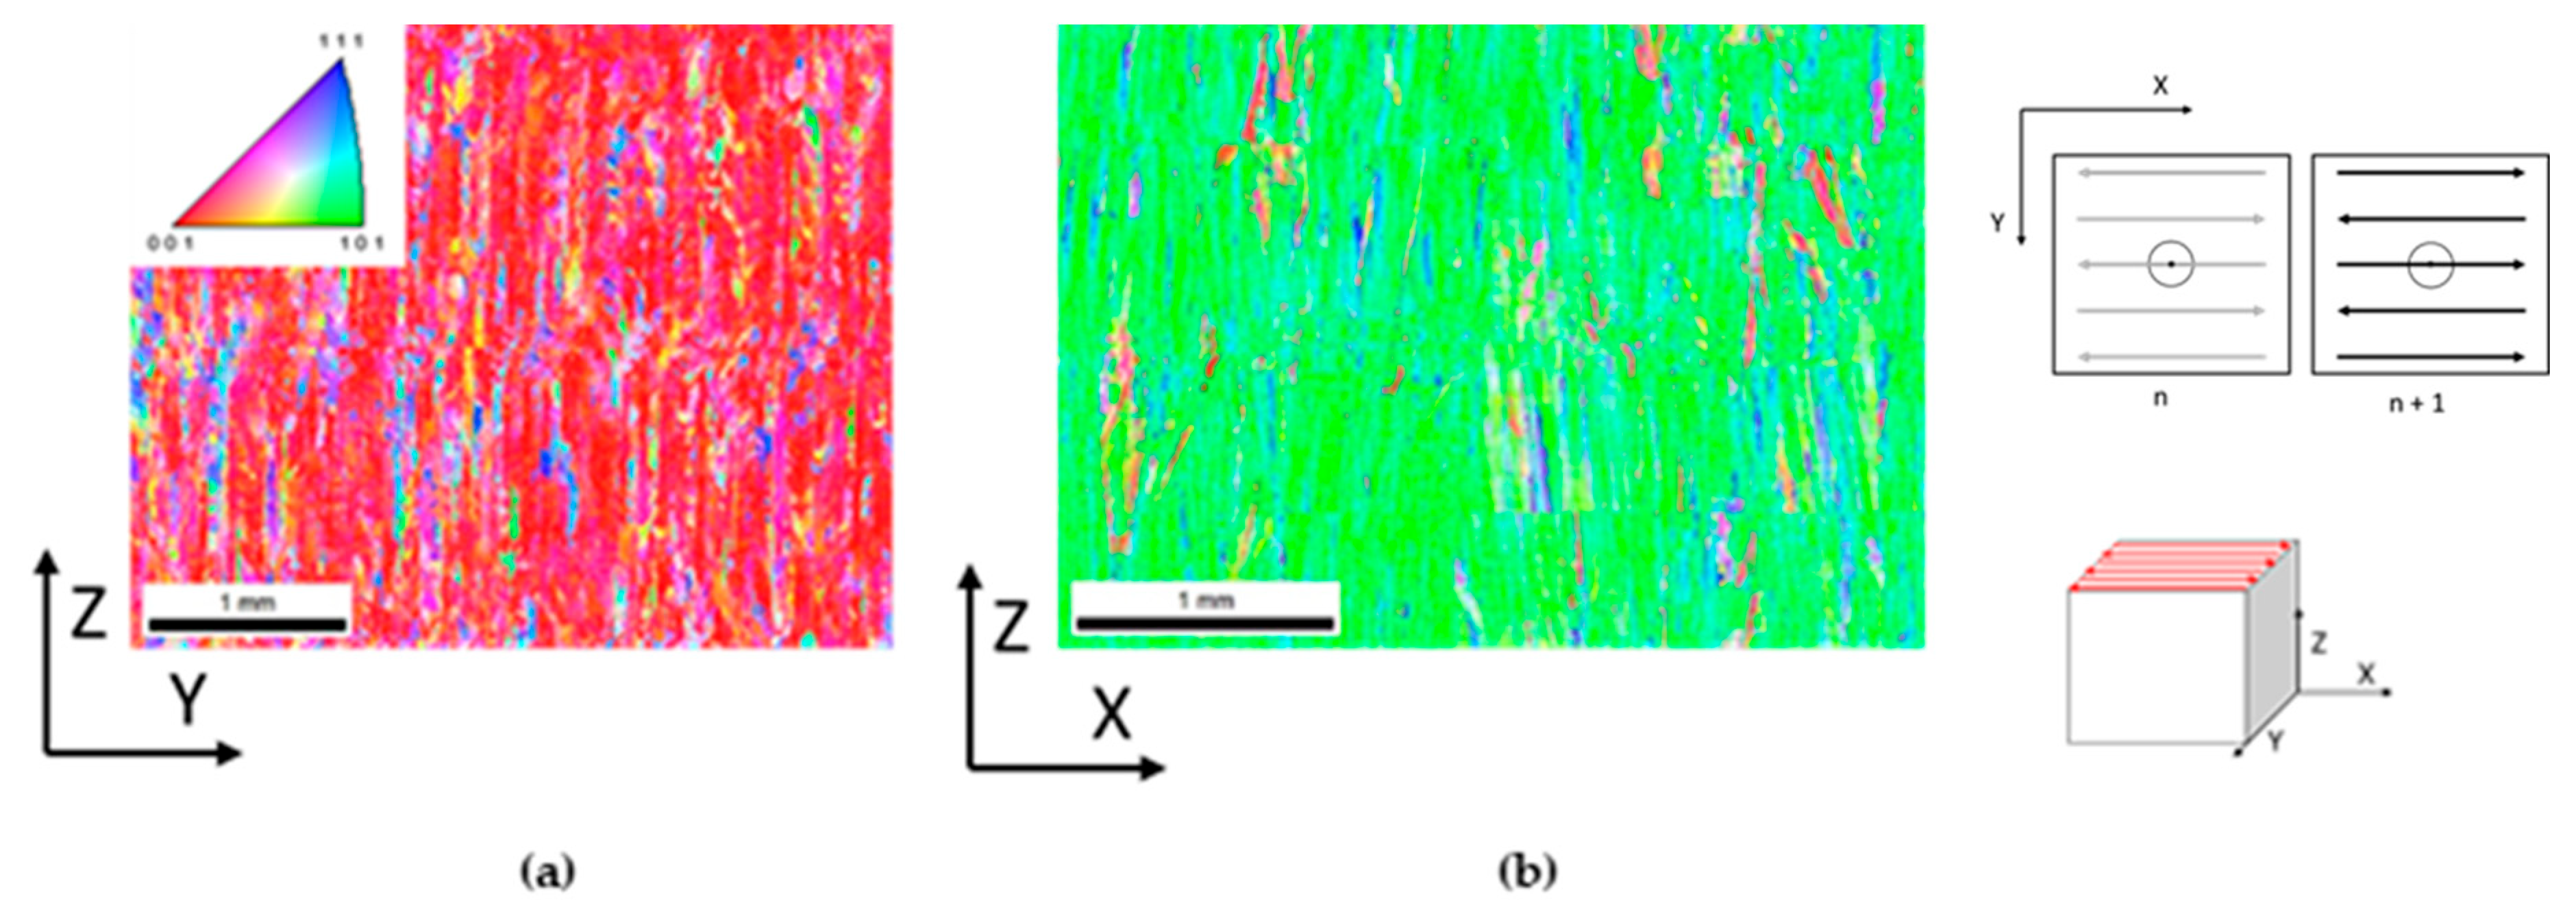
2.1.2. EBSD Analysis
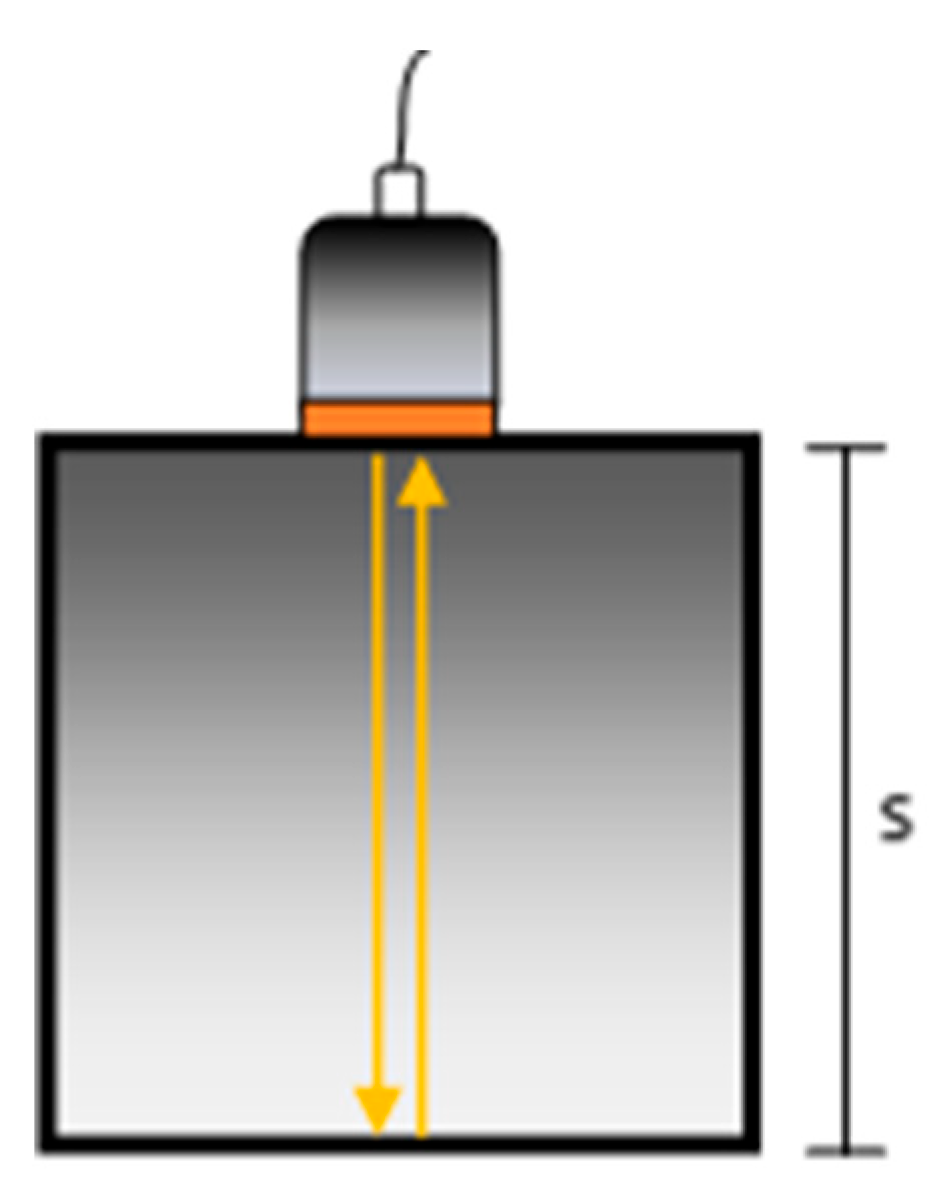
2.1.3. Sound Velocity and Attenuation
2.2. Influence of Surface Roughness on Sound Amplitude
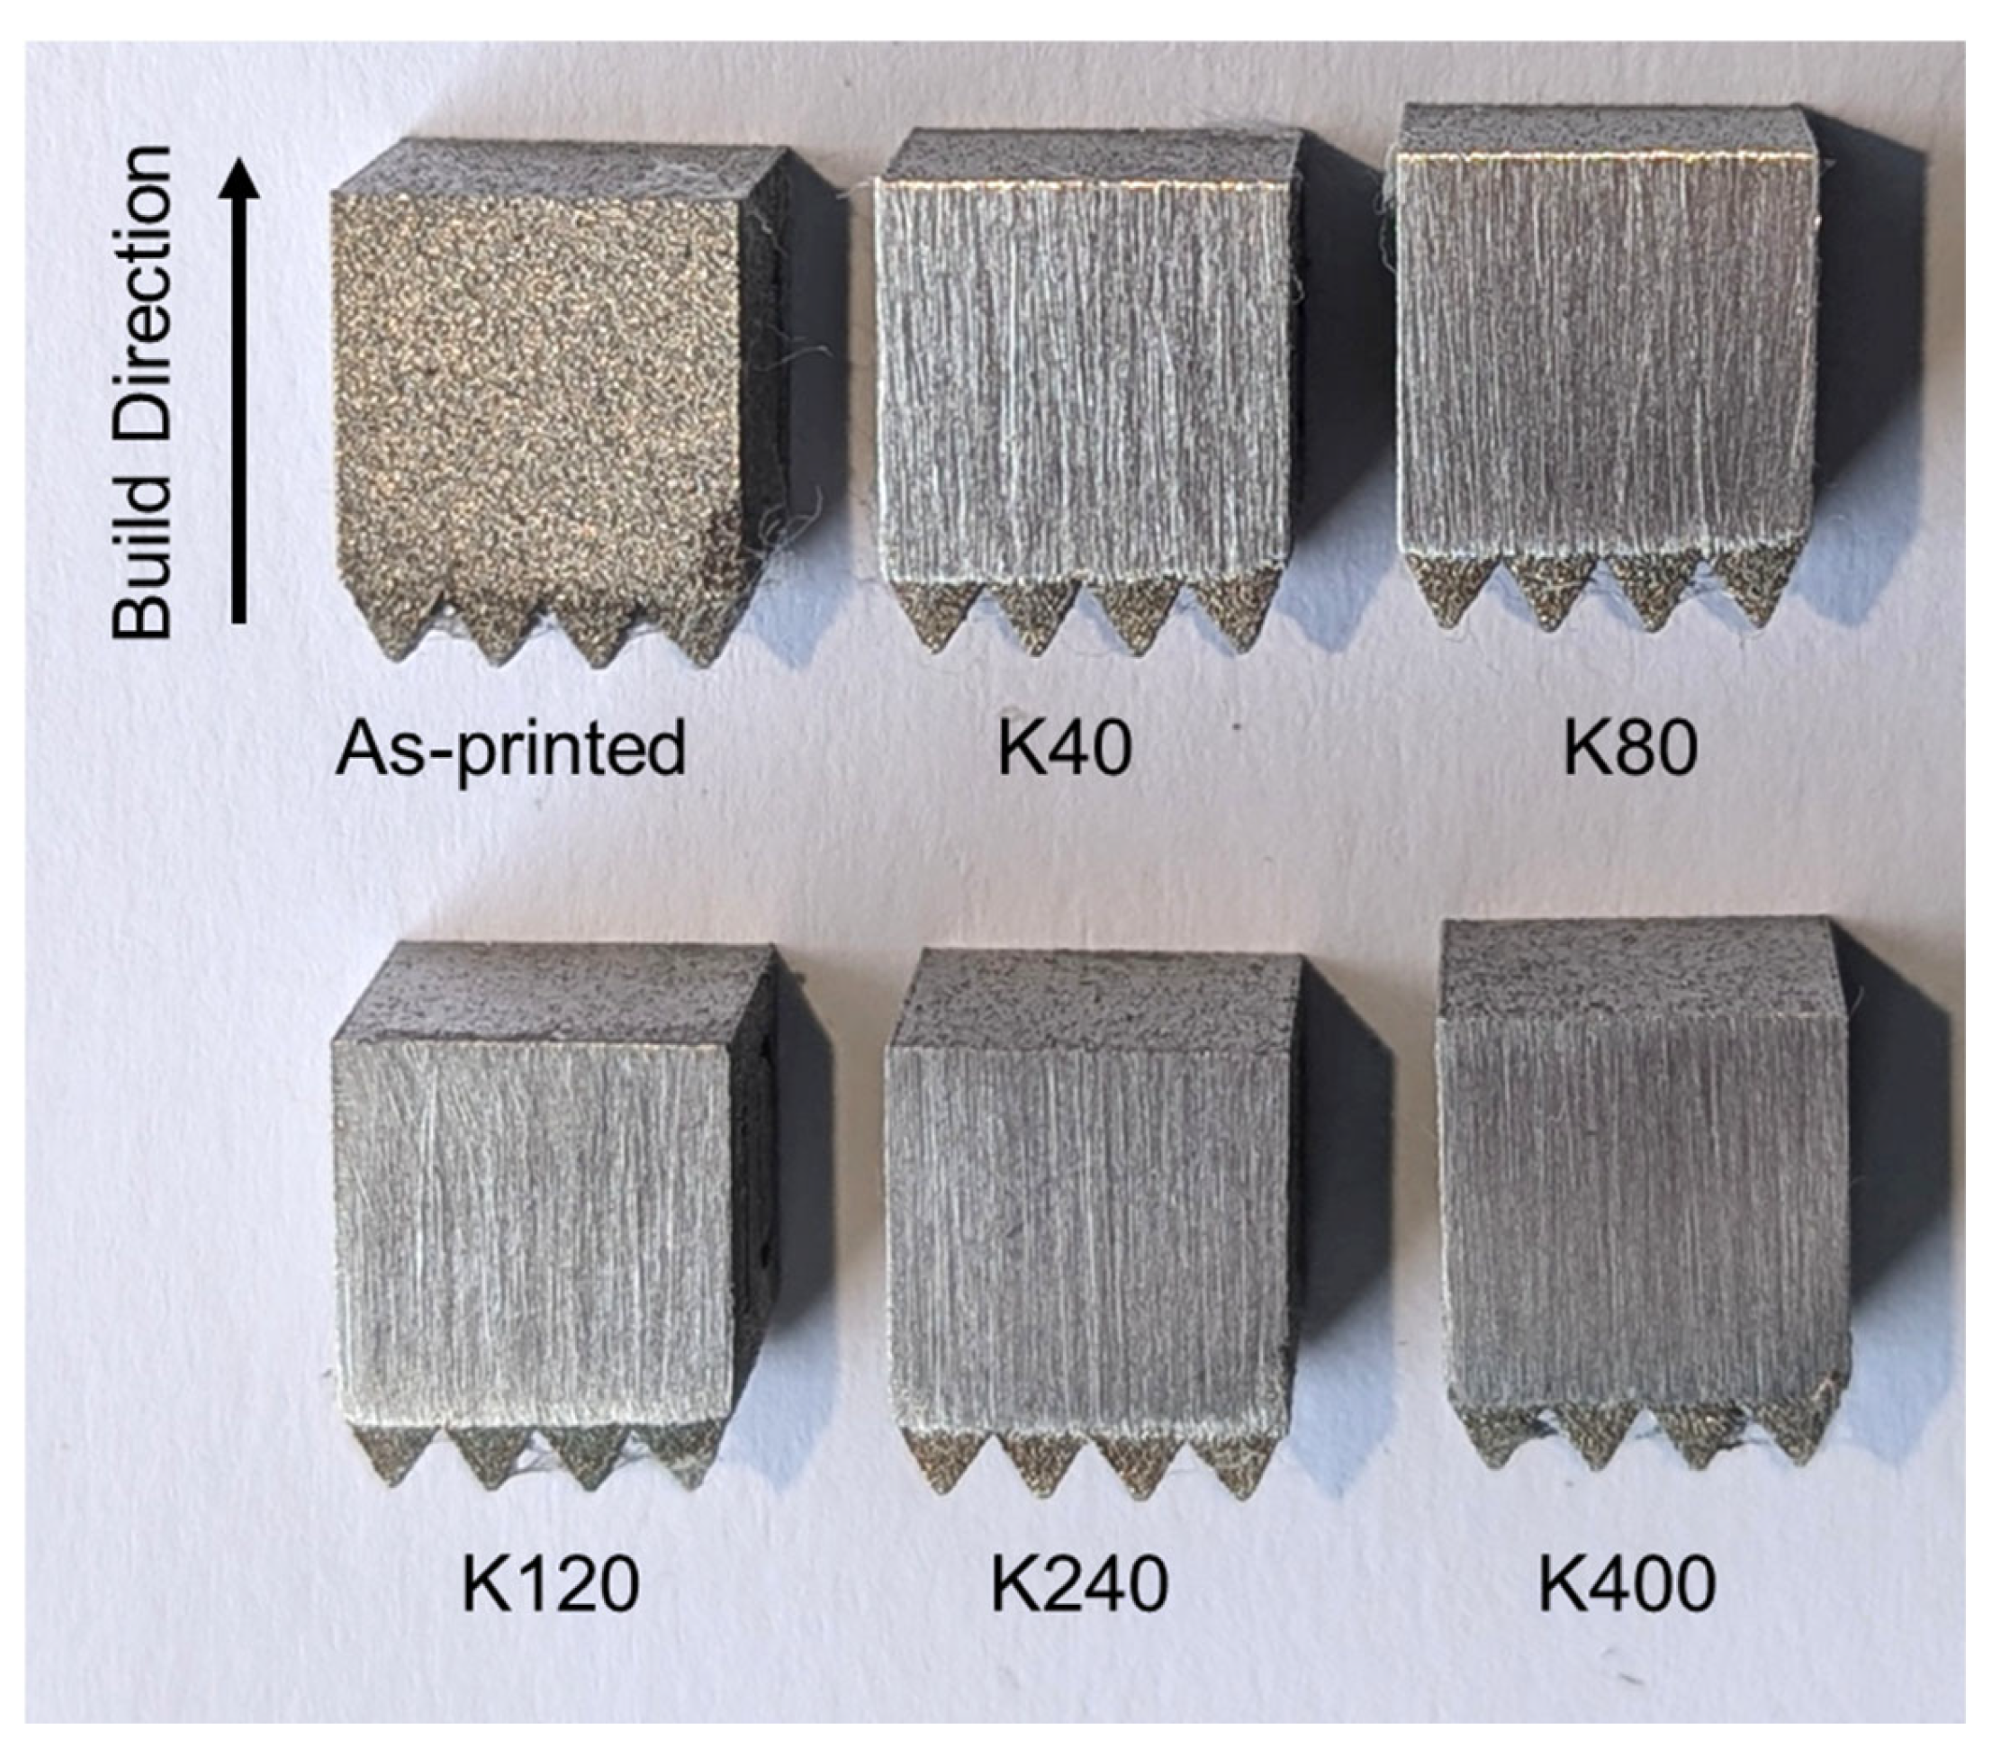
2.2.1. Sample Preparation
2.2.2. Surface Treatment and Roughness Measurement
2.2.3. Sound Attenuation
2.3. Test Bodies with Flat-Bottomed Hole Reflectors (FBH)
2.3.1. Sample Preparation
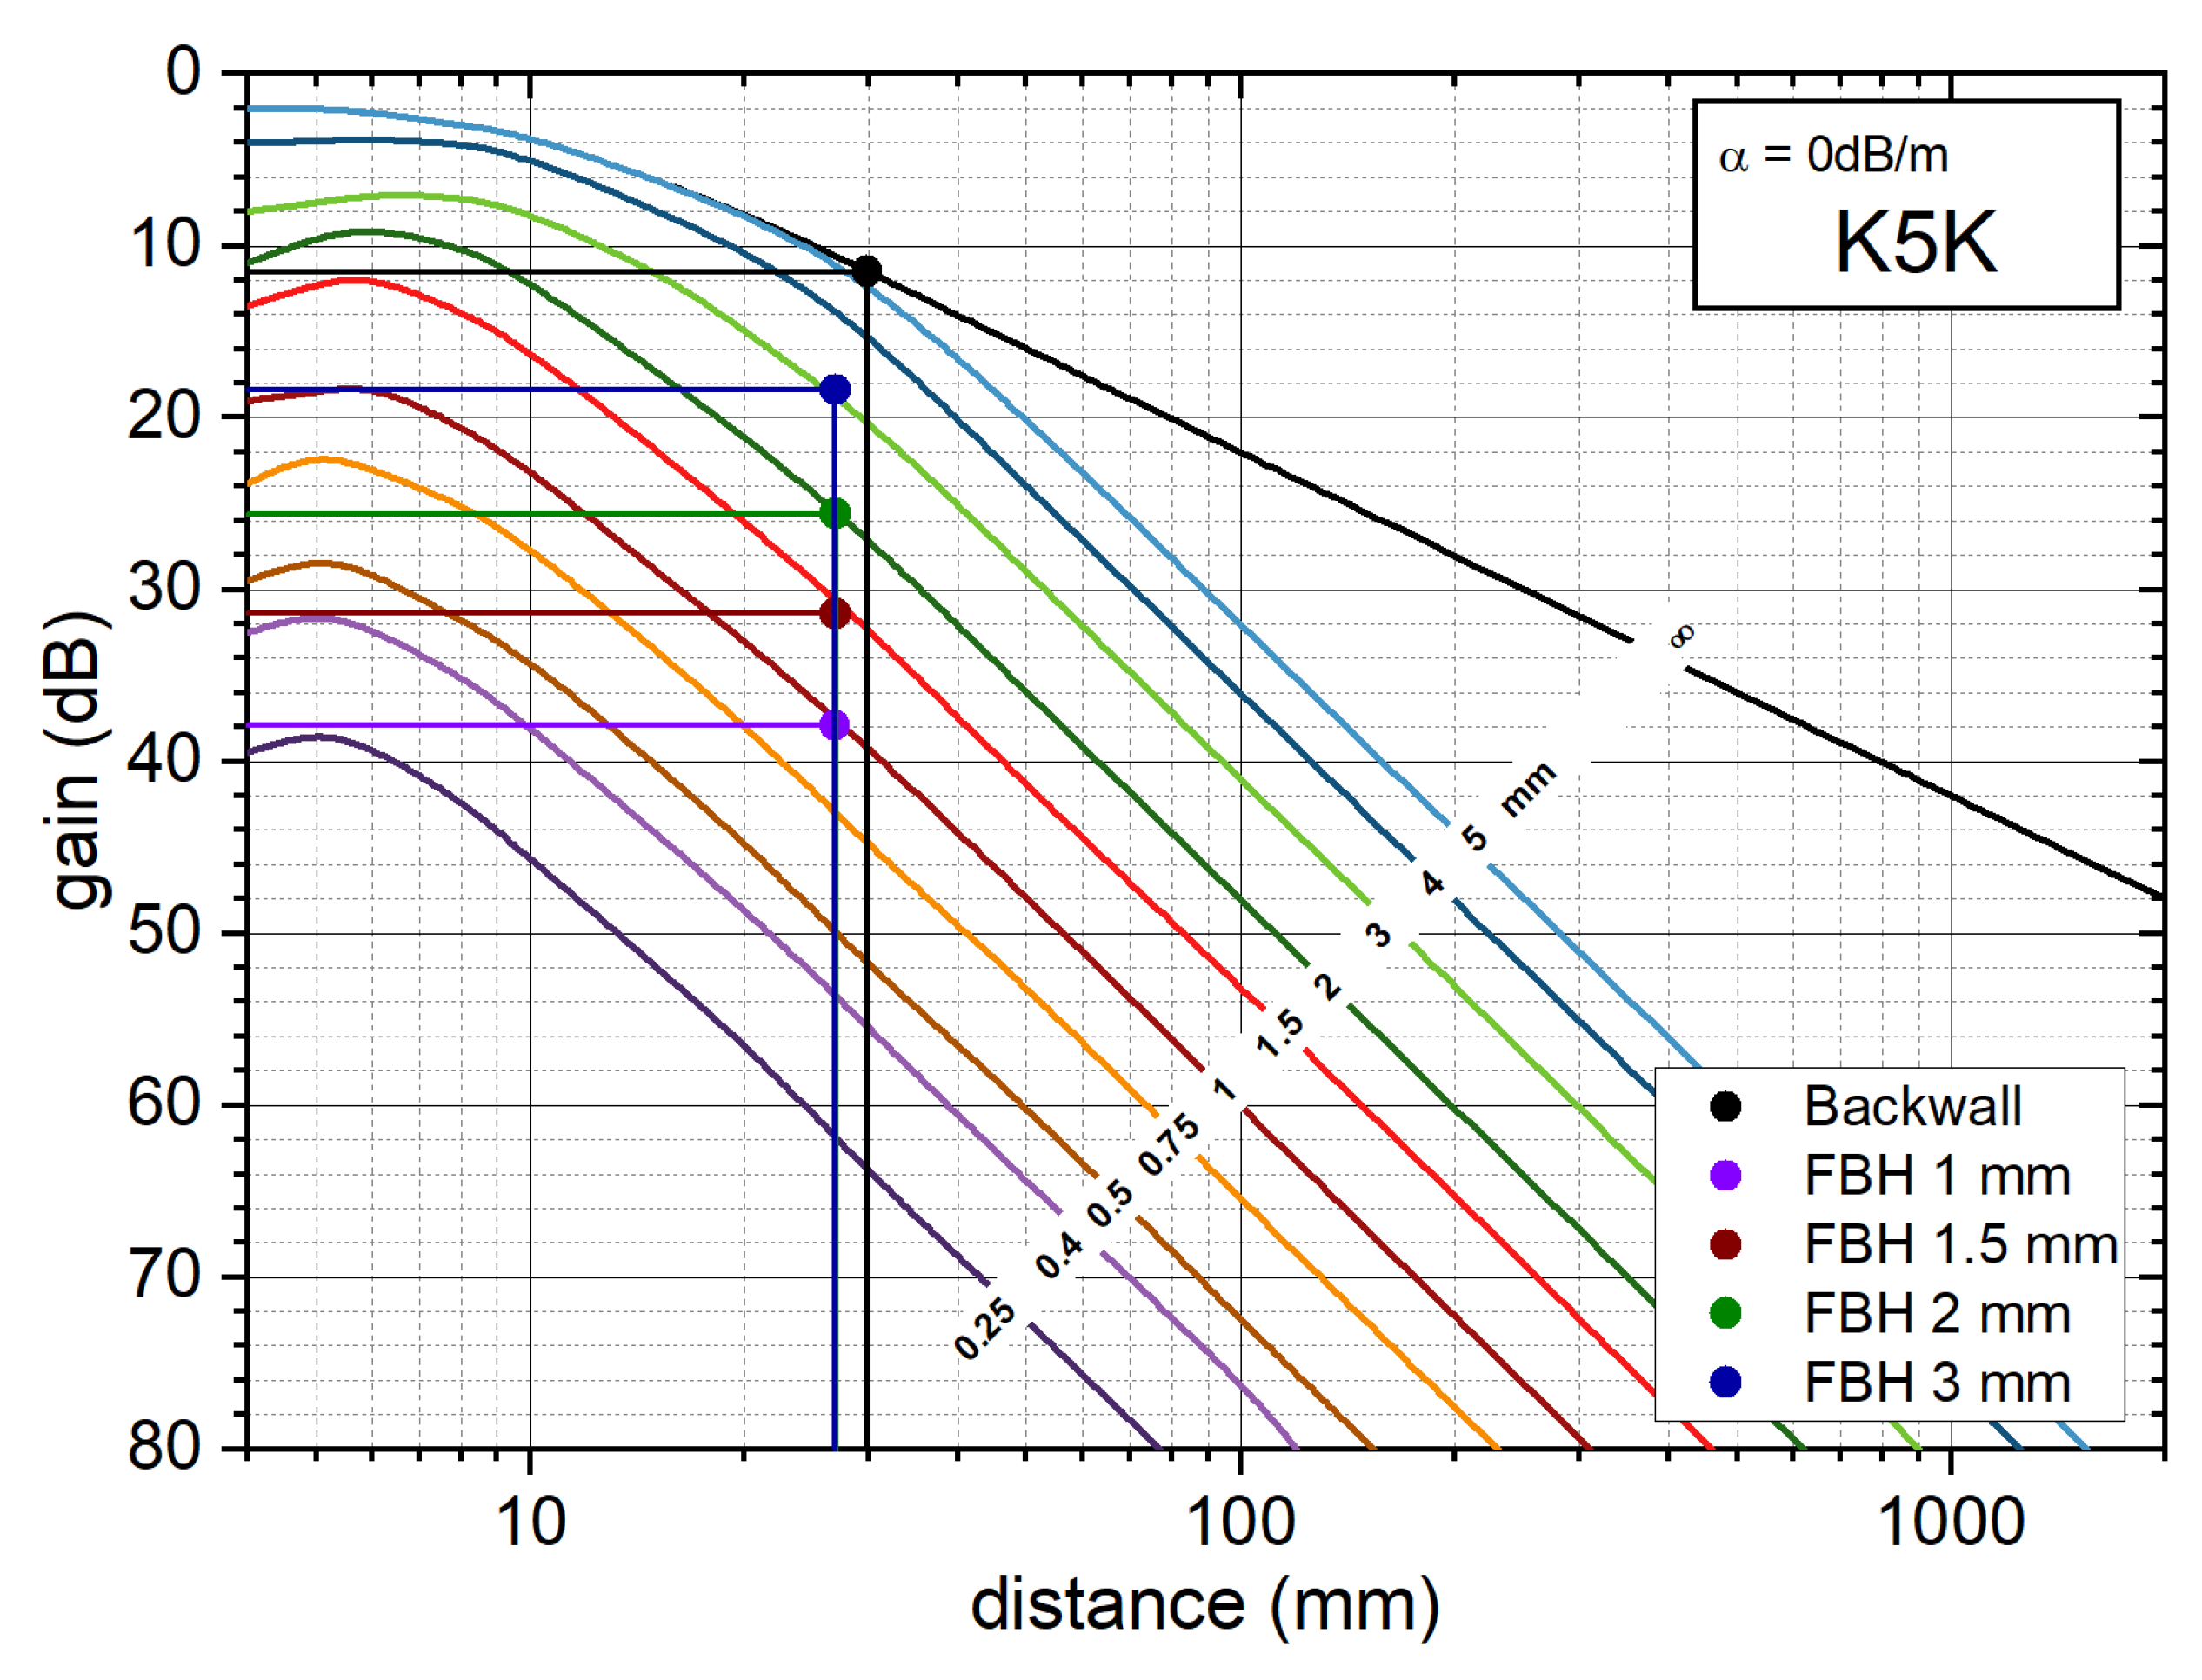
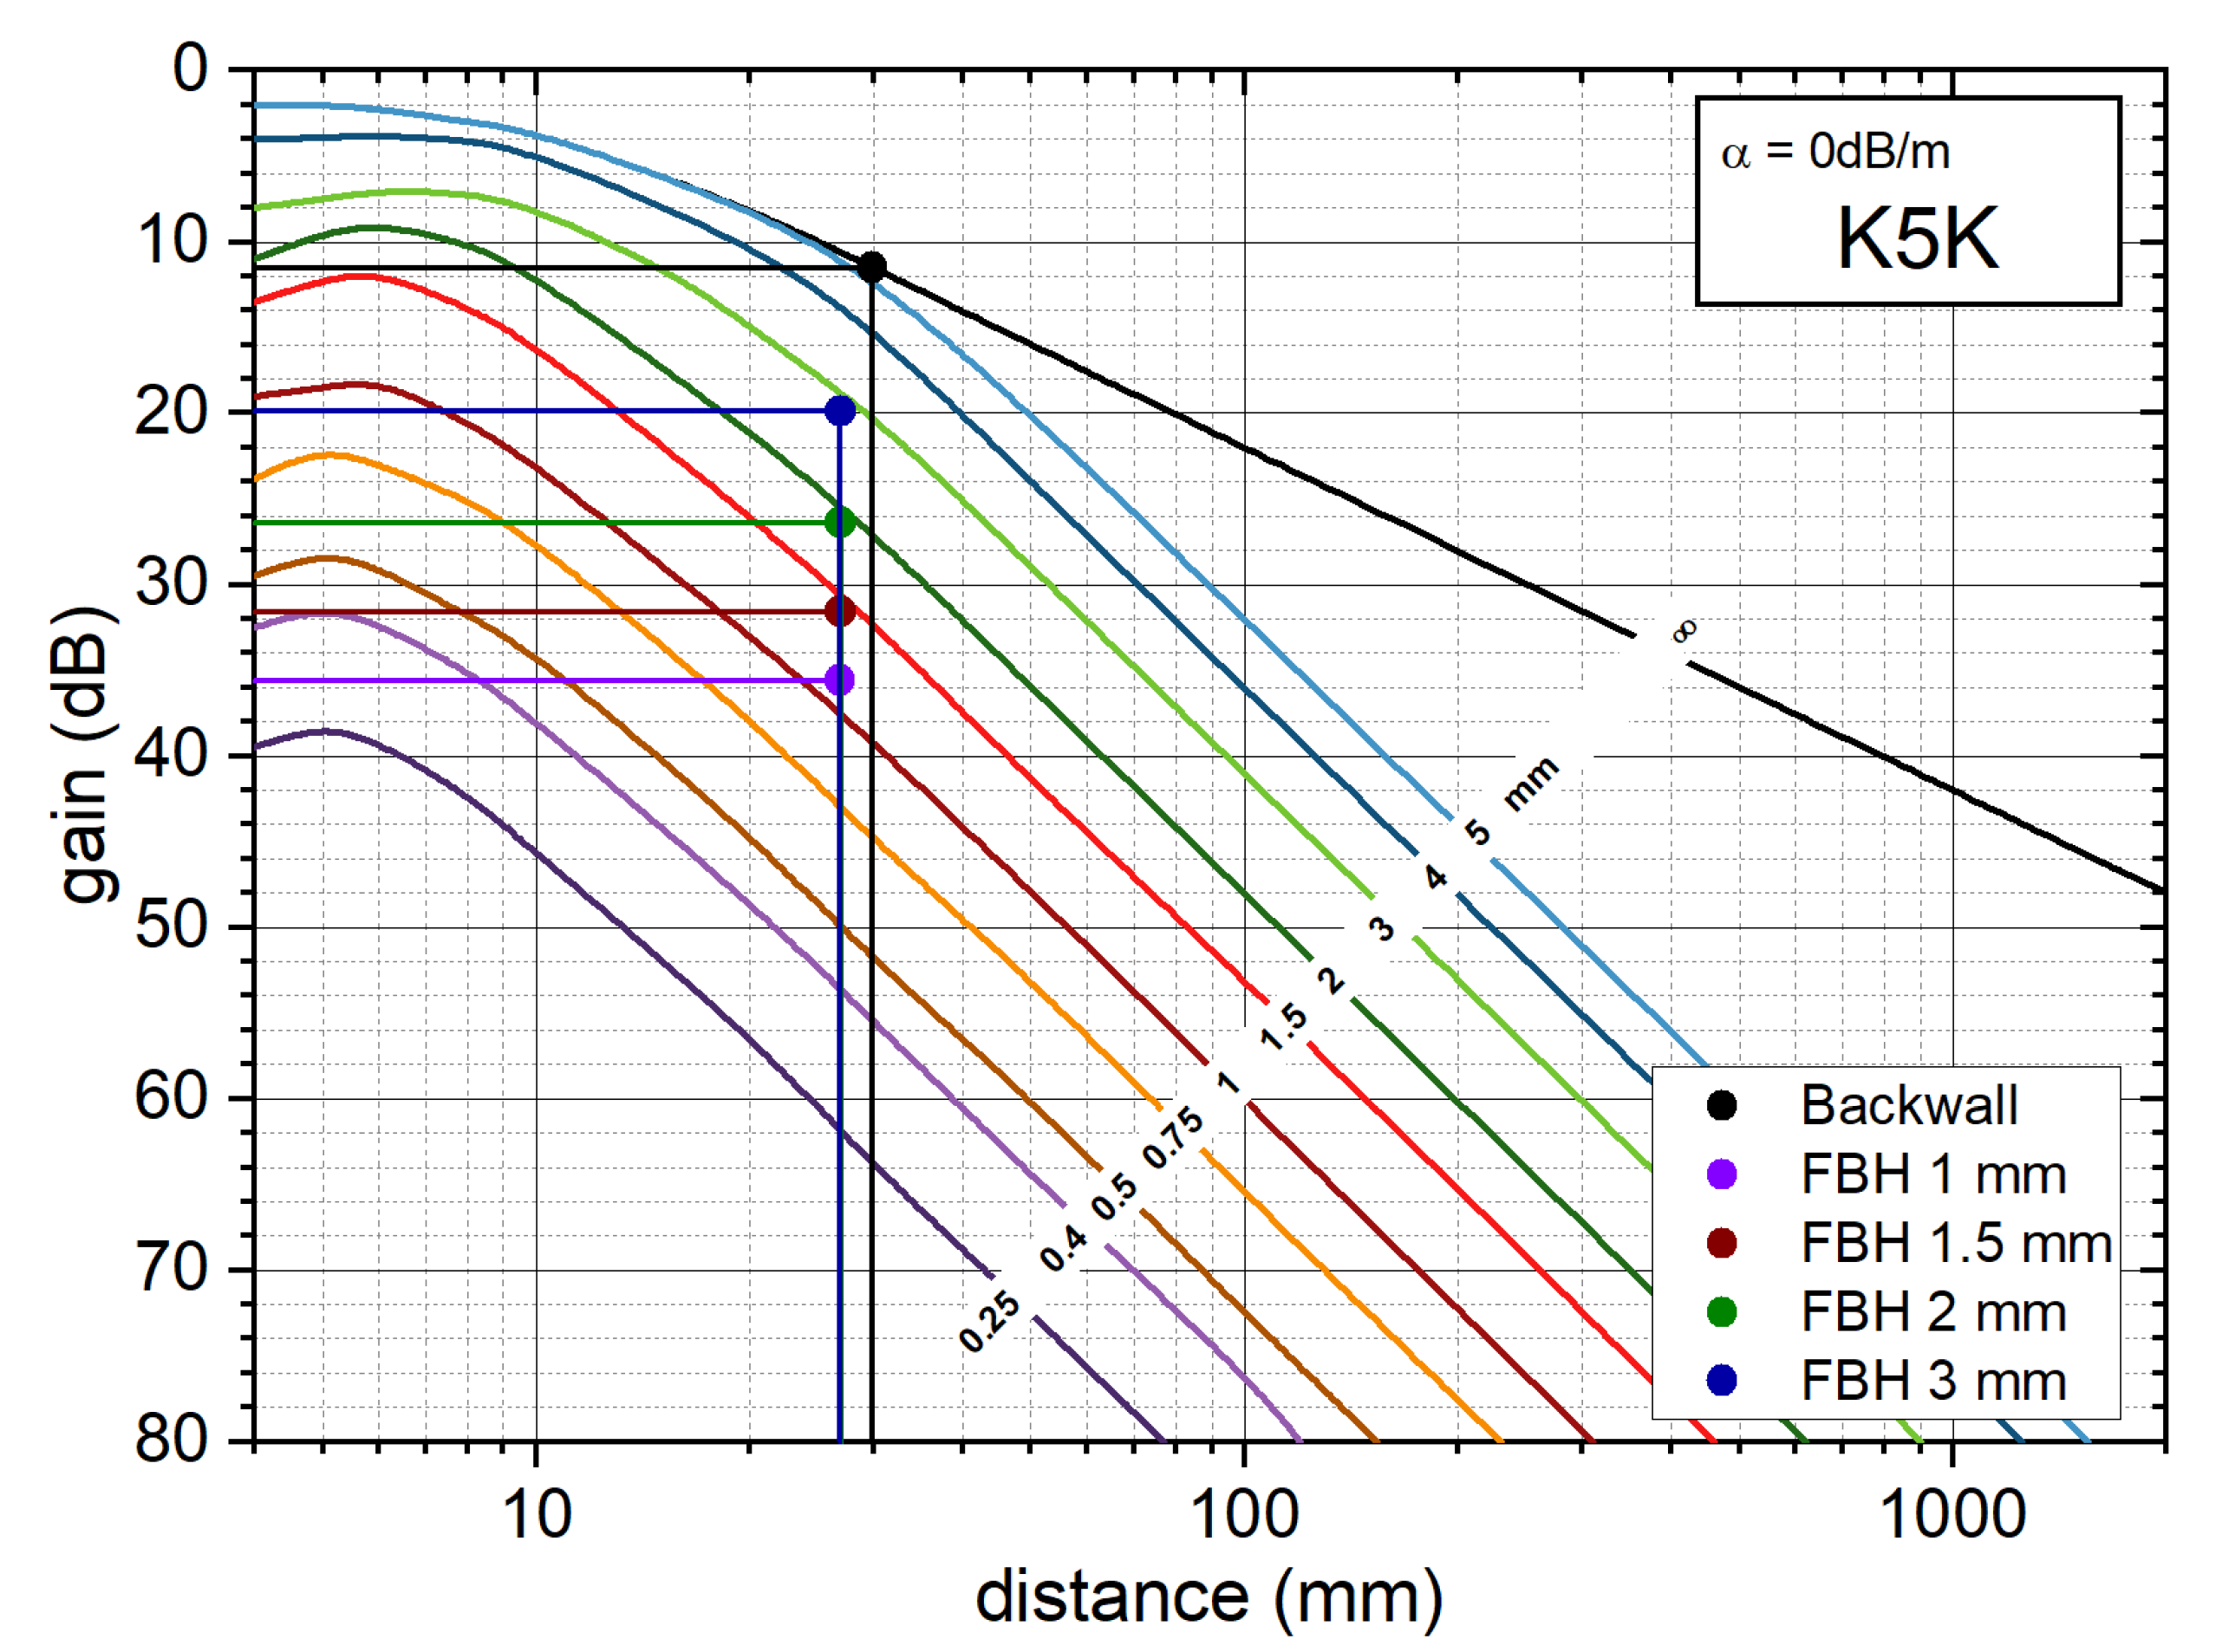
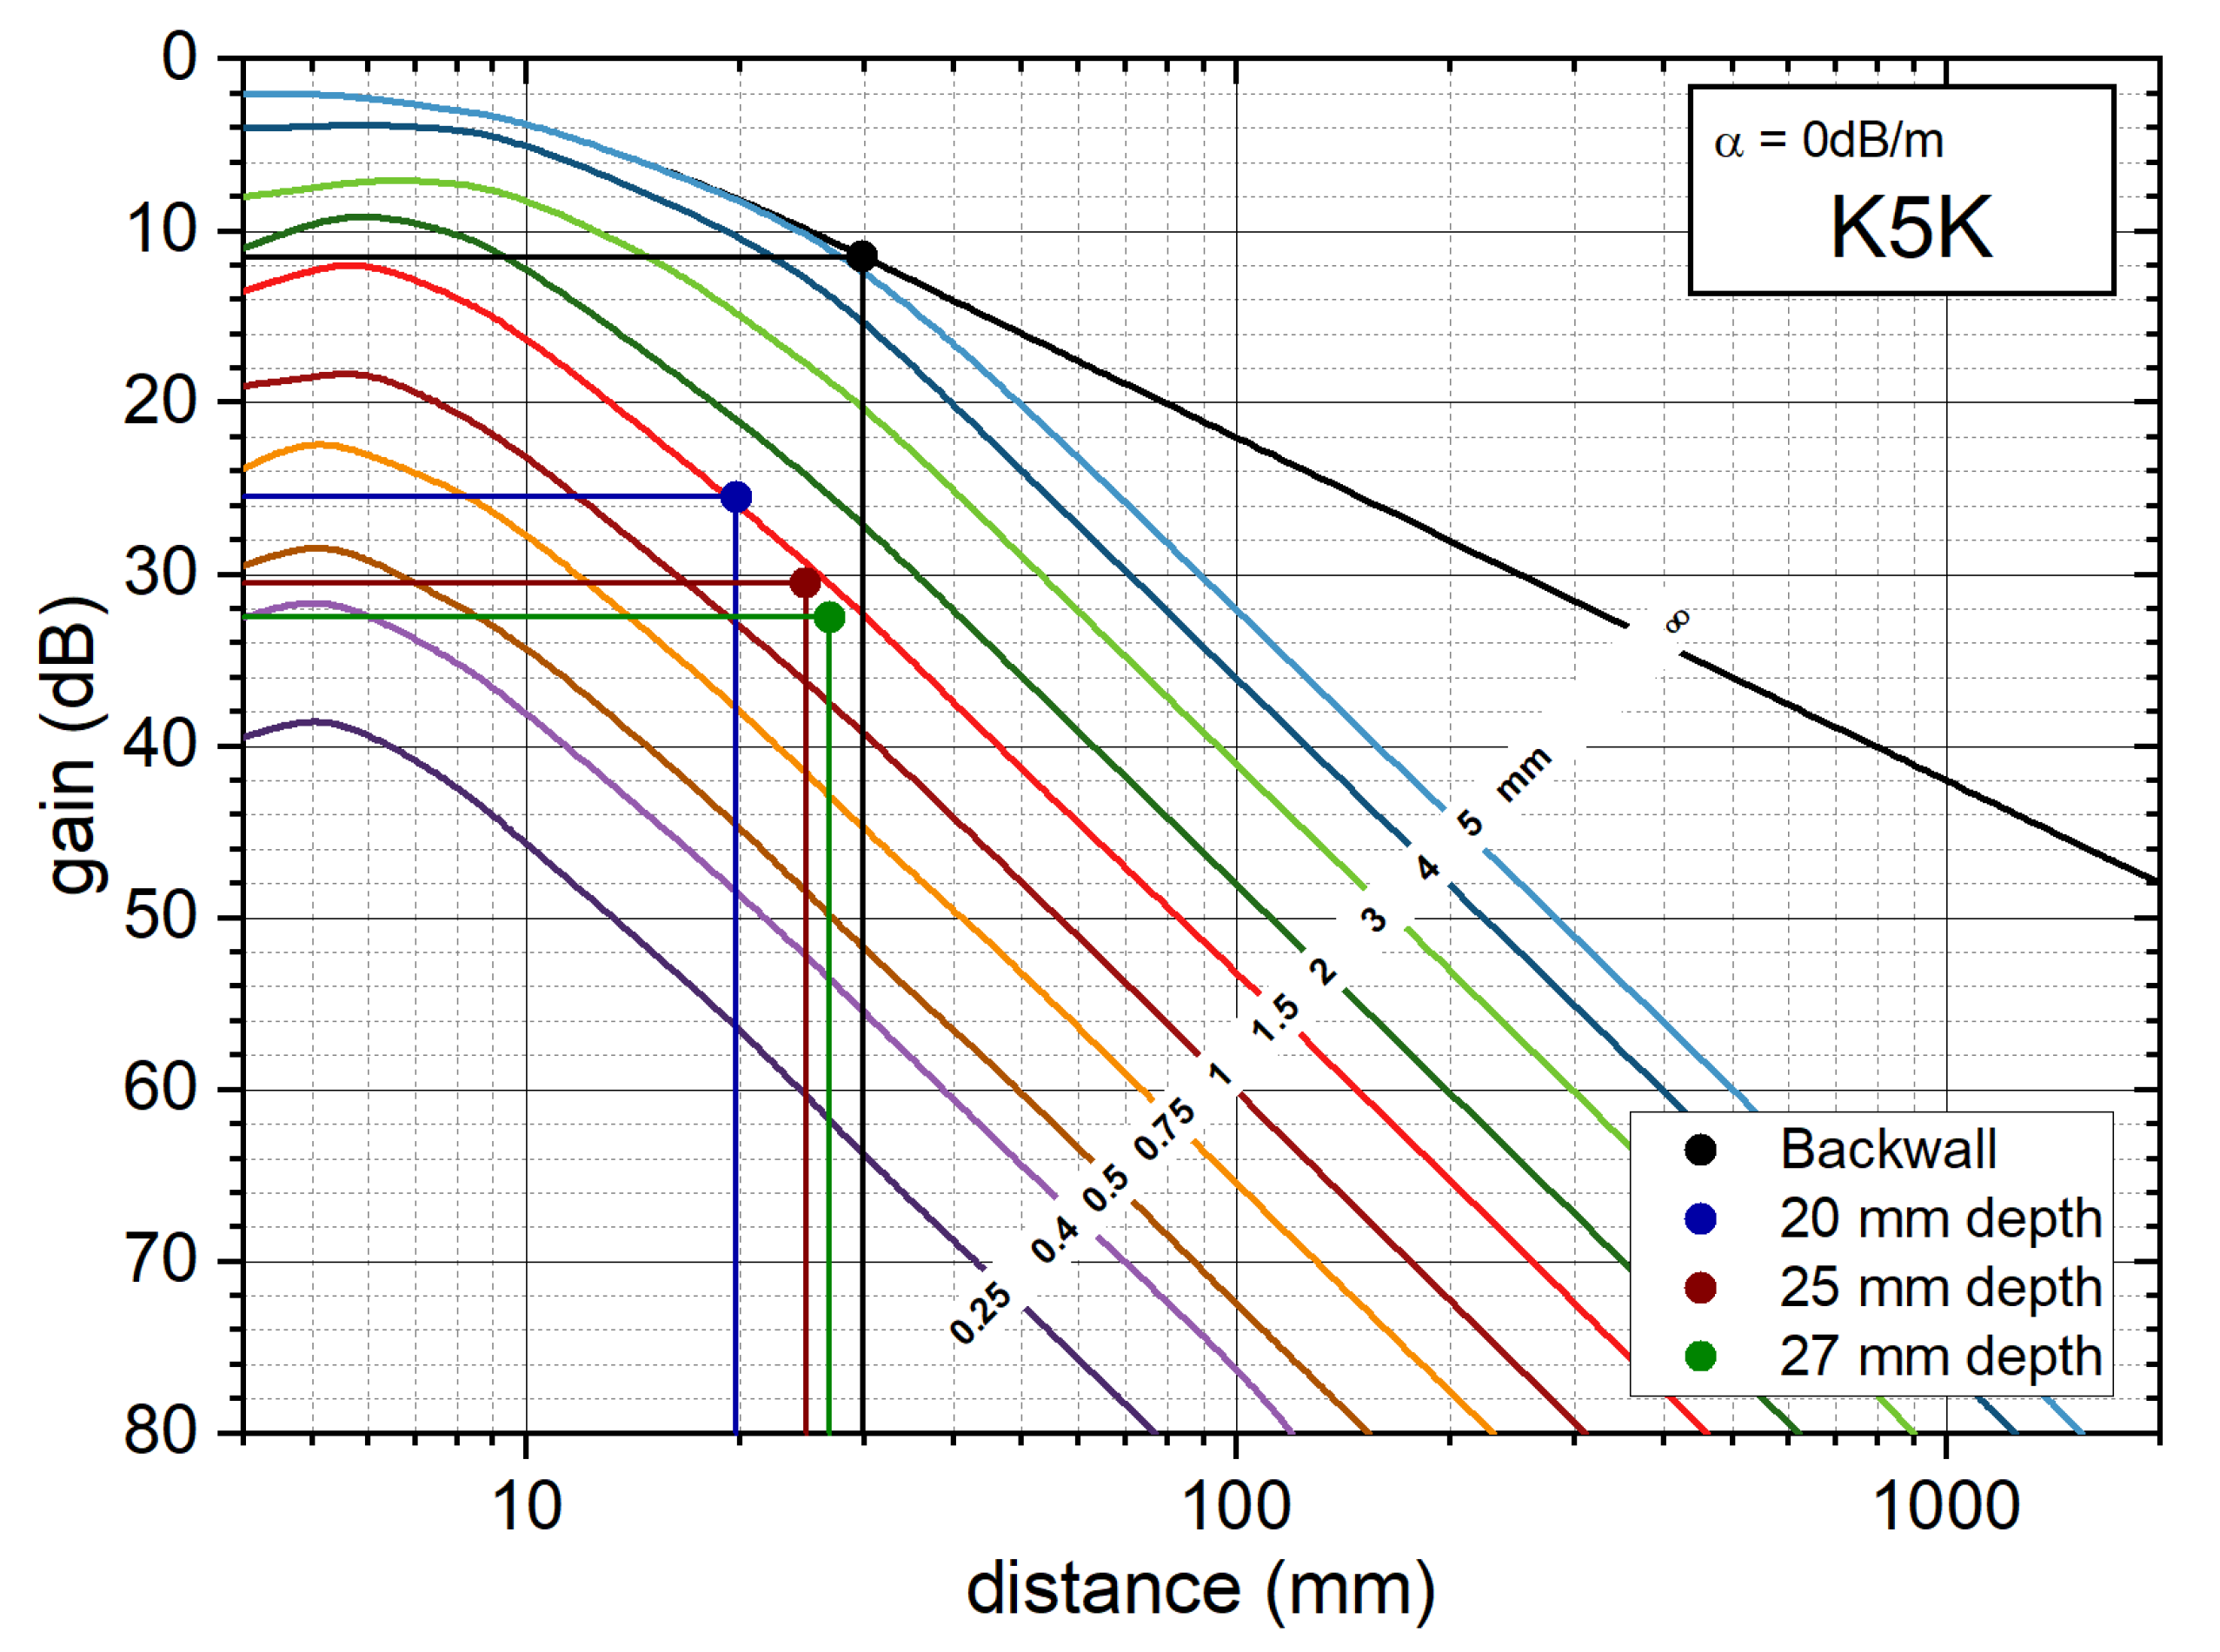
2.3.2. Distance/Gain/Size (DGS) Method
3. Results
3.1. Investigation of the Influence of Laser Path Orientation on Acoustic Properties
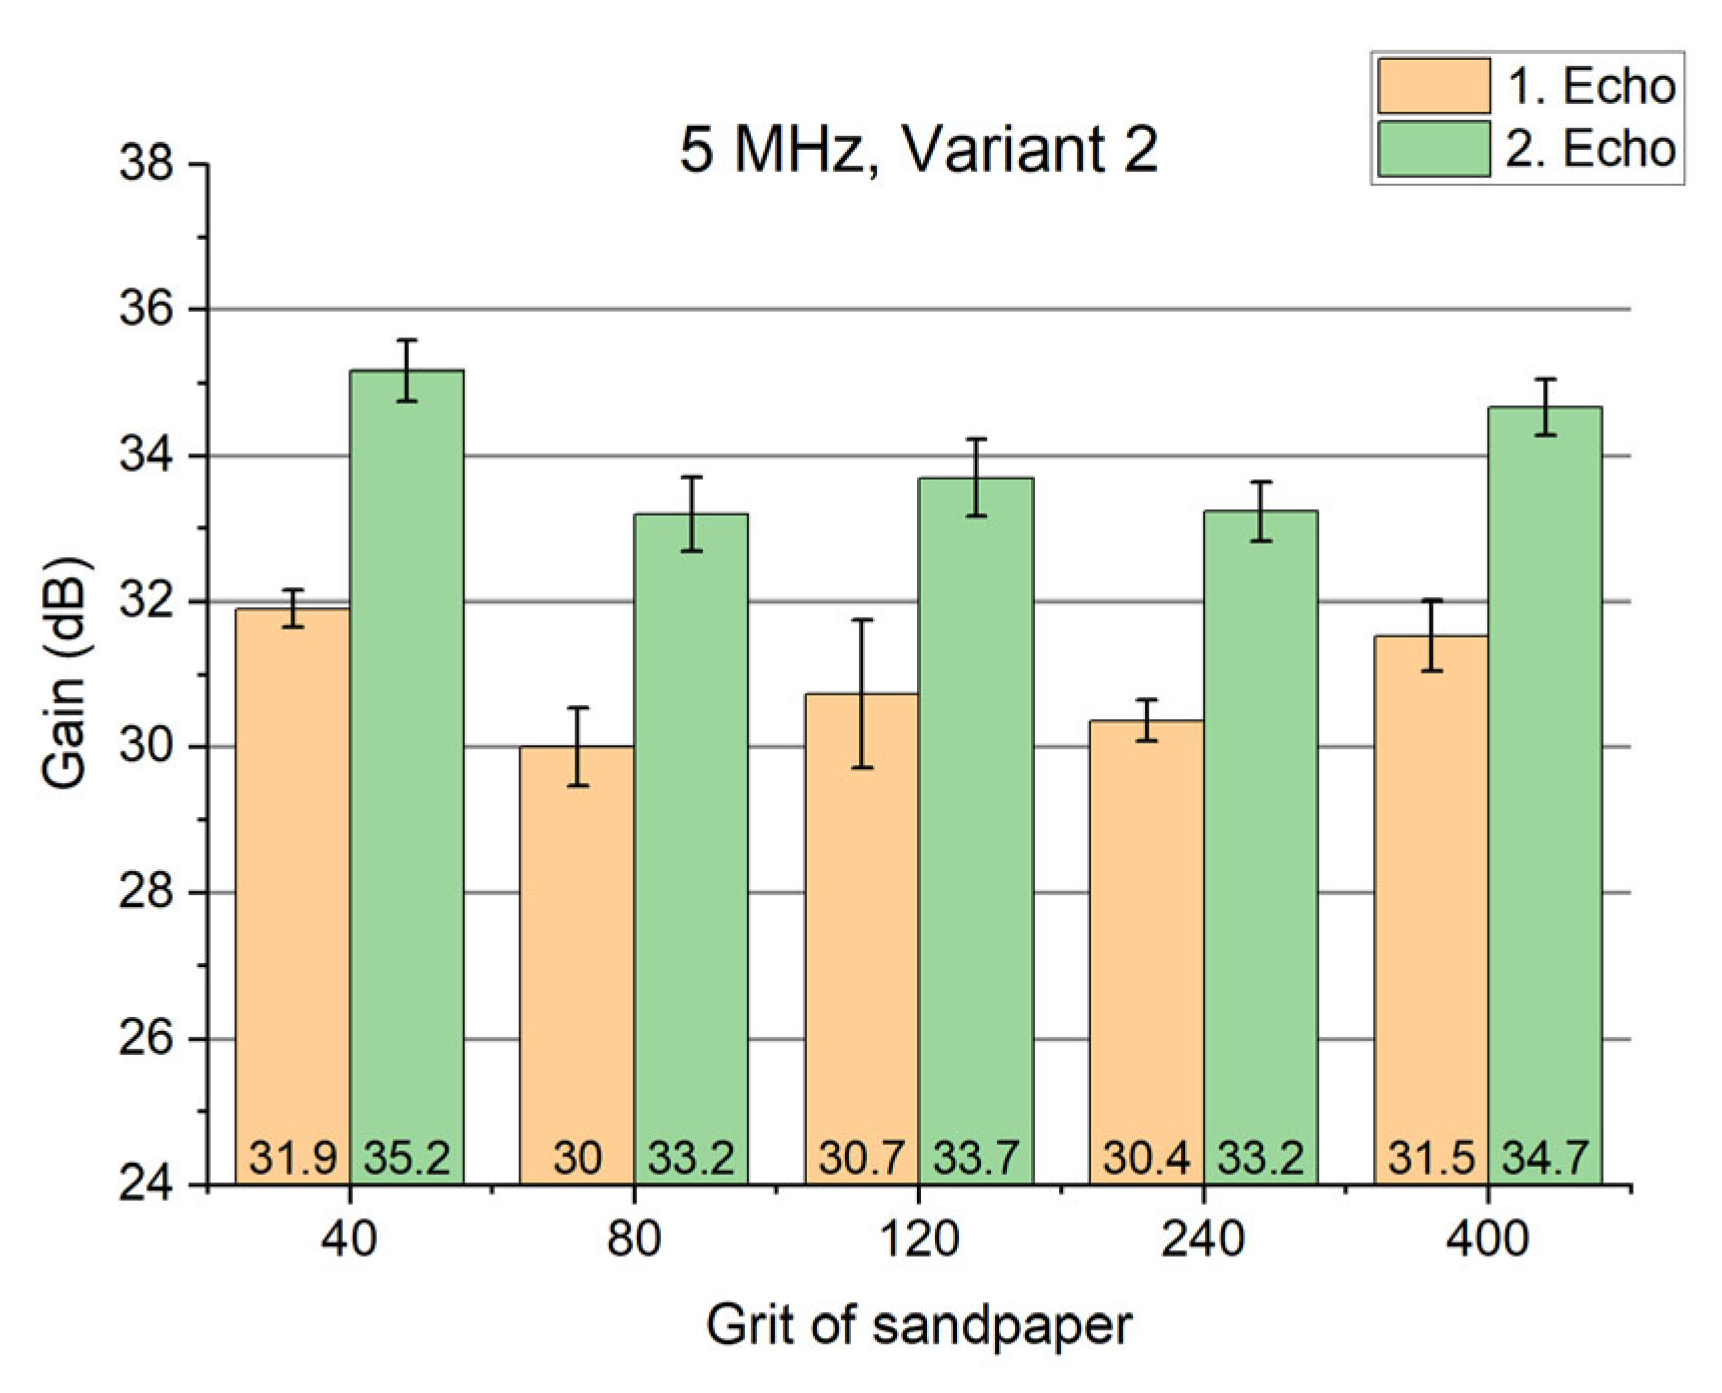
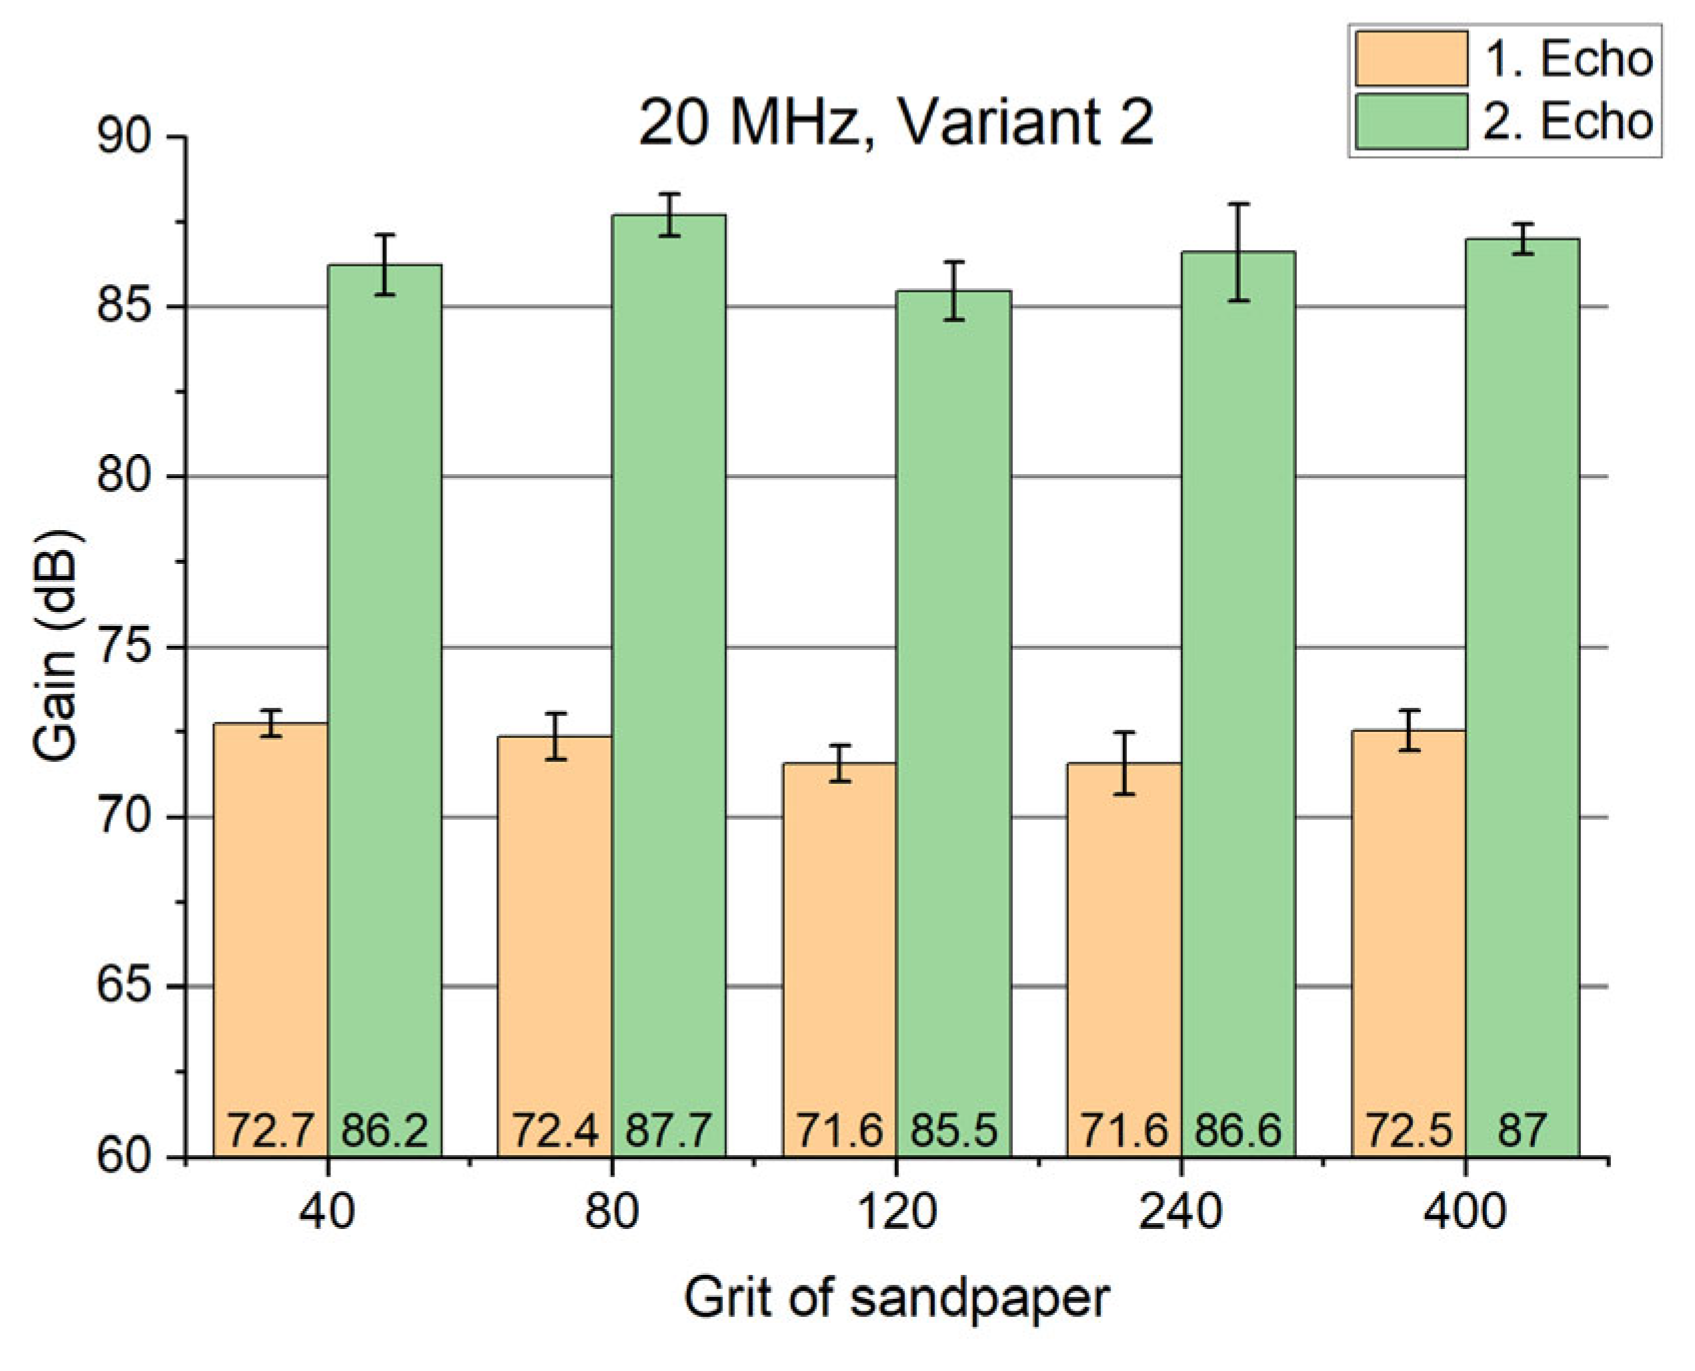
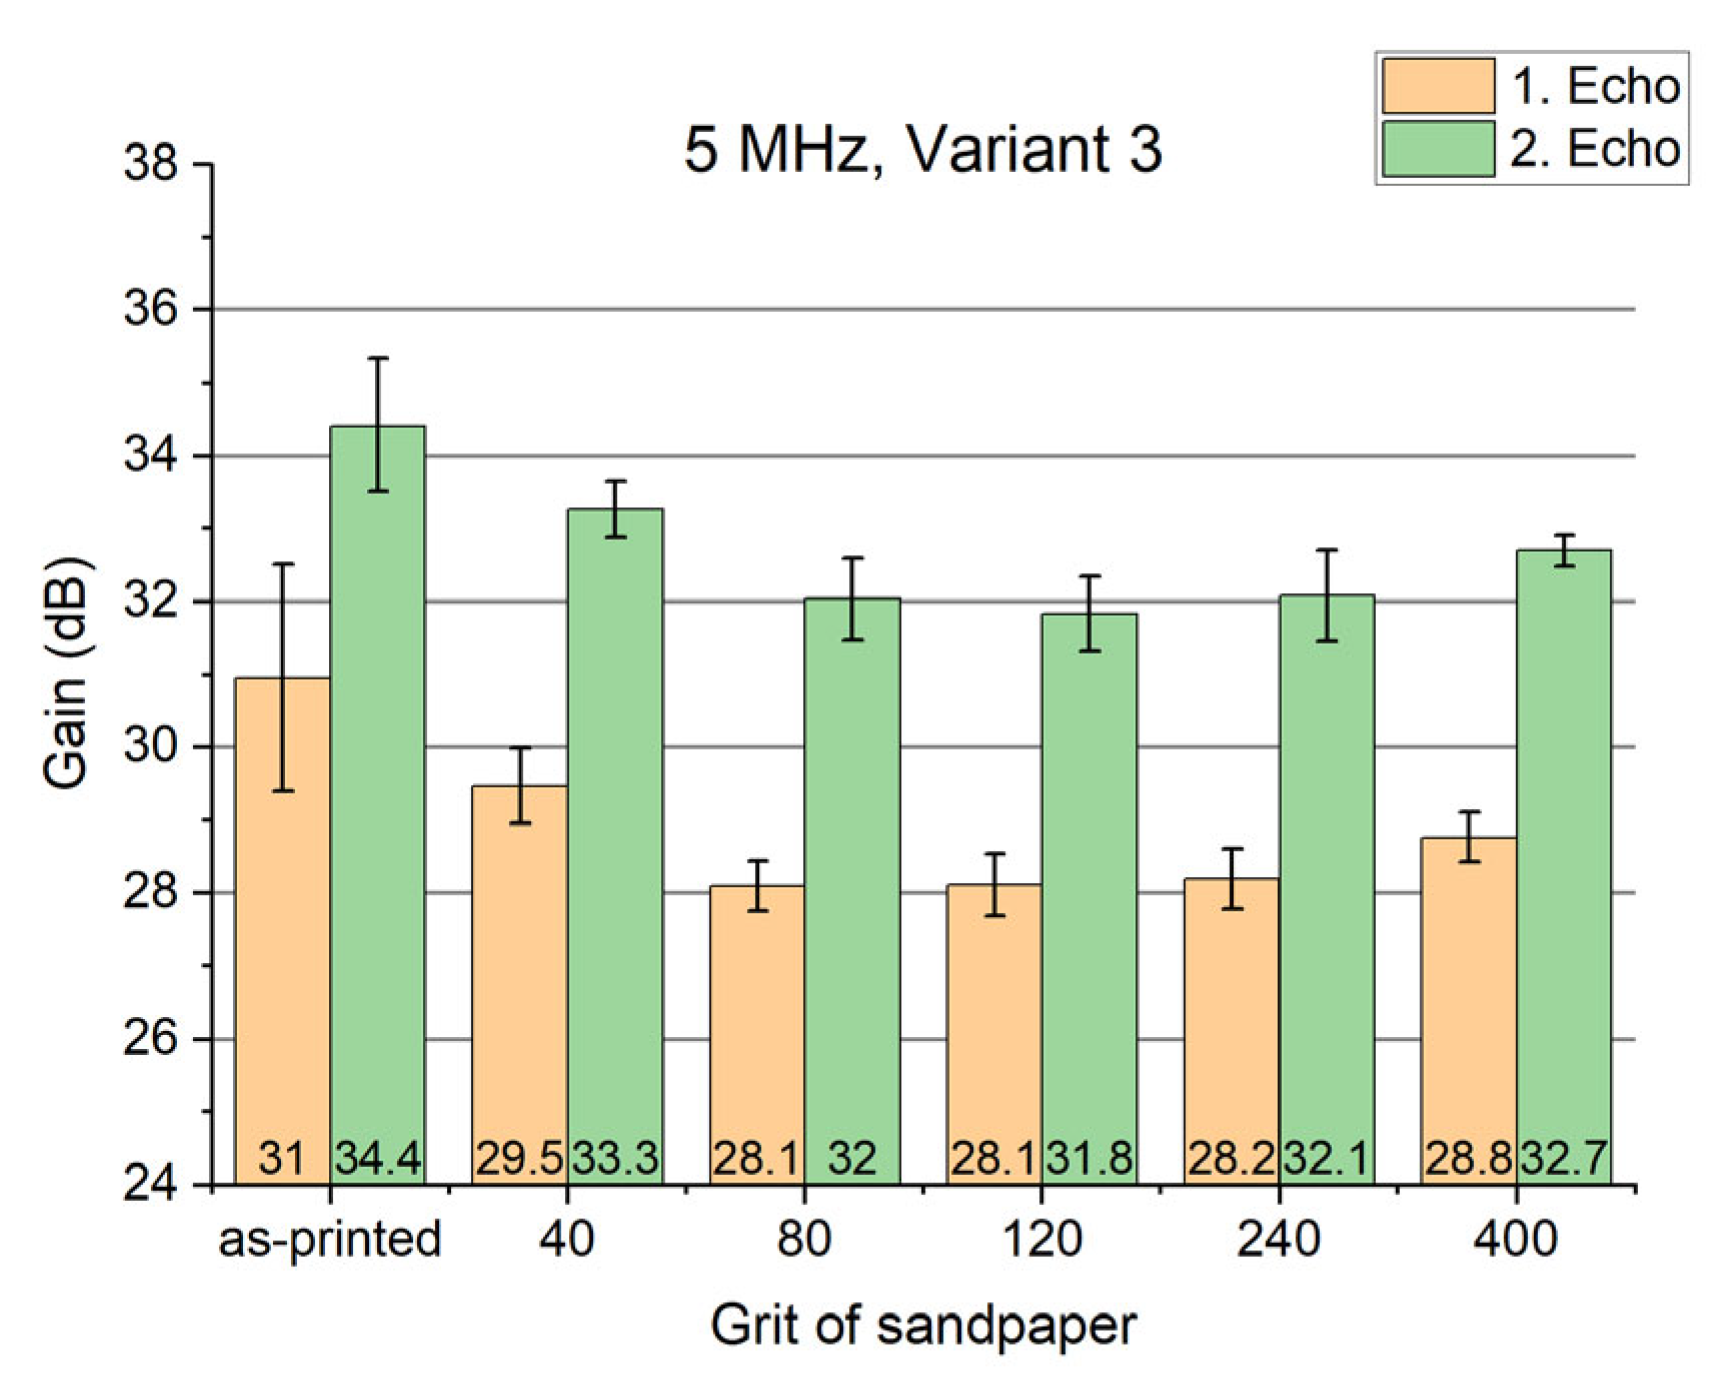
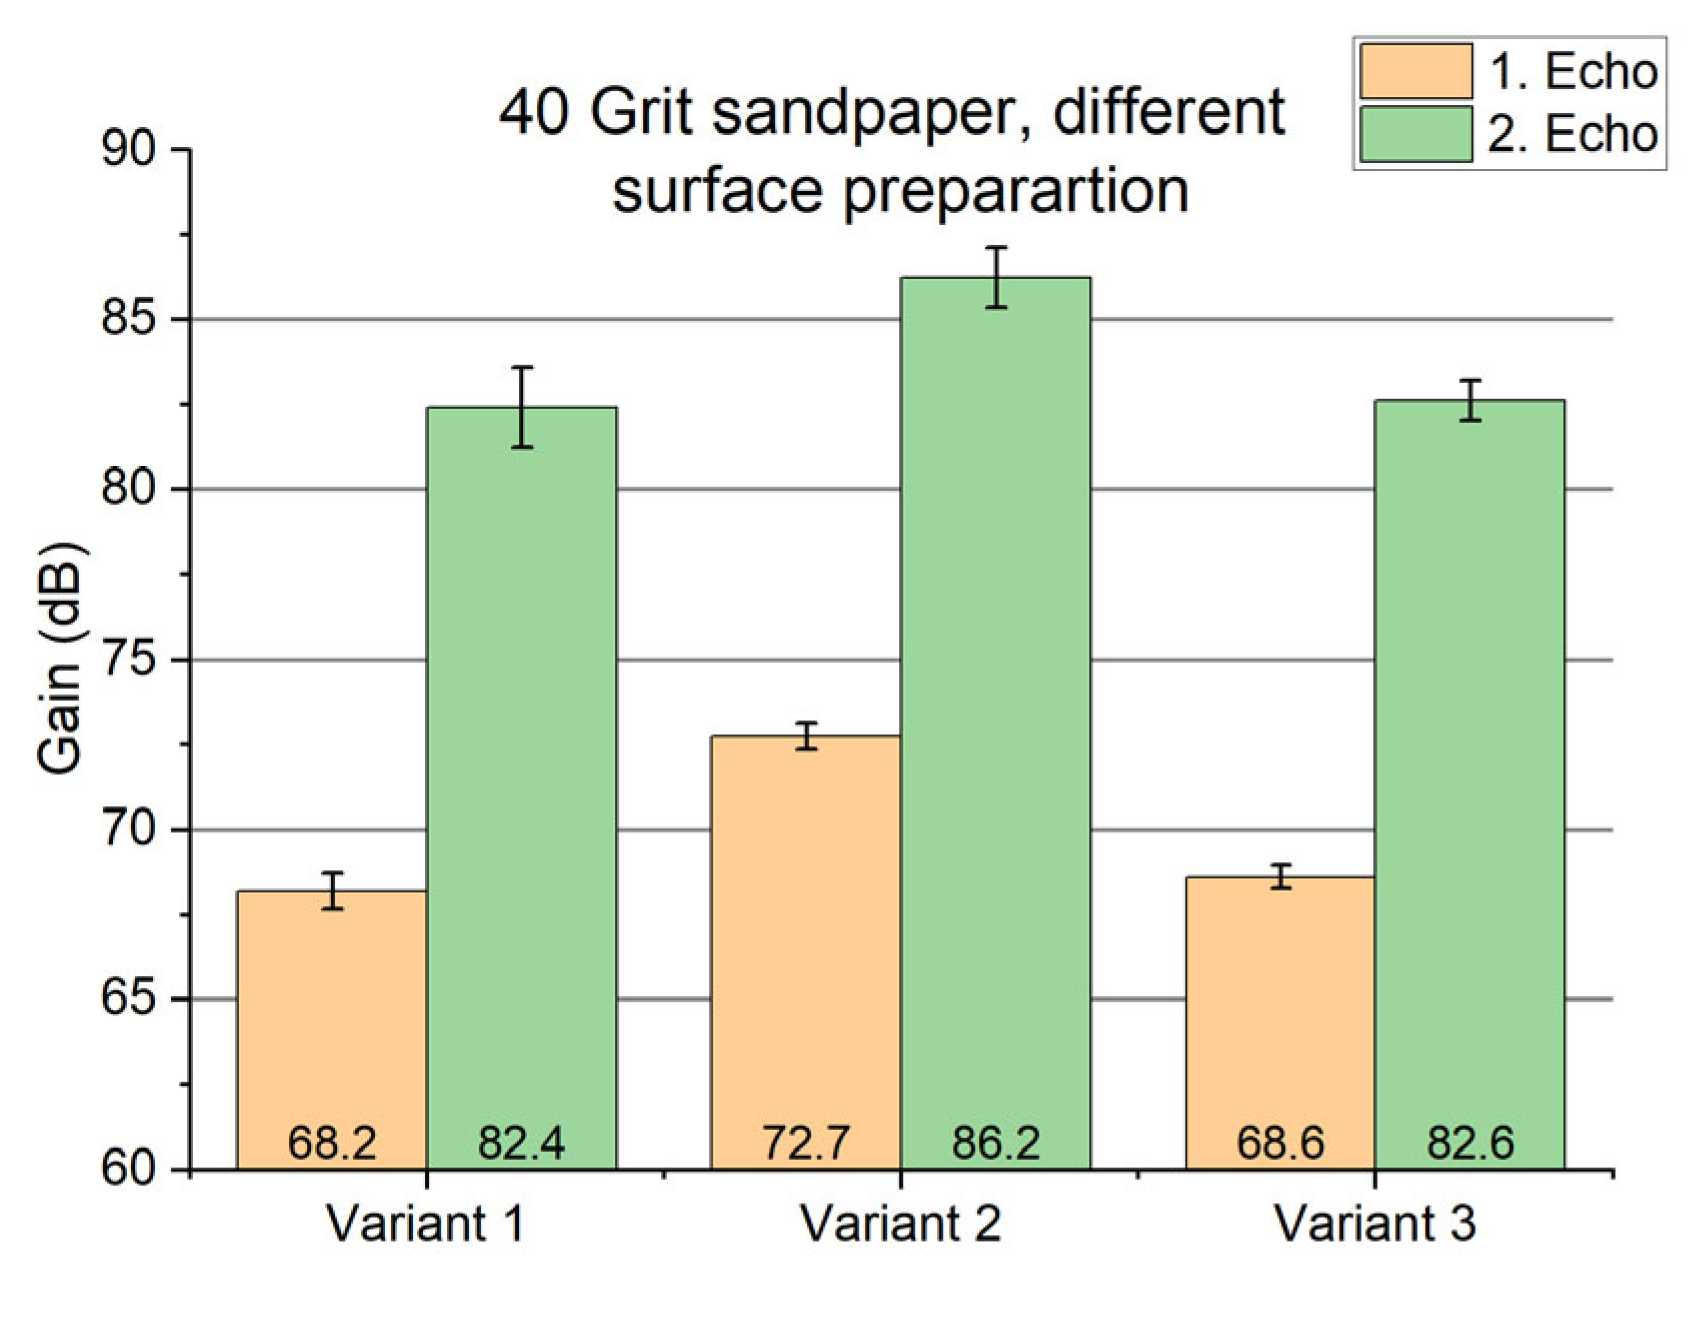
3.2. Influence of Surface Roughness on Sound Amplitude
3.3. Test Bodies with Flat-Bottomed Hole Reflectors (FBH)
4. Discussion
4.1. Investigation of the Influence of Laser Path Orientation on Acoustic Properties
4.2. Influence of Surface Roughness on Sound Amplitude
4.3. Test Bodies with Flat-Bottomed Hole Reflectors (FBH)
5. Conclusions
Author Contributions
Funding
Data Availability Statement
Acknowledgments
Conflicts of Interest
Abbreviations
| UT | Ultrasonic Testing. |
| AM | Additive Manufacturing. |
| FBH | Flat-Bottom Hole. |
| EDM | Electrical Discharge Machining. |
| ERS | Equivalent Reflector Size. |
| DGS | Distance Gain Size. |
| LBPF | Laser-Powder Bed Fusion. |
| NDT | Non-Destructive Testing. |
| EBSD | Electron Backscatter Diffraction. |
| FSH | Full-Screen Height. |
| DAC | Distance Amplitude Correction. |
References
- Jiménez, M.; Romero, L.; Domínguez, I.A.; Del Espinosa, M.M.; Domínguez, M. Additive Manufacturing Technologies: An Overview about 3D Printing Methods and Future Prospects. Complexity 2019, 2019, 9656938. [Google Scholar] [CrossRef]
- Jüngert, A.; Gyula, A.; Keuler, S.; Heckel, T.; Brackrock, D.; Luplow, C. Herstellung Geeigneter Testkörper für die Zuverlässigkeitsbewertung von Zuverlässigkeitsbewertung von Ultraschallprüfungen. DACH-Jahrestagung 2023 Friedrichshafen. Available online: https://www.ndt.net/?id=28617,18.06.2025 (accessed on 18 June 2025).
- Zhang, W.; Shen, J.; Oliveira, J.P.; Kooi, B.J.; Pei, Y. Crystallographic orientation-dependent deformation characteristics of additive manufactured interstitial-strengthened high entropy alloys. Scr. Mater. 2023, 222, 115049. [Google Scholar] [CrossRef]
- Zuo, X.; Zhang, W.; Chen, Y.; Oliveira, J.; Zeng, Z.; Li, Y.; Luo, Z.; Ao, S. Wire-based directed energy deposition of NiTiTa shape memory alloys: Microstructure, phase transformation, electrochemistry, X-ray visibility and mechanical properties. Addit. Manuf. 2022, 59, 103115. [Google Scholar] [CrossRef]
- Marattukalam, J.J.; Karlsson, D.; Pacheco, V.; Beran, P.; Wiklund, U.; Jansson, U.; Hjörvarsson, B.; Sahlberg, M. The effect of laser scanning strategies on texture, mechanical properties, and site-specific grain orientation in selective laser melted 316L SS. Mater. Des. 2020, 193, 108852. [Google Scholar] [CrossRef]
- Hariharan, V.S.; Kaushik, R.; Phanikumar, G.; Murty, B.S. Tailoring the Crystallographic Texture of Laser Powder Bed Fused Haynes 282 Through Scan Rotation Modification: Simulation & Experiments. SSRN 2023. [Google Scholar] [CrossRef]
- Matthies, K. Ultraschallprüfung von Austenitischen Werkstoffen, 1st ed.; DVS Media: Düsseldorf, Germany, 2009; ISBN 9783871559884. [Google Scholar]
- İşleyici, U. Effect of Surface Roughness on Ultrasonic Testing. Master’s Thesis, The Graduate School of Natural and Applied Science of Middle East Technical University, Ankara, Turkey, 2005. [Google Scholar]
- Wang, Z.; Cui, X.; Ma, H.; Kang, Y.; Deng, Z. Effect of Surface Roughness on Ultrasonic Testing of Back-Surface Micro-Cracks. Appl. Sci. 2018, 8, 1233. [Google Scholar] [CrossRef]
- Nagy, P.B.; Blaho, G.; Rose, J.H. Surface Roughness and Ultrasonic Materials Characterization. In Nondestructive Characterization of Materials VI; Green, R.E., Kozaczek, K.J., Ruud, C.O., Eds.; Springer: New York, NY, USA, 1994; pp. 79–86. [Google Scholar]
- Hanks, E.; Palazotto, A.; Liu, D. Effect of surface roughness on ultrasonic inspection of electron beam melting ti-6AL-4V. J. Def. Anal. Logist. 2019, 3, 131–141. [Google Scholar] [CrossRef]
- Mihaljević, M.; Markučič, D.; Katić, M.; Grozdanić, M.; Kožić, K. Design of additive manufactured reference block with disk reflectors for sensitivity calibration of ultrasonic angle beam probes. Int. J. Adv. Manuf. Technol. 2023, 126, 1907–1918. [Google Scholar] [CrossRef]
- Nemitz, O.; Schmitte, T.; Cembrowski, M.; Orth, T.; Rott, S.; Bamberg, J. Kalibrierung des TFM-Verfahrens Mittels Additiv Gefertigter Kalibrier-Reflektoren und Vergleich mit Simulationen. DGZfP Jahrestagung 2019, Friedrichshafen. Available online: https://www.ndt.net/search/docs.php3?id=24538,18.06.2025 (accessed on 18 June 2025).
- Weidig, C.; Straube, C. Additive Herstellung von Prüfobjekten für die ZfP-Ausbildung-Eine Chance ? DGZfP-Jahrestagung 2022. Available online: https://www.ndt.net/?id=27035,18.06.2025 (accessed on 18 June 2025).
- Wang, X.; Li, W.; Li, Y.; Zhou, Z.; Zhang, J.-J.; Zhu, F.; Miao, Z. Phased array ultrasonic testing of micro-flaws in additive manufactured titanium block. Mater. Res. Express 2020, 7, 16572. [Google Scholar] [CrossRef]
- Javidrad, H.R.; Salemi, S. Determination of elastic constants of additive manufactured Inconel 625 specimens using an ultrasonic technique. Int. J. Adv. Manuf. Technol. 2020, 107, 4597–4607. [Google Scholar] [CrossRef]
- Slotwinski, J.A.; Garboczi, E.J.; Hebenstreit, K.M. Porosity Measurements and Analysis for Metal Additive Manufacturing Process Control. J. Res. Natl. Inst. Stand. Technol. 2014, 119, 494–528. [Google Scholar] [CrossRef] [PubMed]
- DIN EN ISO 21920-3. Geometrische Produktspezifikation (GPS)—Oberflächenbeschaffenheit: Profile–:Teil 3: Spezifikationsoperatoren (ISO 21920-3:2021). ISO: Geneva, Switzerland, 2022.
- GE Sensing & Inspection Technologies. Datenblatt K 5 K; GE Sensing & Inspection Technologies: Cincinnati, OH, USA.
- Carter, L.N.; Martin, C.; Withers, P.J.; Attallah, M.M. The influence of the laser scan strategy on grain structure and cracking behaviour in SLM powder-bed fabricated nickel superalloy. J. Alloys Compd. 2014, 615, 338–347. [Google Scholar] [CrossRef]
- Kim, C.; Yin, H.; Shmatok, A.; Prorok, B.C.; Lou, X.; Matlack, K.H. Ultrasonic nondestructive evaluation of laser powder bed fusion 316L stainless steel. Addit. Manuf. 2021, 38, 101800. [Google Scholar] [CrossRef]
- Koube, K.D.; Kennedy, G.; Bertsch, K.; Kacher, J.; Thoma, D.J.; Thadhani, N.N. Spall damage mechanisms in laser powder bed fabricated stainless steel 316L. Mater. Sci. Eng. 2022, 851, 143622. [Google Scholar] [CrossRef]
- Kowalczyk, J.; Jósko, M.; Wieczorek, D.; Sędłak, K.; Nowak, M. The Influence of the Hardness of the Tested Material and the Surface Preparation Method on the Results of Ultrasonic Testing. Appl. Sci. 2023, 13, 9904. [Google Scholar] [CrossRef]


| Scanning Speed (mm/s) | Power (W) | Hatch Distance (µm) | Laser Focus Diameter (µm) | Layer Thickness (µm) | Building Panel Temperature (°C) |
|---|---|---|---|---|---|
| 700 | 250 | 100 | 120 | 30 | 150 |
| Scanning Speed [mm/s] | Power [W] | Hatch Distance [µm] | Laser Focus Diameter [µm] | Layer Thickness [µm] | Building Panel Temperature [°C] |
|---|---|---|---|---|---|
| 800 | 150 | 100 | 80 | 30 | 0 |
| Variant 1 | Variant 2 | ||
|---|---|---|---|
| Diameter FBH (mm) | Depth (mm) | Diameter FBH (mm) | Depth (mm) |
| 0.6 | 27 | 1.5 | 20 |
| 1 | 27 | 1.5 | 25 |
| 1.5 | 27 | 1.5 | 27 |
| 2 | 27 | 1.5 | 28 |
| 3 | 27 | 1.5 | 29 |
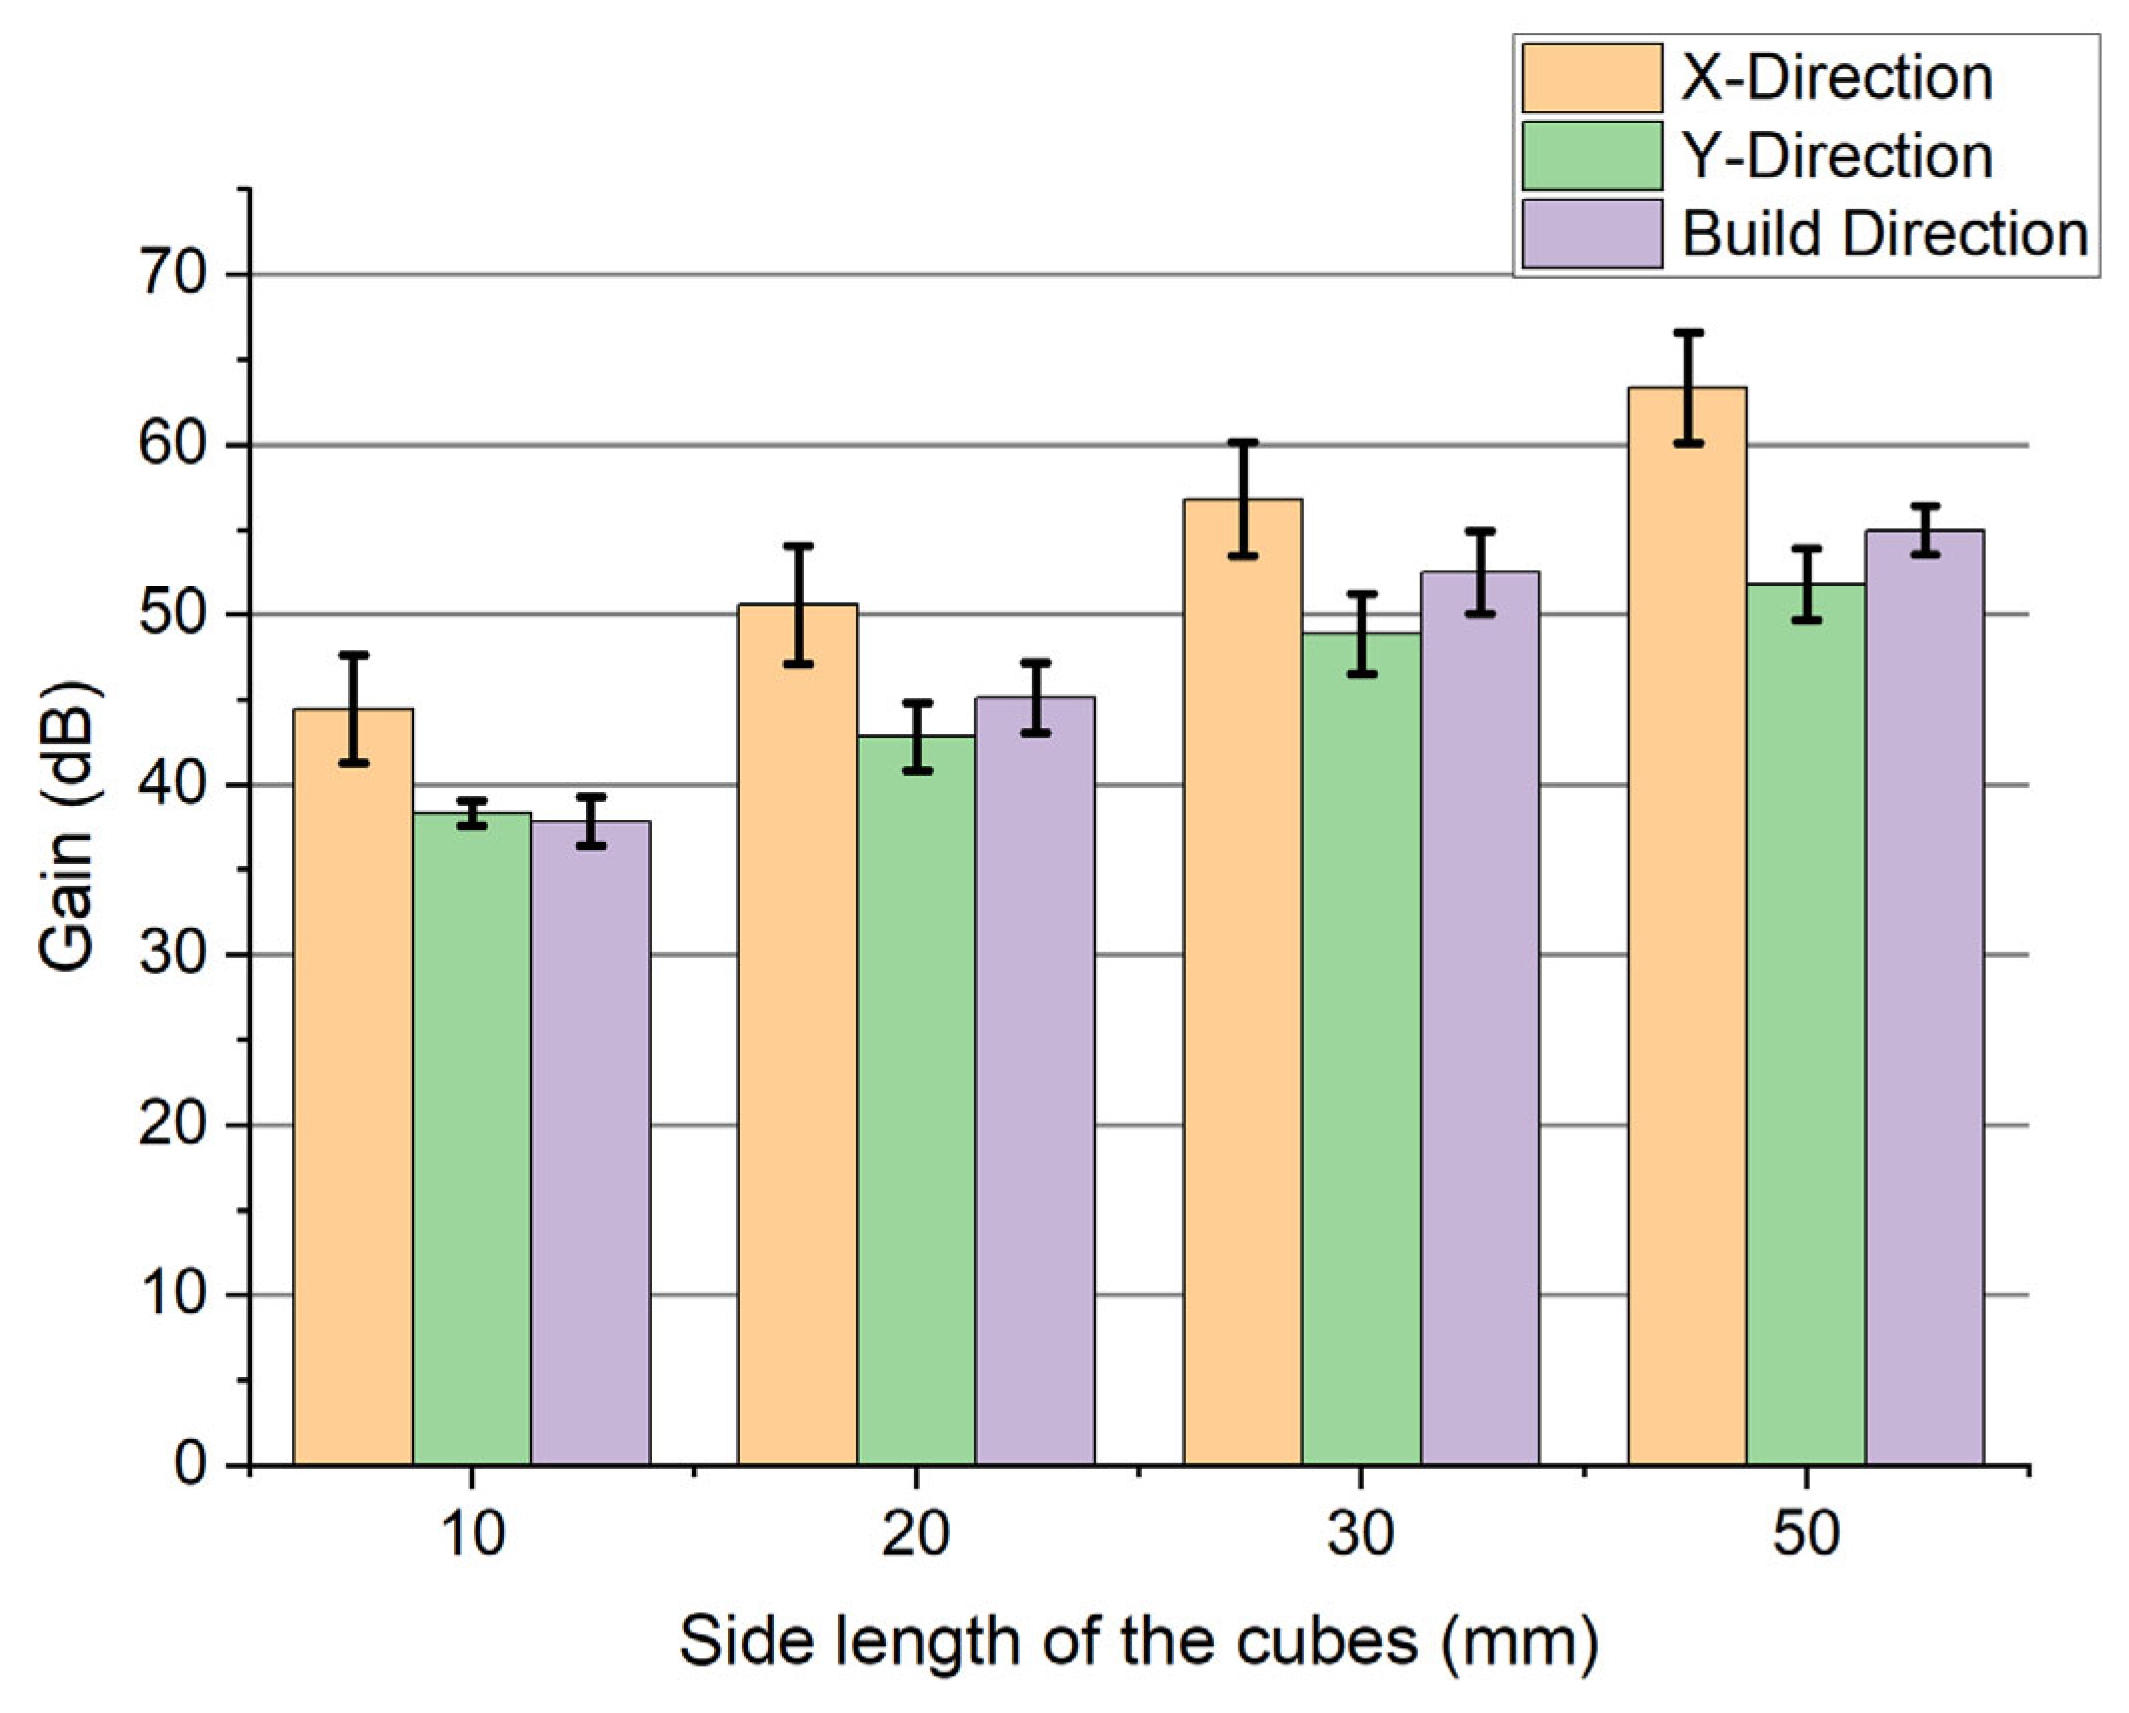
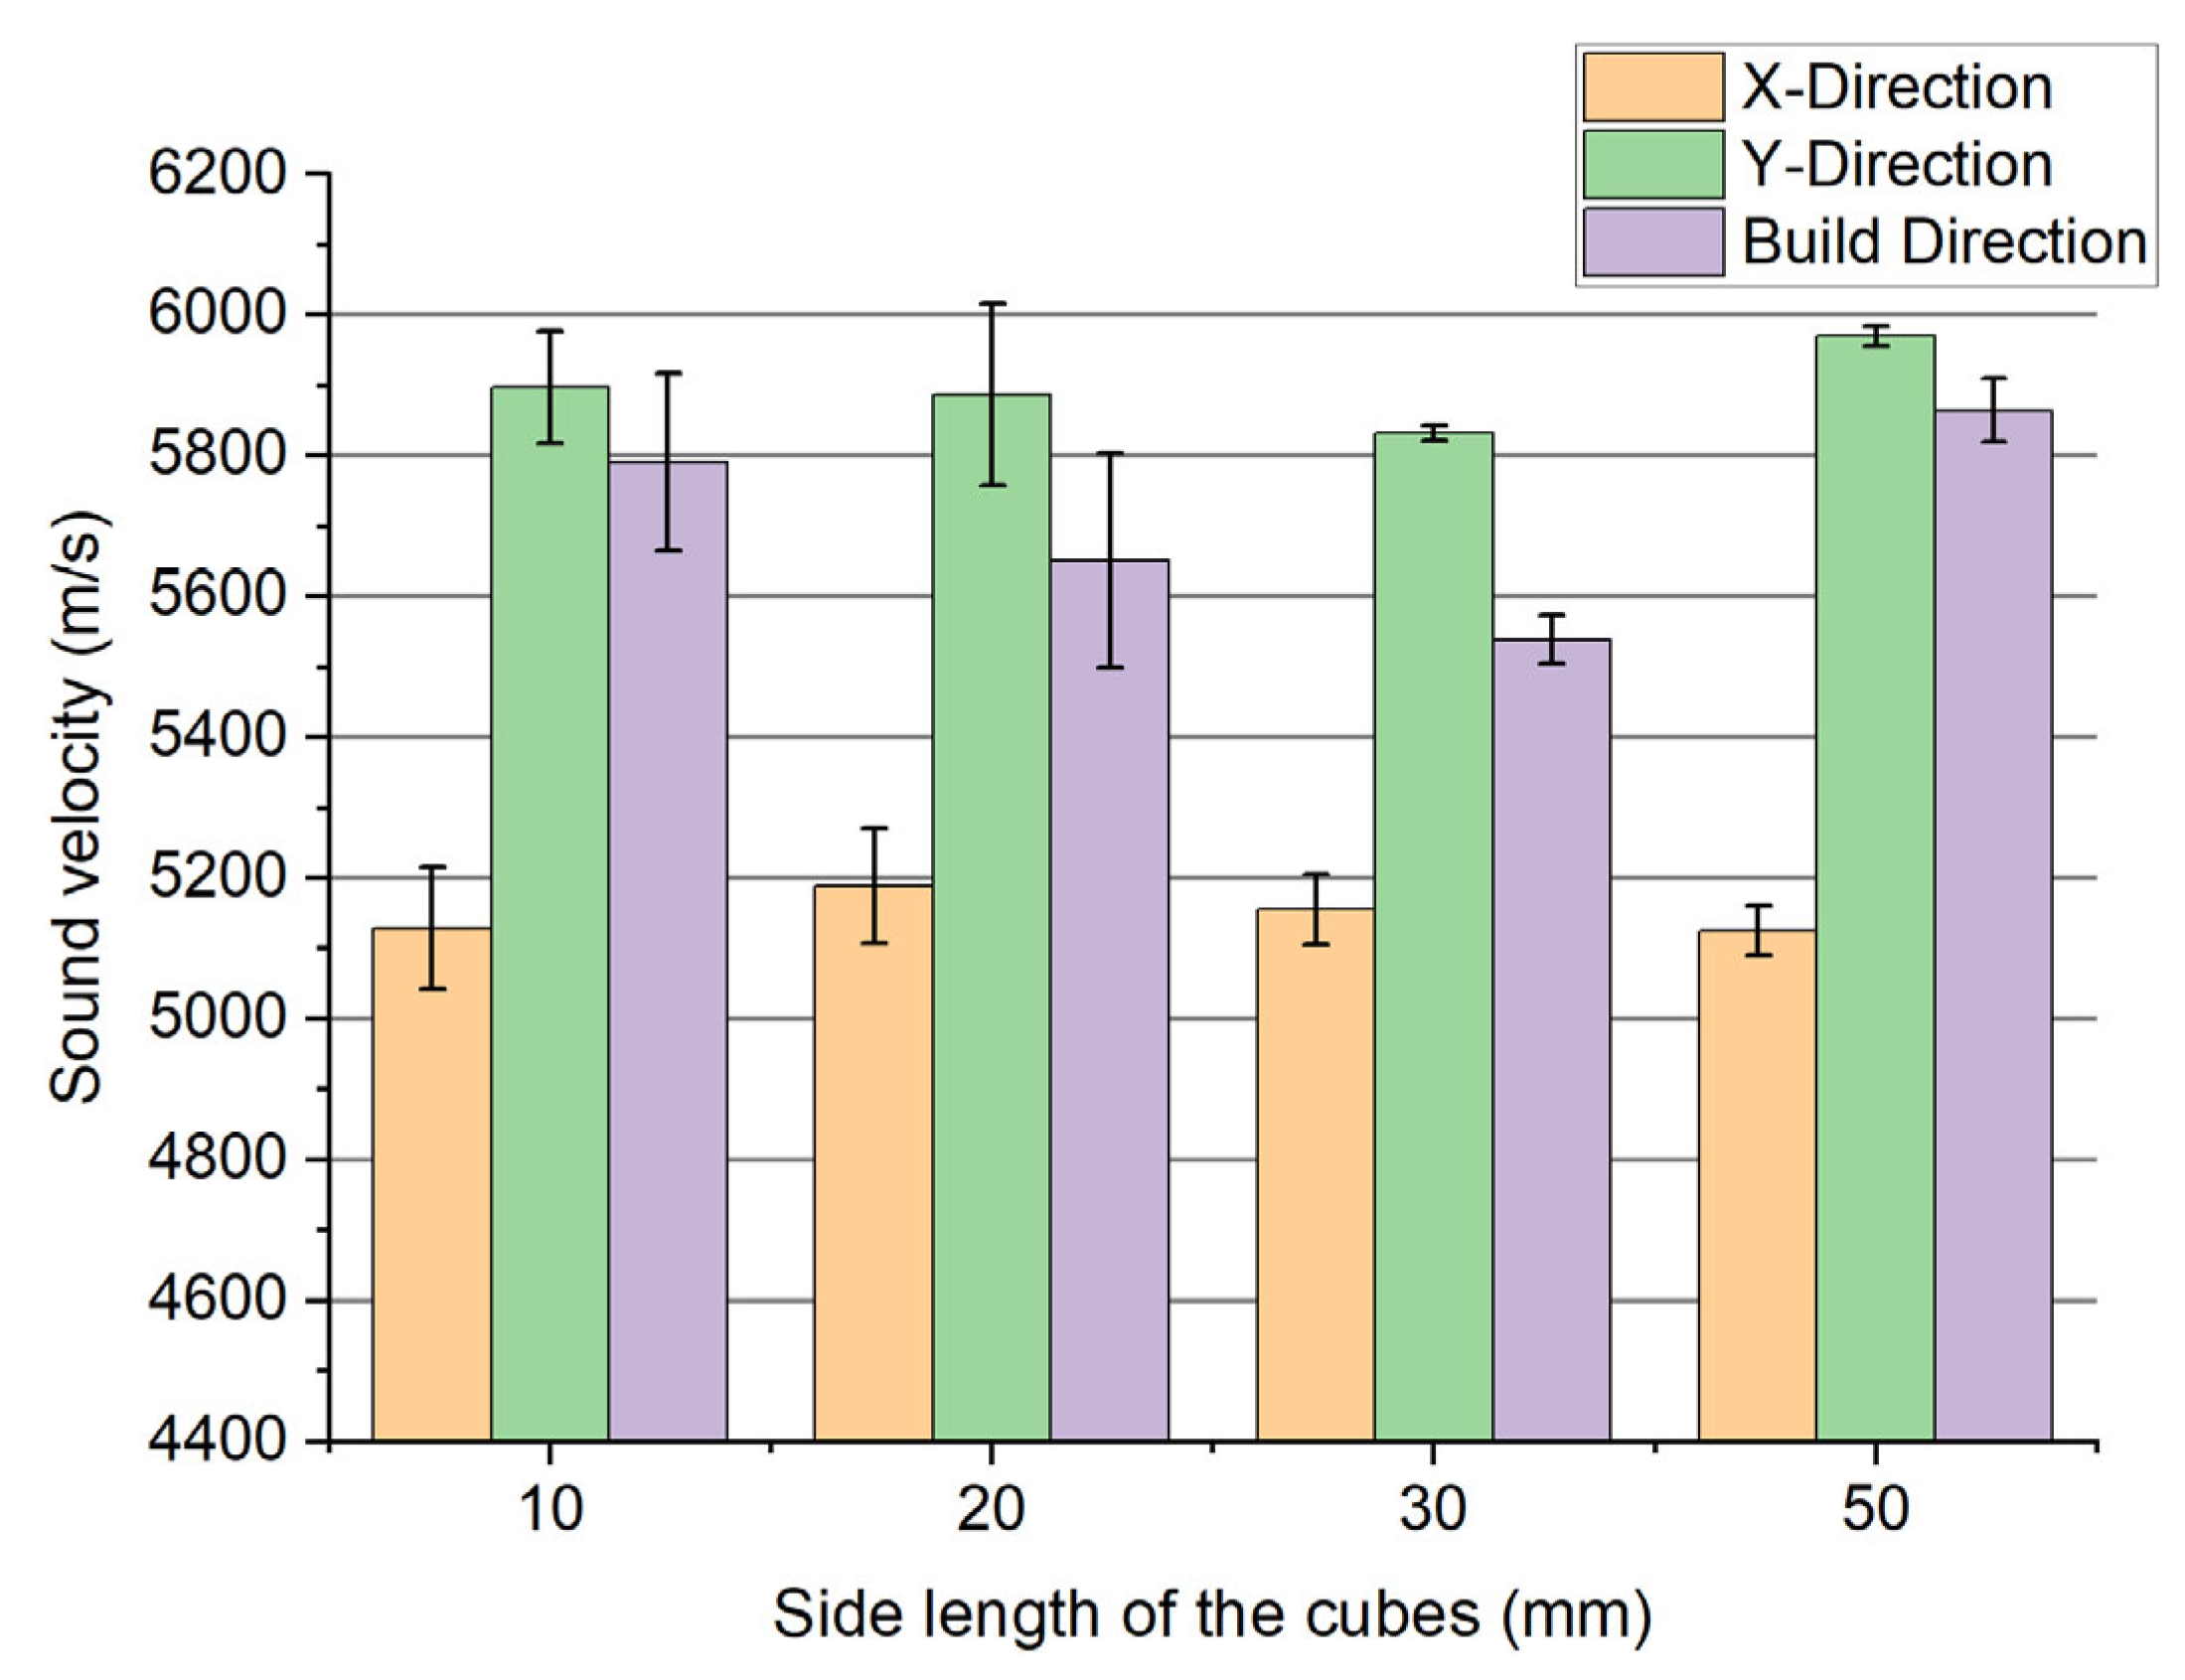
| Side Length of the Cubes | 10 | 20 | 30 | 50 | |
|---|---|---|---|---|---|
| Sound Velocity (m/s) | X-Direction | 5129 | 5190 | 5156 | 5125 |
| Y-Direction | 5898 | 5888 | 5832 | 5971 | |
| Build Direction | 5792 | 5652 | 5539 | 5865 | |
| Gain (dB) | X-Direction | 44 | 51 | 57 | 63 |
| Y-Direction | 38 | 43 | 49 | 52 | |
| Build Direction | 38 | 45 | 53 | 55 |
| Gain (dB) Back Wall | 31.9 | |||||
|---|---|---|---|---|---|---|
| FBH (mm) | Produced Depth (mm) | Measured Depth (mm) | Gain FBH (dB) | ∆dB | Determined FBH (mm) | Deviation (%) |
| 0.6 | 27 | Not resolvable | - | - | - | |
| 1 | 27 | 26.8 | 58.3 | 26 | 0.9 | 10 |
| 1.5 | 27 | 26.8 | 51.8 | 20 | 1.3 | 13.33 |
| 2 | 27 | 26.8 | 46 | 14 | 1.9 | 5 |
| 3 | 27 | 26.8 | 38.8 | 7 | 2.9 | 3.33 |
| Gain (dB) Back Wall | 32.4 | |||||
|---|---|---|---|---|---|---|
| FBH (mm) | Produced Depth (mm) | Measured Depth | Gain (dB) FBH | ∆dB | Determined FBH (mm) | Deviation (%) |
| 0.6 | 27 | Not resolvable | - | - | - | |
| 1 | 27 | 26.9 | 56.5 | 25 | 1.0 | 0 |
| 1.5 | 27 | 26.9 | 52.5 | 21 | 1.3 | 13.33 |
| 2 | 27 | 27.0 | 47.3 | 15 | 1.8 | 10 |
| 3 | 27 | 26.9 | 40.8 | 9 | 2.6 | 13.33 |
| Gain (dB) Back Wall | 31 | |||||
|---|---|---|---|---|---|---|
| FBH (mm) | Produced Depth (mm) | Measured Depth | Gain (dB) FBH | ∆dB | Determined FBH (mm) | Deviation (%) |
| 1.5 | 20 | 19.8 | 45.4 | 14 | 1.5 | 0 |
| 1.5 | 25 | 24.8 | 50.4 | 19 | 1.4 | 6.67 |
| 1.5 | 27 | 26.8 | 52.4 | 21 | 1.3 | 13.33 |
| 1.5 | 28 | 27.8 | Not assessable | - | - | |
| 1.5 | 29 | Not resolvable | - | - | - | |
| Gain (dB) Back Wall | 34 | |||||
|---|---|---|---|---|---|---|
| FBH (mm) | Produced Depth (mm) | Measured Depth | Gain (dB) FBH | ∆dB | Determined FBH (mm) | Deviation (%) |
| 1.5 | 20 | 21.7 | 63.4 | 29 | 0.7 | 53.33 |
| 1.5 | 25 | 24.5 | 50.4 | 16 | 1.6 | 6.67 |
| 1.5 | 27 | 26.4 | 51.4 | 17 | 1.6 | 6.67 |
| 1.5 | 28 | 27.7 | Not assessable | - | - | |
| 1.5 | 29 | Not resolvable | - | - | - | |
Disclaimer/Publisher’s Note: The statements, opinions and data contained in all publications are solely those of the individual author(s) and contributor(s) and not of MDPI and/or the editor(s). MDPI and/or the editor(s) disclaim responsibility for any injury to people or property resulting from any ideas, methods, instructions or products referred to in the content. |
© 2025 by the authors. Licensee MDPI, Basel, Switzerland. This article is an open access article distributed under the terms and conditions of the Creative Commons Attribution (CC BY) license (https://creativecommons.org/licenses/by/4.0/).
Share and Cite
Keuler, S.; Jüngert, A.; Werz, M.; Weihe, S. Influence and Potential of Additive Manufactured Reference Geometries for Ultrasonic Testing. J. Manuf. Mater. Process. 2025, 9, 224. https://doi.org/10.3390/jmmp9070224
Keuler S, Jüngert A, Werz M, Weihe S. Influence and Potential of Additive Manufactured Reference Geometries for Ultrasonic Testing. Journal of Manufacturing and Materials Processing. 2025; 9(7):224. https://doi.org/10.3390/jmmp9070224
Chicago/Turabian StyleKeuler, Stefan, Anne Jüngert, Martin Werz, and Stefan Weihe. 2025. "Influence and Potential of Additive Manufactured Reference Geometries for Ultrasonic Testing" Journal of Manufacturing and Materials Processing 9, no. 7: 224. https://doi.org/10.3390/jmmp9070224
APA StyleKeuler, S., Jüngert, A., Werz, M., & Weihe, S. (2025). Influence and Potential of Additive Manufactured Reference Geometries for Ultrasonic Testing. Journal of Manufacturing and Materials Processing, 9(7), 224. https://doi.org/10.3390/jmmp9070224