1. Introduction
The growing threat of climate change and environmental degradation necessitates urgent action to transition toward sustainable energy systems. In response, the United Nations has set ambitious targets to achieve net-zero emissions, fostering resource-efficient, climate-neutral, and competitive economies [
1]. Thermoelectric (TE) materials, which enable the direct and reversible conversion between thermal and electrical energy, have emerged as a promising solution to enhance energy efficiency without relying on batteries or grid infrastructure [
2]. TE devices exploit two fundamental effects: the Seebeck effect, where a temperature gradient generates an electrical voltage, and the Peltier effect, where an applied current induces a temperature gradient. These properties enable various applications, including waste heat recovery, portable refrigeration, air conditioning, and localized cooling of electronic components [
3].
Significant progress has been made in developing TE materials, focusing on expanding their operating temperature range and improving their dimensionless figure of merit (ZT), a key performance indicator that depends on a material’s electrical conductivity, thermal conductivity, and Seebeck coefficient, to enhance energy conversion efficiency (summarized in
Table 1) [
4]. Traditional TE materials, such as bismuth telluride (Bi
2Te
3) and lead telluride (PbTe), are known for their high ZT values and are widely used in cooling devices and low-grade energy harvesting. However, these materials face significant drawbacks, including toxicity, limited availability, and degradation at high temperatures. Recent research has focused on alternatives, such as half-Heusler alloys (XYZ, where X=Ti, Zr, Nb, Hf, Y=Ni, Co, Fe and Z=Sn, Sb), skutterudites (MX3, where M=Co, Fe, Ni and X=P, As, Sb) and organic-inorganic hybrids (PEDOT:PSS/Bi
2Te
3, CNT/Bi
2Te
3), which offer better thermal stability, making them suitable for high-temperature applications like industrial waste heat recovery or automotive power generation [
4]. However, challenges remain, as these substitutes often involve complex, costly synthesis processes or have limited performance across a broad temperature range.
In this context, less expensive copper-nickel (Cu-Ni) alloys with compositions ranging from 60 to 90% copper and 10–40% nickel are promising as these alloys offer excellent electrical conductivity (~10
6 S m
−1), stable resistivity over a wide temperature range, strong mechanical properties, high oxidation resistance, and ease of synthesis [
5,
6,
7,
8,
9,
10]. However, their relatively low thermal conductivity (30–50 W m
−1 K
−1 at 300 K) currently limits their TE performance, resulting in significantly lower ZT values than traditional TE materials. To improve ZT, various efforts have focused on optimizing the microstructure of CuNi alloys during material processing [
5,
6,
7]. For example, studies by Kang et al. and Mao et al. demonstrated that nano-scale features, such as nanograins, nanotwins, and nanoprecipitates, enhance phonon scattering, reducing thermal conductivity without significantly affecting electrical conductivity [
8]. Meanwhile, Muta et al. and Yuan et al. reported that adding SiO
2 or Al
2O
3 nanoparticle particles and carbon nanotubes (CNTs), could manipulate the electrical and thermal conductivity of Cu
55Ni
45 alloys [
9,
10]. Alternatively, Baiocco et al. and Hussain have reported increases in the thermal conductivity of thermoelectric alloys and CuNi by introducing graphene into the materials during manufacturing. [
11,
12].
Over the past five years, additive manufacturing (AM) of Cu-Ni alloys has gained traction for its ability to create complex geometries with precisely controlled microstructure [
13,
14,
15,
16,
17]. Despite this potential, their TE properties remain largely unexplored in the context of AM, with only a single study to date examining the TE performance of Cu
65Ni
35 alloys produced via laser-based directed energy deposition (L-DED). That study reports significant copper-nickel segregation and compositional inhomogeneity, resulting in inferior TE power factors compared to conventionally processed materials prepared via mechanical alloying and hot-pressing [
17]. This highlights a critical knowledge gap: how to systematically control thermal and compositional gradients during L-DED to enhance functional performance in Cu-Ni alloys. Given the inherently non-equilibrium nature of L-DED which features steep thermal gradients, rapid solidification, and localized melting, an untapped opportunity exists to leverage these conditions for microstructural tuning [
18]. However, achieving uniform composition, low porosity, and high fusion quality requires precise control over key process parameters—such as laser power, scan speed, and powder flow rate [
18]—a domain that remains underexplored mainly for Cu-Ni alloys in the context of thermoelectric applications. This study directly addresses that gap.
To this end, the overarching goal of this study is to establish efficient process maps that elucidate process–structure–property correlations in bulk Cu-Ni TE fabricated via L-DED. As an initial step, this study focuses on the geometry and quality of a single Cu-Ni track formed during a single laser pass, providing foundational insight into early-stage deposition phenomena during DED processing. Macrostructural analysis ensures uniform deposition by minimizing variations in track width, height, and geometry, thereby reducing defect formation in subsequent layers. Additionally, fusion quality is assessed to characterize melting and mixing behavior, mitigating weak adhesion, delamination, and crack formation. The insights gained from this study will inform multi-track and multi-layer deposition strategies, aiming to minimize defects such as porosity, balling, and uneven material distribution, ultimately enhancing the integrity and performance of additively manufactured Cu-Ni TEs.
2. Experimental Methods
(a) Powder Characterization
Copper (METCO 55, >99% purity) and nickel (METCO 56C-NS, 99.3% purity) powders were obtained from Oerlikon Metco and mixed in an atomic ratio of 65% Cu and 35% Ni using an industrial tumbler for 8 h. The powder morphology and composition were analyzed via field emission scanning electron microscopy (Hitachi SU-70, Hitachi High-Tech Corporation, Tokyo, Japan). Flowability tests involved three measurements, with averages and standard deviations calculated. Tap density was determined per ASTM B527-06 by applying vibration to a powder sample in a graduated cylinder [
19]. Apparent density was measured using the untapped volume and total sample mass, with the Hausner ratio calculated as the tap-to-apparent density ratio [
20]. A calibrated Hall flowmeter (Qualtech, Petaluma, CA, USA), following ASTM B213-11, measured the time for 50 g of powder to flow through a standard funnel [
20]. The powder formed a conic shape, and image analysis software was used to calculate the angle of repose, measured to the nearest 0.01°.
(b) Direct Energy Deposition
In this study, a robotic L-DED system was used to fabricate two sets of 21 single-layer tracks with different process parameters. The experiments were conducted at the Commonwealth Center for Advanced Manufacturing (CCAM) using the intelligent DED cell, which features a Precitec YC50 laser-blown powder head with a 3 kW maximum output laser source. The system is integrated with a Siemens Sinumerik 840D control unit and is installed on a 6-axis Comau RJ 40 robot platform, which operates alongside an additional 2-axis trunnion table.
Each track, with a length of 4 cm, was deposited using a mixed 65 wt.% Cu–35 wt.% Ni powder onto a 316 L stainless steel substrate. Argon gas was used as the powder carrier and shielding medium throughout the deposition process to ensure an inert atmosphere and prevent oxidation. The tracks were deposited with a 2 cm lateral spacing between adjacent paths, and a dwell time of at least 30 s was maintained between consecutive depositions. This ensured that the thermal influence between tracks was minimized, allowing for the characterization of each track under isolated conditions.
Table S1 in the Supplement shows the processing parameters, laser power P, robot scan speed υ, and powder mass flow rate m; used during the experiments for sample depositions. Following [
21], the track geometries were examined based on two key composite parameters: linear mass density (M
L) and linear energy density (also known as linear heat input, H
L). While M
L governs material deposition along the track, influencing width, height, and macrostructural geometry, H
L regulates melt pool formation, thermal stability, and solidification behavior, directly shaping the deposits’ microstructural characteristics [
21]. The corresponding equations for these parameters are as follows:
The laser power P was held constant at 800 W for all depositions. The scan speed and mass flow rate were adjusted to achieve values of 0.011 g/mm, 0.016 g/mm, 0.021 g/mm, and 0.026 g/mm. The combination of 800 W laser power and varied scan speed created a range of values from approximately 63 J/mm to 137 J/mm.
(c) Sample Characterization
After the deposition, the single tracks were analyzed from the top and then sectioned perpendicular to the deposition. After the fabrication, the single tracks were cut and mounted in resins and ground flat using up to 800-grit silicon carbide abrasive paper, followed by standard polishing procedures (9 μm, 3 μm, and 1 μm diamond suspension) and final polishing with 0.06 μm colloidal silica suspension using Vibromet 2 [
22]. A transverse cross-section of the deposited samples was analyzed using a field emission scanning electron microscope (Hitachi SU-70 FE-SEM) operated at 15 kV to characterize the track geometry. The resulting cross-sectional images were subsequently processed using ImageJ 1.54g for quantitative analysis.
The software scale was calibrated using the microscope scale bar to characterize the deposition geometry accurately, and pixel measurements were exported to a spreadsheet for analysis. A baseline was first drawn at the baseplate level in the cross-sectional image. Subsequently, points were marked at small intervals along the surface of each track, and their corresponding coordinate values were recorded. These coordinates, in conjunction with the baseline, were used to determine the total width and height of the deposition relative to the flat baseline. Finally, the tracks’ microstructural and compositional homogeneity were examined using Electron Backscatter Diffraction (EBSD; Zeiss Auriga FIB) after further polishing via ablation ion milling (Leica Ion Mill).
(d) Construction of a Qualitative Process Parameter Decision Matrix
A Qualitative Process Parameter Decision Matrix was constructed to evaluate the qualitative impact of key process parameters, H
L, and M
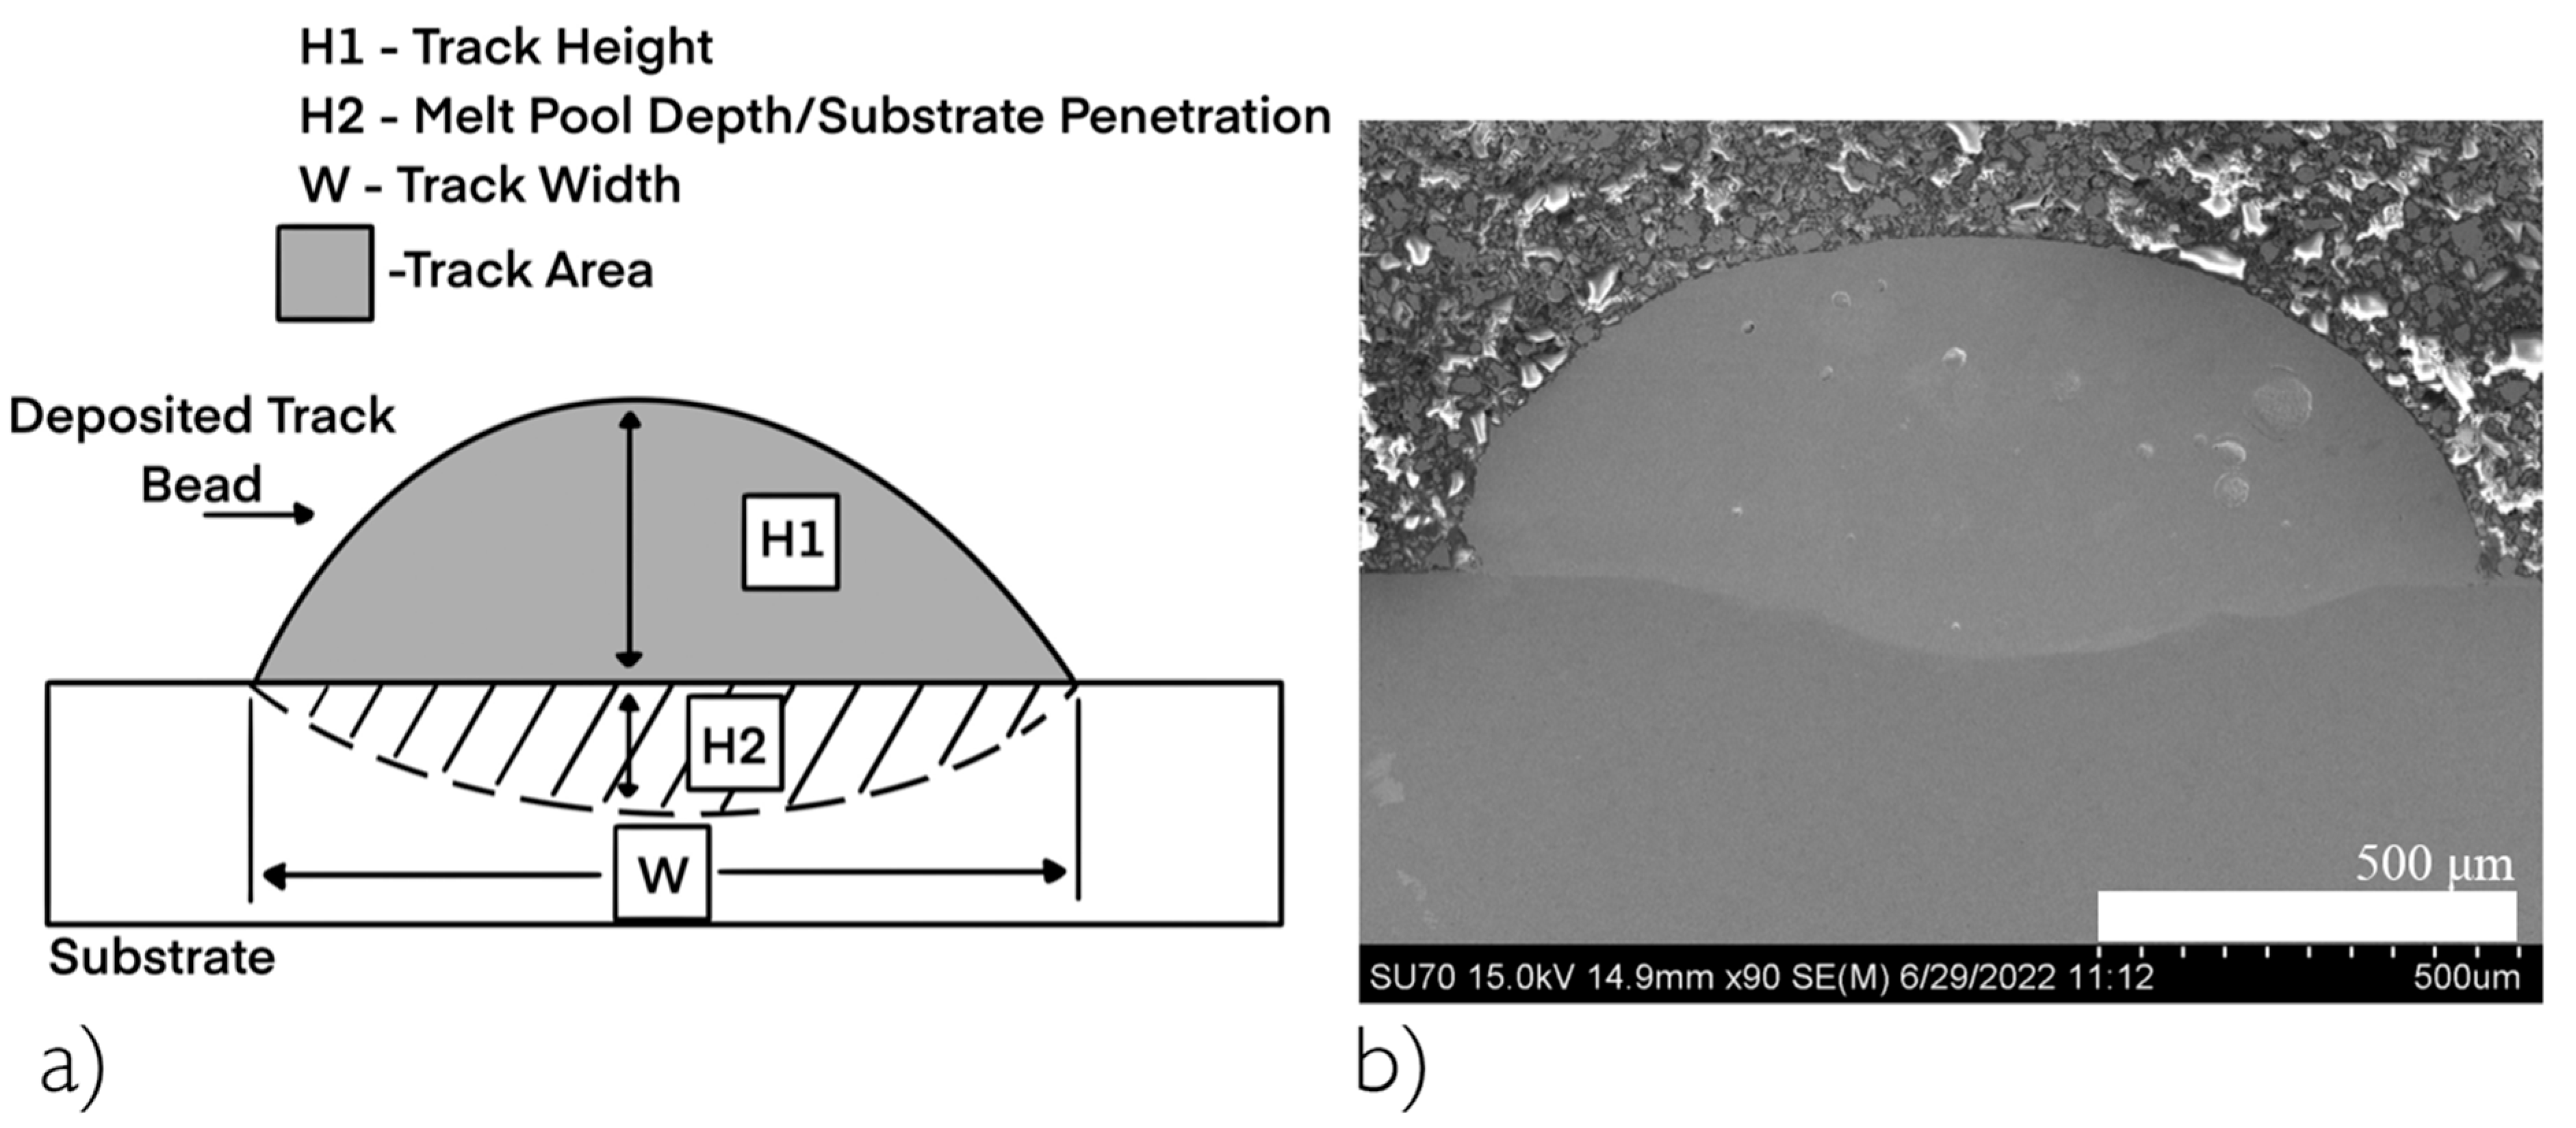
L on critical performance metrics to optimize deposition quality. Process optimization was assessed based on six primary qualitative attributes observed in single-track cross-sections: (1) build-up, (2) substrate penetration, (3) cracking, (4) porosity, (5) Ni inclusion, and (6) overhang. Each sample was assigned a score between 1 and 5 based on an evaluation of SEM micrographs (see
Figure 1 and
Table 2 for details). Further, to account for their relative significance in achieving high-quality deposition, each criterion was assigned a weight ranging from 0 (little importance) to 2 (strong importance). The final process score for each test specimen was determined by multiplying the qualitative score of each criterion by its corresponding weight, followed by summing the weighted values. A higher total score indicated more favorable process conditions, while lower scores highlighted suboptimal parameters requiring further refinement.
3. Results
The flowability of powders is a critical parameter in AM as it directly impacts process quality, consistency, and efficiency [
23,
24,
25]. To this end, spherical particles are preferred in DED processing as their reduced contact area minimizes internal friction, ensuring consistent feeding, stable melt pool dynamics, and uniform deposition while reducing defects like porosity and uneven layers [
26].
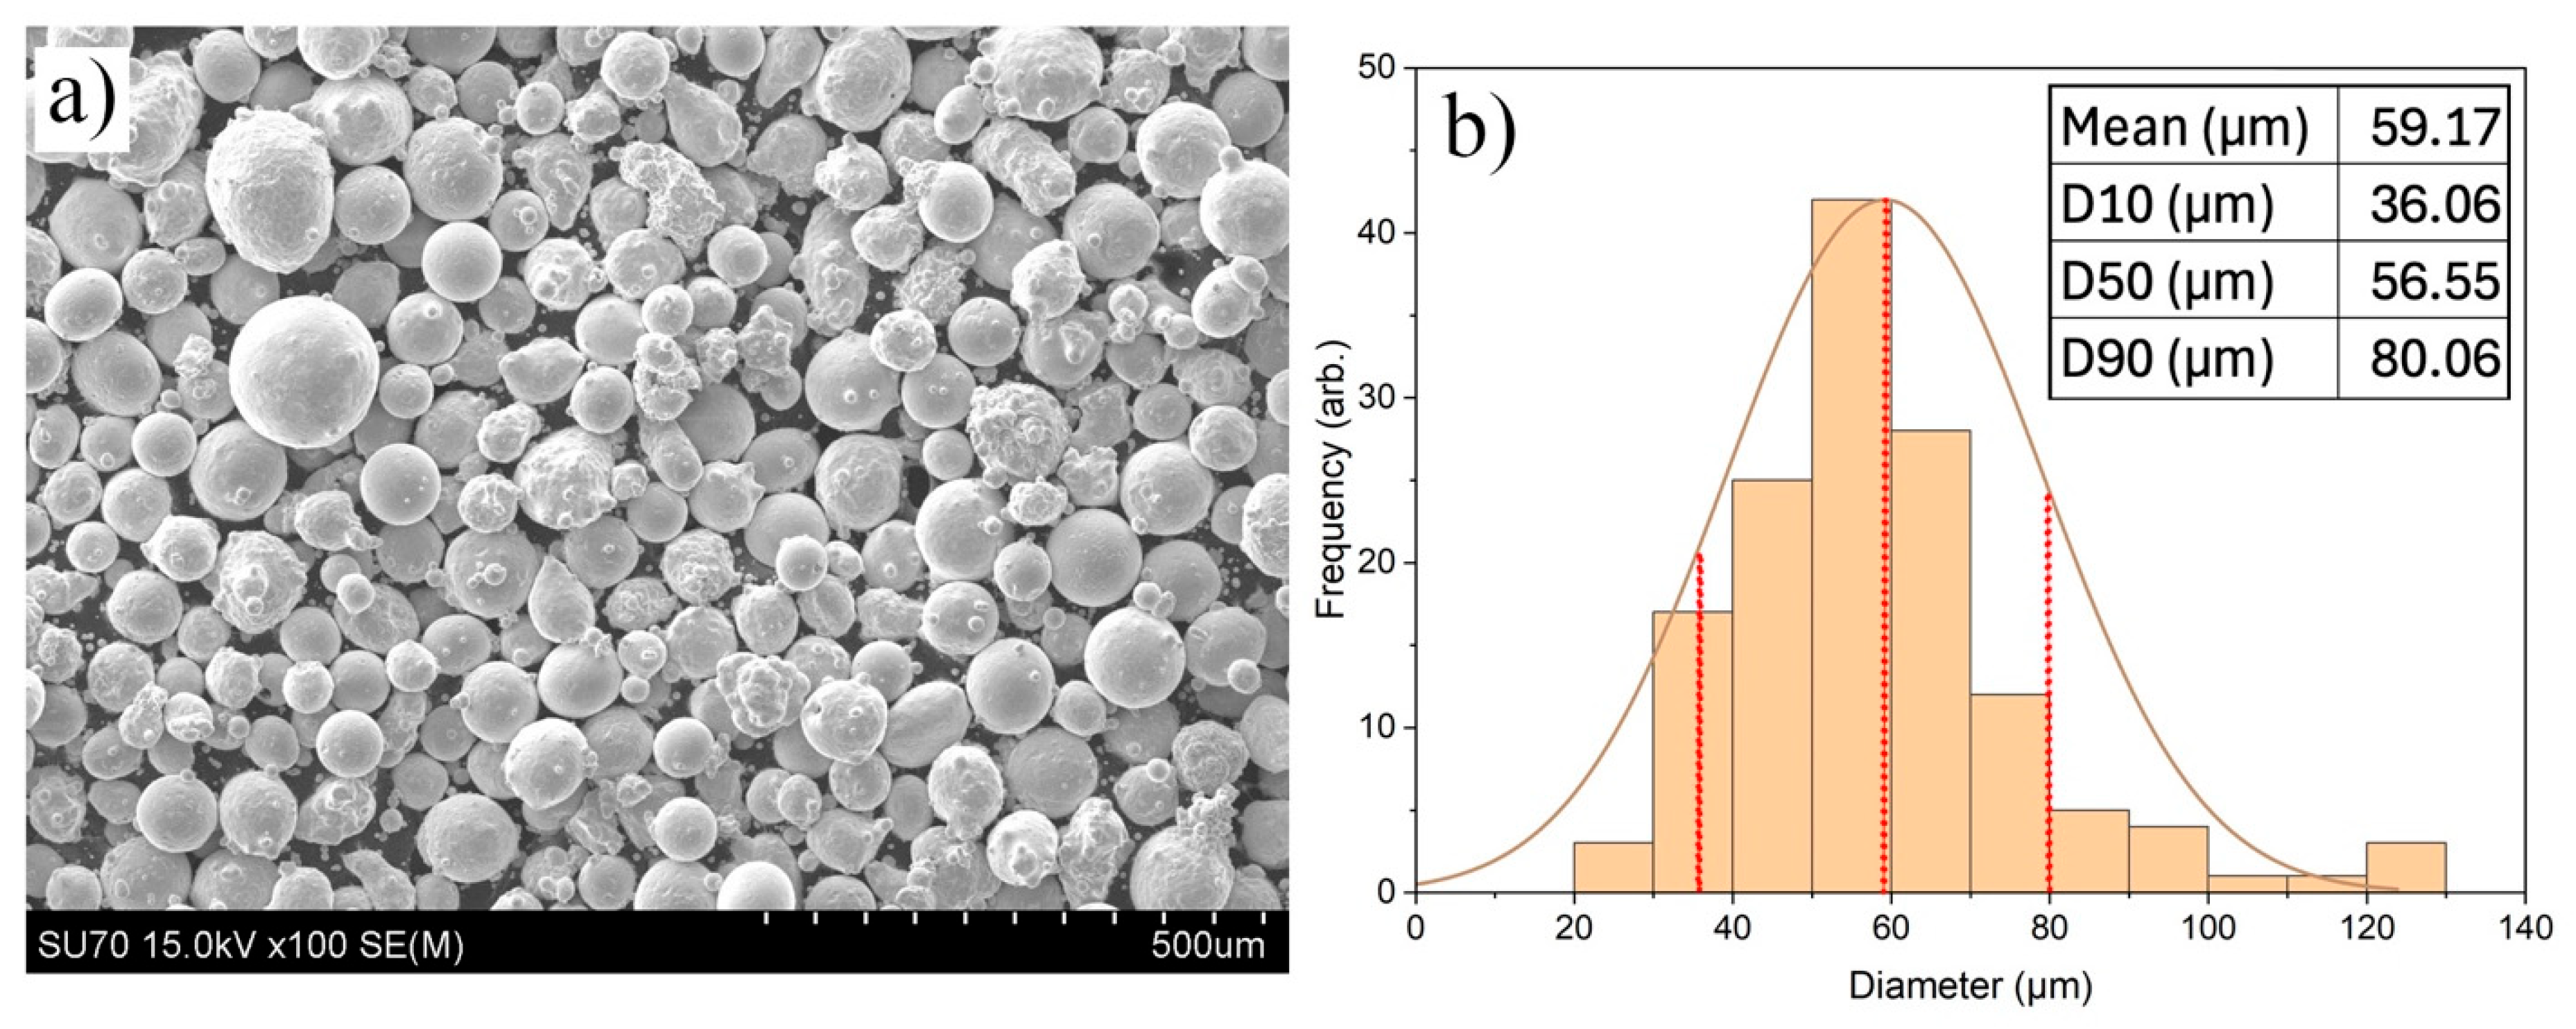
Figure 2 shows the SEM micrograph of the pre-mixed CuNi feedstock powder, with a nominal composition of 65 wt% Cu and 35 wt% Ni. The powder is primarily spherical with a mean diameter of approximately. 57 ± 15 μm, though it contains some irregular particles with attached satellites. An ideal powder size distribution (PSD) for the DED process is typically between 50 µm and 150 µm, but a smaller particle size is preferred when manually mixing alloys from pure elemental powder. This allows more mixed alloy particles to be captured in the melt pool, increasing the alloy mixing potential and decreasing the risk of compositional segregation. The bulk and tap densities were determined as 4.74 g/cm
3 and 5.20 g/cm
3, respectively, yielding a Hausner ratio of 1.10, indicating excellent flowability for AM. Furthermore, the Hall flow rate and angle of repose, measured according to ASTM B213 standards, were calculated as 0.3 g/s and 27.42°, within the desired range for AM applications [
26,
27].
Following DED processing, a macrostructural analysis is crucial for single-track deposits, providing valuable insights into deposition uniformity and quality. Such an analysis ensures that variations in width, height, or geometry are minimized to prevent uneven surfaces that could negatively impact subsequent layers and final part geometry [
21]. Further, it evaluates fusion quality, identifying the degree of melting and mixing between the deposit and the substrate to mitigate risks of weak adhesion or delamination that can result in crack formation [
21].
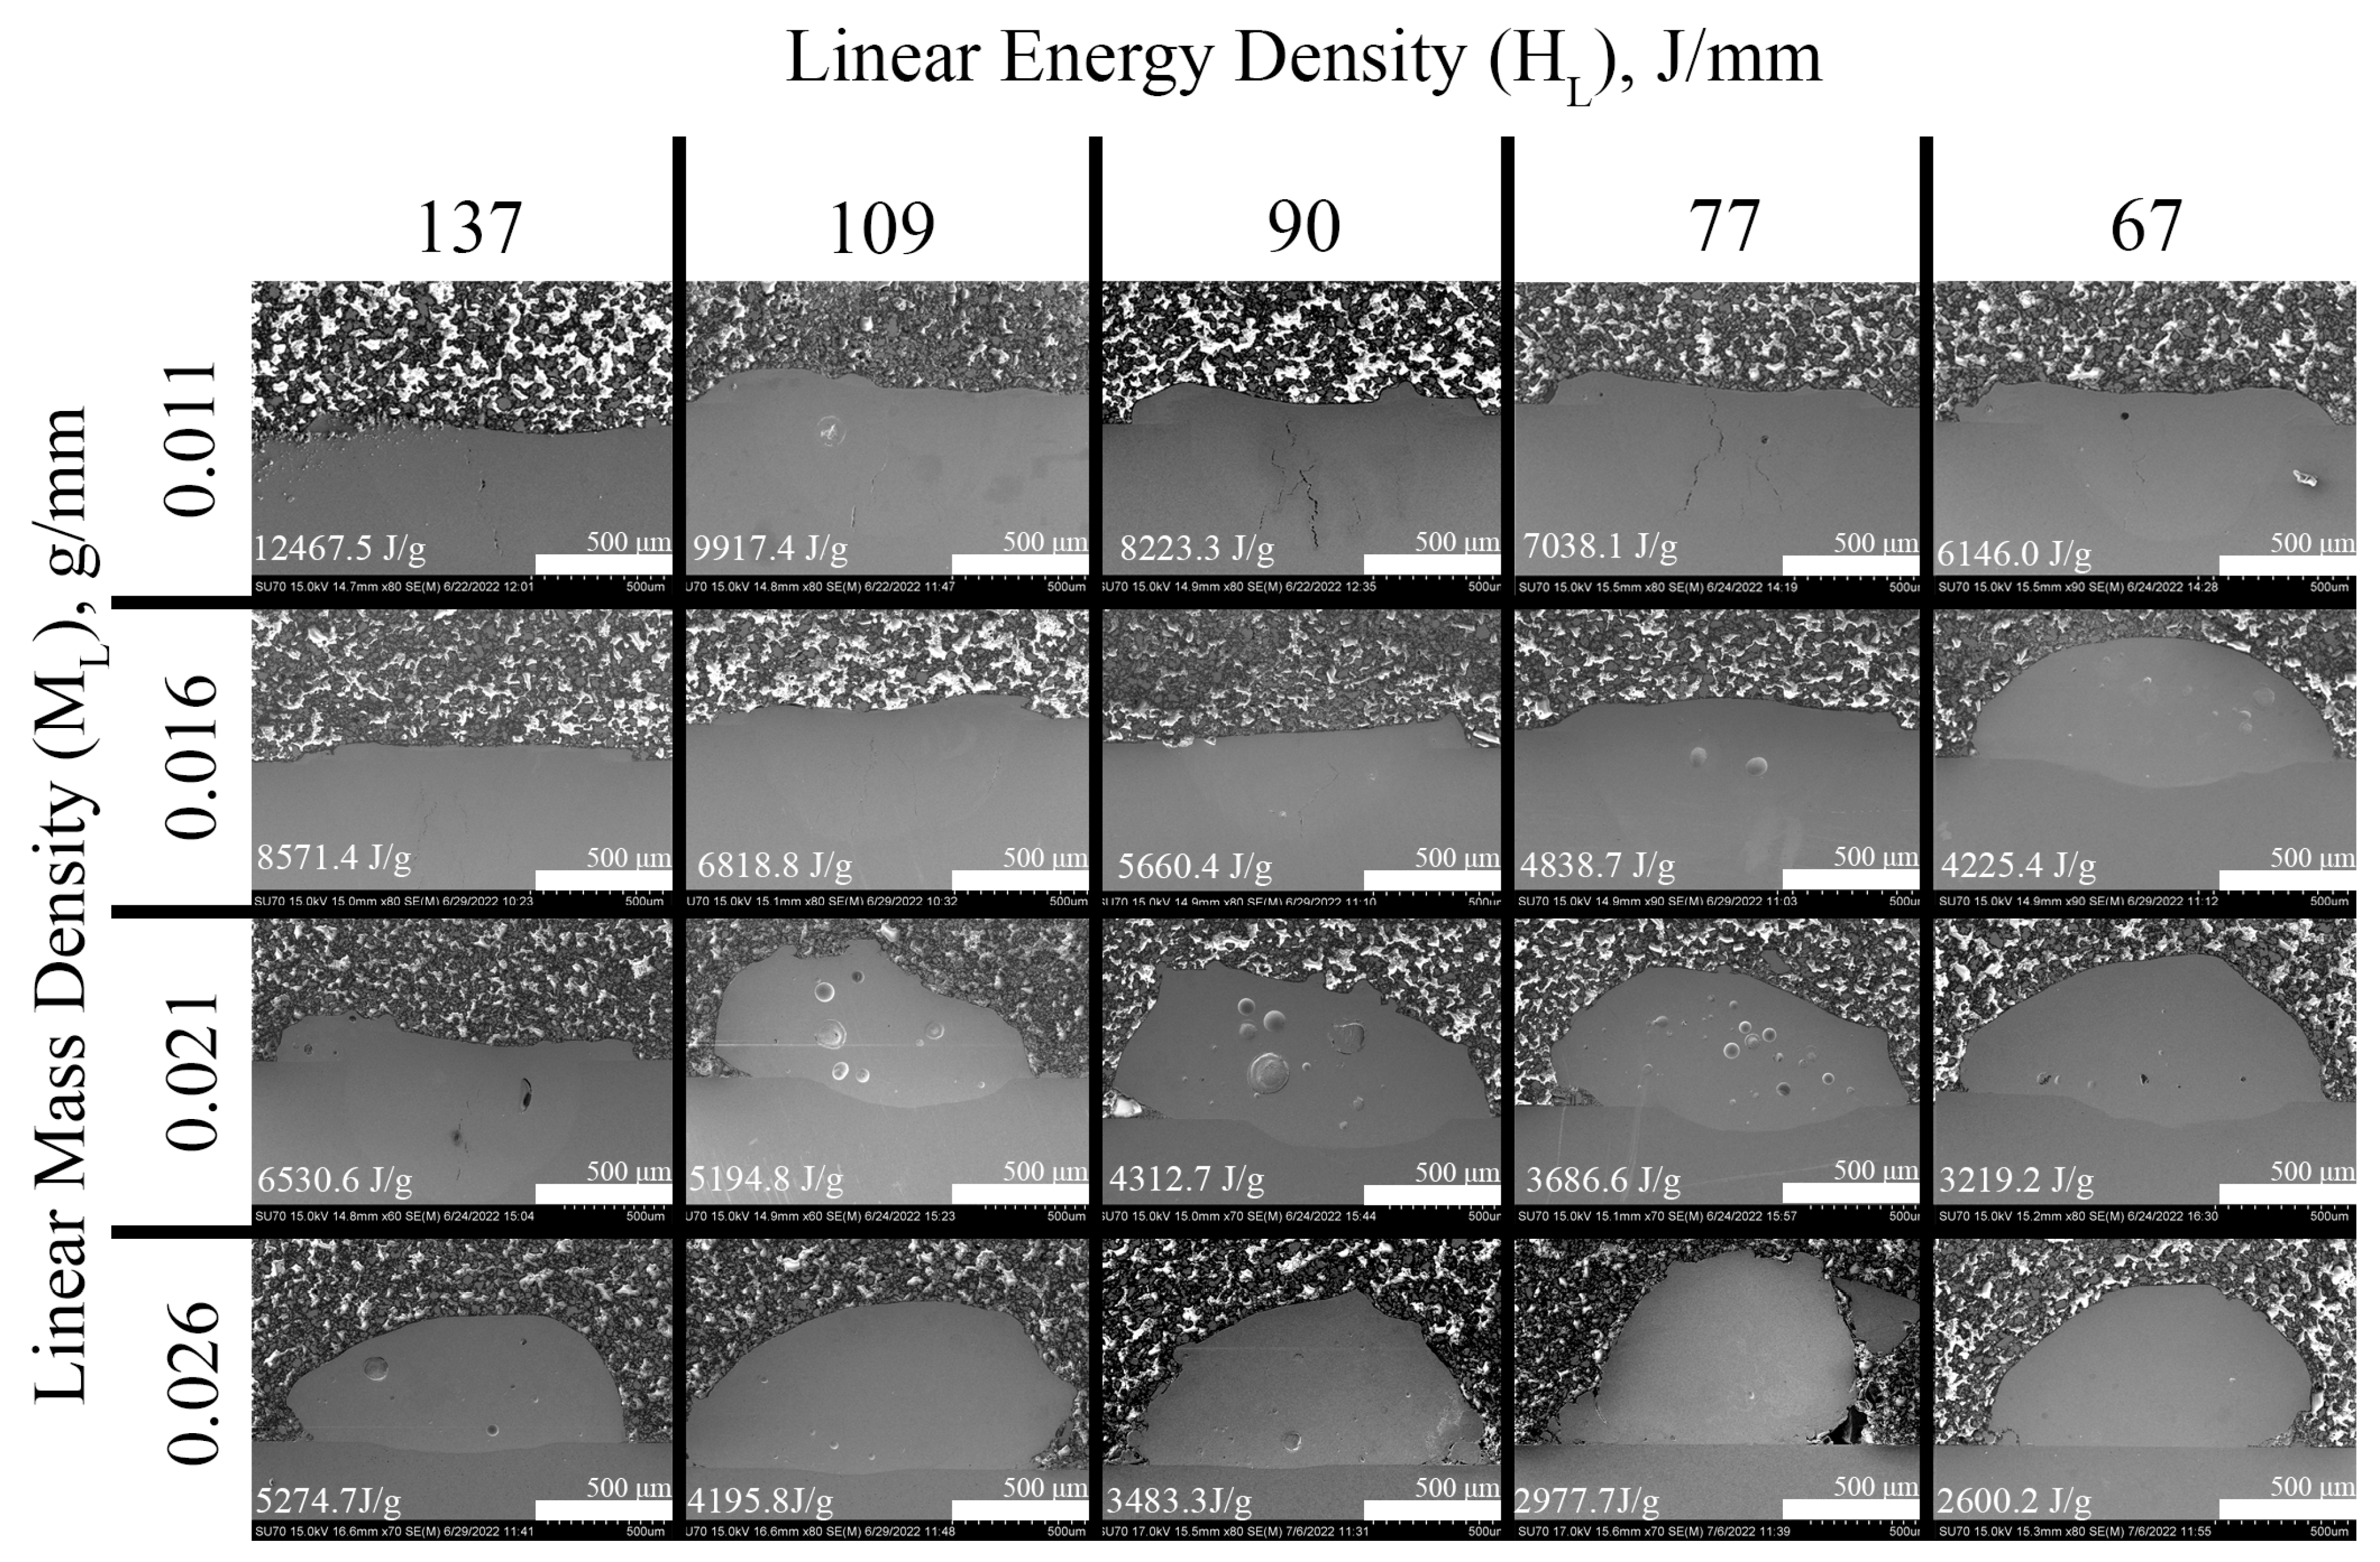
Figure 3 presents SEM micrographs of cross-sections from select tracks. Samples printed with a very low material loading (M
L) of 0.011 g/mm exhibited minimal or no deposition. EDS analysis revealed complete melt pool penetration into the 316 L stainless steel substrate across all linear heat input (H
L) conditions, which led to the formation of hot cracks along the centerline during solidification (see
Figure 4a for example). At the condition M
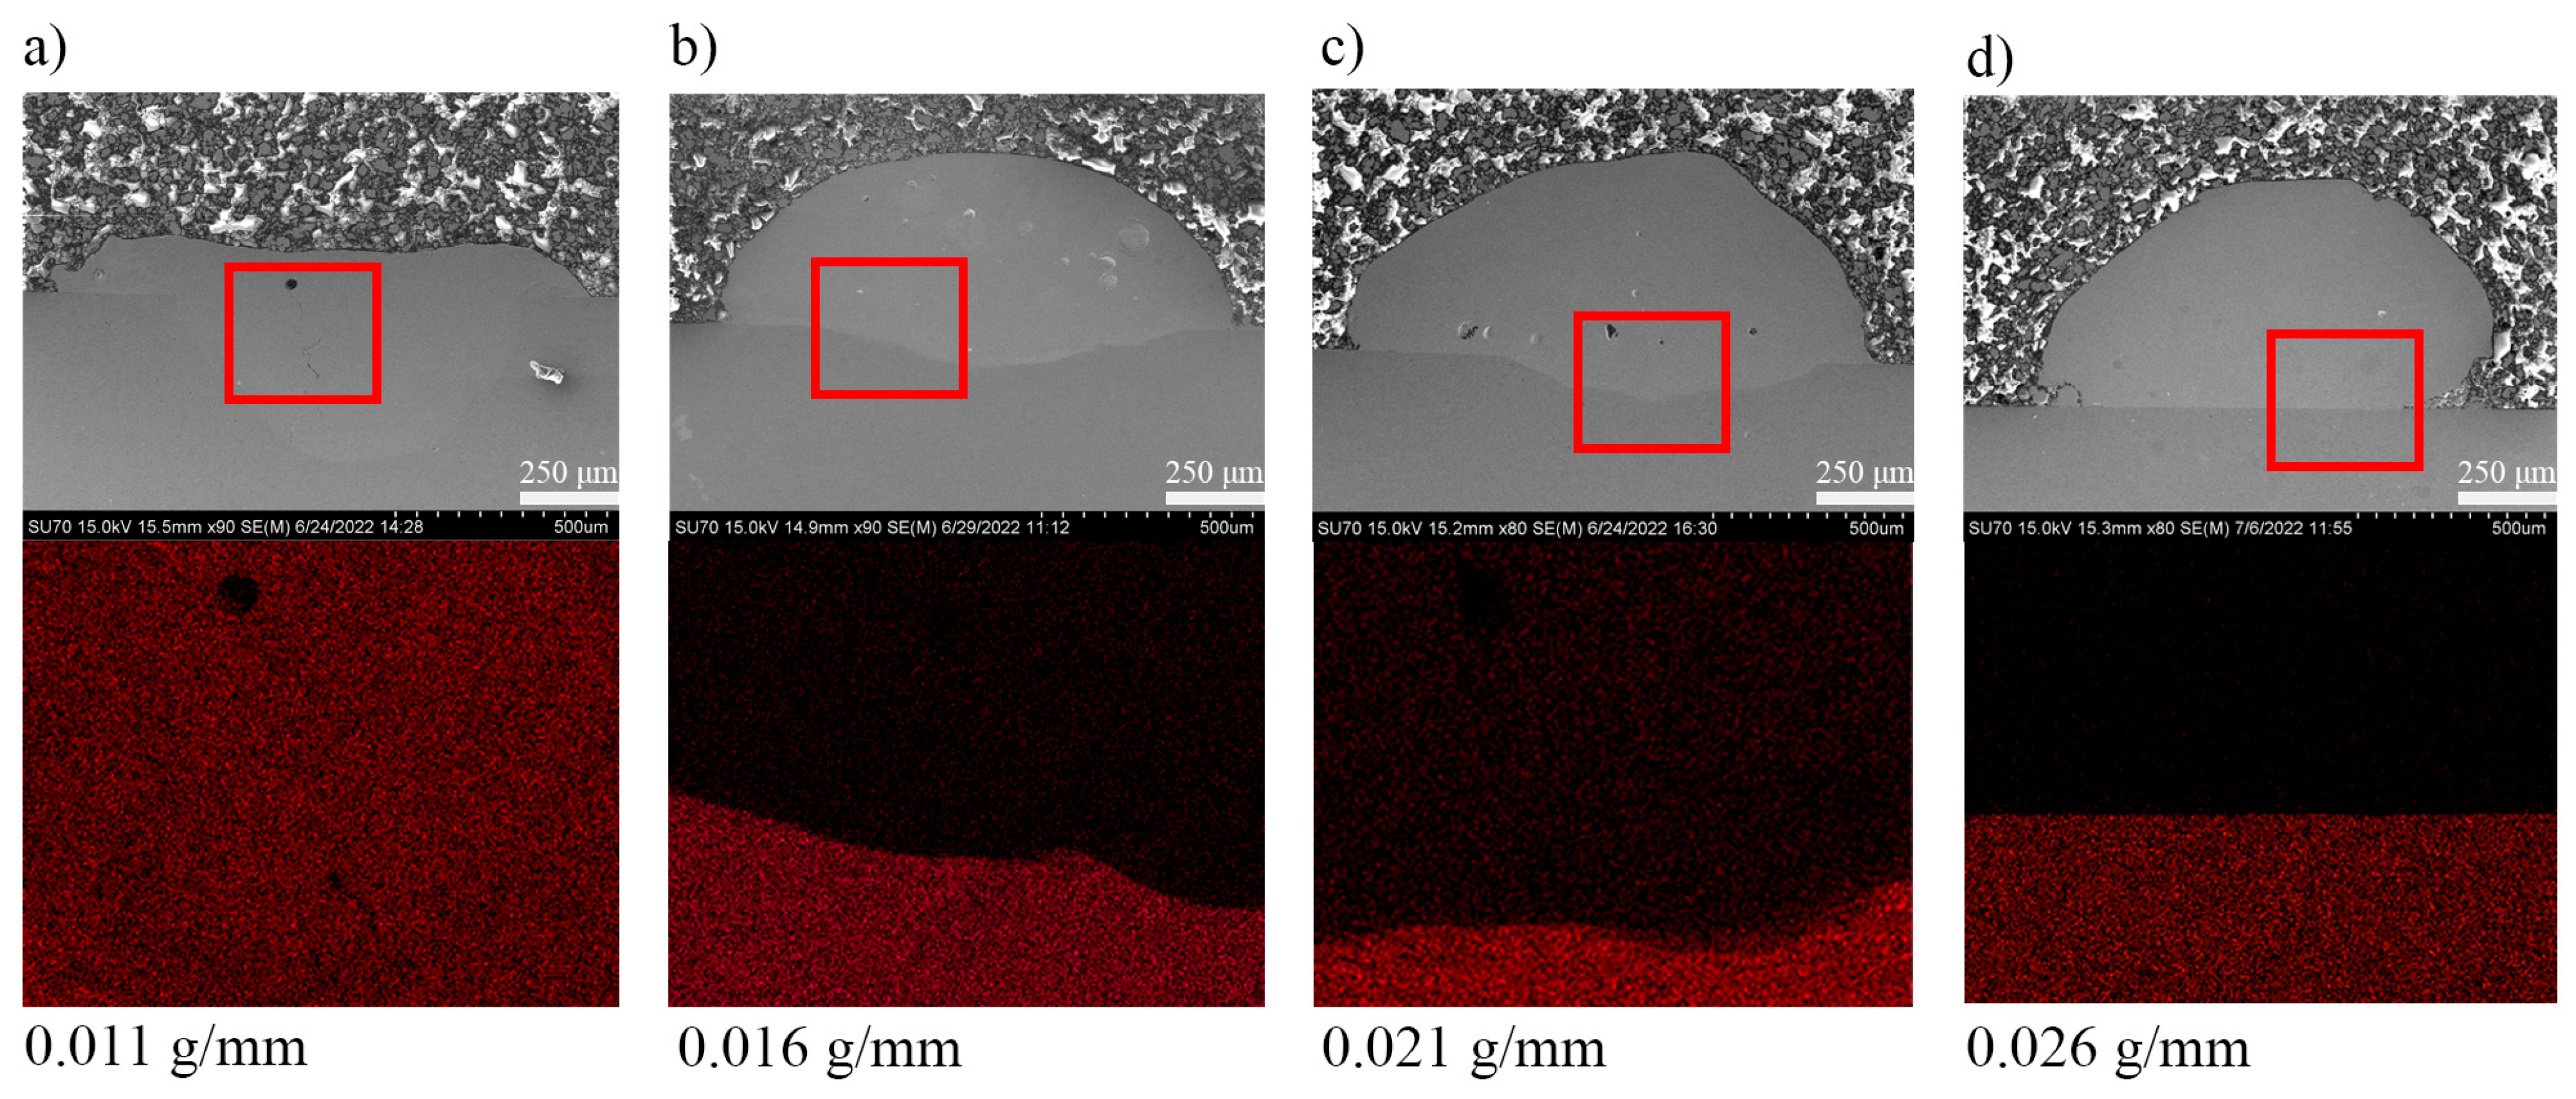
L = 0.016 g/mm, the single track printed at the lowest linear heat input (67 J/mm) shows a uniform cross-section deposit with about 500 µm of deposition height and approximately 100 µm of melt pool penetration into the substrate. EDS analysis at this condition showed minimal dilution of Fe from the 316 L substrate into the deposited material (
Figure 4b). This is identified as an ideal condition, although further penetration into the substrate would ensure better interface adhesion. A uniform cross-section also ensures proper fusion between subsequent layers when depositing multi-layer components. Unfortunately, an increase in H
L promotes substrate melting, allowing the molten material to mix more with the base material rather than forming a raised deposition.
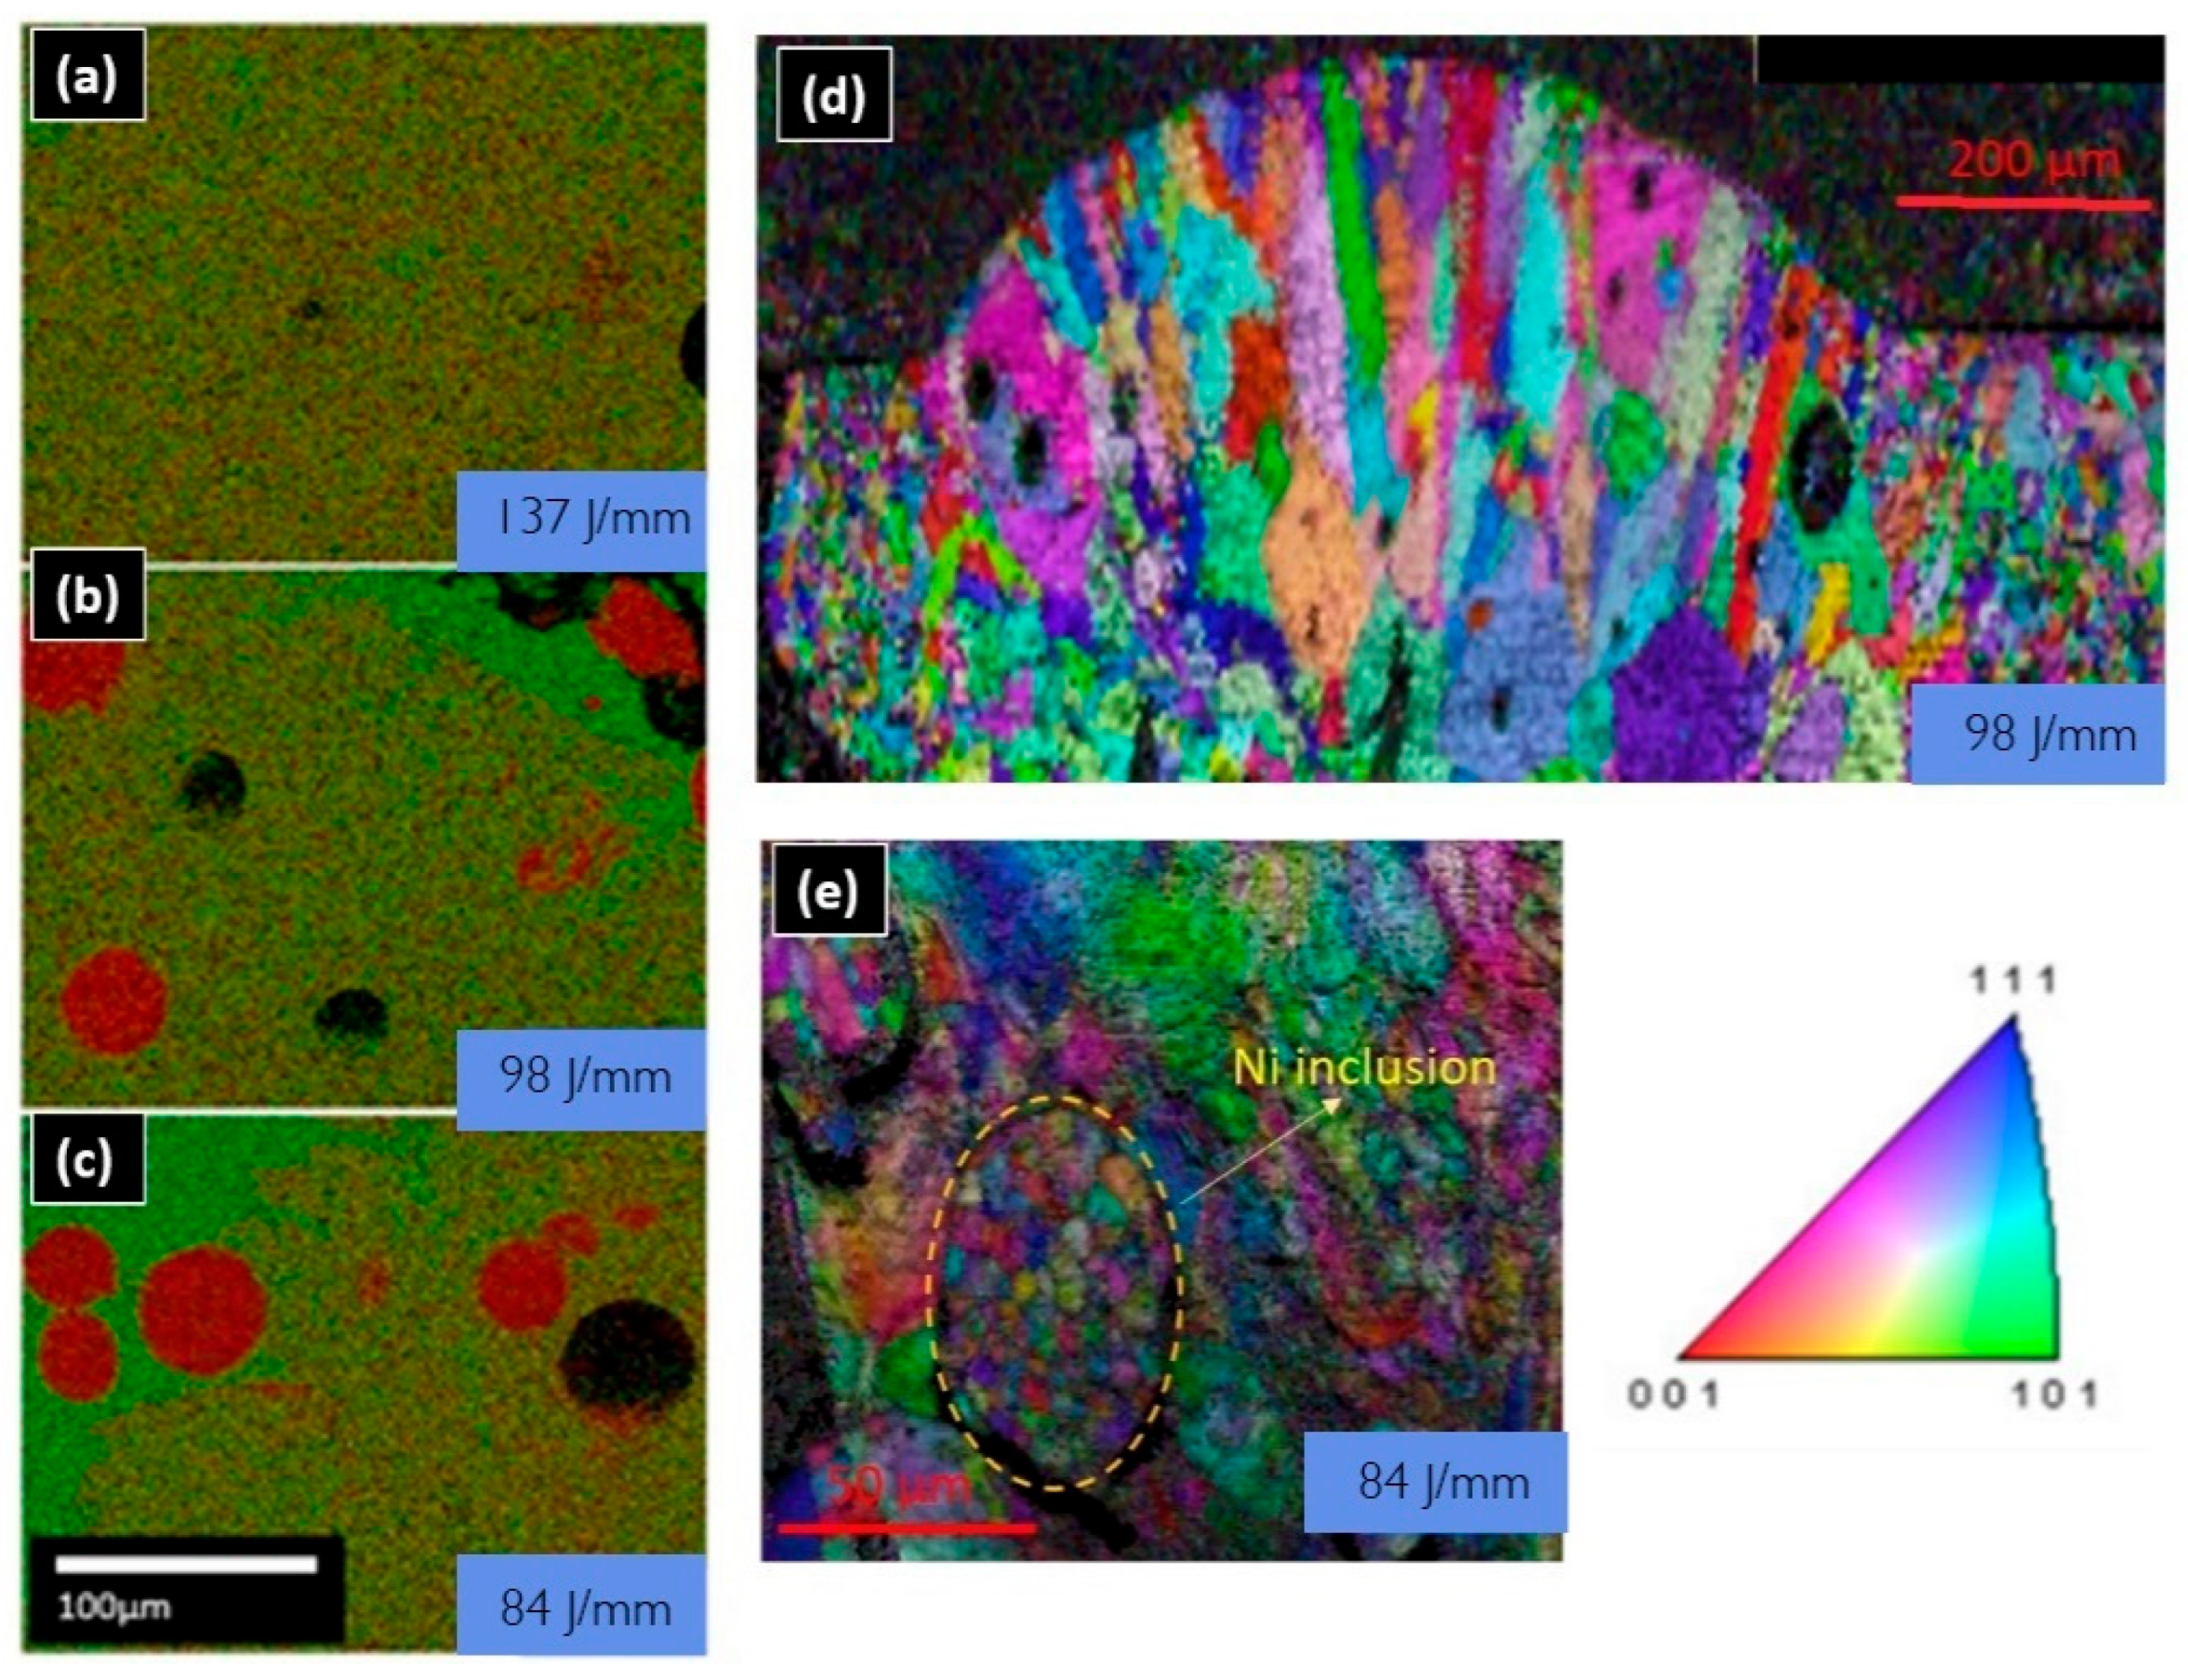
This trend persists at an M
L of 0.021 g/mm, where samples printed at an H
L of 137 J/mm exhibit low deposition accompanied by melt pool cracking, similar to conditions observed under low linear mass input. Reducing H
L enhances deposition height and dilution of Fe into the deposit (
Figure 4c), but introduces large pores theorized to be caused by the significant melting point difference between Cu (1085 °C) and Ni (1455 °C). At high M
L, the excess powder supply surpasses the melting capacity of the given H
L. While Cu fully melts, unmelted Ni particles become entrapped in the melt pool and solidify as isolated pure Ni regions. EDS and EBSD analyses, shown in
Figure 5, support this observation, revealing substantial Ni inclusions in cross-sections of samples printed at H
L < 100 J/mm and M
L = 0.021 g/mm, indicating insufficient energy input for complete melting. The Ni inclusions, approximately 50 µm in size (
Figure 5e), closely correspond to the median Ni feedstock size, further corroborating incomplete melting.
The highest M
L condition of 0. 026 g/mm shows excessive deposition height and little-to-no penetration into the substrate. The added CuNi material was effectively melted and consolidated (no lack-of-fusion or porosity), but EDS reveals poor mixing at the interface to the 316 L substrate, even though the deposit is fused to the substrate,
Figure 4d. This indicates the upper limit for M
L at the given H
L, where any increase in M
L may result in a lack of fusion or delamination between the added CuNi and 316 L substrate. Additionally, these samples exhibited an overhang at the edge of the track and substrate interface, which is undesirable as it may cause lack-of-fusion porosity during bulk component deposition, requiring multiple fused tracks.
The highest M
L condition of 0. 026 g/mm shows excessive deposition height and little-to-no penetration into the substrate. The added CuNi material was effectively melted and consolidated (no lack-of-fusion or porosity), but EDS reveals poor mixing at the interface to the 316 L substrate, even though the deposit is fused to the substrate,
Figure 4c. This indicates the upper limit for M
L at the given H
L, where any increase in M
L may result in a lack of fusion or delamination between the added CuNi and 316 L substrate. Additionally, these samples exhibited an overhang at the edge of the track and substrate interface, which is undesirable as it may cause lack-of-fusion porosity during bulk component deposition, requiring multiple fused tracks.
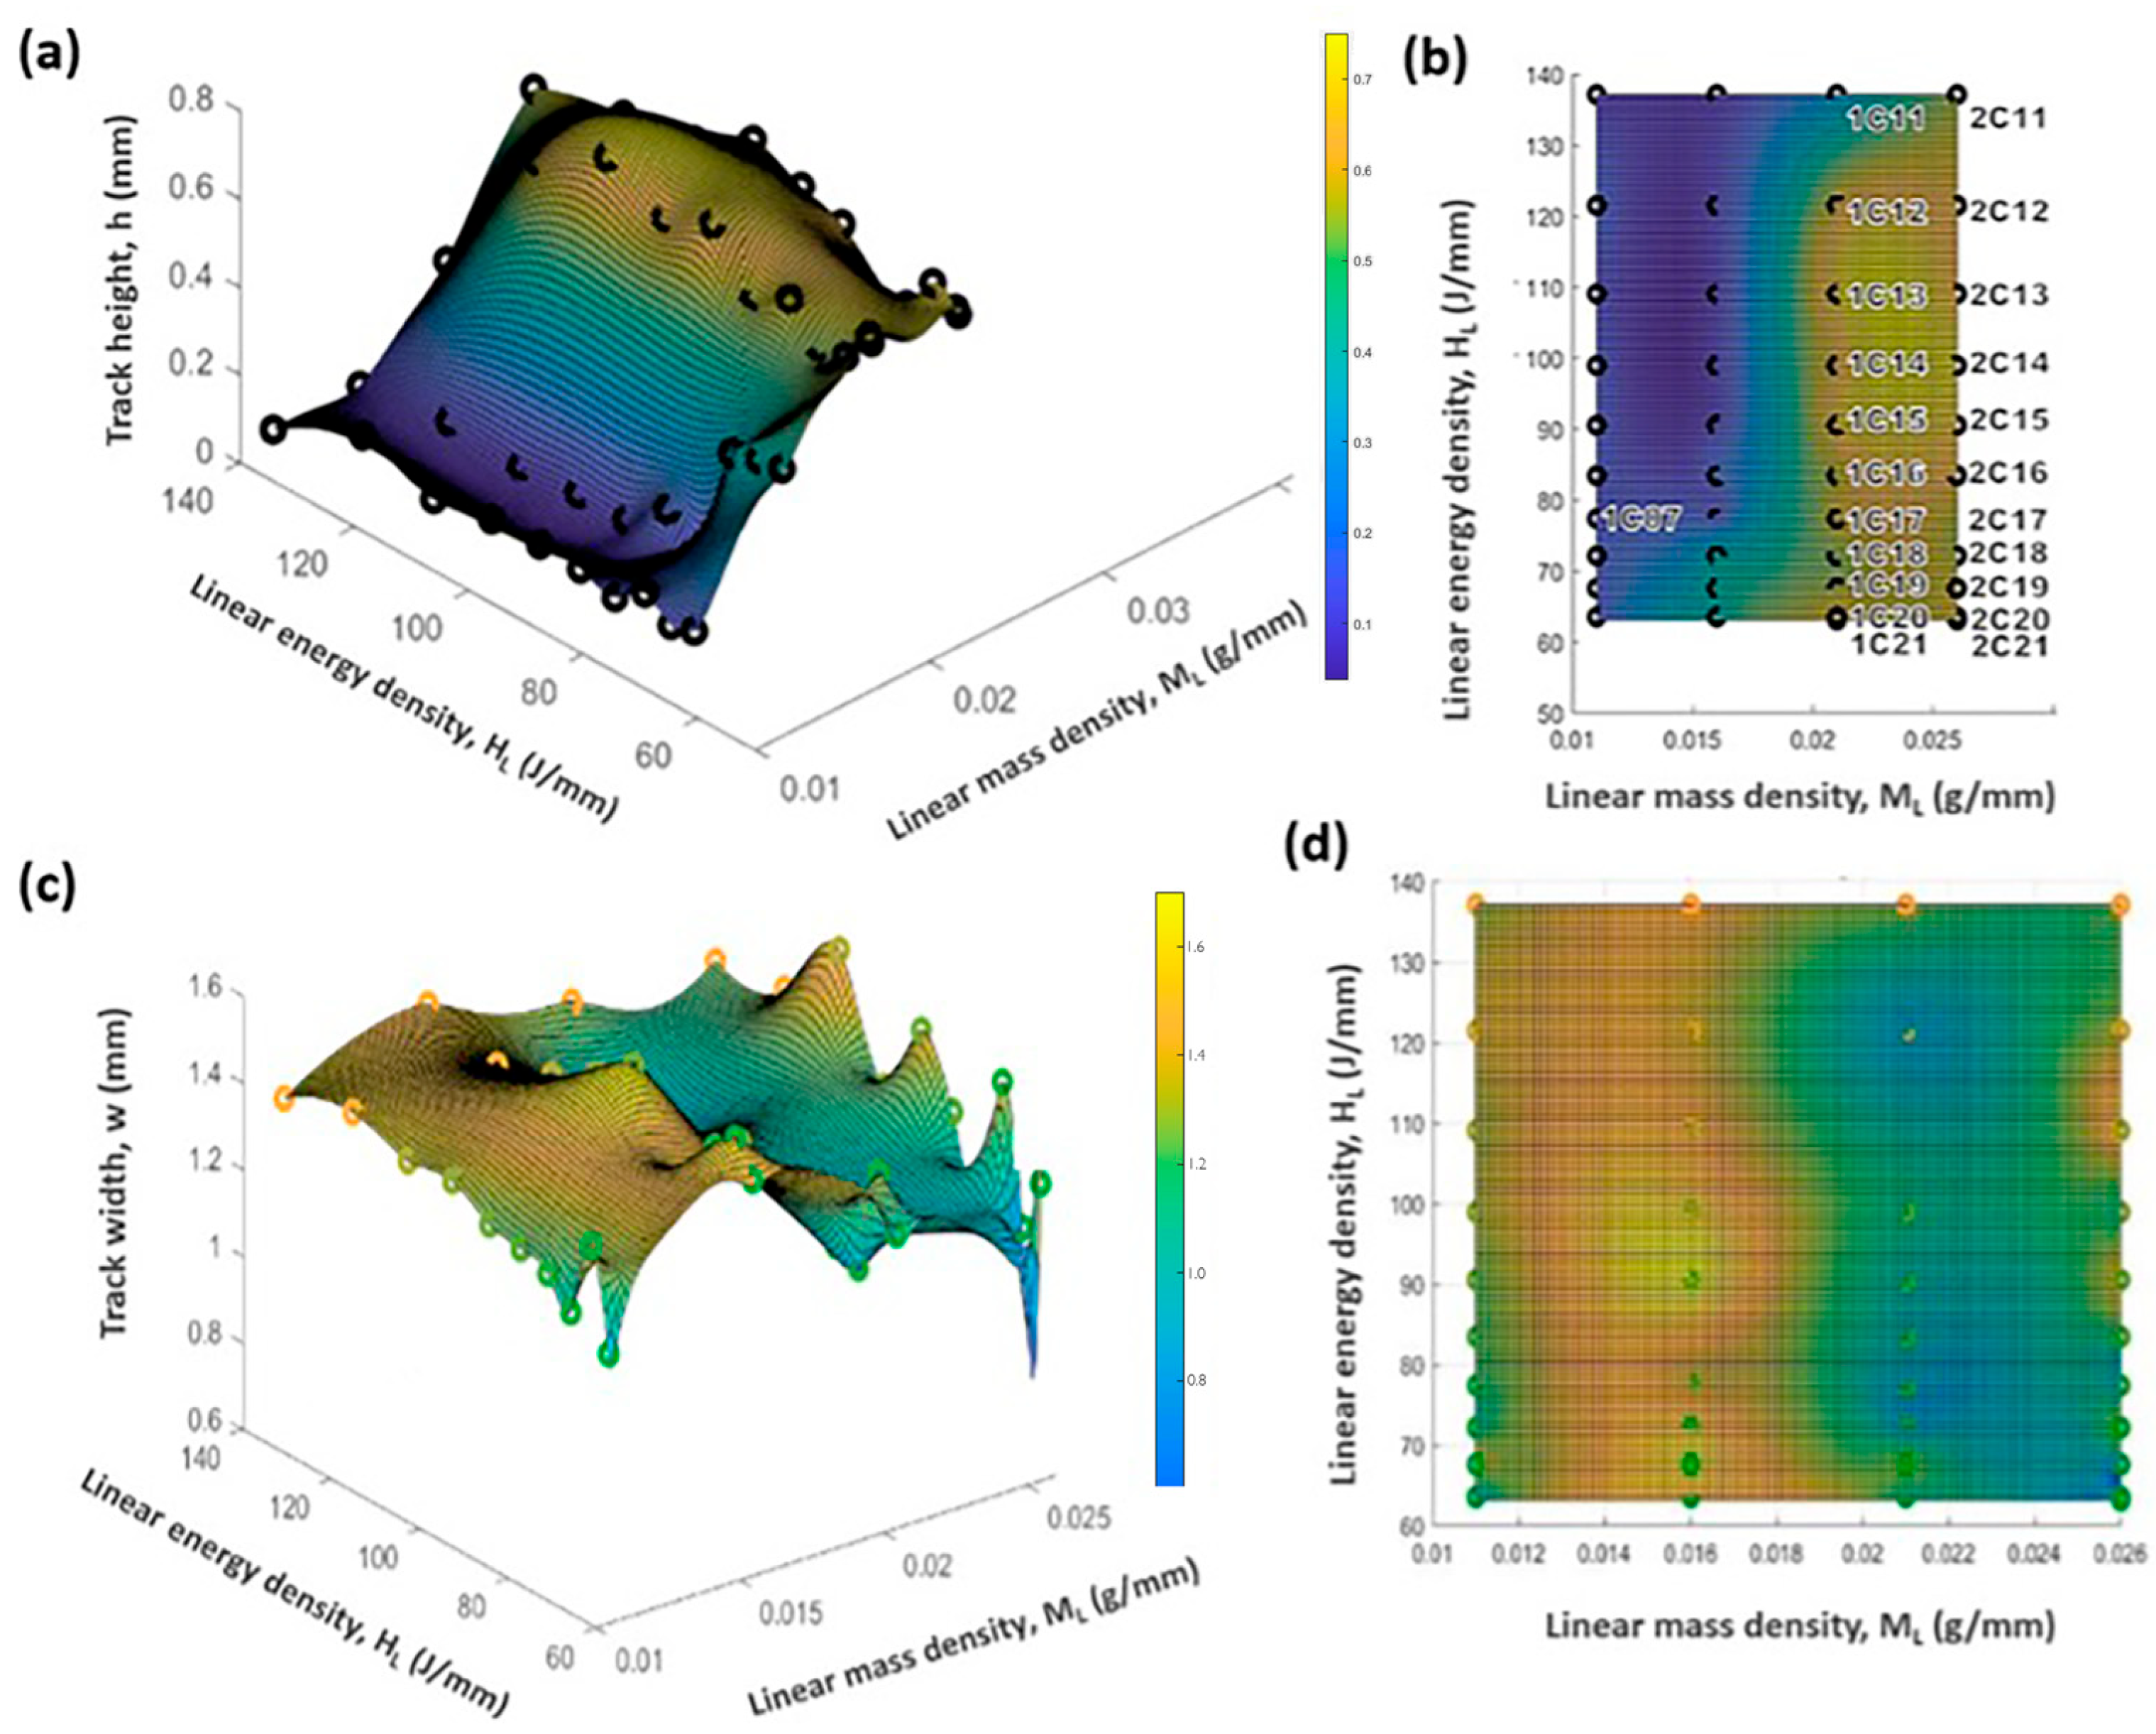
Following a detailed analysis of the SEM micrographs of all 40 specimens, a 3D plot demonstrating the relationships between track height (h
1) and width (w) with M
L and H
L was constructed,
Figure 6, and it was found that h
1 increases monotonically with M
L up to a threshold value of 0.021 g/mm. In line with previous studies on deposition strategies for single-track AISI 316 L stainless steel powders, no significant variation in track width was observed as a function of both H
L and M
L, as the laser spot size was maintained constant throughout the experiment.
The
Supplementary Materials presents the raw data of the process parameter decision matrix for each evaluation criterion detailed in
Table 2, while
Table 3 displays the weighted scores for all test specimens. A total score exceeding 25 points indicates favorable process conditions for high-quality deposition, whereas lower scores suggest suboptimal parameters requiring further optimization.
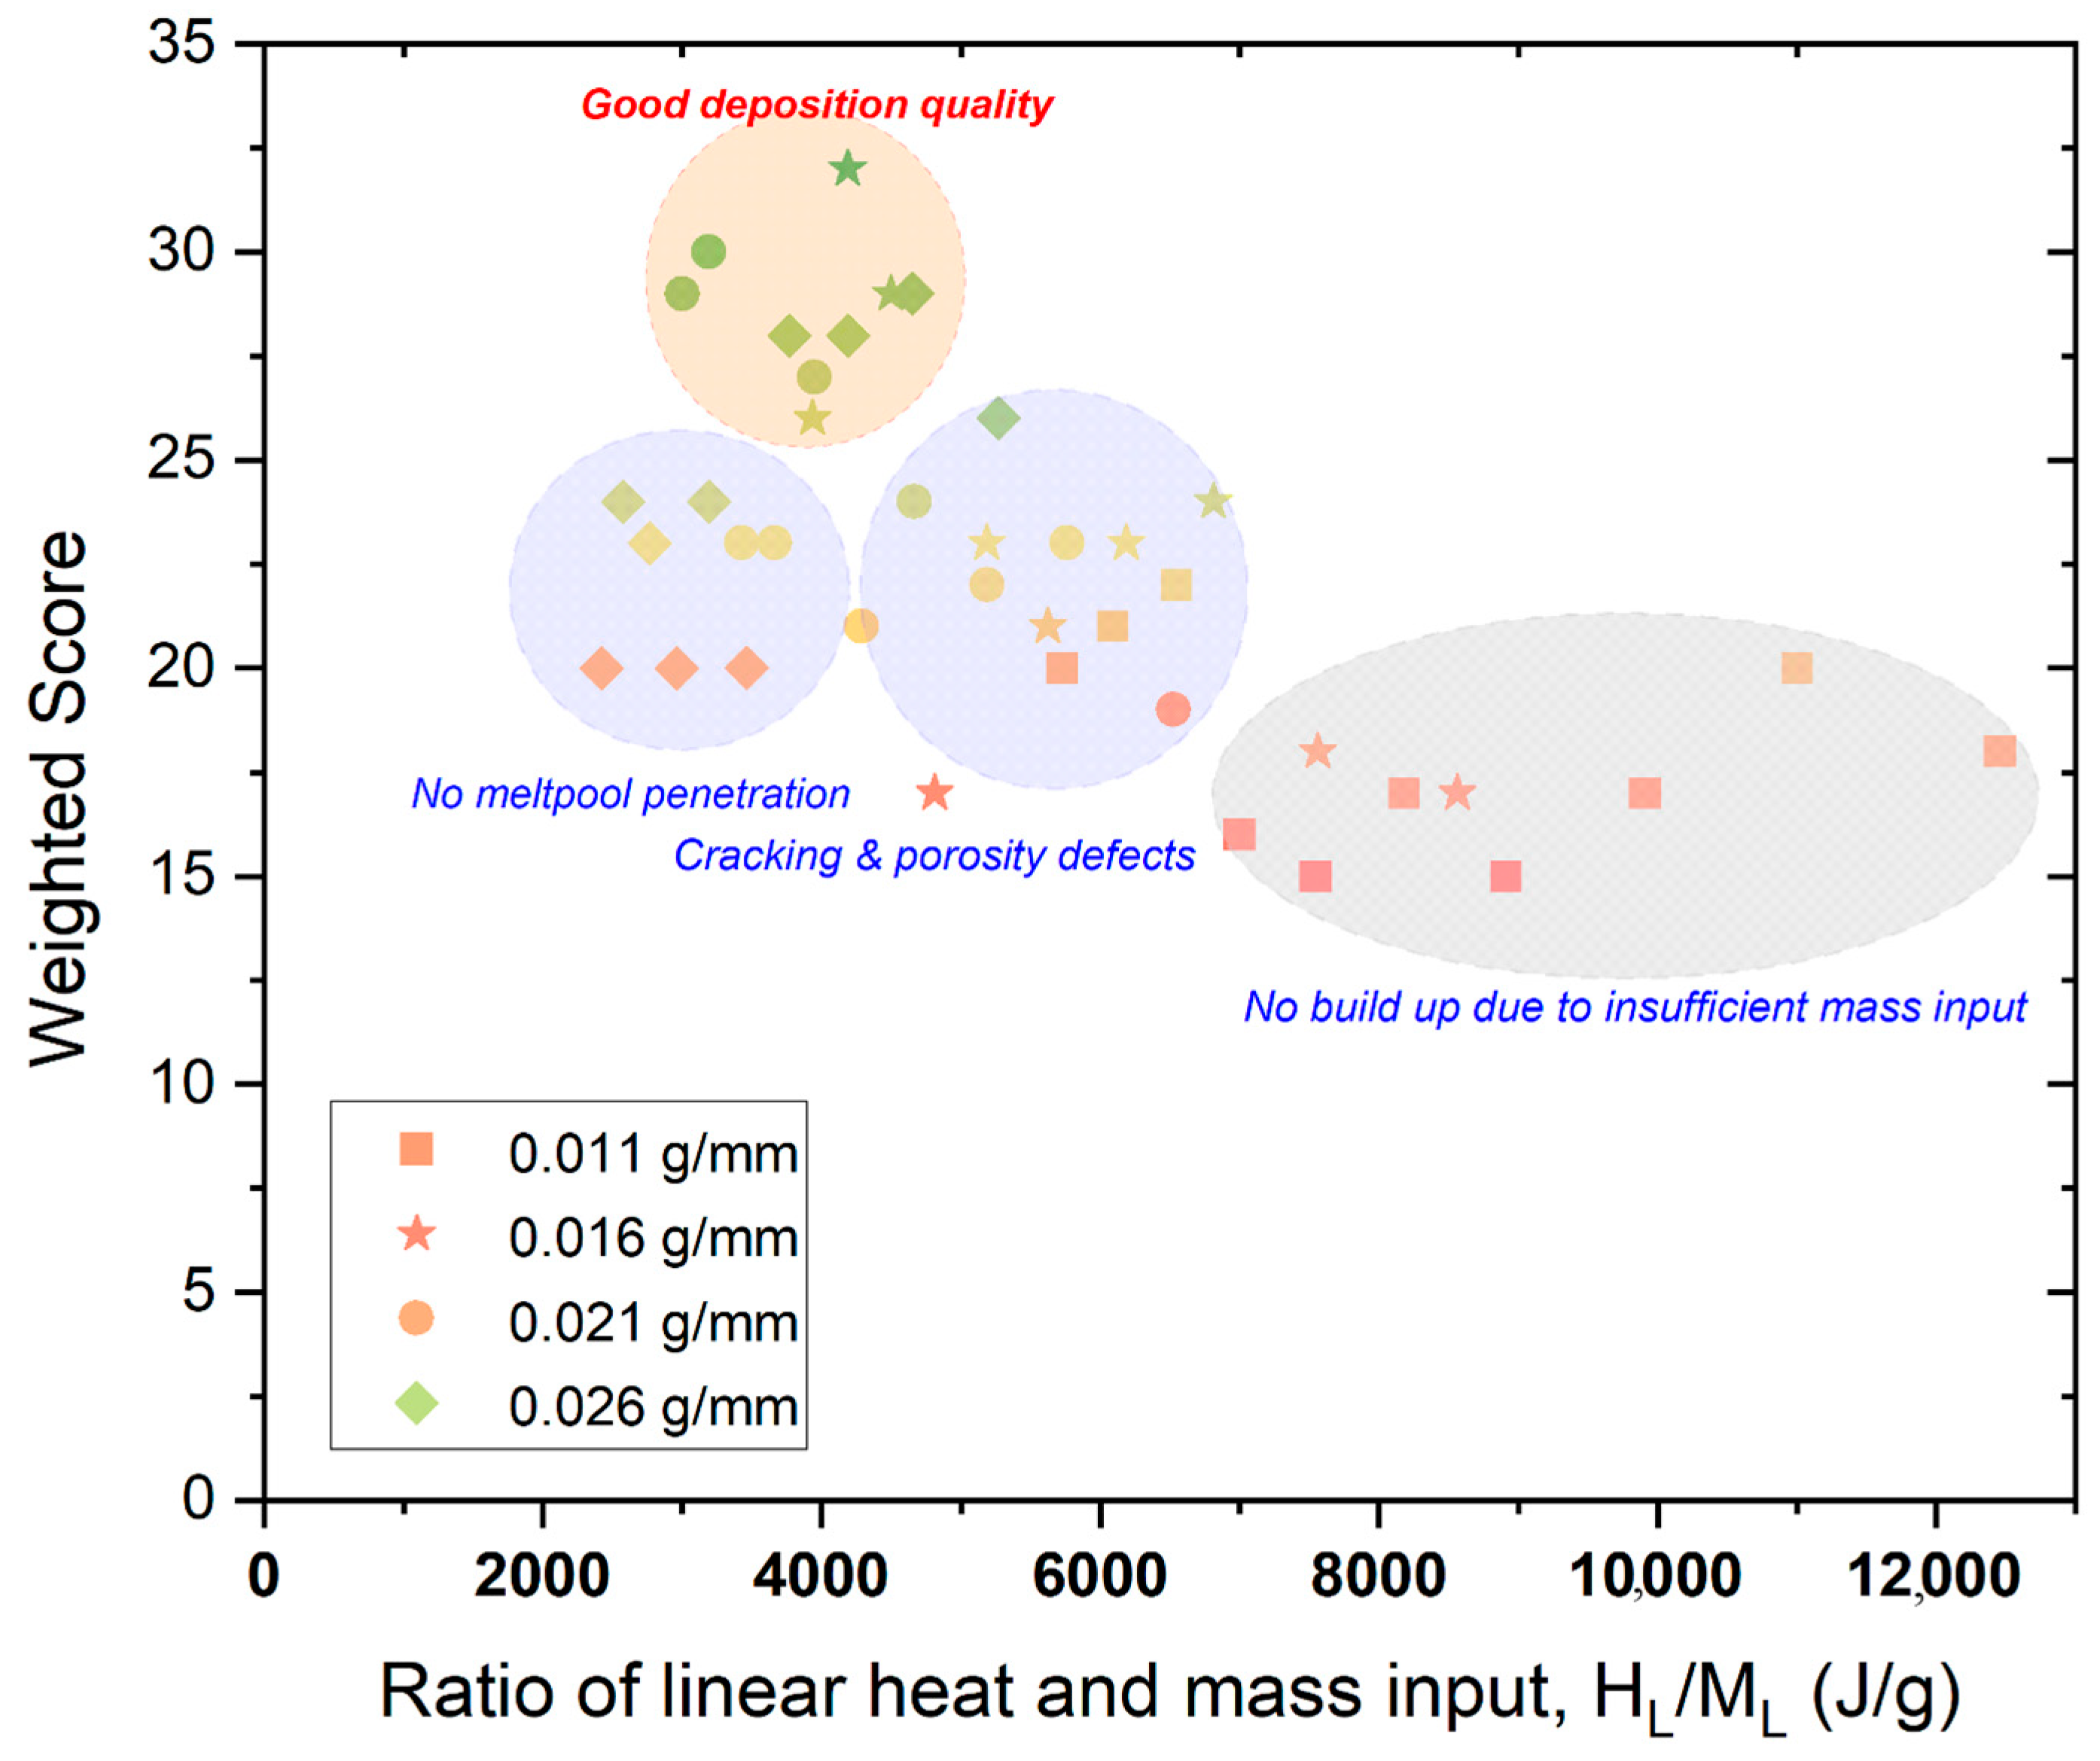
Figure 7 illustrates the total weighted score of the specimens as a function of the energy-to-mass ratio (H
L/M
L) during deposition. Within the explored parameter space, the optimal processing conditions are identified as H
L < 70 J/mm with M
L in the range of ~0.016–0.021 g/mm and 98 J/mm < H
L < 137 J/mm for M
L = 0.026 g/mm (highlighted in
Table 3 and
Figure 7 in green). These conditions correspond to an energy-to-mass ratio of ~4000 ± 500 kJ/g for 65Cu-35Ni powder.
This analysis underscores the critical role of HL and ML optimization in achieving uniform deposition, minimizing defects, and ensuring strong metallurgical bonding between the deposit and substrate. While qualitative, this structured, data-driven approach to process optimization reduces reliance on trial-and-error experimentation, enabling a more systematic and efficient selection of HL and ML conditions for fabricating high-quality Cu-Ni single-track specimens via L-DED.
4. Conclusions
The growing urgency of transitioning to sustainable energy systems has accelerated the development of advanced technologies such as TE materials, which can enhance energy efficiency without the need for batteries or grid infrastructure. In particular, Cu-Ni alloys have emerged as promising candidates for TE applications, especially in niche areas where power density and thermal stability are critical, such as waste heat recovery from solar sources and hot-spot cooling in electronic devices. However, optimizing their TE performance requires overcoming challenges related to low thermal conductivity and fine-tuning their microstructural properties.
This study focuses on the AM of Cu-Ni alloys using laser powder-directed energy deposition (L-DED), which allows for precise control over the deposition process and microstructure. Results indicate that ML and HL significantly influence the deposition quality and microstructural integrity of Cu-Ni alloys fabricated via laser powder-directed energy deposition (L-DED). ML strongly correlates with deposition height and material distribution. Low ML leads to insufficient material deposition and hot cracking, while high ML results in excessive buildup and poor fusion due to incomplete Ni melting. Similarly, HL governs energy distribution and melt pool dynamics, where inadequate HL causes poor mixing and Ni losses, whereas excessive HL promotes solidification cracking and porosity formation due to Cu vaporization. To identify optimal process conditions, we developed a weighted qualitative decision matrix that systematically evaluates six key deposition attributes. Within the explored parameter space, the most favorable conditions were found at HL < 70 J/mm for ML values of ~0.016–0.021 g/mm, and at HL between 98 and 137 J/mm for ML = 0.026 g/mm. These regions correspond to an energy-to-mass ratio of approximately 4000 ± 500 kJ/g, a balance point that minimizes defects while promoting uniform deposition, reducing material segregation, and enhancing structural integrity.
These findings are consistent with prior studies on Cu-Ni additive manufacturing, such as those by Yadav et al. [
14] and Karnati et al. [
15,
16], which reported challenges including process-induced segregation, incomplete alloying, and geometric variability during laser-based deposition. However, unlike these earlier works that primarily relied on empirical or qualitative observations, our study advances the field by introducing a structured, quantitative process–structure–property framework. A streamlined weighted decision matrix enables systematic evaluation of multiple deposition metrics, significantly reducing reliance on trial-and-error experimentation. Furthermore, the integration of advanced microstructural characterization techniques—SEM for assessing geometry and defects, and EDS and EBSD for evaluating compositional uniformity and grain morphology—provides a comprehensive understanding of the interplay between thermal input, powder behavior, and final deposit quality. This methodology lays a foundation for predictive process modeling in the additive manufacturing of thermoelectric alloys.
A key validation of this framework is the observed onset of nickel inclusions under high M
L and low H
L conditions, attributed to the incomplete melting of Ni due to its significantly higher melting point compared to Cu. This observation is consistent with earlier findings by Li et al. [
18], who reported compositional inhomogeneity and segregation in L-DED-processed Cu
65Ni
35 alloys. Our EDS and EBSD analyses further confirm these results, revealing that the unmelted inclusions closely match the size of the original Ni feedstock particles. This strongly underscores the importance of precise thermal energy input to ensure complete melting, homogeneous mixing, and optimal microstructural integrity in additively manufactured Cu-Ni alloys.
Ultimately, the experimental data from single-track depositions serve as a baseline for developing process maps to guide the multi-track and multi-layer deposition processes. These maps will help identify and minimize defects like porosity and uneven material deposition, leading to more efficient Cu-Ni alloy fabrication. In the long term, the data from this study will inform the development of numerical models for Cu-Ni alloy behavior in larger-scale AM, optimizing process parameters and reducing the need for extensive trial-and-error experimentation. This will enhance the reliability and efficiency of Cu-Ni-based TEs for energy conversion applications.


 ,
, 
