Abstract
Despite the significant economic and environmental advantages of friction stir spot welding (FSSW) and its amazing results in welding similar and dissimilar metals and alloys, some of which were known as unweldable, it has some structural and characteristic defects such as keyhole formation, hook defects, and bond line oxidation. This has prompted researchers to focus on these defects and propose and investigate techniques to treat or compensate for their deteriorating effects on microstructural and mechanical properties under different loading conditions. In this experimental study, sheets of AA6061-T6 aluminum alloy with a thickness of 1.8 mm were employed to investigate the influence of reinforcement by graphene nanoplatelets (GNPs) with lateral sizes of 1–10 µm and thicknesses of 3–9 nm on the static and fatigue behavior of FSSW lap joints. The welding process was carried out with constant, predetermined welding parameters and a constant amount of nanofiller throughout the experiment. Cross-sections of as-welded specimens were tested by optical microscope (OM) and energy-dispersive spectroscopy (EDS) to ensure the incorporation of the nanographene into the matrix of the base alloy by measuring the weight percentage (wt.%) of carbon. Microhardness and tensile tests revealed a significant improvement in both tensile shear strength and micro-Vickers hardness due to the reinforcement process. The fatigue behavior of the GNP-reinforced FSSW specimens was evaluated under low and high cycle fatigue conditions. The reinforcement process had a detrimental effect on the fatigue life of the joints under cyclic loading conditions. The microstructural analysis and examinations conducted during this study revealed that this reduction in fatigue strength is attributed to the agglomeration of GNPs at the grain boundaries of the aluminum matrix, leading to porosity in the stir zone (SZ), the formation of continuous brittle phases, and a transition in the fracture mechanism from ductile to brittle. The experimental results, including fracture modes, are presented and thoroughly discussed.
1. Introduction
The friction stir spot welding technique (FSSW) is a novel derivative of friction stir welding (FSW). Both techniques are solid-state joining techniques that have been successfully employed for welding lightweight metals and alloys [1]. In the FSSW process, a rotating welding tool with two main features, a pin, and a shoulder, penetrates the upper sheet of the workpiece to a specific depth in the lower sheet. After completing the process, leaving a characteristic feature known as a “keyhole” [2]. Figure 1 schematically illustrates the FSSW welding process and highlights its three main stages: plunging, stirring, and retracting, labeled as A, B, and C, respectively. The joint formation relies on frictional heat generation, which softens the material; material flow induced by the rotating tool pin; and the forging action applied by both the tool pin and shoulder [3,4]. The strength of FSSW welds is mainly determined by the strain hardening achieved during the process and the thickness of the weld nugget [3,5,6]. A typical FSSW weld microstructure consists of four distinct neighboring zones formed due to the combined effect of heat and plastic deformation: the stir zone (SZ), which is formed around the keyhole and exhibits a fine-grained structure with a uniform distribution of precipitates; the thermomechanically affected zone (TMAZ), characterized by coarser grains compared to the SZ; the heat-affected zone (HAZ), which is influenced only by frictional heat and shows larger grains than the base metal (BM); and the base metal itself, which remains unaltered [3,7,8].
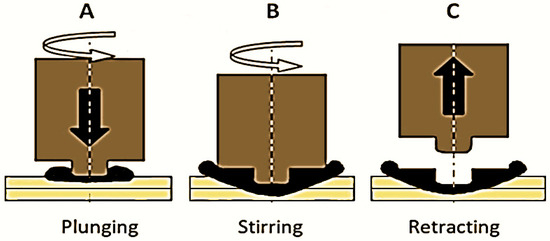
Figure 1.
Schematic of the FSSW welding process illustrating the main three stages: A plunging; B stirring; and C retracting.
Designers and researchers are constantly striving to enhance the performance of FSSW joints under various operating and loading conditions. These improvements are typically achieved by optimizing welding parameters [4,9], modifying the geometry of the welding tool [3,6], or implementing external additions, such as the keyhole refilling technique [2]. In this context, an experimental study recently conducted by our research team (Alkhafaji et al. [10]) investigated an innovative technique that employs an inert argon gas cover to inhibit or reduce bond-line oxidation during the FSSW welding process. The study concluded with a considerable improvement in the purity of the weld zone from oxides, in addition to a significant increase in both static and fatigue strength under static and cyclic loading conditions, respectively.
With the advent of nanotechnology and composite materials, researchers have explored the incorporation of metallic nanocomposites to develop materials with higher durability while maintaining a low weight. This effort aims to improve the strength-to-weight ratio, making such materials ideal for many industrial applications. In particular, the use of nanocomposites in the transportation sector holds promise for reducing fuel consumption in vehicles and mitigating the environmental impact of hydrocarbon fuel exhaust emissions.
Metal matrix nanocomposites (MMNCs) have been extensively studied, with various reinforcement techniques, matrix materials, and different nanofiller ratios explored to enhance their properties. Manoharan et al. [11] compared stir casting and powder metallurgy approaches in the fabrication of MMNCs using a 6063 aluminum matrix reinforced with different percentages of graphite and graphene. Their work highlighted the mechanical property improvements achieved by each method, along with their respective advantages and limitations. Similarly, Asadollahi and Khalkhali [12] conducted a parametric study on the influence of FSSW process parameters on nano-reinforcement efficiency. They fabricated their optimal 3 mm thick AA6061-T6 sample reinforced by SiC nanoparticles at a tool speed of 1500 rpm and a dwell time of 30 s. In another study, Venkatesan and Xavior [13] successfully produced aluminum matrix nanocomposites (AMCs) using a combination of stir and squeeze casting. Their result showed significant mechanical property enhancements at an optimal graphene addition of 0.3 wt%. Morisada et al. [14] employed friction stir processing (FSP) to integrate multi-walled carbon nanotubes (MWCNTs) into an AZ31 magnesium matrix, achieving a remarkable microhardness of 78 HV compared to 41 HV measured in the unreinforced matrix. Additionally, Suresh et al. [15] investigated the effect of SiC fillers, comparing micro- and nano-sized particles on the mechanical properties of FSSW joints of 5083 aluminum alloy. They reported improvements of 29.3% in tensile shear strength, 23.3% in hardness, and 26.3% in wear resistance with nano-sized SiC reinforcement.
Recently, graphene nanoplatelets (GNPs) have gained significant attention as a promising nanofiller in fabricating metal matrix nanocomposites (MMNCs) due to their significant effect in enhancing mechanical properties, especially for aluminum-based nanocomposites [16,17]. However, GNPs may result in potentially harmful and undesirable consequences by reducing the interfacial bonding and the plasticity of the friction stir spot-welded lap joints of aluminum [18]. Sharma et al. [19] successfully incorporated GNPs into bulk aluminum matrices using FSP, achieving notable increases in hardness despite a slight reduction in tensile strength. They reported that the tool pin stirring effect, along with the material flow, significantly influences the microstructural characterization during the friction stir alloying process (FSA) due to the imposition of severe plastic deformation on the material in the treated area, in addition to stirring and frictional heat input [19]. It should be noted that the predominant role of the process parameters and tool geometry is on the frictional heat input and material flow during the FSP, as well as their subsequent influence on mechanical properties and microstructure [3,4,10].
This study aims to develop nano-reinforced joints through the application of localized friction stir processing (FSP) within the FSSW process. While limited previous studies have touched upon the incorporation of nano-reinforcements in FSSW, as documented in references [12,15,20], especially with utilizing GNPs [18], the present study delves into this concept further through investigating diverse nanofiller, with a particular emphasis on GNPs owing to their distinctive characteristics. In addition to studying the effect of reinforcement on hardness and tensile strength under static loading scenarios, the present work investigated the effect of reinforcement on fatigue behavior under low and high cycle fatigue conditions as a novel contribution to the field, as previous research lacks comprehensive coverage of fatigue behavior particularly in FSSW along with the utilization of GNPs as a nano-reinforcement material.
2. Materials and Methods
AA6061-T6 sheets (produced by Sanghvi Metal Corporation, Mumbai, Maharashtra, India) with a thickness of 1.8 mm were used to prepare the FSSW lap-shear specimens. The nominal chemical composition of the alloy (wt.%) is 0.54 Si, 0.46 FE, 0.32 Cu, 0.07 Mn, 0.69 Mg, 0.09 Zn, 0.20 Cr, and 0.05 Ti, with the balance being Al [9]. For the reinforced specimens, GNPs from the Sixth Element (Changzhou) Materials Technology Co., Ltd. (Changzhou, China) with lateral sizes of 1–10 µm and thicknesses of 3–9 nm were used as a nano-reinforcement material in this study. As-received GNPs are shown in FE-SEM image in Figure 2. Figure 3 shows a schematic of the welding tool, which was made from AISI H13 tool steel and then heat-treated to achieve a hardness of 50–52 HRC. The tool was machined to reach a shoulder diameter of 12 mm, pin diameter of 5 mm, pin length of 2.6 mm, and shoulder tilt angle of 6°. The lap-shear specimens were prepared with dimensions of 100 mm × 30 mm and an overlapped area of 30 mm × 30 mm, as shown in Figure 4. The sheets were cut parallel to the rolling direction in order to maintain consistent loading direction during testing [6]. To ensure precise alignment, spacers were placed at both ends of the specimens, and all joints were performed at the center of the overlap area. For the GNP-reinforced specimens, a guide hole that was 1.5 mm in diameter and 2.5 mm in depth was made at the center of the overlap area of each specimen. The resulting holes were then completely filled with GNPs before performing the FSSW process [12,15,20]. Schematic Figure 5 depicts the overlap area of the FSSW specimens and shows the nanofiller addition required to the proposed nano-reinforcement.
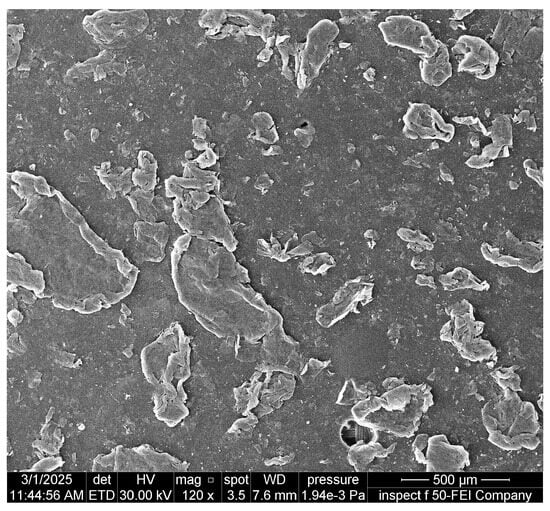
Figure 2.
FE-SEM image of an as-received GNP.
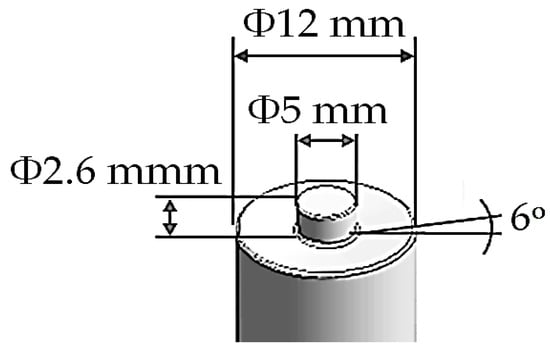
Figure 3.
Schematic illustration of the FSSW welding tool geometry.
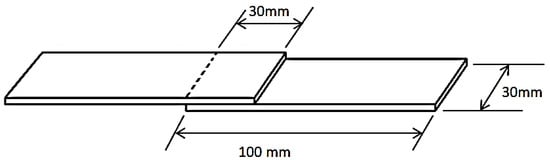
Figure 4.
Schematic of the FSSW lap-shear specimen’s geometry.
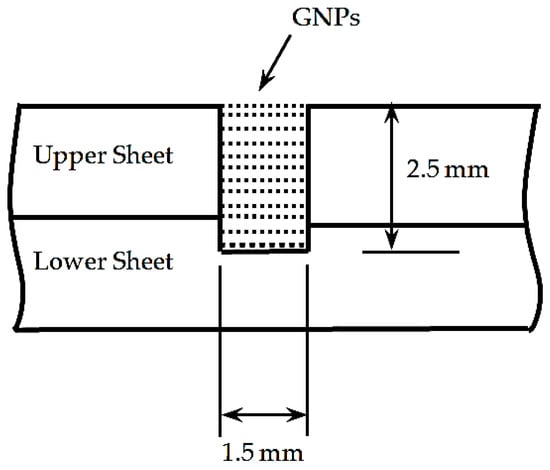
Figure 5.
Schematic illustration of the GNPs’ addition to the FSSW lap-shear specimens.
Taguchi method was employed to evaluate a set of the most influential welding process parameters, which were maintained throughout the entire experimental work in order to neutralize their influence on the results and to focus on the effect of the GNP reinforcement and its potential improvement in both the static and fatigue strength [12]. During this method, three test levels were dependent on four welding variables. The tool was operated at a rotational speed of 600 rpm, with a dwell time of 16 s, a pin penetration depth of 0.3 mm, and a penetration rate of 10 mm per minute.
It is worth noting that detailed investigation regarding the effect of welding process parameters on the mechanical properties and the microstructure of the FSSW lap-shear specimens has been conducted by the same research team [3,4].
The welding processes were conducted to produce two groups of specimens: one welded with nano-reinforcement and another without nano-reinforcement, namely process 1 and process 2, respectively. Table 1 summarizes the tests performed for each set of samples, including the number of specimens tested for each condition and the total number of specimens welded and examined in this study.

Table 1.
Tests and the number of specimens for each welding process.
Before welding, the aluminum sheets were thoroughly cleaned with acetone to remove any potential impurities.
Tensile tests were conducted using the MST 809 Axial/Torsional Test System. The tests were repeated and averaged over three specimens for each welding condition to determine the tensile shear fracture strength (TSFS). Specimens from both welding conditions were prepared to observe the microstructure and to examine the micro-Vickers hardness. The microstructural analysis was performed on cross-sections of the welded joints. These sections were prepared through a multi-step process: gradual wet grinding with silicon carbide emery paper of increasing grit size; cleaning with alcohol; drying; and, finally, etching using Keller’s reagent solution [21].
Micro-Vickers hardness testing was carried out on the cross-sections using a CV-400DM Vickers hardness testing device. Measurements were taken at the mid-thickness of the upper sheet with a testing interval of 0.5 mm. The testing conditions included a load of 0.3 kgf and a dwell time of 15 s, ensuring consistent and accurate hardness evaluations across the welds. Specimens that showed extreme or unrealistic microhardness results were excluded and the average values of the results of the other specimens for both welding conditions were adopted.
The MST 809 Axial/Torsional Test System was used to conduct fatigue tests under cyclic loading conditions for FSSW specimens from both welding conditions. The tests were performed at a sinusoidal load ratio (R = 0.1) and a frequency of 10 Hz [7,22,23,24,25,26]. In order to establish a comparison reference, the average TSFS of the conventional FSSW specimens was used as a baseline. Fatigue tests were then conducted, and results were evaluated at 70% and 40% of the average TSFS of the conventional process to determine the applied load ranges and the number of cycles to failure (Nf) for low and high cycle fatigue, respectively [10,25]. The results from three specimens were averaged to calculate the Nf value at each load range for both welding conditions [22,24,25,27]. In order to observe fatigue cracks initiation and propagation, the fatigue test was stopped at 0.75% of the Nf of that of the fully failed specimens at each load level in both welding conditions, and partially failed specimens were cross-sectioned, prepared, and examined [10,25,28]. For simplicity in this study, a fatigue life of 1 × 10⁴ cycles was adopted as the threshold between low and high cycle fatigue.
3. Results and Discussion
3.1. Micrograph
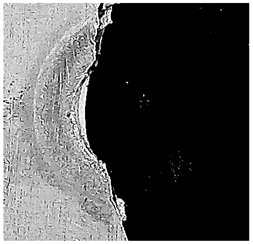
A computerized optical microscope (OM), Leica DM6 M, in addition to a scanning electron microscope, Axia ChemiSEM (SEM), involving energy-dispersive spectroscopy (EDS), were used to examine the cross-sections of as-welded specimens from both welding conditions. Figure 6a shows an optical micrograph of the cross-section of a conventional FSSW specimen. The figure highlights typical features of an FSSW joint, including the keyhole surrounded by the SZ, TMAZ, HAZ, and BM. Additionally, a hook defect is visible in region I, extending from the specimen interface. Figure 6b presents a magnified view of region I, where the hook crack is clearly seen. This defect is considered a critical site for crack initiation and propagation under both static and cyclic loading conditions, potentially leading to static or fatigue failure, respectively.
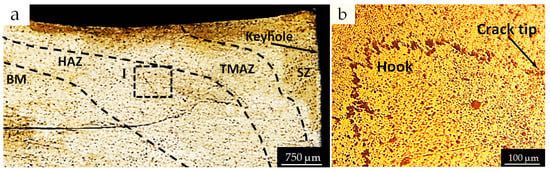
Figure 6.
Optical micrograph of a performed conventional specimen: (a) overview of the specimen cross-section with the FSSW weld features; (b) magnified view of the hook crack of region I of (a).
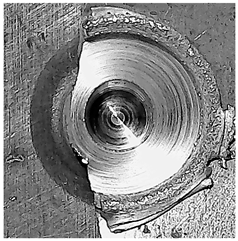
Figure 7a shows an optical micrograph of the cross-section of a GNP-reinforced specimen, while Figure 7b provides a magnified view of region I from Figure 7a. The figure shows that the hook defect is filled and surrounded by small agglomerations of GNPs due to the reduced stirring effect away from the tool pin during the welding process. In region II of Figure 7a, magnified in Figure 7c, larger and continuous GNP agglomerations are observed embedded within the weld joint. The figure also shows a gradual distribution of GNPs, which varies depending on the stirring intensity and is correlated with the distance from the tool pin during the welding process.
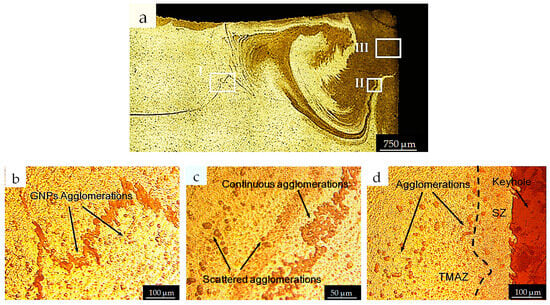
Figure 7.
Optical micrograph of a GNP-reinforced specimen: (a) overview of the specimen cross-section with the FSSW weld features; (b) magnified view of the hook crack; (c) GNPs’ continuous agglomeration; (d) grain refinement of SZ.
Despite the enhanced grain refinement achieved by GNP reinforcement in the SZ, some GNPs were detected in the TMAZ, as shown in Figure 7d. Previous studies have identified GNP agglomeration as a detrimental phenomenon that can alter the material behavior from ductile to brittle, significantly reducing both static and fatigue strength [21,29,30].
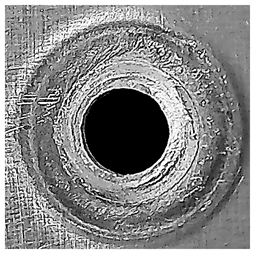
Figure 8a,b show SEM micrographs of the cross-sections of as-welded conventional and GNP-reinforced FSSW specimens, respectively. The square-marked areas in the micrographs were analyzed using EDS to confirm the incorporation of GNPs into the aluminum matrix by measuring the carbon content in terms of weight percentage (wt.%). Table 2 summarizes the quantitative results of the EDS analysis for regions A–H and A’–H’ marked in Figure 8a and Figure 8b, respectively. The EDS analysis revealed that the GNPs are successfully incorporated into the AA6061-T6 matrix with a nearly homogeneous distribution in the SZ. However, some fluctuations were observed, which were attributed to GNP agglomeration formation and the different stirring effects within the joint.
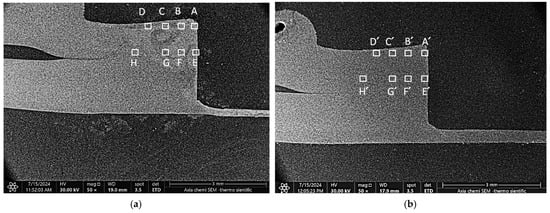
Figure 8.
SEM micrographs of FSSW joint cross-section from the (a) GNP-reinforced process and (b) conventional process.
An extreme carbon content of 19.9% and 16.8% was observed in regions A and G, respectively, which is attributed to the clustered GNPs. While slight differences in the carbon content were recorded in other regions, they were associated with minor differences in the stirring effect in the joint induced by the tool pin during welding.
On the other hand, the EDS quantification showed only minor carbon percentages in some regions of the specimen of the conventional welding process (A’–F’ in Figure 8b) out of the chemical composition of the AA6061-T6 base alloy. This carbon content is attributed to the potential contamination with residual hydrocarbons of the metallographic preparation procedures.
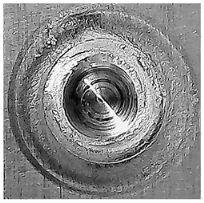
Figure 9a depicts an FE-SEM macrograph of the cross-section of the GNP-reinforced specimen, including deeply examined regions I and II, which were selected to observe and characterize the GNP distribution within the joint matrix. Figure 9b shows the FE-SEM micrograph of a close-up view of region I marked in Figure 9a. The figure visualizes continuous GNP agglomerations in a continuous series of cavities, which constitute potential locations of cracks under both static and cyclic loading conditions.
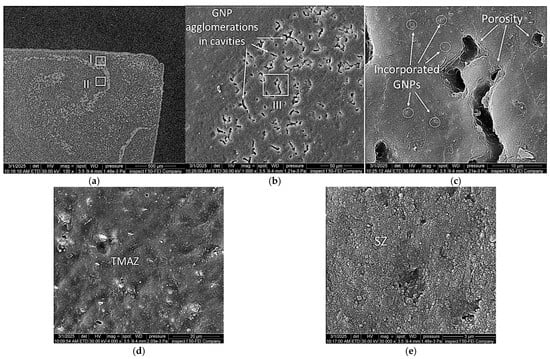
Figure 9.
FE-SEM micrograph of the GNP-reinforced specimen: (a) specimen cross-section including deeply examined regions; (b) magnified view of region I marked in (a) shows the GNP agglomerations; (c) magnified view of region III marked in (b) shows porosity and incorporated GNPs in the SZ; (d) magnified view of the TMAZ; and (e) magnified view of the SZ, marked II in (a).
These agglomerations justify changing the fracture of the reinforced specimens from a ductile to a brittle nature, which significantly affects the fatigue strength of the specimens [21,29,30]. FE-SEM micrograph of Figure 9c shows a close-up view of region III marked in Figure 9b. The figure illustrates incorporated and uniformly distributed GNPs within the SZ, in addition to agglomerations of GNP, which resulted in cavities and porosity that are typical locations of stress intensity and, accordingly, cracks initiation and propagation under different operating and loading conditions despite the improvement in structural integrity achieved by incorporated and uniformly distributed GNPs. Figure 9d,e show magnified views of the TMAZ and SZ, respectively. An obvious grain refinement and uniform distribution of precipitates is observed in the SZ compared to lower grain refinement and coarse and non-uniformly distributed precipitates in the TMAZ. This behavior is attributed to a combined effect of the severe material flow and incorporation of the GNPs in the grain boundaries in the SZ compared to the TMAZ.
3.2. Microhrdness and Tensile Strength
The hardness test is usually performed for the entire cross-section of FSSW specimens. However, researchers often represent results from only one side of the cross-section of the specimen due to the nearly symmetric hardness distribution profile commonly observed [12,31,32,33]. Figure 10 illustrates the hardness test results for one side of the cross-section in specimens welded under conventional conditions and with nano-reinforcement. Both kinds of specimens exhibited typical hardness distribution profiles. The SZs exhibited higher hardness values due to severe plastic deformation induced by the welding tool pin at full dynamic recrystallization achieved by the frictional heat input in these regions, while a sharp decrease was observed in the TMAZs, which experienced lower plastic deformation, and accordingly, lower grain refinement. On the other hand, a gradual hardness decrease can be observed in HAZs compared to the BM as a result of heat exposure and the associated grain coarsening [2,4,23,34,35]. Notably, the nano-reinforced specimen displayed higher hardness values in both the SZ and TMAZ compared to the conventional specimen, with an average hardness increase of 18.8% in the SZ. This hardness improvement is attributed to grain refinement achieved through the incorporation of the GNPs, which are located in the grain boundaries and inhibit grain growth [11,12,13,14,15,18].
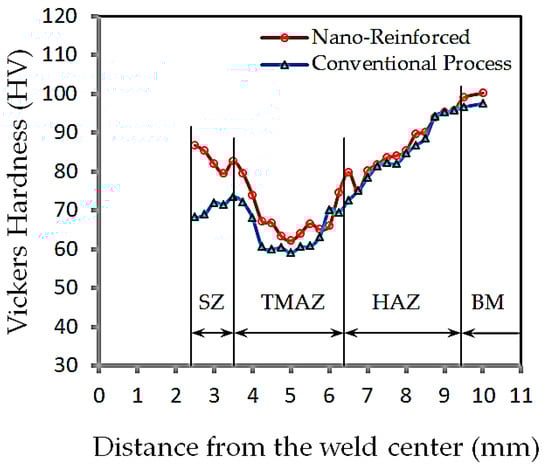
Figure 10.
The Vickers hardness distribution profile for cross-sectioned specimens performed by the conventional process and with the GNP reinforcement.
The tensile test results revealed that the GNP-reinforced welds demonstrated a significantly higher TSFS compared to the conventional welds, with mean values of 4650 N and 3750 N, respectively. Figure 11a,b show load–elongation curves obtained during the tensile test for the conventional and the GNP-reinforced welding conditions, respectively. The TSFS is considered the average of three maximum values of the load–displacement curves for each welding condition.
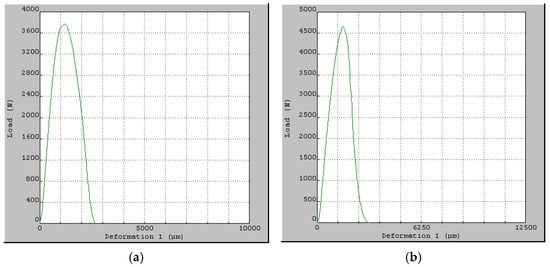
Figure 11.
Load–elongation curves of the tensile test: (a) conventional FSSW specimen; (b) GNP-reinforced specimen.
Table 3 contains the average tensile strength values for both welding conditions. The table shows an approximately 24% increase in TSFS achieved by the GNP reinforcement during the FSSW process, which is attributed to grain refinement achieved by the GNP incorporation within the grain boundaries and inhibited grain growth in the SZ [11,12,13,14,15,18].
Table 3.
Average tensile test results for conventional and GNP-reinforced FSSW specimens.
3.3. Fatigue Strength and Failure Modes
Figure 12 shows the fatigue test results obtained for both welding conditions, tested at load ranges of 2625 N and 1500 N for low and high cycle fatigue, respectively. The fatigue test was halted at specific stages, and partially failed specimens from each welding condition were then cross-sectioned, ground, polished, and etched to observe fatigue crack initiation and propagation under cyclic loading conditions [25,26].
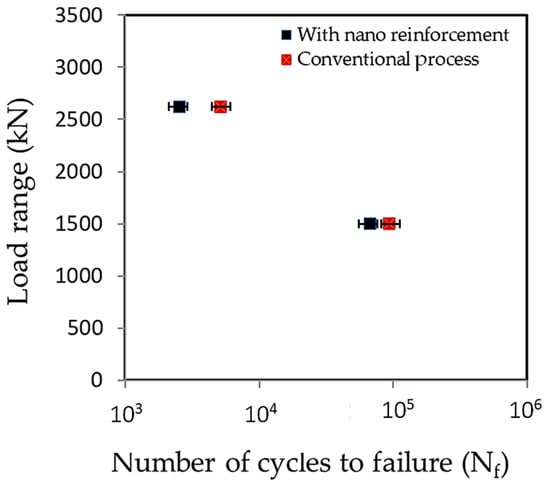
Figure 12.
Fatigue test results representing the relationship between the load range and the number of cycles to failure for specimens of the conventional and the GNP-reinforced welding processes.
The figure shows that the conventional FSSW specimens exhibited higher fatigue life in both low and high cycle fatigue conditions compared to the nano-reinforced specimens. This behavior can be attributed to the increased brittleness associated with the hardness improvement achieved by adding the nanomaterial to the AA6061-T6 matrix, as well as the existing brittle phases inherent in this alloy due to its T6 artificial aging treatment [36]. These findings are consistent with previous studies on the fatigue behavior of MMNCs. Vaghari et al. [37] reported that, although incorporating Al2O3 into pure aluminum matrices enhanced micro-hardness and tensile strength, a nanoparticle content equal to or exceeding 8 wt.% adversely affected fatigue performance due to filler agglomeration and the formation of continuous brittle phases. Similarly, Chen et al. [30] attributed the negative effect of GNPs on fatigue behavior to graphene-related issues, such as severe agglomeration, poor interfacial bonding, and weak structural integrity. Dadkhah et al. [29] observed that increasing graphene content led to porosity defects caused by agglomerate formation, which subsequently deteriorated mechanical properties. Additionally, Du et al. [21] reported that exceeding 1.0 wt.% GNP content resulted in graphene agglomeration, leading to a transition in fracture behavior from ductile to brittle. Table 4 and Table 5 summarize the load ranges, fracture surface characteristics of the upper and lower sheets, and failure modes observed for both welding conditions. Under low cycle fatigue conditions, specimens from both welding conditions failed via the shear failure mode. Conversely, during high cycle fatigue, upper sheet transverse fracture and circumferential failure modes were observed in the conventional and GNP-reinforced specimens, respectively.
Table 4.
Load ranges, fractured surfaces, and failure modes of the FSSW specimens of the conventional process.
Table 5.
Load ranges, fractured surfaces, and failure modes of the FSSW specimens with nano-reinforcement.
It is worth mentioning that a general overview of stress concentration and fatigue crack initiation and propagation was extensively detailed and visualized by schematic micrograph figures in a previous study [10] conducted by the same research team of the present work. Six load levels for each welding condition covered the low and high cycle fatigue conditions were investigated, which exhibited different failure modes depending on the loading conditions and favorable stress conditions.
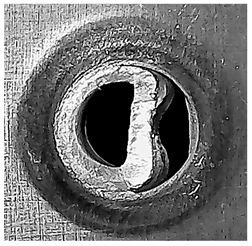
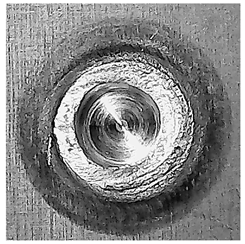
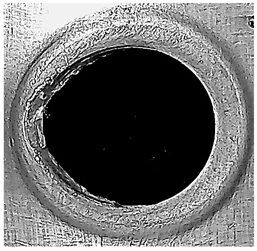
Figure 13a,b show micrographs of cross-sectioned partially and fully fractured specimens from the conventional welding process, which experienced 3.85 × 10³ and 5.14 × 10³ cycles under the same cyclic load of 2625 N, respectively. The bold white arrows on the specimen legs indicate the direction of the applied cyclic load. Fatigue cracks initiate, propagate, and transform into shear cracks depending on the favorable stress conditions [7,23,25,26,28]. Fatigue cracks Cr1 and Cr2 originated from the joint interfacial hook crack tips. Cr1 propagated a short distance along the joint interface under the influence of the fluctuating load before slightly expanding through the top coupon until point A. Subsequently, Cr1 transitioned into a shear crack SC1, which propagated in a circular path through the SZ, ultimately resulting in a shear fracture at point B. The corresponding upper and lower fracture surfaces are displayed in Figure 13c,d, respectively.
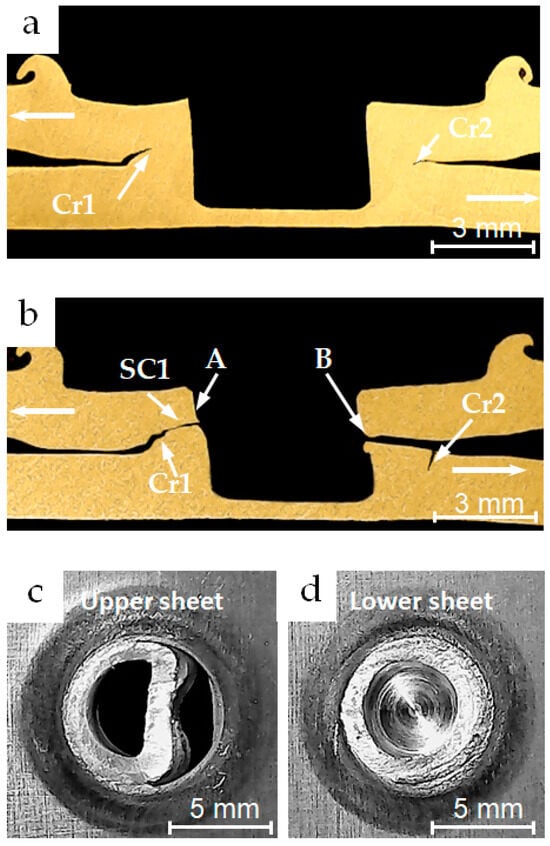
Figure 13.
Optical micrographs of cross-sectioned specimens tested at 2625 N: (a) a partially fractured specimen of the conventional welding process reached a fatigue life of 3.85 × 10³ cycles; (b) a fully fractured conventional specimen reached 5.14 × 10³ cycles; (c,d) the fracture surfaces of the upper and the lower coupons of the fully fractured specimen of (b), respectively.
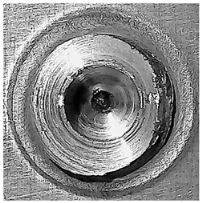
Figure 14a,b illustrate micrographs of cross-sectioned partially and fully fractured specimens from the nano-reinforced welding process, which sustained 5 × 10⁴ and 6.73 × 10⁴ cycles under the same cyclic load of 1500 N, respectively. As in the previous case, bold white arrows on the specimen legs represent the direction of the applied cyclic load. Dominant fatigue cracks Cr1 and Cr2 initiated from the original interfacial crack tip and propagated slightly along the joint interface and through the upper sheet thickness. Cr1 transitioned into a shear crack SC2, which propagated circumferentially around the joint under the influence of the cyclic load and favorable stress conditions, leading to a circumferential failure at point B. The corresponding upper and lower fracture surfaces are shown in Figure 14c,d. Despite a shear crack SC1 and a transverse crack TC1 initiated from the tips of Cr1 and Cr2, propagating through the SZ and the lower sheet thickness, respectively, they did not play a significant role in causing the final fracture, as shown in Figure 14b.
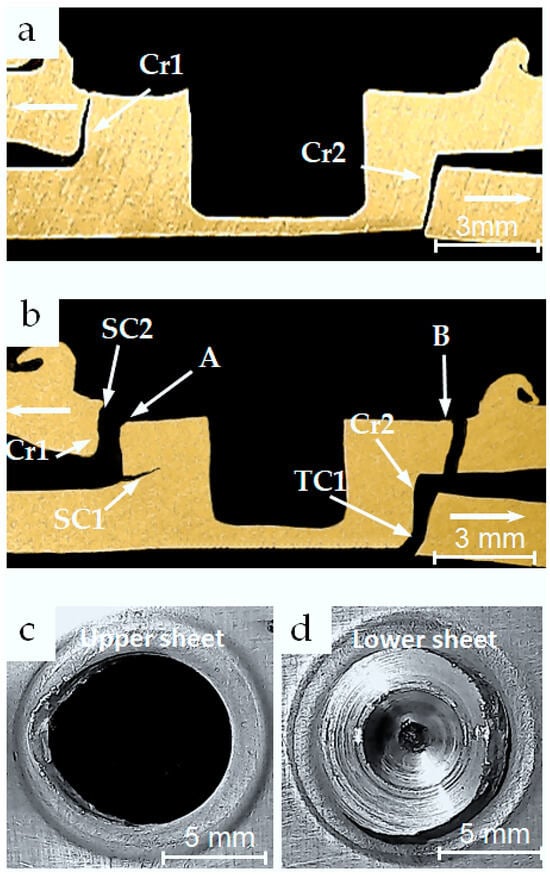
Figure 14.
Optical micrographs of cross-sectioned specimens tested at 1500 N: (a) a partially fractured nano-reinforced specimen reached fatigue life of 5 × 10⁴ cycles; (b) a fully fractured nano-reinforced specimen reached 6.73 × 10⁴ cycles; (c,d) the fracture surfaces of the upper and the lower coupons of the fully fractured specimen of (b), respectively.
4. Conclusions
In this study, the effect of the addition of graphene nanoplatelets (GNPs) on the static and fatigue strengths of AA6061-T6 lap welds was investigated. The nanofiller was introduced into the welds via friction stir processing during the FSSW process. Based on the experimental observations, the following conclusions were reported:
- (1)
- Both conventional and GNP-reinforced FSSW welds were successfully fabricated after several initial welding processes that revealed a set of optimal welding process parameters and guide hole dimensions. The tool was operated at a rotational speed of 600 rpm, with a dwell time of 16 s, a pin penetration depth of 0.35 mm, and a penetration rate of 10 mm per minute. A guide hole of 1.5 mm diameter and 2 mm depth, equivalent to 4.4 mm3, produced the optimal tensile strength;
- (2)
- Energy-dispersive spectroscopy (EDS) analysis confirmed the incorporation of GNPs into the stir zone (SZ) in terms of carbon content (wt%);
- (3)
- Micro-hardness tests revealed a significant increase in hardness along the distribution profile due to the reinforcement of the aluminum matrix by the GNPs;
- (4)
- Vickers hardness and tensile strength were enhanced by approximately 18.8% and 24%, respectively. This improvement is primarily due to the grain refinement induced by GNPs, which inhibited grain growth in the SZ during dynamic recrystallization;
- (5)
- The nano-reinforcement process, however, resulted in a reduction in fatigue strength for the AA6061-T6 FSSW lap-shear specimens. This behavior can be explained by the agglomeration of GNPs, which caused porosity defects within the grain boundaries of the base metal matrix and the formation of continuous brittle phases that changed the fracture nature from ductile to brittle in addition to the already existing brittle phases in the AA6061-T6 due to the artificial aging tempering technique (T6);
- (6)
- Fatigue tests revealed a shear fracture mode under low cycle fatigue conditions for both welding processes. In high cycle fatigue conditions, conventional welds exhibited an upper sheet transverse fracture mode, whereas GNP-reinforced welds showed a circumferential failure mode;
- (7)
- The improvement in microhardness and tensile strength achieved by the GNP reinforcement of FSSW weld joints is feasible for industrial applications that rely on this welding technology and operate under static loading conditions, while further research is required to utilize nano-reinforcement for applications that are subjected to cyclic loading. Further research is necessary to address the agglomeration phenomenon of the GNPs within the SZ of the AA6061-T6 matrix. Increasing the stirring efficiency is essential to achieve the maximum incorporation of the filler material in the matrix and conquer the cohesion of the GNPs, in addition to reducing the formation of strengthening phases by optimizing the dwell time to prevent the weld from transforming from a ductile to a brittle nature. Furthermore, different volumetric contents of the GNPs can be investigated.
Author Contributions
Conceptualization, A.A., D.C. and H.A.-A.; methodology, A.A. and D.C.; data curation, A.A. and H.A.-A.; investigation, A.A. and D.C.; writing—original draft preparation, A.A.; writing—review and editing, A.A. and D.C.; visualization, A.A. and H.A.-A.; supervision, D.C.; project administration, A.A. and H.A.-A. All authors have read and agreed to the published version of the manuscript.
Funding
This research received no external funding.
Institutional Review Board Statement
Not applicable.
Informed Consent Statement
Not applicable.
Data Availability Statement
Data are contained within the article and can be requested from the corresponding author.
Conflicts of Interest
The authors declare no conflicts of interest.
References
- Cox, C.D. Friction Stir Spot Welding: Engineering Analysis and Design; LAP LAMBERT Academic Publishing: Saarbrucken, Germany, 2014; p. 270. [Google Scholar]
- Yuan, W. Friction Stir Spot Welding of Aluminum Alloys. Master’s Thesis, Missouri University of Science and Technology, Rolla, MO, USA, 2008. [Google Scholar]
- Alkhafaji, A.; Camas, D.; Lopez-Crespo, P.; Al-Asadi, H. The Influence of Tool Geometry on the Mechanical Properties and the Microstructure of AA6061-T6 Aluminum Alloy Friction Stir Spot Welding. Materials 2023, 16, 4135. [Google Scholar] [CrossRef] [PubMed]
- Alkhafaji, A.; Camas, D. Effect of Tool Rotational Speed and Dwell Time on the Joint Strength of Friction Stir Spot Welded AA6061-T6 Sheets. Eng. Proc. 2023, 56, 215. [Google Scholar] [CrossRef]
- Bilici, M.K.; Yükler, A.I. Influence of tool geometry and process parameters on macrostructure and static strength in friction stir spot welded polyethylene sheets. Mater. Des. 2012, 33, 145–152. [Google Scholar] [CrossRef]
- Choi, D.H.; Ahn, B.W.; Lee, C.Y.; Yeon, Y.M.; Song, K. Effect of pin shapes on joint characteristics of friction stir spot welded AA5J32 sheet. Mater. Trans. 2010, 51, 1028–1032. [Google Scholar] [CrossRef]
- Chowdhury, S.H.; Chen, D.L.; Bhole, S.D.; Cao, X.; Wanjara, P. Lap shear strength and fatigue life of friction stir spot welded AZ31 magnesium and 5754 aluminum alloys. Mater. Sci. Eng. A 2012, 556, 500–509. [Google Scholar] [CrossRef]
- Shen, Z.; Yang, X.; Zhang, Z.; Cui, L.; Yin, Y. Mechanical properties and failure mechanisms of friction stir spot welds of AA 6061-T4 sheets. Mater. Des. 2013, 49, 181–191. [Google Scholar] [CrossRef]
- Paidar, M.; Khodabandeh, A.; Najafi, H.; Rouh-aghdam, A.S. Effects of the tool rotational speed and shoulder penetration depth on mechanical properties and failure modes of friction stir spot welds of aluminum 2024-T3 sheets. J. Mech. Sci. Technol. 2014, 28, 4893–4898. [Google Scholar] [CrossRef]
- Alkhafaji, A.; Camas, D.; Al-Asadi, H. Effect of Inert Gas Cover on the Static and Fatigue Behavior of AA6061-T6 Aluminum Alloy Friction Stir Spot Lap-Shear Welds. Materials 2025, 18, 256. [Google Scholar] [CrossRef]
- Del Real Romero, J.C.; Jimenez, J.; Manoharan, R.; Shankar, R.; Joseph, R. Hariharasakthisudan Characterisation of mechanical properties of aluminium composites fabricated by stir-casting and powder metallurgy. Int. J. Mech. Eng. Technol. 2017, 8, 176–189. [Google Scholar]
- Asadollahi, M.; Khalkhali, A. Optimization of mechanical and microstructural properties of friction stir spot welded AA 6061-T6 reinforced with SiC nanoparticles. Mater. Res. Express 2018, 5, 116517. [Google Scholar] [CrossRef]
- Venkatesan, S.; Xavior, M.A. Characterization on aluminum alloy 7050 metal matrix composite reinforced with graphene nanoparticles. Procedia Manuf. 2019, 30, 120–127. [Google Scholar] [CrossRef]
- Morisada, Y.; Fujii, H.; Nagaoka, T.; Fukusumi, M. MWCNTs/AZ31 surface composites fabricated by friction stir processing. Mater. Sci. Eng. A 2006, 419, 344–348. [Google Scholar] [CrossRef]
- Suresh, S.; Natarajan, E.; Franz, G.; Rajesh, S. Differentiation in the SiC Filler Size Effect in the Mechanical and Tribological Properties of Friction-Spot-Welded AA5083-H116 Alloy. Fibers 2022, 10, 109. [Google Scholar] [CrossRef]
- Hu, Z.; Wu, Z.; Luo, S.; Wang, X.; Nian, Q.; Chen, Y.; Nagaumi, H. Large scale production of graphene aluminum composites by stir casting: Process, microstructure and properties. J. Mater. Res. Technol. 2023, 27, 681–691. [Google Scholar] [CrossRef]
- Khodabakhshi, F.; Arab, S.M.; Švec, P.; Gerlich, A.P. Fabrication of a new Al-Mg/graphene nanocomposite by multi-pass friction-stir processing: Dispersion, microstructure, stability, and strengthening. Mater. Charact. 2017, 132, 92–107. [Google Scholar] [CrossRef]
- Mohan, A.E.; Sajuri, Z.; Baghdadi, A.H.; Jamadon, N.H.; Abbasi, M. Influences of graphene nanoplatelet addition and pin lengths on the microstructure and mechanical properties of 7075 aluminum alloy under friction stir spot welding. J. Mater. Res. Technol. 2024, 31, 3436–3452. [Google Scholar] [CrossRef]
- Sharma, A.; Sharma, V.M.; Paul, J. Fabrication of bulk aluminum-graphene nanocomposite through friction stir alloying. J. Compos. Mater. 2020, 54, 45–60. [Google Scholar] [CrossRef]
- Fereiduni, E.; Movahedi, M.; Baghdadchi, A. Ultrahigh-strength friction stir spot welds of aluminium alloy obtained by Fe3O4 nanoparticles. Sci. Technol. Weld. Join. 2018, 23, 63–70. [Google Scholar] [CrossRef]
- Du, X.; Zheng, K.; Liu, F. Microstructure and mechanical properties of graphene-reinforced aluminum-matrix composites. Mater. Tehnol. 2018, 52, 763–768. [Google Scholar] [CrossRef]
- Yapici, G.G.; Ibrahim, I.J. On the fatigue and fracture behavior of keyhole-free friction stir spot welded joints in an aluminum alloy. J. Mater. Res. Technol. 2021, 11, 40–49. [Google Scholar] [CrossRef]
- Shen, Z.; Ding, Y.; Chen, J.; Gerlich, A.P. Comparison of fatigue behavior in Mg/Mg similar and Mg/steel dissimilar refill friction stir spot welds. Int. J. Fatigue 2016, 92, 78–86. [Google Scholar] [CrossRef]
- Shahani, A.R.; Farrahi, A. Effect of Sheet Thickness on Fatigue Behavior of Friction Stir Spot Weld of Al 6061-T6 Lap-shear Configuration. J. Stress Anal. 2018, 3, 61–68. [Google Scholar]
- Tran, V.X.; Pan, J.; Pan, T. Fatigue behavior of aluminum 5754-O and 6111-T4 spot friction welds in lap-shear specimens. Int. J. Fatigue 2008, 30, 2175–2190. [Google Scholar] [CrossRef]
- Venukumar, S.; Yalagi, S.; Muthukumaran, S. Comparison of microstructure and mechanical properties of conventional and refilled friction stir spot welds in AA 6061-T6 using filler plate. Trans. Nonferrous Met. Soc. China 2013, 23, 2833–2842. [Google Scholar] [CrossRef]
- Shahani, A.R.; Farrahi, A. Experimental investigation and numerical modeling of the fatigue crack growth in friction stir spot welding of lap-shear specimen. Int. J. Fatigue 2019, 125, 520–529. [Google Scholar] [CrossRef]
- Tran, V.X.; Pan, J. Fatigue behavior of dissimilar spot friction welds in lap-shear and cross-tension specimens of aluminum and steel sheets. Int. J. Fatigue 2010, 32, 1167–1179. [Google Scholar] [CrossRef]
- Dadkhah, M.; Saboori, A.; Fino, P. An overview of the recent developments in metal matrix nanocomposites reinforced by graphene. Materials 2019, 12, 2823. [Google Scholar] [CrossRef]
- Chen, W.; Yang, T.; Dong, L.; Elmasry, A.; Song, J.; Deng, N.; Elmarakbi, A.; Liu, T.; Lv, H.B.; Fu, Y.Q. Advances in graphene reinforced metal matrix nanocomposites: Mechanisms, processing, modelling, properties and applications. Nanotechnol. Precis. Eng. 2020, 3, 189–210. [Google Scholar] [CrossRef]
- Gerlich, A.; Su, P.; North, T.H. Peak temperatures and microstructures in aluminium and magnesium alloy friction stir spot welds. Sci. Technol. Weld. Join. 2005, 10, 647–652. [Google Scholar] [CrossRef]
- Rao, H.M.; Jordon, J.B.; Barkey, M.E.; Guo, Y.B.; Su, X.; Badarinarayan, H. Influence of structural integrity on fatigue behavior of friction stir spot welded AZ31 Mg alloy. Mater. Sci. Eng. A 2013, 564, 369–380. [Google Scholar] [CrossRef]
- Badarinarayan, H.; Yang, Q.; Zhu, S. Effect of tool geometry on static strength of friction stir spot-welded aluminum alloy. Int. J. Mach. Tools Manuf. 2009, 49, 142–148. [Google Scholar] [CrossRef]
- Alhetaa, S.; Zayanb, S.; Mahmoudc, T.; Gomaad, A. Optimization of Friction Stir Spot Welding Process Parameters for AA6061-T4 Aluminium Alloy Plates. Am. Sci. Res. J. Eng. Technol. Sci. 2016, 20, 244–253. [Google Scholar]
- Zhang, D.; Dong, J.; Xiong, J.; Jiang, N.; Li, J.; Guo, W. Microstructure characteristics and corrosion behavior of refill friction stir spot welded 7050 aluminum alloy. J. Mater. Res. Technol. 2022, 20, 1302–1314. [Google Scholar] [CrossRef]
- Abdul-aziz, H.M.; Abbas, N.M.; Jasim, A.H. Artifitial aging time effect on corrosion resistance for friction stir welded AA6061 T6. Diyala J. Eng. Sci. 2013, 6, 83–96. [Google Scholar] [CrossRef]
- Vaghari, M.; Khayati, G.R.; Jahromi, S.A.J. Studying on the fatigue behavior of Al-Al2O3 metal matrix nano composites processed through powder metallurgy. J. Ultrafine Grained Nanostructured Mater. 2019, 52, 210–217. [Google Scholar] [CrossRef]
Disclaimer/Publisher’s Note: The statements, opinions and data contained in all publications are solely those of the individual author(s) and contributor(s) and not of MDPI and/or the editor(s). MDPI and/or the editor(s) disclaim responsibility for any injury to people or property resulting from any ideas, methods, instructions or products referred to in the content. |
© 2025 by the authors. Licensee MDPI, Basel, Switzerland. This article is an open access article distributed under the terms and conditions of the Creative Commons Attribution (CC BY) license (https://creativecommons.org/licenses/by/4.0/).