Article

Cost-Effective Surface Quality Measurement and Advanced Data Analysis for Reamed Bores

Institute for Data-Optimized Manufacturing (IDF), University of Applied Sciences Kempten, Bahnhofstraße 61, 87435 Kempten, Germany
*
Author to whom correspondence should be addressed.
J. Manuf. Mater. Process. 2025, 9(3), 99; https://doi.org/10.3390/jmmp9030099
Submission received: 21 January 2025 / Revised: 13 March 2025 / Accepted: 14 March 2025 / Published: 18 March 2025

Abstract

This paper presents a cost-effective approach for automated surface quality measurement in reamed bores. The study involved drilling 4000 holes into 42CrMo S4V steel, of which 3600 underwent subsequent reaming. Utilizing a CNC-controlled gantry coupled with a mobile roughness measurement device through a compliant mechanism, surface data of every bore were efficiently gathered and processed. Additionally, analytical methods are presented that extend beyond standardized, aggregated metrics. We propose the evaluation of retraction grooves by using autocovariance. In addition, the correlation between the phase position of the waviness profile and the positional deviation of the bore is analyzed. The position deviation is also associated with bending moments that occur during reaming using a sensory tool holder. Furthermore, a 360-degree surface scan is presented to visually inspect the retraction groove. This approach aims to enhance understanding of the reaming process, ultimately improving bore quality, reducing component rejects, and extending tool lifespan.

1. Introduction

Reaming is used to achieve precise bores, demanding high standards for position, shape, and surface quality. Surface quality is not only critical to the usability of a component but also provides valuable insights into the process itself. For instance, chatter marks on a surface are a common indicator of self-excited vibrations during processing, but also tool wear—such as the formation of a built-up edge—is visible on the machined surface. Therefore, surface analysis offers a strong foundation for process optimization and interpretation of data.
This study is part of the project KI-Span [1]. The research project focuses on improving tool life and part quality in machining processes by analyzing data, with the goal of developing robust, process-independent methods. By leveraging high-quality production data, the project aims to reduce tool-related costs, particularly in industries like aerospace, where tools account for a significant portion of production expenses.
Several studies have explored the influence of process parameters on part quality during reaming, often focusing on a specific choice of material. Key parameters that are commonly analyzed include cutting speed, feed rate, tool selection, and lubrication. These studies not only examine surface quality but also investigate other critical quality characteristics, such as roundness, positional accuracy, and cylindricity.
For instance, Zhang, Wang and Han [2] investigated the cutting performance, surface quality, and geometric accuracy of reaming titanium alloy Ti6Al4V using right-hand and straight-groove cemented-carbide reamers under different cutting conditions. The right-hand reamer demonstrated superior performance in terms of cutting force, tool life, surface quality, and geometric accuracy, making it a better choice for machining titanium alloys. The improvement was attributed to the groove structure, which leads to better chip evacuation as well as decreased vibration and friction during machining.
Lagoa Melo et al. [3] used a statistical approach to study surface quality and form errors when reaming AISI P20 hardened steel. Their work established correlations among tool choice, cutting parameters, and lubrication and assessed their effects on surface roughness (Ra), thrust force, torque, roundness, and cylindricity. Through a factorial design of experiments (DOE) and analysis of variance (ANOVA), they revealed that cutting speed is the most critical factor influencing surface roughness and thrust force, with higher cutting speeds generally improving the surface roughness. As in [2], the helical flute reamer reduces surface roughness and thrust force compared to the straight edge reamer, likely due to better chip evacuation. A higher feed rate leads to higher cutting effort and therefore torque. When it comes to lubrication, the minimum-quantity lubrication improved roundness accuracy, but emulsion-based lubricants improved torque performance.
In another study [4], Bezerra, Machado, Souzea Jr., and Ezugwu investigated the reaming of an aluminum–silicon alloy (SAE 322). They examined surface finish, roundness, cylindricity, and power consumption under various cutting conditions while experimenting with different tools and process parameters. Among other things, the findings revealed that a lower depth of cut and cutting speed led to the best result in surface roughness, roundness, cylindricity, and power consumption. The straight edge reamer produced a more accurate hole diameter, but worse surface finish. Also, a higher number of blades improved the diameter accuracy, surface finish, and roundness, but led to worse power consumption and cylindricity.
Additionally, Zheleznov and Andreeva [5] focused on surface quality, particularly the formation of individual scratches during reaming. Their research highlights how a built-up edge or chip wedging can hinder achieving specified roughness values like Ra and Rz.
Müller et al. [6] analyzed the reaming process of steel bushings made from austenitic AISI 316L stainless steel to achieve given dimensional and surface tolerances considering economic and technical constraints. Experiments were conducted with varying cutting speeds, feeds, and lubricants to identify the optimal combination that met all requirements. The results showed that the surface finish and the occurrence of diameter bell-mouthing were less influenced by lubrication and feed rates when slow cutting speeds were used.
In [7], Müller and De Chiffre investigated the reproducibility of surface roughness under varying process conditions, including cutting fluids, cutting speeds, feed rates, and operators. The goal was to evaluate the effectiveness of the reaming process for testing cutting fluids. As in [6], low cutting speeds consistently yielded high reproducibility in surface roughness, regardless of the cutting fluid used. In contrast, higher cutting speeds resulted in uneven and less reproducible surfaces. However, reproducibility improved when cutting fluids with higher oil content were used in water-based solutions. Furthermore, the study highlights that while Ra is not ideal for comparing machined surfaces, it serves as a reliable indicator of reproducibility, and low Ra values generally correlate with better surface quality.
In [8], De Chiffre et al. examined the reaming of austenitic stainless steel (AISI 316 L) using minimum-quantity lubrication (MQL) and HSS reamers. The study evaluated quality characteristics—diameter, roundness, cylindricity, and surface roughness (Ra)—as well as cutting forces (thrust and torque) under different process conditions. The findings showed that lower cutting speeds led to less scatter and better surface roughness. In contrast, a smaller depth of cut (i.e., a smaller reamer diameter) can increase surface roughness, torque scatter, and deviations in hole diameter, likely due to built-up edge formation. While higher feed rates improved surface roughness consistency, they resulted in less repeatable cutting forces. Additionally, the study concluded that applying MQL through two top-positioned nozzles is a practical and effective alternative, reducing coolant consumption while maintaining workpiece quality.
Rodrigues and Moreira [9] investigated tool wear and surface roughness (Ra) when reaming a demanding 15 PH stainless steel with a solid carbide reamer under various cutting conditions. Their findings indicated that although all cutting conditions proved effective, adhesion increased at higher feed rates and emerged as the primary wear mechanism, followed by abrasion. They also suggested that surface roughness fluctuations decrease over time due to a stabilization effect caused by cutting edge honing.
Other studies specifically examined the forces generated during the reaming process. Wang, Cui, Xu, and Jiang [10] analyzed the forces involved when reaming ZL102 aluminum using a PCD reamer. Their findings indicated that thrust force remains constant throughout the reaming operation. Additionally, increasing the cutting speed led to a decrease in thrust force, whereas a higher feed rate increased it.
In [11], Bretz, Abele and Weigold presented the development of a sensor-integrated reaming system for real-time straightness measurement during the machining process, eliminating the need for additional post-process measurements. This system incorporated strain gauges on the reamer shaft for data acquisition, a custom-designed telemetry unit for real-time wireless data transmission, and advanced analysis techniques utilizing artificial neural networks (ANNs). The system achieved high precision in bore straightness measurement while demonstrating the need for a more compact and fully integrated solution suitable for industrial applications.
Other publications placed a greater emphasis on modeling and forecasting of process forces. For instance, Bhattacharyya, Jun, Kapoor, and DeVor [12] developed a model to predict process forces during reaming, incorporating process faults and misalignments. Additionally, this model was used to predict the resulting bore diameter.
Kamath et al. [13] used a dynamic force model to predict cutting forces during reaming. It incorporated tool geometry, material properties, and vibration system elements (mass, stiffness and damping coefficients of the tool) to compute tangential, radial, and axial forces, validated experimentally with less than 5% prediction error. Key findings included that torque increased with reamer size, while radial and axial forces were less sensitive to size variations. The model aided in minimizing defects like spindle misalignment and runout in reamed holes, with potential extensions to other materials and tool geometries. It highlighted the importance of chip thickness variation and vibrational effects on dynamic force changes.
In [14], Rakshith, Kamath and Vijay investigated the performance of artificial neural network (ANN) and random forest (RF) algorithms in predicting torque during reaming operations. Experimental data were gathered from reaming processes performed on various materials, with different tool radii and rotation angles. The ANN model was optimized and its performance compared against RF and polynomial regression models. The findings demonstrated that the ANN model delivered accurate and reliable torque predictions, outperforming both RF and polynomial regression. This superior precision of the ANN model aims to facilitate better torque control, thereby enhancing surface finish quality during machining.
Another field of research is the analysis and optimization of reamer geometry. Voina et al. [15] focused on the preparation of the reamer’s cutting edge when machining GGG 40 cast iron. The wear of the cutting edge was analyzed using a scanning electron microscope. They concluded that edge rounding can increase a reamer’s lifespan and improve the repeatability of the process.
In a 2015 patent [16] by MAPAL Präzisionswerkzeuge Dr. Kress KG, a novel geometry is described that aims to enhance process stability (chatter), surface quality, and roundness of reamed holes. Unlike conventional reamers, which have equally wide and evenly distributed cutting edges that can lead to deflection and chatter, the proposed geometry features differently sized cutting edge groups with an asymmetrical arrangement that still maintains symmetrical distribution of cutting forces.
Instead of experiments, Kumar used a finite element model in [17] to analyze the geometry of a reaming tool. This approach was intended to eliminate the need for expensive experiments in tool development by determining stresses and strains in advance.
In another study, [18], Leveille et al. also used numerical simulations and the finite element method to investigate the reaming process, focusing on the residual stresses introduced primarily by plastic deformation. These residual stresses play an important role in understanding material fatigue, e.g., in the aerospace industry. The cutting forces during machining, which were used to calibrate the model, and the surface profile created by the reamer, which was linked to the residual stress profile, played a key role in this study.
A significant challenge in all the research areas described is the efficient collection of high-quality surface data, which is often time-consuming and costly, underscoring the need for automation. This paper introduces a cost-effective approach for the automated acquisition and subsequent analysis of surface data. It explores possibilities that extend beyond standardized, aggregated surface parameters, utilizing recorded profiles to identify process anomalies such as retraction grooves. Additionally, it highlights the integration of sensor, machine, and quality data, facilitating deeper insights into process dynamics and performance. This approach is a step towards being able to make statements about workpiece quality during machining, regardless of the choice of material and tool. The approaches discussed are independent of the choice of material and process parameters, and can be applied in a wide range of research and industrial applications.

2. Materials and Methods

2.1. Reaming Process

During reaming, existing bores are drilled and then slightly enlarged, with the reamer naturally following the bore’s path. The aim of the experiment, shown in Figure 1, was to induce and analyze tool wear under realistic conditions. The number of holes and the cutting conditions used were based on this objective. In the literature, the number of bores varies significantly depending on the focus of the analysis and the resources available. In [2], a full factorial experimental design was used in reaming 24 bores with two different tools and 24 different machining parameters. In experiment [3], a full factorial design ( 2 4 ) was used, with each parameter combination replicated three times. Experiments in [6] involved a 2 3 full factorial design performed over four days using 16 workpieces per day, resulting in 64 bores. An additional 8 bores were created after 16 specimens, bringing the total to 72 bores. In experiments in [7], the reproducibility of surface roughness was evaluated by reaming 90 specimens with five different operators, three cutting fluids, and two cutting speeds. Finally, experiments in [9] consisted of ten trials, where reaming was performed either on 170 bores or until reamer breakage occurred.
In earlier experiments performed by us within the project KI-Span under similar conditions, reaming tools were worn out after roughly 1500–2000 holes. Moreover, 500 holes fitted on each of the chosen test pieces at a distance of 1.8 mm (determined in an earlier experiment to be a safe distance such that sensitive process-concurring force measurement was not affected by neighboring holes). For this reason, the number of holes in the present analysis was chosen to encompass multiple test pieces as well as multiple drilling and reaming tools. Eight plates of 42CrMo S4V steel with a raw thickness of 50 mm and processed thickness of 48 mm were drilled 45 mm deep. Each plate contained 500 holes. Out of these, 425 holes per plate were subsequently reamed to a depth of 40 mm, resulting in a total of 3400 reamed holes. A total of 600 holes were left unreamed to evaluate the drilling process, which is not discussed in this paper. After the third plate, i.e., after 1500 holes, the first drilling tool was replaced due to a broken cutting edge. A new drill and reamer were simultaneously inserted before plate 6 due to a change in cutting parameters with the aim of increasing the tool wear. The first reamer operated at a cutting speed of 180 m/min with a feed rate of 1.5 mm per revolution. After inserting the second reamer, the cutting conditions were adjusted to a speed of 250 m/min with a feed rate of 1.8 mm per revolution. The first two drilling tools performed at a cutting speed of 65 m/min with a feed rate of 0.2 mm per revolution. The third drill operated at 100 m/min cutting speed with a feed rate of 0.25 mm per revolution.
To minimize chatter and to enhance the roundness and surface quality of the holes, coated six-flute reamers with an irregular pitch angle (γ > α > β) and internal coolant channel (ICC) were used (Ceratizit Komet Fullmax 52M.57 10H7). Pre-drilling was performed with a coated solid carbide drill featuring a 140° tip angle (Ceratizit WTX-UNI 9.80), also equipped with ICC. This resulted in a stock allowance of 0.1 mm. For both drilling and reaming, the sensory “spike” tool holder from the Pro-Micron GmbH [19] was used, which records bending moments, as well as torque and axial forces generated by the process. A five-axis DMU65 FD monoblock milling machine from DMG MORI was used for the machining process. The importance of sensory tool holders was highlighted in [20], where the integration of sensory toolholder data and a real-time feedback loop were discussed to optimize machining processes, aiming to prevent tool failures and enhance productivity through data-driven process control and analysis. An approach avoiding chatter using a comparatively low-cost sensory tool holder was presented by Bleicher et al. in [21]. The more complex sensory tool holder presented in [22] was energy self-sufficient and included strain gauges, as well as piezoelectric and thermal sensors, to measure force, acceleration, and temperature.

2.2. Automated Surface Measurement

For automated surface data acquisition, a cost-effective mobile and handheld surface measuring device, the MarSurf PS 10 by Mahr, was used. This stylus profilometer features a detachable feed unit that is positioned along the bore axis. It offers a measurement length of up to 12.5 mm with a profile resolution of 8 nm. Similar devices are widely used in industry and are therefore readily available. Alternatively, expensive coordinate measuring machines with surface measurement capability can be used. The feed unit of the MarSurf is mounted on a CNC-controlled gantry, which is controlled by a PC using standardized G-code. During the measurement, the stepper motors are automatically switched off to minimize possible influences on the measurement process. MarCom Professional software (Ver. 5.4-1) runs simultaneously on the PC to record and store measurement data in the form of aggregated values such as Ra and Rz, as well as the raw surface profile itself. The interface between the G-code and the MarCom software is implemented in Python 3.12.
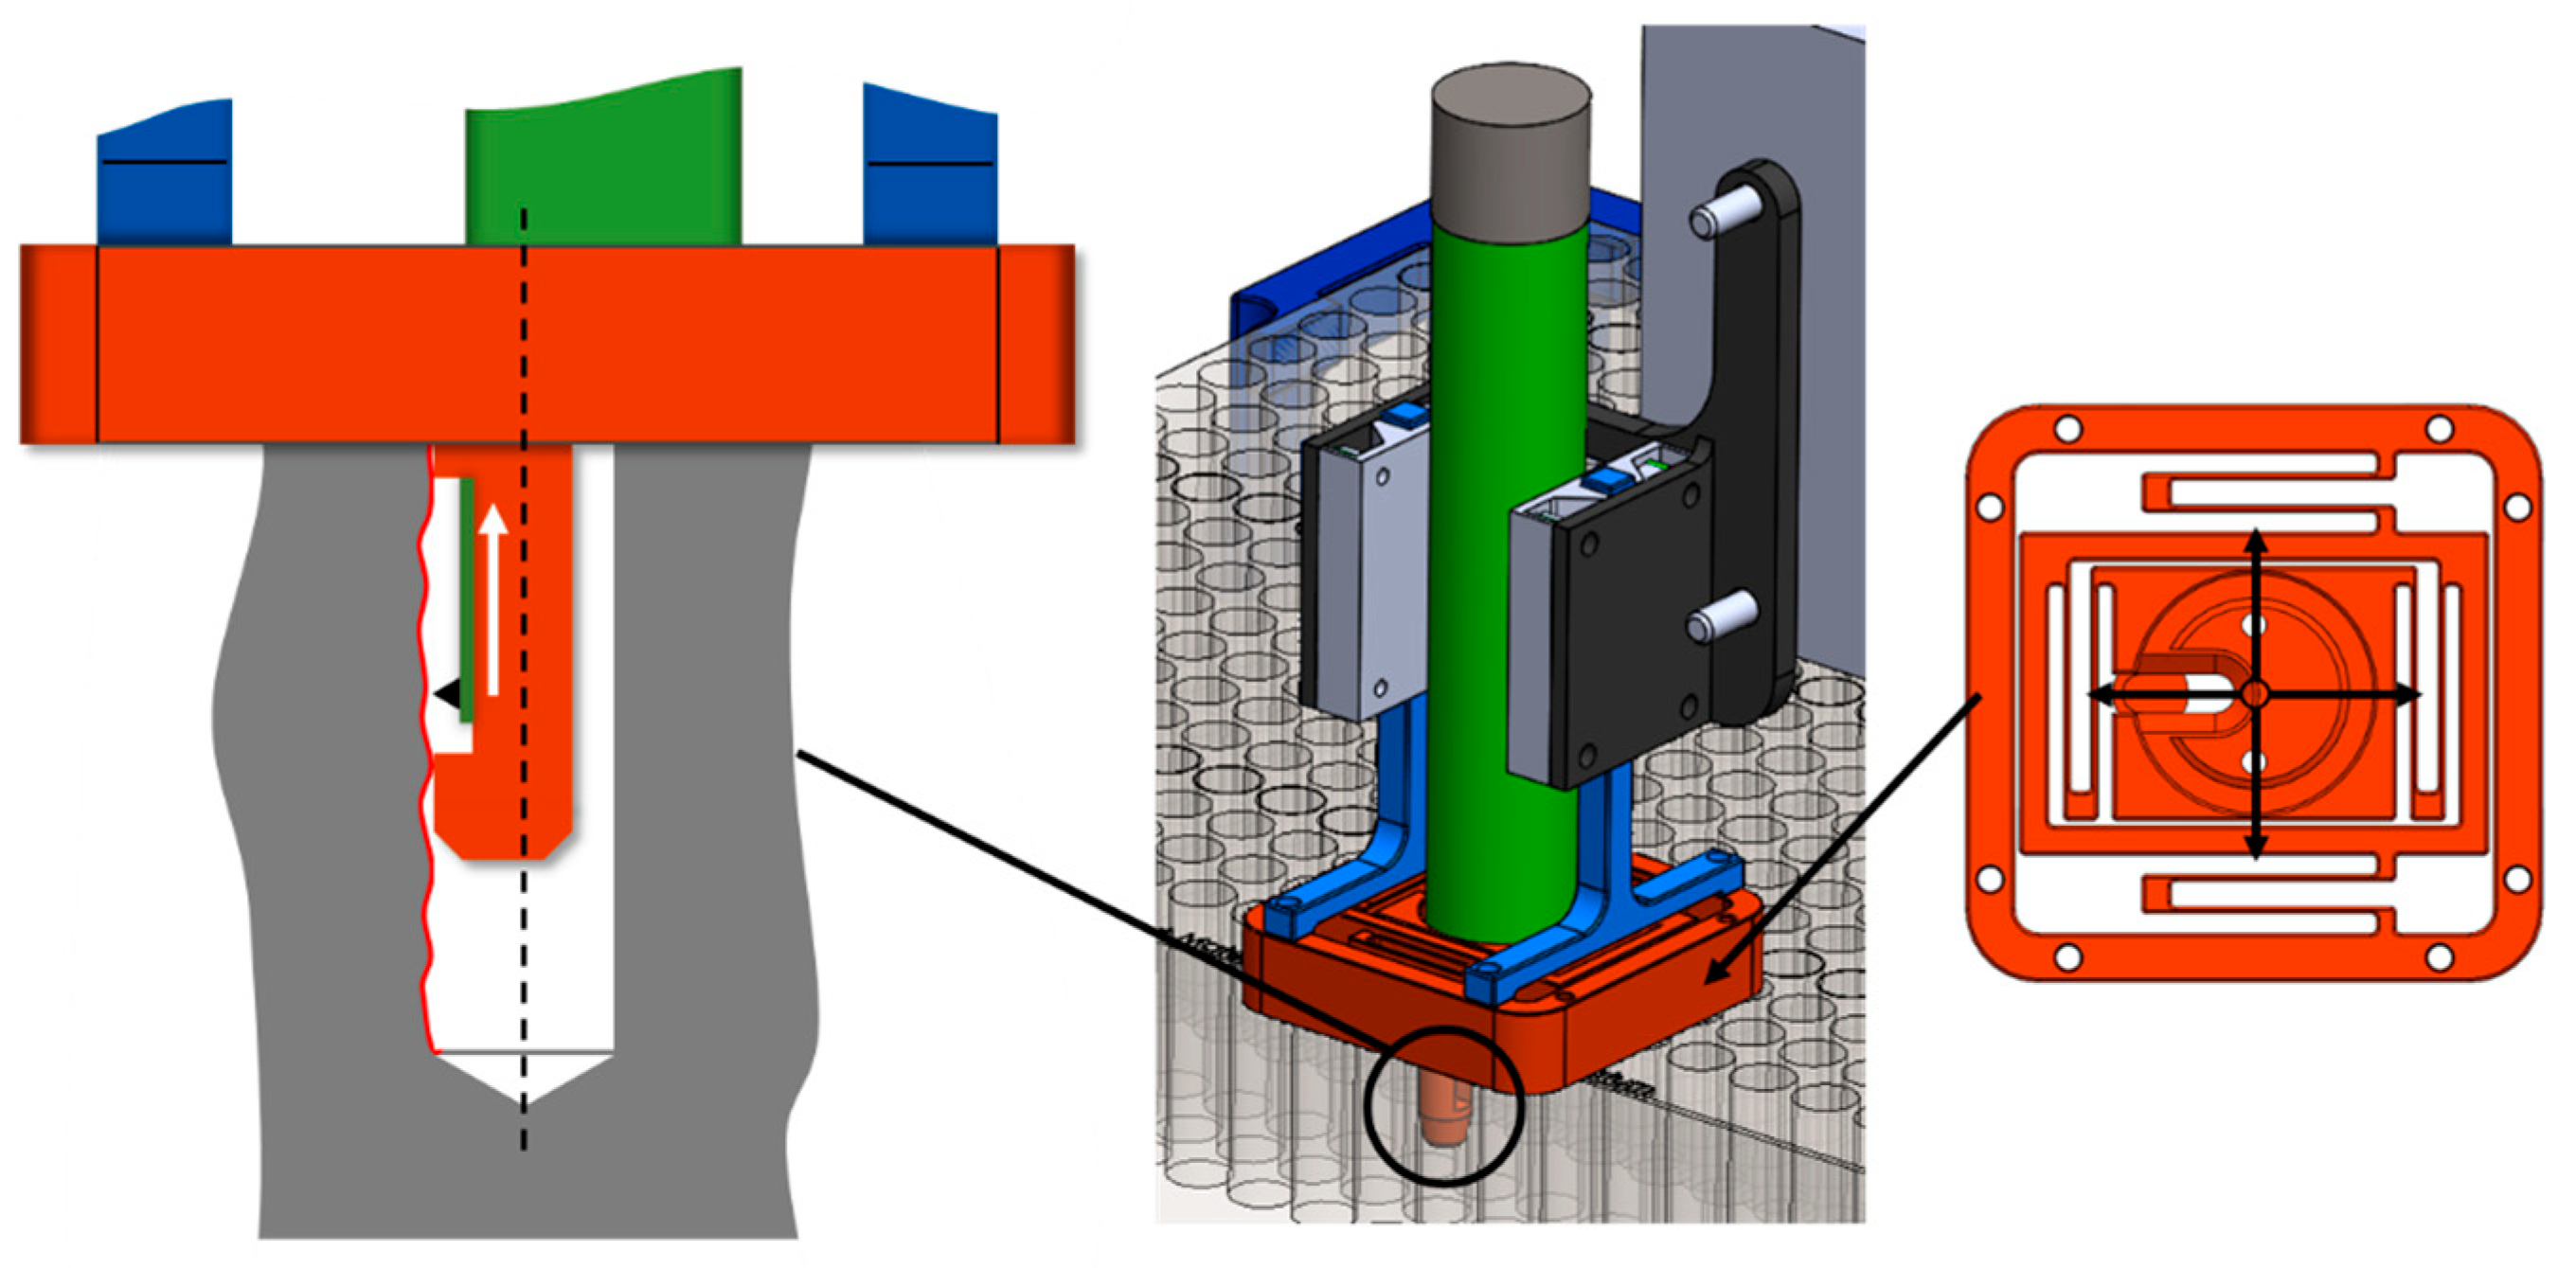
The feed device holder primarily consisted of two flexible, 3D-printed components—designed for this study—out of PLA plastic, functioning as a compliant mechanism. The XY stage (orange component in Figure 2) was engineered to be flexible in two translational directions while remaining rigid in all others. This, along with the two contact surfaces, ensures precise positioning within the bore and provides secure guidance to the measurement surface. The compliant design offers several advantages, including a small installation space and cost savings from eliminating linear units. Additionally, it requires no lubricants that could contaminate the workpiece or profilometer, has almost no breakaway force, and involves little maintenance. A similar compliant design was described and tested with high-accuracy displacement sensors in [23] by Sollapur et al. A broader overview of compliant mechanisms in various applications was provided by Jagtap et al. in [24]. The second component allows precise positioning in the vertical direction by placing the unit on the component surface. It also includes a snap mechanism to protect the measuring device if a hole is missed.

3. Results

3.1. Preprocessing: Filtering According to Standards

The goal of preprocessing is to separate the surface profile into roughness and waviness parts, representing shortwave and longwave components, respectively. Although both are deviations in surface shape, they arise from different mechanisms and are therefore analyzed separately. Roughness is typically influenced by factors like chip formation, cutting edge geometry, or cutting parameters, whereas waviness is attributed to process dynamics, faults, or misalignments.
This separation of waviness and roughness was achieved through a modified nonlinear Gaussian regression filter compliant with DIN EN ISO 16610-31 [25]. This filter is robust against groove-like valleys, making it particularly suitable for plateau-like surfaces produced by processes such as reaming or honing. The choice of the nesting index controls the cut-off length between waviness and roughness and is usually chosen based on the expected surface roughness and measurement length. In this evaluation, the choice of measurement length of 12 mm and nesting index of 0.25 mm deviated significantly from the suggested value of the ISO standard and ensured in particular that enough grooves were present in the roughness profile of sufficient quality. Figure 3 demonstrates this on a reamed hole: the primary profile (representing the actual surface) from the surface measurement device is shown in black; the waviness component resulting from the regression filter is displayed in orange; and the roughness, derived from the difference between the primary profile and waviness, appears in blue. The observed trend of approximately 0.008 mm over 12 mm measuring distance is attributed to a slight misalignment of the measuring device within the bore, which is acceptable for a 3D-printed design.

3.2. Analysis of Retraction Grooves in the Roughness Profile

One focus of this investigation is a groove that occasionally forms during the retraction of the reamer within the bore. A photo of a clearly visible retraction groove from a cut-out section of a plate is shown in Figure 4a. This groove can increase the risk of component failure at sealing surfaces by allowing fluids, like oil, to flow along its path. To make the retraction groove distinctly and non-destructive visible, one bore was measured in approximately five-degree increments, creating a 360° scan of the bore surface. This scan provided a clear visualization of the surface structure, though the radial resolution did not support the derivation of 3D surface parameters. Figure 4b presents this 360° scan, visualized as a scatterplot of the roughness profiles. The darker and therefore deeper groove (in positive Z direction counter-clockwise rising) is clearly visible, corresponding to the groove formed when the reamer is retracted. Figure 4c shows a 2D heatmap of the detrended raw surface profiles, where the recurring pattern clearly reveals the surface generated by each cutting edge.
Figure 5 shows the blue highlighted profile section of Figure 4. This view does not easily allow for optical interpretation of whether the groove was created during immersion or retraction, but the information is implicitly present in the groove’s distance, which matches the feed rate during extraction.
The Abbott–Firestone material ratio curve (Figure 6a) provides a standardized (DIN EN ISO 13565-2 [26]) method for assessing the peaks, core area, and grooves of a surface. In this approach, the surface profile is organized by profile height and material content. Surface constants can then be determined through a well-defined procedure. One such constant is the R V K value, which provides a quantitative measure of the presence of grooves. However, since this method does not evaluate the periodicity of recurring grooves—which can be critical to a component’s function—a new approach based on the autocovariance of the roughness profile is proposed. Similarly to autocorrelation, autocovariance is calculated using a standard formula to evaluate a recorded profile section, revealing how surface features relate to each other over varying distances (see [27], Equation (2.29):
γ k ^ = 1 L x = 1 L k z x + k z ¯ z x z ¯ , k = 0,1 , L 1
γ k ^ is the autocovariance at lag k , L is the number of profile points, z x is the profile height at the x th measurement, and z ¯ is the mean profile height. To evaluate the result with respect to measuring distance d , as shown in Figure 6b, we reparametrize the autocovariance using the known sample rate a as follows:
γ ~ d γ ^ d a ,   d R 0
Unlike autocorrelation, autocovariance is not normalized, providing additional insight into the amplitude of recurring features. In addition, specific areas of the roughness profile, such as heights and grooves, can be analyzed individually by isolating the desired region before calculating the autocorrelation.
Figure 6b shows a high autocovariance at 3 mm, corresponding to the feed rate during retraction of the reamer. Caution is advised if the retraction feed rate is a multiple of the feed rate used to enter the hole. For an effective method for evaluating the calculated autocovariance, we propose utilizing the maximum value of the employed distance (feed rate) during extraction. If this distance happens to be a multiple of the feed rate used during immersion, the difference between the two maximum values at both used feed rates (immersion and retraction) should be utilized.

3.3. Analysis of Phase Position in Waviness

Another focus of this investigation was the waviness of the measured bores, which displayed a periodic pattern influenced by the feed rate per revolution during reaming. Comparative descriptive analysis showed that each borehole displayed a distinctive pattern that spanned its entire surface. While this pattern could vary from hole to hole, similar profiles tended to emerge between holes that shared the same phase position of the surface profile. The phase position of the waviness—representing the location of this recurring pattern within the bore—can be converted to an angle between 0° and 360° (indicated by the blue line) using the known feed rate. Figure 7 shows an example of this calculation for one peak, indicated by a red line. To determine the phase position of one bore, the median phase location of the recurring peaks in the waviness profile (marked by red crosses) is calculated.
Plotting all angles of one plate as a color map reveals distinct patterns within the experiment, provided the profilometer is positioned at a constant angle across all bores. This consistency arises from the highly stable rotational and traversing speeds of the machine tool. Figure 8a displays the phase angle as a color gradient across the holes on the fourth plate in the experiment. Red arrows indicate the machining sequence, while black arrows represent non-cutting movements for the first two rows as an example. Moreover, one can see the three temporary columns in which the plate was processed.
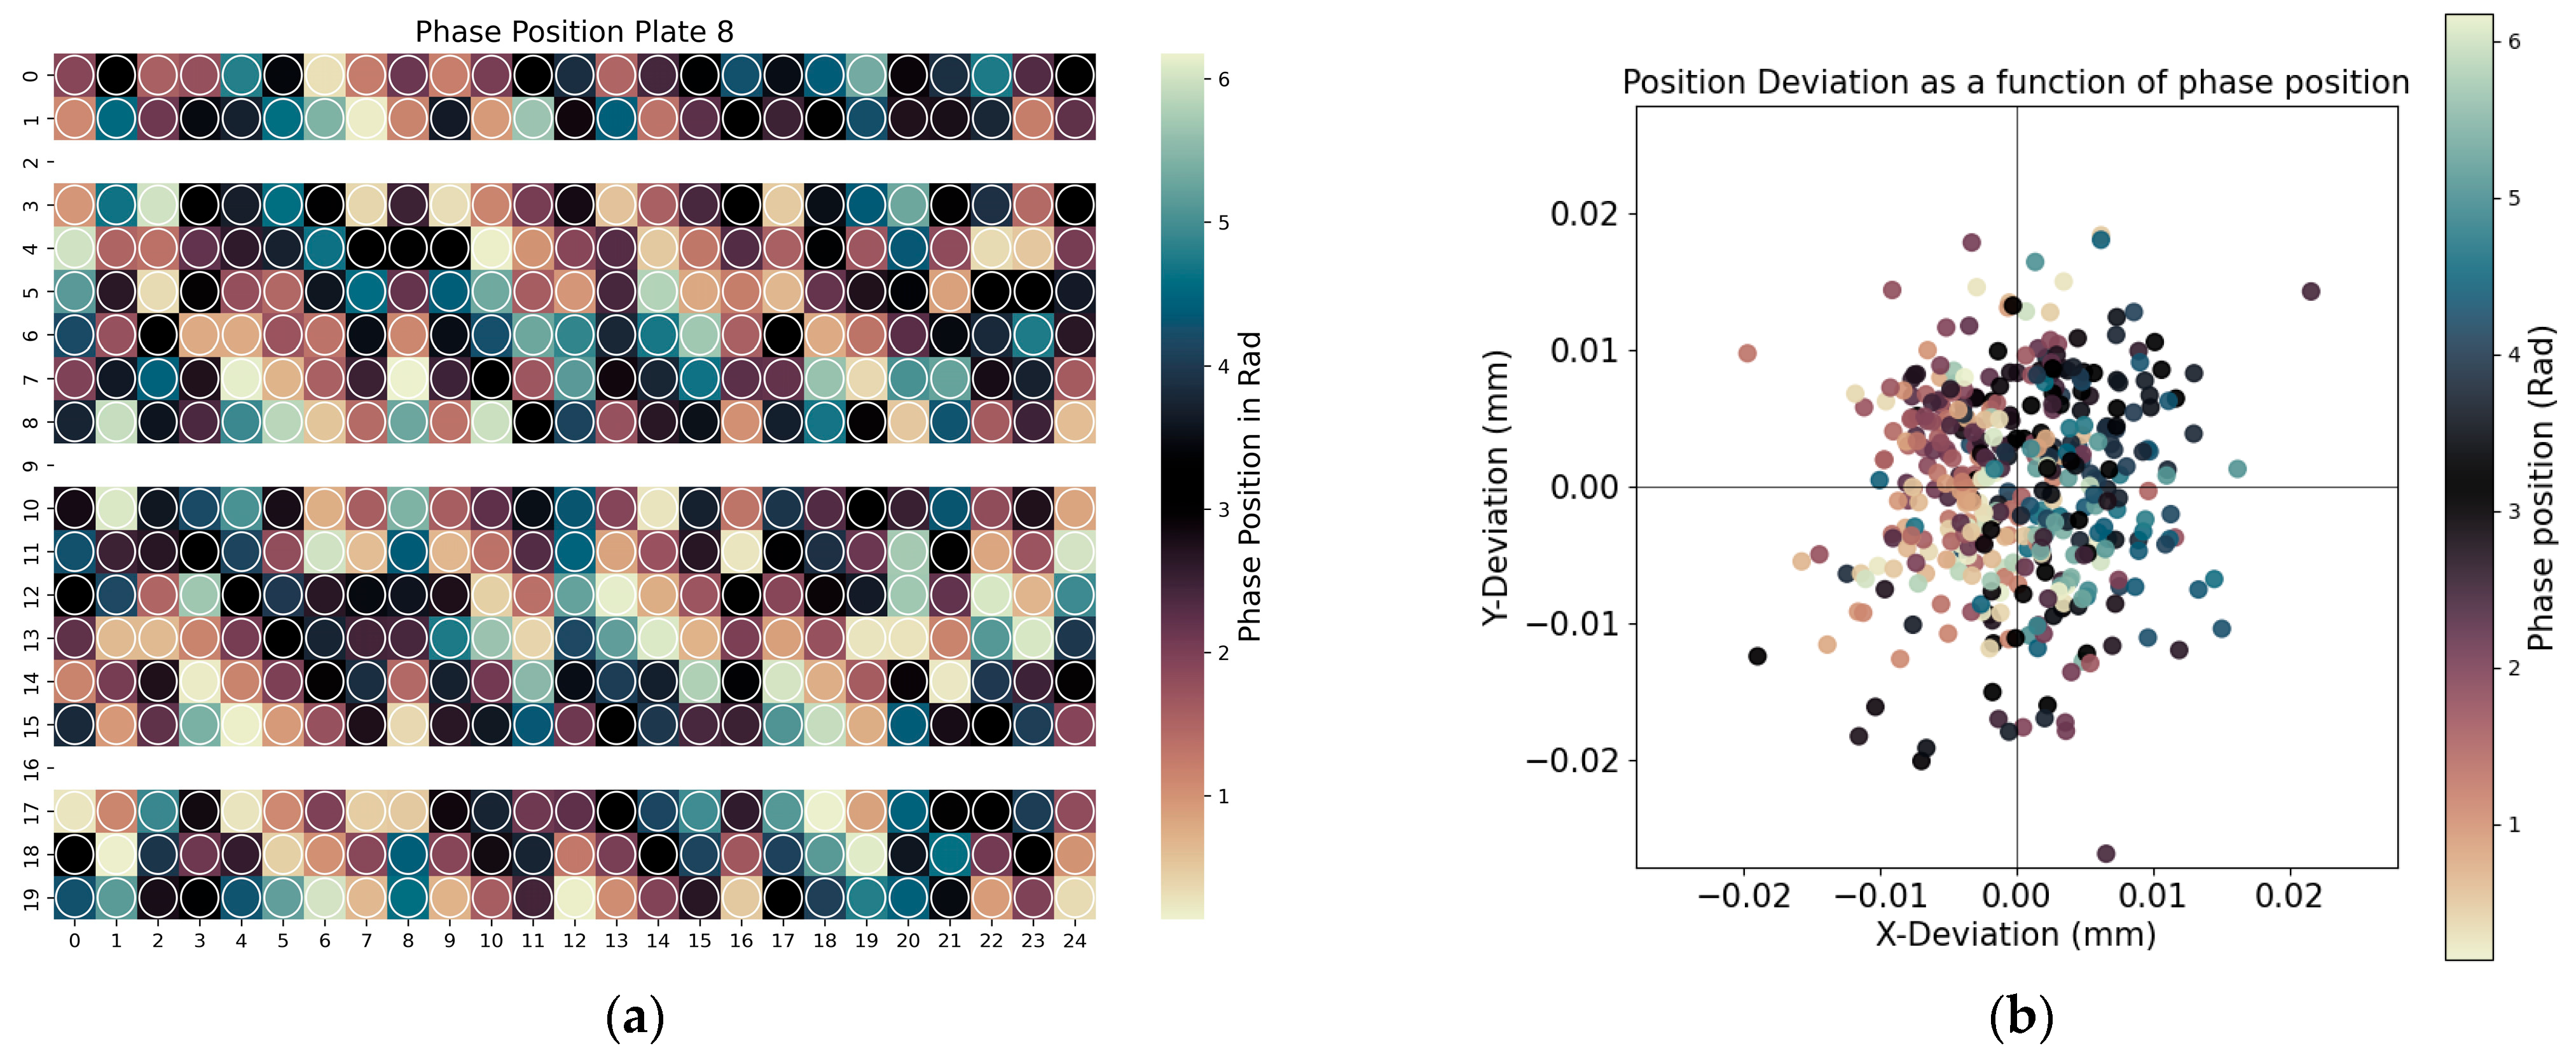
If the holes are plotted around their ideal position (0,0) using measurements from a coordinate-measuring machine rather than at their locations on the plate, another relationship becomes apparent: a certain phase position in the waviness profile results in a certain positional deviation of the bore. When examining the circular correlation between the two variables—phase position and angle of position deviation—we found that it was represented as −0.5–0.5j for the plate shown above, resulting in a correlation of 0.7. Figure 9 shows a less worn reamer, which still results in a considerable correlation of 0.33. The different pattern on the left-hand side is due to changed travel and feed speeds, while we argue that the smaller position deviation is due to the better condition of the reamer.
The correlation between position offset and the phase position of the waviness profile reveals a systematic positional error, especially in the case of worn tools. We propose that the phase position is directly related to the angle at which the reaming tool initially contacts the workpiece. This observation presents a promising avenue for further investigation, as addressing it could provide a method to enhance positional accuracy or extend the usable life of the reamer.

3.4. Analysis of Cutting Forces

During the experiment, process forces were measured using the Spike sensory tool holder by Pro-Micron. It records bending moments, axial forces, and torque in a rotating coordinate system generated during the machining process. Figure 10 displays a representative curve over a bore, showing a reaming process duration of approximately one second. The left ordinate shows the Z-axis position, where the zero point marks the reamer’s entry depth, and the total reaming depth is 40 mm. On the right ordinate, the process forces are displayed, each with a dedicated scale. By synchronizing the axis data with the recorded process forces, specific phases of the reaming process—such as immersion and retraction—can be observed individually. It is noticeable that the bending moment (absolute values) during reaming (0 mm to 40 mm) is very similar to the bending moment after reaming (40 mm to 0 mm). This is in line with the observations of [12], where the largest component of forces in the X and Y directions, i.e., forces that cause bending moments, was caused by reaction forces due to runout error and axis misalignments.
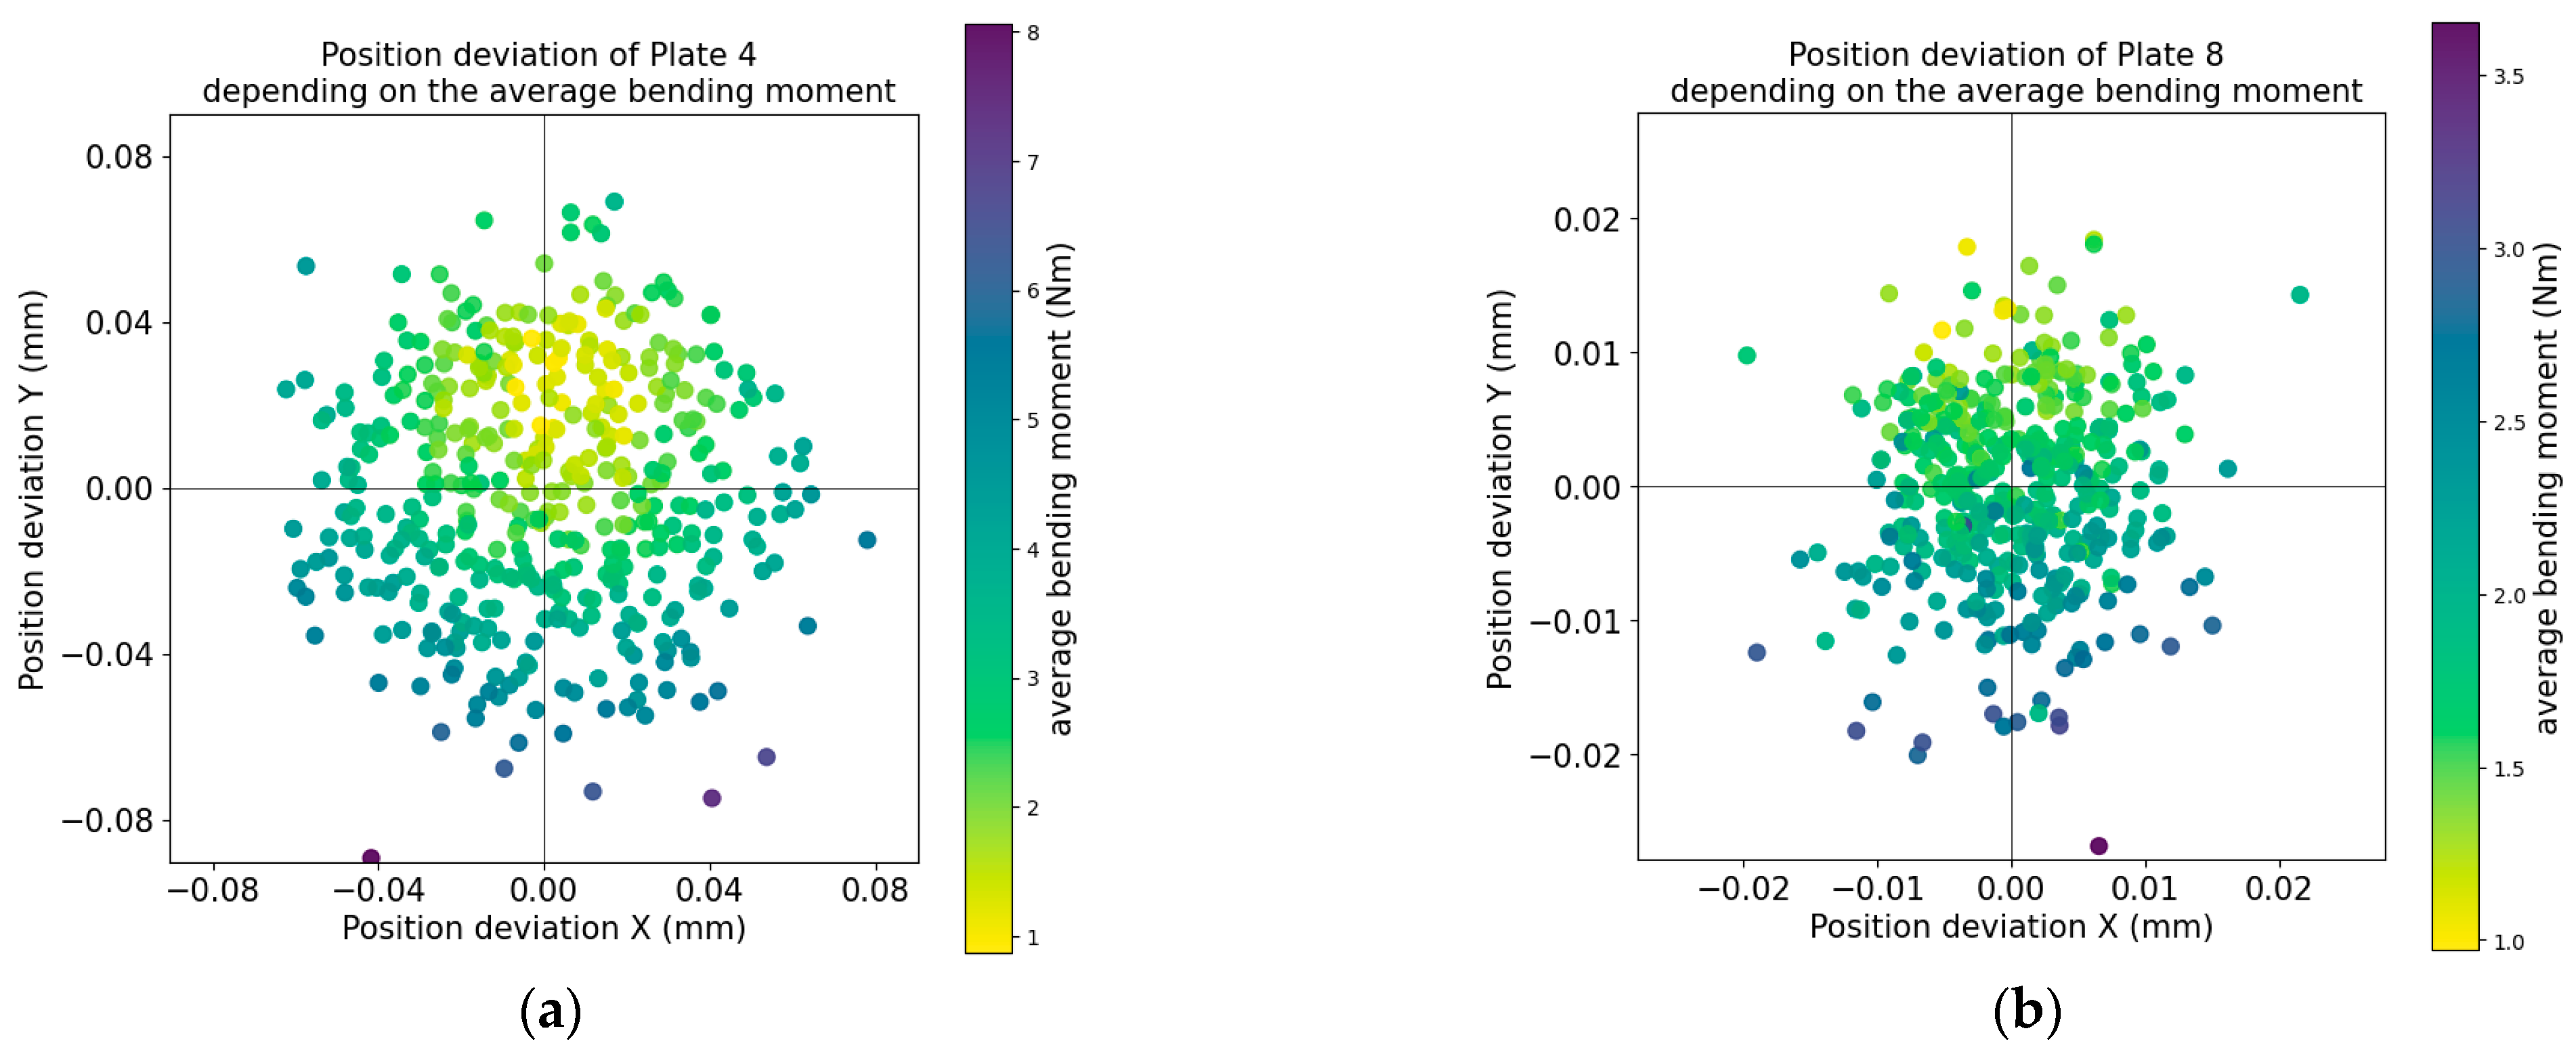
The curves shown can be aggregated in various ways, with the mean value often generating the highest correlations with selected quality metrics. As an example, Figure 11 puts the mean bending moment in comparison to the deviation in position of the reamed bore. The heavily worn reamer on plate 4 led to significantly greater mean bending moments and position deviations than the less worn reamer on plate 8. Both images share a common offset, which may be attributed to the measurement or signal processing pipeline of the position deviation on the coordinate measurement machine or to the process force acquisition in the sensory tool holder. The lowest bending moment occurred at a position deviation of around 0.02 mm in the positive Y direction.

4. Discussion

Despite extensive efforts to establish a link between surface data features, such as retraction grooves, and process forces, such as bending moments, no statistically significant relationship was identified. Various analyses, including feature extraction, FFT, cross-correlation, and regression modeling, yielded no clear dependency between these factors. This finding suggests that lower-order geometric defects predominantly influence the process forces, while factors impacting surface roughness did not prominently appear in the force data. Future research could explore advanced data analysis techniques and alternative measurement technologies to uncover any potential correlations that may exist. This examination would make it possible to recognize grooves, which are not represented in aggregated surface parameters such as Ra, during machining in order to avoid or recognize component rejects or to be able to take countermeasures at an early stage.
Additionally, the proposed relationship between the phase position of the waviness profile and the deviation in position of the reamed bores warrants further investigation to reduce positional errors in reamed bores or to extend the reamer’s lifespan. A possible investigation and future application in industry could be the targeted control of the reamer’s entry angle in order to investigate this relationship in more depth. Further investigations could also explore the residual stresses introduced by the reaming process by analyzing the recorded surface profiles in conjunction with the machining forces measured by the sensory tool holder.

5. Conclusions

The primary conclusions drawn from this work are as follows.
  • An automated and cost-effective system for measuring surface quality in reamed bores was demonstrated, utilizing an NC-controlled gantry and a mobile stylus profilometer.
  • The analysis of the profile data, and in particular the separation of surface profiles into roughness and waviness components according to the demanding DIN EN ISO standards, enabled a more targeted analysis of process-specific issues.
  • It was demonstrated that a 360° scan allows for clear visualization of retraction grooves. An autocovariance-based approach proved helpful in evaluating these grooves, offering a more specific assessment than standard metrics.
  • The phase position of the waviness profile on the reamed surface correlated with tool entry angle and position deviation. By putting this phase position into context with the bore position in the workpiece, patterns associated with tool wear were identified, allowing for potential process improvements to reduce positional deviations.
  • Process forces were measured and analyzed to link bending moments with bore position deviations, revealing that bending moments increase significantly with larger positional deviations.

Author Contributions

Conceptualization, T.J. and S.U.; formal analysis, T.J.; investigation, T.J, S.U. and B.M.; data curation, B.M.; writing—original draft preparation, T.J.; writing—review and editing, F.S.; visualization, S.U.; supervision, F.S. All authors have read and agreed to the published version of the manuscript.

Funding

The project “AI-supported optimization of tool life and component quality on machine tools in machining production (KI-Span)” (original: “KI-gestützte Optimierung der Werkzeugstandzeit und der Qualität der Bauteile an Werkzeugmaschinen in der spanenden Fertigung (KI-Span)”), running from August 2021 to December 2024, is funded under the Bavarian Collaborative Research Program (BayV-FP; funding line: Digitization) by the Bavarian Ministry of Economic Affairs, Regional Development and Energy (StMWi).

Data Availability Statement

The original surface profile data presented in the study are openly available at https://zenodo.org/records/14697332 (accessed on 20 January 2025). Additional data presented in this study are available on request from the corresponding author due to restrictions within the project consortium.

Acknowledgments

The authors would like to thank Fabio Lischka for his mathematical support during the development of this work and the anonymous referees for their valuable suggestions.

Conflicts of Interest

The authors declare no conflicts of interest.

References

  1. Unsin, S.; Dorer, C.; Müller, B.; Jung, T.; Limmer, A.; Schirmeier, F. Schritt für Schritt zur Zerspanungs-Ki. Maschinenbau 2024, 4, 10–15. [Google Scholar] [CrossRef]
  2. Zhang, Y.; Wang, Y.; Han, Z. Study on Characteristics for Reaming Titanium Alloy Ti6Al4V with Two Kinds of Cemented-Carbide Groove Reamers. Materials 2022, 15, 5027. [Google Scholar] [CrossRef] [PubMed]
  3. Lagoa Melo, T.F.; Ribeiro Filho, S.L.M.; Arruda, É.M.; Brandão, L.C. Analysis of the surface roughness, cutting efforts, and form errors in bore reaming of hardened steel using a statistical approach. Measurement 2019, 134, 845–854. [Google Scholar] [CrossRef]
  4. Bezerra, A.A.; Machado, A.R.; Souza, A.M.; Ezugwu, E.O. Effects of machining parameters when reaming aluminium-silicon (SAE 322) alloy. J. Mater. Process. Technol. 2001, 112, 185–198. [Google Scholar] [CrossRef]
  5. Zheleznov, G.S.; Andreeva, S.G. Final Surface Roughness in Reaming Holes. Russ. Eng. Res. 2013, 33, 522–524. [Google Scholar] [CrossRef]
  6. Müller, P.; Genta, G.; Barbato, G.; De Chiffre, L.; Levi, R. Reaming process improvement and control: An application of statistical engineering. CIRP J. Manuf. Sci. Technol. 2012, 5, 196–201. [Google Scholar] [CrossRef]
  7. Müller, P.; De Chiffre, L. Reproducibility of surface roughness in reaming. In Proceedings of the 4th Swedish Production Symposium, Göteborg, Sweden, 3–5 May 2011. [Google Scholar]
  8. De Chiffre, L.; Tosello, G.; Píška, M.; Müller, P. Investigation on Capability of Reaming Process using Minimal Quantity Lubrication. CIRP J. Manuf. Sci. Technol. 2009, 2, 47–54. [Google Scholar] [CrossRef]
  9. Rodriguez, M.A.; Moreira, L.T.S. Tool wear and surface roughness evaluation of the reaming process for the 15-5 precipitation hardening stainless steel. In Proceedings of the COBEM 2009, 20th International Congress of Mechanical Engineering, Gramado, RS, Brazil, 15–20 November 2009. [Google Scholar]
  10. Wang, Y.; Cui, X.; Xu, H.; Jiang, K. Cutting force analysis in reaming of ZL102 aluminium cast alloys by PCD reamer. Int. J. Adv. Manuf. Technol. 2013, 67, 1509–1516. [Google Scholar] [CrossRef]
  11. Bretz, A.; Abele, E.; Weigold, M. Measuring the bore straightness during reaming with sensoric tools. Prod. Eng. Res. Dev. 2020, 14, 535–544. [Google Scholar] [CrossRef]
  12. Bhattacharyya, O.; Jun, M.B.; Kapoor, S.G.; DeVor, R.E. The effects of process faults and misalignments on the cutting force system and hole quality in reaming. Int. J. Mach. Tools Manuf. 2006, 46, 1281–1290. [Google Scholar] [CrossRef]
  13. Kamath, R.C.; Bekinal, S.; Bhat, R.; Naik, N.; Kuttan, A. Dynamic Force Modelling and Experimental Analysis of Reaming. Eng. Sci. 2021, 15, 166–176. [Google Scholar] [CrossRef]
  14. Rakshith, M.C.; Kamath, R.C.; Vijay, G.S. Prediction of the Reaming Torque Using Artificial Neural Network and Random Forest Algorithm: Comparative Performance Analysis. Eng. Proc. 2023, 59, 97. [Google Scholar] [CrossRef]
  15. Voina, I.-D.; Sattel, S.; Contiu, G.; Faur, A.; Luca, B. Reamers cutting edge preparation for improvement the GGG 40 machining. MATEC Web Conf. 2018, 178, 01014. [Google Scholar] [CrossRef]
  16. MAPAL Fabrik für Präzisionswerkzeuge Dr. Kress KG. Mehrschneidige Reibahle. Deutsches Patent-und Markenamt DE102017208017B4, 21 February 2019. [Google Scholar]
  17. Kumar, A. Design and Analysis of Reaming Tool by Finite Element Modeling and Simulation. In Advances in Engineering Design, Lecture Notes in Mechanical Engineering; Joshi, P., Gupta, S.S., Shukla, A.K., Gautam, S.S., Eds.; Springer: Singapore, 2021; pp. 465–472. [Google Scholar] [CrossRef]
  18. Leveille, T.; Valiorgue, F.; Dumas, M.; Masciantonio, U.; Brosse, A.; Karaouni, H.; Rech, J. 3D numerical modelling of residual stresses induced by reaming. J. Manuf. Process. 2024, 114, 47–60. [Google Scholar] [CrossRef]
  19. Eckstein, M.; Breitkopf, G.; Huber, R.; Jäger, T. Spannfutter-Integriertes Kraftmesssystem. European Patent Office EP2103379B2, 16 November 2016. [Google Scholar]
  20. Schörghofer, P.; Pauker, F.; Leder, N.; Mangler, J.; Ramsauer, C.; Bleicher, F. Using sensory tool holder data for optimizing production processes. J. Mach. Eng. 2019, 19, 43–55. [Google Scholar] [CrossRef]
  21. Schuster, A.; Rentzsch, H.; Ihlenfeldt, S. Energy self-sufficient, multi-sensory tool holder for sensitive monitoring of milling processes. Procedia CIRP 2023, 117, 80–85. [Google Scholar] [CrossRef]
  22. Bleicher, F.; Schörghofer, P.; Habersohn, C. In-process control with a sensory tool holder to avoid chatter. J. Mach. Eng. 2018, 18, 16–27. [Google Scholar] [CrossRef]
  23. Sollapur, S.B.; Waghmare, P.M.; Patil, M.S.; Deshmukh, S.P. Design and Validation of XY Flexure Mechanism. J. Eng. Sci. Technol. 2021, 16, 1416–1425. [Google Scholar]
  24. Jagtap, S.P.; Deshmukh, B.B.; Pardeshi, S. Applications of compliant mechanism in today’s world—A review. J. Phys. Conf. Ser. 2021, 1969, 012013. [Google Scholar] [CrossRef]
  25. ISO 16610-31; Geometrical Product Specification (GPS)—Filtration—Part 31: Robust Profile Filters: Gaussian Regression Filters. International Organization for Standardization (ISO): Geneva, Switzerland, 2023. [CrossRef]
  26. ISO 13565-2; Geometrical Product Specification (GPS)—Surface texture—Part 2: Height characterization using the linear material ratio curve. German Institute for Standardisation: Berlin, Germany, 1998. [CrossRef]
  27. Kreiß, J.-P.; Neuhaus, G. Die Differenzengleichung für die Autokovarianzen. In Einführung in die Zeitreihenanalyse; Springer: Berlin/Heidelberg, Germany, 2006; pp. 128–133. [Google Scholar]
Figure 1. Reaming experiment.
Jmmp 09 00099 g001
Figure 2. Automated surface measurement.
Jmmp 09 00099 g002
Figure 3. Surface profile (top), waviness (top), and roughness (bottom) of a reamed bore. The worn tool results in an expressive waviness and roughness profile. Additionally, the feed speeds during the immersion and retraction of the reaming tool are indicated.
Jmmp 09 00099 g003
Figure 4. (a) Sectional view of a reamed bore; (b) 360° scatterplot of roughness profile; (c) heatmap section of detrended raw profile.
Jmmp 09 00099 g004
Figure 5. Retraction groove (highlighted in red) in the roughness profile.
Jmmp 09 00099 g005
Figure 6. Assessment of retraction groove: (a) Abbott–Firestone profile; (b) autocovariance profile with distinct peaks at 1.5 mm and 3 mm, highlighted with asterisks.
Jmmp 09 00099 g006
Figure 7. Phase position of waviness profile.
Jmmp 09 00099 g007
Figure 8. (a) Phase position of worn reamer for plate 4; (b) position deviation of worn reamer for plate 4.
Jmmp 09 00099 g008
Figure 9. (a) Phase position of less worn reamer for plate 8; (b) position deviation of less worn reamer for plate 8.
Jmmp 09 00099 g009
Figure 10. Measured forces (bending moment, axial force, torque) during the reaming process of one bore.
Jmmp 09 00099 g010
Figure 11. Bending moment based on position deviation: (a) plate 4; (b) plate 8. Note that the scaling of the axes varies, reflecting the fact that the position deviations for the worn tool (a) were significantly higher.
Jmmp 09 00099 g011
Disclaimer/Publisher’s Note: The statements, opinions and data contained in all publications are solely those of the individual author(s) and contributor(s) and not of MDPI and/or the editor(s). MDPI and/or the editor(s) disclaim responsibility for any injury to people or property resulting from any ideas, methods, instructions or products referred to in the content.