1. Introduction
Fusion welding is widely used to manufacture complex structures for engineering applications but introduces high-magnitude weldment residual stresses that are difficult to quantify with high confidence because of their magnitude (large zones of material at yield level) and their inherent tensorial nature. The Contour Method is a well-established destructive technique for determining cross-sectional maps of residual stress in manufactured metallic components. However, for some welded components, redistribution of high-magnitude residual stresses during the contour cutting step can result in local plastic deformation of the cut faces, giving large errors in back-calculated residual stress.
The Contour Method was initially proposed in 2000 by Dr. Mike Prime and colleagues at Los Alamos National Laboratory [
1,
2]. The technique involves progressively sectioning the test component across a plane of interest using wire electrical discharging machining (EDM). This relaxes the internal residual stress field, allowing the trailing flanks of the cut faces to distort. The out-of-plane deformation of the opposing cut surfaces is then measured using a coordinate measuring machine (CMM) fitted with a touch probe or optical measurement system. The measured surface deformation datasets from the cut half-components are then combined (averaged) and processed to remove outlying data points. The resultant combined and smoothed “surface deformation contour” is finally applied as a negative normal displacement boundary condition on the cut surface of a 3-dimensional (3D) linear elastic finite element (FE) model of one-half of the component in order to back-calculate the original residual stresses present acting normal to the cut plane [
3]. By this means, high spatial resolution cross-sectional maps of measured residual stress can be determined in large and small metallic components of complex geometry.
Since its inception, the Contour Method has undergone considerable development, including measurement of multiple stress tensor components by multiple methods [
4] and by multiple cuts [
5], implementation of novel wire EDM cutting strategies to minimize introduction of plastic deformation errors during cutting [
6,
7,
8,
9], uncertainty evaluation [
10,
11,
12,
13], and interlaboratory reproducibility [
14,
15]. The method has been widely accepted and utilized in various industries, such as aerospace (e.g., turbine discs, fan blades, and satellite propellant tanks) [
16,
17,
18], additive manufacturing (e.g., moulds and tool inserts) [
19,
20,
21,
22], transportation (e.g., railway rails) [
23,
24], energy (e.g., pressure vessel weldments) [
25,
26,
27], and medical (e.g., femoral implants) [
28] to map residual stresses in fabricated components [
29,
30,
31]. But the practical application of the Contour Method can be challenging [
32]. A fundamental requirement is that residual stress relaxed by wire EDM sectioning must be accommodated by linear elastic deformation across the component cut faces. Otherwise, the method will determine a residual stress field with short- and long-range stress errors owing to the introduction of local cutting-induced plastic strains (CIP) that cannot be corrected through deformation data processing or the back-calculation [
3].
Several research studies have investigated strategies for eliminating or mitigating CIP strains in Contour Method residual stress measurements by focusing on the cutting sequence employed [
6,
7,
8,
9] or by applying near-rigid (high-restraint) boundary conditions to the test component during wire EDM cutting in order to minimize stress redistribution when balancing residual stresses are released [
33]. However, it can be difficult to achieve high restraint (effective clamping) close to the cut line of components of complex geometry. If significant prior information is known about the residual stress field that is present in the component being tested [
9,
34], a bespoke contour cutting path can be designed that minimizes the development of stress concentration ahead of the wire EDM cut trajectory and thereby reduces the introduction of CIP stress errors. Another approach, referred to as the “embedded cutting configuration”, leverages the self-restraint of the test component during cutting in order to reduce the CIP strains, and this has also shown some success in practice [
6,
7]. The method involves introducing pilot holes near the component edges, then cutting the material between the pilot holes before finally cutting the material between the holes and the component edge. Another strategy developed for mitigating the introduction of CIP stress errors [
8] involves performing successive incremental contour cuts to reduce the residual stress in the body of interest. Each cut leads to stress relaxation at the plane of the next contour cut, thereby reducing the risk of plasticity during the subsequent cut. The original residual stress at the plane of interest can then be reconstructed by superimposing the relaxed stresses from each of the sequential contour cuts. The strategy has been shown to be effective in reducing CIP stress errors but may accumulate propagating errors from successive cuts and lose accuracy if significant shear stresses exist at the cut planes. However, for some welded components, redistribution of the residual stress field during the contour cutting step can result in errors in the measured residual stress map.
This article presents a novel implementation of the Contour Method for welded components that has the potential for mitigating the risk of introducing CIP strain relief errors in the measured residual stress field. An orthogonal cutting sequence is applied where a welded component is first cut along the weld centreline (in the longitudinal direction) into two mirror-symmetric halves. This releases residual stresses acting in the transverse direction at the cut plane and partially relieves stresses acting in the remaining cut parts. Each one-half component is then cut transversely towards the weld line at mid-length, and the original residual stresses present on each cut section are determined using the multiple cut contour method.
2. Research Approach
Implementation of the proposed new contour measurement approach to fusion-line weldments is studied numerically (
Section 3) for an evaluation weldment and experimentally (
Section 4) for a demonstration weldment.
First, an initial simplified thermo-mechanical weld mechanics analysis is performed in order to create a representative evaluation weldment (i.e., a synthetic line-weld residual stress field in a flat plate). Second, a non-linear finite element (FE) is used to simulate various contour method cutting scenarios and predict the associated stress-relaxed deformation of the cut faces. Then, linear elastic FE can be used to back-calculate the residual stresses originally present in the welded plate for each cutting sequence. Finally, these results can be compared with the original synthetic residual stress field. This final step will allow direct quantification of the errors in the (simulated) measured residual stress profile.
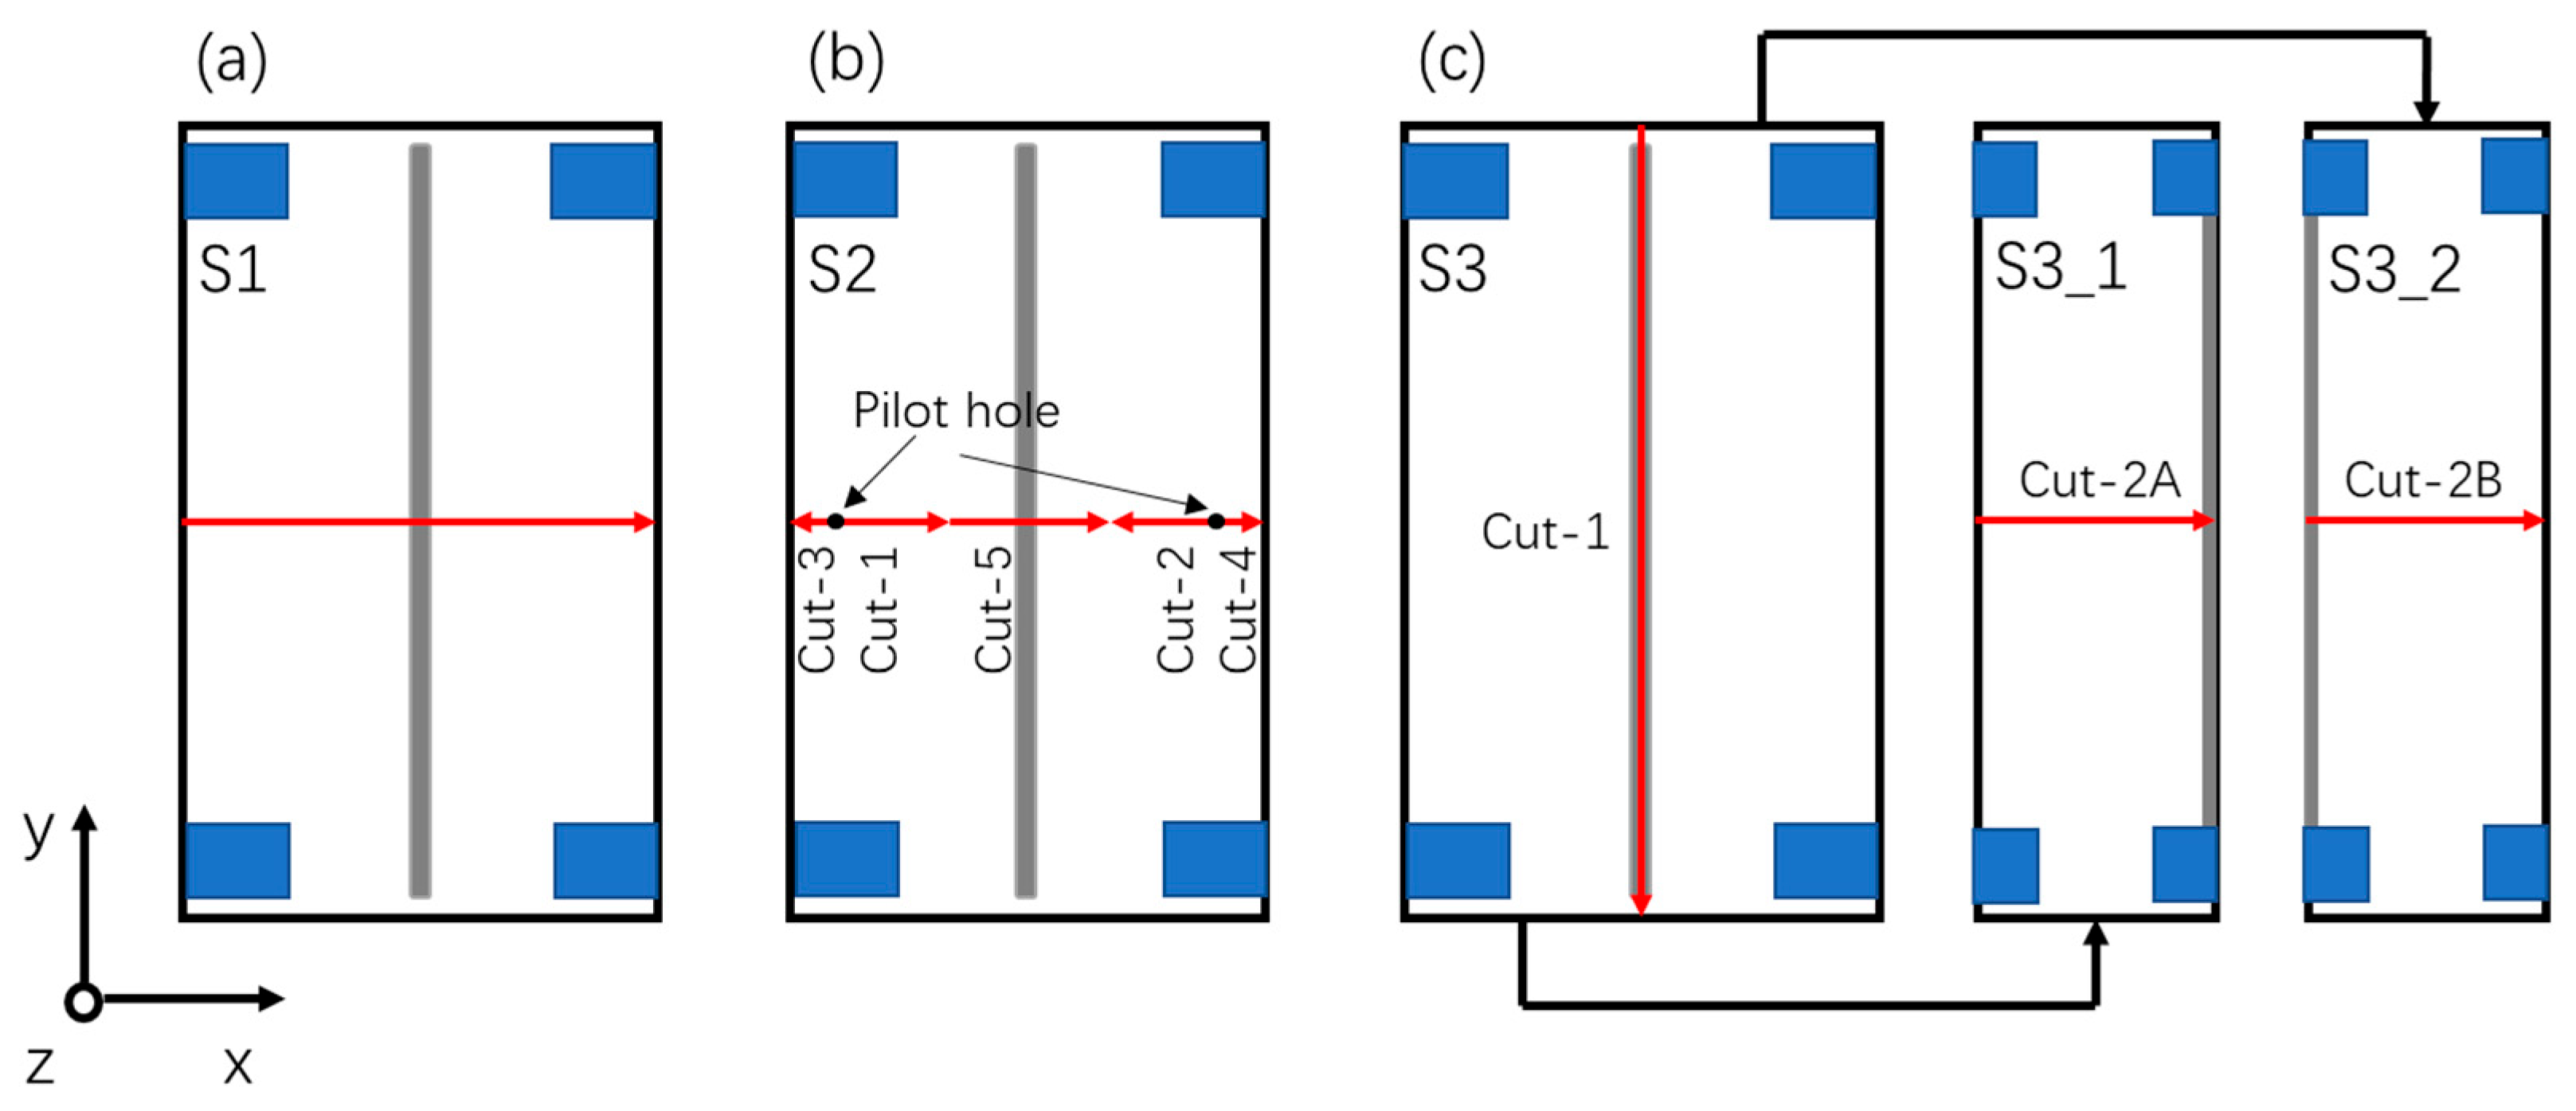
The efficacy of the new approach will be compared with simulated residual stress contour results from a standard single-cut strategy along the transverse direction of the welded plate (see S1 in
Figure 1a) and with results from a double-embedded cutting strategy that is often adopted in practice to try and mitigate weldment cutting plasticity errors (see S2 in
Figure 1b). The novel (bisecting) orthogonal-cutting strategy is illustrated as S3 in
Figure 1c. It involves first performing a longitudinal contour cut along the weld centreline (WCL), followed by a second transverse contour cut from the edge of the plate to the WCL, as illustrated in S3_1. A third cut, S3_2, is then performed on the remaining half plate. The accuracy of the residual stress profiles determined by the four cutting scenarios will then be evaluated. Having demonstrated the benefits of applying a prior bisecting cut by numerical analysis of a synthetic fusion line-weldment along a plate, we will apply the new approach to Contour Method experimental determination of residual stresses present in a real line-weldment of similar geometry (
Section 4), showing how measurement CIP stress errors can be essentially eliminated.
3. Evaluation Weldment–Numerical Model
A residual stress field representative of an autogenous line weld at the top surface of a flat plate was created using a simplified weld computational mechanics simulation approach for use in subsequent Contour Method measurement simulation studies. Comprehensive guidance on the calculation of welding residual stress in austenitic weldments can be found in the R6 defect assessment procedure [
35], including the simple initial temperature heat source approach adopted here. A rectilinear base plate geometry of dimensions 200 mm × 120 mm × 18 mm was chosen for the model, with temperature-dependent material physical and mechanical properties for AISI Type 316 austenitic stainless steel drawn from published literature. An initial temperature field was applied to the model by ‘heating’ a nominal weld fusion zone in the model from 25 °C to a temperature distribution
T calculated using Equation (1), and then ‘cooling’ it down to 25 °C.
where
T0 = 1339 °C represents the maximum temperature,
is a Gaussian-shaped function with its peak located at the top centre line of the plate, and
R1 = 7.5 mm and
R2 = 7.2 mm represent temperature gradients in the x and z directions, which can be calculated using Equation (2):
In practice, the temperature field was applied in the ABAQUS FE model using a UTEMP subroutine, and the residual stress field was subsequently calculated through static mechanical analysis. Material properties in terms of elasticity, plasticity, and thermal expansion at various temperatures were adopted from the literature [
36], with an isotropic hardening model selected to overestimate predicted residual stresses [
35]. This simplified welding residual stress simulation approach offered the advantage of significantly reduced computational time compared with a full moving heat-source type of thermo-mechanical weld pass deposition analysis. Moreover, it allowed the creation of the high-resolution FE mesh required to study the impact of Contour Method cutting sequence on CIP, for which a total of 138,897 linear hexahedral eight-node elements (C3D8R) were employed. The finest mesh resolution is situated at the top of the cut plane, with element sizes of 0.5 mm along the
X direction, 0.2 mm along the
Y direction, and 1 mm along the
Z direction, as illustrated in
Figure 2.
It is worth emphasizing that the primary purpose of this computational model was to generate an initial weld residual stress distribution having a pattern and magnitude representative of what is typically observed in a stainless-steel line-welded component. The simplified approach improved computational efficiency, allowing adoption of a denser mesh along the line where the contour method cutting simulation would be later performed. Thus, the aim of the simulation was not to replicate an exact residual stress field but rather to provide a realistic input for the cutting simulation in the context of simulating and optimizing the contour measurement method. Nonetheless, a more rigorous simulation of the initial weld residual stress field would add confidence in the relevance of findings.
The predicted residual stress/strain distribution from the welding simulation was subsequently transferred to a new model with the same mesh by adopting the stresses and plastic strains from the final step of the welding analysis. This approach preserved the residual stress state while excluding any distortion caused by the welding process simulation. The four contour cutting sequences (illustrated in
Figure 1) were then investigated using the new model by removing through-thickness element sets at the cut plane using the model change function in ABAQUS 2018 software [
7,
9] in elastic-plastic deformation analyses. For the single-cut and double-embedded-cut strategies, predicted nodal out-of-plane displacements of both surfaces (that included CIP strain errors) were extracted from the model and averaged prior to being applied to the cut surface of a linear elastic ½-model as a boundary condition for conventional Contour Method (linear elastic) residual stress back-calculation [
3]. But for the new orthogonal-cutting strategy, longitudinal residual stresses relaxed by the first cut were added by applying its associated measured deformation contour in the linear elastic back-calculation FE model for the second cut [
5], thereby determining the total original residual stress field acting normal to the second cut face.
3.1. Evaluation Weldment–Predicted Residual Stress Field
Figure 3a displays the longitudinal residual stress distribution introduced into the welded plate numerical model. As intended, the initial temperature welding heat source simulation has introduced high magnitude tensile residual stresses (red zone) in the weld melt region along the length of the plate of approximately 400 MPa. These tensile stresses are balanced by compressive longitudinal stresses (blue contour) in the adjacent base plate.
Figure 3b displays the predicted residual stress distribution acting transverse to the welding direction. The simulated weld residual stress field shares the essential distribution characteristics of similar thickness (25 mm) stainless steel plate line-weldments that have been determined by detailed numerical and experimental studies; for example, see R6 Procedure Section V.6: Worked Example of the Calculation of Residual Stress in Weldments [
35,
37].
3.2. Evaluation Weldment–Simulated Contour Method Measurement
The first row of
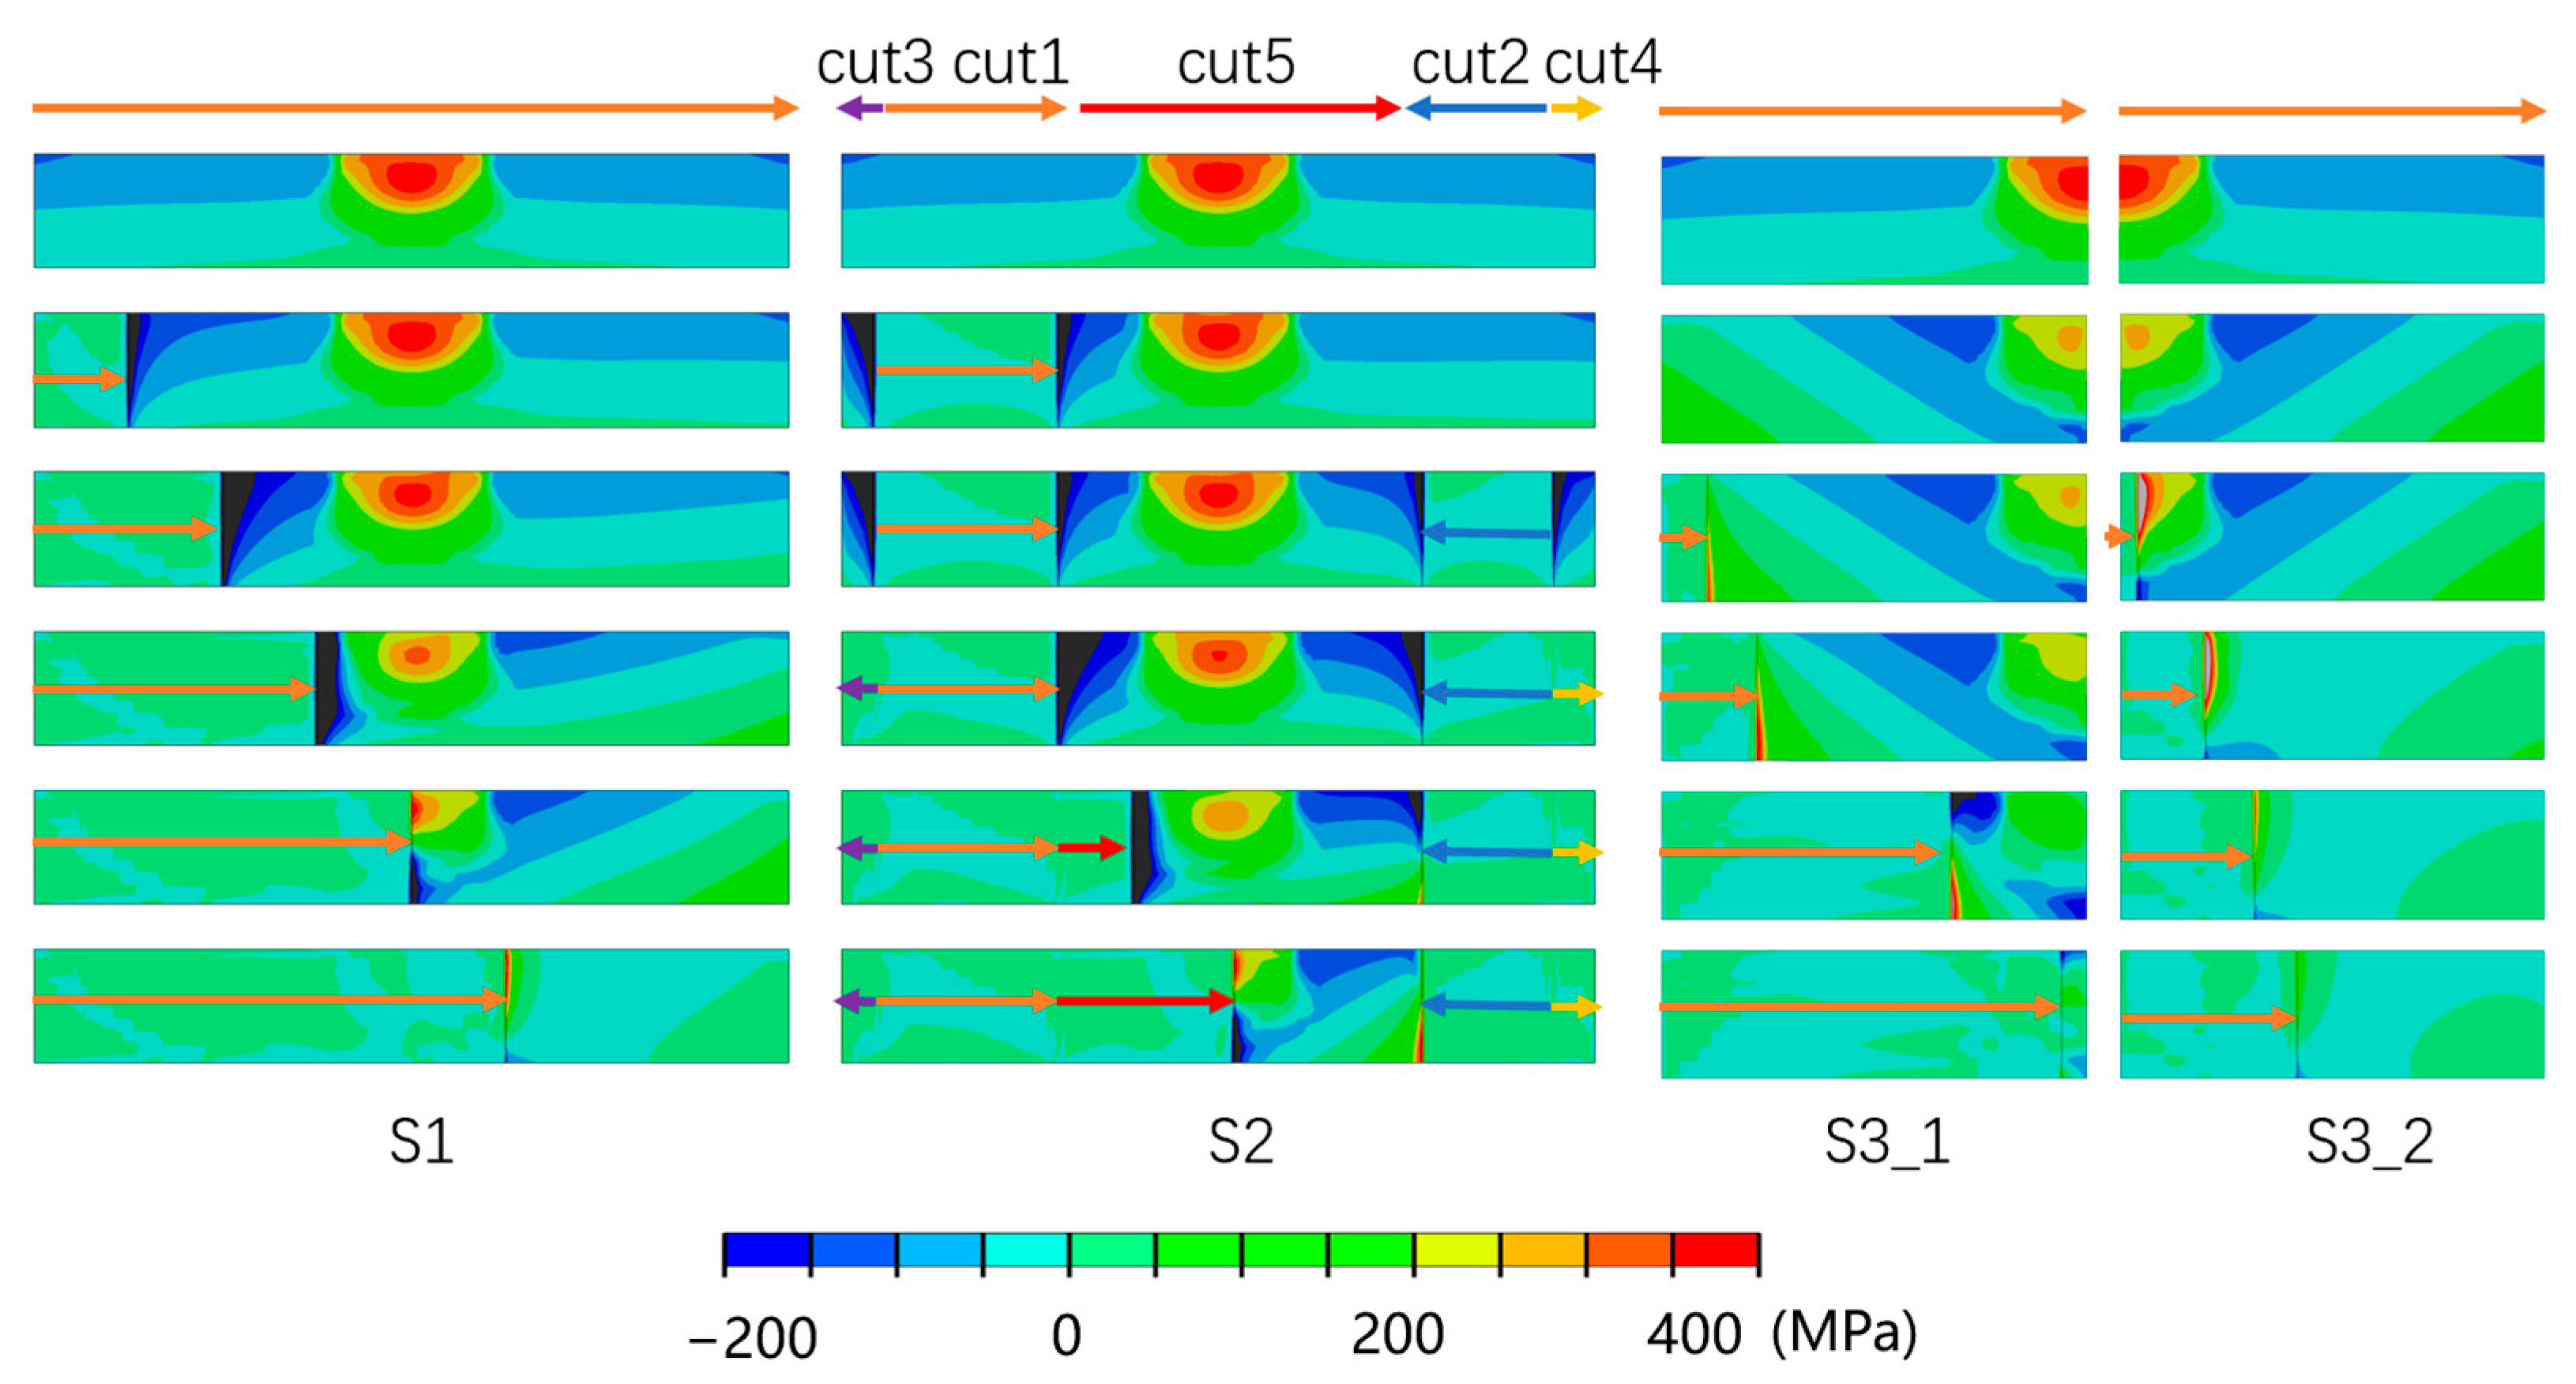
Figure 4 displays the predicted initial distribution of longitudinal residual stress acting on the cross-section of the numerical evaluation weldment. Rows 2 to 6 in
Figure 4 present maps of redistributed longitudinal residual stress introduced by simulated contour cuts (showing important features of the stress field at various cut lengths). The first column illustrates simulated contour cut results for the standard edge-crack cutting strategy (S1) at five cut lengths, the second column presents results from the embedded-cut strategy (S2), and the third and fourth columns show equivalent results arising from the proposed (new) orthogonal-cutting strategy (S3_1 and S3_2).
For the edge-crack cutting strategy (S1), compressive stress concentration builds up at the cut tip as the cut length approaches the weldment tensile zone. This compressive stress buildup is sufficient to introduce significant CIP deformation errors in contour method back-calculated stresses. The compressive stress concentration begins to dissipate as the cut line approaches the more tensile WCL zone, and the remainder of the cut benefits from longer-range relaxation of the original stress field (which limits risks of tensile-driven CIP deformation).
The embedded-cut strategy (S2) generates compressive stress concentrations at the leading tip of cut 1 and similarly at cut 2, but of less intense magnitude compared with cutting strategy S1. Cuts 3 and 4 relieve the magnitude of tensile stress at the WCL, which is beneficial for minimizing stress concentrations during cutting across the tensile stress region.
The third column shows predicted stress redistribution results generated by the S3_1 and S3_2 cutting strategies, where for each case the mirror-symmetric one-half models include the added effect of stresses relaxed by the initial orthogonal cut. The second row displays the relaxed longitudinal residual stresses after the initial orthogonal cut at the WCL (note the relaxed level of stress compared with the first row). Rows 3 to 6 illustrate the elastic-plastic stress redistribution as the transverse cut proceeds. In particular, cutting sequence (S3_1) progressively relieves the high-magnitude tensile longitudinal stress zone whilst introducing low tensile and compressive stress concentrations (see row 5). The final cutting sequence (S3_2) that starts at the WCL initially creates an intense tensile concentration at short cut lengths but relieves much of the remaining residual stress as the cut develops.
3.3. Evaluation Weldment–Simulated CIP Strains
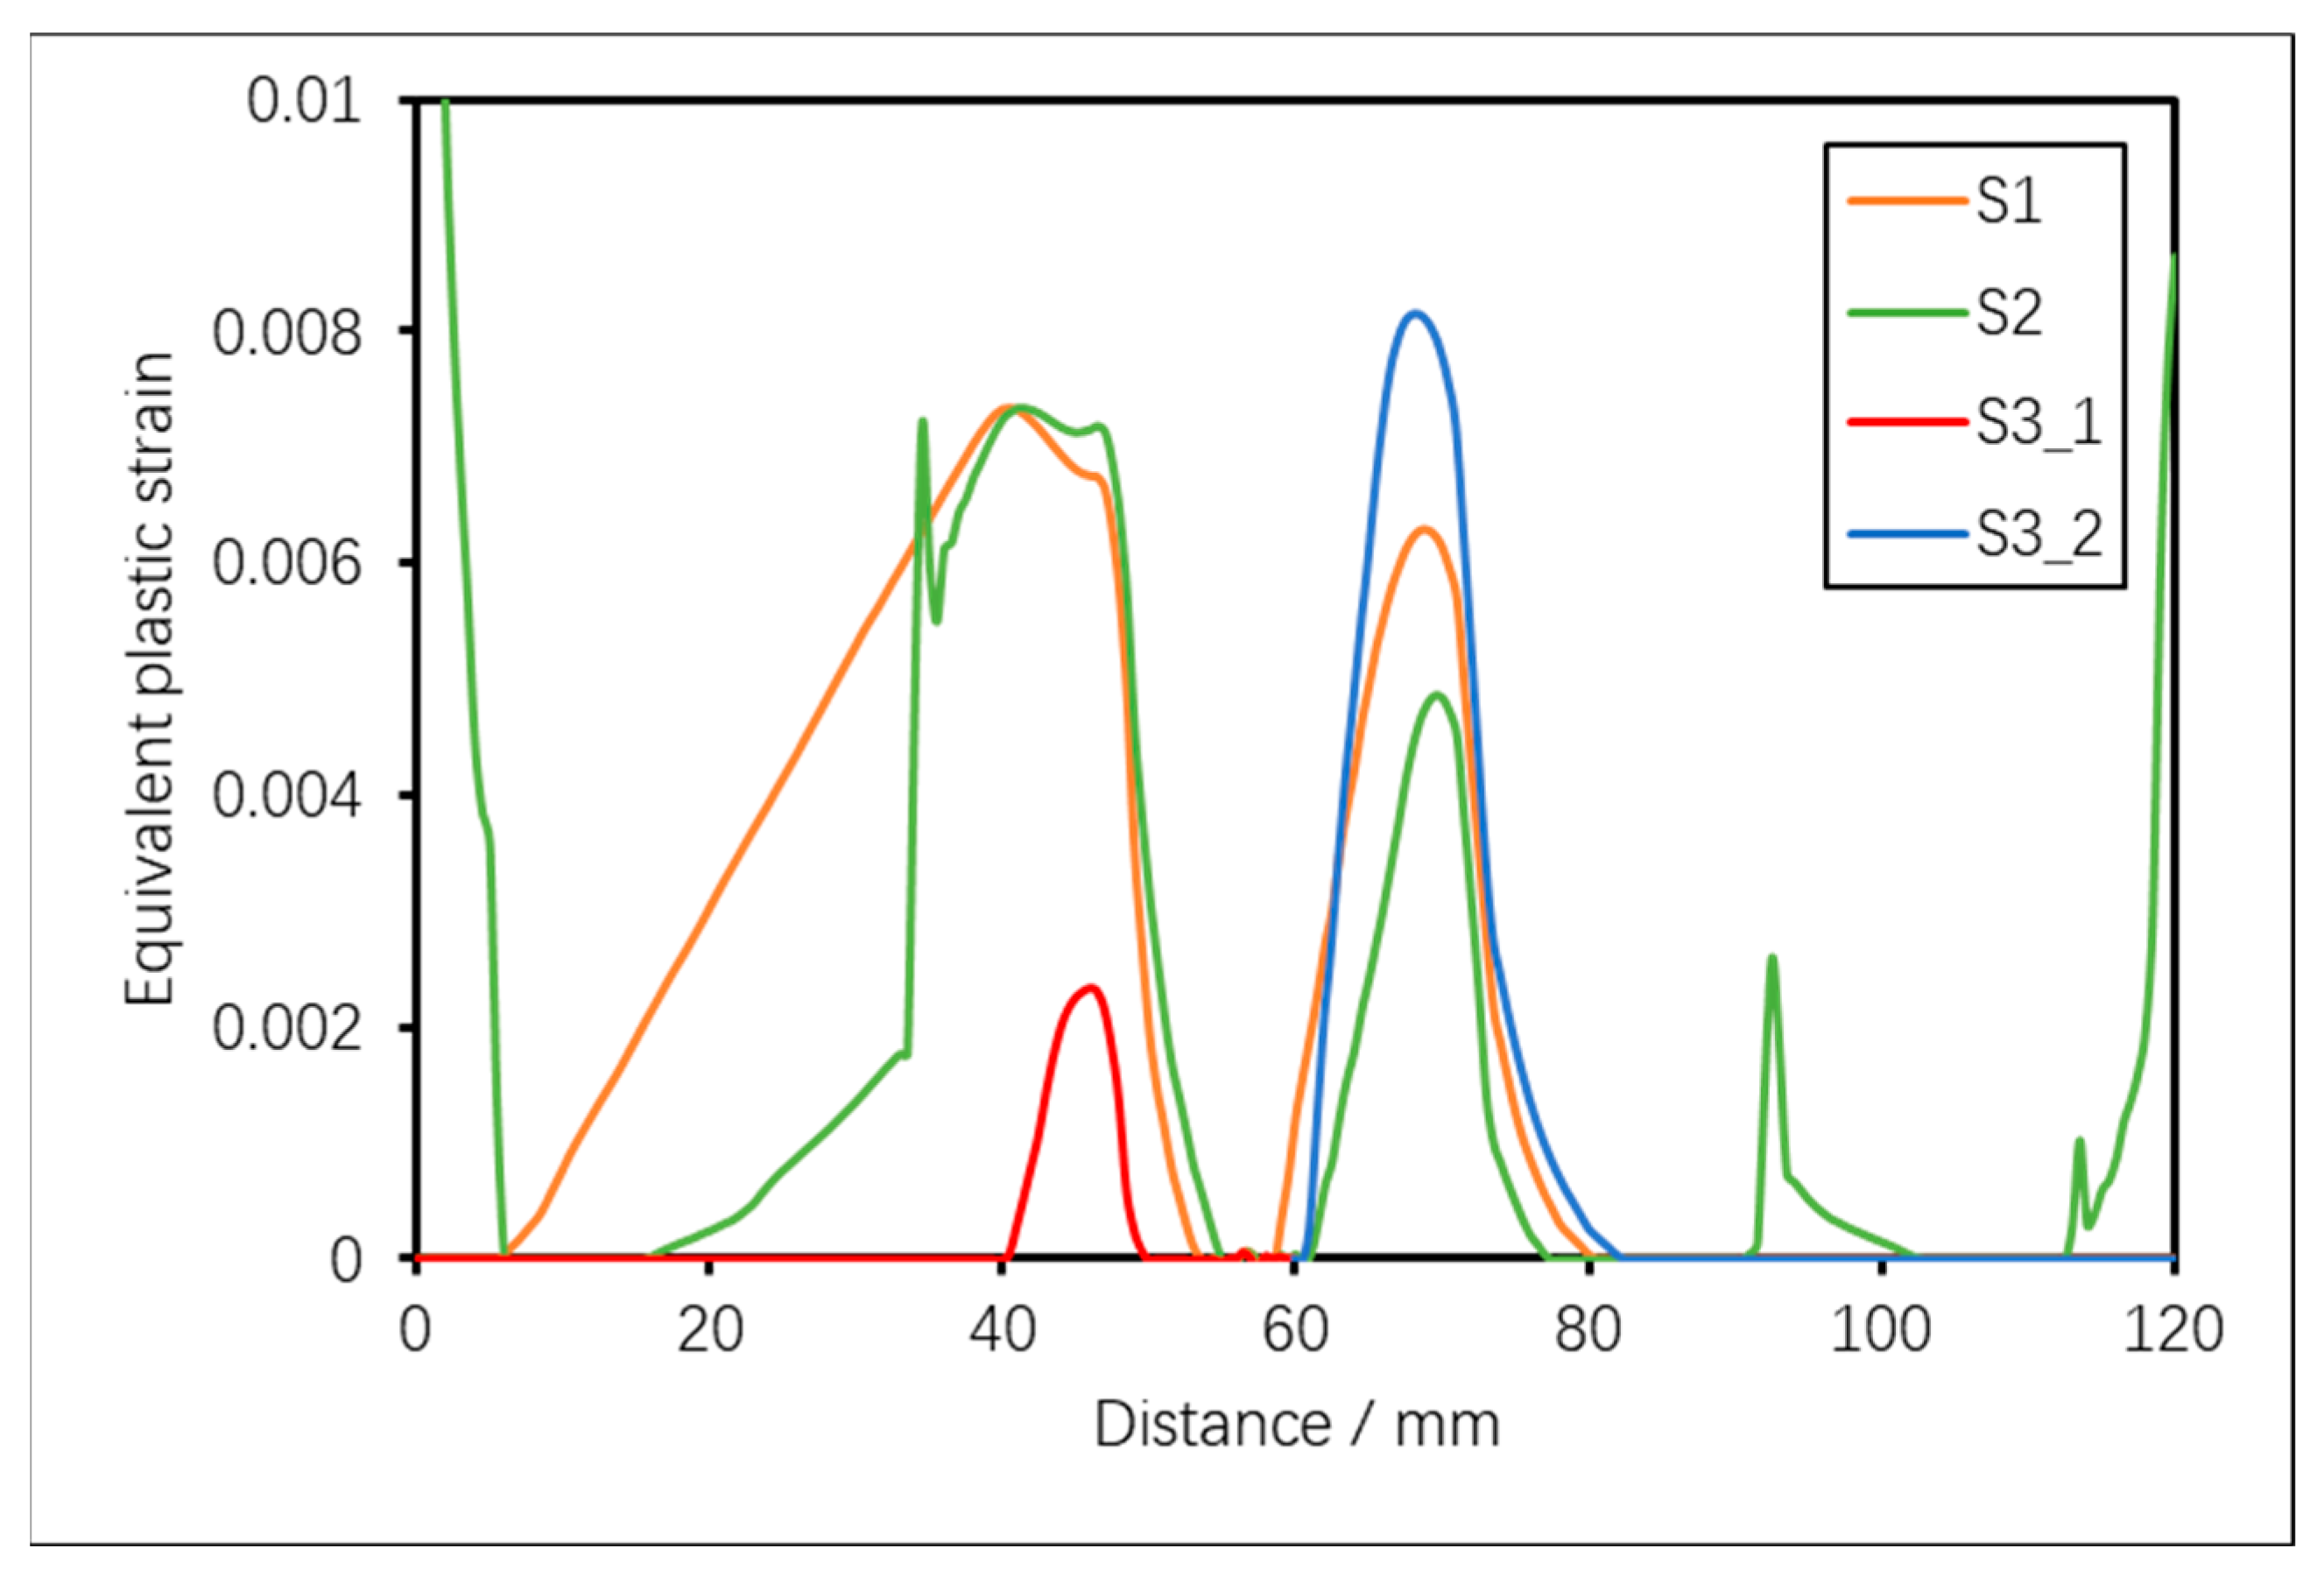
Figure 5 presents predicted plastic strain (equivalent plastic strain output PEEQ in ABAQUS) results for the four cutting configurations along the x-direction of the model at a depth of 3 mm from the top surface. The locations of finite plastic strain are seen to correlate with local regions of significant stress concentration. For the edge-crack cutting strategy (S1), PEEQ increases with cut length (owing to compressive stress concentration) before reducing at the weldment and then rising as the tensile stresses intensify just beyond the WCL. In the case of the embedded-cut strategy (S2), significant plastic strains are observed to develop in regions adjacent to all of the pilot holes as well as the edges of the weldment. Cutting configuration S3_2 introduces a plastic strain peak at short cut lengths owing to local redistribution of high magnitude longitudinal stresses in the weld melt region. In contrast, cutting configuration S3_1 introduces a local PEEQ peak of lower magnitude than predicted for the other three simulated cutting configurations.
3.4. Evaluation Weldment–Simulated Contour Method Stress Results
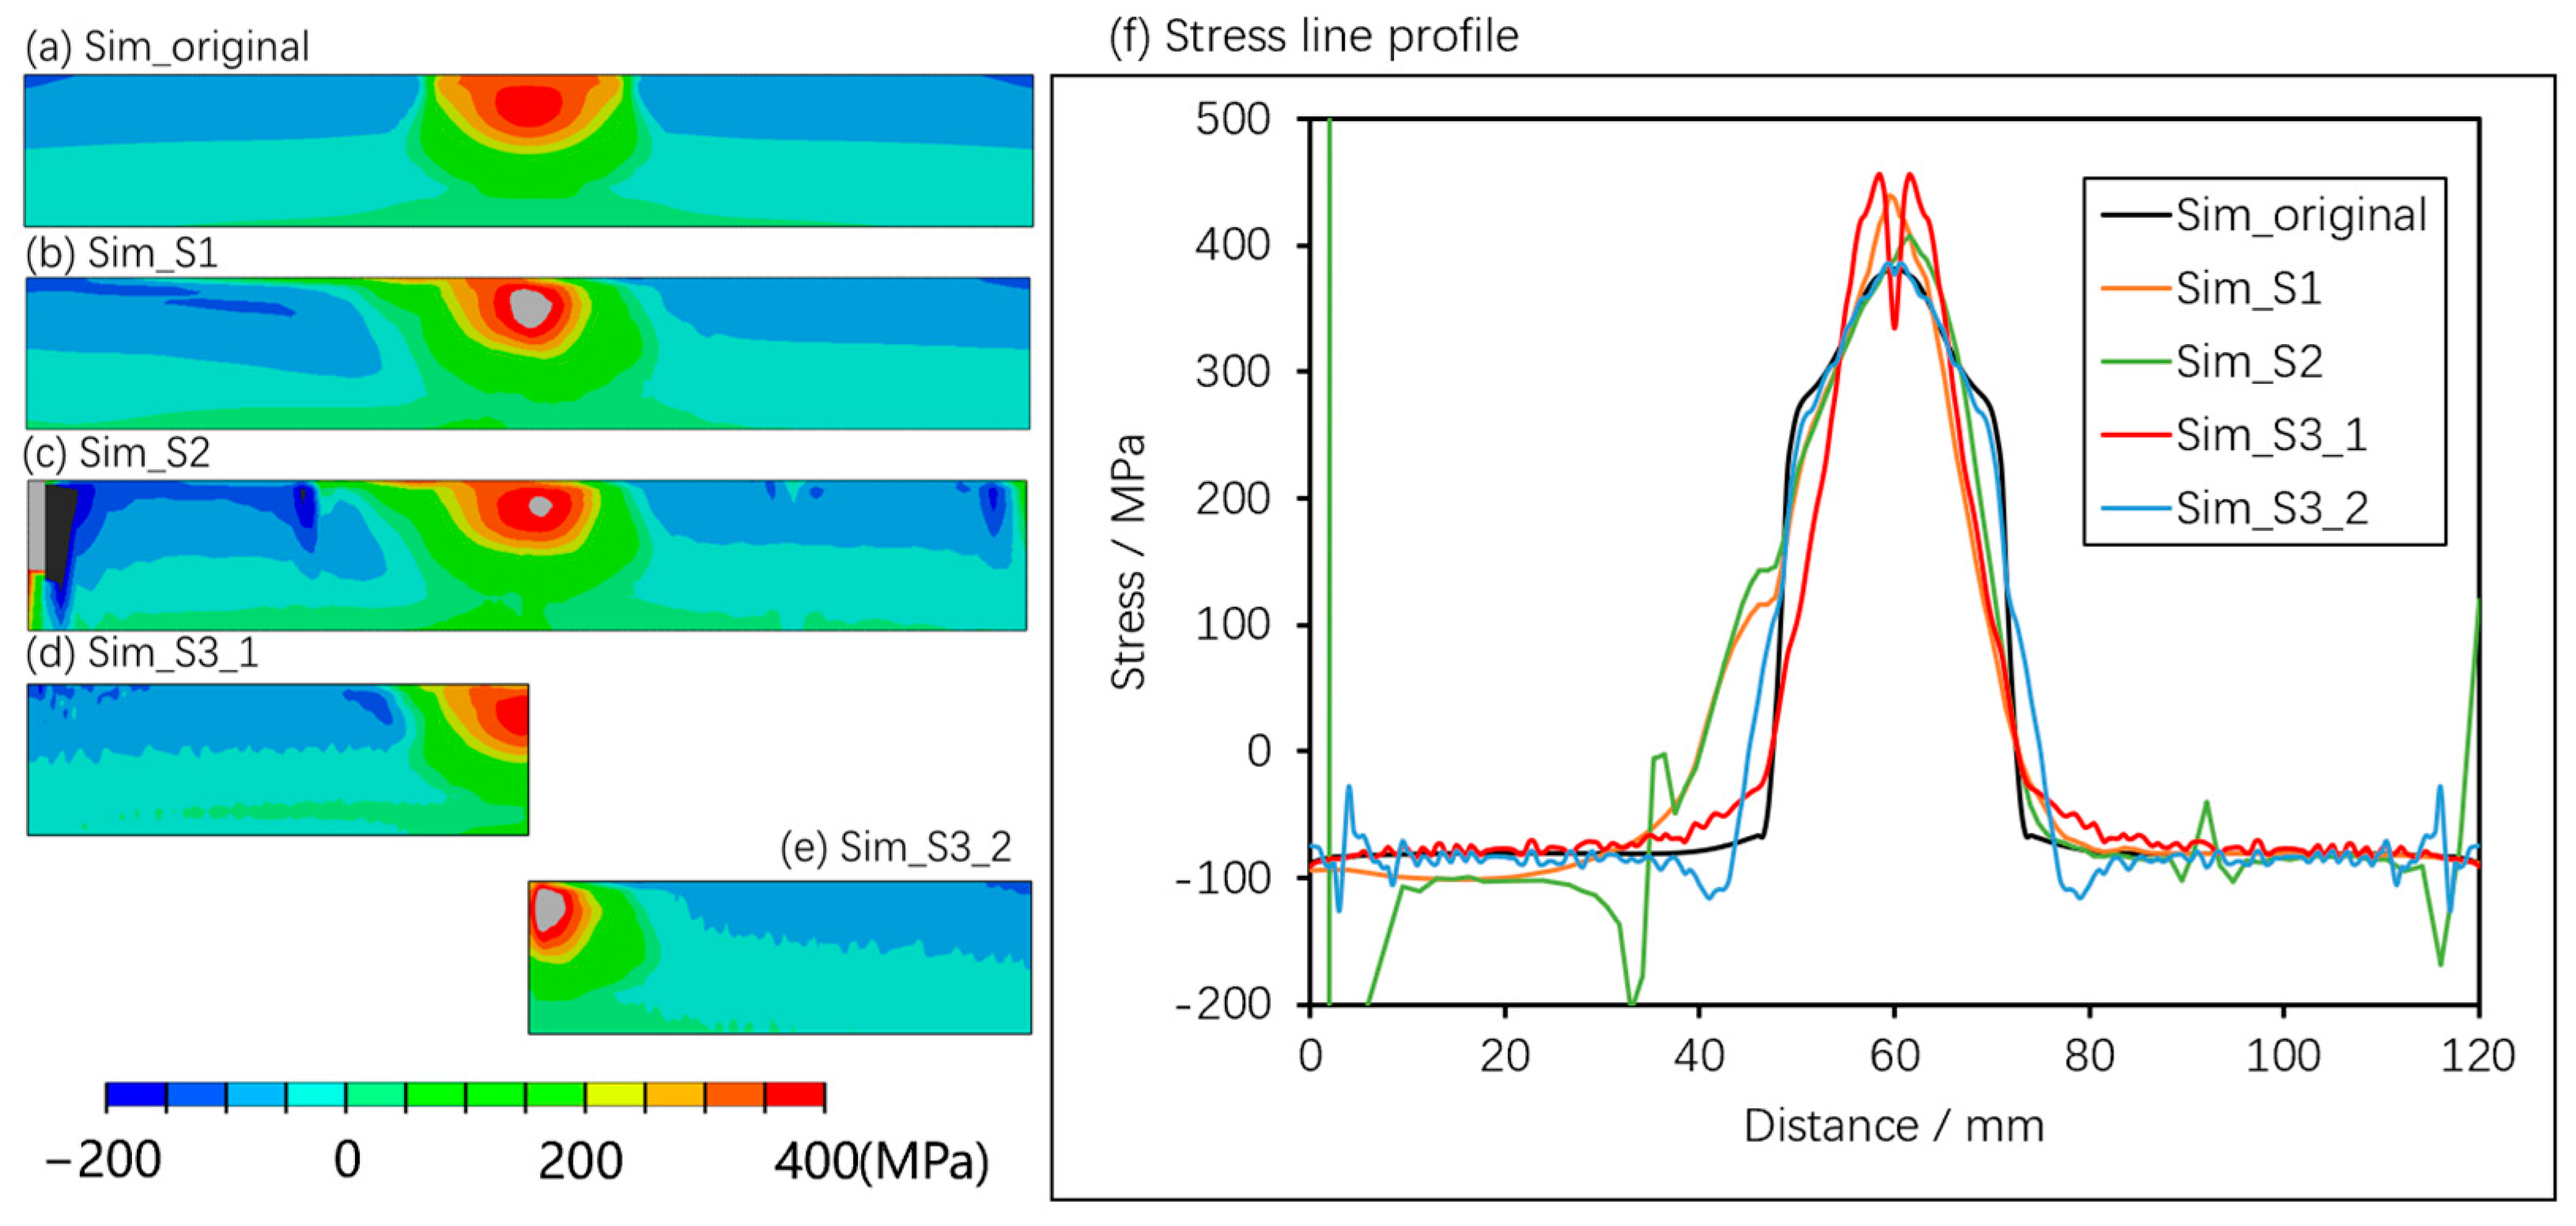
Figure 6a shows the predicted longitudinal residual stress distribution used for the numerical proof-of-concept evaluation. The original weld stress mapping (Sim, original) is compared with simulated contour method weld residual stress mapping for cutting sequences Sim_S1, Sim_S2, Sim_S3_1, and Sim_S3_2 (see
Figure 6b–e); stress profiles along a transverse line at 3 mm from the top surface of the model are compared in
Figure 6f. The general shape and amplitude of the ‘measured’ stress profiles follow the original weld residual stress field. But each simulated ‘measured’ profile evidences stress errors associated with the influence of CIP strains.
The overall errors in stress determination using the four cutting scenarios can be assessed by calculating the root mean square (RMS) of the differences in stress between the simulated measured profile and the original reference stress distribution across the domain (i.e., the width of the model from 0 to 120 mm). The results of this assessment are given in
Table 1 below. Sequence S3_1 is seen to deliver the least RMS stress error, followed by sequence S3_2. Engineers are also interested in the magnitude and distribution of residual stresses close to the WCL, where planar and volumetric defects can be introduced that can potentially jeopardize the life and structural integrity of the manufactured component. Thus, errors in the measurement of the maximum tensile residual stress in the region of the weld (fusion and heat-affected zone) are also of interest. We have therefore also listed the maximum absolute differences between the simulated peak tensile longitudinal stress and the stress profile initially introduced into the evaluation weldment. Contour cutting sequence S3_1 delivers a minimum overall error (RMS) in the stress profile across the weldment and represents the best measurement of local tensile residual stress close to the WCL. The next best cutting sequence in terms of overall profile is case S3_2, but this case also leads to a large difference close to the WCL. The edge-crack S_1 cutting sequence introduces compressive plastic strain errors in the ‘measured’ stress profile from 10 mm, and 30 mm from the WCL (note the characteristic “knee” in the profile often seen in weld contour measurements). The embedded-cut S_2 configuration produces a similar peak tensile stress to Case S_1, but the profile exhibits some asymmetry across the WCL and large absolute errors in regions close to the pilot holes. Overall, cutting sequence S3_1 delivers a close-to-perfect Contour Method measured residual stress profile.
4. Demonstration Weldment–Experimental Details
The numerical contour method measurement studies presented above for an idealized evaluation weldment have indicated that, in principle, low-stress error measurements of residual stress in a typical line weldment can be achieved by first undertaking a preparatory (stress reduction) bisecting wire EDM cut and correcting for the stress relaxation using the Contour multiple cuts method. It remains to demonstrate that the simulated optimized approach can be applied experimentally to a real weldment and deliver plausible low-stress error contour measurements.
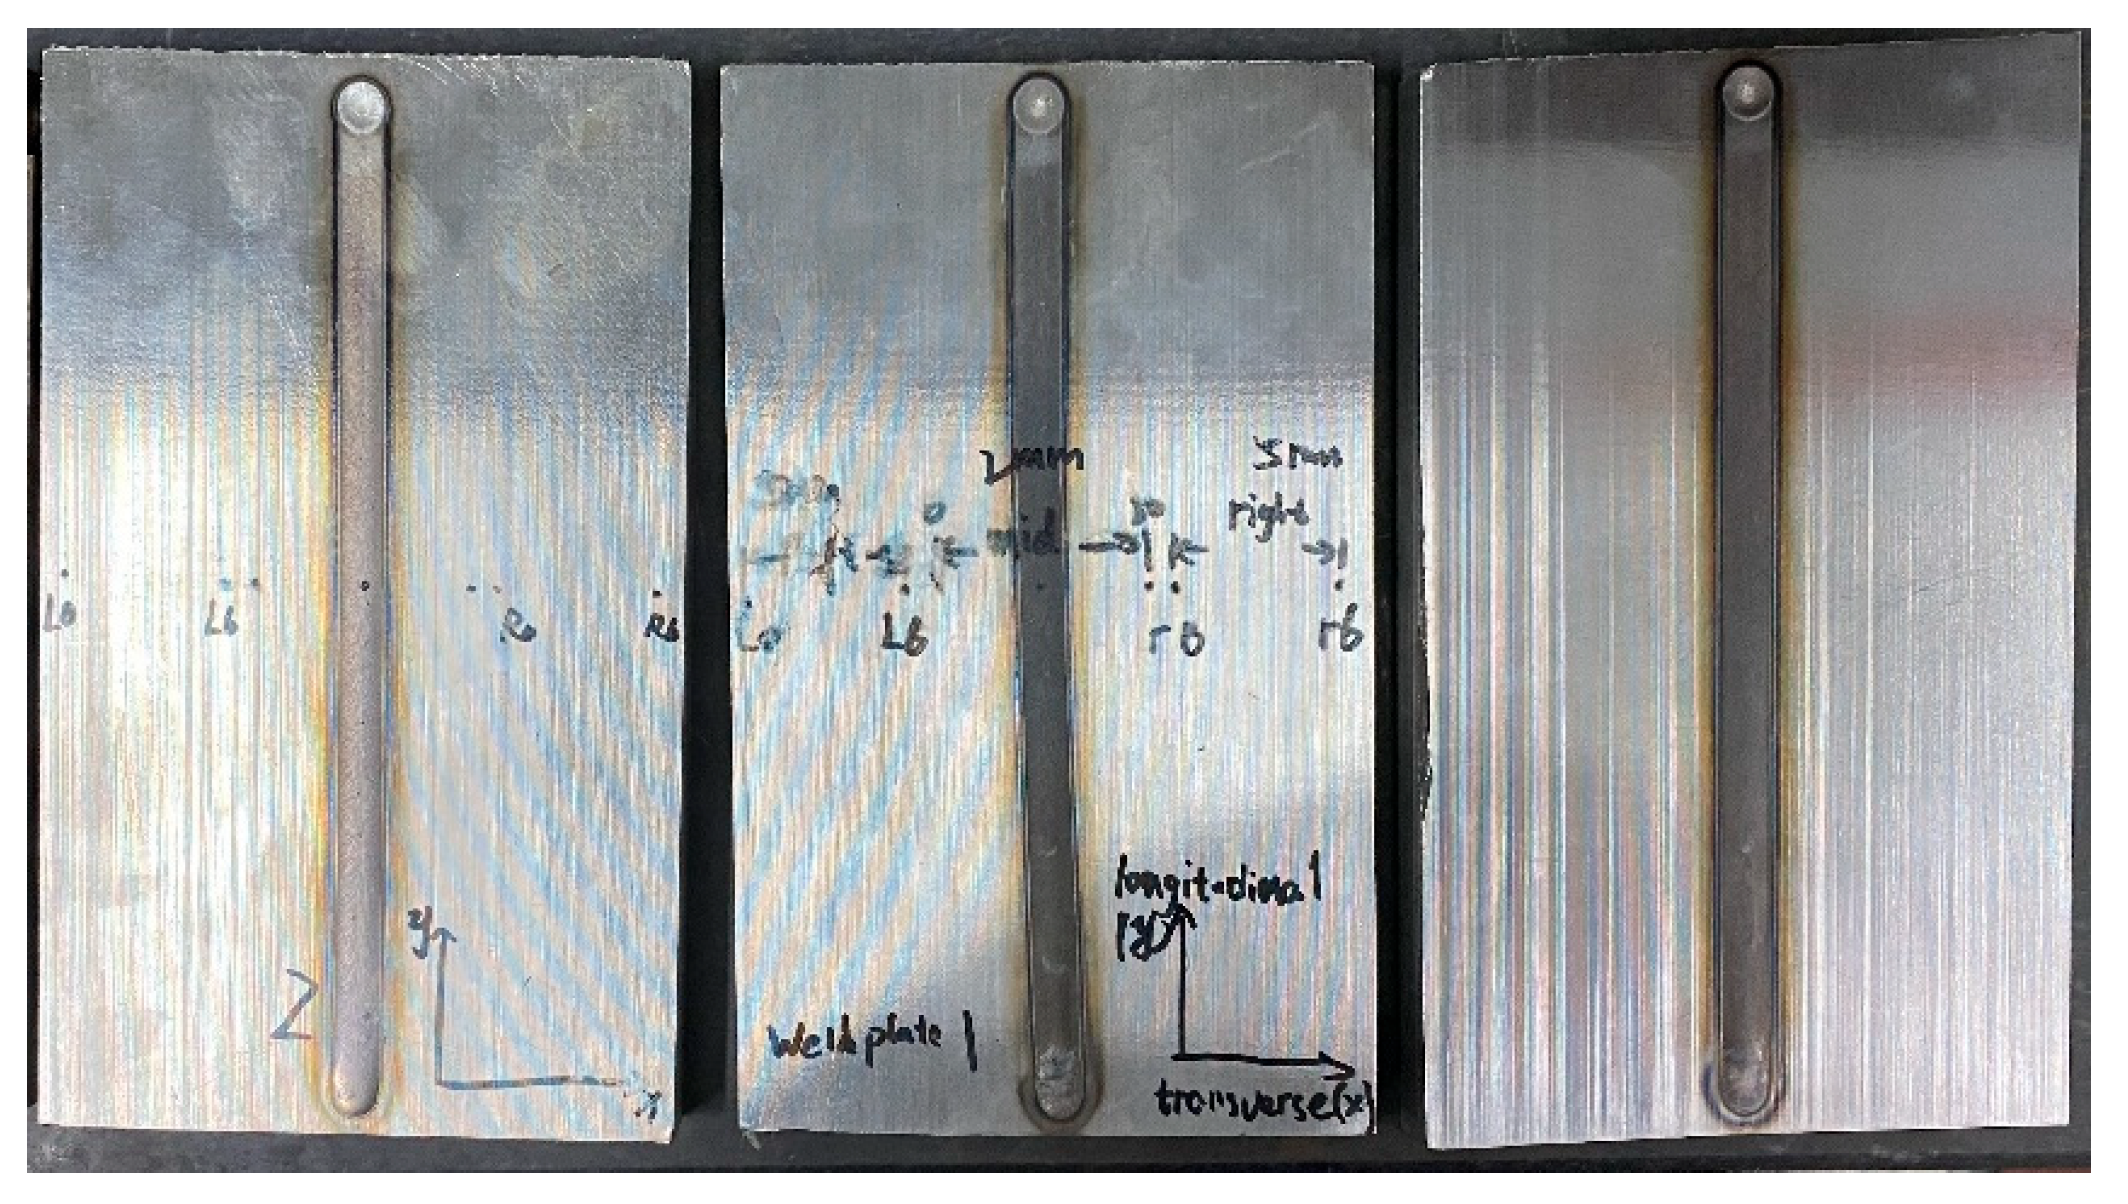
For this demonstration phase of work, three identical AISI Type 316H austenitic stainless-steel plates were machined to rectilinear dimensions of 200 mm × 120 mm × 18 mm. A gas tungsten arc welding process (GTAW) was then employed to introduce a single-pass autogenous weld along the longitudinal centreline of the top surface of each plate with an advance rate of 3 mm/s and welding current of 160 A under argon gas shielding. A self-fusion autogenous welding process without filler materials was used for welding of 316H steel plate, with the closed-circuit voltage in the range of 13–15 V. A photograph of the three welded plates is shown in
Figure 7. The nominal composition of the stainless-steel plate material used is given in
Table 2.
4.1. Demonstration Weldments–Contour Method Procedure
Contour Method experimental measurements were performed on the demonstration weldments in order to replicate the four different cutting configurations simulated for the evaluation weldment. Best practice outlined in reference [
32] was followed, with sacrificial layers added to the weldment surfaces to minimize cutting errors, particularly where the EDM wire entered and exited the component. A Sodick wire EDM machine (AP600L) with a 200 μm diameter brass wire was used to undertake all of the contour cuts using a “skim setting” that produced a cutting speed of ~0.3 mm/min. The wire EDM cutting parameters are listed in
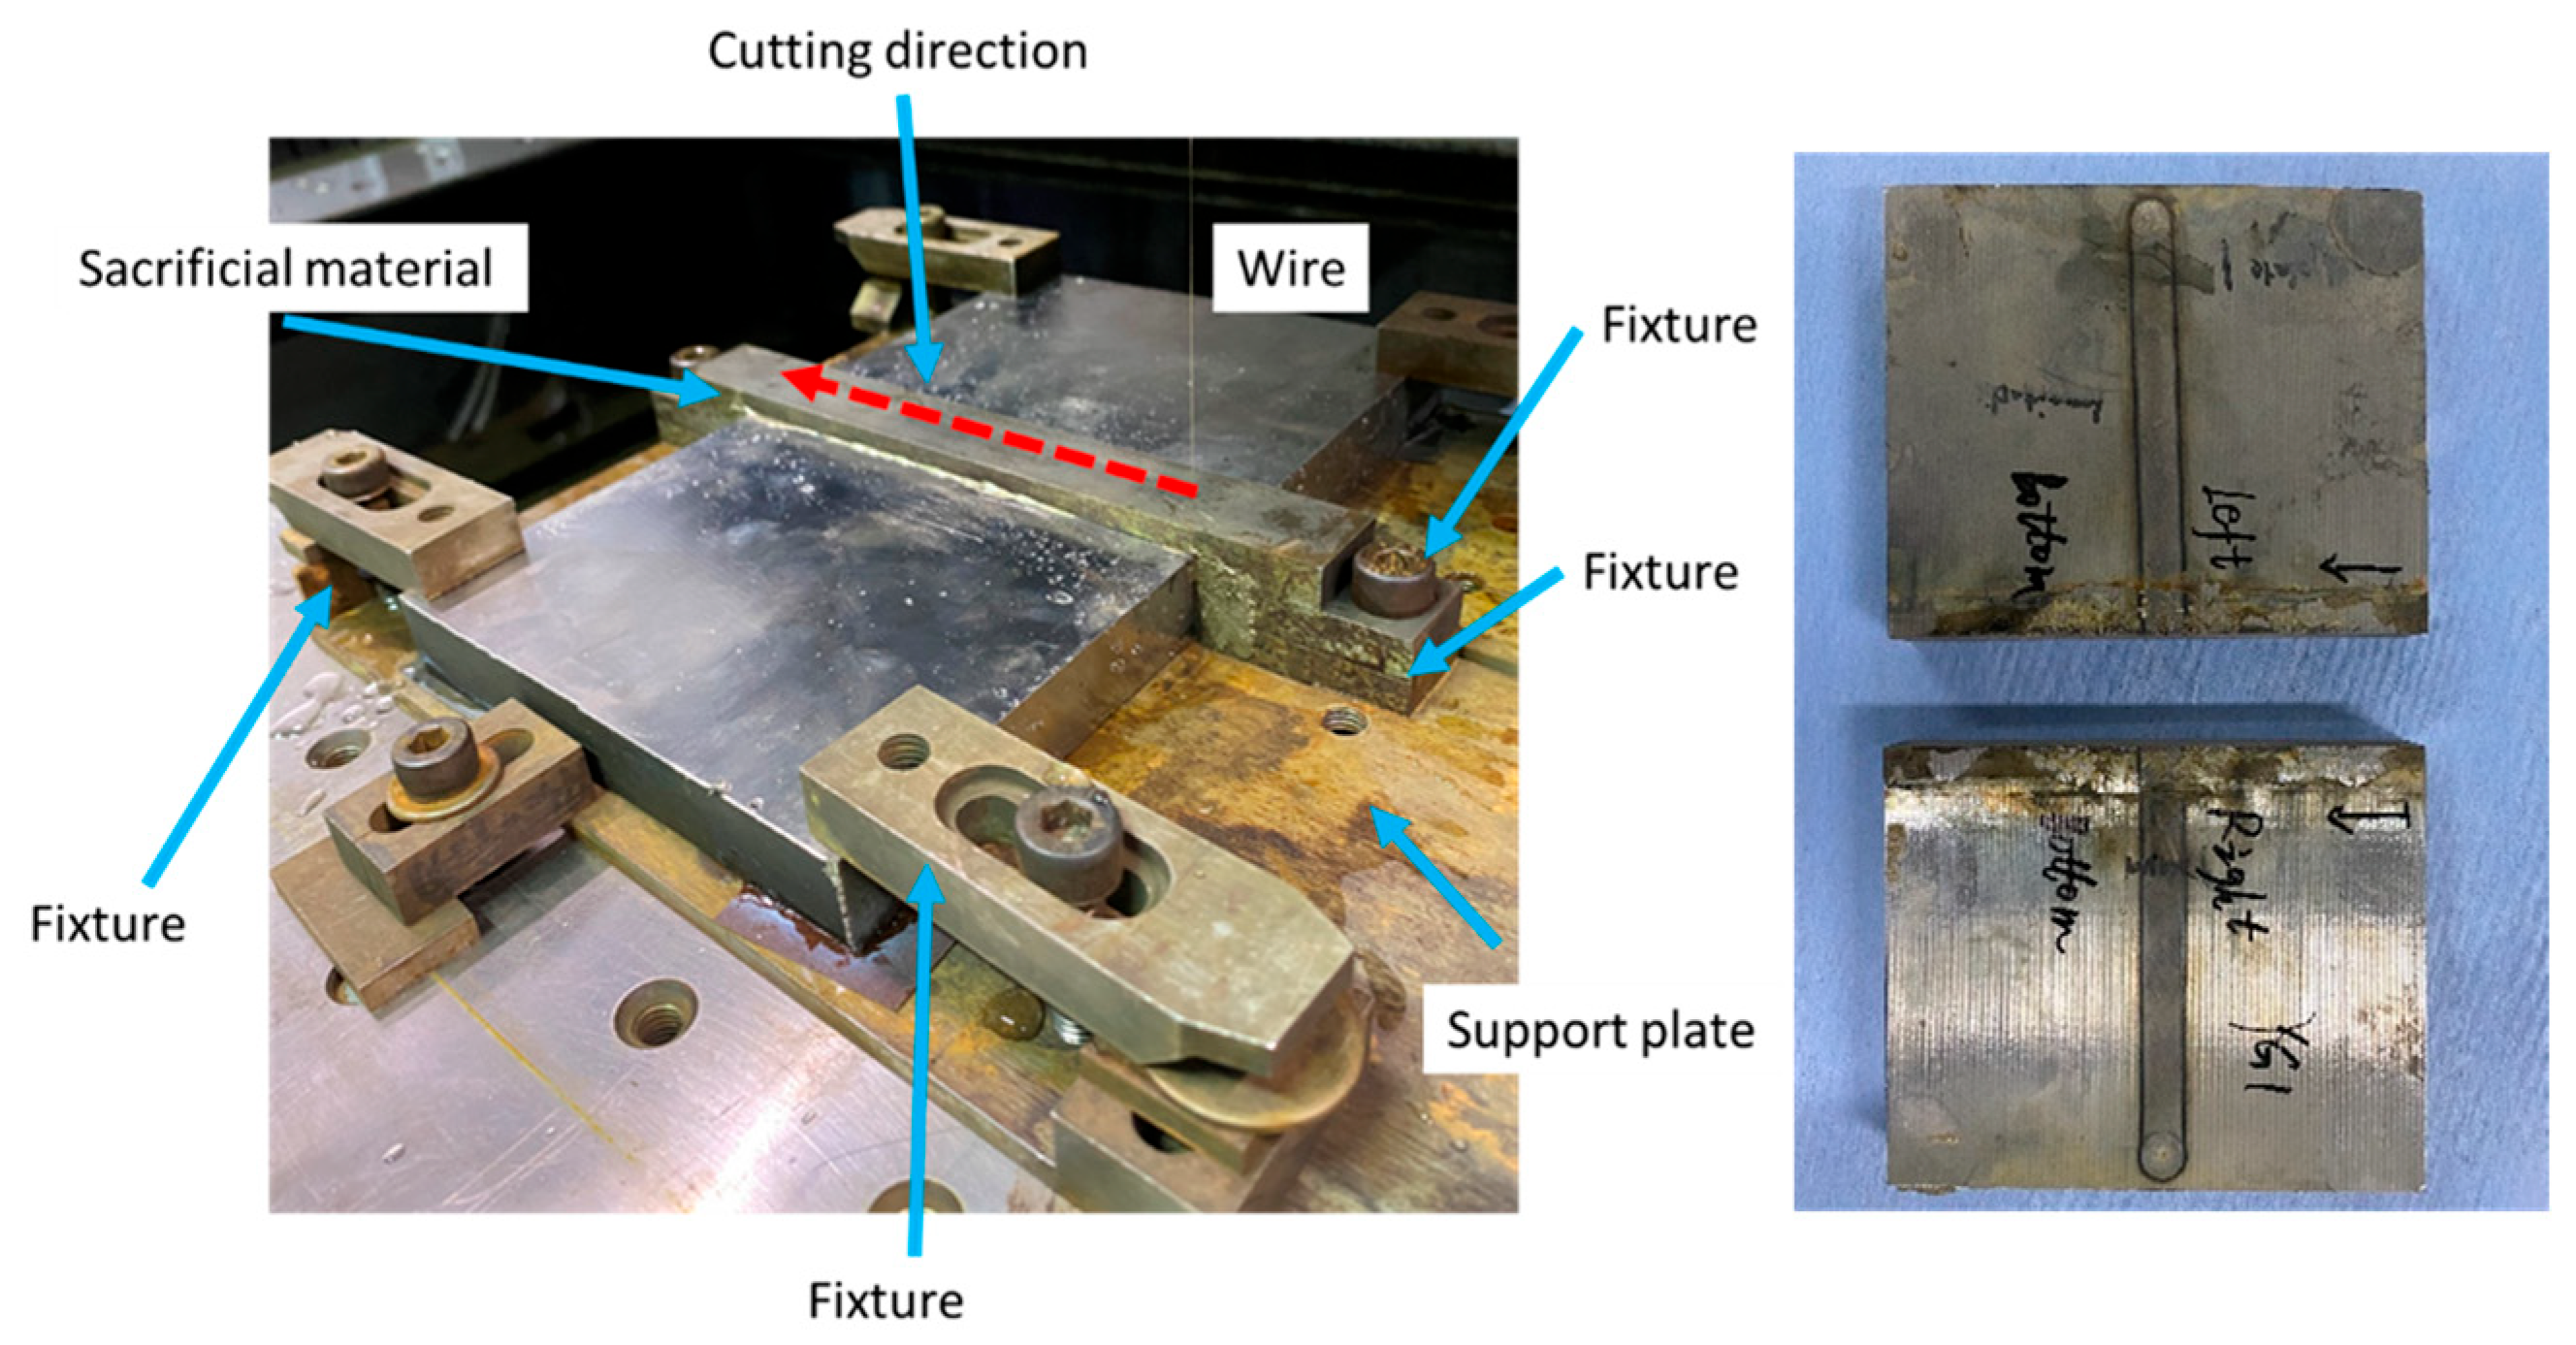
Table 3. The test weldments were submerged in deionized water during cutting to maintain temperature stability. Each of the welded plates was firmly clamped to the wire EDM machine bed to prevent movement during cutting, as illustrated in
Figure 8. The first weldment was cut using a conventional edge-crack cutting configuration (S1), and the second employed the double-embedded cutting configuration (S2). The third weldment (S3) was first cut along the WCL in order to reduce residual stress levels in the cut parts. Then, one of the half-plates was cut (S3_1) from the free edge to the WCL, and the other half-plate was cut (S3_2) from the WCL to the edge, as illustrated in
Figure 1 for the Evaluation Weldment. The beginning and end of a contour cut are generally more susceptible to displacement errors associated with cutting instability and local stress redistribution. To mitigate these effects, sacrificial run-in and run-off blocks of material are usually added (glued with conductive epoxy) to the edges of the plate, and a sacrificial strip is applied to the top of the weld path [
32].
The wire EDM-cut surfaces of the weldments were first cleaned to remove residues arising from the cutting process. The out-of-plane displacement of each cut surface was then measured using a Hexagon PMM-C coordinate measurement machine equipped with a white beam confocal probe, with a measurement density of 0.1 mm. For each contour cut, raw measured displacement data were processed following the procedure outlined in [
32,
38]. This involved aligning displacement data sets from opposing cut surfaces and pointwise averaging onto a shared grid. The averaged data set was then cleaned by eliminating outliers and smoothed using bivariate splines. The processed displacement data were then applied as a surface displacement boundary condition (of opposite sign) to an ABAQUS 3D FE model of the cut plate constructed with C3D8R elements. The contour method stress back-calculation was conducted using a static equilibrium analysis step, assuming elastic isotropy with a material elastic modulus of 195 GPa and a Poisson’s ratio of 0.3. For the multiple-cut cases (S3_1 and S3_2), the original residual stress acting on the second cut plane was determined by superposing the relaxed stress released by the preparatory (stress-relief) cut.
4.2. Demonstration Weldments–Contour Method Measurement Results
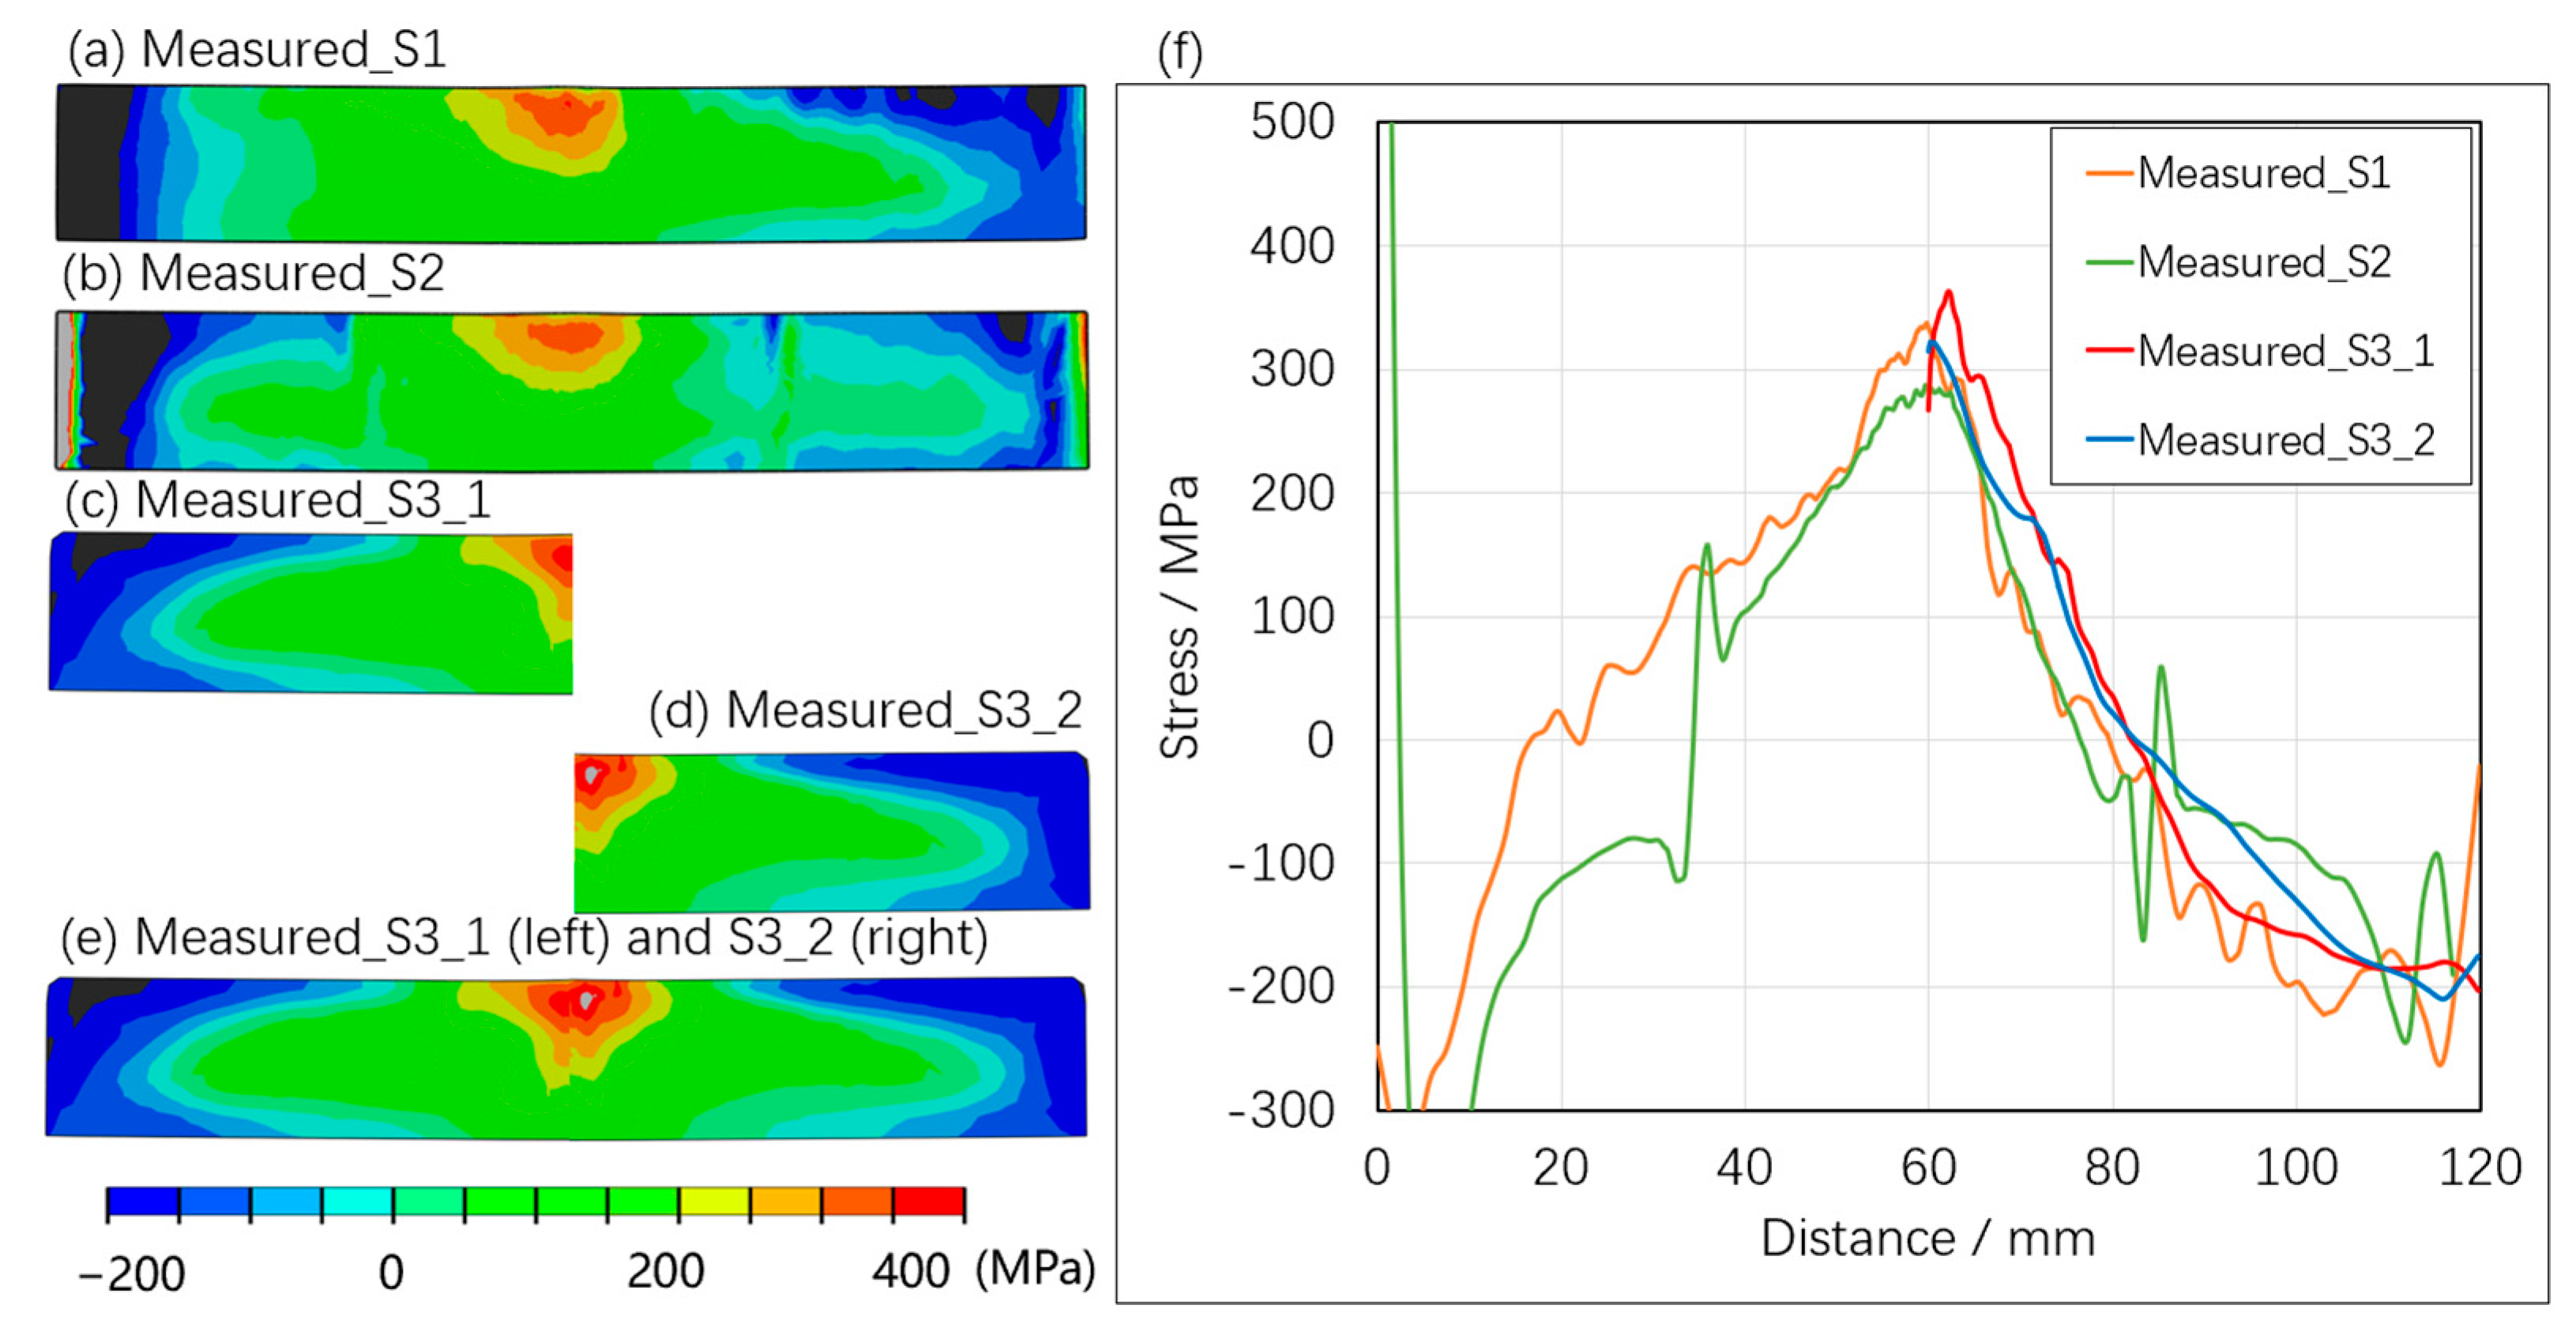
Figure 9 shows contour residual stress measurement results arising from the four cutting configurations applied. The maps of longitudinal stress for the four cases are similar to each other, which confirms the general nature of the stress field present. The stress profile results along a 3 mm line beneath the top surface also follow each other. These line distributions of stress can be compared with equivalent cutting configuration results from the evaluation weldment (
Figure 6). Specifically, the stress profile for measured case S1 has a prominent tensile “knee” feature (10 to 50 mm from the WCL) that was also observed for case Sim_S1 (owing to compressive CIP strains). Likewise, embedded-cut S_2 experimental results exhibit some asymmetry across the WCL, a smaller “knee” feature, and large perturbations in regions close to the pilot holes, as previously seen in the simulated measurement stress profile (
Figure 6). In contrast, the measured stress profile from cutting configuration S3_1 is smooth and rises to a maximum at the WCL, as expected from the earlier simulation case where plastic strain errors were found to be small (
Figure 5). Cutting sequence S3_2 experimental results are also of interest in that the profile indicates a tensile peak at around 2 mm from the WCL, a feature that is also observed in the simulated S3_2 contour results; this perturbation is associated with very local tensile plastic strains (
Figure 5), which occur early in the cut. At longer cut lengths, we would expect sequence S3_2 to give accurately measured stresses. It is of interest to reflect the S3_2 measured stress profile across a WCL-defined mirror plane, compare it with the S3_1 measured profile (
Figure 9f), and observe that the two measured profiles are almost mirror symmetric (if we ignore the erroneous S3_2 local peak). This close correlation implies that cutting sequence S3_1 has delivered a measured residual stress profile that is essentially free from CIP-related stress errors. Moreover, the contour simulations for the evaluation weldment have shown how ‘measured’ stress errors are related directly to the impact of CIP strains and therefore how errors can be mitigated by minimizing, or preferably eliminating, CIP deformation during contour cutting.
These results underscore why attention should be given to designing a cutting configuration for contour method residual stress measurements that mitigates CIP strains and improves the accuracy of the back-calculated residual stress results. Computational models of representative weldments offer a realistic but quantitative route for evaluating the merits of specific cutting sequences in terms of controlling CIP strains and associated stress measurement errors.
5. Discussion
The determination of high-magnitude residual stress fields, such as those introduced by the welding process, poses challenges when using the Contour Method due to the risk of inducing plasticity during the contour cut. Several researchers have reported strategies to reduce cutting-induced plasticity, for example [
6,
7,
8,
9], that rely on a common underlying mechanism: controlling stress redistribution during the cutting process in order to minimize stress concentration at the cut tip and thereby mitigate the risk of introducing local plastic deformation. In this paper, we have employed the concept of prior residual stress relaxation to mitigate excessive concentration of residual stress at the cut tip during measurement, that is, a preparatory longitudinal cut made along the WCL that reduces the magnitude of tensile stress at the weld region in the cut halves. The proposed new strategy also requires two sequential contour cuts: a longitudinal cut along the WCL, followed by a transverse cut across the remaining half component. However, it is important to note that even with the preparatory cut, starting from the tensile weld region (S3_2 case) can still trigger local plasticity and introduce some stress errors in the final results. On the other hand, initiating the cut from the edge side (S3_1 case) prevents such plasticity from occurring at the weld region. This finding aligns well with the argument put forth by Muransky et al. [
39] that in a good contour measurement, the residual stress in the region of interest should be relaxed as much as possible by releasing equilibrating stresses outside the region of interest.
As the proposed cutting strategy involves multiple cuttings, the residual stress on the transverse plane must be reconstructed by superimposing the relaxed stress field from the first cut with the remaining stress measured from the second cut. This increases the uncertainties of the second cut measurement of interest. However, the stress relaxation on this cut plane is predominantly governed by the global deformation induced by the first cut and is therefore largely insensitive to localized surface artefacts or cutting noise introduced during wire EDM. But care must be taken during contour data processing to ensure consistent grid alignment and spatial registration between the two surface profiles to avoid artefacts arising from data mismatch. Although the use of two cuts introduces an inherent risk of additional error, these are typically minimal when the cutting, measurement, and reconstruction procedures are well controlled.
Overall, for flat plate line weldments, we propose that the merits of performing a preparatory cut along the WCL should be assessed in order to reduce the risk of introducing cutting-induced plasticity and associated measurement errors in Contour measurements of longitudinal stress. The examples presented in this paper have positioned the preparatory cut directly along the WCL. A potential refinement of this approach would be to slightly offset (in the transverse direction) the initial sectioning line (by a few mm) so that one of the cut sections retains a smaller portion of the weldment. This adjustment could help prevent the peak tensile stress from coinciding with the free edge of the specimen, which is often affected by both cutting and displacement measurement artefacts.
