Abstract
This study investigates the double-sided hot cladding of an experimental Al–2%Cu–1.5%Mn–1%Zn–0.7%Mg–0.4%Fe–0.4%Si alloy with commercially pure aluminum A1050 under combined hot deformation. Finite element modeling was employed to analyze the evolution of shear strains, normal stresses, and flow stresses in the deformation zone during cladding. The results indicate that increasing the degree of reduction significantly alters the distribution and direction of shear strains: at low reductions (20–30%), shear directions in the base and cladding layers coincide, while reductions above 40% induce opposing shear directions. Temperature was identified as the dominant factor affecting normal stress and flow stress differences between layers, whereas deformation magnitude primarily influenced peak stresses at the neutral section of the deformation zone. Experimental validation was conducted over a temperature range of 300–450 °C and relative reductions of 20–60%, demonstrating successful layer bonding in all cases except at low temperatures and reductions (300–375 °C, 20–30%). Based on combined modeling and experimental data, a predictive model for estimating peel strength during hot rolling cladding was developed, offering a robust tool for optimizing process parameters and ensuring reliable interlayer bonding in investigated aluminum alloys.
1. Introduction
The rapid development of microelectronics, robotics, automotive engineering, and the aerospace industry presents the scientific community with a wide range of interdisciplinary challenges. In metallurgy and materials science, long-standing trends include improving the functionality of metallic components, extending their service life, and enhancing their recyclability. Aluminum and its alloys are widely used across all of the above-mentioned sectors [1,2].
Among wrought aluminum alloy systems, the 2xxx (Al–Cu) and 6xxx (Al–Mg–Si) series are particularly widespread [3,4,5], offering a favorable balance of strength, ductility, processability, and corrosion resistance, with further property improvement achievable through heat treatment. However, products made from these alloys, particularly flat-rolled products, are often exposed to aggressive environments, requiring additional surface protection [6,7]. The most reliable and efficient protection method is cladding the base alloy with commercially pure aluminum, which exhibits superior corrosion resistance. The cladding process typically involves surface preparation, hot rolling of the stacked materials, heat treatment, and cold rolling to final dimensions [8,9]. Despite extensive research in this area [10,11,12,13], the initial stage of metallurgical bonding during hot rolling remains poorly understood and difficult to control [14,15,16]. Several mechanisms for bonding metallic surfaces during co-deformation have been proposed, including diffusion, dislocation, film rupture, energy-based, and combined models [17,18]. Each theory is based on specific material or process characteristics, such as the strength and ductility of surface layers, surface condition, or energy release during deformation, but they all fundamentally depend on the key process parameters: temperature, strain magnitude, and strain rate [19,20,21,22].
Recycling aluminum alloys plays a critical role in meeting the growing demand for aluminum while reducing energy consumption and CO2 emissions by 80–95% compared with primary production [23,24]. However, using secondary raw materials in wrought alloy production inevitably leads to impurity buildup (Fe, Si, Mg, Zn), which can degrade functional properties [25,26]. One potential solution is the development of thermally non-hardenable Al–Cu–Mn alloys strengthened by ~7–8 vol.% nanoscale Al20Cu2Mn3 dispersoids [27,28,29]. These dispersoids provide high thermal stability and strength (~300 MPa) without the need for homogenization or aging, greatly simplifying processing [30,31]. Research has also focused on adapting these alloys for production from secondary feedstocks [32,33,34]. It has been shown that iron forms intermetallics Al15(Fe,Mn)3Si2 and Al7Cu2Fe, reducing ductility, though contents up to 0.5% are not critical. Furthermore, Mg and Zn additions to the base Al–Cu–Mn alloy enhance both strength and heat resistance, while Si from recycled material promotes the formation of Al8Fe2Si skeleton phases that improve structural integrity. Nevertheless, corrosion protection, essential for many potential applications of this alloy group, remains an unresolved issue.
Therefore, two research objectives are of particular relevance: studying the bonding behavior of aluminum alloys during co-deformation under different thermal and deformation conditions in rolling, and investigating the cladding of a newly developed aluminum alloy in comparison with its base composition. In this work, a finite element (FE) model of the cladding process was developed, stress–strain state features influencing interlayer bonding were analyzed, and a series of experiments was carried out to validate the model and compare the findings.
2. Methods and Materials
2.1. Material Characterization
Ingots of the investigated alloys Al–2%Cu–1.5%Mn–1%Zn–0.7%Mg–0.4%Fe–0.4%Si (hereinafter referred to as CMZM-FS) and 1050A were cast to produce wrought billets for the base and cladding layers, respectively. The following charge materials were used to obtain the target chemical composition: Aluminum Al99.85, Copper Cu-ETP, Zinc Z2, Magnesium Mg99.95B, Silicon Grade 441, and Al–20%Mn and Al–10%Fe master alloys. Melting was performed in a resistance electric furnace at 740 °C using a chamotte crucible. Casting was carried out into graphite molds to produce ingots measuring 20 × 140 × 180 mm for CMZM-FS and 10 × 75 × 180 mm for 1050A. Samples were taken from the ingots to verify the chemical composition by optical emission spectroscopy, and the results are presented in Table 1.

Table 1.
Chemical composition of investigated alloys (mass. %).
The as-cast microstructures of the 1050A alloy and the experimental alloy, obtained by scanning electron microscopy (SEM, TESCAN VEGA 3, TESCAN Brno, s.r.o., Brno, Czech Republic), are shown in Figure 1a,b. The as-cast CMZM-FS alloy microstructure is characterized by eutectic phase particles Al2Cu, Al15(Fe,Mn)3Si2, and Mg2Si, distributed along dendritic cells, as identified by electron microprobe analysis (EMPA, OXFORD Aztec, Aztec, Oxford, Abingdon, UK).
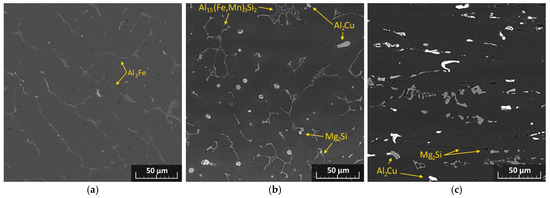
Figure 1.
Cast 1050A (a) and CMZM-FS (b) and deformed CMZM-FS (c) alloy microstructure.
The ingots were hot-rolled on a two-high mill to various thicknesses to produce billets for the experimental cladding. The rolling temperatures for CMZM-FS and 1050A were 450 °C and 300 °C, respectively, with a per-pass reduction of 15–30%. As a result of rolling, the microstructure of the experimental alloy underwent significant changes: phase particles became finer and were elongated along grain boundaries in the rolling direction (Figure 1c).
To describe the physical and mechanical properties of the materials in the developed FE model of the cladding process, data from plastometric tests and regression analysis of the results for an alloy with a chemical composition similar to the experimental CMZM-FS [35] were used. The flow stress () of the experimental alloy during deformation in the ranges of true strain (εt) 0–1, strain rate () 0.01–10 s−1, and temperature (T) 300–450 °C is described by the equation:
where A, m, n1, n2, l are experimentally determined factors, which are listed in Table 2. The strain-hardening behavior of the alloy grade 1050A was taken from the standard QForm material database, based on literature data [36], and can also be described by Equation (1) using the coefficients given in Table 2.

Table 2.
Coefficients for calculating the flow stress of alloys under hot deformation.
The thermal conductivity was calculated according to the Wiedemann–Franz law by measuring the electrical conductivity of the experimental alloy and amounted to 192.5, 207.9, and 223.3 W/(m·K) at temperatures of 300, 375, and 450 °C, respectively. The heat capacity was assumed to be constant and equal to the typical value for 2xxx-series alloys, 838 J/(kg·K).
2.2. Simulation Procedure
The process simulation was carried out in the QForm-3D v.10.3.0 [37] software environment using the Deformation module, with thermal effects taken into account. The tool and billet geometry, created in KOMPAS-3D V23 design software, was imported into the simulation program (Figure 2a). The mesh shape for both the tooling and the workpiece was assumed to be tetrahedral. The tool was modeled as rigid, and the rolling calculations were performed without considering elastoplastic deformations. The rolls have a diameter of 210 mm and a length of 300 mm, and, to accelerate computation, they were modeled as hollow cylinders with an internal bore diameter of 190 mm. Roll rotational speed was set to 20 rpm, based on the DUO-210 laboratory mill parameters. In each simulation case, the roll gap was set to 4 mm, while the initial thicknesses of the individual billet layers ( and ) and the total billet thickness varied to achieve reductions of 20, 30, 40, 50, and 60%, as specified in Table 3. Three initial billet heating temperatures—300, 375, and 450 °C—were also selected to match the experimental conditions. The initial billet width was 40 mm, and the length was calculated based on the planned reduction (elongation) to obtain a clad sheet 100 mm long after rolling. Identical billet dimensions were used in the experimental part of the study.
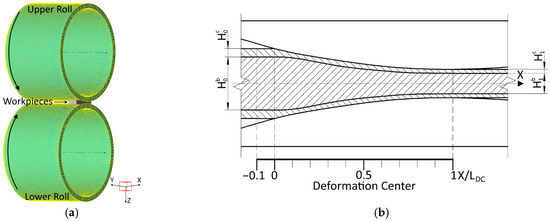
Figure 2.
View of the central longitudinal section of the roll unit (a) and the deformation center (b).

Table 3.
Thickness of specimens and variants of deformation regimes.
Finite element analysis of parameters such as equivalent strain, flow stress, and normal pressure was performed for the geometric deformation center (DC) from the metal entry point between the rolls to the exit (0–1 X/LDC) (Figure 2b). However, due to the development of deformation processes at some distance from the DC entry, accompanied by significant stresses within and on the metal surface, an additional segment, 8–10% of the deformation zone length, located on the entry side (−0.1–0 X/LDC) was also considered.
The accuracy of the cladding process model, which strongly depends on the mesh element size, was controlled using a mesh adaptation factor. This factor was set to 2.5 for the tool and varied between 2.5 and 3.5 for the billets, depending on their thickness (volume). These values were selected empirically to ensure maximum calculation accuracy, result repeatability, and a reasonable simulation runtime.
The governing equations of the deformation problem for a rigid–viscoplastic body in QForm are based on a variational formulation derived from the stationarity of the Markov functional:
where δ denotes variation; V is the volume of the deformable body; S is the surface on which external forces are applied; is the effective stress; is the effective strain rate; represents the known surface forces; and denotes the velocities of material points on the surface.
Since forces and stresses are not varied, the equation takes the form:
The first integral of the functional represents the power of plastic deformation, while the second term corresponds to the power of external forces.
In the finite element discretization of the deformable body, the kinematically admissible velocity field is represented as a combination of velocity fields of individual finite elements. The velocity field of each finite element, in turn, depends on the shape functions and nodal velocities of that element:
where is the matrix of finite element shape functions, and are the nodal velocity values of the finite element.
The presented formulation (3), in the general case, does not satisfy the incompressibility constraint on the velocity field () for a rigid–plastic body. Therefore, the minimum of the functional is conditional. To determine it, QForm employs the Lagrange multiplier method. To account for the incompressibility condition, the Markov functional is modified by introducing the corresponding constraint terms with Lagrange multipliers:
In addition, the system of equations that determines the stress–strain state of the workpiece during plastic deformation modeling in QForm includes the equilibrium equations:
and the kinematic relations between the material point velocities and strain rates:
In QForm, according to the von Mises plasticity criterion, the effective stress is equal to the flow stress (metal resistance to plastic deformation), which depends on the effective (accumulated) plastic strain (εeff), strain rate, and temperature, and was defined using Equation (1):
The effective plastic strain was calculated as the sum of the increments of strain intensity (), integrated along the trajectory of a material particle (t):
The normal stress (p) acting in the billet layers at their contact surface was calculated as the hydrostatic pressure exerted by the layers on each other and equals the mean normal stress () with the opposite sign, representing one-third of the sum of the stresses along the main diagonal of the stress tensor:
When calculating the energy–force parameters of the process in QForm, the resultant force and torque were obtained by integrating the stress vector field over the contact surface. In the case of rolling force, the integral of the normal contact pressure between billet and roll contact area was evaluated as follows:
The nature of friction at the contacting surfaces of the layered rolled material is undoubtedly one of the key factors in forming at least a mechanical bond between them during cladding [38]. Since a necessary condition for bonding aluminum alloys is the disruption of oxide films on the contacting surfaces as a result of metal deformation and plastic flow, the friction model was taken as a law describing the contact friction τ as the product of a friction factor (coefficient) m and the conditional shear yield stress:
The same relationship was also used to describe contact friction at the interfaces between the tool and the billets. The friction factor m was selected based on numerous experimental rolling trials of similar alloys, by comparing the modeled deformation behavior, process duration, and energy–force parameters with the experimental results. As a result, the most appropriate value of m was determined and is presented in Table 4.

Table 4.
FE-Simulation parameters.
To simulate the co-deformation of two or more bodies, a special contact element is employed, since the finite element mesh nodes of contacting bodies generally do not coincide. One node of this element is connected to a node on the contact surface of the first body, while the other three nodes correspond to a triangle on the second body, within which the first node is located. The calculation also uses a penalty coefficient C that prevents the penetration of one mesh into another, acting as a value many times greater than the diagonal coefficients of the stiffness matrices of both contacting bodies:
where is the maximum value of the diagonal coefficients of the stiffness matrices of both contacting bodies; c is a dimensionless coefficient recommended by the software developers, set to 10.
The temperature field of the multilayer workpiece was calculated taking into account heat transfer between its layers and the tooling, as well as convection. The differential equation of unsteady heat conduction used in QForm is given as follows:
where is the thermal conductivity coefficient; is the Laplace operator; is the temperature field; is the volumetric heat generation rate (the sum of the external heat flux power (not used in this study) and the heat generated by plastic deformation); is the material density; and is the specific heat capacity.
2.3. Experimental Procedure
Billets of varying thicknesses for the base and cladding layers were prepared for the cladding process. Their contact surfaces were mechanically brushed to a depth of up to 0.01 mm, degreased with tetrachloroethylene (C2Cl4), and thoroughly dried. The treated billets were then assembled into stacks consisting of three metal layers: the outer layers of cladding alloy 1050A and the inner base layer of CMZM-FS. Thus, the layered billet was assembled according to the M–T–M principle (M—soft, T—hard layers).
The initial thickness of each billet was selected to achieve reductions of 20–60% during cladding and to obtain final samples with identical total thicknesses and comparable thicknesses of each layer, assuming uniform deformation of all layers. The experimental deformation regimes, as well as the billet thicknesses before and after cladding, are summarized in Table 3. Cladding was performed on a two-high rolling mill DUO-210 at a deformation rate of 200 mm/s. To reduce contact friction at the roll surfaces, the rolls were lubricated with a water-based emulsion containing 1 wt.% cutting fluid based on mineral oils. For each deformation regime, three preheating temperatures—300, 375, and 450 °C—were applied to investigate the influence of the thermal factor. Thus, the experimental matrix included 15 temperature-deformation variants of double-sided cladding, with an additional repeat performed on one extra sample for each variant.
Samples for microstructural, physical–mechanical, and interlayer bonding strength analyses were taken from the double-sided cladded sheets using electrical discharge and circular sawing. Vickers microhardness (HV) was measured on a digital hardness tester (Metkon Instruments Ltd., MH-6, Bursa, Turkey) under a 25 g load with a dwell time of 10 s. Tensile tests for ultimate tensile strength, yield strength, and elongation were conducted on an Instron 5900 Series testing machine at a strain rate of 0.001 s−1. Three tensile specimens were cut from each sheet along the rolling direction. The interlayer bond strength was measured using a technique analogous to the T-Peel Test on two specimens of each variant (ASTM D1876 [39]). Specimens were 5 mm wide and 50 mm long, cut both along and across the rolling direction. Testing was stopped upon complete separation of the cladding layer from the base layer.
3. Results
3.1. Simulation Results
Based on available literature data [17,40] and the results of previous work [41], the FE analysis focused on evaluating the key process parameters directly characterizing the flow and strengthening behavior of the material layers in the contact zone.
Figure 3 shows the curves of shear strain along the deformation zone on the contacting surfaces of the base and cladding layers. The strain values are alternating in sign and can be denoted as εxz and εzx, reflecting different shear directions according to the Hencky strain tensor:
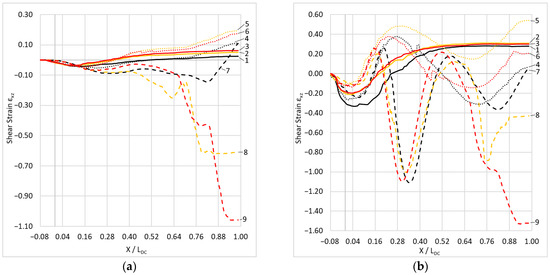
Figure 3.
Variation of shear strains along the deformation zone on the contacting surfaces of the base (a) and cladding (b) layers at reductions of 1, 2, 3–20%; 4, 5, 6–40%; 7, 8, 9–60%; and deformation temperatures of 1, 4, 7–300 °C; 2, 5, 8–375 °C; 3, 6, 9–450 °C.
The graphs indicate that the reduction during cladding has the most significant effect on the magnitude and distribution of shear strain in the bonded layers. As the reduction increases, the absolute difference in strain values between the layers grows, and the amplitude of εxz and εzx variation along the DC also increases. In all cases considered, the layers experience shear in the direction opposite to rolling upon entering the DC. As the traced point reaches 0.15–0.30 X/LDC, the sign of the shear strain changes. Another characteristic region is at 0.75 X/LDC, where the curves reverse in an unusual direction, indicating the location of the neutral section of the DC, where the lagging zone borders the leading zone.
In the central part of the DC, the pattern of shear strain evolution, particularly in the cladding layer, strongly depends on the reduction. At 20% reduction, the magnitude of εxz after passing the 0.15–0.30 X/LDC segment changes only slightly. At 60% reduction, the shear strain curves reverse sign three times along the 0.15–0.75 X/LDC segment. This behavior is directly related to the DC configuration, its height and length, and the gradient of metal flow velocity along it.
The effect of temperature on this parameter is minor, as observed from curves 1, 2, and 3 (Figure 3a,b). With reductions up to 60%, the difference between εxz and εzx in curves 7, 8, and 9 (depending on cladding temperature) increases, reaching 0.5 in the base layer and up to 1.0 in the cladding layer. After cladding at 20–30% reduction, the shear strain magnitudes in the cladding and base layers are relatively low, 0.40 and 0.05, respectively, with the shear direction along the contacting surfaces being unidirectional. As the reduction increases, the shear strain direction in the cladding layer changes dramatically. This trend persists for reductions of 40–60%, where the average shear strain is approximately −0.40 in the cladding layer and 0.20 in the base layer.
The success of bonding between the rolled layers during cladding is directly related to the characteristics of their surfaces, such as surface condition, e.g., roughness and absence of contaminants, and, particularly, their ability to plastically flow under deformation. Some studies [42,43] report a negative effect of a large difference in plastic and strength properties between the contacting surfaces, which manifests as the development of additional shear stresses between them, reducing the effectiveness of normal stresses generated during rolling. However, other sources [17,18] indicate that a high difference in surface strength can promote more effective disruption of oxide films and bonding of material regions.
Figure 4a shows the variation along the deformation zone of the flow stress difference between the base and cladding layers () at points of direct contact, for deformations at 300–450 °C and reductions of 20, 40, and 60%. For all reductions, the curves demonstrate a sharp increase in the difference in layer resistance starting from the zone preceding metal entry into the rolls (−0.08 X/LDC up to ~0.15 X/LDC. Then, up to 0.30–0.35 X/LDC, the flow stress difference decreases. For 20% and 60% reductions, this behavior occurs differently, reflecting the deformation and thermal conditions of the processes. Due to more intensive deformation heating at 60% reduction, softening of the base layer surface is more pronounced.
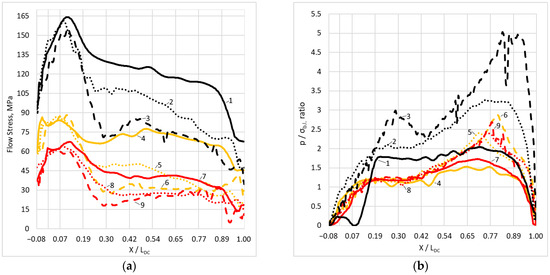
Figure 4.
Change along the deformation center of the difference in the base and cladding layers flow stress (a) and the ratio of the normal rolling pressure to the base layer material flow stress (b) at reductions of 1, 2, 3–20%; 4, 5, 6–40%; 7, 8, 9–60%; and deformation temperatures of 1, 4, 7–300 °C; 2, 5, 8–375 °C; 3, 6, 9–450 °C.
In the segment 0.35–0.75 X/LDC, the curves exhibit a plateau in the flow stress difference, maintaining the magnitude order determined by the reduction. This indicates ongoing formation and growth of oxide film cracks, with gradual filling by oxide-free metal. The segment starting at 0.75 X/LDC shows a decrease in flow stress difference in all cases, reaching a minimum of 5–10 MPa. This behavior suggests that the filling of oxide film cracks during cladding occurs not only by the metal of the cladding layer but also potentially by the flow of the base layer metal, which softens significantly at the DC exit.
The effect of preheating temperature is most pronounced for this parameter. As shown in Figure 4a, an increase in reduction by 20% results in an average decrease in () of ~30% at the same cladding temperature. Increasing the preheating temperature from 300 to 375 °C and from 375 to 450 °C reduces the relative difference in flow stresses by ~45%.
The magnitude of the normal stress (p) developed during cladding is undoubtedly important for effective disruption of oxide films and filling of cracks by the volume of metal from both the base and cladding layers. The variation of the ratio of p to the base layer flow stress ( was evaluated at a point on the surface moving along the deformation zone during cladding at reductions of 20, 40, and 60% and temperatures of 300–450 °C (Figure 4b). At the initial stage—before the tracked point enters the deformation zone and up to 0.15 X/LDC—the p/σb.l. ratio increases linearly, despite the previously noted significant growth of (. Up to 0.35 X/LDC, a stage of established p/σb.l. occurs, corresponding to softening of the base layer and the onset of steady rolling. Subsequently, the ratio of normal stress to the base layer flow stress rises, reaching a peak in the neutral section of the deformation zone located between 0.70–0.80 X/LDC, depending on reduction. It can be assumed that at this point, the maximum normal stresses cause intensive deformation heating of the base layer, reducing the flow stress difference between the base and cladding layers observed in the 0.75–1 X/LDC segment of Figure 4a. The maximum peak p/σb.l. is expected at 60% reduction, reaching 5.0 at 300 °C and 2.7 at 375 and 450 °C.
The energy–force parameters of the rolling process serve as a direct measure reflecting the main characteristics of the process, taking into account the properties of the processed material. In earlier studies on predicting layer bonding during hot co-deformation of metals [44,45], rolling force was identified as the most suitable factor for such prediction. A similar conclusion was reached in the authors’ previous work [41], albeit for a relatively narrow experimental dataset.
The median values of rolling force and torque at the steady stage of the process, under the conditions considered in this study, are shown in Figure 5a and Figure 5b, respectively. The pattern of rolling force variation with temperature is similar for all reduction levels. At 20% reduction, the rolling force is 85, 61, and 46 kN at 300, 375, and 450 °C, respectively. In all cases, the force decreases by 20–25% for each 75 °C increase in temperature. However, at lower reductions, the decrease is at the upper limit (~25%), while at higher reductions it is at the lower limit (~20%), indicating an increasing contribution of the deformation component (normal stresses, geometric parameters of the deformation zone) to the rolling force relative to the temperature effect.
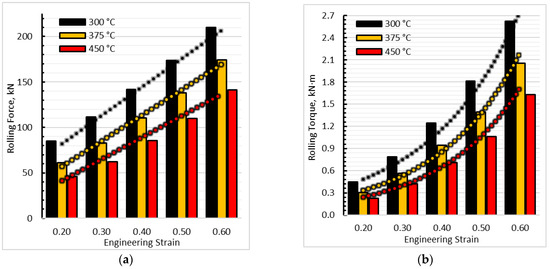
Figure 5.
Roll separating force (a) and rolling torque on the top roll (b) during double-sided cladding of the CMZM-FS alloy.
The increase in rolling force with increasing reduction is linear, as shown in the figure. In contrast, the change in torque at the same deformation temperatures follows an exponential trend (Figure 5b). This is related to two factors. First, with increasing partial reduction, the height and length of the deformation zone increase, which significantly affects the rolling moment arm. Second, as noted from the images in Figure 3, with increasing reduction, the magnitude and pattern of shear strains acting at the interlayer boundaries of the rolled material change. As the relative strain gradually increases, the effect of shear strains becomes more pronounced, exhibiting an exponentially growing reactive influence.
3.2. Experimental Results
As a result of the experiments, mechanical bonding of the rolled layers was not achieved under all deformation conditions. At temperatures of 300 and 375 °C and reductions of 20 and 30%, no bonding of the cladding layers to the base layer occurred at all (Table 5). For the combination of 375 °C and 30% reduction, bonding was achieved only on one side of the cladded layers and was extremely unstable, precluding further testing of this variant. The best bonding results were obtained at a rolling temperature of 450 °C across all reduction levels.

Table 5.
Experimental results of hot cladding.
Evaluation of the SEM images of the interlayer boundary of the cladded samples (Figure 6) shows that in some cases, distinct voids can be observed between the layers.
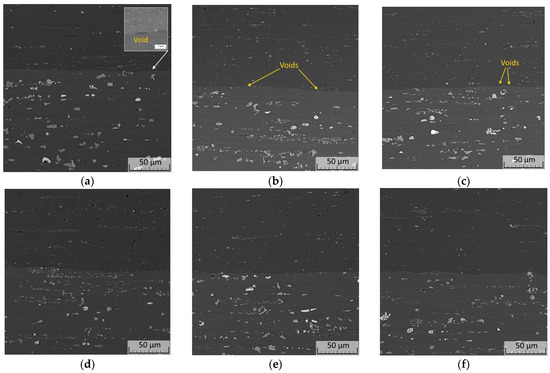
Figure 6.
Microstructure of the layer border zone after hot cladding at: temperature 300 °C and deformation 40 (a) and 60% (b); temperature 375 °C and deformation 60% (c); temperature 450 °C and deformation 20 (d), 40 (e) and 60% (f).
The largest and most frequent voids occur at the lowest cladding temperature, with lengths in the rolling direction of 2–4 μm. As the cladding temperature increases, both the size and number of discontinuities decrease. It should also be noted that their location, unlike the variant shown in Figure 6a, is mostly localized near or within clusters of eutectic phases observed at the interlayer boundary. At a rolling temperature of 450 °C and reductions of 40 and 60% (Figure 6e,f), the layer boundary is characterized by the absence of pores and a small number of phase particles, reflecting the effect of high temperature and deformation.
As a result of cladding at 300 °C, the highest microhardness values were obtained for both the base and cladding layers, reaching 100 and 57 HV, respectively. With an increase in rolling temperature, the effect of deformation hardening during cladding decreases. It should be noted that the average microhardness of the base layer after cladding at 375 and 450 °C is the same, whereas the cladding material at the highest cladding temperature reaches a microhardness of 37 HV, which is 30% lower compared to the variants processed at 300 and 375 °C. This is due to the occurrence of complete dynamic recrystallization of the 1050A alloy layers during cladding at 450 °C.
The distribution of microhardness across the thickness of samples cladded at 450 °C (Figure 7a) shows certain patterns. Regardless of the reduction level during cladding, the microhardness of the 1050A alloy fluctuates within a narrow range. The microhardness of the base layer near the interlayer boundary is, on average, higher than at the mid-thickness, which is both a consequence of the deformation history during the preparation of the cladding billet (surface work hardening) and the effect of stresses from interlayer frictional forces.
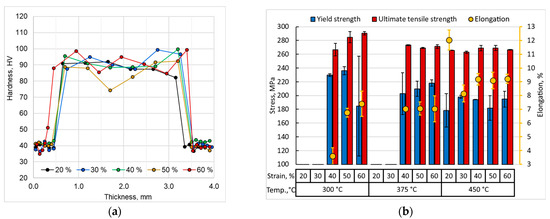
Figure 7.
Microhardness across the thickness of samples clad at 450 °C (a) and tensile test results of layered rolled samples (b).
Tensile tests of the samples after cladding (Figure 7b) produced expected results. At a cladding temperature of 300 °C, increasing the reduction leads to an increase in the strength of the laminated composite, accompanied by a decrease in ductility. At higher cladding temperatures of 375 and 450 °C, the differences in mechanical properties depending on the reduction level are significantly reduced. The yield strength, ultimate tensile strength, and elongation of the samples cladded at 375 and 450 °C fall within a narrow range, averaging 200 MPa, 265 MPa, and 8%, respectively. This correlates with the previously noted hardness values of the base layer achieved at these cladding temperatures.
The diagrams present the results of peel tests of the cladding layer from the base layer along the longitudinal (Figure 8a) and transverse (Figure 8b) rolling directions. For each case, both the median and peak (maximum) peel strengths, as well as the point of complete separation of the cladding layer from the samples, are reported. In all observed cases, the extent of delamination is comparable to or equal to the median value throughout the T-Peel test, fluctuating within the indicated range.

Figure 8.
Peak, median and delamination bond strength of cladded layers as a result of peel testing along (a) and across (b) the rolling direction.
A clear trend of increasing interlayer bonding strength with increasing reduction is observed in both graphs. However, at cladding temperatures of 300 and 375 °C, this trend is not pronounced—the median peel strength varies between 3 and 8 N/mm for relative reductions of 40–60%. Samples processed at 450 °C with 20 and 30% deformation also show comparable interlayer bonding strength when tested along the rolling direction. The highest strength values are observed for samples cladded at 450 °C with 40–60% reduction. Their average peel strength ranges from 14 to 30 N/mm. Overall, samples produced at the highest cladding temperature exhibit an exponential increase in interlayer bonding strength with increasing reduction, indicating the predominance of the temperature factor over the deformation factor during cladding.
The peel strength for the transverse test of a sample processed at 450 °C and 60% reduction reaches the ultimate strength of the cladding layer material. In this case, none of the tested samples exhibited any delamination.
Examining the fracture surfaces of the samples after tensile testing (Figure 9), certain patterns can also be observed. At a cladding temperature of 450 °C and minimal reductions (Figure 9c,d), the contact surfaces of the layers exhibit numerous rounded irregularities. At the maximum deformation but low temperatures (Figure 9a,b), the layer surfaces are rougher, with irregularities in the form of peaks and scales. This change in the initially identical surface morphology due to joint deformation indicates that insufficient deformation hinders the formation of bonding bridges, as the surface layers of the cladding, being harder, exhibit weak flow and insufficient oxide film disruption. At the same time, low deformation temperatures limit the effective filling of oxide film cracks and the subsequent bonding of juvenile regions of the base and cladding layers due to the high difference in their mechanical properties.

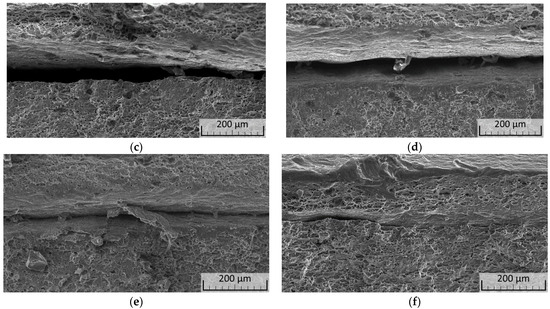
Figure 9.
Fractographs of the interlayer boundary in specimens after tensile testing at: temperature 300 °C and deformation 60% (a); temperature 375 °C and deformation 60% (b); temperature 450 °C and deformation 20 (c), 30 (d), 50 (e) and 60% (f).
Fractures of samples cladded at 450 °C with 50% and 60% reduction (Figure 9e,f) are consistent with the peel test results, showing uniform elongation of both layers during tensile loading and the absence of large voids. On the interlayer boundary, the most developed network of bonding bridges is observed among all variants, in some areas forming a continuous interlayer connection.
4. Discussion
Evaluating the experimental results, it can be confidently noted that the contribution of the temperature factor during cladding predominates over the deformation factor. This is evident in achieving a positive cladding outcome even at minimal deformation, provided the temperature is close to the maximum for the investigated base alloy. Comparing these data with the simulation results, one might assume that the exponential nature of the increase in interlayer bonding strength correlates with the rolling torque. However, this holds true only for cladding at the maximum deformation temperature.
At the same time, calculated model parameters such as the magnitude of shear strains and the ratio of normal stress to the flow stress of the base layer during deformation show good potential for predicting cladding results. Numerous studies have attempted to mathematically describe the dependence of interlayer bonding strength of aluminum and its alloys during hot rolling. Among recent works, References [13,46,47] can be highlighted, with model [13] being the closest in boundary conditions to the present study and relatively simple. This model was developed based on experiments conducted at temperatures of 200, 300, and 400 °C with reductions of 35, 50, and 65%, and it takes into account both the degree of rolling reduction and temperature, the latter being the most significant factor. Overall, the equation is as follows:
where —peel strength, N/mm; —temperature, °C; r—reduction, % [13].
This model demonstrates very good agreement with the experimental results of the present study at a cladding temperature of 300 °C. However, calculations for higher temperatures—375 and 450 °C—show significant error, which will be further examined and discussed later in the paper. Based on this, an analysis of the modeling and experimental data was conducted to develop a more accurate model applicable to the investigated experimental alloy.
For the regression analysis of the bonding strength () (mean of the longitudinal and transverse test results), the following factors were considered: temperature (T), relative reduction (ε), as well as parameters determined in the deformation zone during computational modeling—strain rate at the neutral section of the deformation zone (), median value of the ratio of normal stress to the flow stress of the hard (base) layer (), the difference in flow stresses of the base and cladding layers (), friction stress () and the time of passage through the deformation zone (t).
Based on the nature of the dependencies between bonding strength and the considered parameters, an exponential model was chosen. For the analysis and further construction of the model, a correlation matrix was created, as shown in Figure 10. Additionally, interactions of certain variables, such as and , were considered. The results of the analysis of variance (ANOVA) are presented in Table 6.
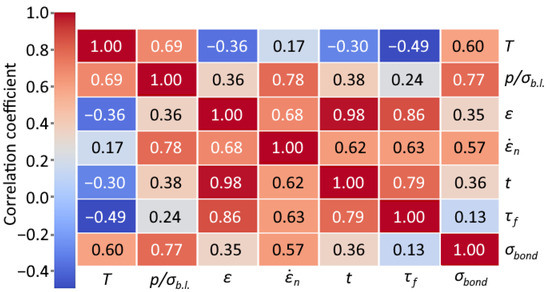
Figure 10.
Correlation matrix of the original features.

Table 6.
Analysis of variance for the model.
Based on the analysis results, a final model was developed, which includes five features: T, , ε, , and the interaction . Although T and did not show statistical significance at the 5% level, they were retained in the model due to their physical interpretability. The features , ε, and the interaction proved to be statistically significant (p < 0.05). This approach allows a balance between statistical rigor and practical interpretability. The remaining considered features and interactions contributed negligibly to the final model and were therefore excluded from consideration.
The final model has the following analytical form:
To evaluate the adequacy of the obtained model, a residual analysis was carried out, i.e., an examination of the differences between the observed responses and their predicted values. As shown in Figure 11a, the predicted values exhibit no discernible patterns, indicating the absence of systematic errors. The uniform distribution of residuals around the zero line further confirms constant error variance (homoscedasticity). As presented in Figure 11b, the residuals follow a normal distribution, which is also supported by the Shapiro–Wilk test (Statistic = 0.9625, p-Value = 0.8027), demonstrating the adequacy of the developed model within the investigated parameter range.

Figure 11.
Results of residual tests for constant error variance (a) and for normality of residual distribution (b).
Figure 12 shows the comparison between the experimental data and the developed model. The accuracy of this model was evaluated using the R2, RMSE, and MAE metrics, which were 0.9504, 1.972, and 1.297, respectively, indicating a high accuracy of the obtained model.
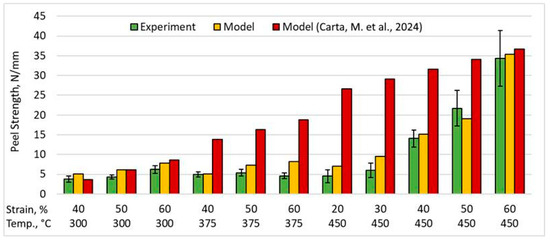
Figure 12.
Comparison of the model calculation results with experimental data and data from Reference [13].
When evaluating the obtained experimental results and the developed model in comparison with other studies, it is important to note the presence of substantial discrepancies. As stated earlier, the experimental and calculated data reported by the authors of [13] show good agreement with the present results only under the cladding condition at 300 °C and in the case combining maximum temperature and reduction. This is a consequence of fundamentally different conditions of simultaneous deformation. These include the number of bonded layers, differences in the materials used, and the fact that in [13] the bonded sheets were fabricated from the same alloy. The most important difference, in terms of the methodology and key aspects of the present study, lies in the deformation conditions: the linear rolling rate in [13] exceeded that used here by a factor of ten; deformation was performed with rolls of smaller diameter (130 mm) using thinner specimens ( = 2.4 mm) and narrower width, which consequently reduced the deformation zone area by several times and promoted the development of much higher forces per unit of contact area. All these factors explain the exceptionally high bonding strength values reported in [13].
At the same time, comparison with earlier results obtained for the base alloy Al–2%Cu–2%Mn [41] highlights the role of the number of bonded layers. Under comparable deformation conditions (reduction ratio and temperature) in the present and previous [41] studies, a significant difference in the magnitude of normal stresses along the deformation zone, as determined by FEM simulations, was observed. The stress magnitude under one-sided cladding was, on average, 30% higher than under two-sided cladding. This difference can be considered as the reason for the twofold or greater increase in bonding strength achieved in the case of one-sided cladding.
It can therefore be concluded that the known models for predicting the bonding strength in hot roll cladding—whether based on experimental data or incorporating FEM-calculated parameters—are valid only under strictly limited conditions. Their unification for different alloy combinations, number of layers, deformation conditions, and technological equipment parameters remains a highly challenging task.
5. Conclusions
Finite element modeling of the double-sided hot cladding process of the experimental Al-2%Cu-1.5%Mn-1%Zn-0.7%Mg-0.4%Fe-0.4%Si alloy with technically pure aluminum A1050 under combined hot deformation was performed. It was found that increasing the degree of reduction during cladding significantly changes the pattern of shear strains in the deformation zone. At small reductions (20–30%), the shear directions in the base and cladding layers coincide, whereas this changes when the reduction exceeds 40%. Deformation temperature has the greatest influence on the normal stresses and flow stresses of the base and cladding layers in the deformation zone. The magnitude of deformation does not significantly affect the stresses along most of the deformation zone but noticeably impacts their maximum, observed at the neutral section of the zone.
To verify the developed model, experiments were conducted on cladding the studied alloy at temperatures of 300–450 °C and relative reductions of 20–60%. Layer bonding was achieved in all cases, except for combinations of 300–375 °C and 20–30% reduction. Based on these data, a predictive model was proposed for estimating the feasibility of mechanical bonding during hot rolling cladding. This model can be calculated using results from simulations of combined plastic deformation in applied finite element software and is directly linked to the bonding strength of aluminum alloys in the studied group.
Author Contributions
Conceptualization, A.K. (Alexander Koshmin) and A.Z.; methodology, A.K. (Alexander Koshmin); software, A.K. (Anna Khakimova); validation, A.K. (Alexander Koshmin), R.B. and D.D.; formal analysis, K.L.; investigation, A.K. (Anna Khakimova) and K.L.; resources, R.B.; data curation, D.D.; writing—original draft preparation, A.K. (Alexander Koshmin); writing—review and editing, A.K. (Alexander Koshmin), A.Z. and R.B.; visualization, A.K. (Anna Khakimova); supervision, A.Z.; project administration, A.Z. and K.L.; funding acquisition, A.K. (Alexander Koshmin). All authors have read and agreed to the published version of the manuscript.
Funding
The study was carried out with the financial support of the Moscow Polytechnic University within the framework of the grant named after Pyotr Kapitsa.
Data Availability Statement
Data are contained within the article.
Conflicts of Interest
The authors report there are no competing interests to declare.
References
- Kammer, C. Aluminum and Aluminum Alloys. In Springer Handbook of Materials Data; Springer: Cham, Switzerland, 2018; pp. 161–197. [Google Scholar] [CrossRef]
- Sanders, R.; Staley, J.T. History of Wrought Aluminum Alloys and Applications. In Properties and Selection of Aluminum Alloys; Anderson, K., Weritz, J., Kaufman, J.G., Eds.; ASM International: Novelty, OH, USA, 2019. [Google Scholar] [CrossRef]
- Kermanidis, A.T. Aircraft Aluminum Alloys: Applications and Future Trends. In Revolutionizing Aircraft Materials and Processes; Pantelakis, S., Tserpes, K., Eds.; Springer: Cham, Switzerland, 2020; pp. 21–55. [Google Scholar] [CrossRef]
- Khangholi, S.N.; Javidani, M.; Maltais, A.; Chen, X.G. Review on recent progress in Al–Mg–Si 6xxx conductor alloys. J. Mater. Res. 2022, 37, 670–691. [Google Scholar] [CrossRef]
- Kumar, N.S.; Pramod, G.; Samrat, P.; Sadashiva, M. A Critical Review on Heat Treatment of Aluminium Alloys. Mater. Today Proc. 2022, 58, 71–79. [Google Scholar] [CrossRef]
- Zhu, H.; Li, J. Advancements in Corrosion Protection for Aerospace Aluminum Alloys through Surface Treatment. Int. J. Electrochem. Sci. 2024, 19, 100487. [Google Scholar] [CrossRef]
- Bhat, K.U.; Panemangalore, D.B.; Kuruveri, S.B.; John, M.; Menezes, P.L. Surface Modification of 6xxx Series Aluminum Alloys. Coatings 2022, 12, 180. [Google Scholar] [CrossRef]
- Bolton, W.; Higgins, R.A. Materials for Engineers and Technicians, 5th ed.; Elsevier: Oxford, UK, 2010; ISBN 978-1856177696. [Google Scholar] [CrossRef]
- Ragazin, A.A.; Yashin, V.V.; Latushkin, I.A.; Aryshesnkii, E.V.; Grechnikov, F.V. Homogenization Modes Effect on Mechanical Properties and Corrosive Characteristics of the Rolled Products from Al-Mg (1570) Aluminum Alloy with Addition of Scandium and Zirconium. Mater. Sci. Forum 2022, 1049, 102–107. [Google Scholar] [CrossRef]
- Szabó, G.; Mertinger, V.; Zupkó, I.; Mikó, T. Technological Investigation of Clad Sheet Bonding by Hot Rolling. Key Eng. Mater. 2015, 651, 243–247. [Google Scholar] [CrossRef]
- Zinong, T.; Bing, Z.; Jun, J.; Zhiqiang, L.; Jianguo, L. A Study on the Hot Roll Bonding of Aluminum Alloys. Procedia Manuf. 2020, 50, 56–62. [Google Scholar] [CrossRef]
- Xu, W.; Xia, C.; Ni, C. Numerical Simulation and Experimental Verification of Hot Roll Bonding of 7000 Series Aluminum Alloy Laminated Materials. Metals 2024, 14, 551. [Google Scholar] [CrossRef]
- Carta, M.; Buonadonna, P.; Reggiani, B.; Donati, L.; Aymerich, F.; EIMehtedi, M. Effect of Temperature and Strain on Bonding of Similar AA3105 Aluminum Alloys by the Roll Bonding Process. Metals 2024, 14, 920. [Google Scholar] [CrossRef]
- Khan, H.A.; Asim, K.; Akram, F.; Hameed, A.; Khan, A.; Mansoor, B. Roll Bonding Processes: State-of-the-Art and Future Perspectives. Metals 2021, 11, 1344. [Google Scholar] [CrossRef]
- Li, Z.; Rezaei, S.; Wang, T.; Han, J.; Shu, X.; Pater, Z.; Huang, Q. Recent advances and trends in roll bonding process and bonding model: A review. Chin. J. Aeronaut. 2023, 36, 36–37. [Google Scholar] [CrossRef]
- Liu, Z.; Krämer, A.; Lohmar, J.; Aretz, H.; Karhausen, K.; Bailly, D.; Hirt, G.; Teller, M. The adaption, evaluation and application of a semi-empirical bond strength model for the simulations of multi-pass hot roll bonding of aluminium alloys. Int. J. Mater. Form. 2023, 16, 71. [Google Scholar] [CrossRef]
- Kovalev, S.I.; Koryagin, N.I.; Shirkov, I.V. Stresses and Strains in Flat Rolling; Metallurgiya: Moscow, Russia, 1982. (In Russian) [Google Scholar]
- Kobelev, A.G.; Lysak, V.I.; Chernyshev, V.N.; Kuznetsov, E.V. Materials Science and Technology of Composite Materials; Intermet Engineering: Moscow, Russia, 2006. (In Russian) [Google Scholar]
- Kolpashnikov, A.I. Rolling of Light Alloy Sheets; Metallurgiya: Moscow, Russia, 1970. (In Russian) [Google Scholar]
- Zinoviev, A.V.; Kolpashnikov, A.I.; Polukhin, P.I. Technology of Forming of Non-Ferrous Metals and Alloys: Textbook for Universities; Metallurgiya: Moscow, Russia, 1992. (In Russian) [Google Scholar]
- Shatalov, R.L.; Kulikov, M.A. Influence of outer parts of a strip on the deformation and force parameters of thin-sheet rolling. Metallurgist 2020, 64, 687–698. [Google Scholar] [CrossRef]
- Shatalov, R.L.; Maksimov, E.A. Development and Application of the Theory of Rigid Ends in Thin-Sheet Rolling. Metallurgist 2021, 64, 1035–1042. [Google Scholar] [CrossRef]
- Saevarsdottir, G.; Magnusson, T.; Kvande, H. Reducing the Carbon Footprint: Primary Production of Aluminum and Silicon with Changing Energy Systems. J. Sustain. Metall. 2021, 7, 848–857. [Google Scholar] [CrossRef]
- Shen, A.; Zhang, J. Technologies for CO2 emission reduction and low-carbon development in primary aluminum industry in China: A review. Renew. Sustain. Energy Rev. 2024, 189, 113965. [Google Scholar] [CrossRef]
- Zhao, Y.L.; Zhang, W.W.; Yang, C.; Zhang, D.T.; Wang, Z. Effect of Si on Fe-rich intermetallic formation and mechanical properties of heat-treated Al-Cu-Mn-Fe alloys. J. Mater. Res. 2018, 33, 898–911. [Google Scholar] [CrossRef]
- Belov, N.A.; Akopyan, T.K.; Korotkova, N.O.; Cherkasov, S.O.; Yakovleva, A.O. Effect of Fe and Si on the Phase Composition and Microstructure Evolution in Al-2 wt.% Cu-2 wt.% Mn Alloy During Solidification, Cold Rolling and Annealing. JOM 2021, 73, 3827–3837. [Google Scholar] [CrossRef]
- Belov, N.A.; Alabin, A.N.; Matveeva, I.A. Optimization of phase composition of Al–Cu–Mn–Zr–Sc alloys for rolled products without requirement for solution treatment and quenching. J. Alloys Compd. 2014, 583, 206–213. [Google Scholar] [CrossRef]
- Belov, N.A.; Cherkasov, S.O.; Korotkova, N.O.; Yakovleva, A.O.; Tsydenov, K.A. Effect of Iron and Silicon on the Phase Composition and Microstructure of the Al–2% Cu–2% Mn (wt%) Cold Rolled Alloy. Phys. Met. Metallogr. 2021, 122, 1095–1102. [Google Scholar] [CrossRef]
- Akopyan, T.K.; Letyagin, N.V.; Belov, N.A.; Fortuna, A.S.; Nguen, X.D. The role of Sn trace addition in the precipitation behavior and strengthening of the wrought Al–Cu–Mn-based alloy. J. Mater. Sci. 2023, 58, 8210–8229. [Google Scholar] [CrossRef]
- Belov, N.A.; Shurkin, P.K.; Korotkova, N.O.; Cherkasov, S.O. The effect of heat treatment on the structure and mechanical properties of cold-rolled sheets made of Al-Cu-Mn alloys with varying copper to manganese ratios. Tsetnye Met. 2021, 9, 80–86. [Google Scholar] [CrossRef]
- Belov, N.; Akopyan, T.; Tsydenov, K.; Cherkasov, S.; Avxentieva, N. Effect of Fe-Bearing Phases on the Mechanical Properties and Fracture Mechanism of Al–2wt.%Cu–1.5wt.%Mn (Mg,Zn) Non-Heat Treatable Sheet Alloy. Metals 2023, 13, 1911. [Google Scholar] [CrossRef]
- Belov, N.A.; Akopyan, T.K.; Tsydenov, K.A.; Letyagin, N.V.; Fortuna, A.S. Structure evolution and mechanical properties of sheet alloy Al–2Cu–1.5Mn–1Mg–1Zn (wt.%) designed for Al20Cu2Mn3 dispersoids. Metals 2023, 13, 1442. [Google Scholar] [CrossRef]
- Tsydenov, K.A.; Belov, N.A. Phase Composition and Structure of Al–Cu–Mn–Mg–Zn–Fe–Si Alloys Containing 2% Cu and 1.5% Mn. Phys. Met. Metallogr. 2024, 125, 709–720. [Google Scholar] [CrossRef]
- Belov, N.A.; Tsydenov, K.A.; Drits, A.M. Method of Producing Cold-Rolled Sheets from Secondary Aluminium Alloy. RU Patent 2 826 055 C1, 3 September 2024. [Google Scholar]
- Danilin, V.N.; Aleshchenko, A.S.; Danilin, A.V.; Koshmin, A.N. Simulation of taper heating and variable pressing rate to improve extrusion performance for high-strength aluminum alloys. Model. Simul. Mater. Sci. Eng. 2024, 32, 065006. [Google Scholar] [CrossRef]
- Polukhin, P.I.; Gun, G.Y.; Galkin, A.M. Soprotivlenie Plasticheskoi Deformatsii Metallov i Splavov (Plastic Strain Resistance of Metals and Alloys); Metallurgiya: Moscow, Russia, 1983; p. 352. (In Russian) [Google Scholar]
- QForm. Available online: https://qform3d.com/ (accessed on 12 August 2025).
- Klepov, D.N.; Yashin, V.V.; Latushkin, I.A.; Aryshenskii, E.V.; Erisov, Y.A. Determination of Conditions for the Occurrence of Delamination, a Surface Defect Occurring during Hot Rolling of Aluminum Alloy Strips. Russ. Metall. 2024, 2024, 1694–1699. [Google Scholar] [CrossRef]
- ASTM D1876-08(2015)e1; Standard Test Method for Peel Resistance of Adhesives (T-Peel Test). ASTM International: West Conshohocken, PA, USA, 2015. [CrossRef]
- Arkulis, G.E. Joint Plastic Deformation of Dissimilar Metals; Metallurgiya: Moscow, Russia, 1964. (In Russian) [Google Scholar]
- Koshmin, A.; Zinoviev, A.; Cherkasov, S.; Mahmoud Alhaj Ali, A.; Tsydenov, K.; Churyumov, A. Finite Element Modeling and Experimental Verification of a New Aluminum Al-2%Cu-2%Mn Alloy Hot Cladding by Flat Rolling. Metals 2024, 14, 852. [Google Scholar] [CrossRef]
- Qin, Q.; Zhang, D.-T.; Zang, Y.; Guan, B. A simulation study on the multi-pass rolling bond of 316L/Q345R stainless clad plate. Adv. Mech. Eng. 2015, 7, 1–13. [Google Scholar] [CrossRef]
- He, Z.; Chu, Z.; Shuang, Y.; Gou, Y. The bonding mechanism and experimental verification of pilger hot rolling clad tube. Adv. Mater. Sci. Eng. 2020, 2020, 2689370. [Google Scholar] [CrossRef]
- Yong, J.; Dashu, P.; Dong, L.; Luoxing, L. Analysis of Clad Sheet Bonding by Cold Rolling. J. Mater. Process. Technol. 2000, 105, 32–37. [Google Scholar] [CrossRef]
- Pan, S.C.; Huang, M.N.; Tzou, G.Y.; Syu, S.W. Analysis of Asymmetrical Cold and Hot Bond Rolling of Unbounded Clad Sheet under Constant Shear Friction. J. Mater. Process. Technol. 2006, 177, 114–120. [Google Scholar] [CrossRef]
- Zhang, X.P.; Yang, T.H.; Castagne, S.; Gu, C.F.; Wang, J.T. Proposal of bond criterion for hot roll bonding and its application. Mater. Des. 2011, 32, 2239–2245. [Google Scholar] [CrossRef]
- Salikhyanov, D.R. Investigation of the stress-strain state at the boundary between materials during rolling of a layered composite. Chernye Met. 2023, 9, 34–39. [Google Scholar] [CrossRef]
Disclaimer/Publisher’s Note: The statements, opinions and data contained in all publications are solely those of the individual author(s) and contributor(s) and not of MDPI and/or the editor(s). MDPI and/or the editor(s) disclaim responsibility for any injury to people or property resulting from any ideas, methods, instructions or products referred to in the content. |
© 2025 by the authors. Licensee MDPI, Basel, Switzerland. This article is an open access article distributed under the terms and conditions of the Creative Commons Attribution (CC BY) license (https://creativecommons.org/licenses/by/4.0/).