1. Introduction
Fiber Metal Laminates (FMLs) are hybrid materials that leverage the unique properties of metallic and fiber-reinforced polymer (FRP) layers [
1], achieving reduced weight compared to metals while combining the elastoplastic capability of these with the brittle-elastic behavior characteristic of composites. This combination provides FMLs with high structural performance and an enhanced strength-to-weight ratio compared to conventional composite materials, including improved resistance to corrosion, fatigue, impact, and crack propagation, making them particularly suitable for demanding applications in the aerospace, space, automotive, naval, and defense sectors [
1,
2,
3]. Despite their potential, critical areas still require optimization, such as manufacturing processes and metallic surface treatments, both of which influence the interlaminar behavior of FMLs [
4].
Chen et al. [
4] reported that the interlaminar strength in FMLs is often the system’s weak point, due both to the nature of the metal/composite bond and the lack of reinforcement in the through-thickness direction. This bond is maintained by a resin-rich layer that acts as an adhesive agent. Its strength depends not only on the intrinsic properties of the materials involved but also on the quality of the interface, which can be affected by the presence of organic or physical contaminants, as well as by poor wetting of the adhesive [
5]. In this context, Campbell [
6] emphasizes that one of the key factors to promote effective adhesion is the surface roughness.
In addition, surface treatments enhance the wettability of metallic surfaces, thereby optimizing the adhesive wetting process. This facilitates the distribution of the adhesive, ensuring full contact with the available surface and promoting the mechanical interlocking mechanism [
7]. This adhesion mechanism occurs when the adhesive percolates into pores, cracks, grooves, and other surface irregularities present in the micro- and nanoscale morphology prior to the curing of the adhesive or adhesive system [
5,
7,
8].
A simple technique such as mechanical abrasion enables the production of surfaces that are more receptive to adhesives, particularly when the sanding duration is extended and the roughness parameters are controlled to increase surface energy, thereby enhancing mechanical adhesion [
9]. Likewise, chemical or electrochemical etching processes allow the formation of a passive oxide layer on metallic surfaces with uniform thickness and homogeneous structure, whose roughness and porosity can be controlled. This passive layer not only increases corrosion resistance but also improves the tribological and mechanical properties of the interface [
10]. According to Dervishi et al. [
10], the native oxide limits the performance of aluminum alloys in applications involving frictional or sliding contact. In contrast, Raveh et al. [
11] highlight that the formation of a passive oxide film can significantly enhance the surface properties of aluminum, thereby expanding its potential applications.
To evaluate the strength of adhesive joints, mechanical tests are categorized as tensile, shear, or peel, each promoting different failure modes depending on the direction of the applied load [
12]. Mode I occurs when a normal load is applied to the interface, tending to separate the adhered surfaces. Mode II involves a shear load acting parallel to the interface, while Mode III is characterized by transverse tearing, in which the crack surfaces slide laterally relative to each other. However, studies have shown that Mode III has a minimal contribution to interlaminar failure [
13]. Thus, delamination in composite laminates is primarily driven by Modes I and II, with Mode I being the dominant mechanism, as normal stresses act directly at the crack tip, whereas the maximum shear stress (Mode II) develops prior to reaching this region [
5,
13]. In this context, peel tests are commonly used to assess interlaminar strength, as they directly induce Mode I failure. These tests are effective for evaluating joint quality and understanding how surface treatments influence the adhesive–adherent interface [
14].
According to Hu et al. [
15], failure modes in metal/resin joints are classified as adhesive, cohesive, or mixed. Adhesive failure occurs when separation happens at the adhesive/substrate interface, indicating poor adhesion. Cohesive failure occurs within the adhesive itself or within the substrate, suggesting that the joint is stronger than one of the materials. Finally, mixed failure combines characteristics of both types, showing regions of separation both at the interface and within the cohesive material.
On the other hand, out-of-autoclave (OoA) manufacturing processes, such as vacuum bagging (VB) and vacuum-assisted resin transfer molding (VARTM), have emerged as cost-effective and sustainable alternatives to autoclave curing, reducing energy consumption and simplifying the production process [
16,
17]. These techniques allow the fabrication of FMLs at low pressures and moderate temperatures, being particularly suitable for thermosetting matrices such as polyester resin.
The objective of this study was to investigate the interlaminar behavior of an FML, fabricated using a combination of VARTM and VB processes, through T-peel tests under Mode I, while varying the surface condition of the metallic phase. The outer metallic phase of the FML consisted of 3003-H14 aluminum alloy. It is noteworthy that the use of this alloy as a metallic substrate in FML fabrication represents a novel approach compared to existing literature, where this alloy is primarily limited to applications in welding, corrosion resistance, or the manufacture of metallic components.
The aluminum surfaces intended for adhesion were treated via a mechanical abrasion, followed by an ultrasonic bath in a 0.1 M sodium hydroxide solution (NaOH), with exposure times of 20, 40, and 60 min. These variants were designated as Al-20, Al-40, and Al-60, respectively, representing different surface states. The morphology of these surfaces was examined using optical microscopy and atomic force microscopy (AFM); the former provided an overview of the generated microtextures, while the latter enabled detailed local analysis of surface relief and topography. Concurrently, peel tests were conducted to correlate the surface features with the interlaminar strength of the FML.
3. Results
3.1. Morphological Characterization by Optical Microscopy
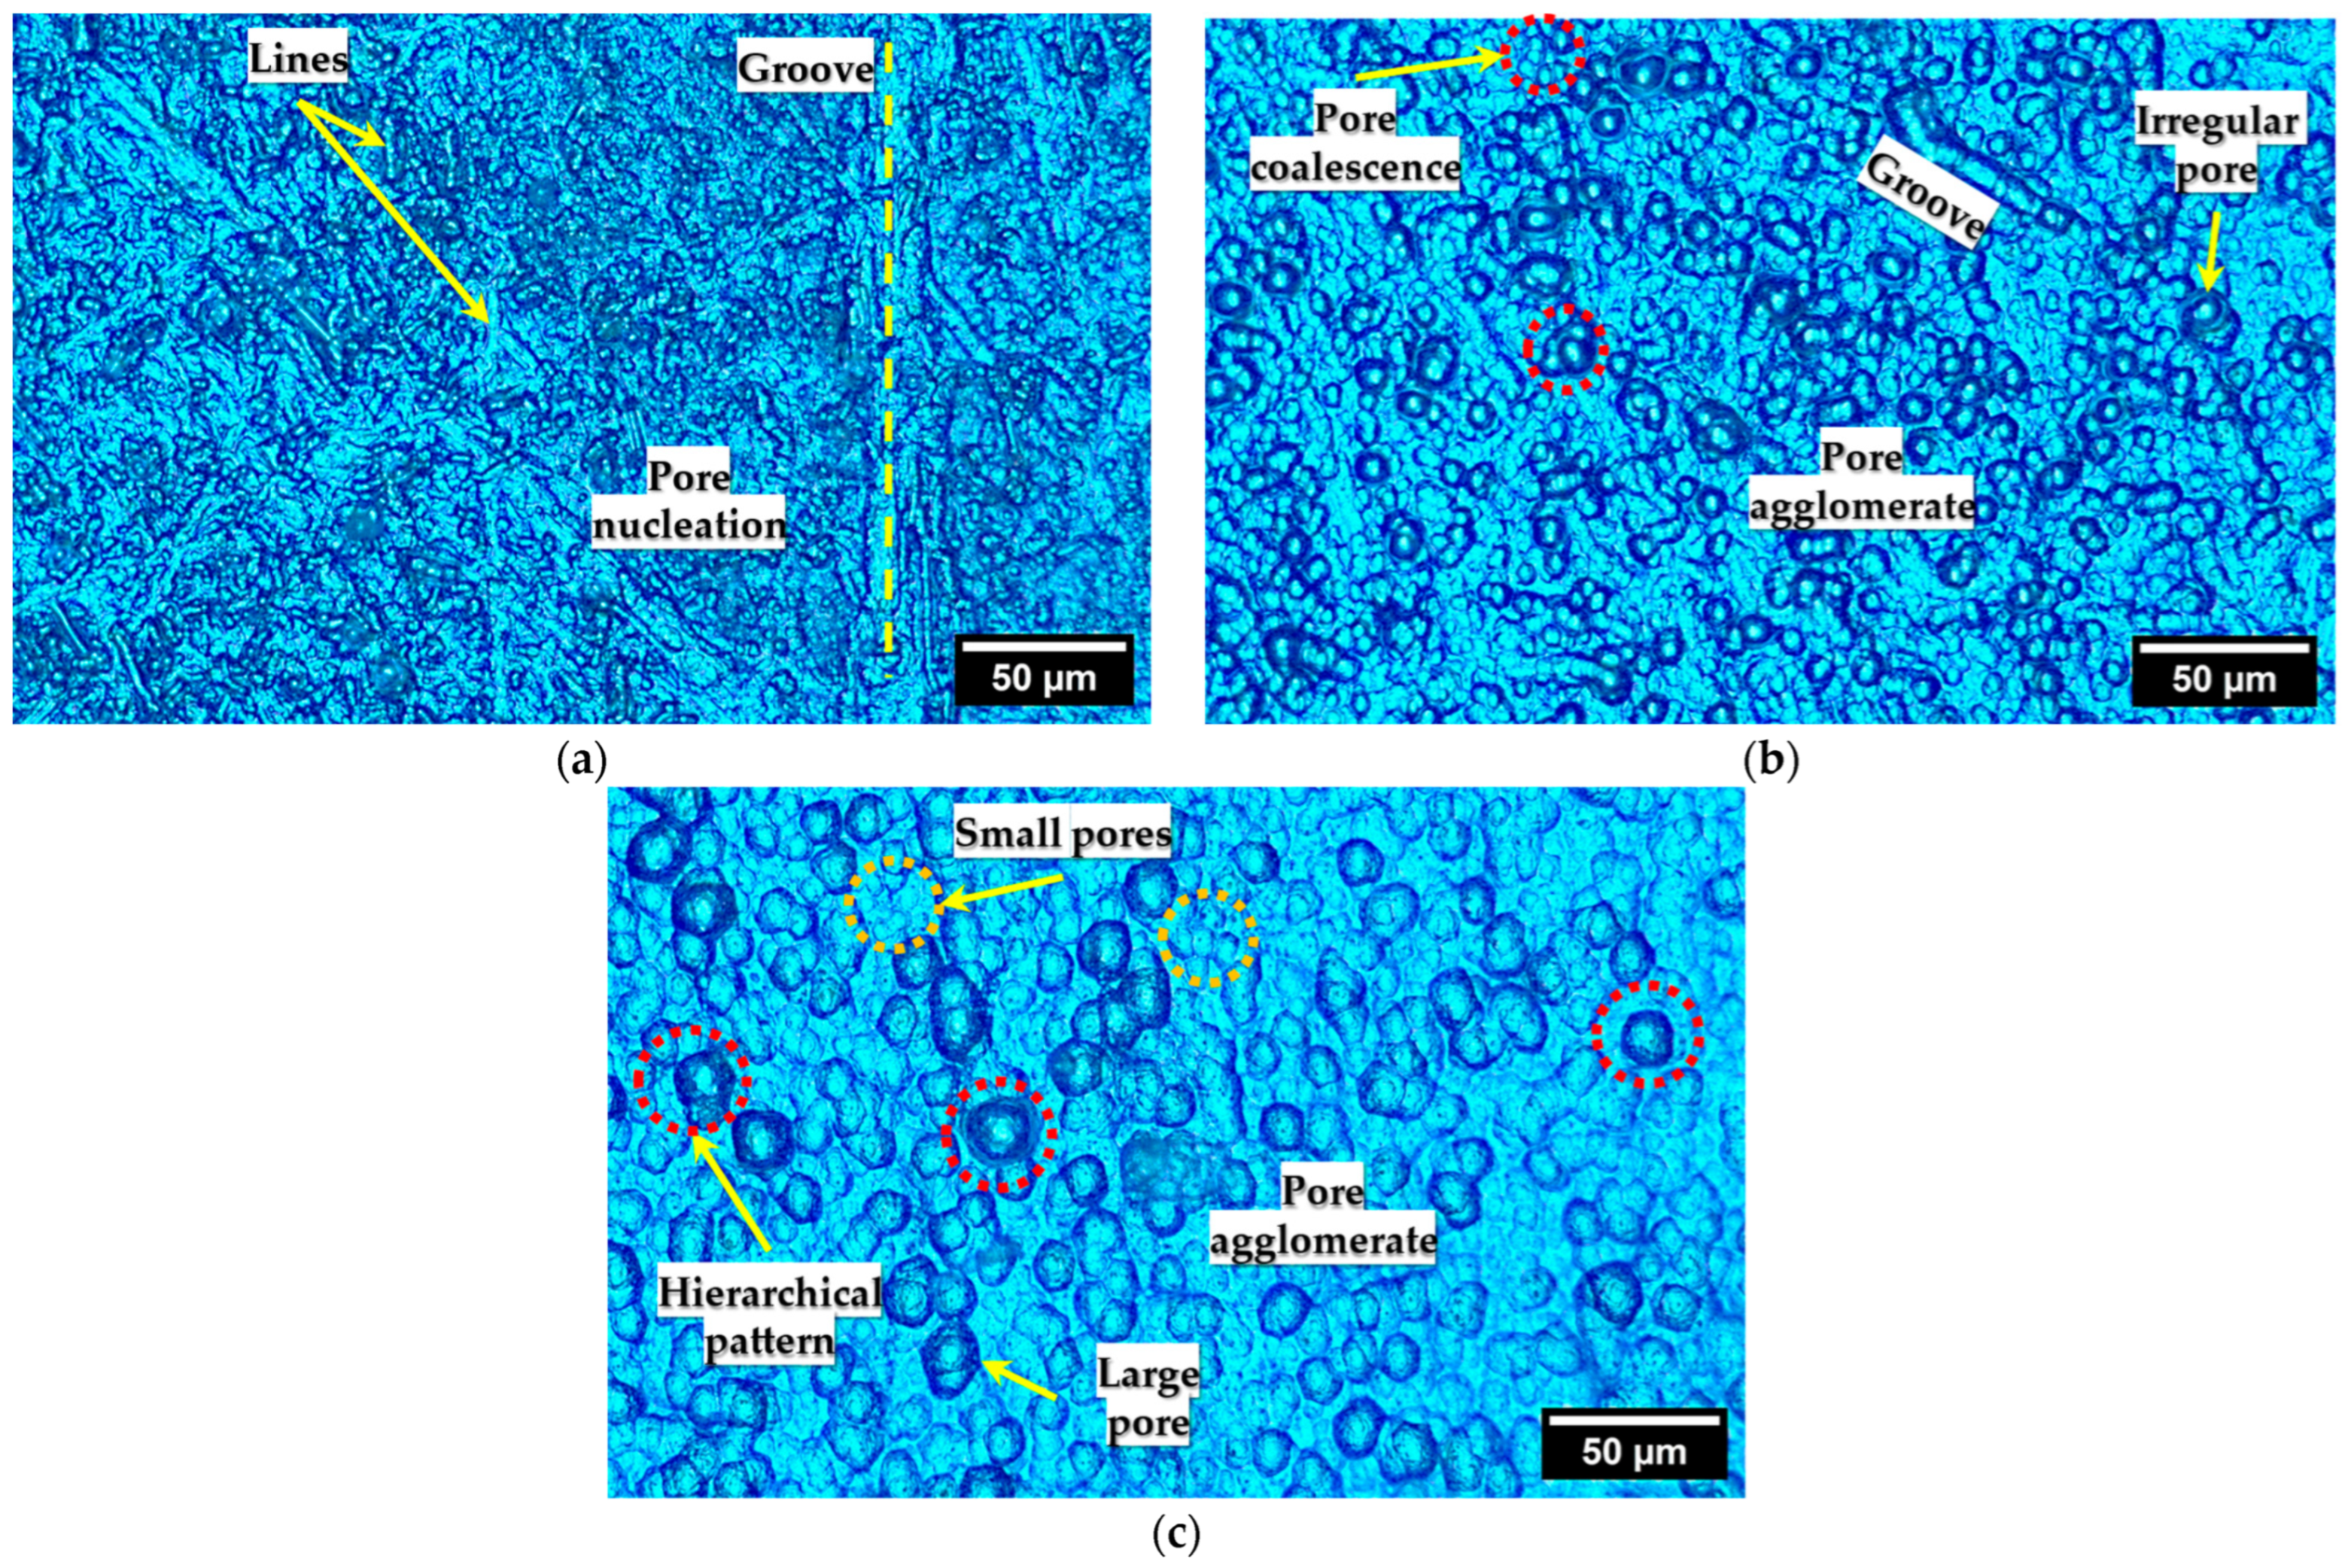
Representative optical micrographs of the Al-20, Al-40, and Al-60 variants, corresponding to aluminum sheets treated in alkaline ultrasonic solution for 20, 40, and 60 min, respectively, are shown in
Figure 5.
The interpretation of the micrographs was based on the contrast generated by the reflection of incident light. In general, darker regions within circular structures indicated lower reflection, suggesting the presence of topographical depressions associated with cavities or pores. In contrast, brighter areas were initially interpreted as surface elevations or zones less affected by the chemical treatment, particularly in the Al-20 and Al-40 variants.
However, for Al-60, this relationship between contrast and topography was no longer entirely valid. Despite exhibiting regions of higher reflection, these did not correspond to elevations but rather resulted from significant pore widening and the angle of the pore walls, which altered the optical behavior of the surface. Therefore, interpretation at this stage required consideration of both morphology and potential optical effects induced by geometric changes.
This approach allowed for the precise identification and delimitation of irregularities, such as lines and grooves, as well as regions with homogeneous or heterogeneous distribution, shape, and coalescence of pores. Based on these observations, morphological mechanisms associated with the abrasive pretreatment and chemical etching were proposed, facilitating comparison among the different microtextures of the aluminum variants.
In the micrograph corresponding to the Al-20 variant (see
Figure 5a), the surface was strongly affected by the prior mechanical pretreatment, with a microtexture that reflected less light due to a higher proportion of dark regions associated with the predominant presence of irregularities formed by lines and grooves. Some features showed no significant dissolution internally and instead displayed high brightness under the microscope, while pores were identified both within and outside these grooves.
As exposure time increased, Al-40 (see
Figure 5b) exhibited a surface with a higher density of randomly distributed pores, showing greater reflectivity compared to Al-20. The lines and grooves generated during the sanding process were still prevalent. At this intermediate stage, small- and medium-diameter pores coexisted, many of which were partially aggregated or coalesced to form asymmetric structures.
Prolonged treatment up to the Al-60 condition (see
Figure 5c) resulted in a surface characterized by the complete blurring of lines and grooves, attributed to a more regular and symmetrical organization of the pores. This morphological transformation was reflected in an overall increased reflectivity, interrupted only by faint dark regions associated with deeper pores. Most pores exhibited similar brightness, likely due to comparable depth and shape. Pore coalescence continued, albeit to a lesser extent, and the surface morphology exhibited a bimodal pore distribution, characterized by larger structures surrounded by smaller ones.
Based on the quantitative information collected, shown in
Table 2. The morphological parameters exhibited substantial changes when comparing the surface conditions Al-20, Al-40, and Al-60.
The average pore area increased from 2.2 µm2 in Al-20 to 16.1 µm2 in Al-40, representing an increase of approximately 630%, and ultimately reaching 68.4 µm2 in Al-60, equivalent to a total growth of nearly 3000% relative to the Al-20 condition. The average pore diameter also experienced significant increases, growing by 163% from Al-20 (1.6 µm) to Al-40 (4.2 µm), and by 111% when comparing Al-40 to Al-60 (8.9 µm), more than doubling the diameter in the final stage. Furthermore, analysis of the diameter range revealed that, although each variant exhibited a distinct interval (Al-20: 0.7–3.9 µm, Al-40: 2.2–9.2 µm, and Al-60: 3.2–15.2 µm), a progressive overlap was observed, suggesting that, as exposure to alkaline etching progressed, the pore populations shared similar sizes, reflecting a continuous and dynamic evolution of the surface morphology.
Moreover, the porous area fraction showed a notable increase, rising from 2.4% in Al-20 to 13.9% in Al-40, corresponding to a 479% increase, and reaching 39.7% in Al-60, implying a total growth exceeding 1550%. Finally, the average interpore distance exhibited a more moderate behavior compared to Al-20 (4.0 µm), increasing by 33% in Al-40 (5.3 µm) and by 85% in Al-60 (7.4 µm).
3.2. Morphological and Topographical Characterization by AFM
Although optical microscopy provided a broad view of the surface features of each aluminum type, this technique exhibited certain limitations, as it did not allow precise identification of surface elevations or depressions, nor clear delineation of the physical boundaries of the pores. Only the darker contrast observed in some surface regions suggested the presence of shapes reflecting light differently at the surface level.
To overcome these limitations and complement the surface analysis, atomic force microscopy (AFM) was employed, enabling high-resolution 2D and 3D imaging with greater detail. This approach allowed for quantification of local parameters limited to the analyzed areas. From these images, a morphological and topographical analysis was performed, facilitated by the high resolution of AFM, which allowed clearer observation of the regions of interest and a deeper examination of the surface microstructural features.
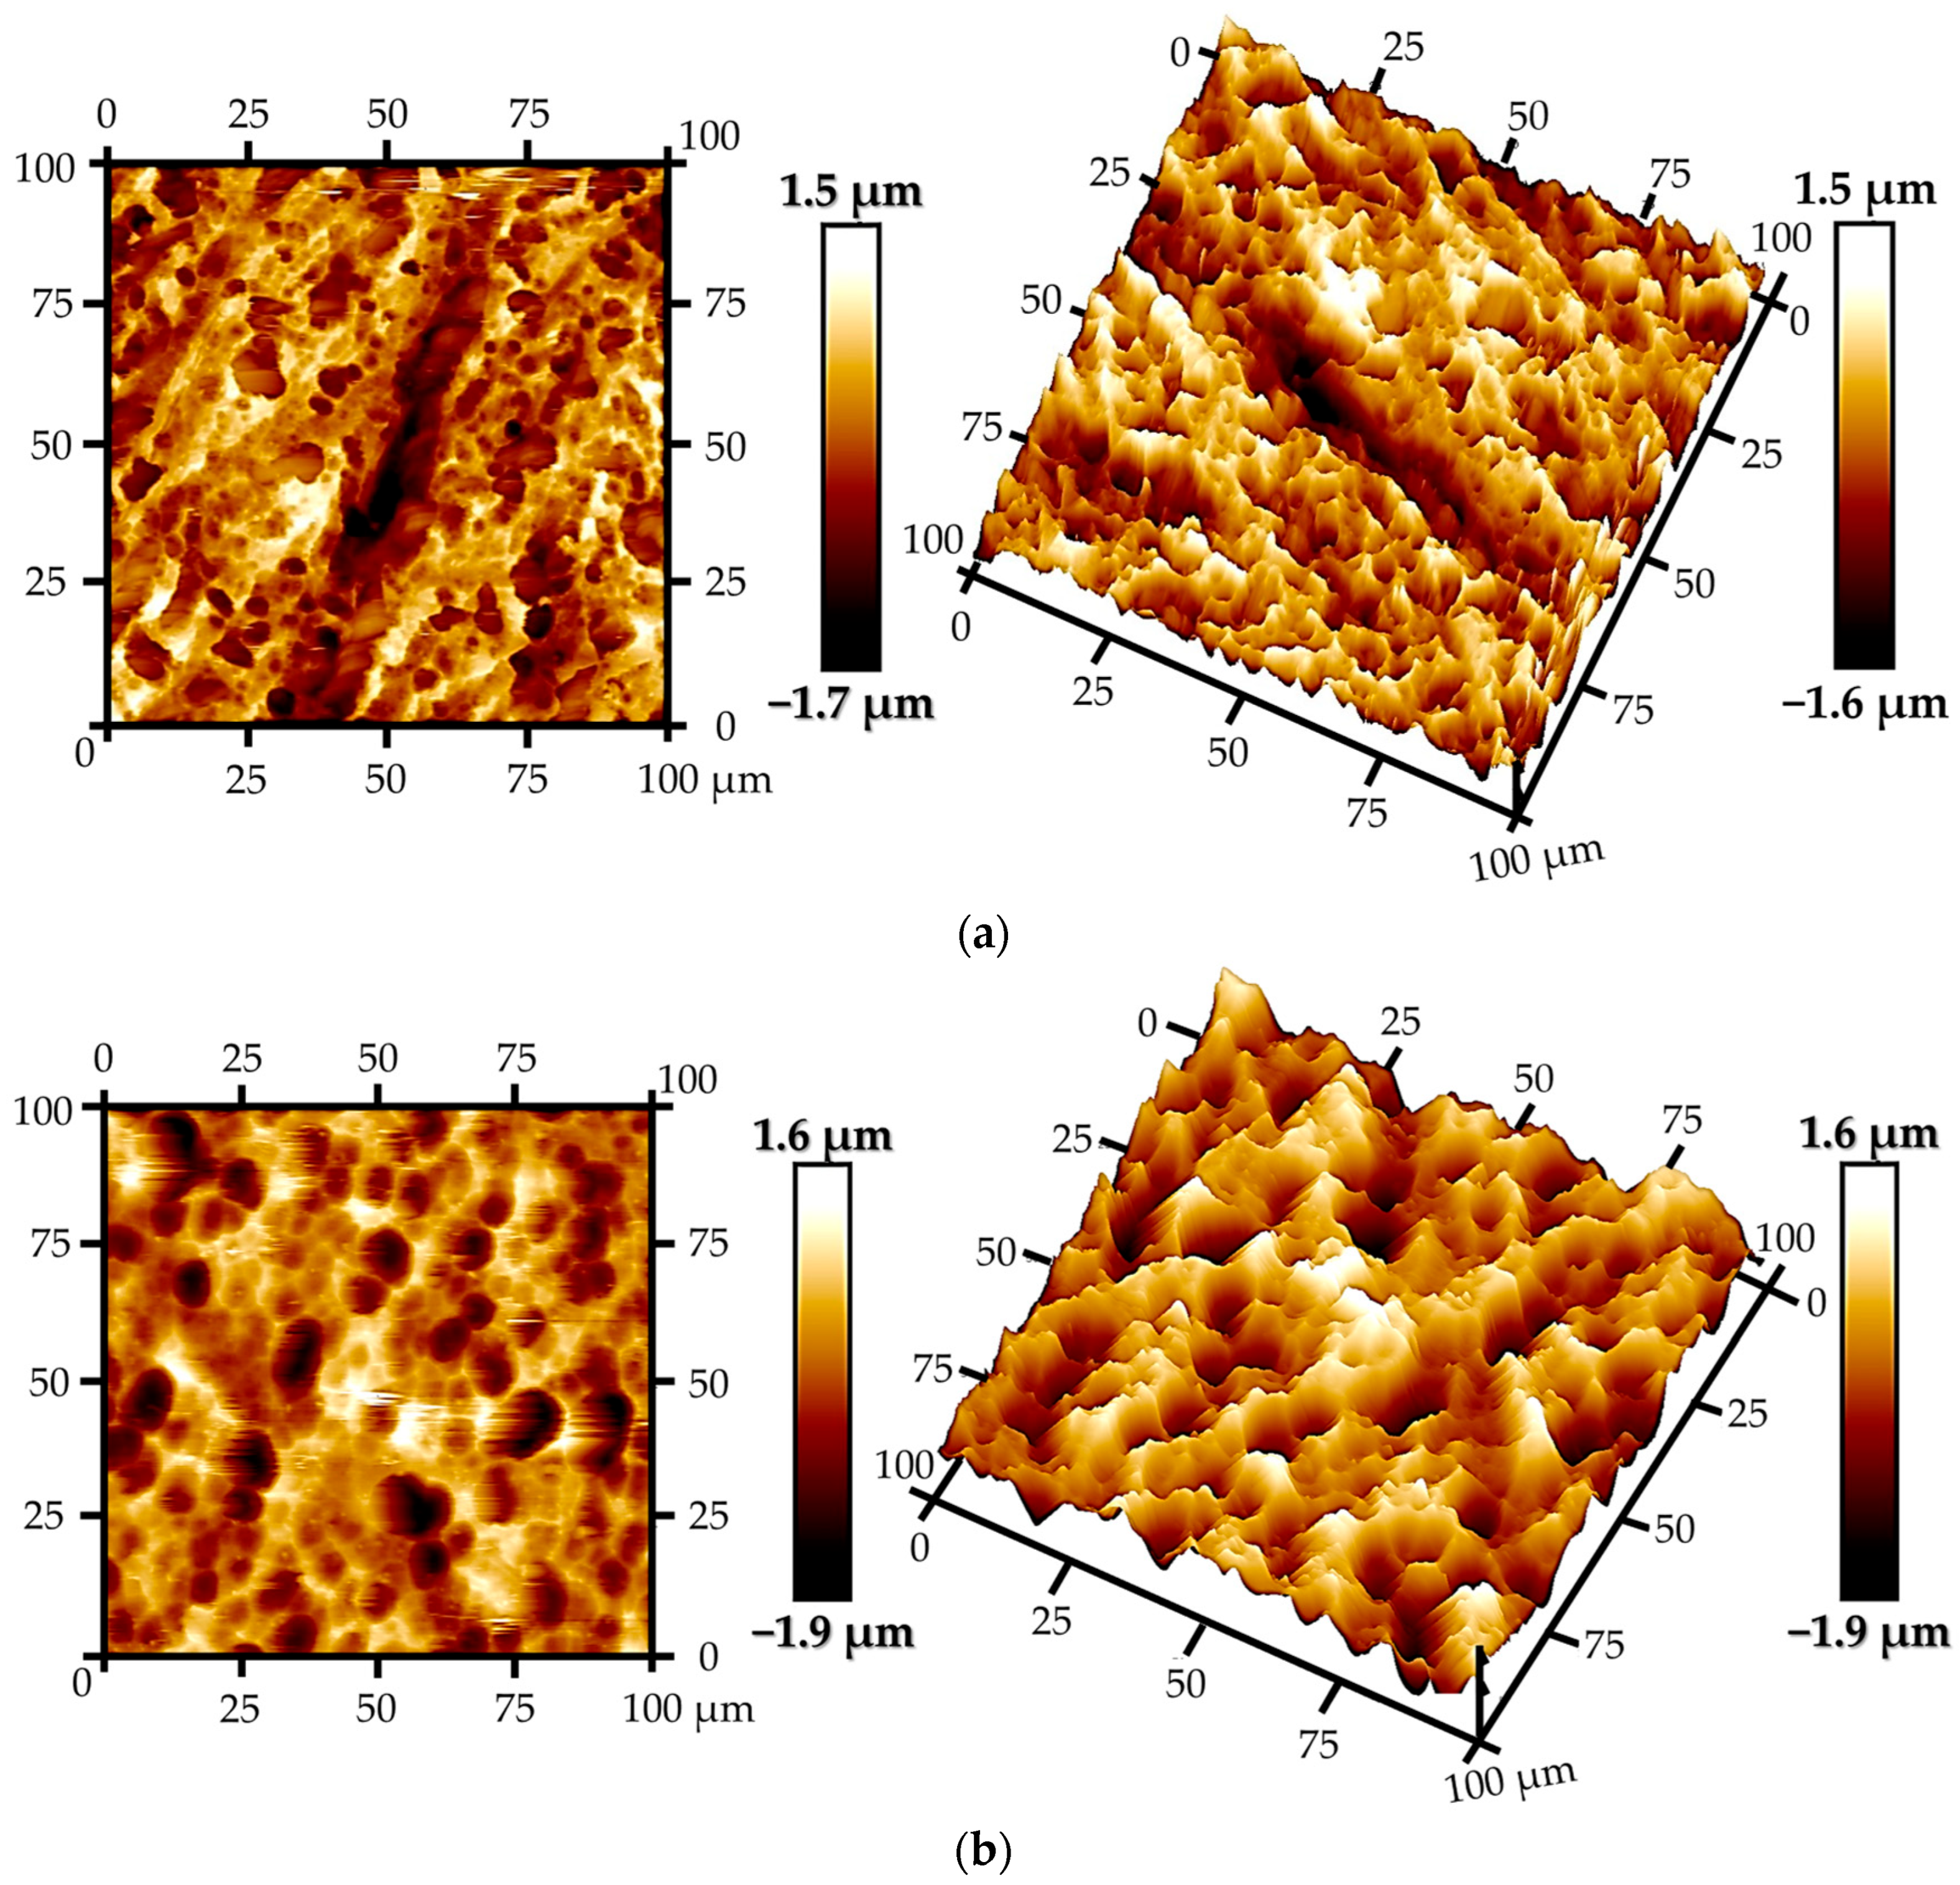
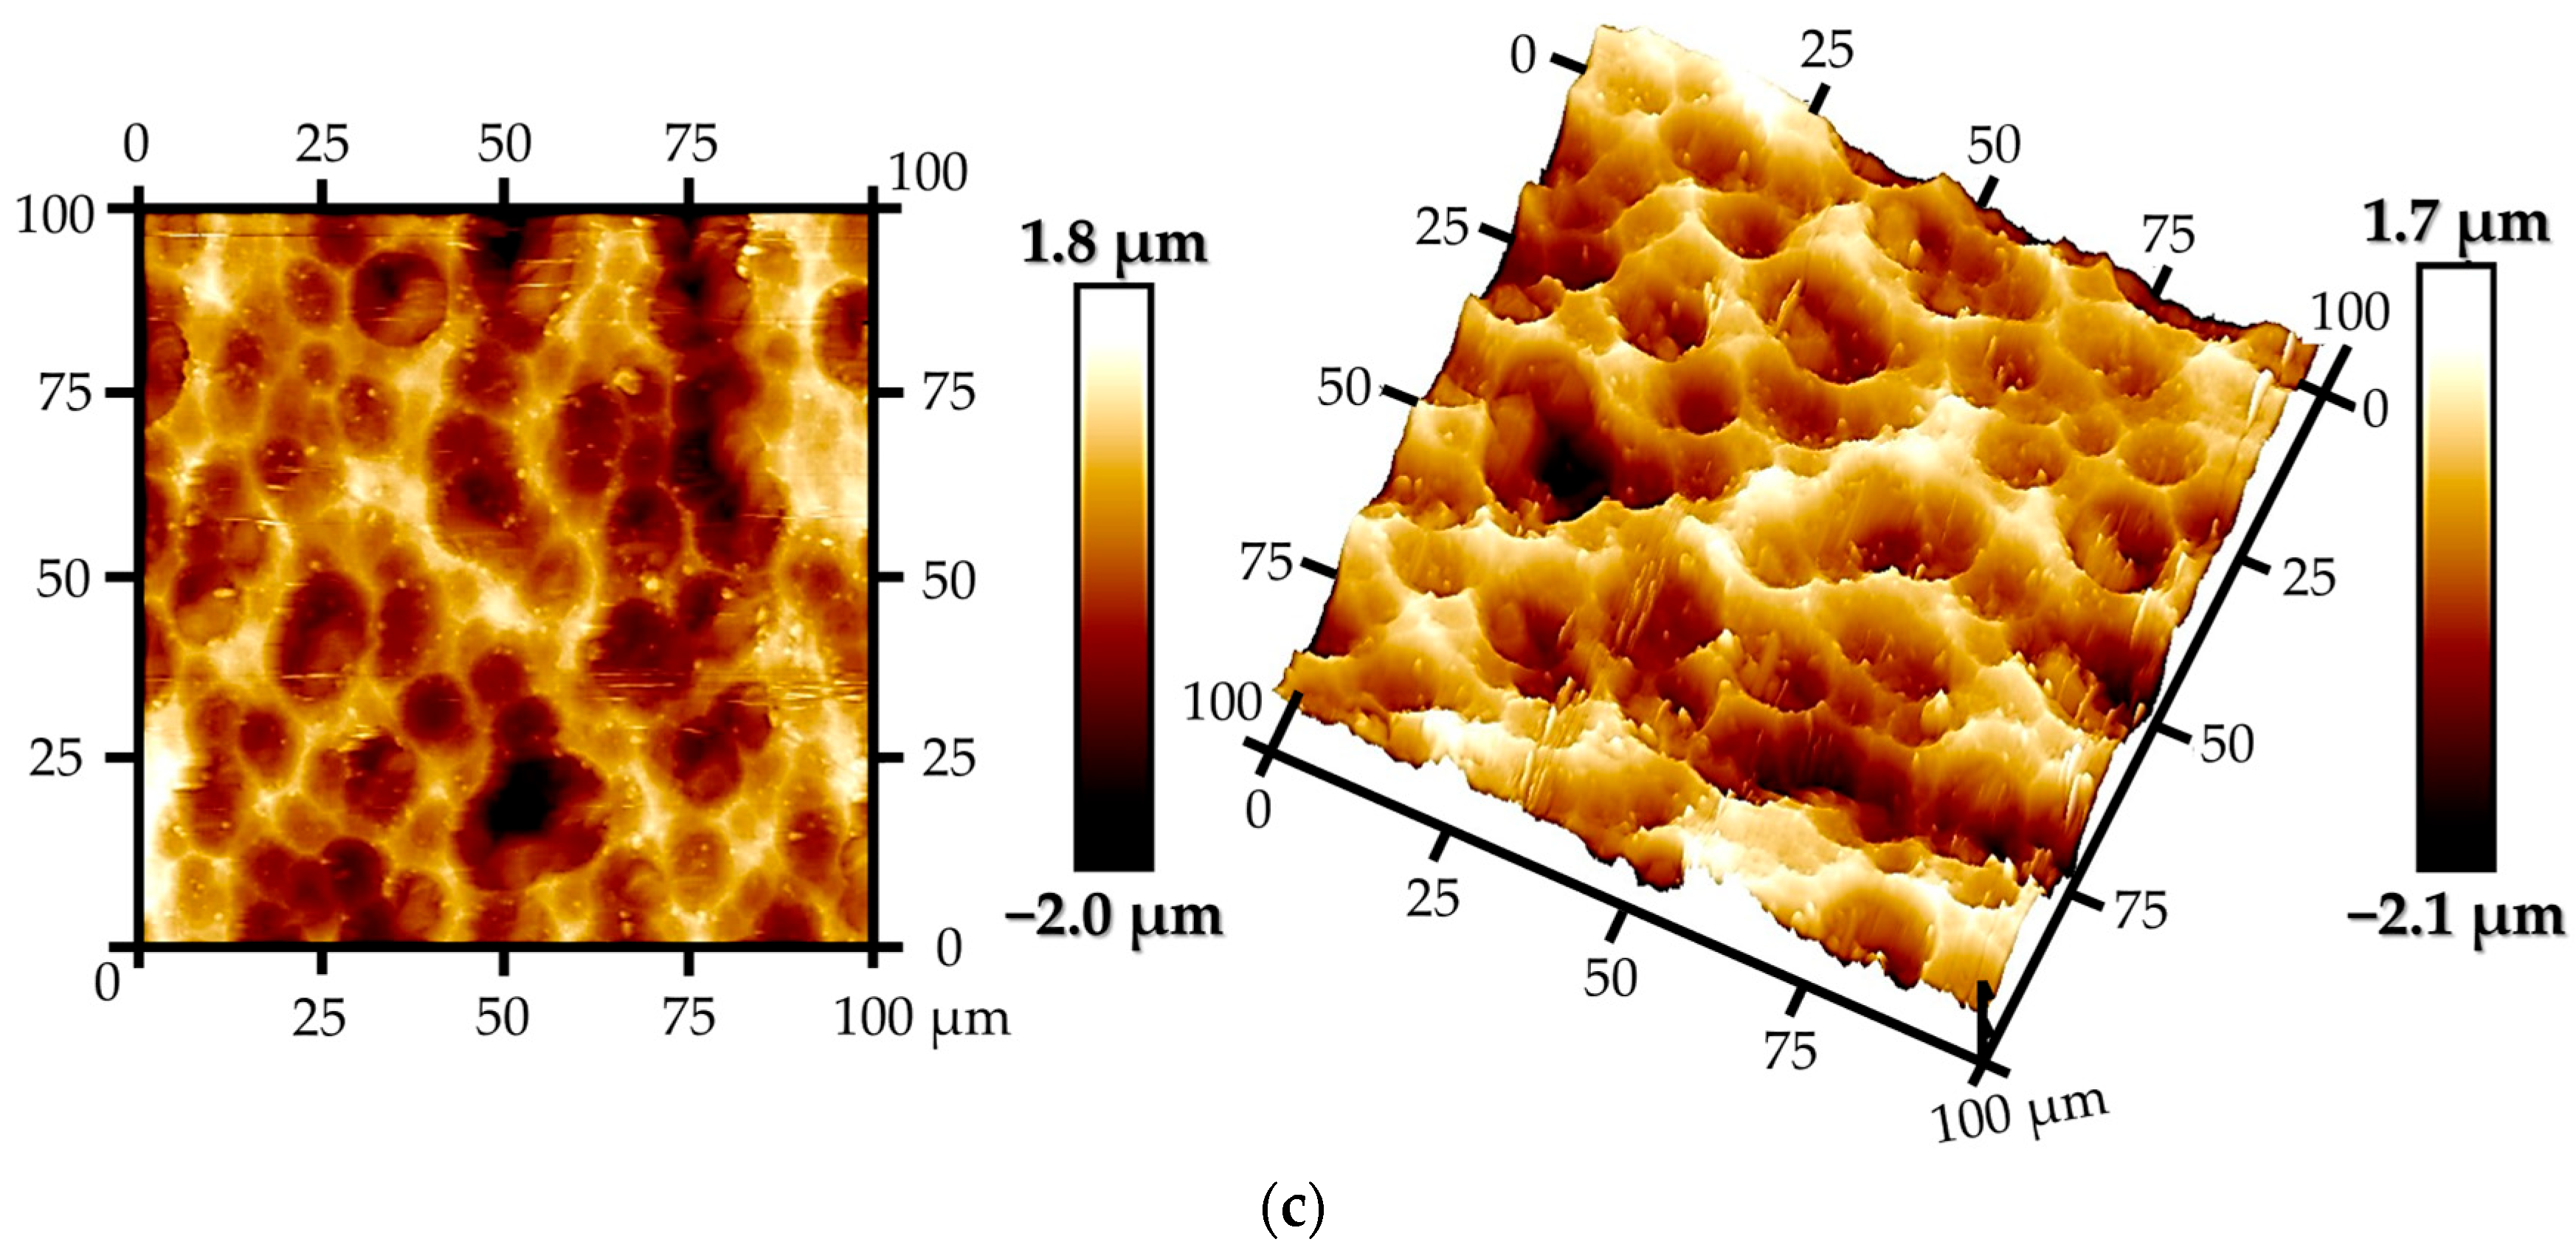
Figure 6 shows representative 2D and 3D AFM micrographs of the areas corresponding to each aluminum surface configuration. The micrographs obtained for Al-20 (
Figure 6a) allowed the identification, in the two-dimensional map, of wide grooves contrasting with fainter and less extensive lines, as well as the growth of small, elongated, and deformed pores which, upon expanding, occupied the space of these lines or even merged with them. In the three-dimensional map, morphology revealed a surface populated with ridge-like formations and deep grooves of considerable extent. It was also observed that small pores formed on top of the ridges, while the line marks were not visible in this representation.
In contrast, the two-dimensional surface representation of Al-40 (
Figure 6b) showed larger pores than in Al-20, distributed randomly and with asymmetric geometry. Additionally, smaller pores were observed, which occupied a larger area in the plane and formed elongated chains because of multiple junctions between their edges. The 3D reconstruction of the surface still revealed ridges, but with greater spacing than in Al-20, due to the growth and widening of the pores. This modification reduced the volume of the reliefs and generated valleys or depressions distinguishable by darker contrast, indicating a notable topographical change on the metallic substrate.
Based on the observations from the previous surface images, the exploration of Al-60 (
Figure 6c) revealed a dominance of larger, symmetrically shaped pores in the two-dimensional view, contrasting with Al-40, which simultaneously formed long chains due to coalescence or edge adjacency. Nevertheless, some small, shallow pores were still detected, identifiable by color contrast, although they occupied a minimal portion of the total area. The 3D volume-relief representation showed a significant change, with almost no ridges compared to Al-40.
To complement the qualitative morphological analysis described above, a study of the quantitative pore parameters obtained from the AFM micrographs was conducted, summarized in
Table 3. The values derived from the 2D micrographs allowed for more precise comparisons between the different surface variants, which were contrasted with values estimated via optical microscopy. Furthermore, the analysis of the 3D micrographs provided additional information on surface patterns that could not be estimated from the 2D data.
Average area: In both techniques, the pore area increased markedly from Al-20 to Al-60. AFM detected higher values in all cases, suggesting that this technique captured surface irregularities and lateral extensions of the pores more accurately. However, the overall trend was identical: a moderate increase between Al-20 and Al-40, followed by a much more pronounced rise toward Al-60.
Diameter range and average diameter: In both microscopy techniques, the minimum and maximum pore diameters increased progressively with the surface variant, accompanied by an increase in the average diameter. Additionally, the rate of increase was greater between Al-20 and Al-40, indicating that the intermediate etching stage is particularly effective in expanding and enlarging the biaxial space of the pores.
Porous area fraction: The percentage of surface covered by pores increased continuously in both techniques. However, optical microscopy recorded a marked increase at Al-60, as its resolution facilitated the detection of larger, more evident pores at this stage. In contrast, measurements from AFM images showed a more gradual increase, as this technique allowed for more precise identification of small and shallow pores, which were also quantified, contributing to a more homogeneous distribution in the total measurement.
Interpore distance: In both methods, the average center-to-center separation between adjacent pores increased with the progression of surface modification, confirming that pore expansion and coalescence tended to reduce surface density. These mechanisms affected the increase in inter-pore distance, as centroids that were previously close together became positioned generally between their original locations, thereby increasing the average separation.
Volumetric and Vertical Morphological Changes
The three-dimensional parameters derived from 3D AFM images provided specific insights into the surface morphology. This characterization revealed essential vertical and volumetric details to understand the morphological evolution beyond planimetric observations.
In terms of volume, the values reflected the combined influence of changes in pore area and depth, which grew exponentially: from 16.1 µm3 in Al-20 to 63.2 µm3 in Al-40, representing a fourfold increase in the occupied three-dimensional space; and to 125.2 µm3 in Al-60, implying an almost twofold increase relative to the intermediate variant.
On the other hand, the peak-to-valley height range within the pores offered relevant insights into their evolution. At the initial stage (Al-20, 0.1–1.5 µm), shallow pores located atop ridges coexisted with deeper ones near preexisting grooves. This range increased in Al-40 (1.0–1.9 µm), indicating a general deepening of the pore structure. In Al-60 (0.6–2.1 µm), the minimum value decreased while the maximum continued to increase, suggesting the simultaneous formation of new shallow pores and further deepening of previously existing ones.
As for the mean depth, values remained within the previously analyzed peak-to-valley ranges. The increase was approximately 150% in Al-40 compared to the initial variant, whereas between Al-40 and Al-60, the rise was only about 7%.
3.3. Interlaminar Strength
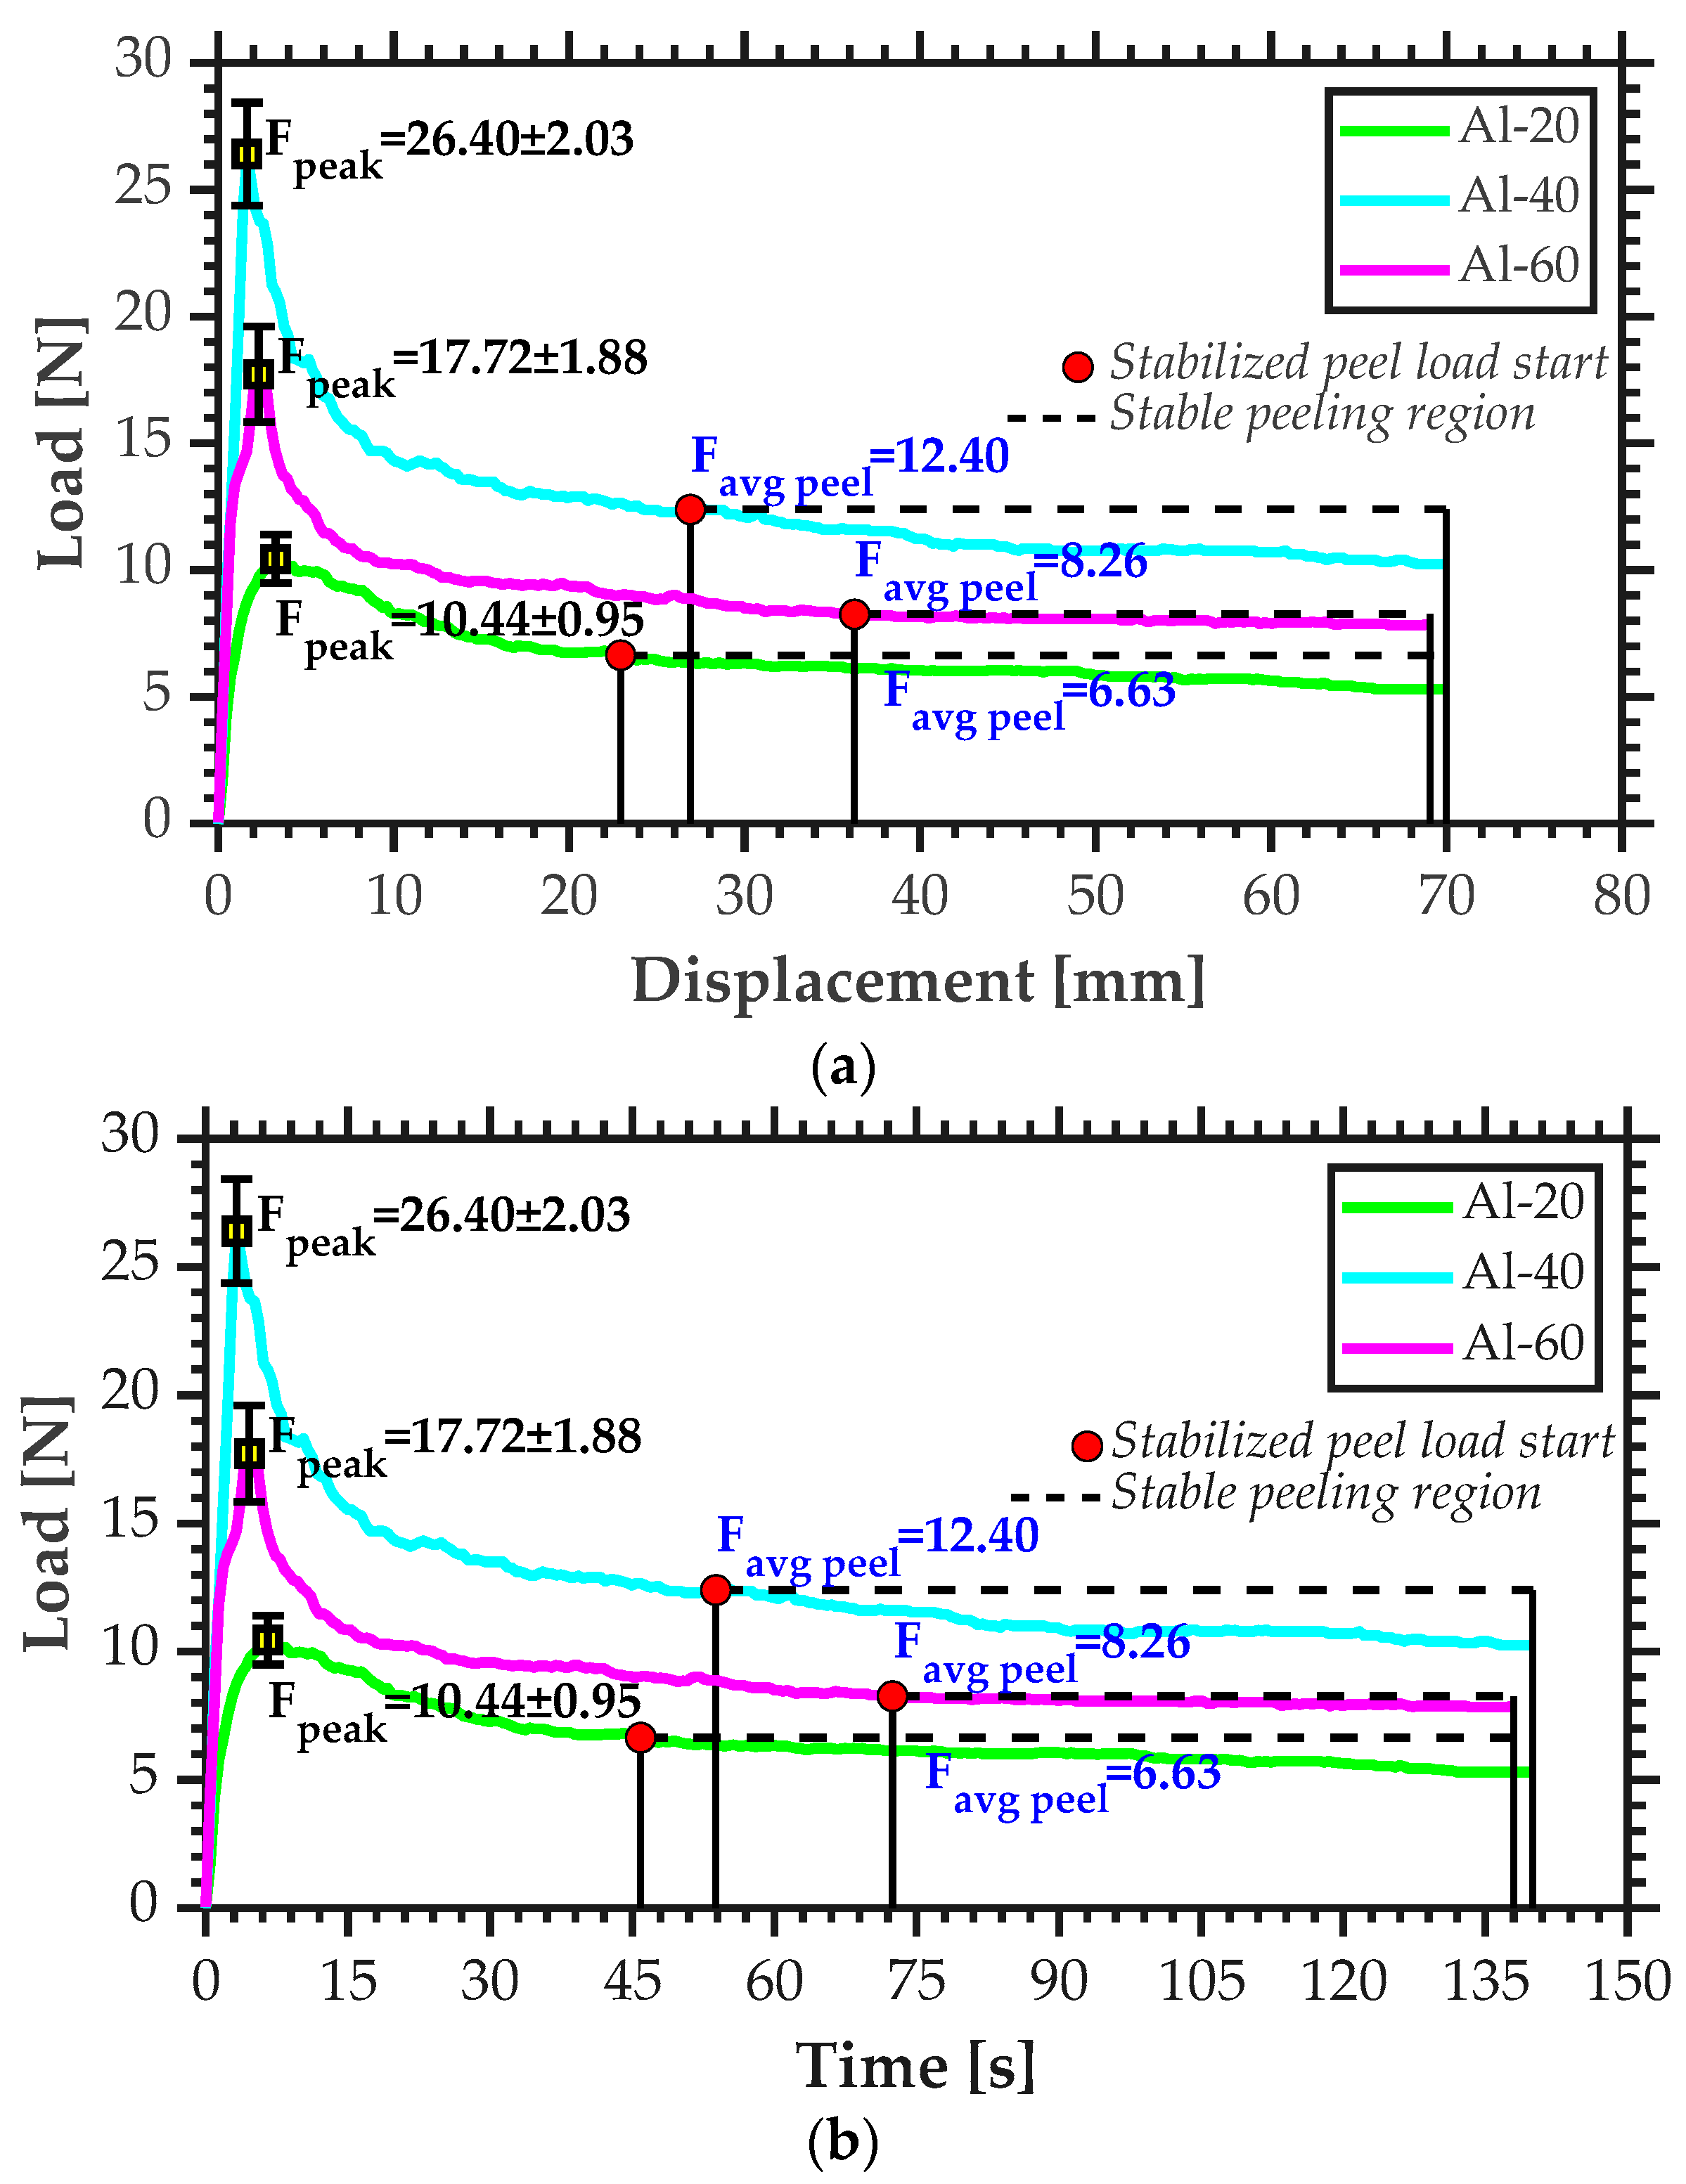
The average curves for both load–displacement and load–time responses, presented in
Figure 7, were generated to compare the peeling behavior exhibited by each set of specimens. Concurrently, the standard deviation of the initial peak forces (F
peak) was determined and represented as error bars, along with the average peeling force (F
avg peel) in the stabilized region. The average peeling force was obtained from the mean curve by identifying the region where the relative variation between consecutive points remained below a 5% threshold of the maximum value. Additionally, the onset and extent of the stable peeling region were delineated.
The load–displacement curves (see
Figure 7a) showed that all three sets of aluminum specimens exhibited a characteristic response composed of three distinct zones. In Zone I, a linear increase in force was observed, corresponding to the pre-delamination response. Upon reaching the maximum load, interfacial separation began, marking the onset of Zone II, where the force progressively decreased as delamination progressed. Finally, in Zone III, the response stabilized at an almost constant peeling force, indicating a steady-state delamination process.
During the transition between Zones II and III, the force reduction has been associated with the development of shear stresses, which arise both from the heterogeneous distribution of adhesion along the specimen width and from the influence of the fiber weave pattern, as noted in [
18]. This interpretation is supported by Abrahami et al. [
19], who emphasize, from a mechanical perspective, that the contact angle between the oxide film and the resin varies depending on the direction of the applied load. This variation, caused by the irregular geometry of the pores, prevents the load from acting uniformly on all pore walls simultaneously, thereby increasing peeling resistance compared to smooth or partially filled pore surfaces.
In these curves, the Al-20 group recorded a Fpeak = 10.44 ± 0.95 N. In comparison, the Al-40 and Al-60 groups exhibited significantly higher maximum forces, reaching 26.40 ± 2.03 N and 17.72 ± 1.88 N, respectively. These values represent increases of 152.9% for Al-40 and 69.7% for Al-60 relative to Al-20. Moreover, the average peeling force in Al-40 was 87% higher than Al-20 and 50% higher than Al-60, highlighting a notable improvement in peel resistance for this group.
In parallel, the load–time curves (
Figure 7b) provided complementary insights into the delamination process. The onset of peel force stabilization occurred at 46 s for Al-20, whereas Al-40 and Al-60 reached stabilization later, at approximately 54 s and 73 s, respectively.
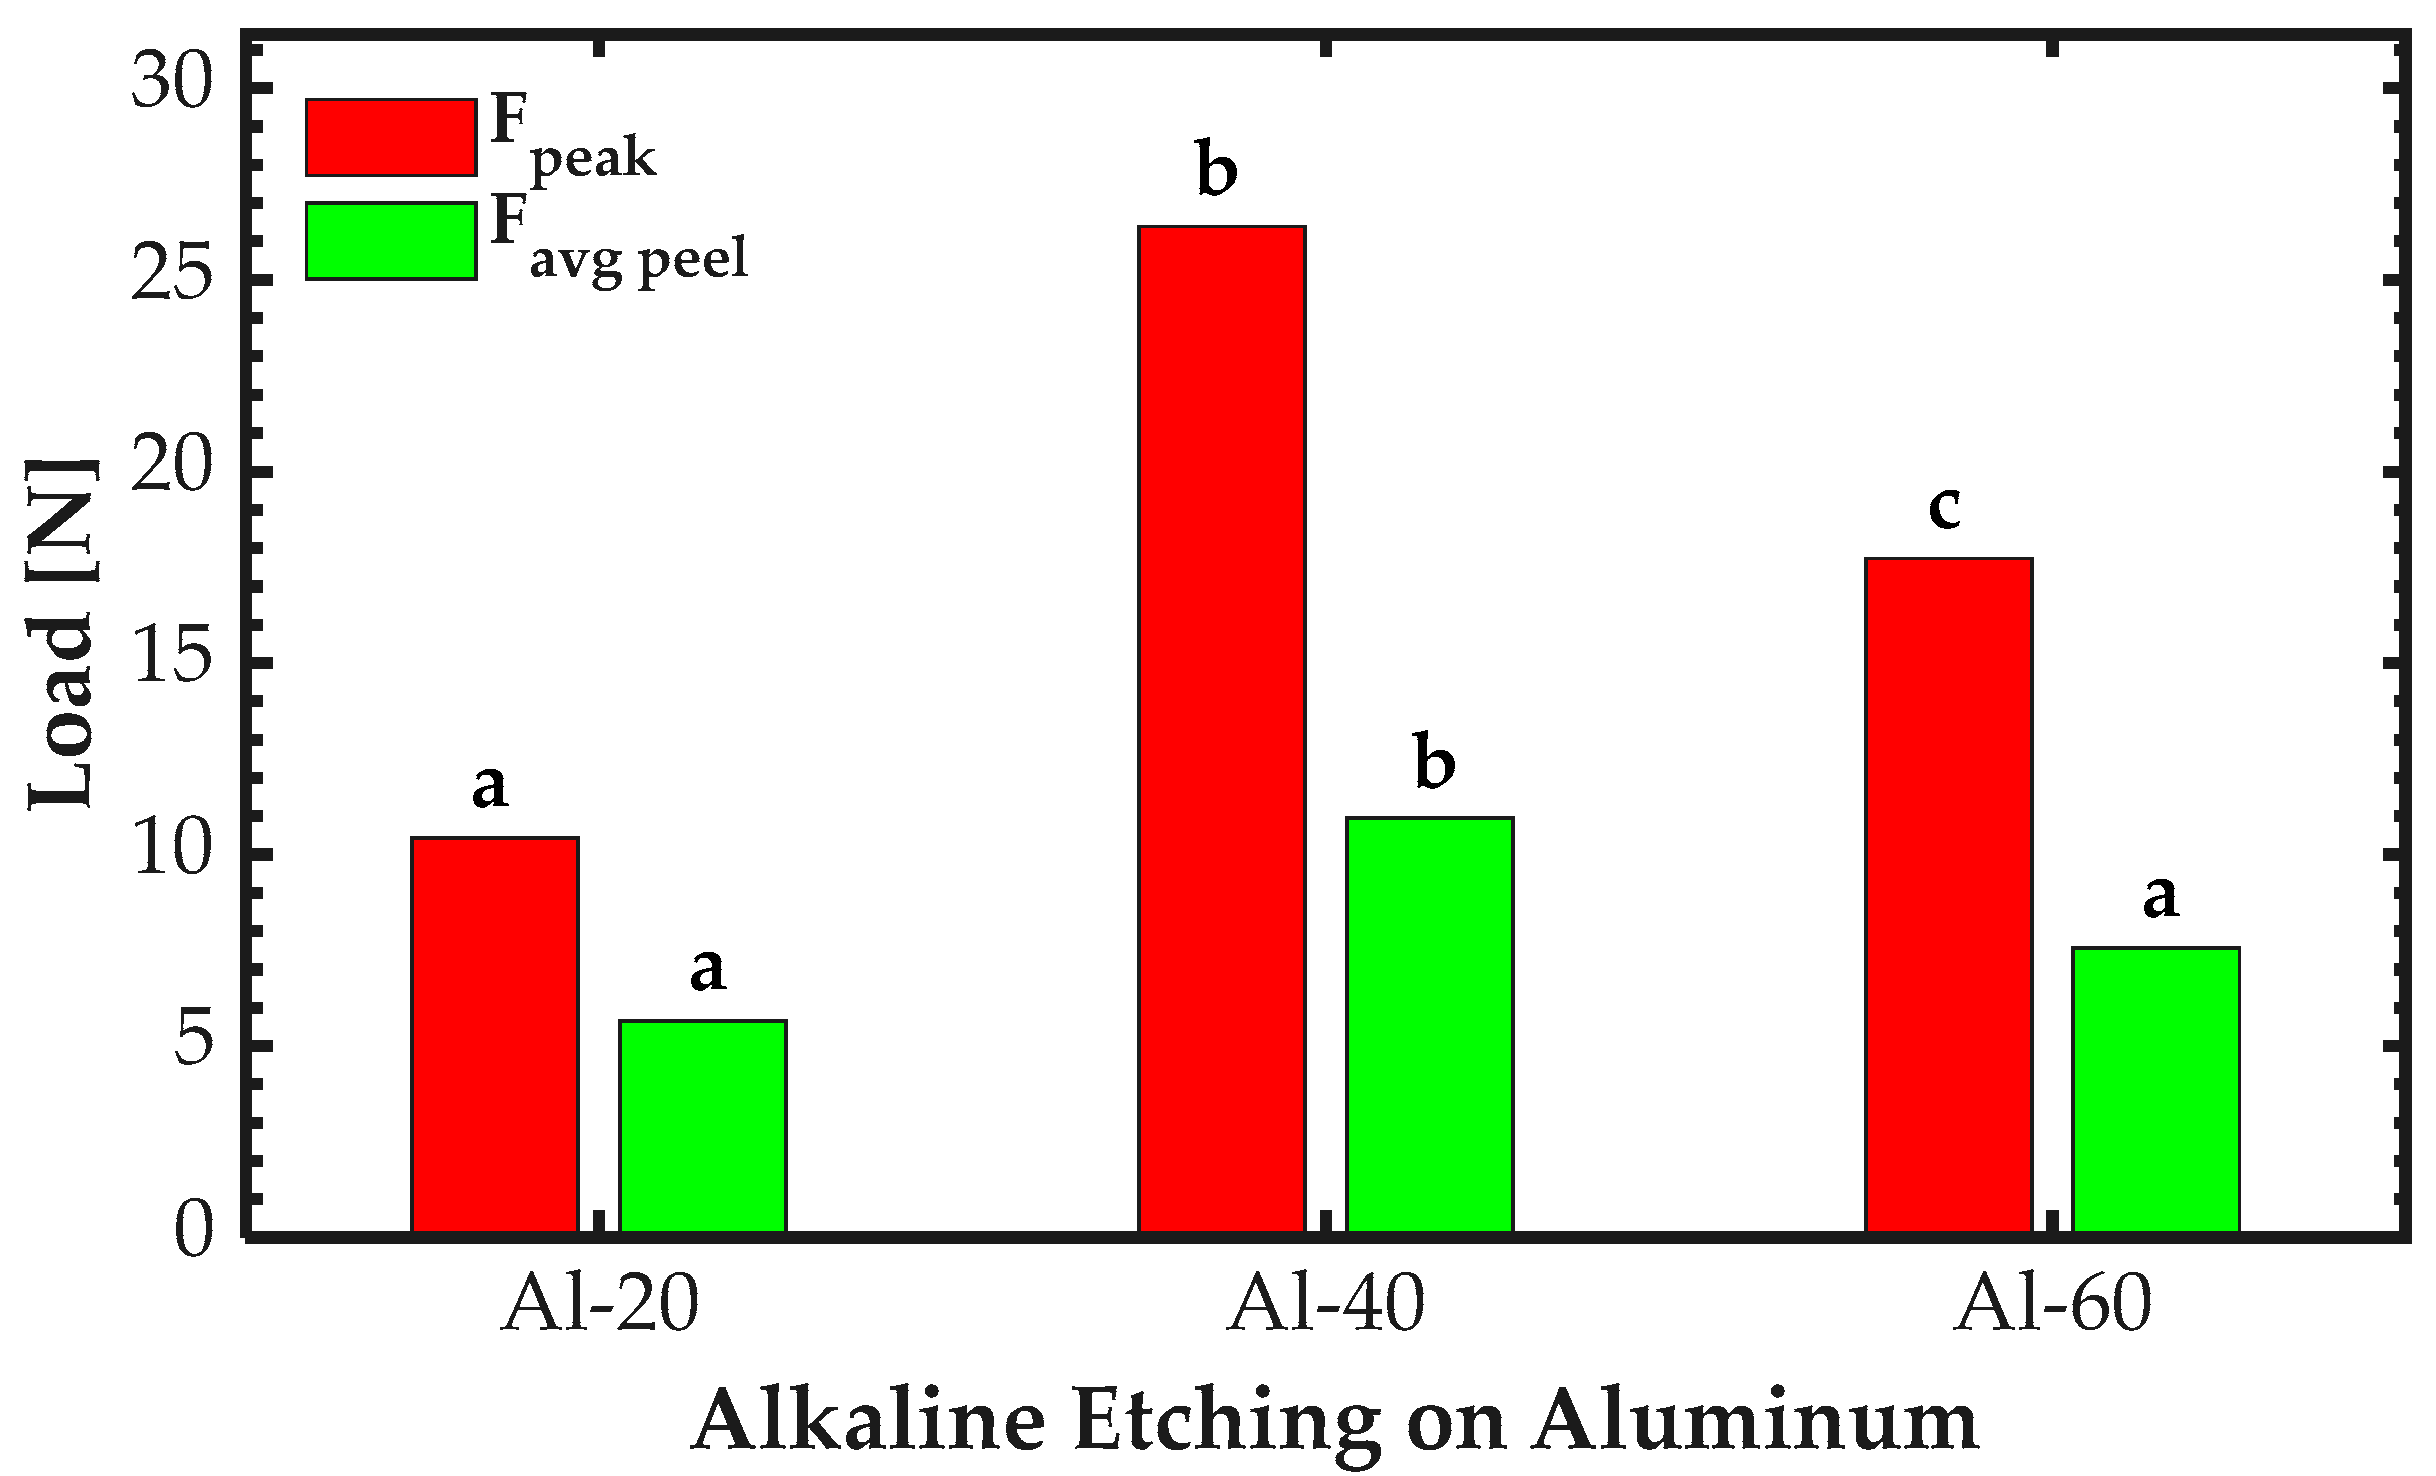
To statistically validate the differences observed in both the initial peak force and the stabilized average peel force, a one-way ANOVA was conducted across the three surface treatment groups. The results showed statistically significant differences among groups for both F
peak (
p < 0.0001) and F
avg peel (
p = 0.0013). Post hoc Tukey multiple comparison testing revealed that Al-40 exhibited significantly higher values than both Al-20 and Al-60 (
p < 0.05). For F
avg peel, no significant difference was detected between Al-20 and Al-60. These results are illustrated in
Figure 8.
Furthermore, the average peel strength for each group was calculated by dividing the measured average peeling load (F
avg peel) by the width of the bonded area (25 mm). The region of the curve corresponding to the most stable load response was used to determine this average. The resulting values, shown in
Figure 9 with error bars representing the corresponding standard deviations, reflect the influence of surface treatment duration on interlaminar strength.
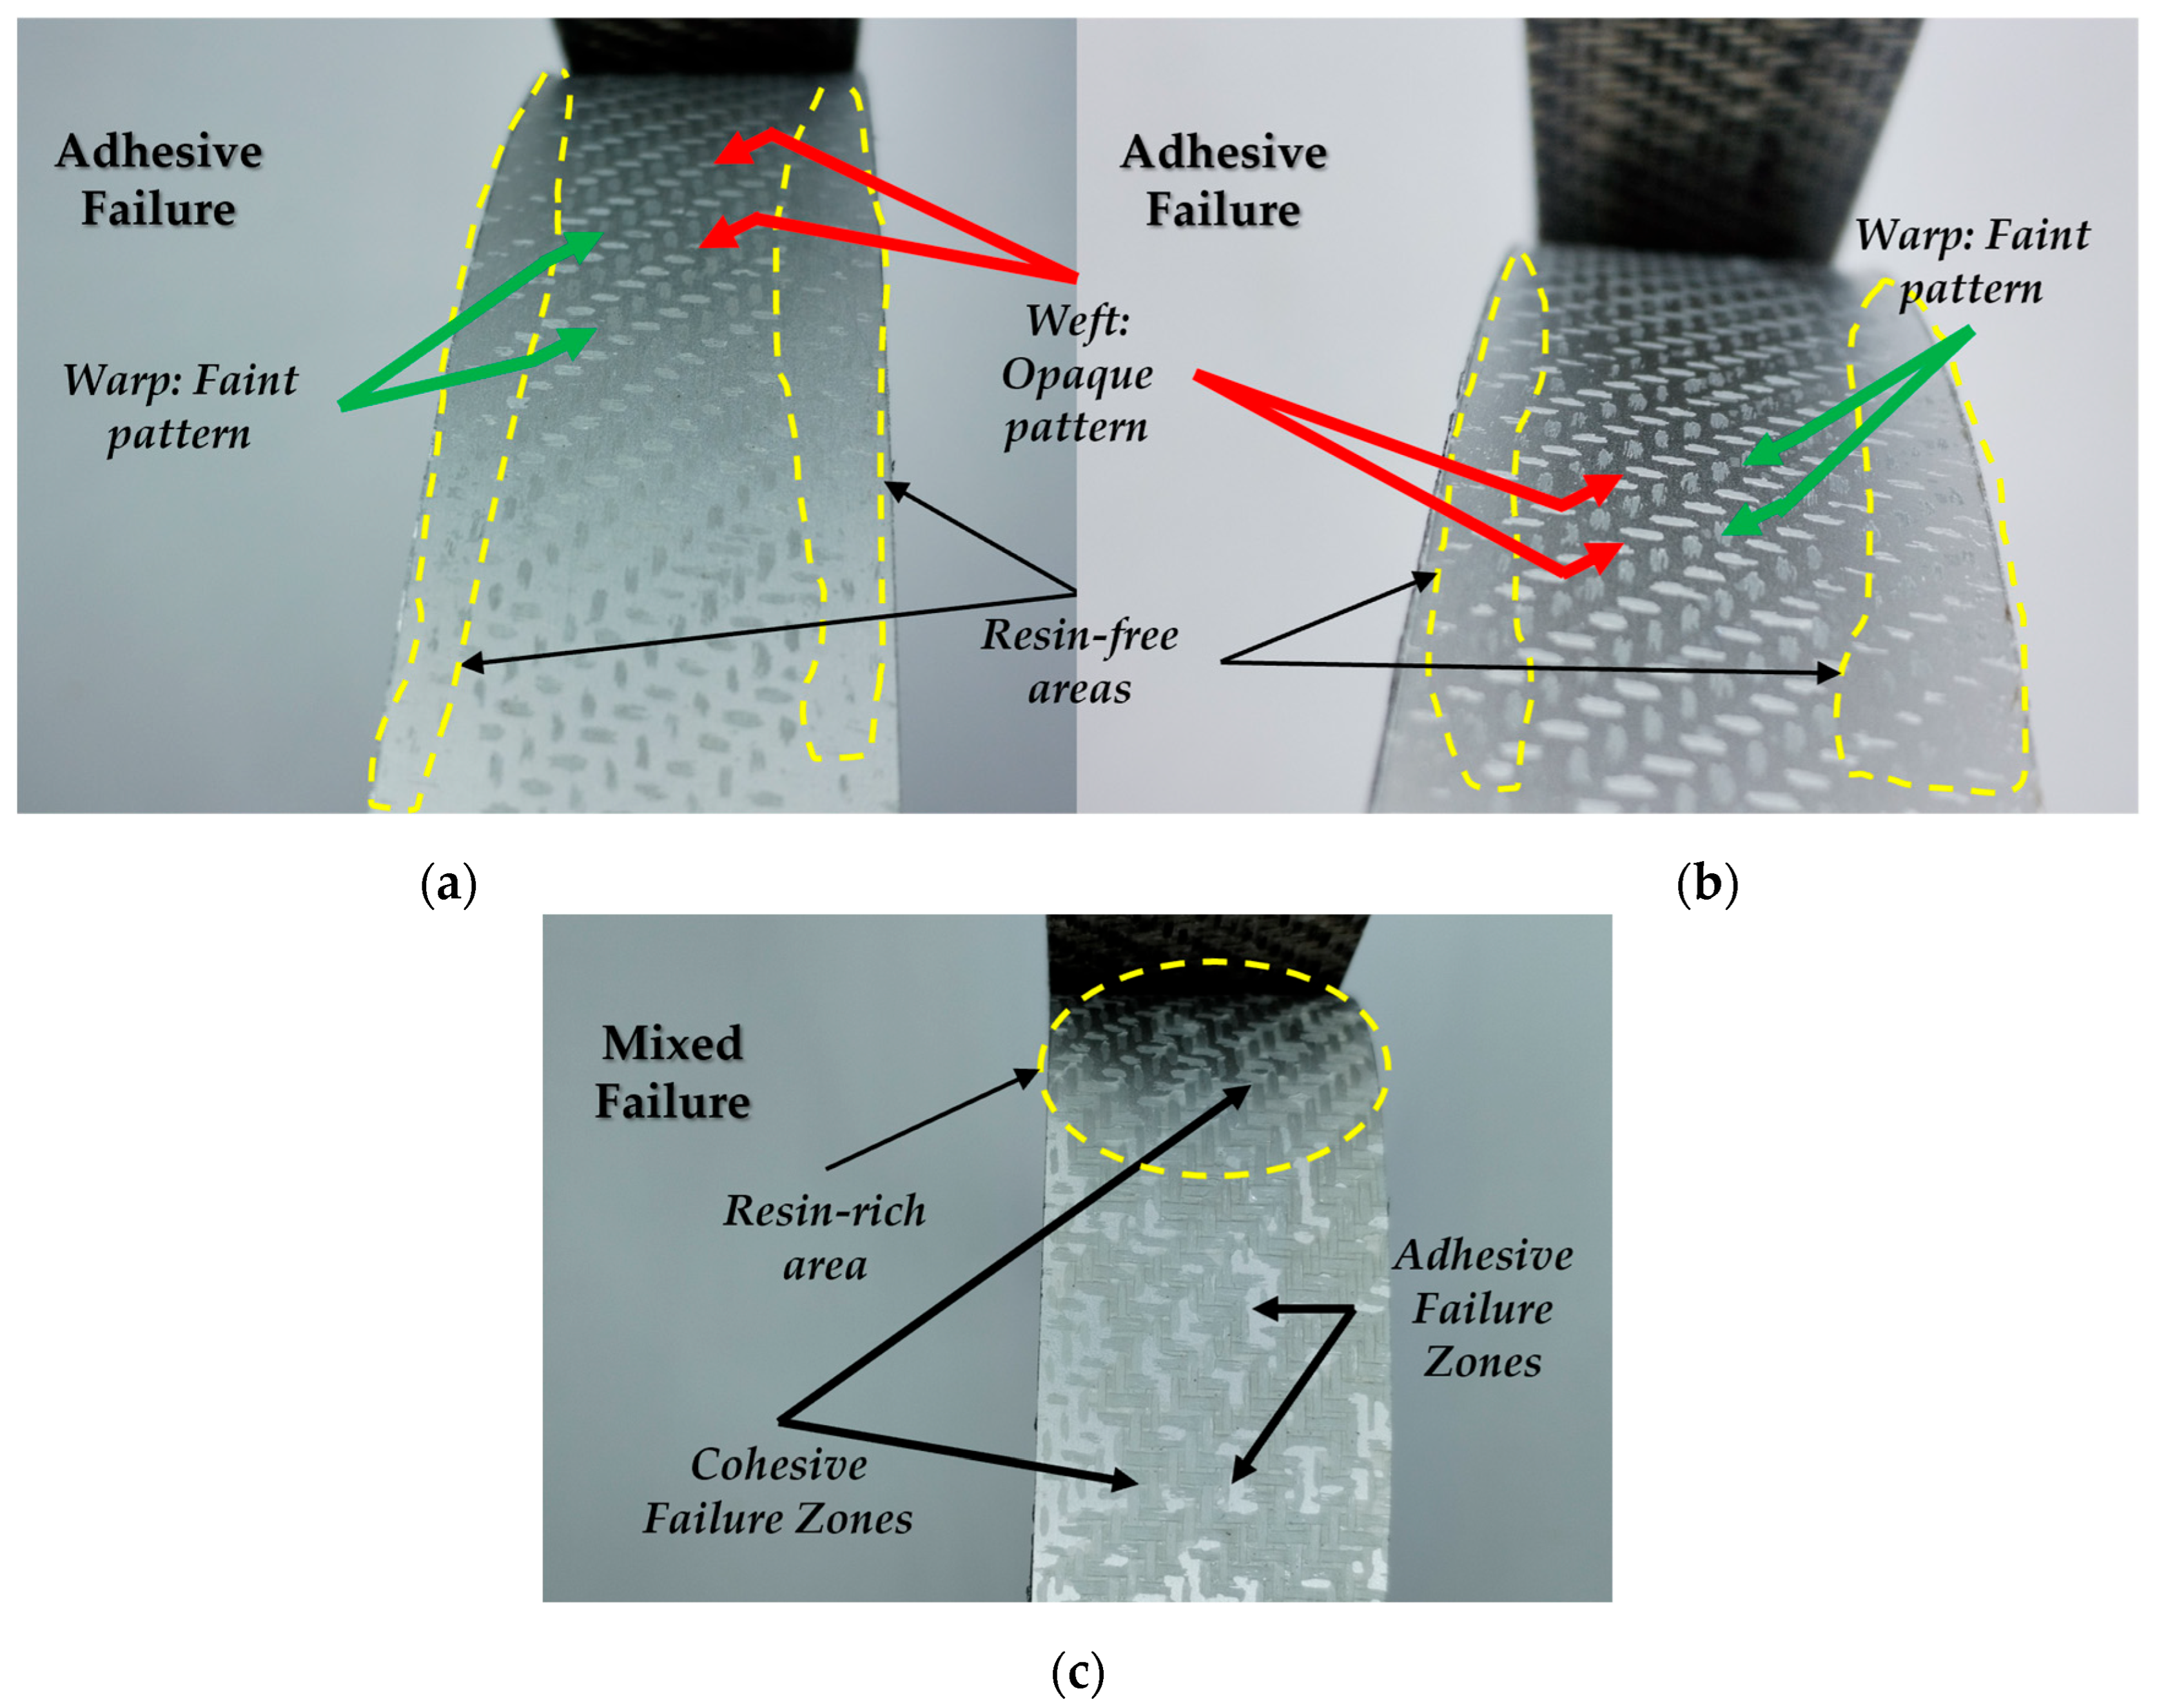
The analysis of failure modes after the peel test provided additional information on adhesive joint behavior (see
Figure 10). Three types of fracture were identified: cohesive failure, occurring within the adhesive; adhesive failure, occurring at the bonding interface; and mixed failure, resulting from a combination of both types.
The Al-20 and Al-60 specimens (see
Figure 10a,b) primarily exhibited adhesive failure, as indicated by the minimal amount of resin remaining at the adhesive interface. Notably, Al-60 required a peeling load of 0.33 ± 0.08 N·mm
−1, corresponding to a 22% increase compared with Al-20. In contrast, Al-40 specimens (see
Figure 10c) showed predominantly cohesive failure, requiring a peeling load of 0.50 ± 0.08 N·mm
−1. In this case, the crack propagated within the resin-rich film away from the interface, which increased the initial resistance and raised the peel load in the stable region of the curve. Furthermore, resin residues were more evident on the metallic surface of Al-40, making the fiber pattern more visible and indicating a higher degree of resin impregnation than that observed in the other two groups.
4. Discussion
The dual microscopy approach proved useful for analyzing several aspects, including the degree of surface relief, geometry, potential depth, pore diameter and volume, internal and external homogeneity, and the spatial distribution of smaller pores. These pores were observed clustered, adjacent, or isolated in relation to abrasion-induced irregularities or to larger pores.
The progressive evolution of the surface morphology induced by the alkaline ultrasonic treatment, as observed through optical microscopy, was influenced by the prior mechanical preparation via sanding.
Al-20: Early alkaline etching stage, characterized by incipient and highly localized nucleation driven by irregularities from mechanical abrasion. Elevated edges around these irregularities likely hindered the etching solution from reaching deeper zones, thereby limiting dissolution.
Al-40: Reflected a transient phase dominated by simultaneous processes at the solid/liquid interface (Al/NaOH). Lines and grooves served as preferential sites for pore nucleation and growth, while the heterogeneous coalescence of pores of different sizes and geometries likely played a key role in developing directional roughness and a functional surface with anisotropic adhesion properties.
Al-60: Exhibited a more regular and symmetrical pore distribution, indicative of an isotropic chemical attack. The bimodal pore distribution followed a hierarchical pattern, likely related to local variations in surface energy or substrate reactivity. Compared with Al-40, the lower pore density suggests fewer new nucleation sites, while larger pores occupied a significant portion of the surface.
Notable differences in aluminum surface conditions are evidenced by the quantitative evolution of pore diameter, interpore distance, and area fraction, demonstrating, a continuous and dynamic morphological transformation. This transformation is consistent with the coexistence and subsequent organization of bimodal pore populations. These results suggest that the interplay between mechanical pretreatment and alkaline etching governs the transition from irregular morphologies to organized porous structures, with implications for surface functionality and potential applications.
The 3D volume-relief representation obtained by AFM revealed significant morphological changes.
Al-20: Wide grooves and ridge-like structures indicated that alkaline etching initially acted on mechanically induced irregularities. This generated small, elongated pores that often merged with existing scratches, inheriting their depth.
Al-40: Asymmetric pores and coalescence mechanisms reflected an active transformation stage. Pores were identified in the initial, intermediate, and final phases of the coalescence process. This irregular widening created additional space that allowed the alkaline solution to penetrate deeper into the metallic substrate.
Al-60: The appearance of widened microcrater-like features, accompanied by plateaus that defined their contours and the disappearance of ridges, marked a transition toward isotropic etching and hierarchical pore organization. The resulting structure showed an “egg-box”-like morphology.
The exponential increase in pore volume can be attributed to the alkaline etching regime. The sharp rise observed between Al-20 and Al-40 reflects the removal of abrasive ridges and excavation of the substrate. In the subsequent stage (Al-60), material removal concentrated on the pore walls, leading to expansion perpendicular to their depth.
For Al-40, the enlargement and coalescence of pores facilitated the incorporation of preexisting abrasive cavities into the porous structure. This suggests an active transitional stage in which alkaline etching not only targeted new surface regions but also modified previously formed defects.
Al-60 displayed a coexistence of shallow pores on elevated microtexture regions alongside deeper ones, indicating a dual mechanism. This dual behavior likely results from the limited lateral material available for pore expansion in elevated areas and from the enhanced adsorption and reactivity of the alkaline solution near larger adjacent pores. Such evolution aligns with a cumulative process driven by etching time and sustained surface reactivity across different substrate regions.
Taken together, the evolution of the peak-to-valley height range reflects the limited increase in mean pore depth between the Al-40 and Al-60 stages. This suggests that the alkaline etching process reached a threshold, leading to the stabilization of pore valley growth and indicating that the process had reached its limit.
Collectively, the dual approach based on both microscopy techniques confirmed consistent progression of two- and three-dimensional morphological features across the three aluminum surface variants. Despite differences in resolution and observation scale between techniques, the combined analysis validated previous findings and revealed clear evolutionary trends. This facilitated the identification of morphological patterns and revealed the transition from irregular morphologies dominated by mechanical abrasive features to more symmetrical porous structures shaped by chemical etching. These findings underscore the predictive value of this methodology for functional surface design, as they can be used to anticipate performance variations associated with morphological particularities.
In terms of peel behavior, all three peel curves exhibited a similar profile across the analyzed FML types, indicating a comparable overall response of the system under peeling conditions. Nevertheless, the results showed that Al-40 specimens reached the highest peel resistance, both in terms of initial peak force and average peel strength, surpassing Al-20 and Al-60 specimens. A key finding is that the anisotropic features of Al-40’s surface micromorphology facilitate effective adhesion, explaining its superior load-bearing capacity in the stabilized peel delamination region, as confirmed by ANOVA.
Despite exhibiting larger pores and higher porosity—which would normally favor resin impregnation—Al-60 specimens showed ~33% lower peel resistance compared to Al-40. This apparent contradiction arises from excessive pore widening and isotropic morphology, which thin the inter-pore metallic walls and suppress edge relief, thereby reducing resin anchorage and promoting stress concentrations that facilitate crack initiation at the interface. Visual inspection of the Al-60 metal/composite interface supported these interpretations.
Two distinct patterns—opaque and faint—were observed on Al-60, corresponding to the orientation of the warp and weft yarns. These differences indicate uneven resin distribution along the interface, which compromises stress transfer and contributes to the reduced peel strength.
Al-20 and Al-60 predominantly exhibited adhesive failure, consistent with limited resin impregnation, while Al-40 displayed cohesive failure, suggesting that cracking occurred within the resin-rich film. This failure mode increased resistance during the initial stages and raised the peel load in the stable phase of the curve.
Visible resin residues on Al-40 highlighted improved impregnation of the metallic surface. The combination of thicker walls, irregular pores, and ridges along their edges in Al-40 promoted more uniform stress distribution and stronger resin bonding, explaining its superior mechanical performance compared with Al-20 and Al-60.
In addition, the similarity in the mean pore depth between Al-40 and Al-60 confirms that the lower peel strength of Al-60 is primarily attributable to the increased pore diameter, wider interpore spacing, and wall thinning, which result in ineffective resin anchorage, rather than to differences in pore depth.
Time-dependent responses provided additional insights. Stabilization of the peel force occurred earlier in Al-20 (46 s), while Al-40 and Al-60 required longer times (54 s and 73 s, respectively). The delay in stabilization for Al-40 and Al-60 can be attributed to their higher resistance in overcoming bonding forces during crack propagation and stabilization of the delamination process. Among these, Al-40 exhibited greater stability during interfacial separation, favoring a more controlled delamination mechanism.
Overall, these results demonstrate that the effectiveness of surface treatments on 3003-H14 aluminum alloy is governed by the balance between morphological and topographical features, which influence the impregnation uniformity of the polymeric phase. Together, these factors control the strength and stability of the adhesive joints, making Al-40 the most favorable condition among the evaluated groups.
When comparing the results with those reported for specimens fabricated with anodized aluminum sheets [
20,
21], Al-40 exhibited greater stability during interfacial separation and reached an initial peak force ~50% higher than that reported for post-cured specimens (17.33 N) [
20], although it remained ~10.7% below the value obtained for specimens without additional curing (29.56 N) [
21]. This indicates that the anisotropic morphology developed in Al-40 can achieve a peel response comparable to anodized specimens, despite relying on a simpler chemical process.

