Article

Evaluation of Bond Strength in Multi-Material Specimens Using a Consumer-Grade LCD 3D Printer †

1
Department of Medical Engineering, Faculty of Engineering, Chiba University, 1-33 Yayoi-cho, Inage-ku, Chiba 263-8522, Japan
2
Department of Advanced Energy, Graduate School of Frontier Sciences, The University of Tokyo, 5-1-5 Kasiwanoha, Kasiwa, Chiba 277-0882, Japan
3
Department of Mechanical Engineering, National Institute of Technology, Kisarazu College, 2-11, Kiyomidaihigasi, Kisarazu, Chiba 292-0041, Japan
4
Aviation Technology Directorate, Japan Aerospace Exploration Agency, 6-13-1 Ohsawa, Mitaka, Tokyo 181-0015, Japan
5
Center for Frontier Medical Engineering, Chiba University, 1-33 Yayoi-cho, Inage-ku, Chiba 263-8522, Japan
6
Department of Orthopaedic Surgery, Graduate School of Medicine, Chiba University, 1-8-1 Inohana, Chuo-ku, Chiba 260-8670, Japan
*
Authors to whom correspondence should be addressed.
This paper is an extended version of our paper published in the Japan Society of Mechanical Engineers Kanto Branch 31st General Meeting and Lecture, 2024.
J. Manuf. Mater. Process. 2025, 9(10), 332; https://doi.org/10.3390/jmmp9100332 (registering DOI)
Submission received: 21 August 2025 / Revised: 27 September 2025 / Accepted: 4 October 2025 / Published: 11 October 2025

Abstract

Additive Manufacturing (AM) is currently widely used as a means of production and processing. Among the techniques, stereolithography 3D printers (3DP) are highly accurate and versatile, making them popular for personal use. While many personal 3D printers with multi-material printing capabilities have appeared on the market, stereolithography printers for personal use have yet to appear. Therefore, assuming the realization of a low-cost, versatile 3D printer with this functionality, we verified whether the resins currently available for personal use are suitable for this functionality by conducting printing, secondary curing, and tensile tests. The printing results showed that all test specimens were printed with an exposure time of 8 s or more. The tensile test results indicated that the test specimens produced by multi-material printing exhibited tensile strength comparable to that of single-material specimens (90% to 114% of the weak material standard). Additionally, it was confirmed that strength manipulation and post-processing are possible with multi-material printing using the same printing parameters. These findings demonstrate that multi-material printing using conventional commercially available resins is sufficiently practical in terms of strength. The use of existing resins and low-cost photopolymerization-based 3D printers contributes to the realization of low-cost yet high-precision AM technology.

1. Introduction

Recently, the use of 3D printers has continued to expand. In particular, rapid prototyping, and the use of small-quantity, high-mix products for which cost recovery cannot be expected with molds, are common. In the aerospace industry, where only a small number of products are produced and a single model is used for a long period of time, 3D printers are being used to save energy by reducing weight, and to reduce costs and processes [1]. In addition, many 3D printers for personal use have been widely developed, and the market growth of 3D printers for personal use has been confirmed [2]. In addition to this, attention is being paid to the next generation of multi-materials that can assign the most suitable material to each location with strong bonding strength in a single output [3]. With the development of the personal ownership of 3D printers, there has been a great deal of attention paid to the creation of self-help tools, as well as use for hobbies and daily necessities. In particular, the ability to produce personalized orthotics and tools at low cost for each patient or individual is very appealing, and has potential applications in medical engineering. In fact, large-scale contests have been held, and the level of attention is increasing [4].
There are two main modes of operation of personal 3D printers—the FDM (Fused Deposition Modeling)/FFF (Fused Filament Fabrication) mode, in which resin is melted and extruded from a tube to cure, and the SLA (Stereo Lithography Apparatus)/LCD (Liquid Crystal Display)/DLP (Digital Light Processing) mode, in which resin is cured by ultraviolet light to produce a molded product [5]. Although the mode of operation of optical 3D printers is different, the process of the curing of photopolymer resin with ultraviolet light is the same [6]. In this context, the recent appearance of Bambu Lab A1 seems to have rapidly attracted attention to multi-materialization using the FDM method [7]. In fact, the popularity trend of Bambu Lab A1, as shown by Google Trends, has been remarkable since 2024. In contrast, the optical structure type has advantages, such as accuracy, but it currently employs the FDM method, with automatic leveling and monitoring functions [8]. In addition, the commercialization of multi-material 3D printers for personal use has not been confirmed.
SoRee Hwang et al. developed an extruded DLP 3D printer that produces multi-materials with less equipment, and also discussed the strength of the printer [9]. Park, S.-W et al. presented a comprehensive approach to the development of a multi-material printer using the SLA method [10]. Maruyama et al. realized multicolor printing using a palette that stores multiple droplets of different light-curing resins [11]. Quero et al. showed that a commercial 3D printer can be made multi-material by the simple modification and addition of parts [12]. Choi et al. developed a machine that incorporates a rotating butt system [13]. As described above, multi-materialization in the form of light fabrication has been studied extensively, and seems to be feasible in principle. The previous studies suggest that miniaturization and simplification are often required for machines in this context.
Among optical fabrication methods, the LCD method currently holds a large share of the optical fabrication market because there are only a few types of DLP 3D printers available for personal use. However, there is a lack of research on the use of LCD for multi-material production. However, its running cost and ease of use have great potential. For example, it has the advantage of the low light source cost compared to DLP [14]. In addition, while multi-material printing is not possible with materials with significantly different melting temperatures, such as ABS and PLA, under the FDM method, multi-material printing is possible under the optical method as long as the wavelengths of light required for curing are the same. At present, resins with various characteristics are being developed in the light-curing resin market, which are available at the same wavelength (405 nm). Therefore, if we can demonstrate the more active use of resin, we can expect innovations in manufacturing by individuals achieved at lower cost when home-use optical 3D printers are put to practical use.
However, most of the methods used in the development of 3D printers are DLP methods, including the development of LCDs, which are currently widely used as personal 3D printers, and many papers on the multi-material printing function only report production with new functions added. In other cases, most of the research is on the DLP method [15], wherein models are reported to be expensive for research and business use, and resin models [16]. Therefore, considering large-scale personal use, it is necessary to conduct research that measures the strength and growth of commercially available resins.
In this study, we will demonstrate that the bond strength of multi-material specimens made with existing 3D printers and resin is sufficient for practical use. We will also clarify the effects of exposure time and secondary curing time on the bond strength of single-material specimens, thereby demonstrating the systematic nature of processing with a 3D printer. Most previous studies on multi-material fabrication have relied on specially designed DLP devices or custom-formulated resins [17,18,19], and there are few systematic evaluations of combinations using commercially available LCD printers and off-the-shelf 405 nm resins.
Furthermore, most previous reports have focused on mechanism proposals and material design, with only limited research quantitatively demonstrating the relationship between UV exposure, post-curing, and interfacial strength. This study addresses this gap and presents the following novel contributions: (i) The demonstration of multi-material fabrication using only a commercially available LCD printer without modification and commercially available 405 nm resin, along with the establishment and verification of a simple procedure that involves merely switching resin vats. (ii) A systematic evaluation of the effects of exposure time and post-curing for both single-material and multi-material fabrication, clarifying the practical application of multi-material LCD printing (2 s leads to failure, 4 s is mostly successful, and stable completion is achieved with 8 s or more), as well as elucidating the strength–elongation trade-off that accompanies post-curing. (iii) The achievement of over 90% (up to 114%) of the weaker material’s strength in multi-material bonding, which consistently outperforms cyanoacrylate adhesive of the same shape. (iv) The presentation of illuminance mapping for the printer and post-cure device, and reporting on practices that enhance reproducibility at the consumer level through practical fabrication.
Specifically, by conducting tensile tests, we will demonstrate that the multi-material test specimens possess sufficient strength. Additionally, by including evaluations up to post-processing, the aim is to provide an experimental flow that can be used in a pilot study. Ultimately, this also includes the consideration of the feasibility of individual use.

2. Materials and Methods

2.1. Equipment and Materials Used

Figure 1 shows a conceptual diagram of printing with a 3D printer and tensile testing with a tensile tester. In this paper, experiments were conducted via repeated strength and elongation measurements.
The 3D printer used was the Elegoo (Shenzhen, China) Mars4 Ultra manufactured by Elegoo Corporation of China. For secondary curing, Form Cure manufactured by Formlabs of the United States was used. The tensile tester was an Shimadzu Corporation (Kyoto, Japan) AG-Xplus 250 kN manufactured by Shimadzu Corporation, Japan. Two types of resin were used, as shown in Table 1. The two resins used were Elegoo (Shenzhen, China) ABS-Like resin manufactured by Elegoo, China, and Anycubic (Shenzhen, China) Tuff Resin [20] manufactured by Anycubic, China. The resins were selected via the following four points in consideration of the purpose of this study. The resins were selected because they are widely consumed (typical materials from typical manufacturers), have different properties, their compositions are published in safety sheets [21,22] and their tensile strengths are publicly available on official websites. In addition to the 3D-printed multi-material specimens, adhesive specimens were produced for comparison. The adhesive used for the glued material specimens was 100% cyanoacrylate. Fusion360, a 3D CAD software, was used to create the specimens. ChituBOX Slicer was used as the slicer software.

2.2. Specimen Fabrication Method and Printing Conditions

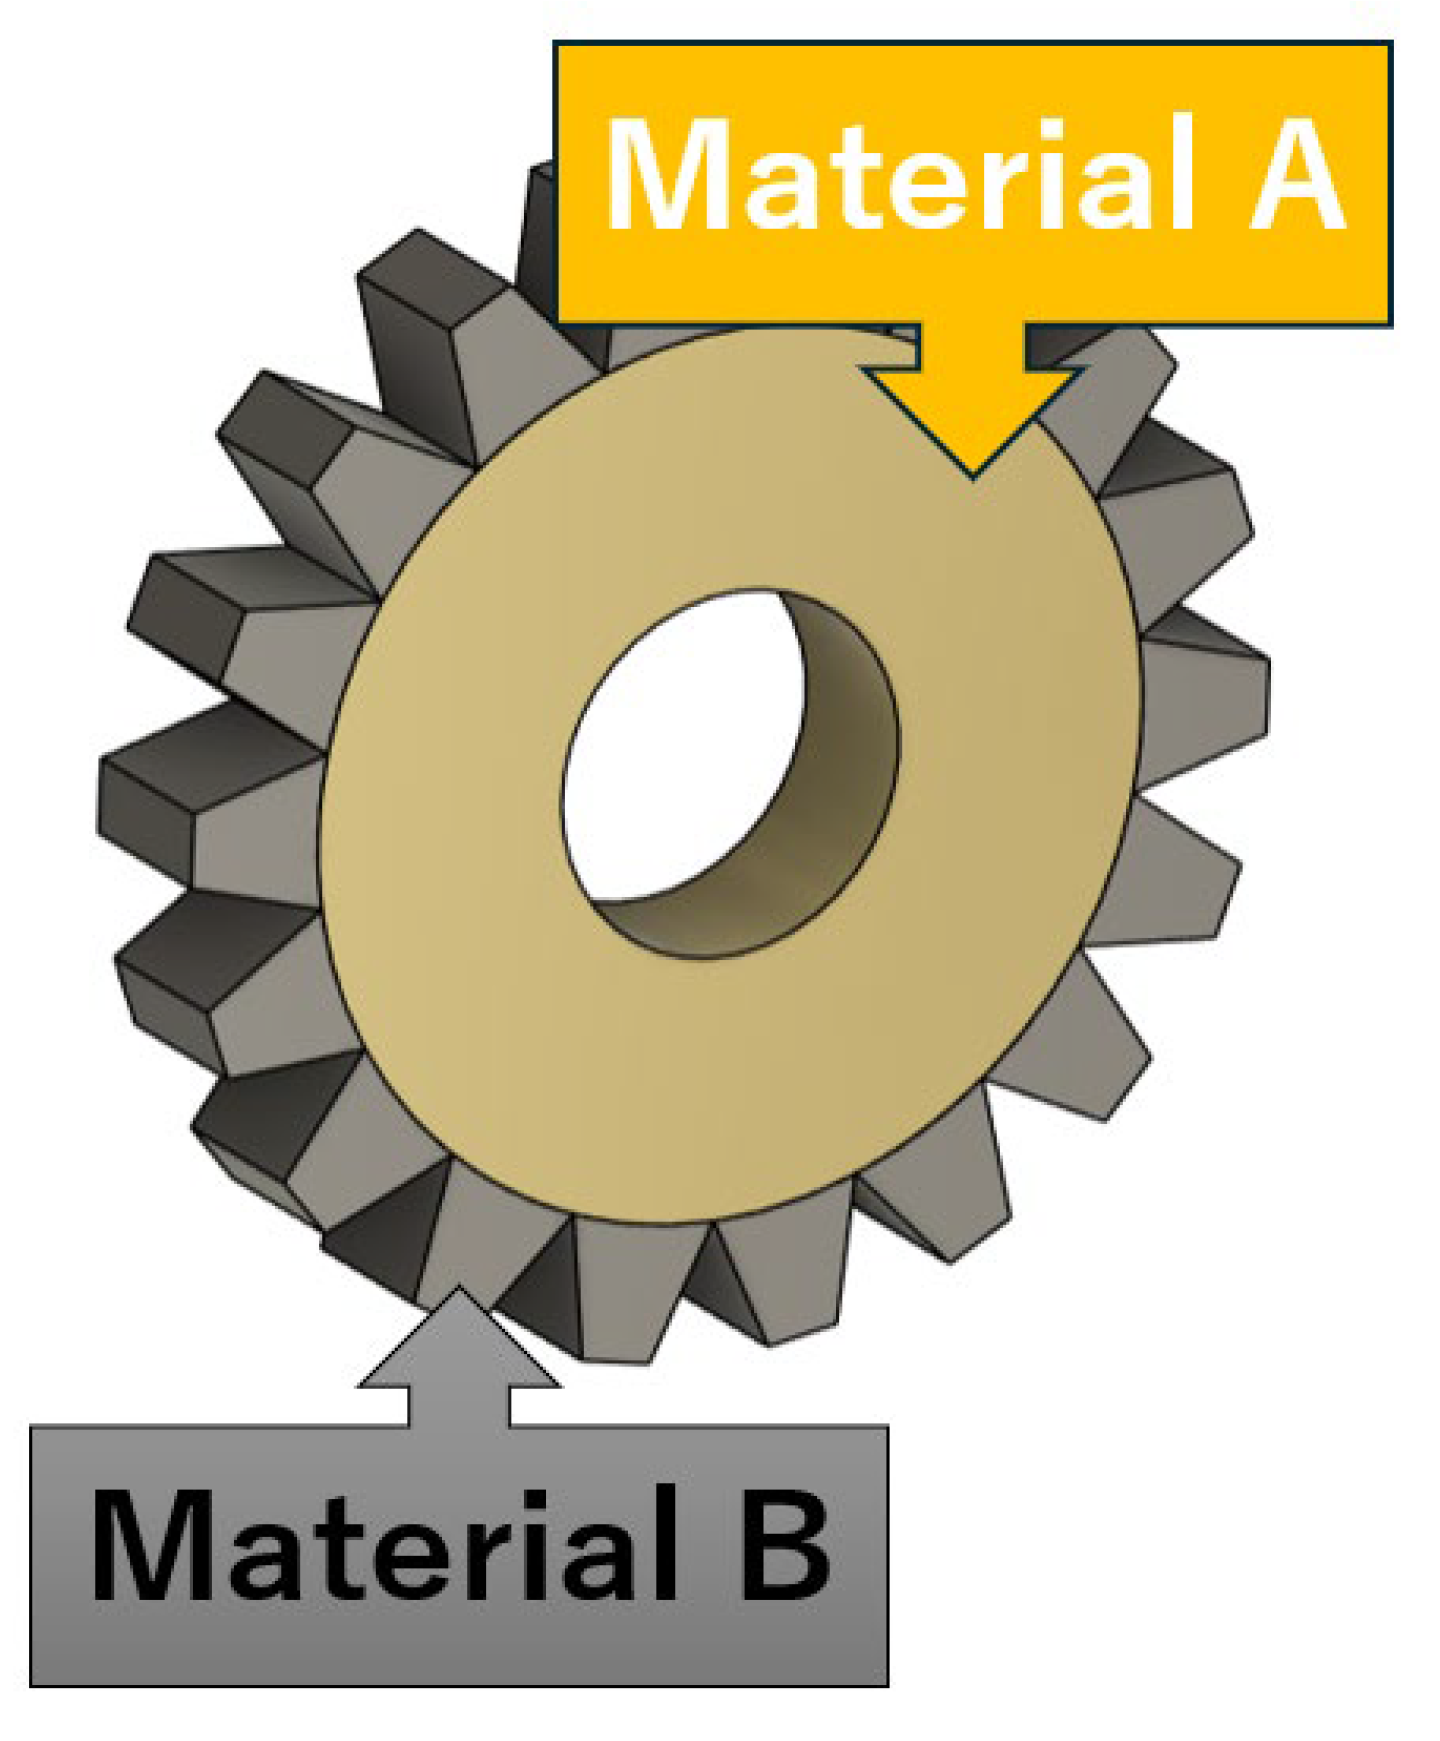
Figure 2 shows a conceptual diagram of multi-materials. In a multi-material system, materials can be switched at each location and arranged according to the characteristics of each material.
The printing method of the multi-material specimen is described here. The second material is fed into the resin batts and printing is resumed. The printing parameters are shown in Table 2. The exposure times of 4 s, 8 s, and 12 s were used for comparison. Printing was done vertically due to the convenience of the printing method. Secondary curing times of 0, 5, and 60 min were used. In addition, multi-material specimens were produced with secondary curing times of 0 and 60 min. In the case of the single-material specimens, printing was performed in a single run. The room temperature for the entire process was 25 °C. For the multi-materials with adhesive bonding, the single material was printed half at a time and then bonded with adhesive (100% cyanoacrylate). The filling rate of the model was set to 100% because there is no item for optical 3D printers. Although the filling rate can be changed by use of software [23], the filling rate was set to 100% for practical use because the uncured resin that penetrated into the voids expanded and caused leakage. For multi-material printing, two resin vats were used and swapped out as needed. Before printing, the resin was stirred and cleaning using alcohol disinfectant (70%).
Figure 3 is the measurement result of the irradiation dose. The dose is simply calculated by multiplying the irradiation amount by the irradiation time as shown below. For the MARS4 ULTRA (3D printer), the AH-NUV was placed on top of the LCD panel and measured at 12 points. The figure shows the measured values at each location. For the Form Cure (post-processing machine), the AH-NUV was placed on the turntable and irradiated for 5 min at 60 °C, and the average value was recorded. The average values were 0.377 mW/cm2 for UVA, 4.390 mW/cm2 for Blue, and 4.767 mW/cm2 for the total.
In the Form Cure (secondary curing machine), the AH-NUV was placed on the turntable and irradiated at 60 °C for 5 min. The average value per minute was recorded as follows: UVA (365 nm~400 nm) at 11.05 mW/cm2, BLUE (400~440 nm) at 9.55 mW/cm2, with a total of 20.6 mW/cm2.

2.3. Specimen and Test Conditions

The test specimen was the same as the scaled test specimen [24] (Figure 4 [25]) of JIS K 7139, the test standard for plastics. The room temperature during the test was 25 °C, and the tensile speed was 0.72 mm/min. Five tensile tests were conducted under each condition.
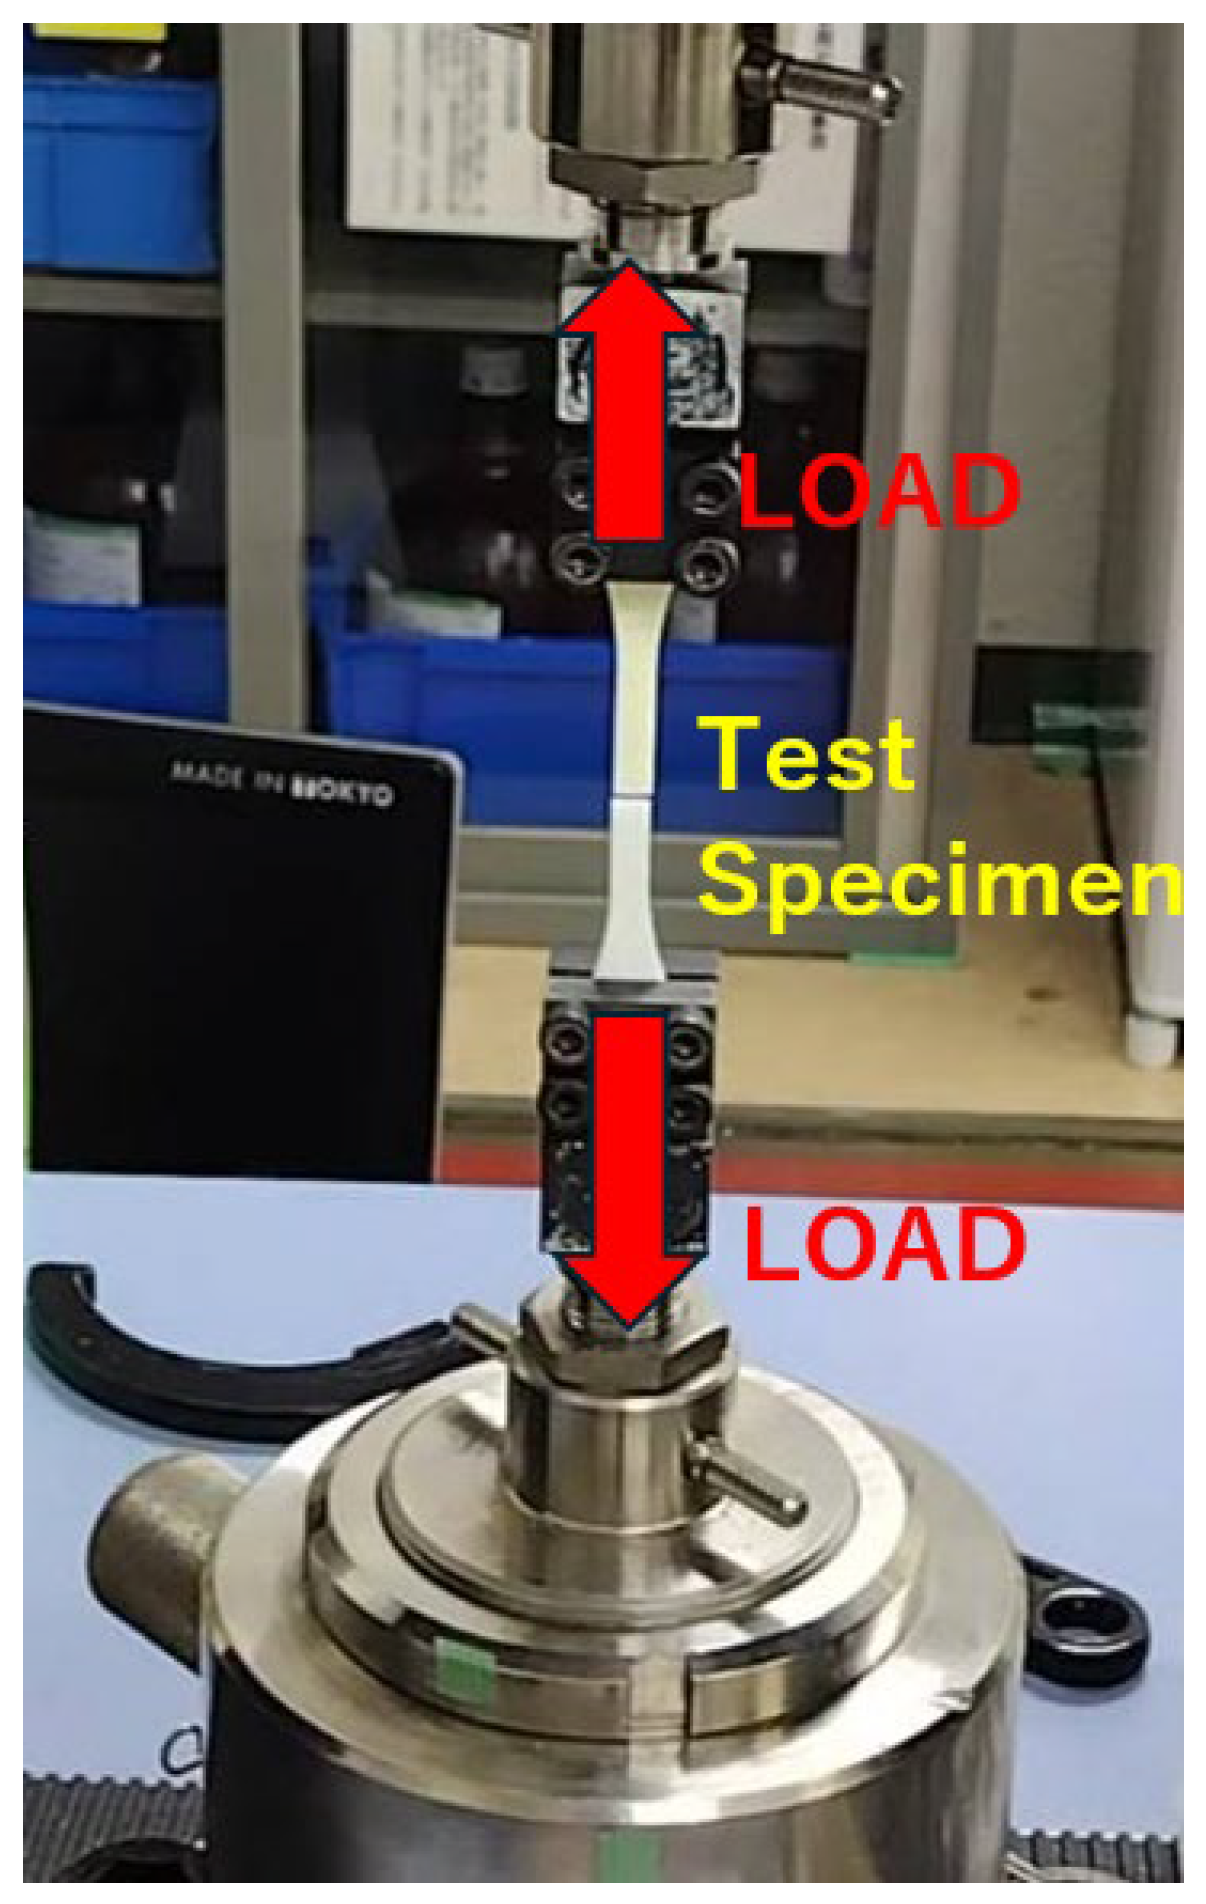
Figure 5 shows the test results. In the next section, the results of the experiments are described, and those using ABS-Like Resin are labeled ABS and those using Tough Resin are labeled TOUGH. The multi-material specimens with a single layer of ABS-Like Resin are labeled ABS-TOUGH, while those with a single layer of Tough Resin are labeled TOUGH-ABS. Adhesive is used for specimens that have been glued together.

3. Results

3.1. Printing Results

3.1.1. Output of the Test Specimen

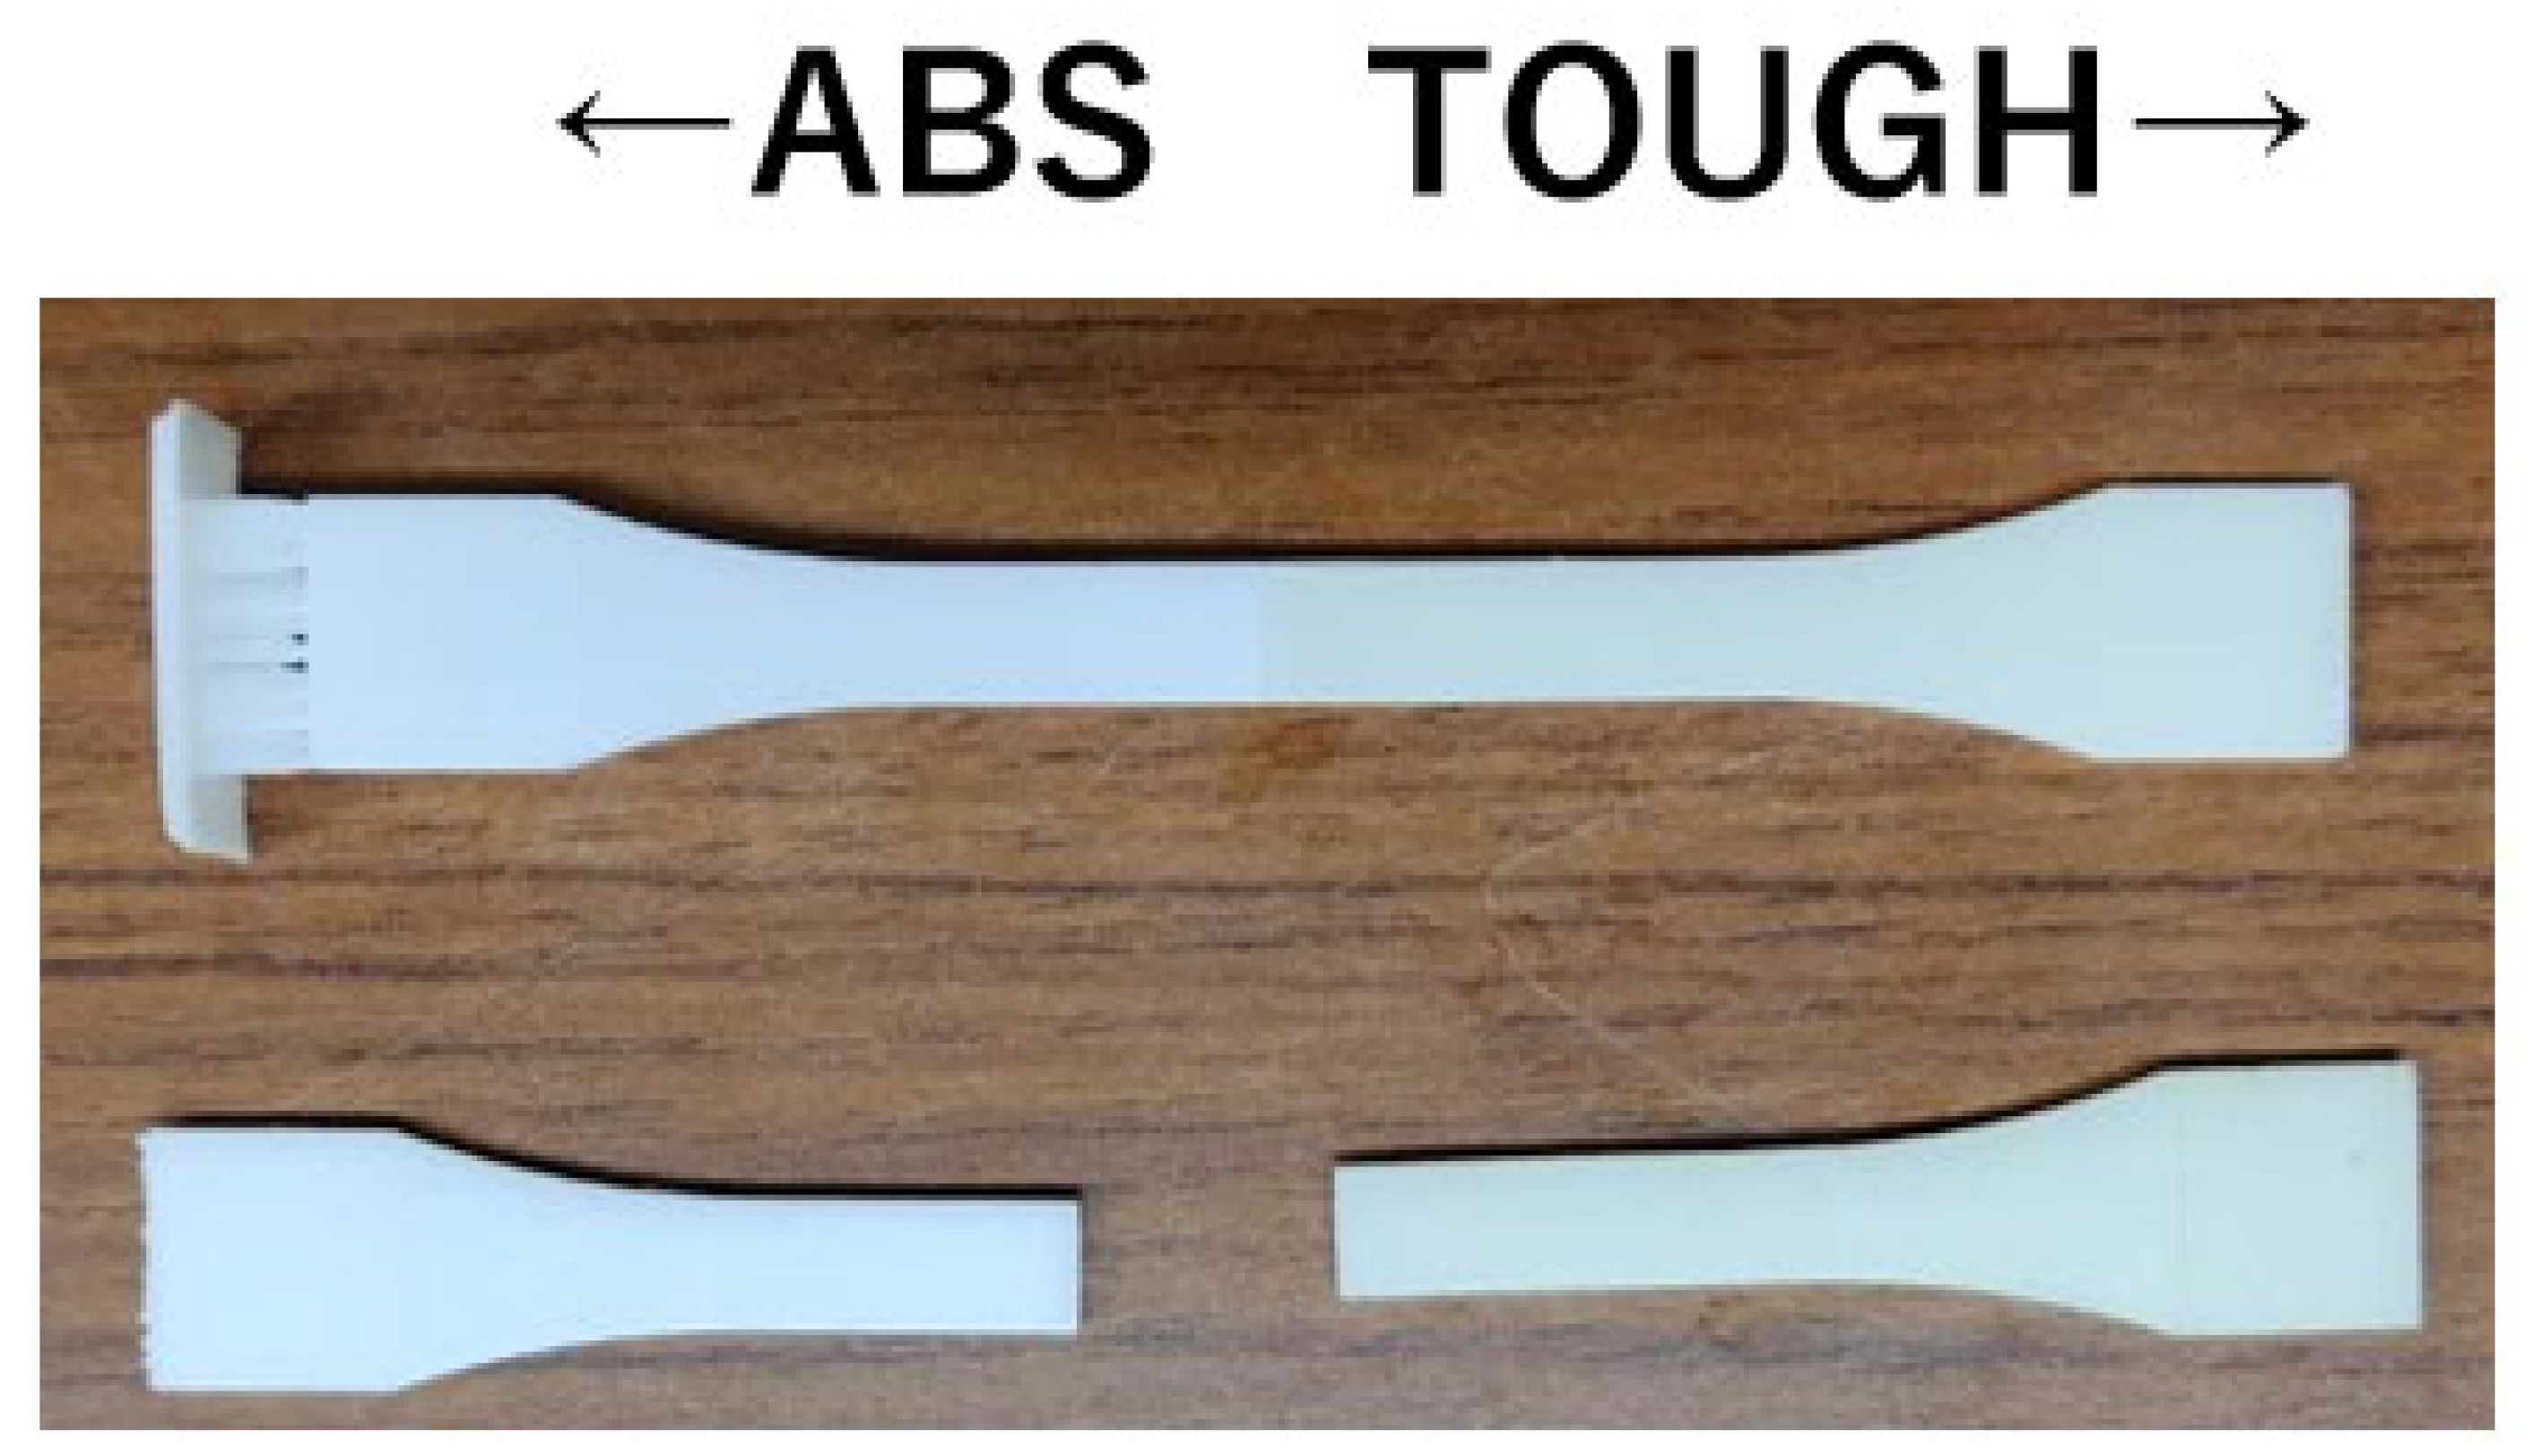
For the single-material specimens, all of the above printing parameters resulted in material output to the end. Figure 6 shows the printed specimen. When the multi-material specimen is printed to the end, it looks like the specimen on the right side of Figure 6. In contrast, when switching materials, if the second type of material does not solidify, half the size of the material is output, as shown on the left. For the multi-material specimens with exposure times of 8 s and 12 s, the material was output until the end of the specimen. However, when the exposure time was 4 s, only 7 (43.75%) of the 16 specimens printed at one time were printed to the end. When the exposure time was 2 s, all of the outputs stopped without resin setting at the time of material changeover. Therefore, only half of the long dimension was output. These results suggest that multi-material fabrication requires a long exposure time, and that there is a possibility of expansion in the dimensions when the entire piece is exposed for a long time. In fact, dimensional expansion has been confirmed for single materials when exposed for long periods of time [26]. It has also been reported that multi-material specimens may fail at the same exposure time as a single material [27]. The same result was observed in this experiment. When printing failed, no fixation of the second type of material was observed.
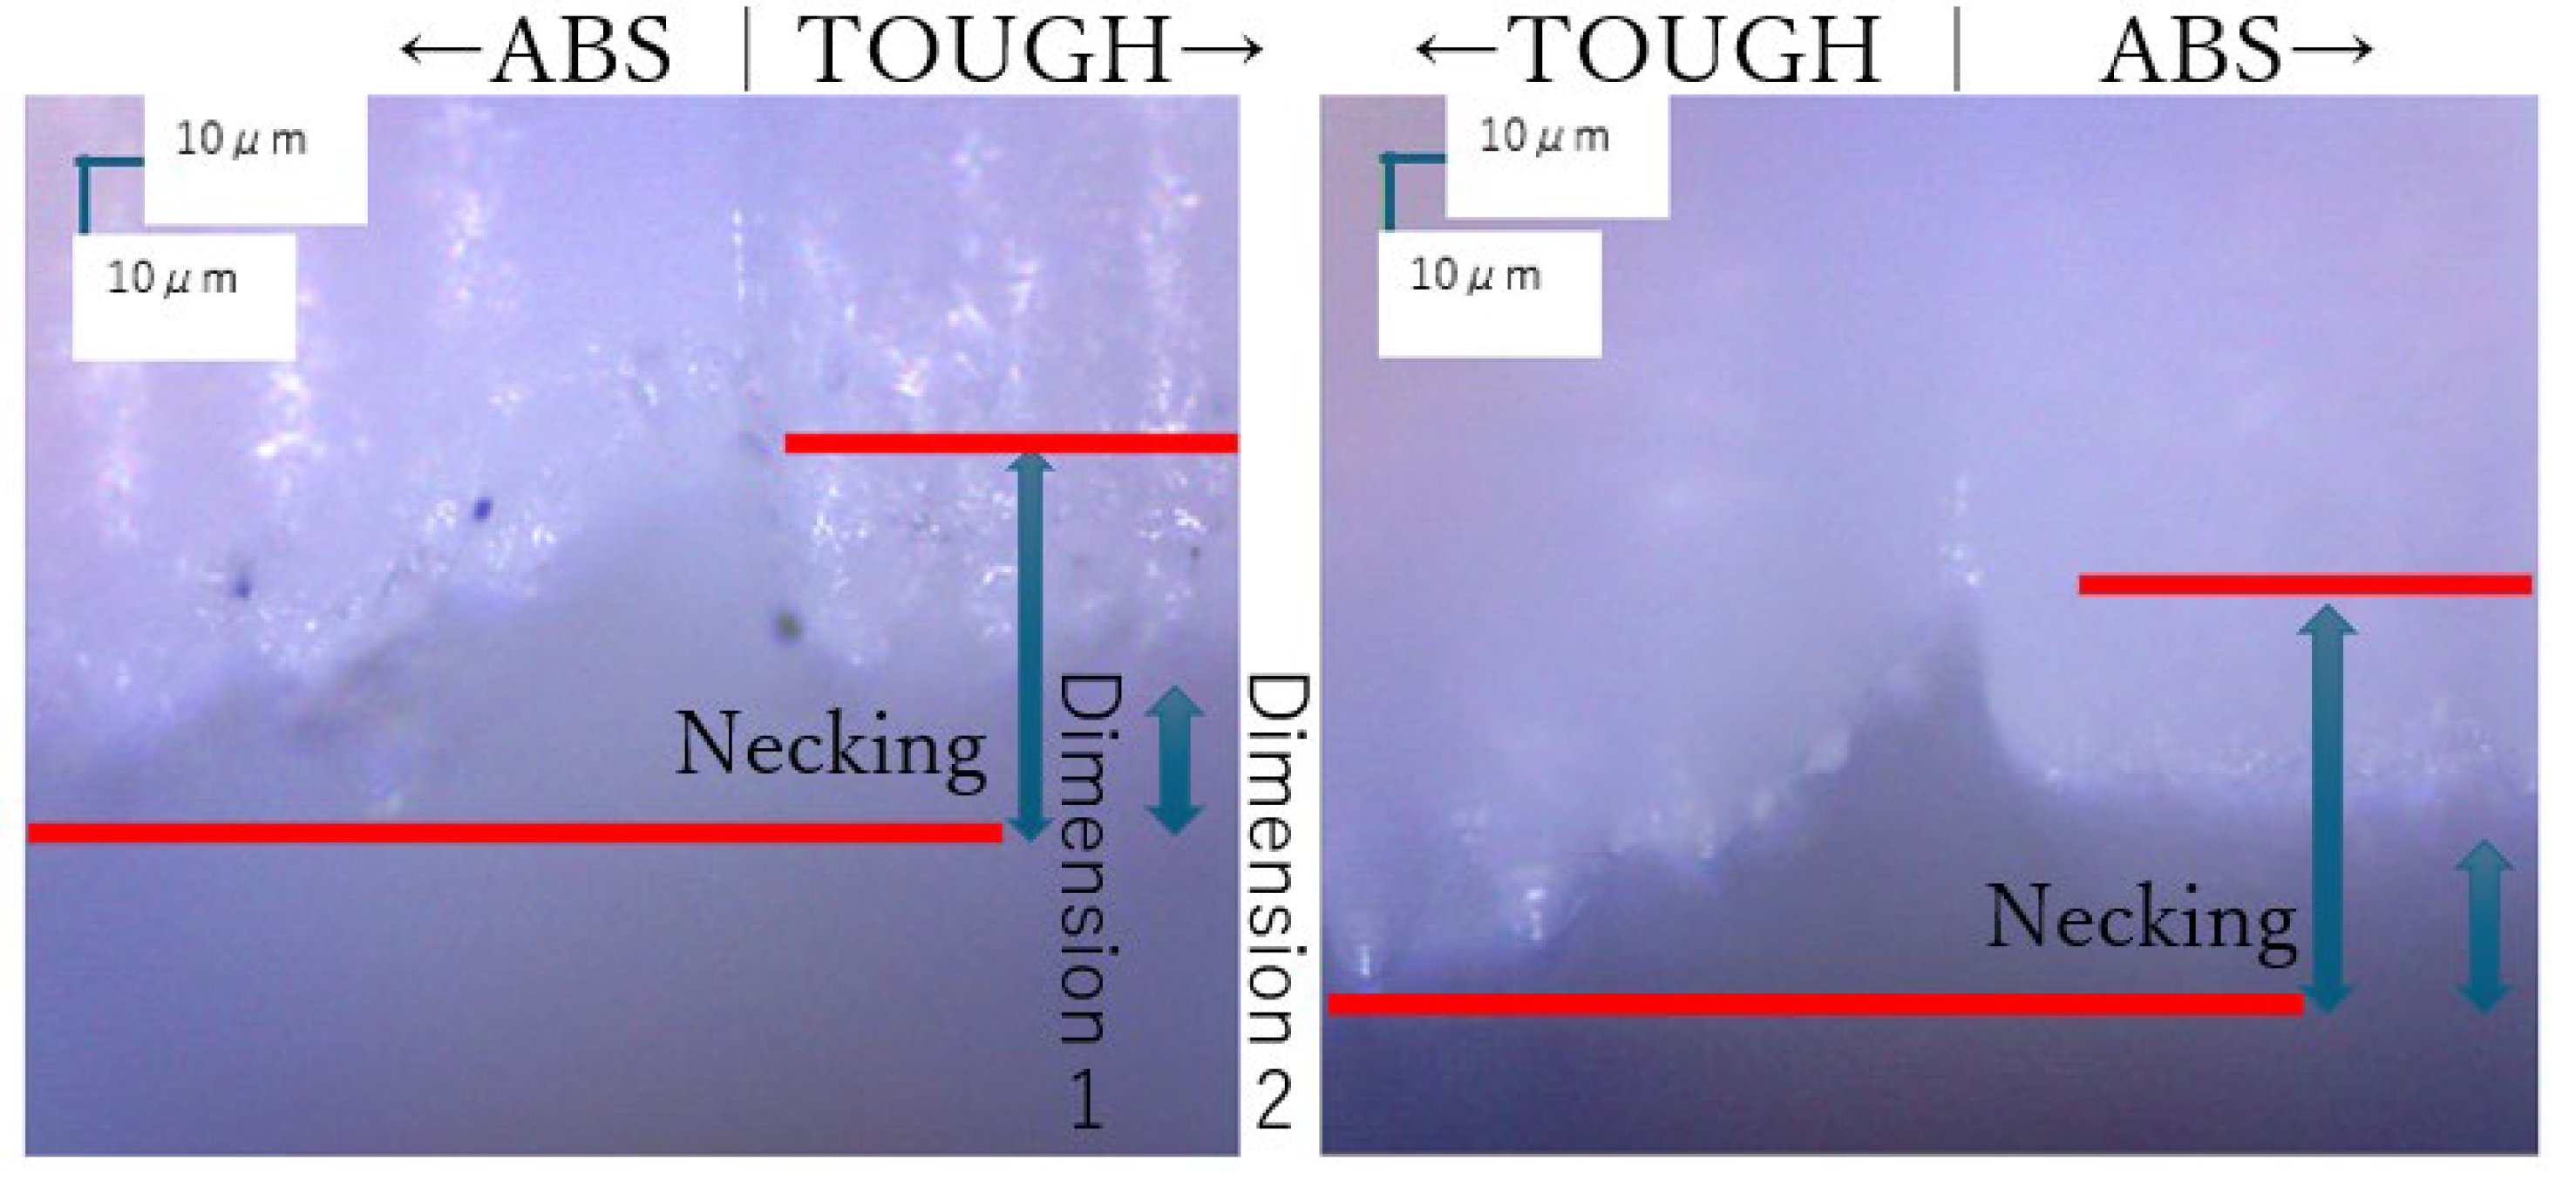
The specimens were subjected to tensile testing and microscopic observation prior to fracture. Figure 7 shows a view of the center of the specimen with the two materials connected. Table 3 shows the values for the size of the constriction in Figure 7. This all happened when switching materials, as the edge of the first material was not printed and the second material joined it. In a previous study of multi-materialization via the DLP method [16], shrinkage of the boundary surface was also observed, but the cause was not determined.
We also include the dimensions after shrinkage, and provide representative values for each test piece, ABS-TOUGH and TOUGH-ABS. The exposure time was 8 s, and the secondary curing time was 60 min.

3.1.2. Fracture Mode

The following shows representative examples of fracture in ABS, TOUGH, ABS-TOUGH, and TOUGH-ABS. The fracture patterns were similar for each material. All images correspond to an irradiation time of 8 s and a secondary curing time of 60 min.
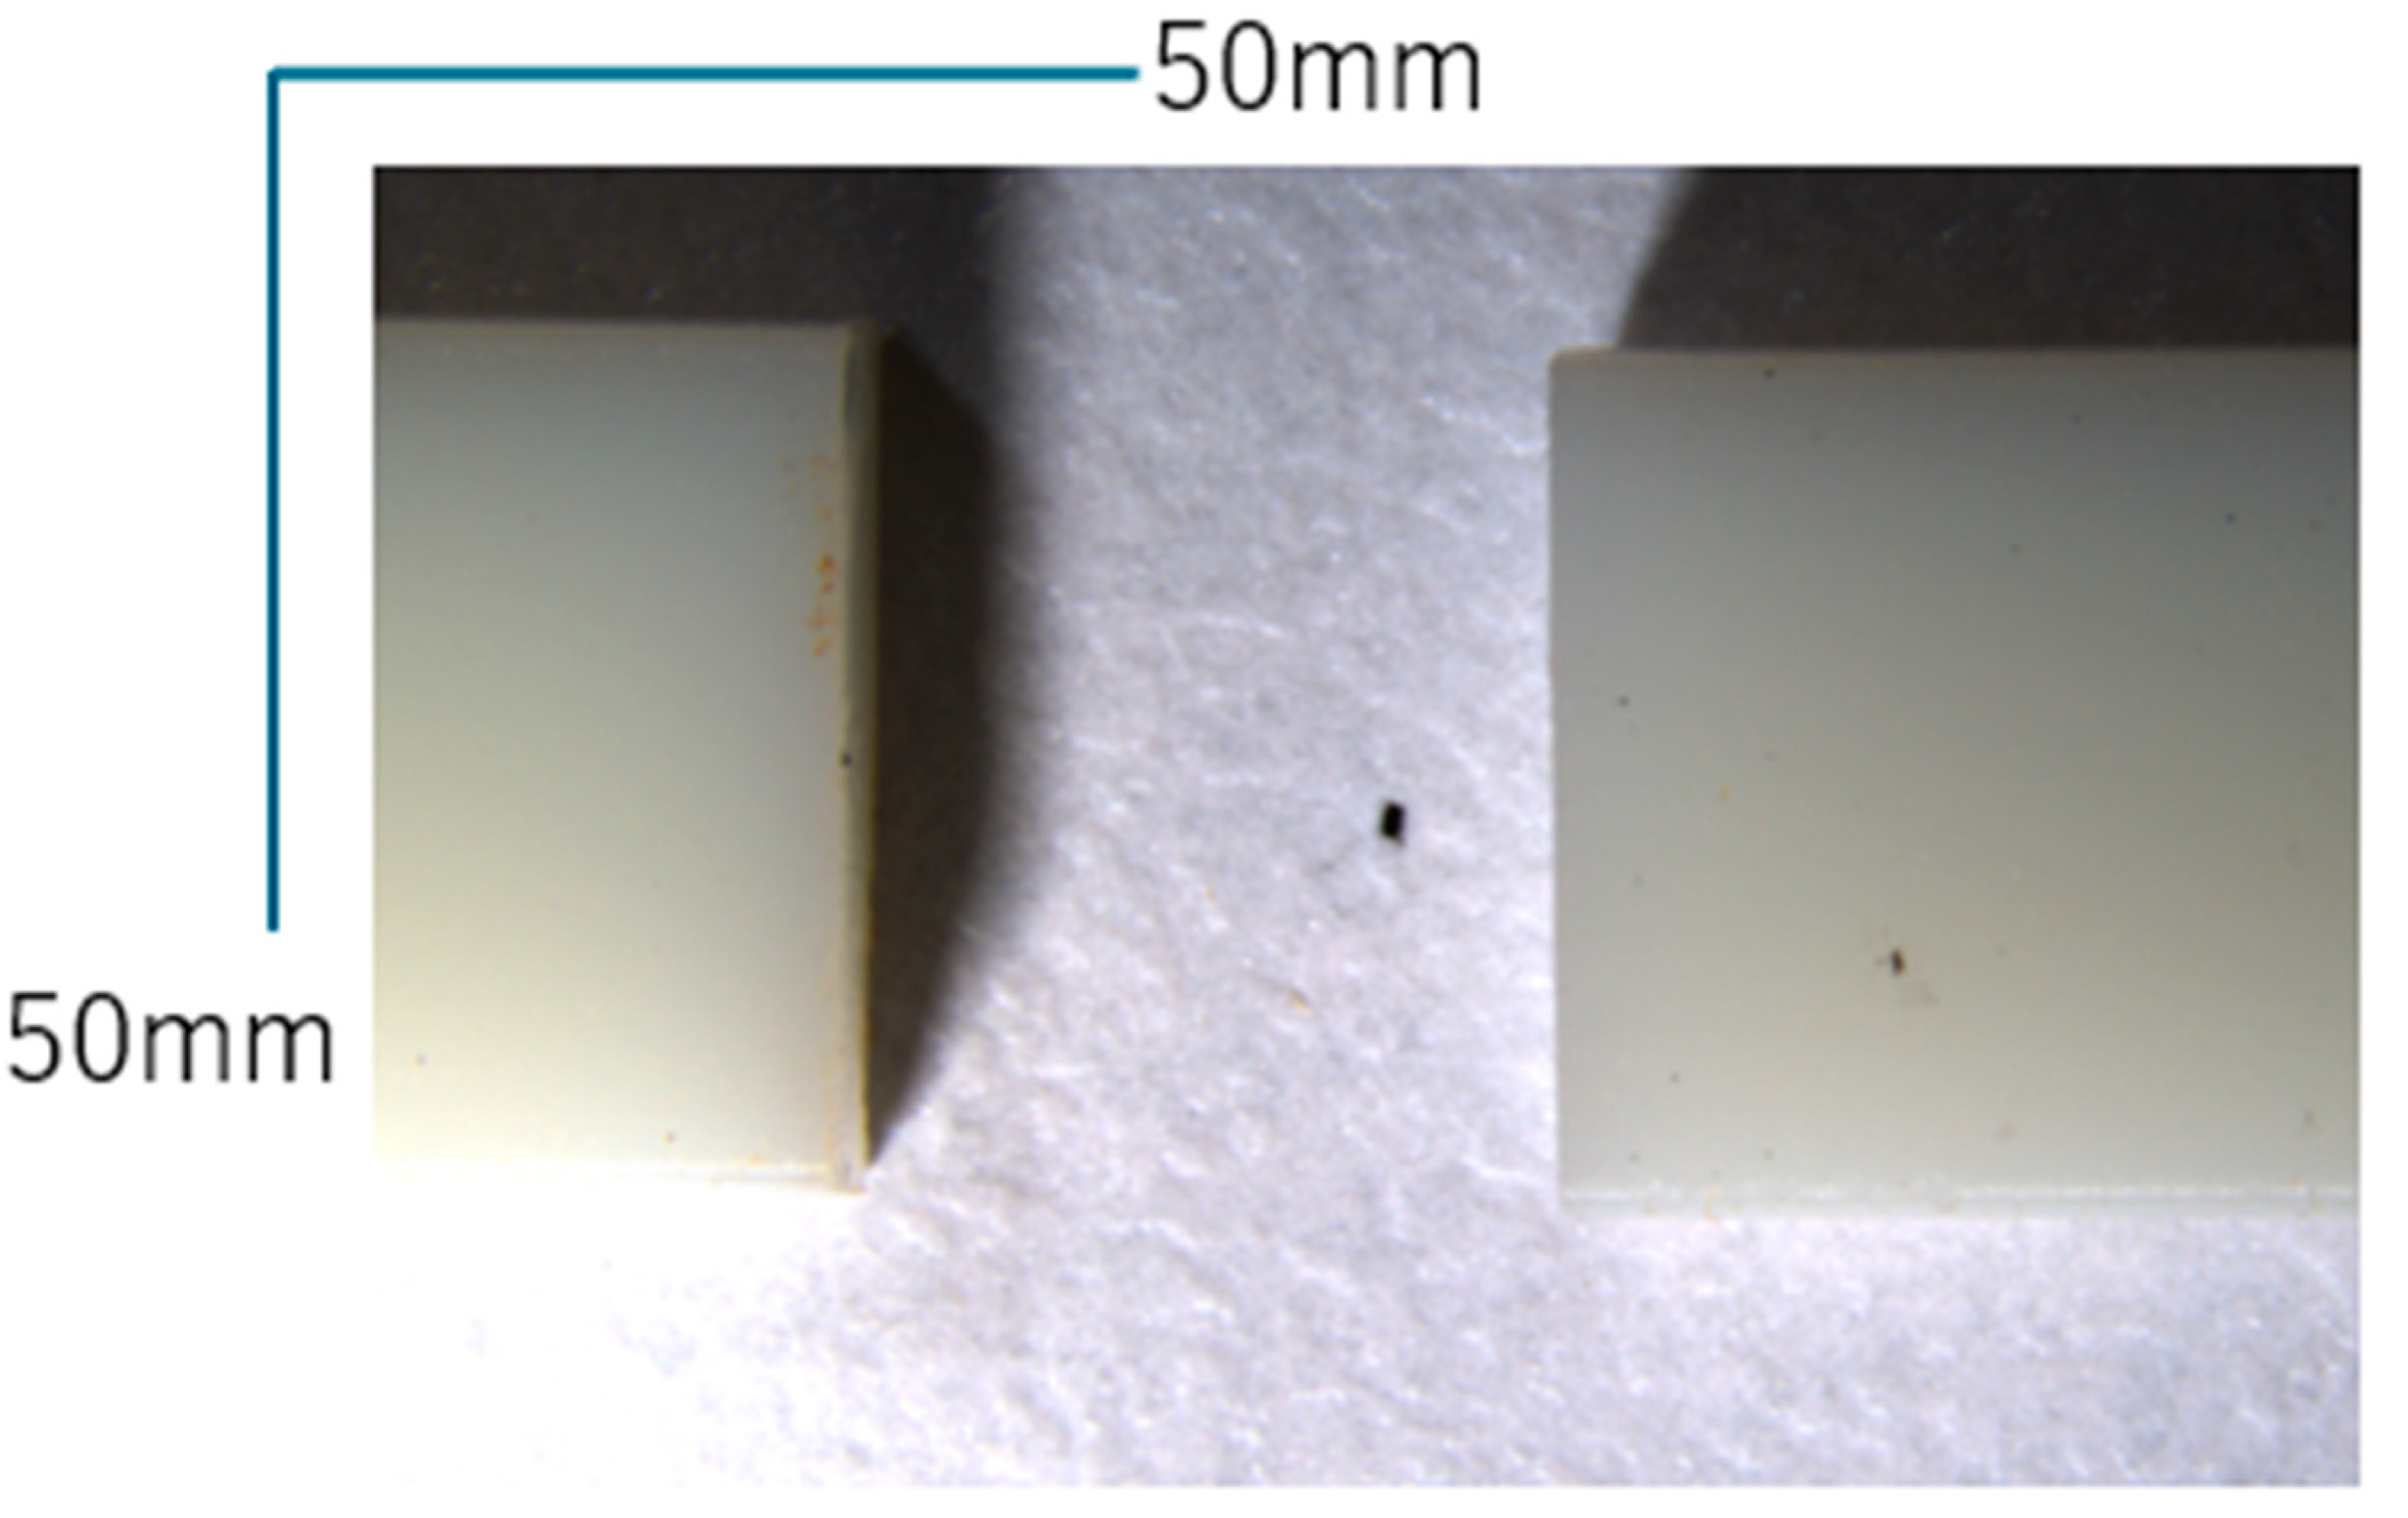
In ABS (Figure 8), warping was observed at the edges of the test specimens.
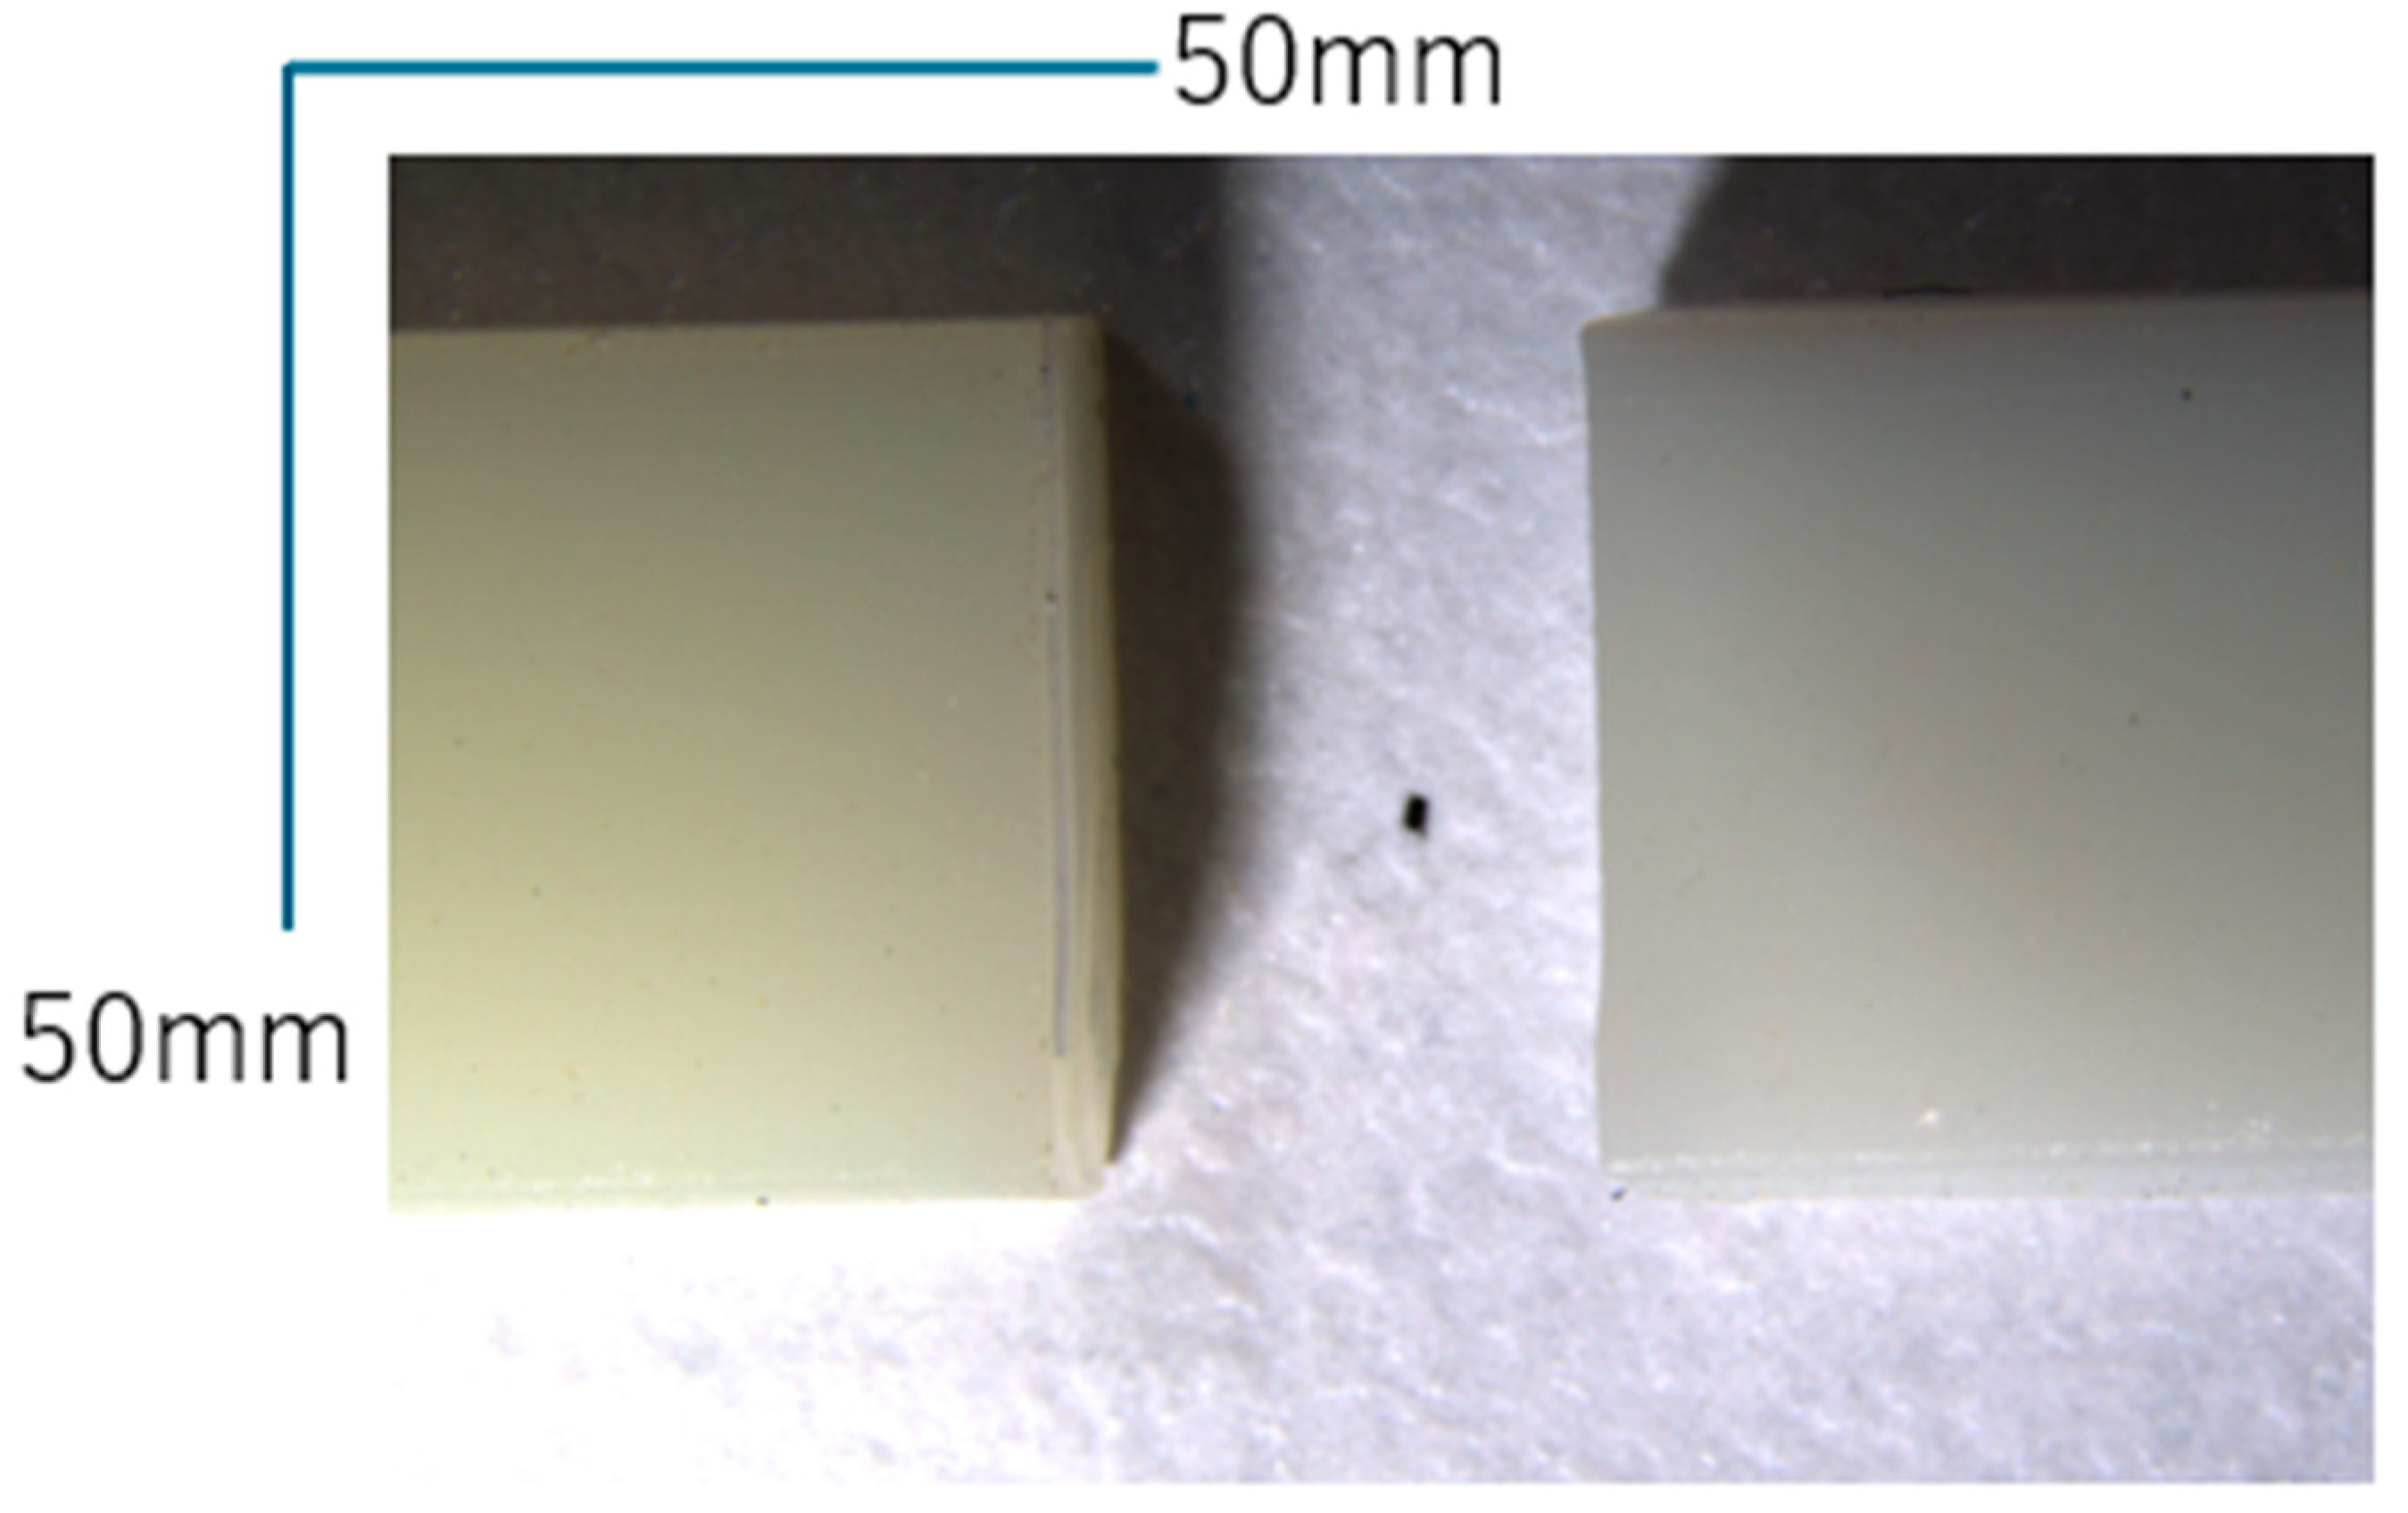
The single-material test specimen (Figure 8 and Figure 9) exhibited vertical fracture, which is representative of brittle fracture in resins. Fracture occurred between layers, excluding corners and outer sections.
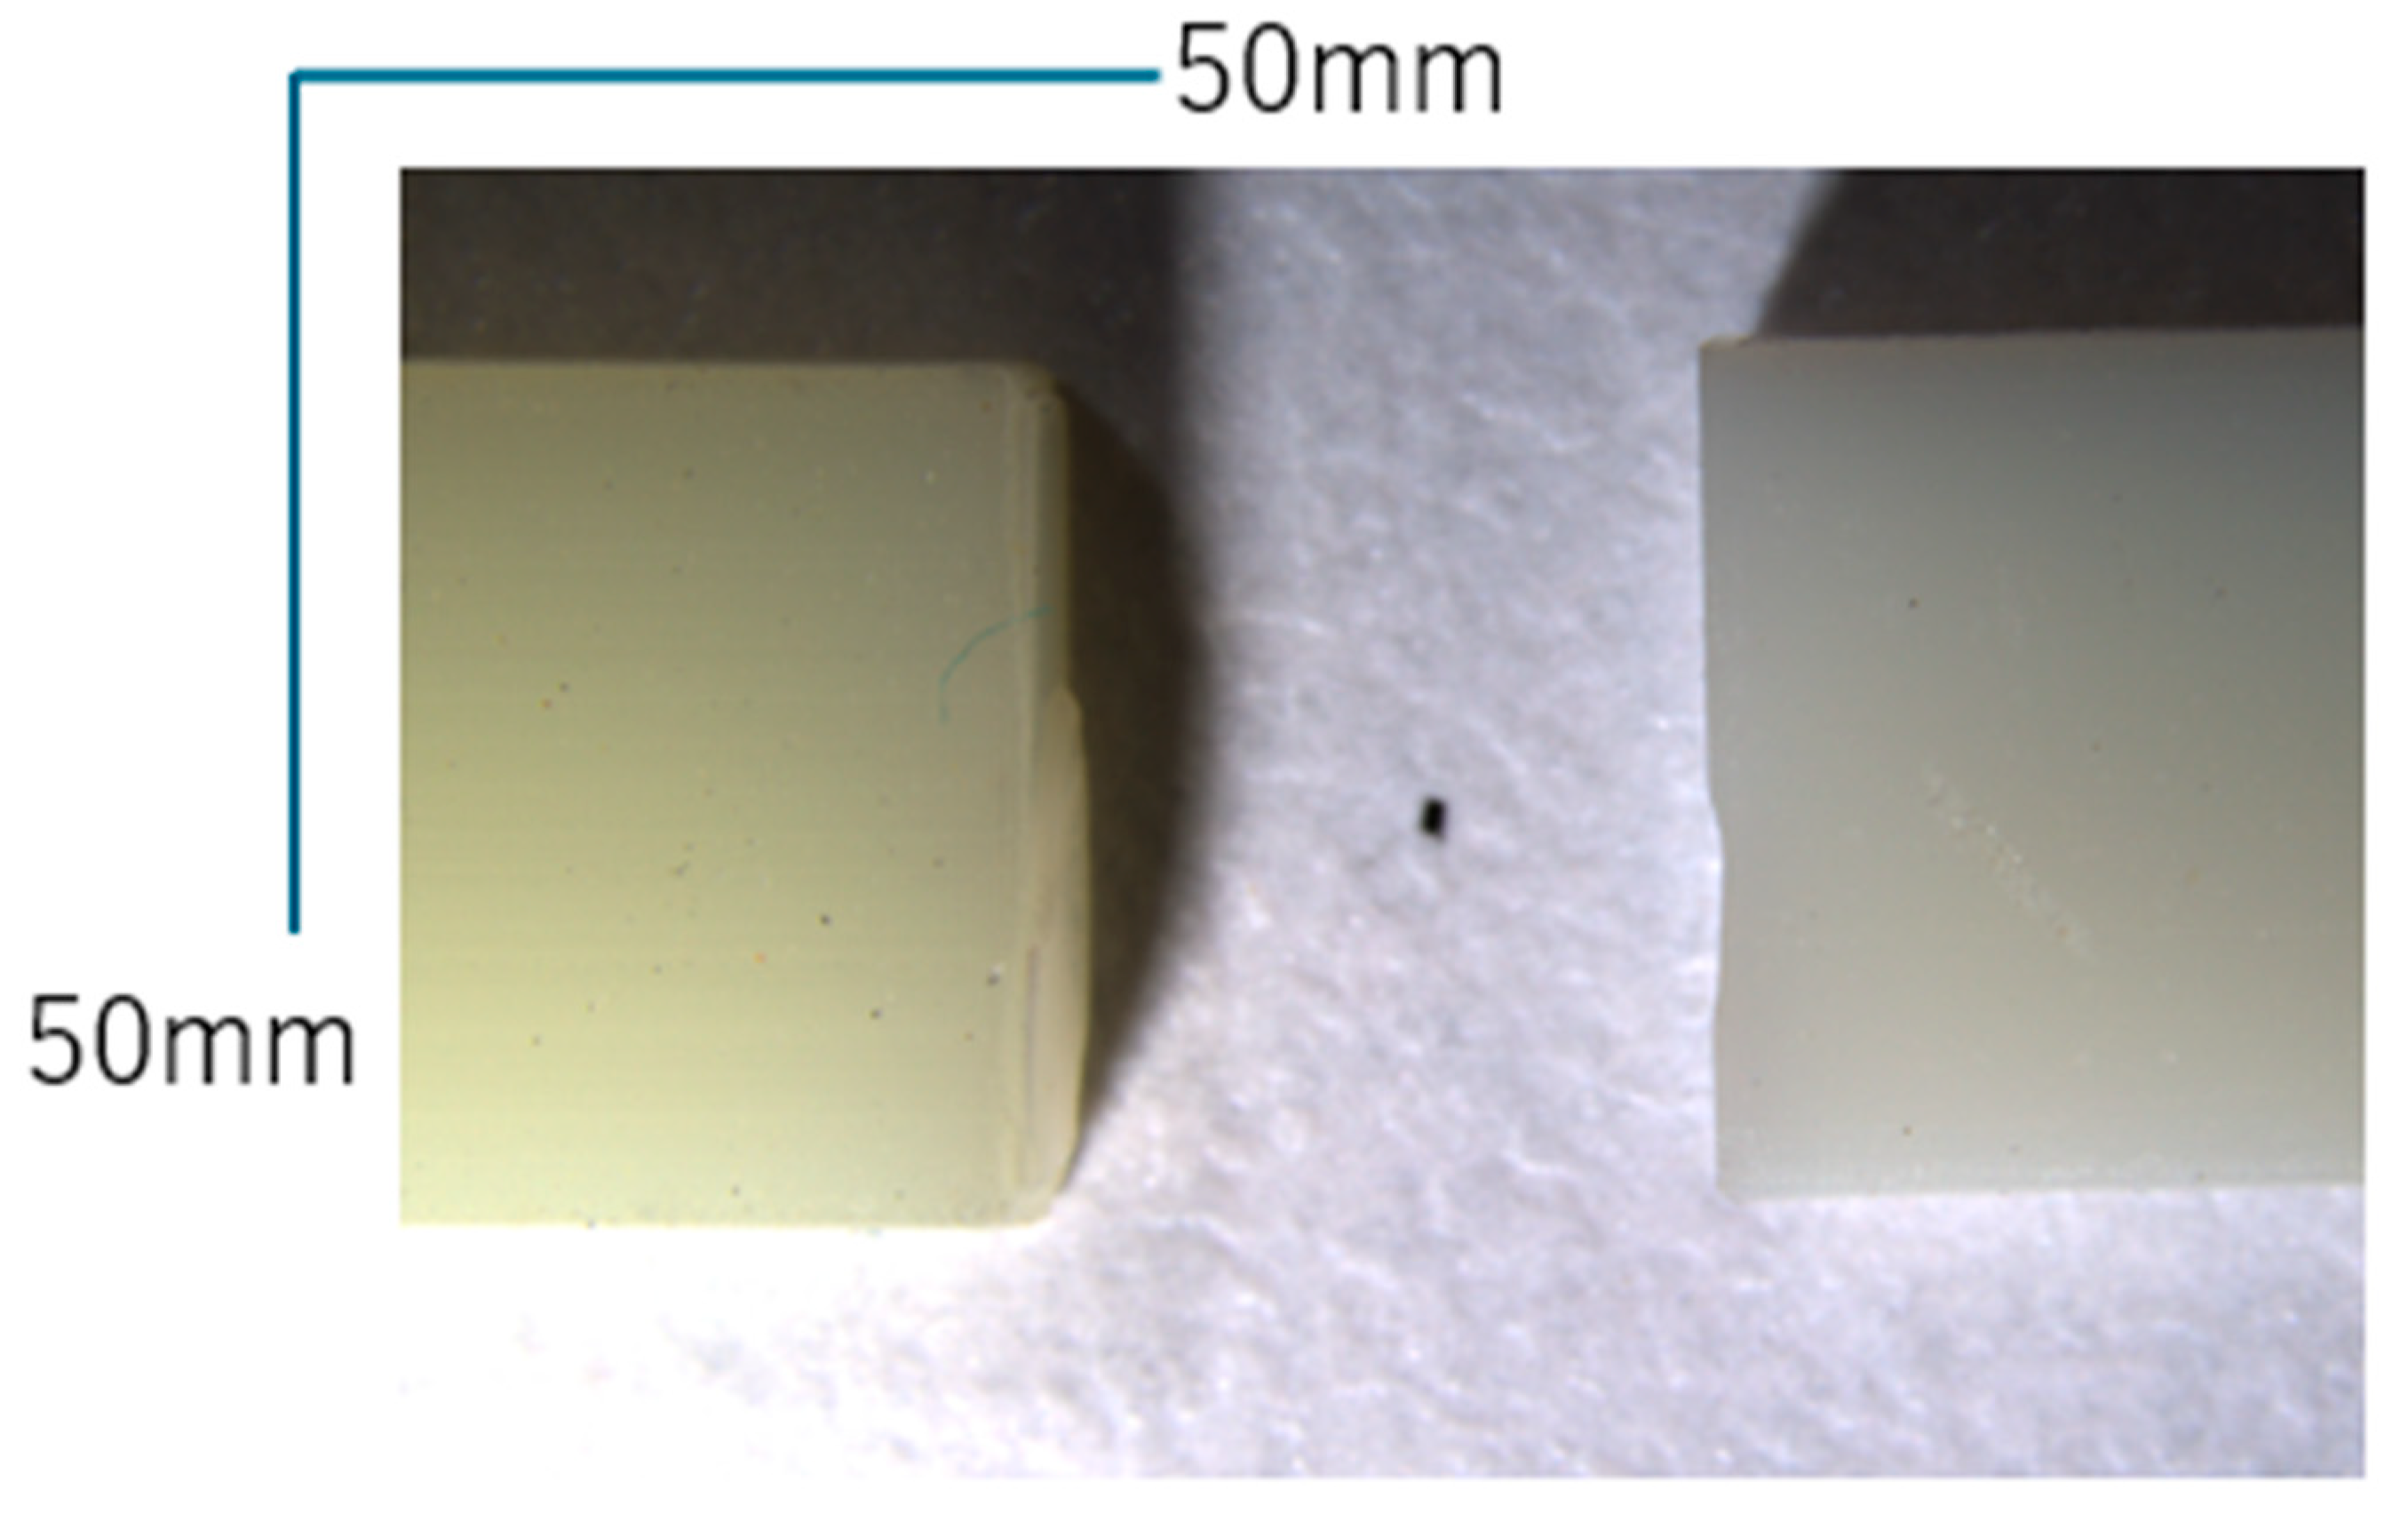
In ABS-TOUGH (Figure 10), fracture followed a curved path compared to the single material.
In TOUGH-ABS (Figure 11), the fracture propagated through more layers of the ABS. The fractures in both composite materials occurred on the ABS side.

3.2. Comparison of Single-Material Specimens with Multi-Material and Adhesive Specimens (Result)

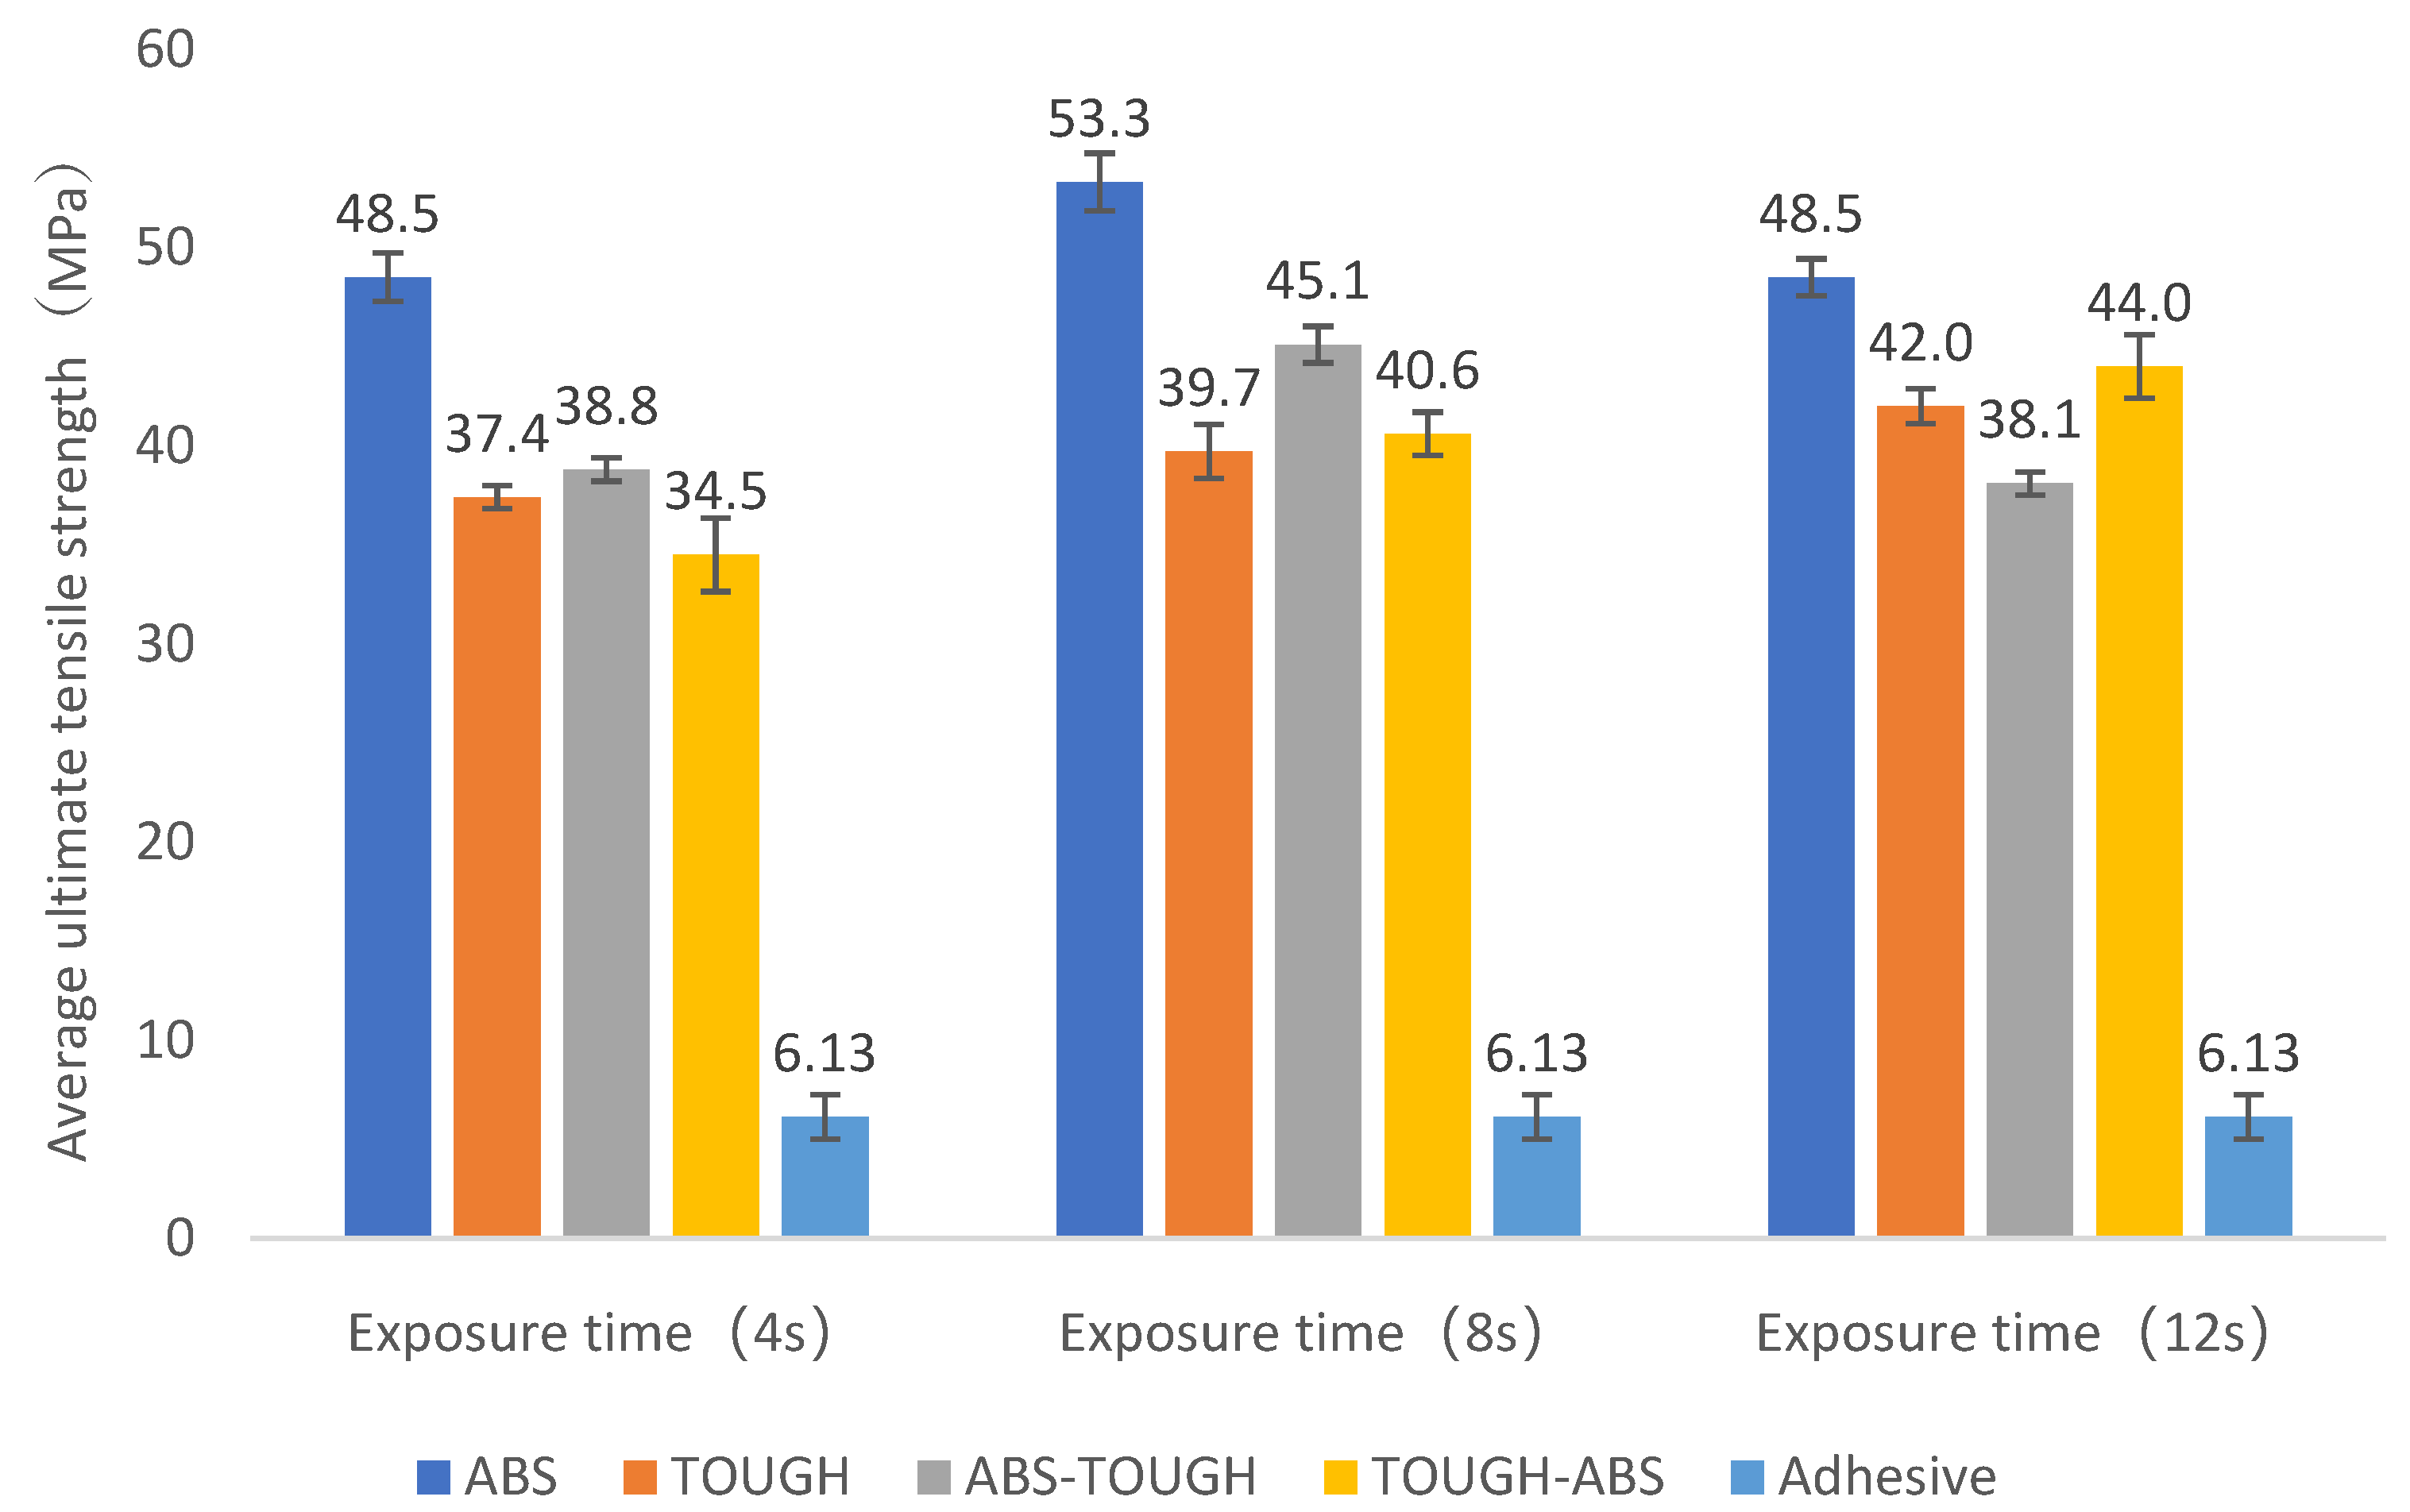
Figure 12 shows the average tensile strengths of the single-material specimens and the multi-material and adhesive specimens. At all exposure times, the multi-material specimens exhibited much higher average tensile strengths than the adhesive. All of the tensile strengths of the multimaterial specimens were greater than 90% of the tensile strength of the low-strength material, TOUGH. The maximum tensile strength for the low-strength material was 114%. For the high-strength material ABS, the tensile strength ranged from 71.1% to 90.7%. In addition, it was observed that the tensile strength of the multi-material specimens differed even when the exposure time was the same.
Some of the specimens did not fracture at the center, but rather at the TOUGH portion. There were also outcomes wherein the tensile strength at the bonding surface was between the ABS and the TOUGH. These two results confirm that rupture can occur outside of the bonding plane.
We assessed multi-material specimens (ABS-TOUGH and TOUGH-ABS) against the TOUGH single material and the adhesive control at each exposure time using Welch one-way ANOVA with Benjamini–Hochberg-adjusted pairwise Welch t-tests (n = 5/group).
At 4 s, ABS-TOUGH outperformed TOUGH (p = 0.014), whereas TOUGH-ABS performed worse than TOUGH (p = 0.046). Both multi-materials were markedly stronger than the adhesive control (ABS-TOUGH vs. adhesive, p = 2.5 × 10⁻⁸; TOUGH-ABS vs. adhesive, p = 3.1 × 10⁻⁷). An order effect was evident, namely, ABS-TOUGH > TOUGH-ABS (p = 0.014).
At 8 s, ABS-TOUGH remained superior to TOUGH (p = 6.1 × 10⁻⁴), while TOUGH-ABS was statistically indistinguishable from TOUGH (p = 0.354). Both multi-materials again exceeded the adhesive control in terms of performance (p = 5.6 × 10⁻¹⁰ for each). The order effect persisted, with ABS-TOUGH > TOUGH-ABS (p = 6.1 × 10⁻⁴).
At 12 s, the pattern reversed for ABS-TOUGH, which was inferior to TOUGH (p = 3.9 × 10⁻⁴), whereas TOUGH-ABS remained comparable to TOUGH (p = 0.103). Both multi-materials still surpassed the adhesive control (ABS-TOUGH, p = 1.6 × 10⁻⁸; TOUGH-ABS, p = 9.0 × 10⁻⁹). Here, the order effect flipped to TOUGH-ABS > ABS-TOUGH (p = 0.00180).
Collectively, multi-materials are consistently stronger than the adhesive control at all exposure times, but their advantage relative to TOUGH depends on the stacking order and exposure duration; ABS → TOUGH is favored at 4–8 s, whereas TOUGH → ABS is favored at 12 s.
Figure 13 shows the average elongations of the single-material specimens and the multi-material and adhesive specimens. The elongations of the multi-material specimens were greater than those of the adhesive at all exposure times. However, the elongation of the multi-material specimens was less than 55% of that of the single-material specimens at most.
Across 4–12 s, the Welch ANOVAs were highly significant at every time point (all p ≤ 6.87 × 10⁻⁸). TOUGH consistently exhibited the greatest total elongation, which was significantly higher than those of ABS and both multi-material groups at each exposure (all BH-adjusted p ≤ 7.9 × 10⁻⁴). ABS ranked second, and its score was significantly higher than those of both ABS-TOUGH and TOUGH-ABS at all times (BH p ≤ 0.0055). Between the multi-materials, ABS-TOUGH consistently exceeded TOUGH-ABS (BH p ≤ 0.0022). Adhesive specimens’ scores were consistently and markedly lower than those of all printed groups (BH p ≤ 9.6 × 10⁻⁹ at 12 s). Notably, the elongation of ABS increased at 12 s (14.26%), and ABS-TOUGH also rose (7.98%), but these levels remained well below that of TOUGH (28.94%).

3.3. Effect of Exposure Time on Multi-Material Specimens

Figure 14 shows the relationship between the exposure times and average tensile strengths of the specimens. The results for ABS and TOUGH, which are single-material specimens, show that the average tensile strength basically tends to increase as the exposure time increases. For ABS resin, the tensile strength increased by a maximum of 17.7% (8 MPa) as the exposure time increased from 2 to 8 s. For ABS resin, the tensile strength increased by up to 17.7% (8 MPa) (9% increase from 4 to 8 s) as the exposure time increased from 2 to 8 s, but it decreased by about 9.0% from 8 s (53.3 MPa) to 12 s (48.5 MPa). On the other hand, the TOUGH resin showed a consistent increase of 32.1% (approx. 10.2 MPa) from 2 s (31.8 MPa) to 12 s (42 MPa) of exposure time. In the case of ABS-TOUGH, the increase was confirmed at 8 s (45.1 MPa), as in the case of ABS, and the rate of increase was about 16%. TOUGH-ABS showed a consistent increase up to 12 s (44 MPa) as in TOUGH, with an increase of 27%. In terms of tensile strength, the multi-material specimens showed similar behaviors to the first material.
We assessed the effect of exposure time on ultimate tensile strength (UTS) using Welch’s one-way ANOVA (reporting F(df_between, df_within, Welch)) and post-hoc pairwise Welch t-tests with Benjamini–Hochberg (BH) correction, complemented by linear/quadratic trend tests. For ABS, exposure time significantly affected UTS, F(3, ≈8.66) = 12.68, p = 0.0016. Post-hoc tests showed 8 s > 2 s (p = 0.0017), 8 s > 4 s (p = 0.0040), and 12 s > 2 s (p = 0.038), whereas 12 s was not different from 4 s (p = 0.945). The quadratic trend was significant (p = 1.09 × 10⁻⁵), with a peak near 8 s (vertex ≈ 7.8 s). For TOUGH, the main effect was highly significant, F(3, ≈8.60) = 80.33, p = 1.29 × 10⁻⁶; pairwise contrasts indicated 4 s > 2 s (p = 2.6 × 10⁻⁵), 8 s > 2 s (p = 1.3 × 10⁻⁴), 12 s > 2 s (p = 1.8 × 10⁻⁶), 12 s > 4 s (p = 1.5 × 10⁻⁴), and 12 s > 8 s (p = 0.034). The linear trend was strong (p = 9.24 × 10⁻⁸); although the quadratic term reached significance (p = 0.0040), the trajectory at 2–12 s was effectively monotonic increase. For ABS-TOUGH (4/8/12 s), exposure time was significant, with F(2, ≈7.76) = 66.52, p = 1.30 × 10⁻⁵; 8 s exceeded both 4 s and 12 s (each p = 3.0 × 10⁻⁵), while 4 s showed no difference from 12 s (p = 0.14). The pronounced quadratic trend (p = 1.08 × 10⁻⁸) indicates an optimum at 8 s. For TOUGH-ABS (4/8/12 s), exposure time significantly increased UTS, F(2, ≈7.58) = 22.98, p = 0.000607; 8 s > 4 s (p = 0.00243), 12 s > 4 s (p = 0.00036), and 12 s > 8 s (p = 0.0165). The linear trend was significant (p = 3.75 × 10⁻⁶), whereas the quadratic term was not (p = 0.203), consistent with a monotonic increase. Collectively, exposure time exerted a statistically significant influence on UTS across materials.
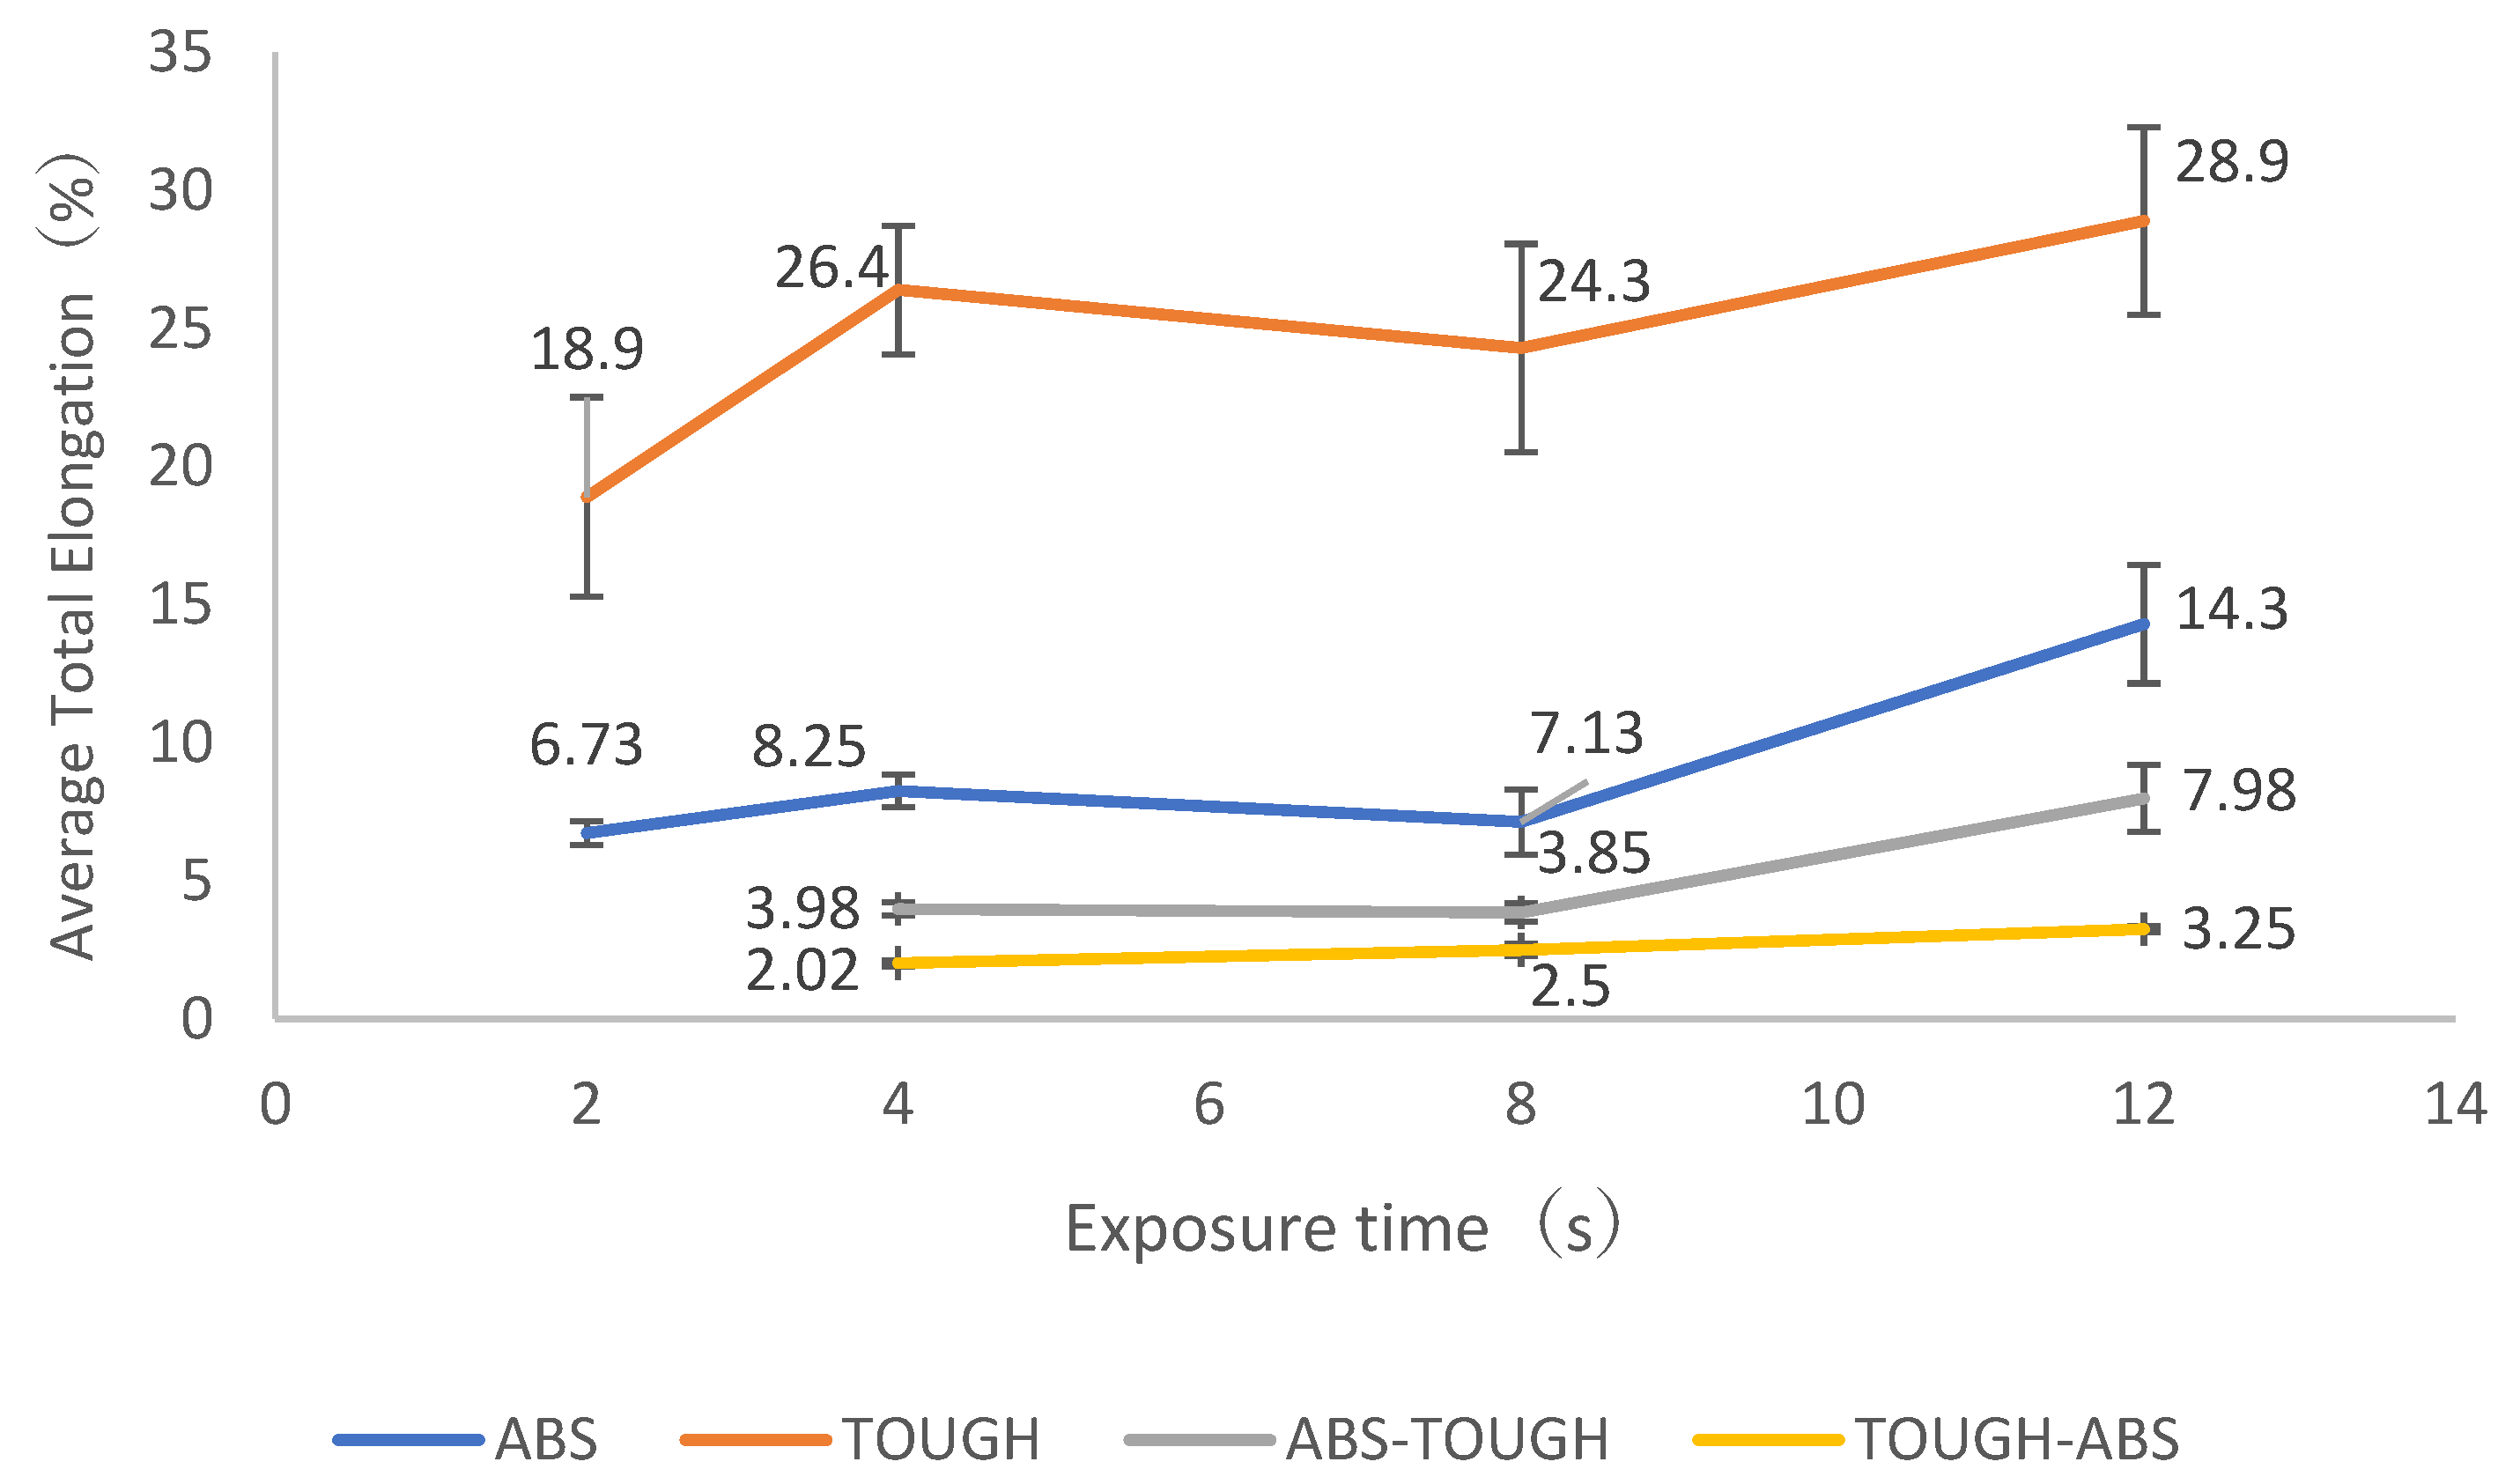
Figure 15 shows the relationship between the exposure time and average elongation of the specimens. Elongation also tends to increase with exposure time. The elongation of ABS resin increased 112% from 2 s (6.73%) to 12 s (14.3%) of exposure time, while that of TOUGH resin increased about 52.9% from 2 s (18.9%) to 12 s (28.9%). The exposure times of all the resins increased by approximately 52.9%. However, all of them showed a temporary decrease in elongation (ABS—13.6% decrease, TOUGH—7.95% decrease, based on tensile strength at 4 s) at the exposure time of 8 s. For the multi-material specimens, ABS-TOUGH showed a similar overall increase of 100.5% when compared to 4 s (3.98 MPa) and 12 s (7.98 MPa), but a decrease of 3.3% when compared to 4 s (3.98 MPa) and 8 s (3.85 MPa). In contrast, TOUGH-ABS continued to increase up to 12 s (3.25 MPa), with an increase of 60.9%.
Across all materials, exposure time significantly modulated both tensile strength and ductility. For ABS, Welch one-way ANOVA showed a reliable effect on UTS (F(3, ≈8.66) = 12.68, p = 0.0016). Post-hoc Welch tests (BH) indicated 8 s > 2 s (p = 0.0017), 8 s > 4 s (p = 0.0040), and 12 s > 2 s (p = 0.038), whereas 12 s was not different from 4 s (p = 0.945). The quadratic trend was significant (p = 1.09 × 10⁻⁵), with the peak near 8 s (vertex ≈7.8 s). For TOUGH, exposure time had a large main effect on UTS (F(3, ≈8.60) = 80.33, p = 1.29 × 10⁻⁶); pairwise tests showed 4 s > 2 s (p = 2.6 × 10⁻⁵), 8 s > 2 s (p = 1.3 × 10⁻⁴), 12 s > 2 s (p = 1.8 × 10⁻⁶), 12 s > 4 s (p = 1.5 × 10⁻⁴), and 12 s > 8 s (p = 0.034). The linear trend was dominant (p = 9.24 × 10⁻⁸); although the quadratic term reached significance (p = 0.0040), the pattern over 2–12 s was effectively one of monotonic increase. For the multi-material ABS-TOUGH, UTS also showed a strong main effect (F(2, ≈7.76) = 66.52, p = 1.30 × 10⁻⁵)—8 s > 4 s and 8 s > 12 s (both p = 3.0 × 10⁻⁵), with 4 s not different from 12 s (p = 0.14). The pronounced quadratic trend (p = 1.08 × 10⁻⁸) indicates a peak at 8 s. In TOUGH-ABS, exposure time significantly increased UTS (F(2, ≈7.58) = 22.98, p = 0.000607): 8 s > 4 s (p = 0.00243), 12 s > 4 s (p = 0.00036), and 12 s > 8 s (p = 0.0165). The linear trend was significant (p = 3.75 × 10⁻⁶), and the quadratic term was not (p = 0.203), consistent with a monotonic increase.
Elongation (%) showed complementary but not identical patterns. For ABS, Welch ANOVA was significant (F(3, ≈8.16) = 14.08, p = 0.00138); post-hoc tests showed 4 s > 2 s (p = 0.0093), 12 s > 2 s (p = 0.0077) and 12 s > 4 s (p = 0.0093), whereas contrasts involving 8 s and 2 s (p = 0.590) and 4 s (p = 0.206) were not significant, but 12 s > 8 s (p = 0.0077). A positive linear trend (p = 1.70 × 10⁻⁴) and a significant quadratic term (p = 0.00419) yielded a U-shaped response with a shallow minimum near ~4.6 s and a strong rise by 12 s. For TOUGH, elongation also depended on time (F(3, ≈8.70) = 4.43, p = 0.037); 4 s > 2 s (p = 0.048) and 12 s > 2 s (p = 0.036), with other pairs not significant (all p ≥ 0.189). The linear trend was significant (p = 0.010) and the quadratic term was not (p = 0.598), indicating a modest monotonic increase. For ABS-TOUGH, elongation showed a robust time effect (F(2, ≈7.00) = 16.77, p = 0.00214)—12 s > 4 s and 12 s > 8 s (both p = 0.0048), whereas 4 s vs. 8 s was not significant (p = 0.583). Both linear (p = 5.26 × 10⁻⁴) and quadratic (p = 0.00102) terms were significant, again indicating a U-shaped profile with recovery at 12 s. For TOUGH-ABS, elongation rose monotonically with time (F(2, ≈7.58) = 98.87, p = 3.71 × 10⁻⁶): 8 s > 4 s (p = 0.0116), 12 s > 4 s (p = 1.4 × 10⁻⁶), and 12 s > 8 s (p = 0.0021); the linear trend was strongly positive (p = 1.66 × 10⁻⁷) and the quadratic term was not significant (p = 0.212).
Taken together, we see that exposure time is a statistically decisive factor for both strength and ductility. ABS and ABS-TOUGH exhibited peak UTS near 8 s and U-shaped elongation with large gains by 12 s, implying a strength–ductility trade-off that must be balanced in process selection. TOUGH and TOUGH-ABS showed progressive, largely monotonic improvements in both UTS (especially pronounced) and elongation as time increased to 12 s. Practically speaking, these results suggest targeting ~8 s to maximize UTS in ABS/ABS-TOUGH, whereas longer exposures up to 12 s are advantageous when prioritizing ductility in those systems and for maximizing both metrics in TOUGH/TOUGH-ABS.

3.4. Effect of Secondary Curing Time on Multi-Material Specimens

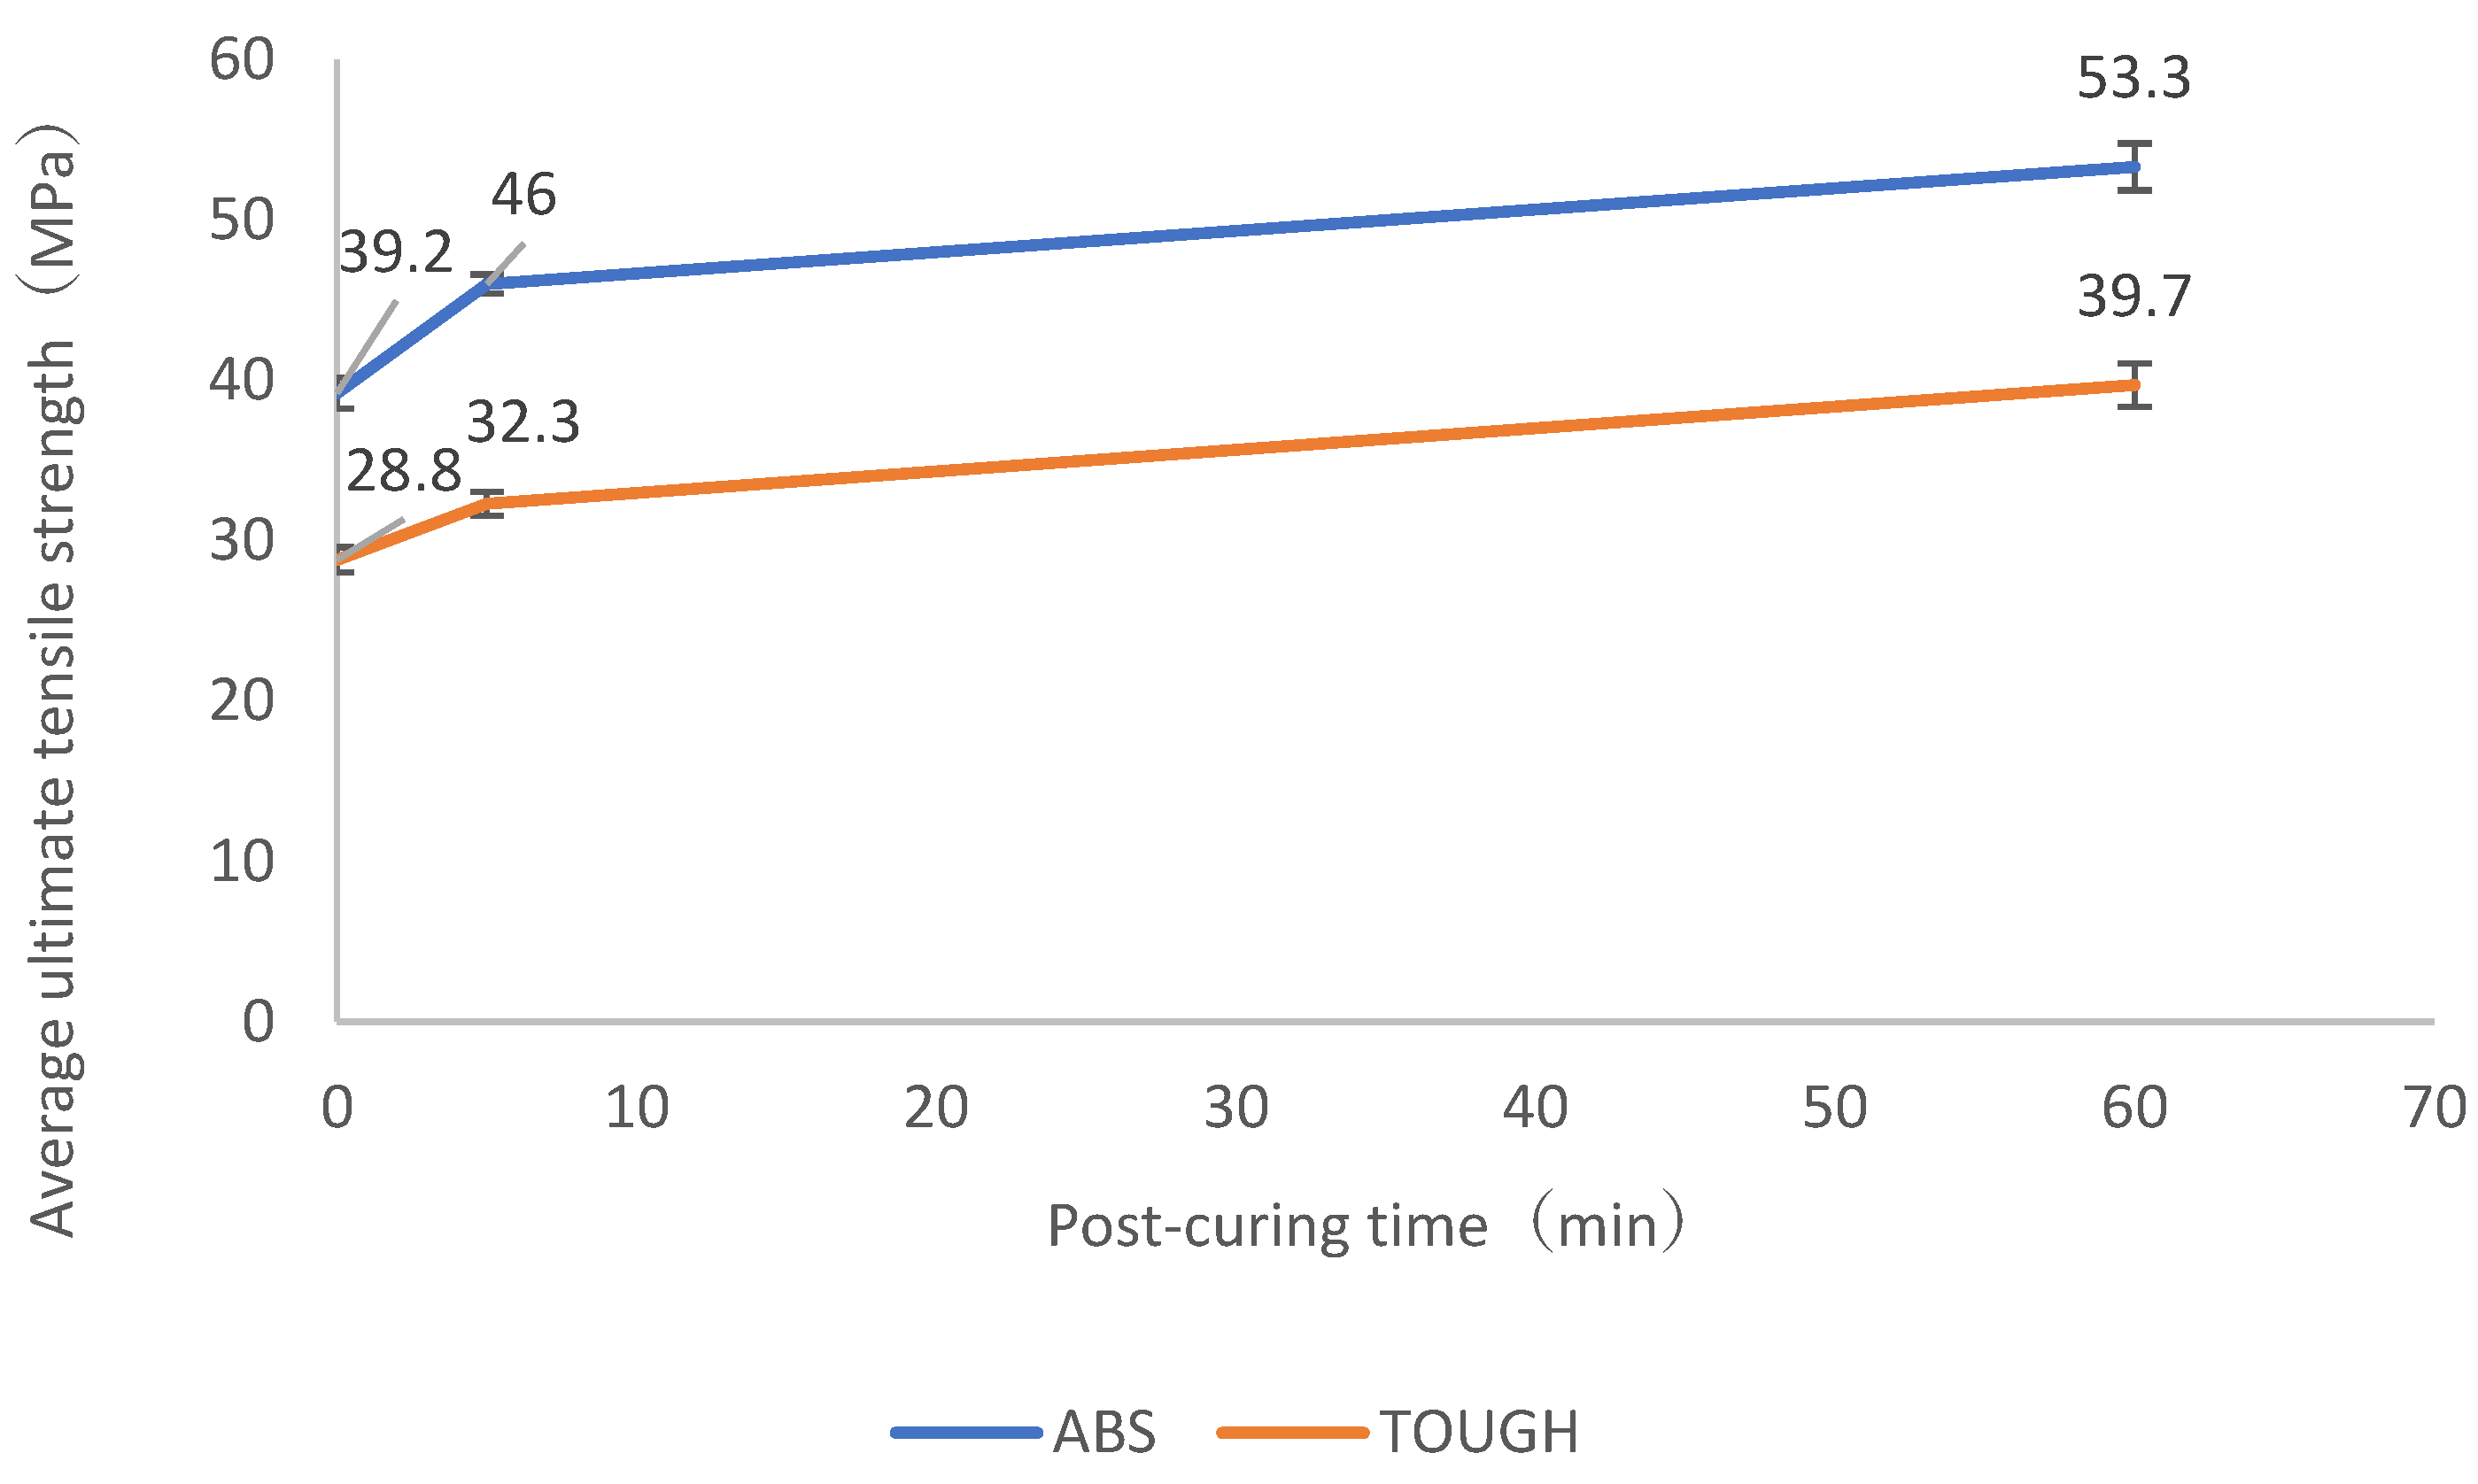
Figure 16 shows the relationship between exposure time and the average tensile strength of single material specimens. Secondary curing for 60 min increased the tensile strength of the ABS resin by 36.0% (approximately 14.1 MPa, from 39.2 MPa when uncured to 53.3 MPa after curing) and that of the TOUGH resin by 37.8% (approximately 10.9 MPa, from 28.8 MPa when uncured to 39.7 MPa after curing).
Using Welch’s one-way ANOVA, post-curing time (0, 5, 60 min) significantly affected ultimate tensile strength (UTS) for both ABS and TOUGH. For ABS, the mean UTS (95% CI) rose from 39.24 MPa (37.77–40.71) at 0 min to 46.02 MPa (45.10–46.94) at 5 min and 53.28 MPa (51.05–55.51) at 60 min; ANOVA: F(2, 7.19) = 107.52, p = 4.42 × 10⁻⁶. BH-adjusted Welch t-tests confirmed pairwise differences, as follows: 0 vs. 5 min p = 2.40 × 10⁻⁵, 0 vs. 60 min p = 5.60 × 10⁻⁶, 5 vs. 60 min p = 2.90 × 10⁻⁴; gains were +17% (5 vs. 0), +36% (60 vs. 0), and +16% (60 vs. 5). For TOUGH, the mean UTS increased from 28.82 MPa (27.62–30.02) to 32.26 MPa (31.14–33.38) and 39.70 MPa (37.64–41.76), with ANOVA results of F(2, 7.65) = 74.25, p = 9.75 × 10⁻⁶. TYhe pairwise BH-adjusted p-values were 0 vs. 5 min p = 4.00 × 10⁻⁴, 0 vs. 60 min p = 2.60 × 10⁻⁵, and 5 vs. 60 min p = 1.60 × 10⁻⁴, corresponding to +12%, +38%, and +23% increases, respectively. In conclusion, post-curing time had a robust, monotonic, and practically large positive effect on UTS in both materials; a 60 min post-curing time maximized tensile strength and is recommended when strength is the priority.
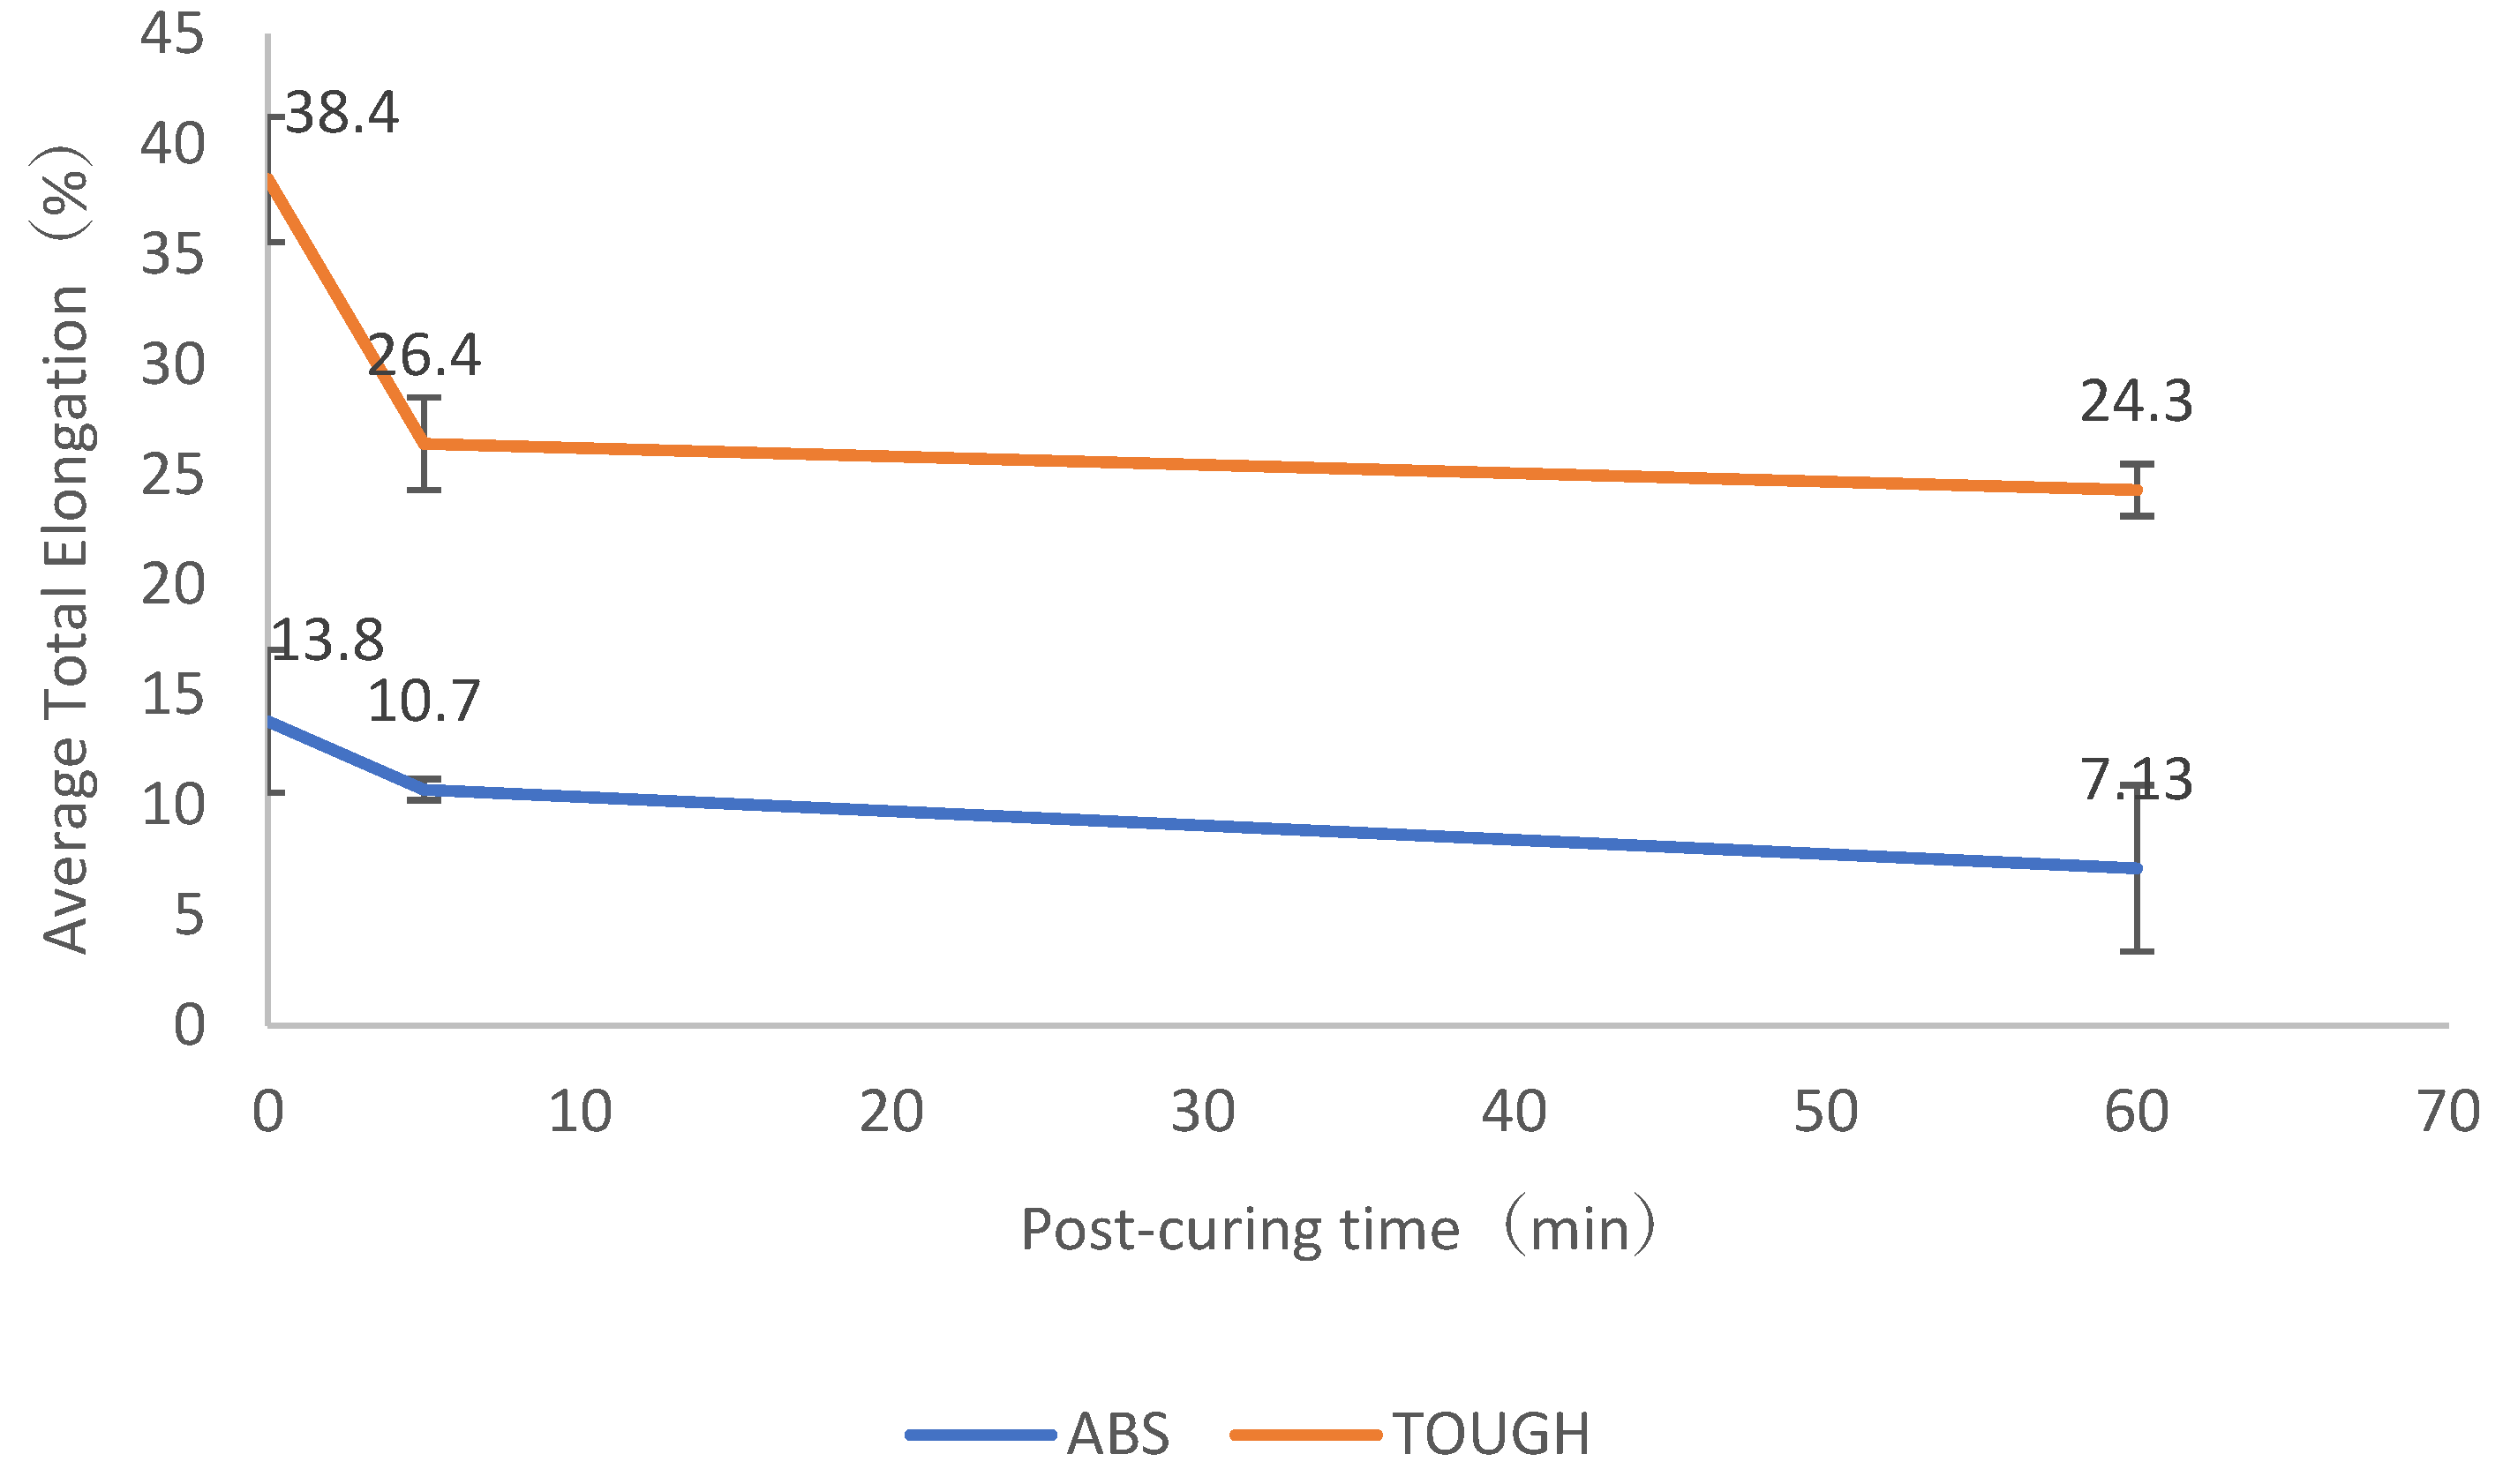
Figure 17 shows the relationship between secondary cure time and average elongation for single-material specimens. Elongation decreased by 48.3% for ABS and 36.3% for TOUGH after 60 min of secondary curing. The elongation decreased by 48.3% for ABS and by 36.7% for TOUGH after 60 min of secondary curing. The elongation of the TOUGH specimens decreased by 36.7% after 60 min of secondary curing.
Using Welch one-way ANOVA followed by Benjamini–Hochberg-adjusted pairwise Welch t-tests (n = 5 per group), we determined that post-curing time significantly affected total elongation for both materials. For ABS, the omnibus test was significant (F(2,≈7.05) = 8.94, p = 0.0116). Mean ± SD elongations were 13.80 ± 3.48% at 0 min, 10.67 ± 2.58% at 5 min, and 7.13 ± 1.44% at 60 min. Pairwise contrasts showed no difference between 5 min and 0 min (p = 0.148), a significant reduction at 60 min vs. 0 min (p = 0.028), and a trend for 60 min vs. 5 min (p = 0.052). Thus, ABS ductility decreased markedly by 60 min. For TOUGH, the omnibus test was also significant (F(2,≈5.53) = 20.46, p = 0.00278). Means were 38.38 ± 3.98% (0 min), 26.36 ± 0.59% (5 min), and 24.28 ± 4.61% (60 min). Pairwise tests indicated a large drop by 5 min (p = 0.0034) and a significant difference at 60 min vs. 0 min (p = 0.0027), whereas the 60 min vs. 5 min change was not significant (p = 0.372). In conclusion, post-curing substantially reduced elongation in both materials; for ABS, the significant loss appeared by 60 min, while for TOUGH most of the loss occurred by 5 min, with no clear additional decrease by 60 min.
Figure 18 shows the relationship between secondary cure time and average tensile strength for the multi-material specimen (ABS-TOUGH). As with the single-material specimens, there is a trade-off between tensile strength and elongation, as 60 min of secondary curing resulted in an 11% increase in tensile strength and a 43.4% decrease in elongation. The percentage increases and decreases in tensile strength and elongation were different compared to the single-material specimens, but showed similar trends.
Post-curing for 60 min significantly increased the ultimate tensile strength of the ABS-TOUGH specimens compared with no post-curing (45.06 ± 1.13 vs. 40.60 ± 2.24 MPa; Welch’s t-test, t ≈ 3.97, p = 0.0075; mean difference +4.46 MPa, 95%CI +1.70 to +7.22; Hedges’ g = 2.27). In contrast, the total elongation decreased markedly (3.85 ± 0.41% vs. 6.80 ± 0.77%; t ≈ −7.52, p = 2.66 × 10⁻⁴; mean difference −2.95%, 95%CI −3.90 to −1.99; g = −4.30). These results indicate a clear strength–ductility trade-off, as 60 min post-curing improved strength by ~11% at the expense of ~43% ductility.

4. Discussion

4.1. Comparison of Single-Material Specimens with Multi-Material and Adhesive Specimens

Figure 12 shows the average tensile strength of the single-material specimens, the multi-material specimens, and the adhesive specimens. There was no significant decrease in strength due to the use of multi-materials, suggesting that the tensile strength can be maintained if the bonding time is longer than a certain exposure time (8 s in this case). In addition, the tensile strength of TOUGH-ABS exceeded that of ABS-TOUGH at an exposure time of 12 s. This may be due to the fact that the tensile strength of the single-material ABS decreased at 12 s. Figure 13 shows the tensile strengths of the single-material specimens.
Figure 13 shows the average elongation of the single-material specimens and the multi-material and adhesive specimens. The multi-material specimen outperformed the adhesive at all exposure times, but it value was less than half that of the single-material specimen. This may be due to the load being concentrated on the bonding surface due to the reduction in area. In fact, warpage and stress concentration in multi-material specimens were observed in a study by Yazhou et al. [16]. In the context of multi-material specimens, there is a previous study in which the elongation was measured at the middle of each material [28]. However, the results of this study do not represent the strength of the bond plane because the fracture surface was not the bond plane. Therefore, it should be stated that the results of this study do not provide an index of elongation. The results for both tensile strength and elongation show that the order of printing changes the values. As shown in the stress distribution and strain contour maps given in the study by Yazhou et al. [16], the stress distribution and elongation distribution are different and non-uniform at the top and bottom of the specimen. Therefore, it is considered that the tensile strength and elongation differ depending on the order of printing due to the non-uniformity of the load distribution caused by the differences in physical properties affected by the first layer of resin.

4.2. Effect of Exposure Time on Multi-Material Specimens from the Viewpoint of Single-Material Specimens

Figure 14 shows the experimental results of tensile strength when the exposure time was varied from 2 to 12 s. The results show that the average tensile strength basically increased as the exposure time increased. According to previous studies, the average tensile strength basically tends to increase with exposure time, as in the present test. For example, according to the study by Pazhamannil et al. [29], the average tensile strength continued to increase with exposure time between 2 s and 8 s. Temiz’s study [30] and Bazyar et al.’s study [31] also showed increases in average tensile strength versus exposure time, but stagnation and decreases were observed at exposure times of 15 s and 28 s, respectively. Therefore, it is considered that the average tensile strength decreases after a certain long exposure time, depending on the resin used. However, some studies have shown no relationship between exposure time and tensile strength [32]. The maximum exposure time in this study was 12 s. If the exposure time is further increased, there is a possibility that the tensile strength could increase again, as in the study by Bazyar and colleagues [31]. However, the recommended exposure time for current 3D printers is about 4 s at most [33], and in addition to this, 8 s was sufficient for printing when creating multi-materials in this study. The same is expected to be true for multi-material specimens. This was also confirmed in the study by Xinghong et al. [27], in which only the bonding surface was exposed to long-term exposure. The tensile strength increased with exposure time, showing a similar behavior. Yazhou et al. [16] also observed an increase and then a decrease in tensile strength with additional exposure time for multi-material specimens, similar to what was seen in the present experiment. Younghun et al. [26] confirmed that the increase in strength with increasing UV irradiation time was due to the increase in the formation of crosslink networks by UV irradiation. This study also mentioned the induction of brittleness and the decrease in mechanical strength due to overcuring. Although these studies were conducted on DLP-type specimens, it is considered that the same mechanism and effect as in the LCD type specimens are responsible for these results, since the materials and UV curing are the same in the LCD-type specimens. In other words, the tensile strengths of both the multi-material and single-material specimens increased and then decreased with exposure time, although the timing of the increase was different with respect to the exposure time.
Figure 15 shows the results for exposure time and average elongation. The elongation tends to increase with exposure time. In contrast, the study by Bazyar et al. [31] does not summarize the elongation results of the actual test, but it does show a stress–strain curve. According to the results, the elongation begins to decrease after an exposure time of 16 s, but increases up to that point. This suggests that the elongation of the resin in this study may decrease if the exposure time is further increased (i.e., the behaviors seen in the previous study and this study will be similar). However, elongation data are scarce, and it is difficult to make a judgment based on this small number of cases. Although a decrease from an increase in elongation was observed for multi-material specimens in the study by Yazhou and colleagues [16], this cannot be applied to TOUGH-ABS, which only shows an increase in elongation, and thus cannot be explained in a unified manner. Similarly, elongation data are scarce for multi-material specimens, and further research is warranted.

4.3. Effect of Secondary Curing Time on Multimaterial Specimens

Figure 16 and Figure 17 show the tensile strength and elongation as a function of secondary curing time for a single-material specimen. The experimental results of this study and previous studies confirm that changes in tensile strength and elongation with secondary curing time are different from those with varying exposure times, and that a tradeoff between strength and elongation occurs. In the experimental results of a previous study [29], an increase in tensile strength was observed with an increase in secondary curing time. This change slowed down as the secondary curing time increased [34]. Similar results showing decreasing elongation with increasing secondary curing time were derived in a previous study [35]. Some of the previous studies [35] used a Stereolithography Apparatus (SLA)-type printer, which is different from the LCD type among the light 3D printers, but since the materials used and the UV curing method are the same, the mechanical properties and mechanism of the reaction in the resin are considered to be similar. This is very consistent with the results of this experiment.

4.4. Actual Use

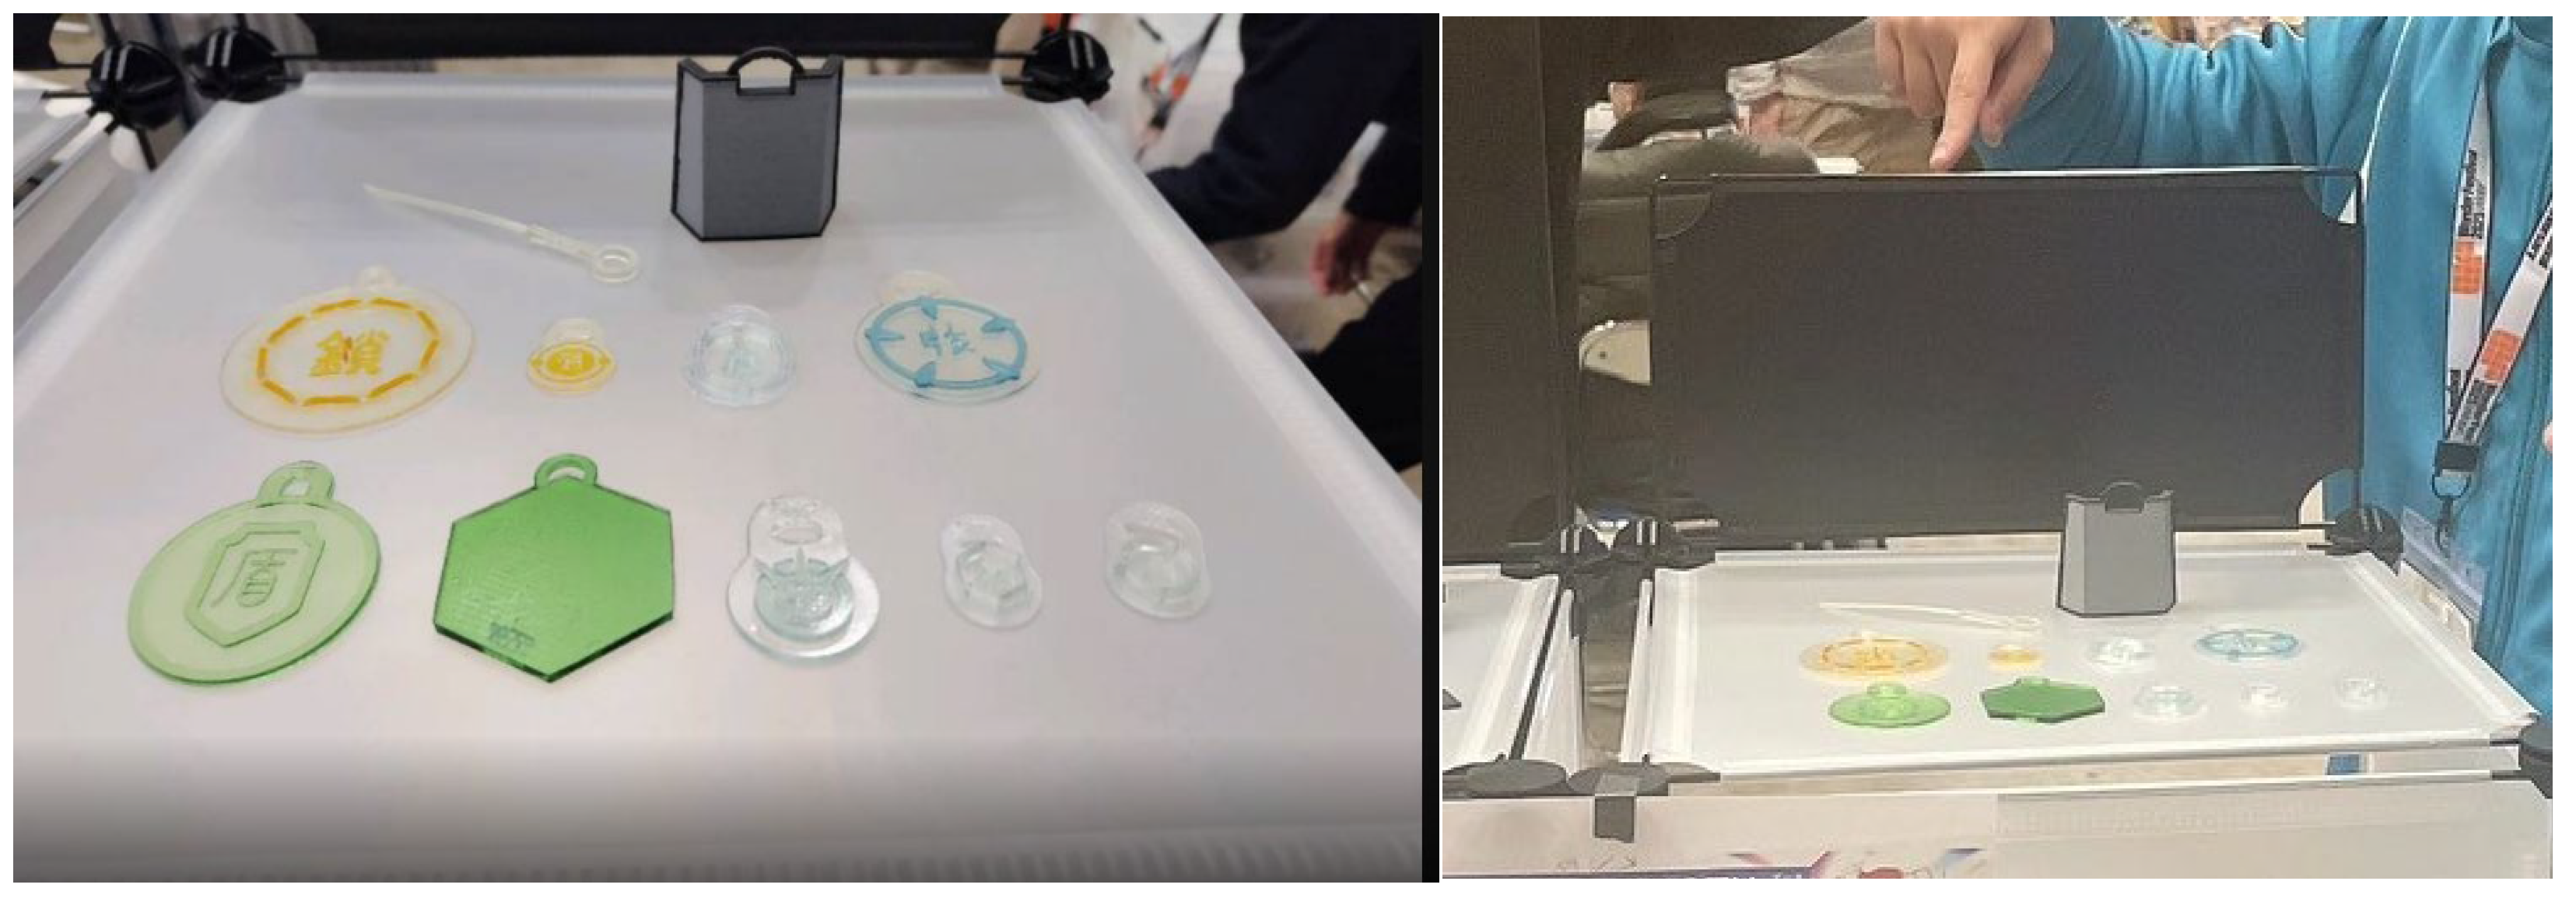
Using the method developed in this study (material substitution), actual mass production (Figure 19) was carried out. The exhibition and sales took place at Makuhari Messe in Japan, with day-of licenses granted at Wonder Festival 2024 Summer and Wonder Festival 2025 Winter. Production utilized two types of clear resin. The items were produced as “Trigger” keychains by World Trigger. The irradiation time was set to 3.2 s. This method was chosen mainly to achieve color variation without the need for painting. In the context of practical use, dimensional shrinkage and durability are the main concerns. However, so far, there have been no reports of defective products from the buyer. In some cases, chipping of the first layer or warping after secondary curing was observed, but since these issues were also seen in items made from single materials, it is considered that they are not unique to multi-material production.

5. Limitation and Future Trends

In this study, various results were obtained. However, the areas covered in this study, which serves as a pilot study, are by no means extensive. Furthermore, this is a field in which possibilities are still being explored. The following limitations can be considered for this study:
  • There is a shortage of materials that can be used for combinations. In particular, for extremely soft materials, the tensile test itself could not be conducted under the current conditions, so it is necessary to reconsider the method from scratch;
  • When the exposure time was 2 s, the fact that printing itself did not occur could pose a significant practical concern. Regarding dimensional shrinkage, although it may be possible to address this by adjusting the exposure time, further verification is necessary;
  • Some differences from previous studies were observed regarding the behavior in response to certain exposure times and post-curing times. Additionally, for practical applications, extensive testing and accumulation beyond just tensile tests are necessary—for example, pinpoint bond surface failure. Tests that examine the distribution of elongation are also required;
  • This time, we combined only two types of materials into two layers. Further multilayering and the use of multiple materials are necessary;
  • It is considered that there are not enough tests to elucidate the chemical mechanism. Further testing with additional equipment is necessary.
On the other hand, the following scenarios can be considered in the future.
  • The material scope of this study includes all resins that cure at 405 nm. In addition to the mechanical properties of single materials, it is necessary to consider the conditions for multi-materials and the mechanical properties after output. In this regard, the introduction of machine learning [36] may prove to be effective;
  • There is an increasing demand for environmental performance these days [37]. Improvements can also be considered, such as incorporating biodegradable resin, creating circuits, and enhancing the removal of support material traces using water-soluble support materials;
  • This study focuses on resins, but materials other than resin can also be considered. For example, in the dental field, photopolymerization-type 3D printers are used, and sports mouthguards made from multiple materials have been reported [38]. It seems feasible to apply this approach in such fields and for models. However, when combined with metals and the like, issues such as thermal expansion are thought to arise [39]. Additionally, it is considered that digital gradient material placement and changing only part of the material in the same layer are also possible.

6. Conclusions

We investigated whether personal resins can be used in personal LCD 3D printers that will be able to print multi-material fabrications in the future by conducting actual printing and tensile tests. In addition, tensile tests were conducted on the strength and elongation of single materials by varying the exposure time and secondary curing, which was largely based on experience. Finally, a comparison was made between single materials and multi-materials. As a result, the following excellent results were obtained in this paper:
  • The multi-material specimens required a longer exposure time (8 s in this experiment) for complete printing than the single-material specimens. In addition, all specimens showed a dimensional reduction at the bonding surface. Although the dimensional reduction is a problem, it is thought that, in the actual development of a multi-material housing, it can be handled by lengthening the exposure time for only the bonding surface;
  • The single-material specimens showed a relationship between exposure time and tensile strength and elongation. Similarly, the multi-material specimens showed an increase in tensile strength followed by a decrease with increasing exposure time. However, further research on elongation is warranted;
  • The tensile strength of the multi-material specimens was found to be more than 90% of the weak tensile strength of the single-material specimens. Elongation was less than 55% of that of the single-material specimen. The tensile strength of the resin exceeded the lowest official value of the resin, and it is considered that there no problem would be met when using the resin for personal use in terms of strength;
  • The effect of secondary hardening was observed in the multi-material specimens, similar to that of the single-material specimens. Tensile strength and elongation have a trade-off relationship, as in the case of the single-material specimens. This suggests that the same post-treatment can be used as for the single-material specimens.

Supplementary Materials

The following supporting information can be downloaded at: https://www.mdpi.com/article/10.3390/jmmp9100332/s1.

Author Contributions

Conceptualization, S.S.; data curation, S.S.; formal analysis, S.S.; funding acquisition, S.S. and S.O.; investigation, S.S.; methodology, S.S.; project administration, S.S. and S.O.; resources, S.S., T.A., H.T. and M.S.; software, S.S., M.I. and H.T.; supervision, S.S., T.A., Y.A. and S.O.; validation, S.S. and M.I.; visualization, S.S.; writing—original draft, S.S. and M.I.; writing—review and editing, S.S., M.I. and S.O. All authors have read and agreed to the published version of the manuscript.

Funding

This research received no external funding.

Institutional Review Board Statement

Not applicable.

Data Availability Statement

The raw tensile test data, specimen CAD/STL files, and slicing/exposure parameters that support the findings of this study are available from the corresponding author upon reasonable request. The restriction is due to the fact that these files are directly tied to ongoing follow-up experiments, and time-sensitive technical details are being consolidated to preserve the integrity of the continuing study. A minimal reproducible dataset (aggregated results tables and representative images/condition sheets) is included in the Supplementary Materials.

Acknowledgments

The study was conducted at the tensile testing facility of the National Institute of Technology, Kisarazu College Department of Mechanical Engineering. Preparation for printing the test pieces was carried out at the Chiba University Medical Engineering Frontier Center. Additional experimental verification was conducted using resources at the University of Tokyo. This research was conducted during a period supported by IGPEES and the University of Tokyo WINGS Program. This article is a revised and expanded version of a paper entitled Bond strength measurement of composite materials using an optical 3D printer (LCD type), which was presented at [The Japan Society of Mechanical Engineers Kanto Branch 31st General Meeting and Lecture, Waseda University and 2024/03/13–2024/03/14]. The first author, a student researcher with limited personal resources, is grateful to Kunitoshi Uruma for a short-term personal loan that covered publication-related expenses. The supporter had no role in the conduct of the study or the preparation of the manuscript. The authors would like to express their sincere gratitude to Utaka Kagawa and Taito Koeda for their generous support and assistance during the course of this study. Their contributions, while not directly related to authorship, were invaluable to the progress of the research. We thank Kanato Imai and the University of Tokyo Model Club for their generous cooperation with our Wonder Festival exhibition and sales activities. We also thank the administrative staff of the first author’s affiliated institutions for their kind assistance with logistics and paperwork. The above contributions do not imply authorship; any remaining errors are our own. We also thank the anonymous reviewers for their constructive comments, which helped us to improve the clarity and quality of the manuscript.

Conflicts of Interest

The authors declare no conflicts of interest.

Abbreviations

The following abbreviations are used in this manuscript:
AMAdditive manufacturing
3DP3D Printer
FDMFused deposition modeling
FFFFused filament fabrication
SLAStereo lithography apparatus
LCDLiquid crystal display
DLPDigital light processing

References

  1. Kalender, M.; Kılıç, S.E.; Ersoy, S.; Bozkurt, Y.; Salman, S. Additive Manufacturing and 3D Printer Technology in Aerospace Industry. In Proceedings of the 2019 9th International Conference on Recent Advances in Space Technologies (RAST), Istanbul, Turkey, 1–14 June 2019; pp. 689–694. [Google Scholar]
  2. Wohlers Admin. Wohlers Report 2013 Reveals Continued Growth in 3D Printing and Additive Manufacturing. Wohlers Assoc. 2013. Available online: https://wohlersassociates.com/press-releases/wohlers-report-2013-reveals-continued-growth/ (accessed on 3 October 2025).
  3. 3D Printing Trend Report 2024. Available online: https://www.protolabs.com/resources/guides-and-trend-reports/3d-printing-trend-report/ (accessed on 22 February 2025).
  4. ictrehab 3D Printed Assistive Device Design Contest 2024 Related Information. ICT Rehabilitation Research Association.
  5. Ngo, T.D.; Kashani, A.; Imbalzano, G.; Nguyen, K.T.Q.; Hui, D. Additive manufacturing (3D printing): A review of materials, methods, applications and challenges. Compos. Part B Eng. 2018, 143, 172–196. [Google Scholar] [CrossRef]
  6. Katheng, A.; Prawatvatchara, W.; Chaiamornsup, P.; Sornsuwan, T.; Lekatana, H.; Palasuk, J. Comparison of mechanical properties of different 3D printing technologies. Sci. Rep. 2025, 15, 18998. [Google Scholar] [CrossRef] [PubMed]
  7. Contract Signed with 3D Printer Manufacturer “Bambu Lab,” Which Is Taking the Market by Storm; Sales to Begin Domestically. Also Exhibiting at TCT Japan. Available online: https://prtimes.jp/main/html/rd/p/000000095.000030909.html (accessed on 22 February 2025).
  8. Elegoo Mars 5 Ultra—Best Beginner’s Dream Resin 3D Printer. Available online: https://us.elegoo.com/products/mars-5-ultra-9k-7inch-monochrome-lcd-resin-3d-printer (accessed on 23 March 2025).
  9. Hwang, S.; Lee, J.; Lee, S.; Hong, D.; Park, M. Development of DLP 3D Printer with Multiple Composite Materials. J. Korean Soc. Precis. Eng. 2020, 37, 381–388. [Google Scholar] [CrossRef]
  10. Park, S.-W.; Jung, M.-W.; Son, Y.-U.; Kang, T.-Y.; Lee, C. Development of Multi-Material DLP 3D Printer. J. Korean Soc. Manuf. Technol. Eng. 2017, 26, 100–107. [Google Scholar] [CrossRef]
  11. Multi-Material Microstereolithography Using a Palette with Multicolor Photocurable Resins. Available online: https://opg-optica-org.utokyo.idm.oclc.org/ome/fulltext.cfm?uri=ome-10-10-2522&id=439721 (accessed on 22 February 2025).
  12. Quero, R.F.; de Jesus, D.P.; Silva, J.A.F. da Simple modification to allow high-efficiency and high-resolution multi-material 3D-printing fabrication of microfluidic devices. Lab. Chip 2023, 23, 3694–3703. [Google Scholar] [CrossRef]
  13. Multi-Material Stereolithography—ScienceDirect. Available online: https://www-sciencedirect-com.utokyo.idm.oclc.org/science/article/pii/S0924013610003043 (accessed on 22 February 2025).
  14. Tsolakis, I.A.; Papaioannou, W.; Papadopoulou, E.; Dalampira, M.; Tsolakis, A.I. Comparison in Terms of Accuracy between DLP and LCD Printing Technology for Dental Model Printing. Dent. J. 2022, 10, 181. [Google Scholar] [CrossRef]
  15. Hyeonwoo, H.; Jeon, S.J. Digital light processing 3D printing of multi-materials with improved adhesion using resins containing low functional acrylates. Korean J. Chem. Eng. 2022, 39, 451–459. [Google Scholar] [CrossRef]
  16. Li, Y.; Yang, Q.; Wang, F.; Jian, L.; Wang, Q.; Xiao, J.; Wu, T.; Li, D. Research on the Morphology and Mechanical Property of Bonding Interfaces Fabricated by Multimaterial Digital Light Processing. Addit. Manuf. Front. 2025, 4, 200200. [Google Scholar] [CrossRef]
  17. Salih, R.M.; Kadauw, A.; Zeidler, H.; Aliyev, R. Investigation of LCD 3D Printing of Carbon Fiber Composites by Utilising Central Composite Design. J. Manuf. Mater. Process. 2023, 7, 58. [Google Scholar] [CrossRef]
  18. Bergoglio, M.; Rossegger, E.; Schlögl, S.; Griesser, T.; Waly, C.; Arbeiter, F.; Sangermano, M. Multi-Material 3D Printing of Biobased Epoxy Resins. Polymers 2024, 16, 1510. [Google Scholar] [CrossRef]
  19. Palavicini, J.; Quin, S.L.; Zakkour, W.; Zakkour, K.; Manafi Varkiani, S.; Xu, X.; Lawson, N.C.; Nejat, A.H. Bond Strength of Reline Materials to 3D-Printed Provisional Crown Resins. Polymers 2023, 15, 3745. [Google Scholar] [CrossRef]
  20. Anycubic Flexible Tough Resin: Durable Flexibility for Robust 3D Prints. Available online: https://store.anycubic.com/products/uv-tough-resin (accessed on 11 January 2025).
  21. Anycubic Resin User Manual & MSDS|ANYCUBIC 3D Printing. Available online: https://store.anycubic.com/pages/resin-user-manual (accessed on 11 January 2025).
  22. Elegoo Resin MSDS. Available online: https://jp.elegoo.com/blogs/3d-printing/elegoo-resin-sds (accessed on 11 January 2025).
  23. Hozdić, E. Characterization and Comparative Analysis of Mechanical Parameters of FDM- and SLA-Printed ABS Materials. Appl. Sci. 2024, 14, 649. [Google Scholar] [CrossRef]
  24. Japanese Standards Association JSA GROUP Webdesk. Available online: https://webdesk.jsa.or.jp (accessed on 23 March 2025).
  25. Shimizu, S.; Aoba, T.; Inada, M.; Orita, S. Bond strength measurement of composite materials using an optical 3D printer (LCD type). Proc. Conf. Kanto Branch 2024, 2024.30, 14C03. [Google Scholar] [CrossRef]
  26. Lee, Y.; Lee, S.; Zhao, X.G.; Lee, D.; Kim, T.; Jung, H.; Kim, N. Impact of UV curing process on mechanical properties and dimensional accuracies of digital light processing 3D printed objects. Smart Struct. Syst. 2018, 22, 161–166. [Google Scholar] [CrossRef]
  27. Deng, X.; Zhang, G.; Mo, Y.; Huang, Z.; Zhou, D.; Qiao, J.; Li, L. Simultaneously improving fabrication accuracy and interfacial bonding strength of multi-material projection stereolithography by multi-step exposure. Int. J. Smart Nano Mater. 2024, 15, 387–404. [Google Scholar] [CrossRef]
  28. Kowsari, K.; Akbari, S.; Wang, D.; Fang, N.X.; Ge, Q. High-Efficiency High-Resolution Multimaterial Fabrication for Digital Light Processing-Based Three-Dimensional Printing. 3D Print. Addit. Manuf. 2018, 5, 185–193. [Google Scholar] [CrossRef]
  29. Pazhamannil, R.V.; Rajeev, A.; Govindan, P.; Edacherian, A. Experimental Investigations into the Effects of Process Parameters and UV Curing on the Tensile Strength of Projection Based Stereolithography. Strength Mater. 2022, 54, 483–492. [Google Scholar] [CrossRef]
  30. Temiz, A. The Effects of Process Parameters on Tensile Characteristics and Printing Time for Masked Stereolithography Components, Analyzed Using the Response Surface Method. J. Mater. Eng. Perform. 2024, 33, 9356–9365. [Google Scholar] [CrossRef]
  31. Bazyar, M.M.; Tabary, S.A.A.B.; Rahmatabdi, D.; Mohammadi, K.; Hashemi, R. A novel practical method for the production of Functionally Graded Materials by varying exposure time via photo-curing 3D printing. J. Manuf. Process. 2023, 103, 136–143. [Google Scholar] [CrossRef]
  32. Sukindar, N.A.; Khata, M.T.A.H.M.; Yasir, A.S.H.M.; Zawawi, M.F.; Kamaruddin, S.; Aziz, A.A. Effect of the Printing Parameters on the Tensile Strength and Surface Roughness of a Photopolymer Resin Using DLP 3D Printing. Malays. J. Microsc. 2024, 20, 189–200. [Google Scholar]
  33. List of Specially-Made Resin Exposure Times by Printer—SK Honpo. Available online: https://skhonpo.com/pages/exposuretime (accessed on 4 March 2025).
  34. How Mechanical Properties of Stereolithography 3D Prints are Affected by UV Curing. Available online: https://www.google.com/search?q=How+Mechanical+Properties+of+Stereolithography+3D+Prints+are+Affected+by+UV+Curing&oq=How+Mechanical+Properties+of+Stereolithography+3D+Prints+are+Affected+by+UV+Curing&gs_lcrp=EgZjaHJvbWUqBggAEEUYOzIGCAAQRRg70gEHNTQ5ajBqN6gCALACAA&sourceid=chrome&ie=UTF-8#vhid=zephyr:0&vssid=atritem-https://www.dynamism.com/download/2016/UV%2520Postcure%2520white%2520paper.pdf?srsltid%3DAfmBOoorKXvX6HO1Te_ANDPXrQaW-6hO3e8WP4NqHmIjEl4mbNuDj2HA (accessed on 13 June 2025).
  35. Štaffová, M.; Ondreáš, F.; Svatík, J.; Zbončák, M.; Jančář, J.; Lepcio, P. 3D printing and post-curing optimization of photopolymerized structures: Basic concepts and effective tools for improved thermomechanical properties. Polym. Test. 2022, 108, 107499. [Google Scholar] [CrossRef]
  36. Integration of Machine Learning and Digital Twin in Additive Manufacturing of Polymeric-Based Materials and Products|Progress in Additive Manufacturing. Available online: https://link-springer-com.utokyo.idm.oclc.org/article/10.1007/s40964-025-01257-4 (accessed on 16 September 2025).
  37. State-of-the-Art Review on Fused Deposition Modeling (FDM) for 3D Printing of Polymer Blends and Composites: Innovations, Challenges, and Applications|The International Journal of Advanced Manufacturing Technology. Available online: https://link-springer-com.utokyo.idm.oclc.org/article/10.1007/s00170-024-14820-0 (accessed on 16 September 2025).
  38. Unkovskiy, A.; Huettig, F.; Kraemer-Fernandez, P.; Spintzyk, S. Multi-Material 3D Printing of a Customized Sports Mouth Guard: Proof-of-Concept Clinical Case. Int. J. Environ. Res. Public. Health 2021, 18, 12762. [Google Scholar] [CrossRef] [PubMed]
  39. Ogasawara, T.; Arai, N.; Fukumoto, R.; Ogawa, T.; Yokozeki, T.; Yoshimura, A. Titanium alloy foil-inserted carbon fiber/epoxy composites for cryogenic propellant tank application. Adv. Compos. Mater. 2014, 23, 129–149. [Google Scholar] [CrossRef]
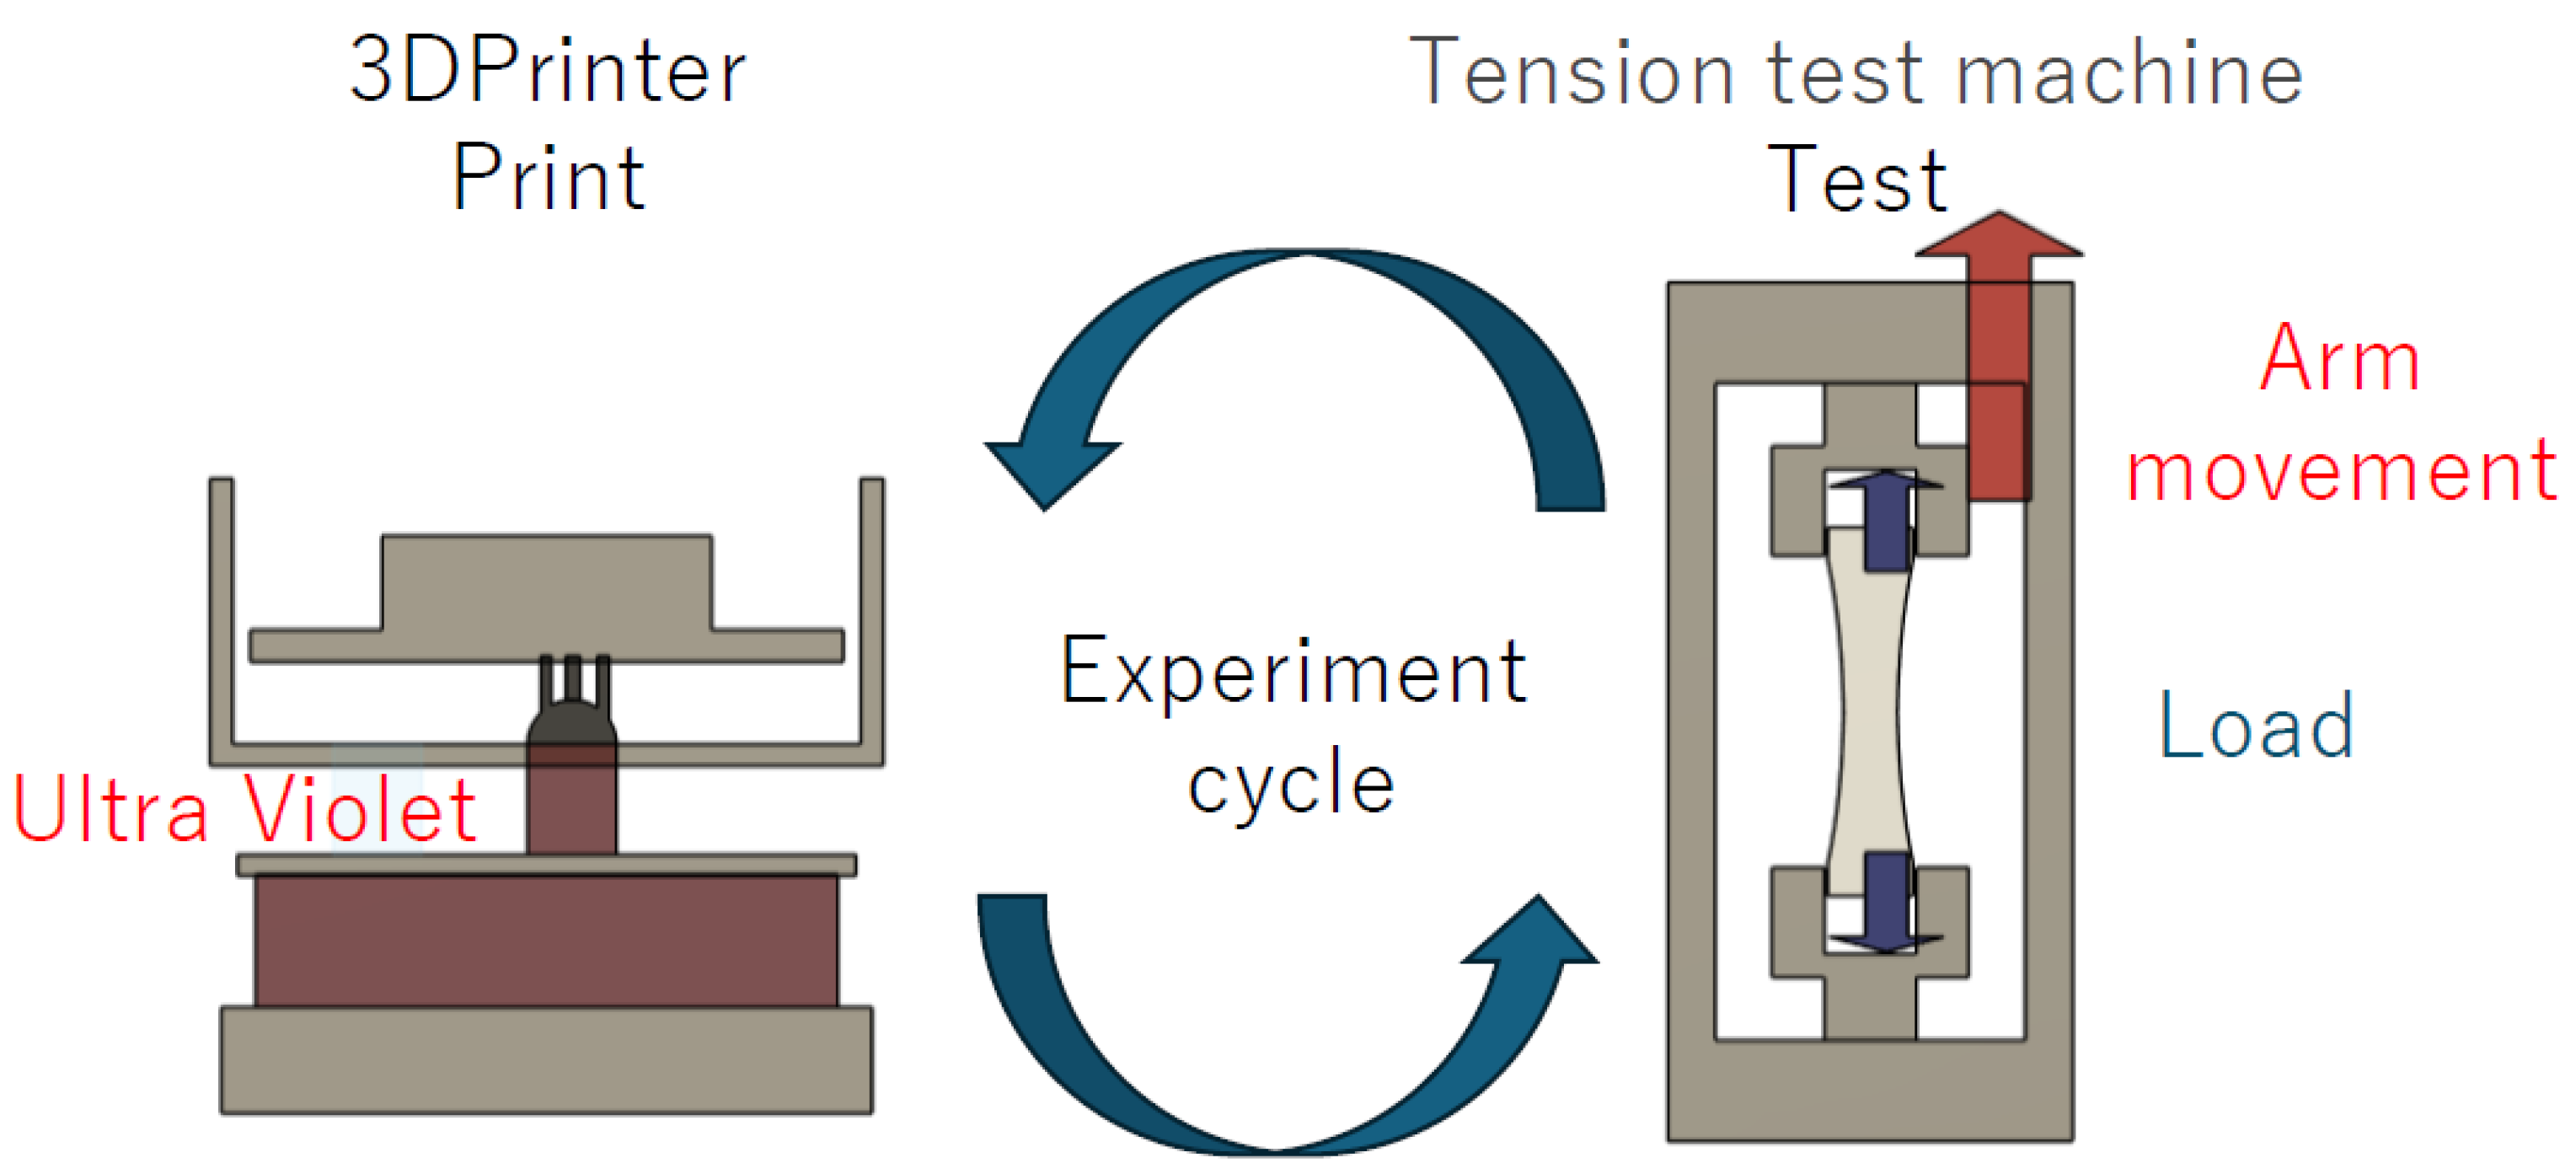
Figure 1. A conceptual diagram of 3D printing and tensile testing using a tensile testing machine.
Jmmp 09 00332 g001
Figure 2. A conceptual diagram of multi-materials.
Jmmp 09 00332 g002
Figure 3. Radiation dose map (Mars4 Ultra).
Jmmp 09 00332 g003
Figure 4. Dimensions of scaled test specimens.
Jmmp 09 00332 g004
Figure 5. Tensile test procedure.
Jmmp 09 00332 g005
Figure 6. Appearance of the printed test piece.
Jmmp 09 00332 g006
Figure 7. Appearance of necking.
Jmmp 09 00332 g007
Figure 8. Fracture appearance in the ABS test specimens.
Jmmp 09 00332 g008
Figure 9. Fracture appearance of TOUGH test specimens.
Jmmp 09 00332 g009
Figure 10. Fracture appearance of ABS-TOUGH test specimens.
Jmmp 09 00332 g010
Figure 11. Fracture appearance of TOUGH-ABS test specimens.
Jmmp 09 00332 g011
Figure 12. Average tensile strengths of single-material specimens, multi-material specimens, and adhesive-bonded specimens.
Jmmp 09 00332 g012
Figure 13. Average elongation of single-material specimens, multi-material specimens, and adhesive-bonded specimens.
Jmmp 09 00332 g013
Figure 14. The relationship between exposure time and average tensile strength in multi-material specimens.
Jmmp 09 00332 g014
Figure 15. The relationship between exposure time and average elongation in multi-material specimens.
Jmmp 09 00332 g015
Figure 16. The relationship between secondary curing time and average tensile strength in single-material specimens.
Jmmp 09 00332 g016
Figure 17. The relationship between secondary curing time and average elongation in single-material specimens.
Jmmp 09 00332 g017
Figure 18. The relationship between secondary curing time and average tensile strength in multi-material specimens.
Jmmp 09 00332 g018
Figure 19. A look at the exhibit of works created using this method (World Trigger, Trigger). The bottom nine were made using the method of this experiment.
Jmmp 09 00332 g019
Table 1. Resin specifications.
Resin NameManufacturePublished Tensile Strength
(MPa)
Abbreviation Used in This StudyExposure Time (s)
ABS-Like ResinElegoo
(Shenzhen, China)
39.39 ± 10%ABS2, 4, 8, 12
Tough ResinAnycubic
(Shenzhen, China)
35~45TOUGH2, 4, 8, 12
Table 2. Print settings.
ItemValue
Layer height (mm)0.050
Number of bottom layers6
Exposure time (s)2, 4, 8, 12
Bottom layer exposure time (s)60
Lifting speed of the bottom layers(mm/min)60, 0
Lifting distance (mm)9
Retraction speed (s)6.390
Bottom light-off delay (s)0.000
Standard light-off delay (s)0.000
Bottom lift acceleration (mm/s2)0.000
Standard lift acceleration (mm/s2)0.000
Bottom retraction acceleration (mm/s2)0.000
Standard retraction acceleration (mm/s2)0.000
Bottom lift speed (mm/min)2.500 ± 2.500
Standard lift speed (mm/min)3.500 ± 3.500
Bottom retract speed (mm/min)3.500 ± 3.500
Standard retract speed (mm/min)7.000 ± 23.000
Lift speed (mm/min)73.000 ± 23.000
Retract speed (mm/min)73.000 ± 23.000
Bottom lift height (mm)2.500 ± 2.500
Table 3. Shrinkage dimension.
Dimension 1 (μm)Dimension 2 (μm)
ABS-TOUGH34.610.6
TOUGH-ABS52.825.8
Disclaimer/Publisher’s Note: The statements, opinions and data contained in all publications are solely those of the individual author(s) and contributor(s) and not of MDPI and/or the editor(s). MDPI and/or the editor(s) disclaim responsibility for any injury to people or property resulting from any ideas, methods, instructions or products referred to in the content.