1. Introduction
Downtime, that is, the period of time during which critical machines or processes are unavailable, has a great impact in manufacturing production. An accurate computation of the downtime–related costs is difficult, but the following expense sources are typically recognised: direct costs, such as labour and material; indirect costs, such as the impact of stopping and restarting the production as well as the non–realized revenue. For instance, ref. [
1] surveyed Swedish firms in 2014, and the costs considered could reach up to 23.9% from the total manufacturing cost ratio and 13.3% from planned production time.
At the same time, there is a clear trend in the industry towards increasing the number of installed sensors. According to the survey presented by Plant Engineering in 2021 [
2], 36% of the surveyed plants planned to implement or increase investment in sensors and/or remote monitoring. It is expected that the inclusion of these sensors will provide a clear benefit in the following aspects: enable predictive maintenance, insights or/and analytics (according to 66% of the respondents), improve equipment effectiveness (according to 55% of respondents), and utilize data over instinct to improve uptime and meet production goals (according to 53% of the respondents). In such a scenario, data–driven models are effective tools that could turn the data recorded by the sensors into beneficial insights that could improve production and decrease downtime.
This work focuses on the downtime reduction of tread cutting blades installed in a tyre manufacturing plant. There is a lack of literature addressing the specific problem of a circular cutting system used on rubber. Most existing studies on circular saw modelling and wear detection focus on wood sawing [
3], with fewer works available on cutting other materials, such as rocks [
4] or metal [
5]. In general, the works trying to determine the predominant factors on wood cutting and wear formation tend to be validated on a lab set–up, and the results regarding the most prominent factors affecting the cutting/wear formation are ambiguous [
3]. At the same time, the works reporting wear evolution tend to show monotonic and almost linear wear increase in wood cutting [
6,
7] as well as rock [
4] and aluminium [
5] cutting. In the previous works, the main factor affecting the wear formation is either the material of the workpiece or the physical properties of the cutting tool. Considering the previous, in the work presented by [
8] it is suggested that, in an industrial scenario, the most predominant aspect could be considered the material properties of the workpiece.
In industrial scenarios in which aging or wearing estimations are required and failure data is available, survival–type models, such as the Weibull model, that can be used for complex failure datasets [
9] are quite extensive. However, given that research suggest that the reliability of a piece of equipment or system is greatly affected by operating conditions [
10], those models can be further improved by using exogenous factors or covariates in case there is existing additional information that could be used for a more accurate modelling.
Regarding how to provide operators with asset life–expectancy information, the Health Index (HI) is a popular tool in the industry. HI is a practical approach that combines the results of operating observations, field inspections, and on–site and laboratory testing in order to provide an objective and quantitative index that informs the operator of the overall health of the asset [
11,
12]. Furthermore, HI is an excellent indicator in reflecting the results of optimal balance among capital investment, cost of the asset, and operating maintenance.
There are numerous works in the literature that discuss data models and how to develop them. However, few explore the aspects related to experimenting with these models when it comes to deploying them in industrial environments. Since the emergence of what is considered the precursor of MLOps [
13], where some of the key aspects and bad practices in deploying and maintaining models were identified, the term MLOps has gained great relevance. However, few studies provide evidence of how to instantiate it, especially in an Industry 4.0 environment, as highlighted in [
14].
In the current Industry 4.0 context, new research suggests that Industry 4.0, which is leveraged by big–data analytics, artificial intelligence, and digital twins, is limited by its emphasis on promoting the efficiency and flexibility of industry rather than focusing on industrial sustainability and workers’ welfare [
15]. Therefore, the next step beyond this paradigm requires bringing humans back into the process for collaboration and reintroducing the human touch to manufactured products while simultaneously focusing on sustainable manufacturing [
16]. For this to happen, the role of co–intelligence—where humans assist robots by training, explaining, and sustaining, and robots assist humans by amplifying, interacting, and embodying—will be paramount [
17].
This work presents an online approximation for reducing a circular cutting blade system’s downtime. In doing so, an improved survival modelling approach that accounts for the operation variability is compared against other survival models. The models are built with existing sources of data and are designed to provide the final users, the operators, a Health Index of the cutting system, which empowers the operator while requiring their feedback. Instead of focusing on the improvement of the model with a fixed dataset, this work, situated in between the 4.0 and 5.0 industrial revolutions, provides evidence of the research of models that are already deployed and could benefit from the inclusion of new data sources by introducing the human in the loop and need to consider other aspects, such as retraining.
2. Materials and Methods
2.1. Study Setting
This investigation was conducted within an industrial environment, specifically, a tire plant that routinely cuts different rubber treads, for which it employs a rotating blade. Before initiating this study, the plant relied on a reactive maintenance strategy for managing the blades’ lifespan. Under this regimen, blade replacements were only made when the blade became jammed or when defects, such as burrs, were observed on the cut treads.
2.2. Project Framework
The research forms part of the European AI–PROFICIENT project, aimed at integrating Artificial Intelligence (AI) technologies into manufacturing operations. The primary objective within this framework is to develop adaptive algorithms capable of estimating the wear status of critical components like the cutting blade and providing actionable insights to operational staff, while continually learning from the data gathered.
2.3. Development Phases
The project unfolded in two distinct phases:
Initial Phase: During the early phase, pre–existing data collection systems were utilized to gather necessary operational data. This phase focused on leveraging available historical data to begin the algorithm development process.
Implementation Phase: Subsequently, a dedicated platform was developed to facilitate real–time data acquisition from production machinery. This new system enabled a continuous stream of data, enhancing the immediacy and relevance of the information available for algorithm refinement. The deployment of this platform marked a transition to a more dynamic data environment, where algorithms could be applied directly within the operational context of the plant.
Throughout both phases, the integration of AI into the plant’s processes was aimed at transitioning from reactive to predictive maintenance strategies, thereby increasing operational reliability and efficiency.
2.4. Data Sources
2.4.1. Original Data—Prior to Deployment
Before the deployment of the platform, the data used for the modelling and analysis came from a combination of handwritten maintenance logs and the signals of the Supervisory Control and Data Acquisition (SCADA) system. Maintenance logs report the maintenance actions carried out during each shift (such as a change of the cutting blade) and were cross–matched with the cutting system signals from the SCADA that included, among other things, the number of cuts and the materials being cut. Knowing the approximate time when the blade was placed and removed, together with the cuts it performed, enabled the identification of the number of cuts achieved by each blade during its usable life. As a result, 227 blades were identified from the historic data, each having an ordered record of the cuts performed. Five of those records are depicted in the following
Table 1.
2.4.2. New Data—Post Deployment
During the second part of the project, new measurements and interfaces were installed, which allowed the recording of new information for each blade used in the process.
Table 2 displays an example of the new data.
Table 2.
Snippet of the new data obtained after new sensors were installed.
Table 2.
Snippet of the new data obtained after new sensors were installed.
| bladeID | Cuts | Reason | Jams | waterJetCleaning |
|---|
| 288 | 58,496 | EOL | 0 | 0 |
| 289 | 83,090 | QualityIssue | 1 | 0 |
| 290 | 31,514 | EOL | 0 | 0 |
| 291 | 11,439 | Jam | 1 | 0 |
| 292 | 12,902 | Jam | 1 | 0 |
where, in the column indicating
reason for replacement:
EOL stands for End Of Life and indicates the blade has achieved its maximum number of usable cuts in practice.
Jam is used to signal that after the blade jammed during the cutting process it was replaced due to it not being suitable for further cuts.
Quality Issue indicates that the blade was replaced because the cutting process gave results of poor quality.
Furthermore, the columns Jams and waterJetCleaning further indicate how many times the blade jammed during its lifetime and the amount of cleanings via water jet it received.
2.5. Models
2.5.1. Weibull–Based Reliability Model
Traditional survival/reliability analysis is used to analyse the expected duration of time until a certain event occurs. In this case, that “time” is measured by the number of cuts made by a blade until its replacement. In such an approach, the survival function
gives the probability that a blade is still useful (has not been replaced) after a certain number of cuts. The Weibull distribution is used, which is particularly well suited for modelling lifetime distributions. It is expressed mathematically as:
where
and
k are referred to as
scale and
shape parameters, respectively, and are obtained via Maximum Likelihood Estimation (MLE).
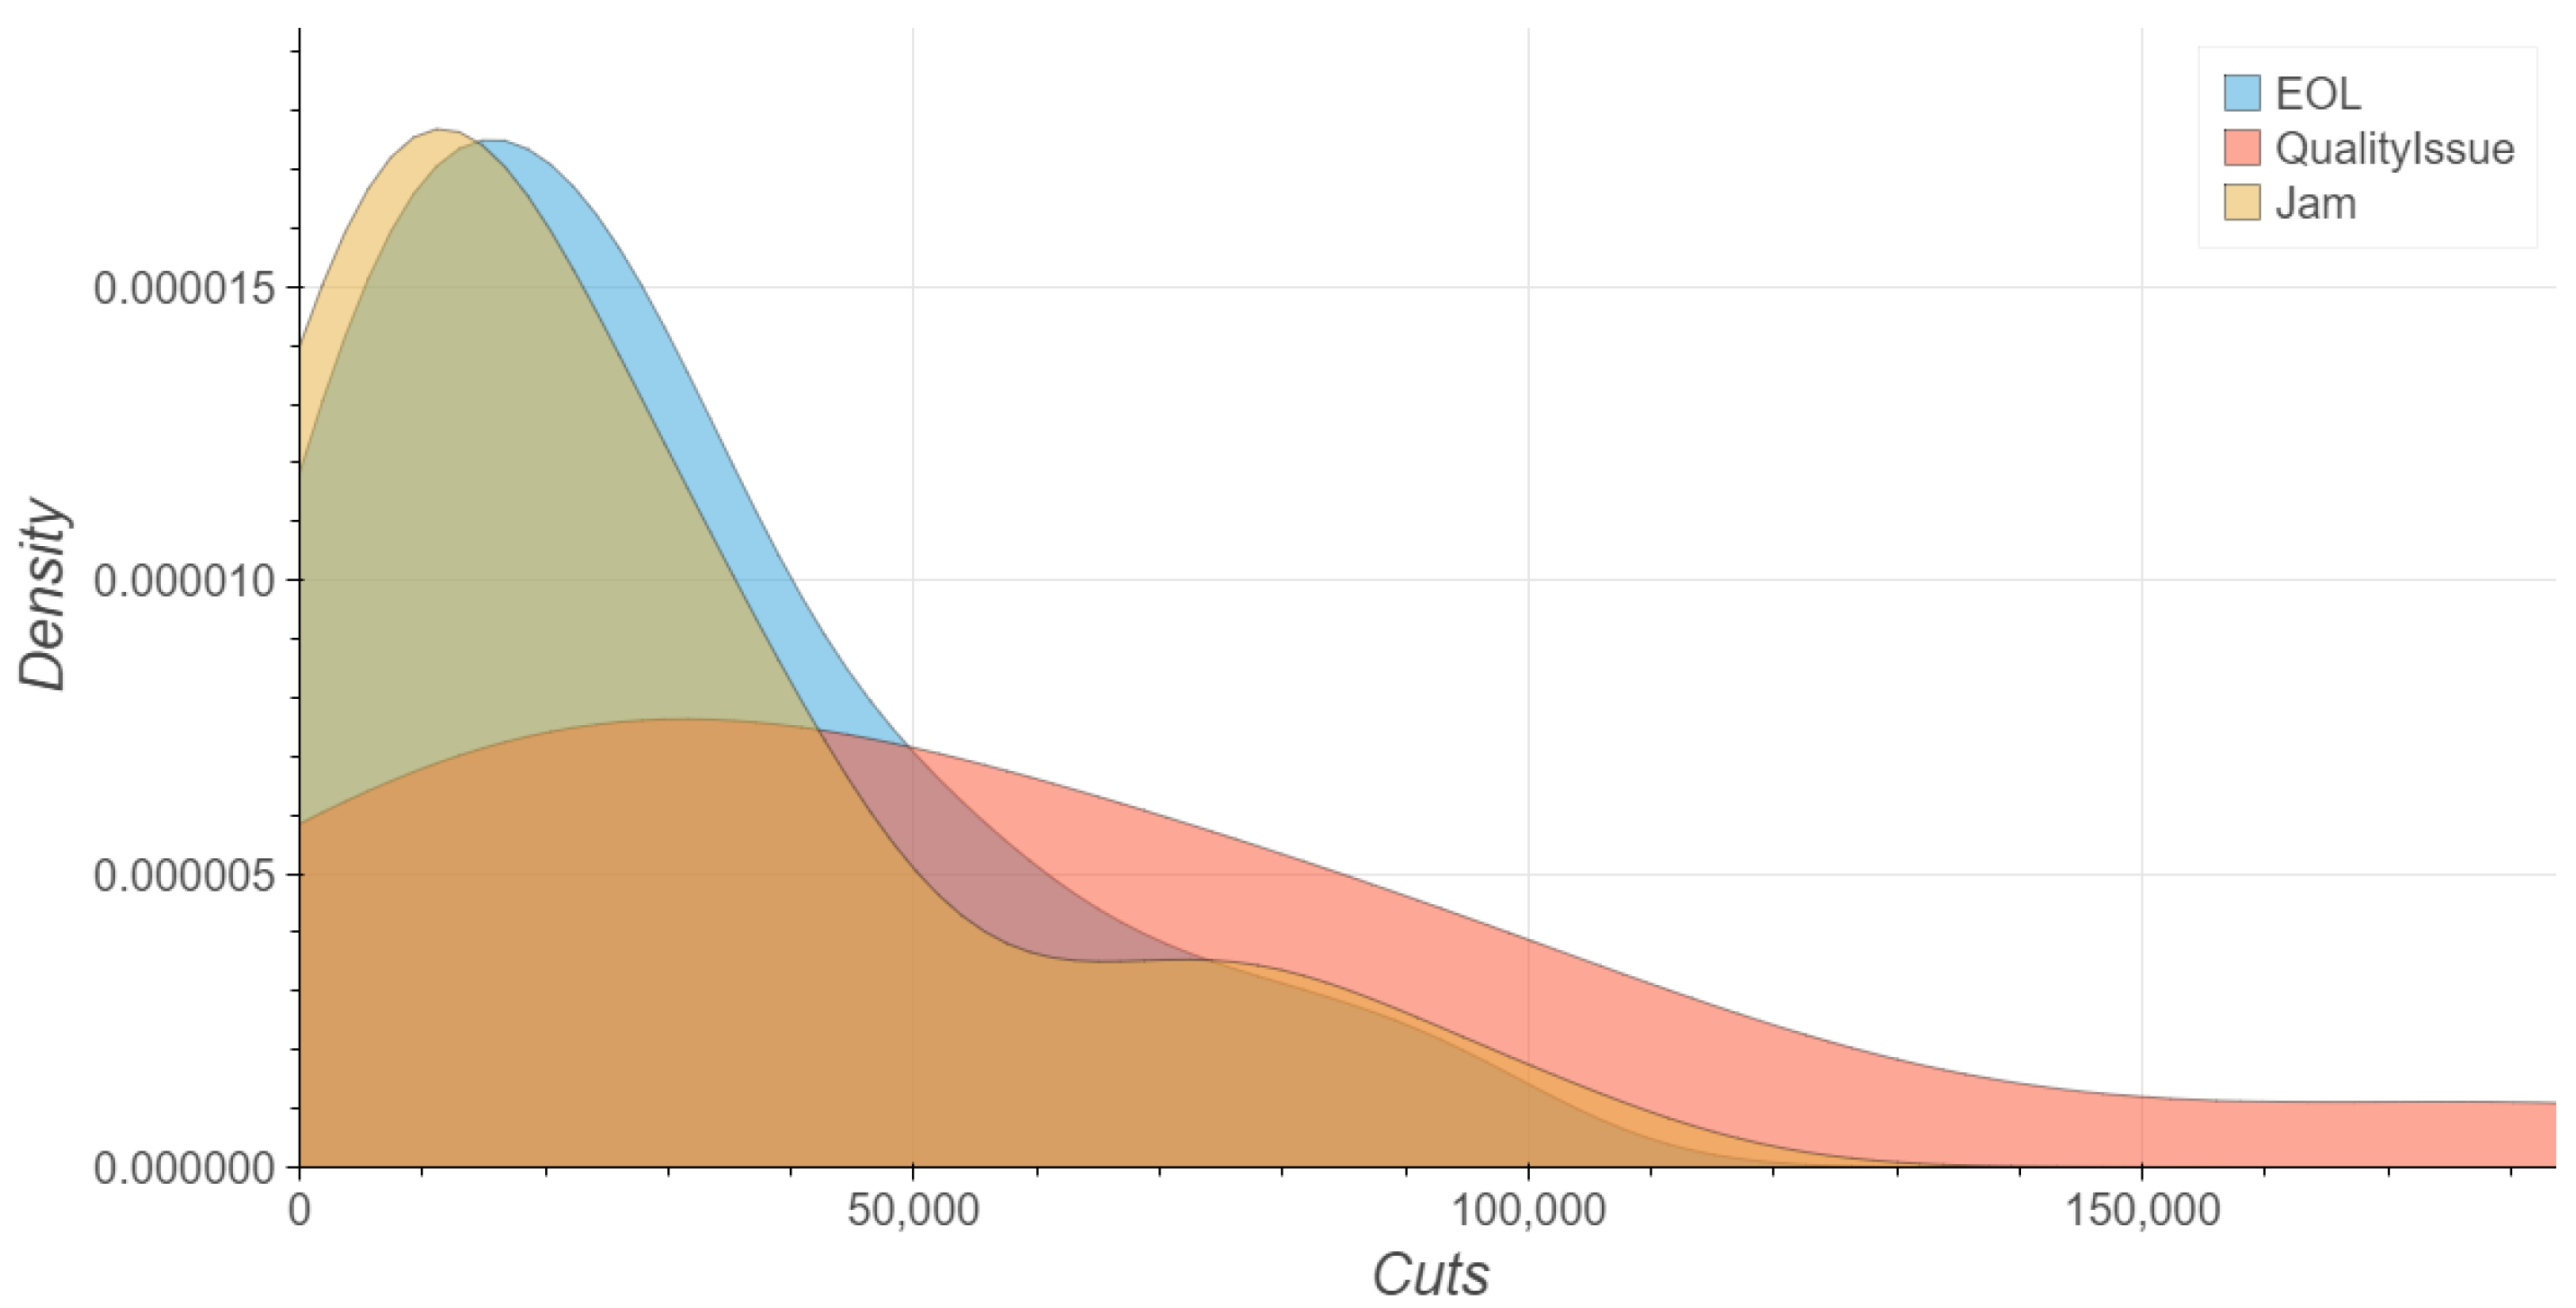
This approach allows for a probabilistic characterization of the blades’ total cuts, which comes in handy when treating blades as a group but has its downsides when it comes to treating them individually. For instance, that the majority of blades do not reach 50,000 cuts does not mean that one particular blade will not be in need of replacement after 10,000 cuts.
2.5.2. Context–Aware Weibull Models
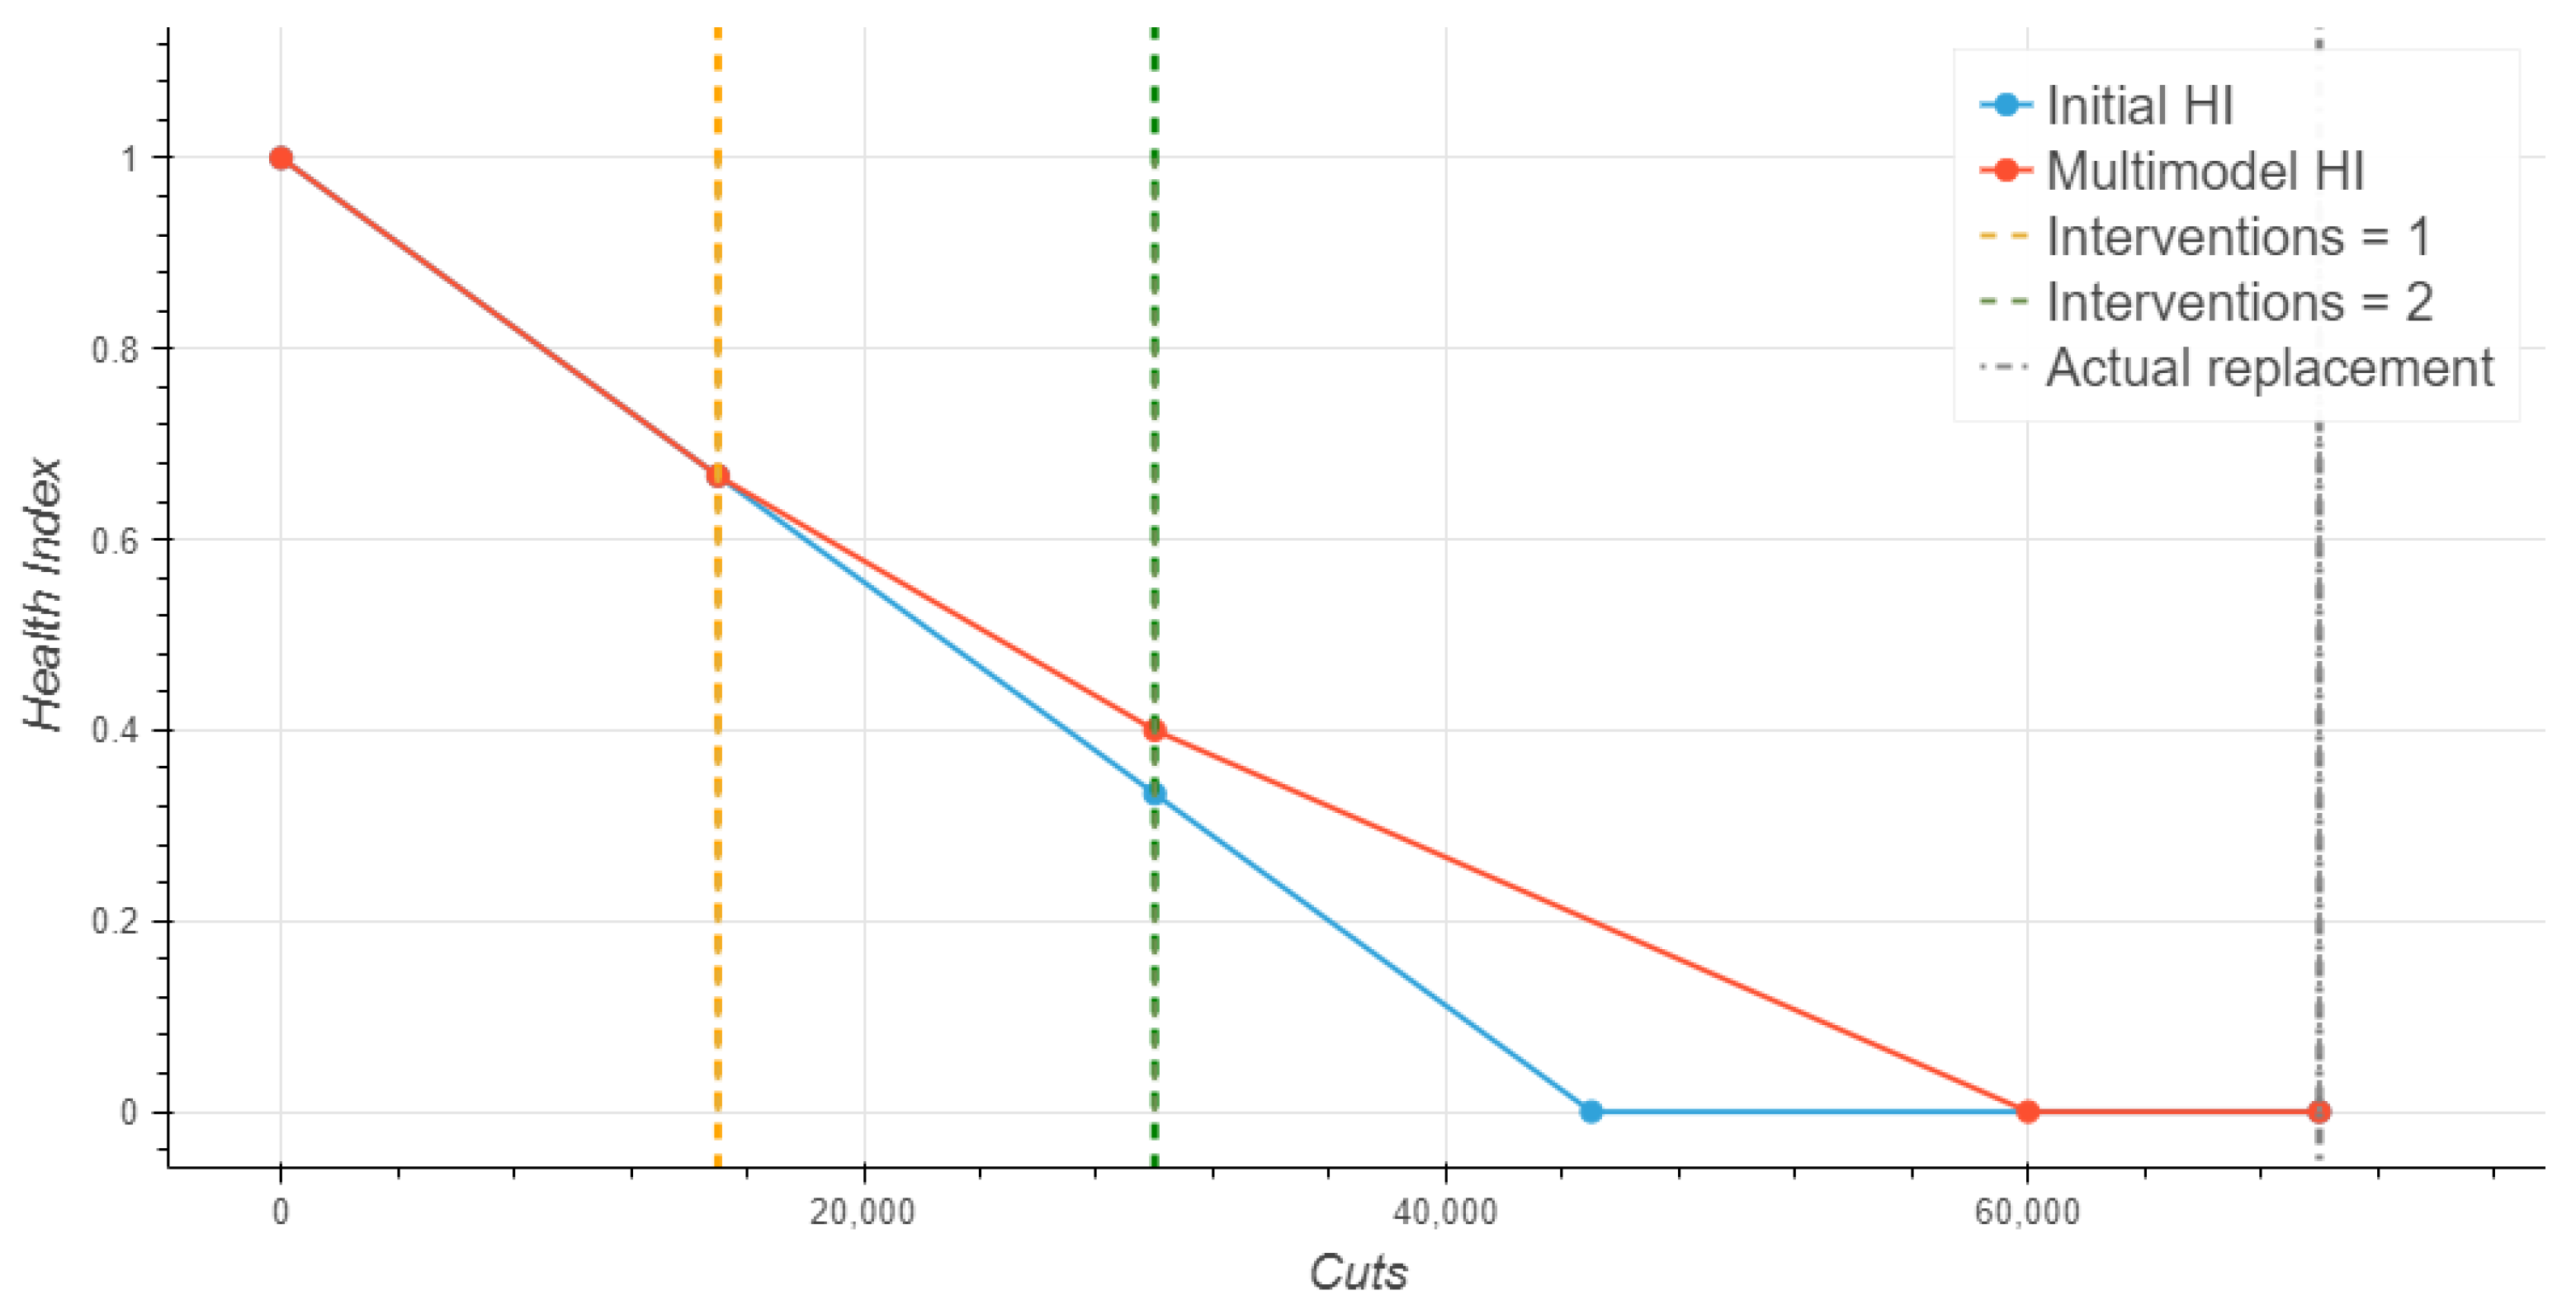
As we continue to make progress in the development of the project, more sensors are installed and more information on the blades life cycle can be obtained. More precisely, we can utilize information regarding the blade jamming or cleaning actions that had taken place during their lifetime. These actions are recoded together as interventions, creating up to three different categorical classes for 0, 1, or 2 (or more) interventions. These three classes will be used to further characterize the blades and model them accordingly. That is to say, the Weibull approach will be complemented by considering different models/Weibull distributions according to the interventions performed on each blade.
2.5.3. Survival Analysis via XGBoost
For the sake of comparing our approach to the more complex and commonly utilized state–of–the–art approaches, we will be applying Gradient Boosting techniques to the survival analysis via XGBoost (version 2.0.3) [
19]. We will be using the Accelerated Failure Time (AFT) model, which assumes the log of the survival time is linearly related to the covariates with a random noise component. This approach allows the use of powerful tree–based learning methods like XGBoost for survival analysis, leveraging its capacity for handling various types of data and complex non–linear relationships within the data.
2.6. Health Index
The creation of a Health Index (HI) requires that we combine complex information regarding the condition of each blade in order to provide a single numerical value as an indication of the overall condition of the asset. The objective is that HI becomes a useful tool for the operator and helps them make decisions based on an estimation of the degradation of the blade.
The modelling approach suggested here follows the one presented in de Calle Etxabe Kerman et al. [
8], which is based on survival functions obtained via Weibull fitting. Such approaches reflect the probability of a blade being alive, i.e., usable, after a certain amount of cuts. However, the interpretation of probabilistic information is not as straightforward for the final users (operators or maintenance managers), who are ultimately the ones in charge of the blade replacements. Therefore, it becomes a necessity to adapt the definition of Health Index to match data specifications and to be of use to the people dependent on it. This work proposes a way to turn a survival function into a proper Health Index, whose interpretation is rather straightforward, with values close to 1 meaning the asset is in good condition, whereas values close to 0 mean the asset should be replaced soon. Given the one–to–one relationship between the survival rate and
Cuts, we could set programmed replacements once the blade manages to reach a certain number of cuts—a threshold of sorts. This is to say that, by fixing the
Cuts to be made before a blade is replaced, we expect that the percentage of programmed replacements will tend to equate the survival rate of the batch of blades.
Note, however, that to define the best threshold, different costs associated with each type of blade replacement (programmed and unprogrammed) must be taken into account. As the exact quantification of these costs is difficult, mostly due to all the external opportunity costs associated with an unplanned change, various scenarios are compared through simulations.
Simulation
Different simulation scenarios are proposed in this section on account of the relative cost established for the different replacements,
where Unprogrammed Replacement Cost is at least the same as Programmed Replacement Cost so that
.
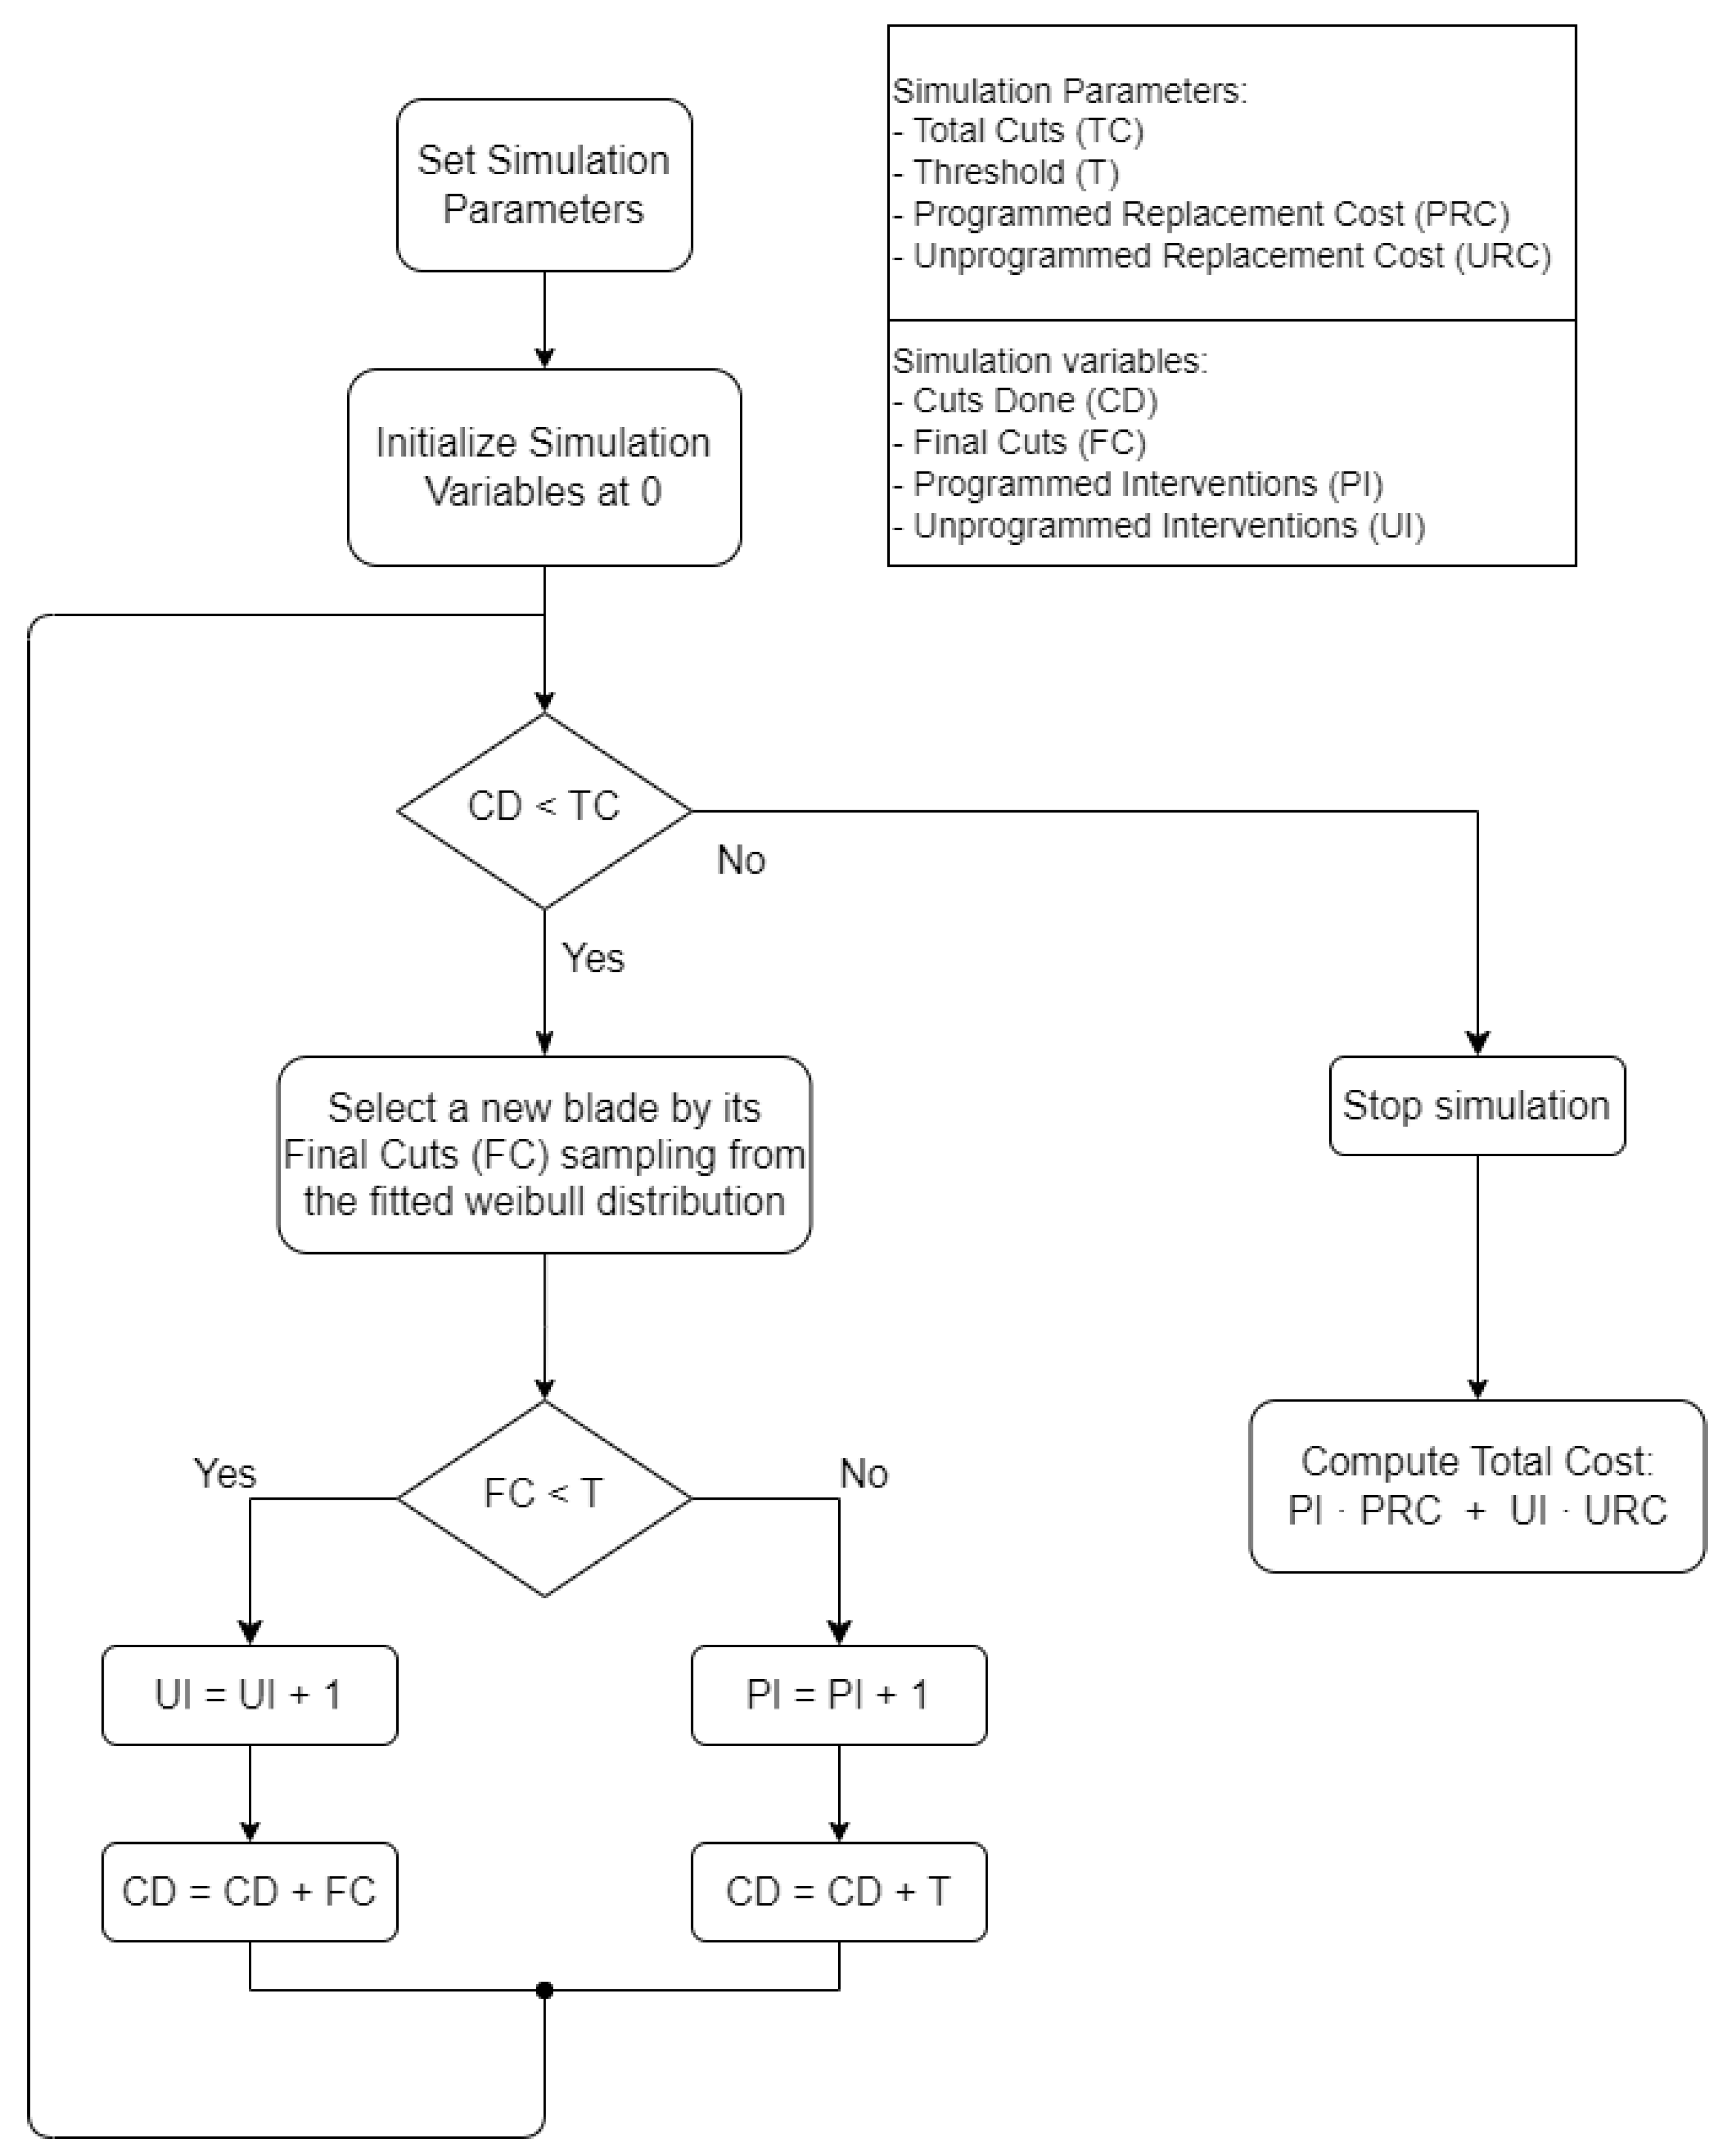
Simulations are carried out as illustrated in
Figure 1 for a fixed number of Total Cuts and varying Threshold, defined for survival rates ranging from 0.10 to 0.90, with 0.10 steps. Note that this is the same as considering each of the nine 10–quantiles (or deciles), ranging from
to
, since the survival function is related to the cumulative distribution function for the Weibull distribution:
The simulation process depicted in
Figure 1 can be summarised as follows:
After initialising necessary simulation parameters, blades are sampled from the fitted Weibull distribution.
Its Cuts are then compared to the Threshold, flagging a blade as an Unprogrammed Replacement if the value is not met. Otherwise, a Programmed Replacement is established.
Simulation parameters are updated accordingly and a new blade is sampled (with replacement) until Cuts Done reaches the Total Cuts required.
Finally, after obtaining the total number of Programmed Interventions and Unprogrammed Interventions, the final Relative Cost is computed according to (
2):
Due to the stochastic nature of the simulation, the simulation process is repeated several times and the final cost results are then averaged. Once the most appropriate cuts value is chosen as the Threshold (normally the one that minimises the costs) for Cuts, we take the following approach for creating the Health Index. Considering a constant wear–speed, the Health Index decreases linearly from 1 as the blade cuts and reaches 0 after performing the established number of cuts. The blade is changed thereafter.
We can estimate the Health Index of the blades by considering a constant wear–speed. This way, the Health Index decreases linearly from 1 as the blade cuts and reaches 0 after performing the established number of cuts (the blade is changed thereafter). Problems arise when the blade reaches its end of life before that point (after all, it is modelled based on survival probability) because HI never gets to 0. A work–around solution to this problem may consist of simply including certain uncertainty intervals for the HI.
2.7. Platform Deployment
While developing the algorithmic part, an industrial IoT platform was developed in order to facilitate the acquisition of data from the machines and to ease the deployment of the developed algorithms.
In an attempt to follow best practices for model deployment, MLOps principles were considered. In that regard, special attention was paid to the following aspects:
Automation: Automation is one of the keys of MLOps. It involves avoiding manual interventions in the deployment and operation processes as much as possible. This not only speeds up workflows but also reduces the risk of human error and enhances consistency across different environments.
Version control: Code has been versioned using a Git versioning system. This enables greater control over changes and the ability to track and roll back to specific versions if necessary, enhancing the manageability and security of codebases.
Continuous training: Given that new data are being created every day, the model might no longer act as expected. In that regard, the system can improve over time by retraining; this way, potential drift on data can be tackled without major consequences.
Infrastructure as a code: For the sake of reproducibility, the deployment of the infrastructure has avoided manual configuration steps as much as possible. This has been possible by using docker containers that enable defining the configurations and software requirements through code, which should be preferred over manual steps written on the documentation.
Scalability: Scalability has been ensured by using elastic solutions such as cloud–based databases and storage, which can dynamically adjust to the load demands. This is advantageous even if the current model size and data volume are modest, as it prepares the system for future growth without requiring re–engineering. This approach ensures that the infrastructure can handle increases in data input and user demand smoothly, facilitating a seamless scaling–up process when needed.
In addition, some human–centred considerations have been taken into account in order to ensure a conflict–less integration of the system in the plant. In that regard, the following considerations have been taken:
Minimizing operator overhead: An attempt to require minimal intervention from the operator has been made to avoid solutions that would cause more effort than relief. Nevertheless, it must be kept in mind that, before the deployment of the platform, no warning was given by the cutting system; it would work until failure, leading to a stoppage of the cutting process.
Transparency/Understandability: The models have been designed to be as interpretable as possible, favouring simple–to–understand models over complex black boxes. This approach helps operators understand and validate the outputs, increasing the confidence when using the system.
Engagement and feedback loops: Specific HMI’s have been installed to provide the operator a means to retrain the algorithms by providing feedback.
The whole architecture of the deployed systems can be seen in
Figure 2.
2.7.1. Human Feedback Interface
Following the human feedback approach suggested by [
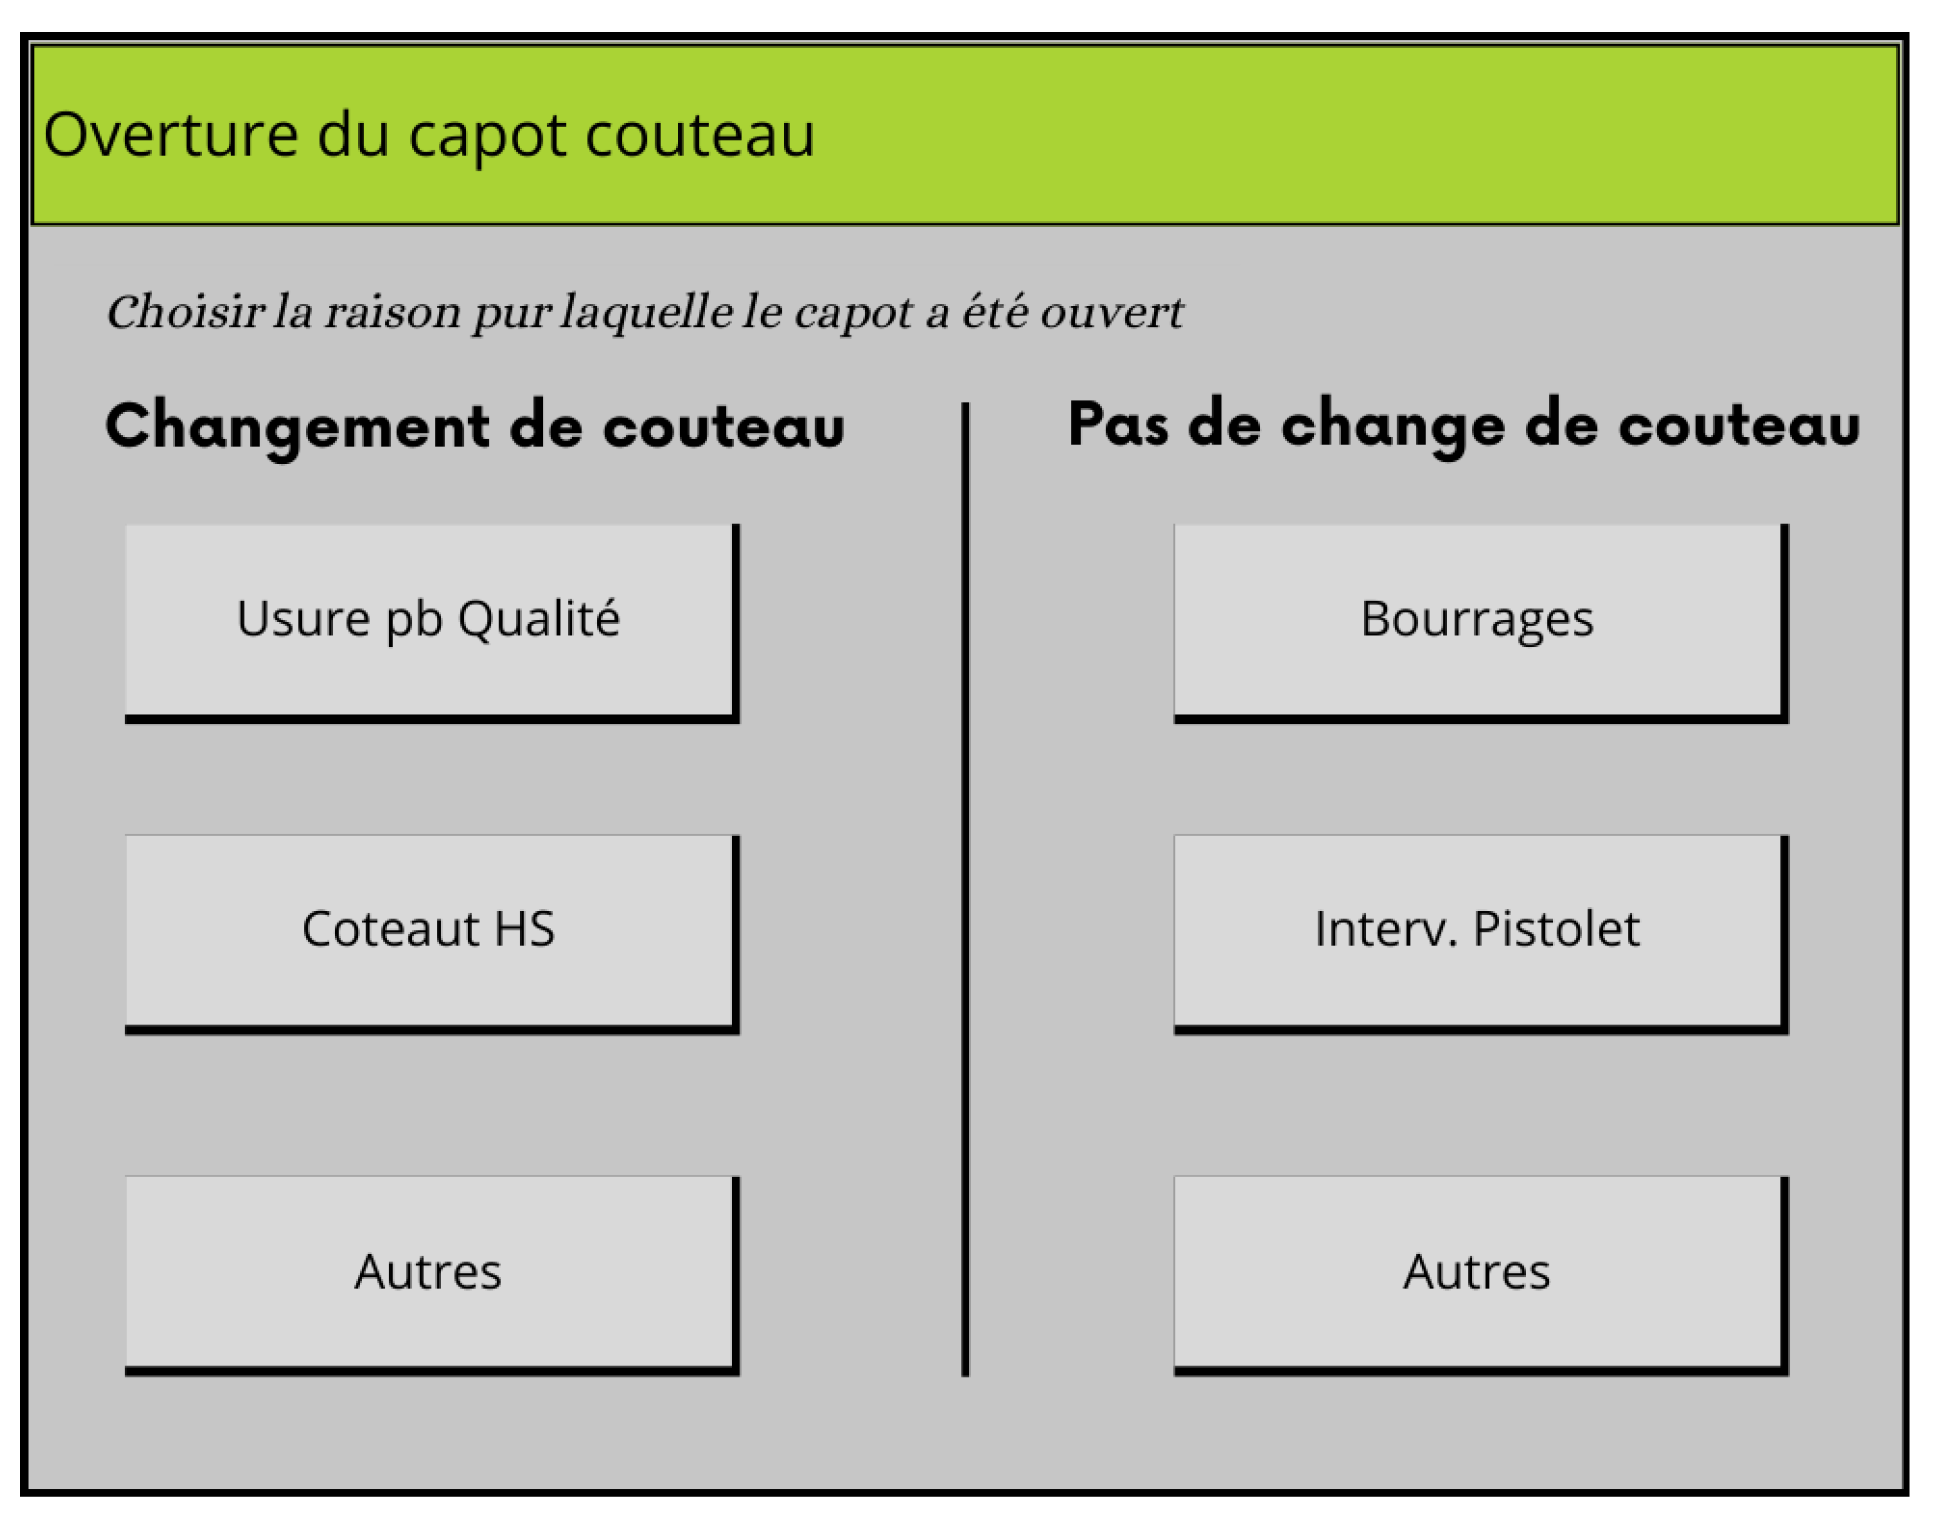
20], two sources of feedback for retraining were used: Explicit and implicit. The implicit feedback is gathered automatically as it is possible to know the amount of cuts a blade performs and, hence, it is possible to adjust the model outputs based on the new data. Regarding the explicit feedback, it is known that the reasons for changing a blade could be motivated by scheduled maintenance and not due to wearing. In addition, after several conversations with the operators it is possible to identify that some interventions that take place on the cutting system are known to impact the blades’ life: when the blades are cleaned by water jets or an excessively thick work piece is being cut, the cutting system sometimes jams and is not able to cut properly. In this context, a new HMI has been installed close the local PC at the cutting system. This HMI (visible in
Figure 3) pops up every time the security lid of the cutting system is opened, and it allows the operator to provide additional information regarding the motivation for opening the lid. In this way, it is possible to identify harmful interventions during a blade’s life and, in addition, the causes for changing the blade.
2.7.2. Feature Extraction
The signals obtained from the cutting system and the local PC are sent to the the Influx database. This includes the cut counter (which restarts every time the operator marks a change of blade on the HMI) and boolean signals that indicate the activation of the different buttons on the HMI. Once the signals are stored on the Influx time–series database, it is possible for the rest of the modules of the platform to access, almost in real time, the data gathered on the plant.
The raw readings, however, are not informative enough just by themselves. In that sense, a feature extraction module is needed; this module takes the raw signals since the previous blade replacement (that is, since the current blade was installed) and computes the different interventions (jams or water jets) and the cuts carried out up to the current time.
This processed information can be later used either for updating the features database in case the blade has been changed or to execute model predictions if knowing the Health Index is desired.
2.7.3. Prediction Service
The prediction service takes the features computed by the feature extraction module and, using the model, computes an estimation of the current health of the blade. In addition, it provides estimations of the evolution of the blade’s wear for the next cuts. This information is stored on the prediction database, which is queried by a Kibana dashboard (see
Figure 4) that can be accessed by the operator or maintenance manager. The dashboard displays the health index as well as the expected evolution of the index for the future.
2.7.4. Executions
All the services are governed by a single algorithm that is executed every 30 s. In every execution, the algorithm carries out a different role: if a blade change is detected, it will update the feature table and launch a retraining of the model. If no blade change was detected, the latest model will be used to produce some inference.
4. Conclusions
This work presents a research carried out in two stages in relation to the development of a cutting blade system Health Indicator. As in many of the works in the literature, the first modelling attempts are carried out on a fixed set of data. However, this work goes a step beyond by showing deployment considerations and constraints that are otherwise overlooked. Lying in between Industry 4.0 (with connected machines and data streams) and 5.0 (where the operator is placed in the centre), this work contributes to bridging the gap between static research and the development of models and the dynamic research that occurs post–deployment, a domain seldom explored in academia. Crucial challenges in the ongoing evolution of applied technologies are shown, such as the need for robust data streams and the role of the human within the system. This research work not only extends the theoretical framework but also ensures practical relevance in real–world applications. In addition, the simplicity of the approach, together with the modest data requirements (usage data), makes this approach easily transferable to similar scenarios.
A method to build a Health Index from a Weibull–like survival model is presented. This method considers the relation between planned/unplanned replacements and re–scales the outcome of the survival model to a user–friendly Health Index. Furthermore, the method is generic and could be used in other applications of a similar nature.
During deployment, it has been demonstrated that, beyond following the model software development best practices (typically gathered under the MLOps umbrella), the role of the operator is paramount. In this particular work, the operator is both the consumer and the provider of data. They benefit from the Health Index and, at the same time, provide the system with invaluable information regarding the interventions made to the blade as well as the blade replacements carried out. Lacking this information, the system would not be valid. For that purpose, the role of the human feedback system needs to be highlighted: It simplifies the work operation (by going from free–text to pop–up) and at the same time it improves the quality of the retrieved data, reaching 210 inputs given by the operators through the HMI at the time of the analysis. This is a simple demonstration on how the role of operators will evolve from being a consumer to being a consumer/prosumer under the human–centred AI paradigm.
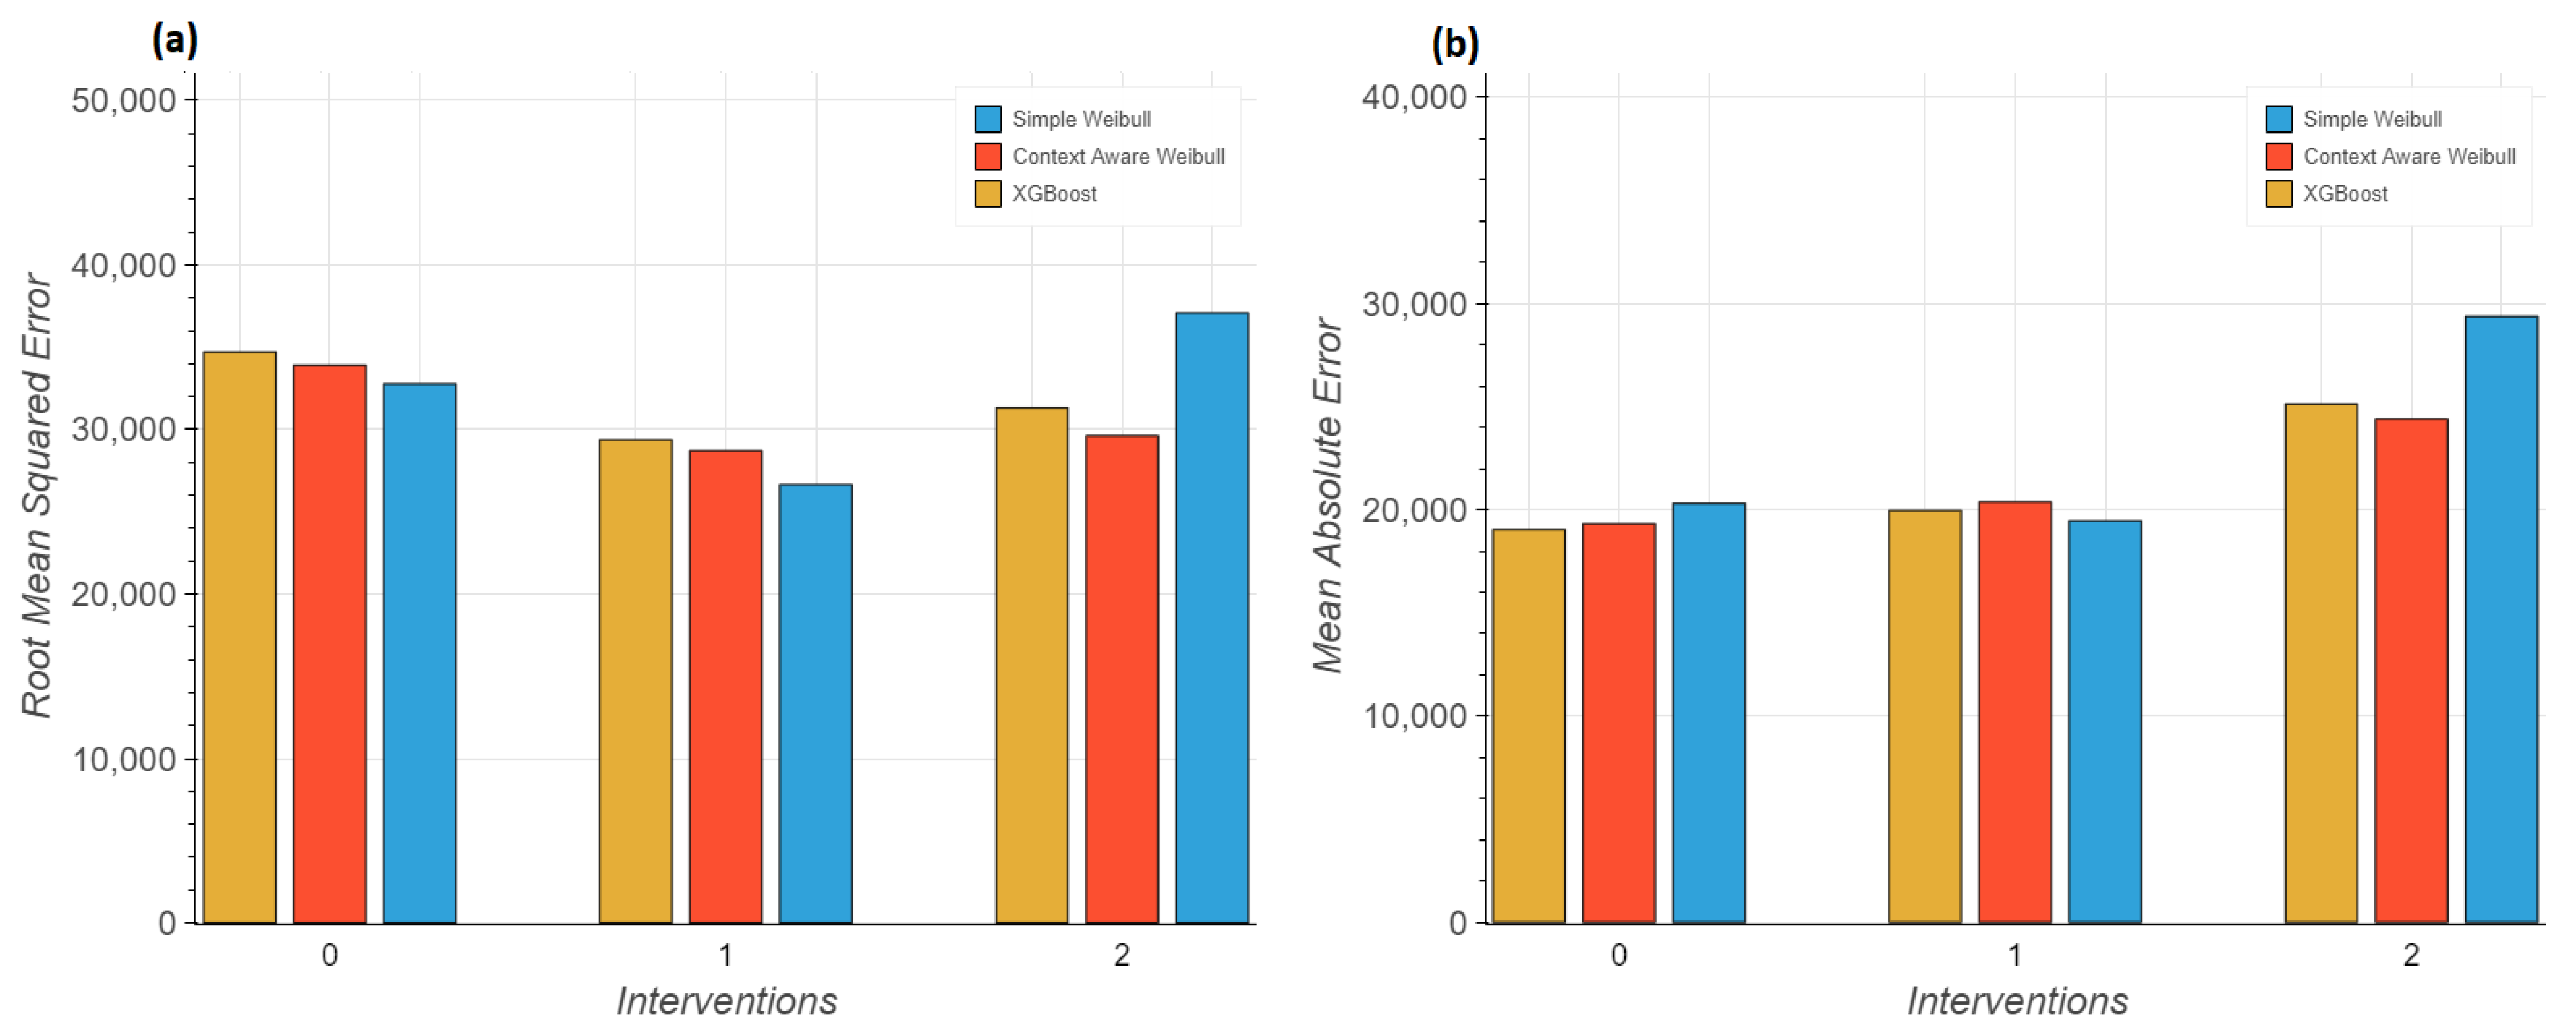
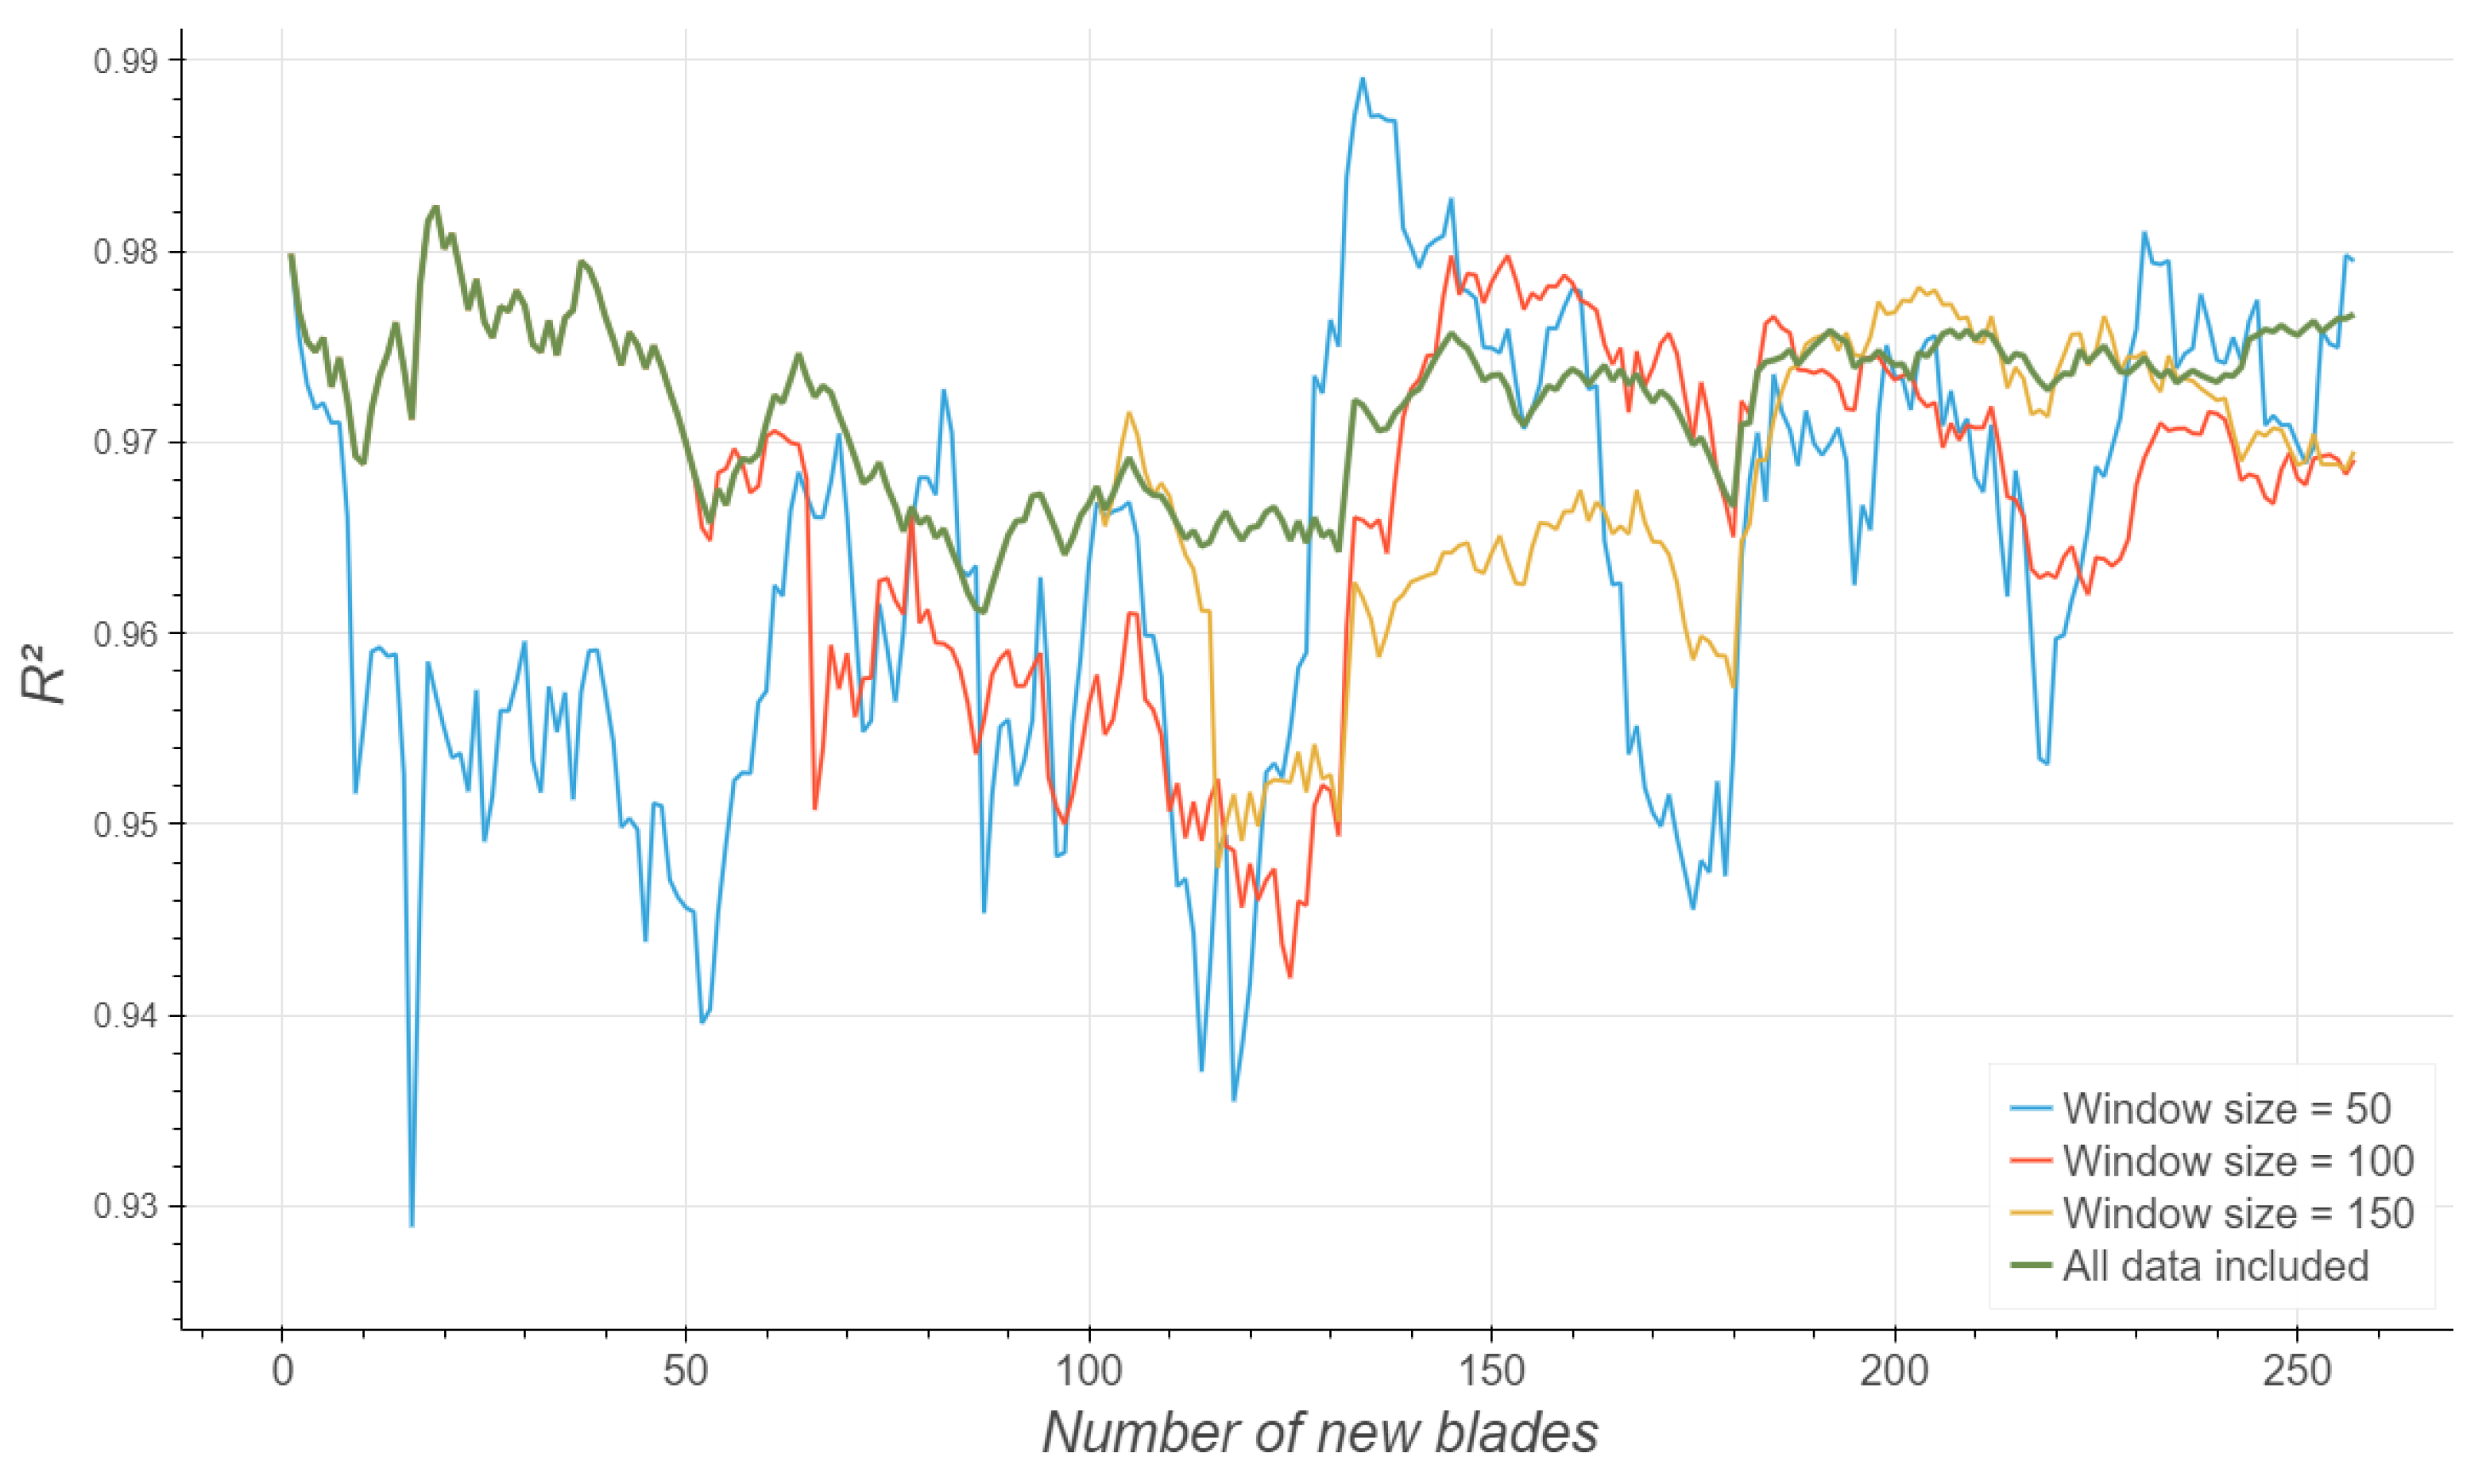
With the available data at the time of the analysis, survival/reliability algorithms have been shown to be simple yet powerful methods to make the estimations, showing almost equivalent results to more complex models, including operations such as the XGBoost model.
Nevertheless, having to deal with a deployed model opens new research needs. The problem is no longer just fitting the data once, it is considering that this data increases over time and that its nature might change. In such a dynamic system, the analytical results obtained at certain points in time (such as the simple model having an equivalent fit to more complex fittings) might need to be revised in the future, when more data become available.
It is expected that the developed models will continue gathering more and more accurate data in the future. In that sense, revising the results of the best model and retraining strategies will be necessary in the future, as will considering the improvement of usage–based estimation with the inclusion of additional sensors to obtain a more detailed appraisal of the blades.
