1. Introduction
The challenges in the industrial application of high-strength steels refer primarily to conformability, joining of sheets, tool life, and springback. The latter is pointed out in the literature as the problem more pertinent to the mass production of structural components using these materials. The difficulty in predicting and controlling the springback may imply the need for project adjustments to the geometry of the tool, adjustments to the process parameters, and control of the forming temperature during production [
1,
2]. Regarding the influence of temperature on the springback of metals subjected to forming operations, the literature indicates that the relationship between the factors is more prominent, and higher temperatures used in the operations reduce the problem of the springback effect [
3,
4,
5,
6,
7,
8].
In contrast, the effect of the temperature increase within the forming limits of metals is not completely understood. While for certain materials, the increase in temperature increases the forming limits, in other cases, damages are found with respect to conformability [
9,
10,
11,
12,
13,
14,
15,
16,
17,
18,
19,
20,
21].
The need to predict failures is found to be the utmost critical necessity in sheet metal stamping. To check the forming limits of materials, ref. [
22] introduced the concept of the forming limit curve (FLC), defined on the axes of minor and major principal strains in the sheet plane. The forming limit of a sheet metal is defined as the state in which a localized thinning (necking) on the sheet starts during forming, essentially leading to a fracture/failure. The two principal strains, ε
1 and ε
2, measured at various component points in the imminence of failure, result in a curve (forming limit curve—FLC) separating the failure and safe conditions. The concept of FLC was extended to the domain of deformations between states of uniaxial stretching to deep drawing to biaxial stretching.
Ref. [
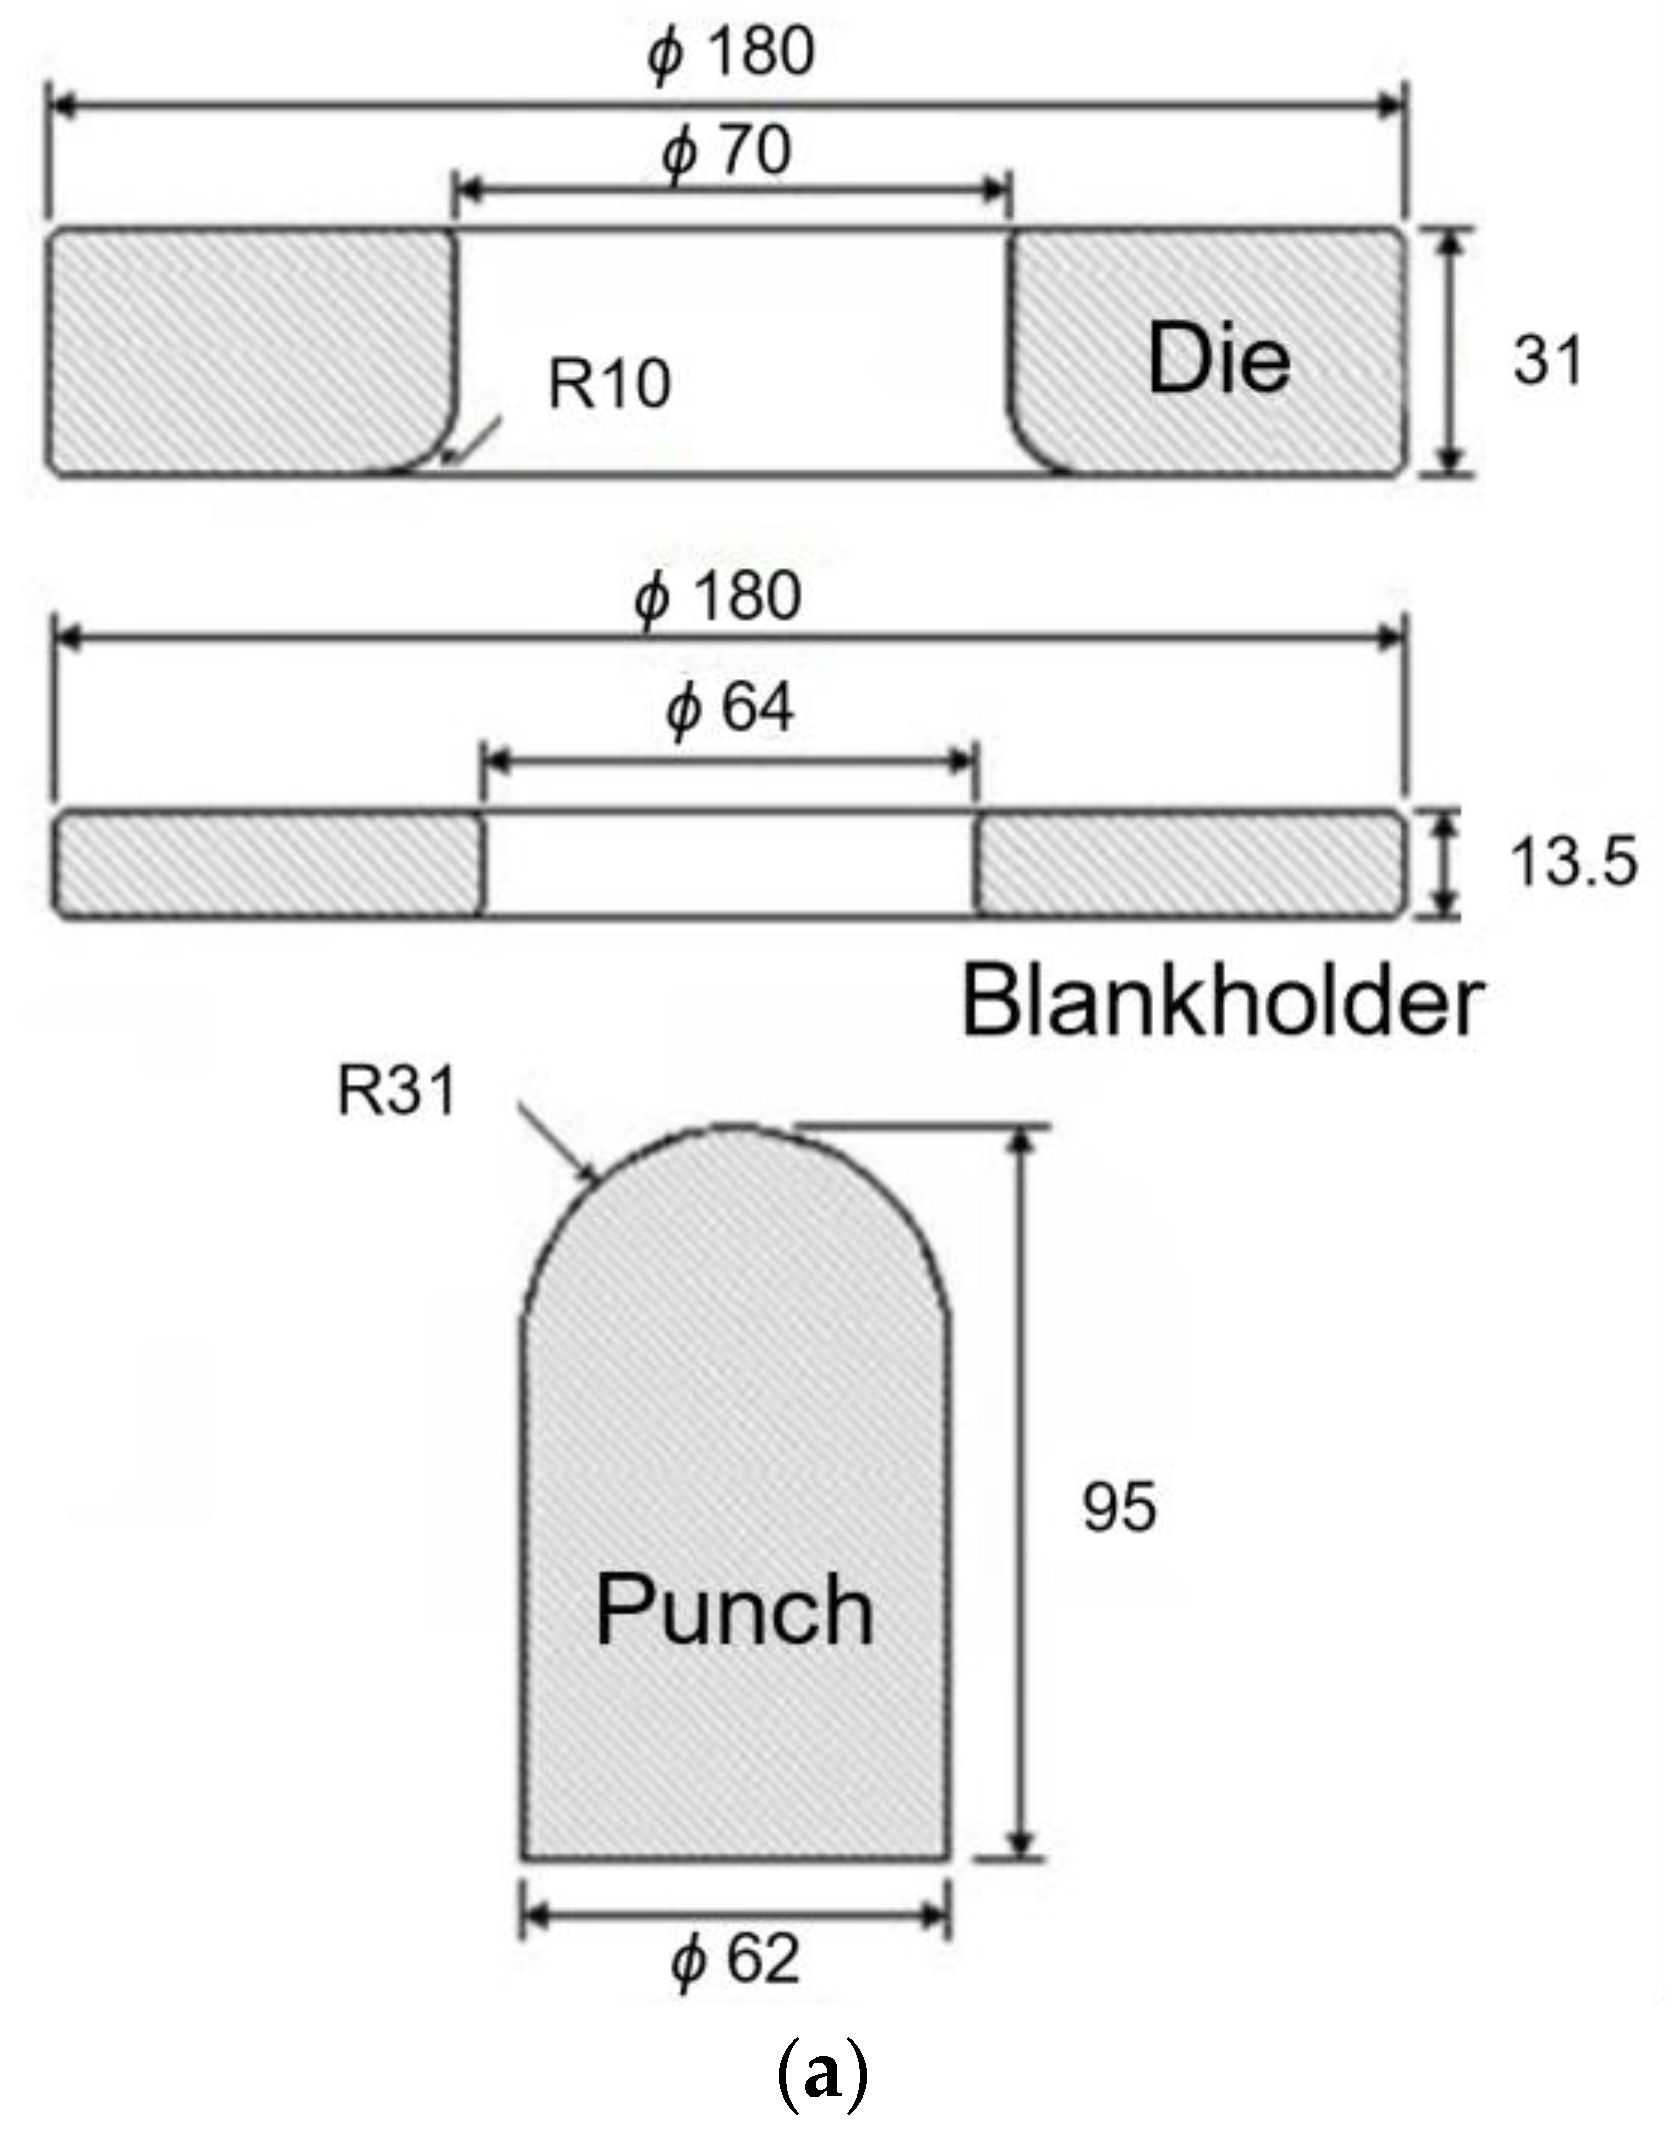
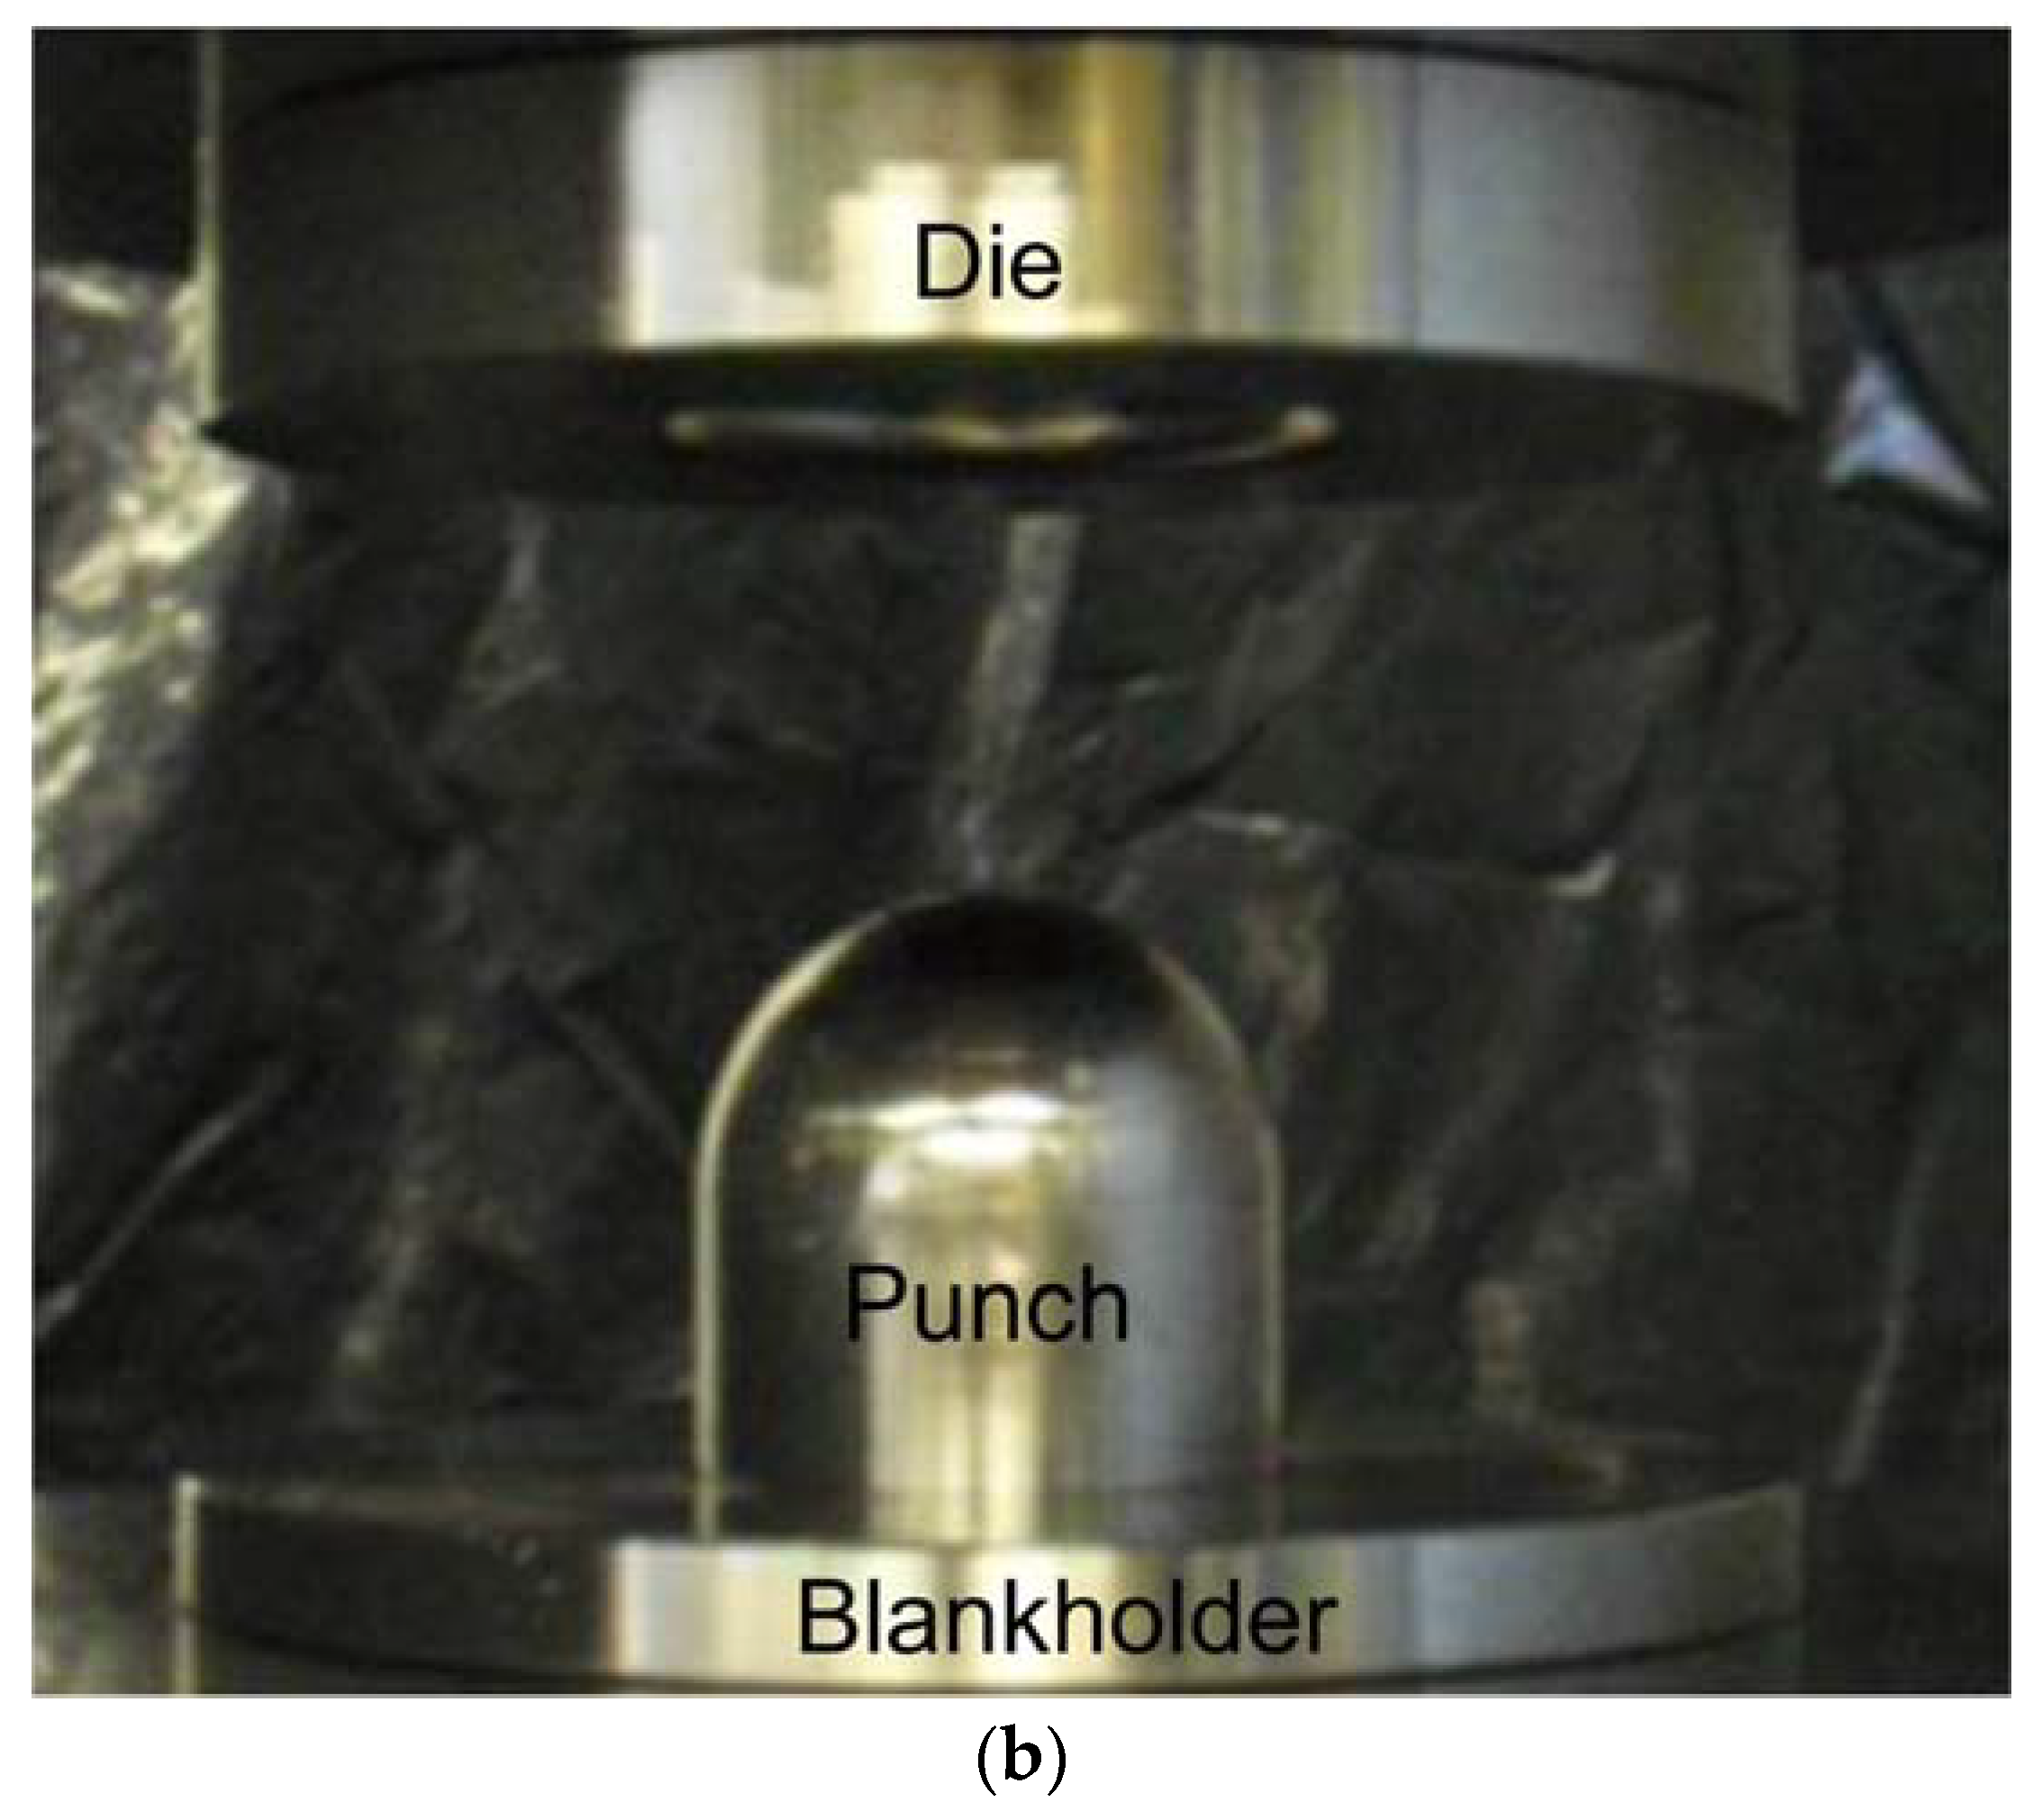
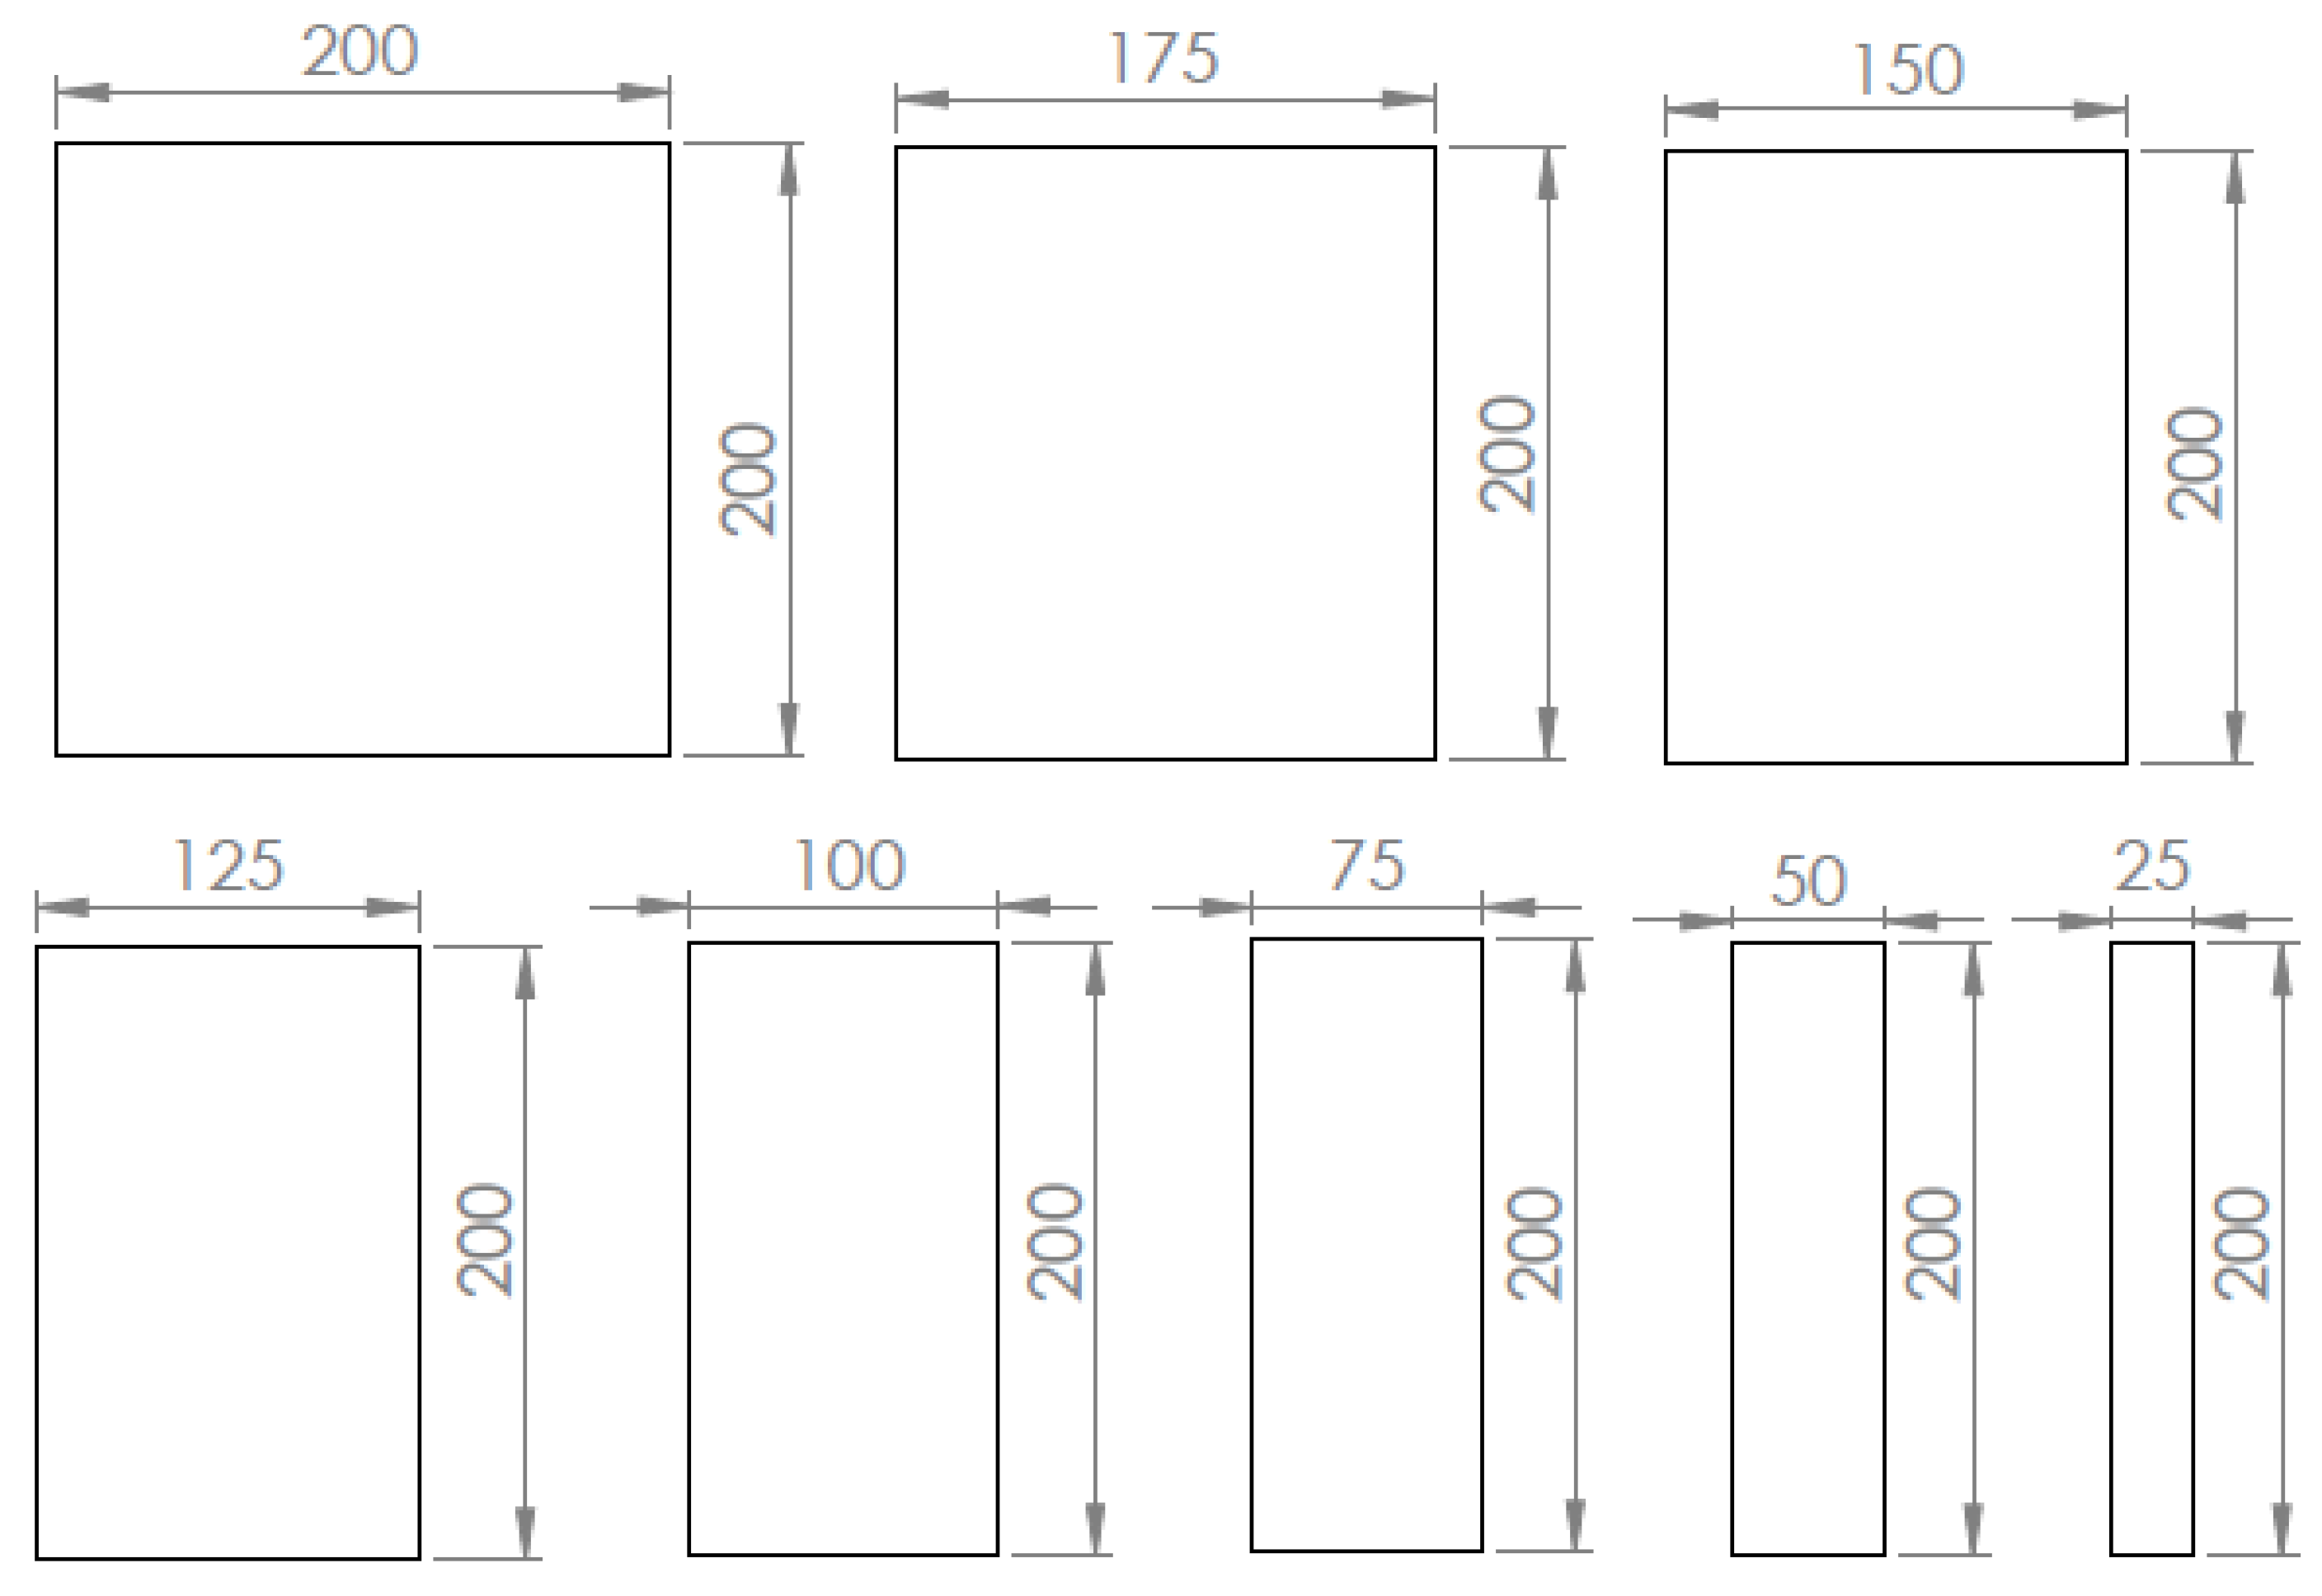
23] proposed a single testing method to determine the limit strain from uniaxial stretching to equibiaxial stretching and then compared their results with those obtained by other known tests, such as Bulge and Erichsen. With single tooling, it is possible to reproduce the states of uniaxial and biaxial deformation through the deformation imposed via a hemispherical punch in rectangular metal sheets that vary in width and are fixed by a die and blank holder.
The first simulation work of forming sheet metal dates back to the 1930s [
24]. However, in recent decades, through simulation based on the finite element method, the process has gained ground as a very useful tool in component designs obtained via forming. In sheet metal stamping, numerical analysis has contributed a lot to reducing the time and cost of development of tools. In the case of numerical tests predicting forming limits, such as the Nakazima test, one of the challenges is to develop a computer routine that can predict the onset of necking. Developed by [
25,
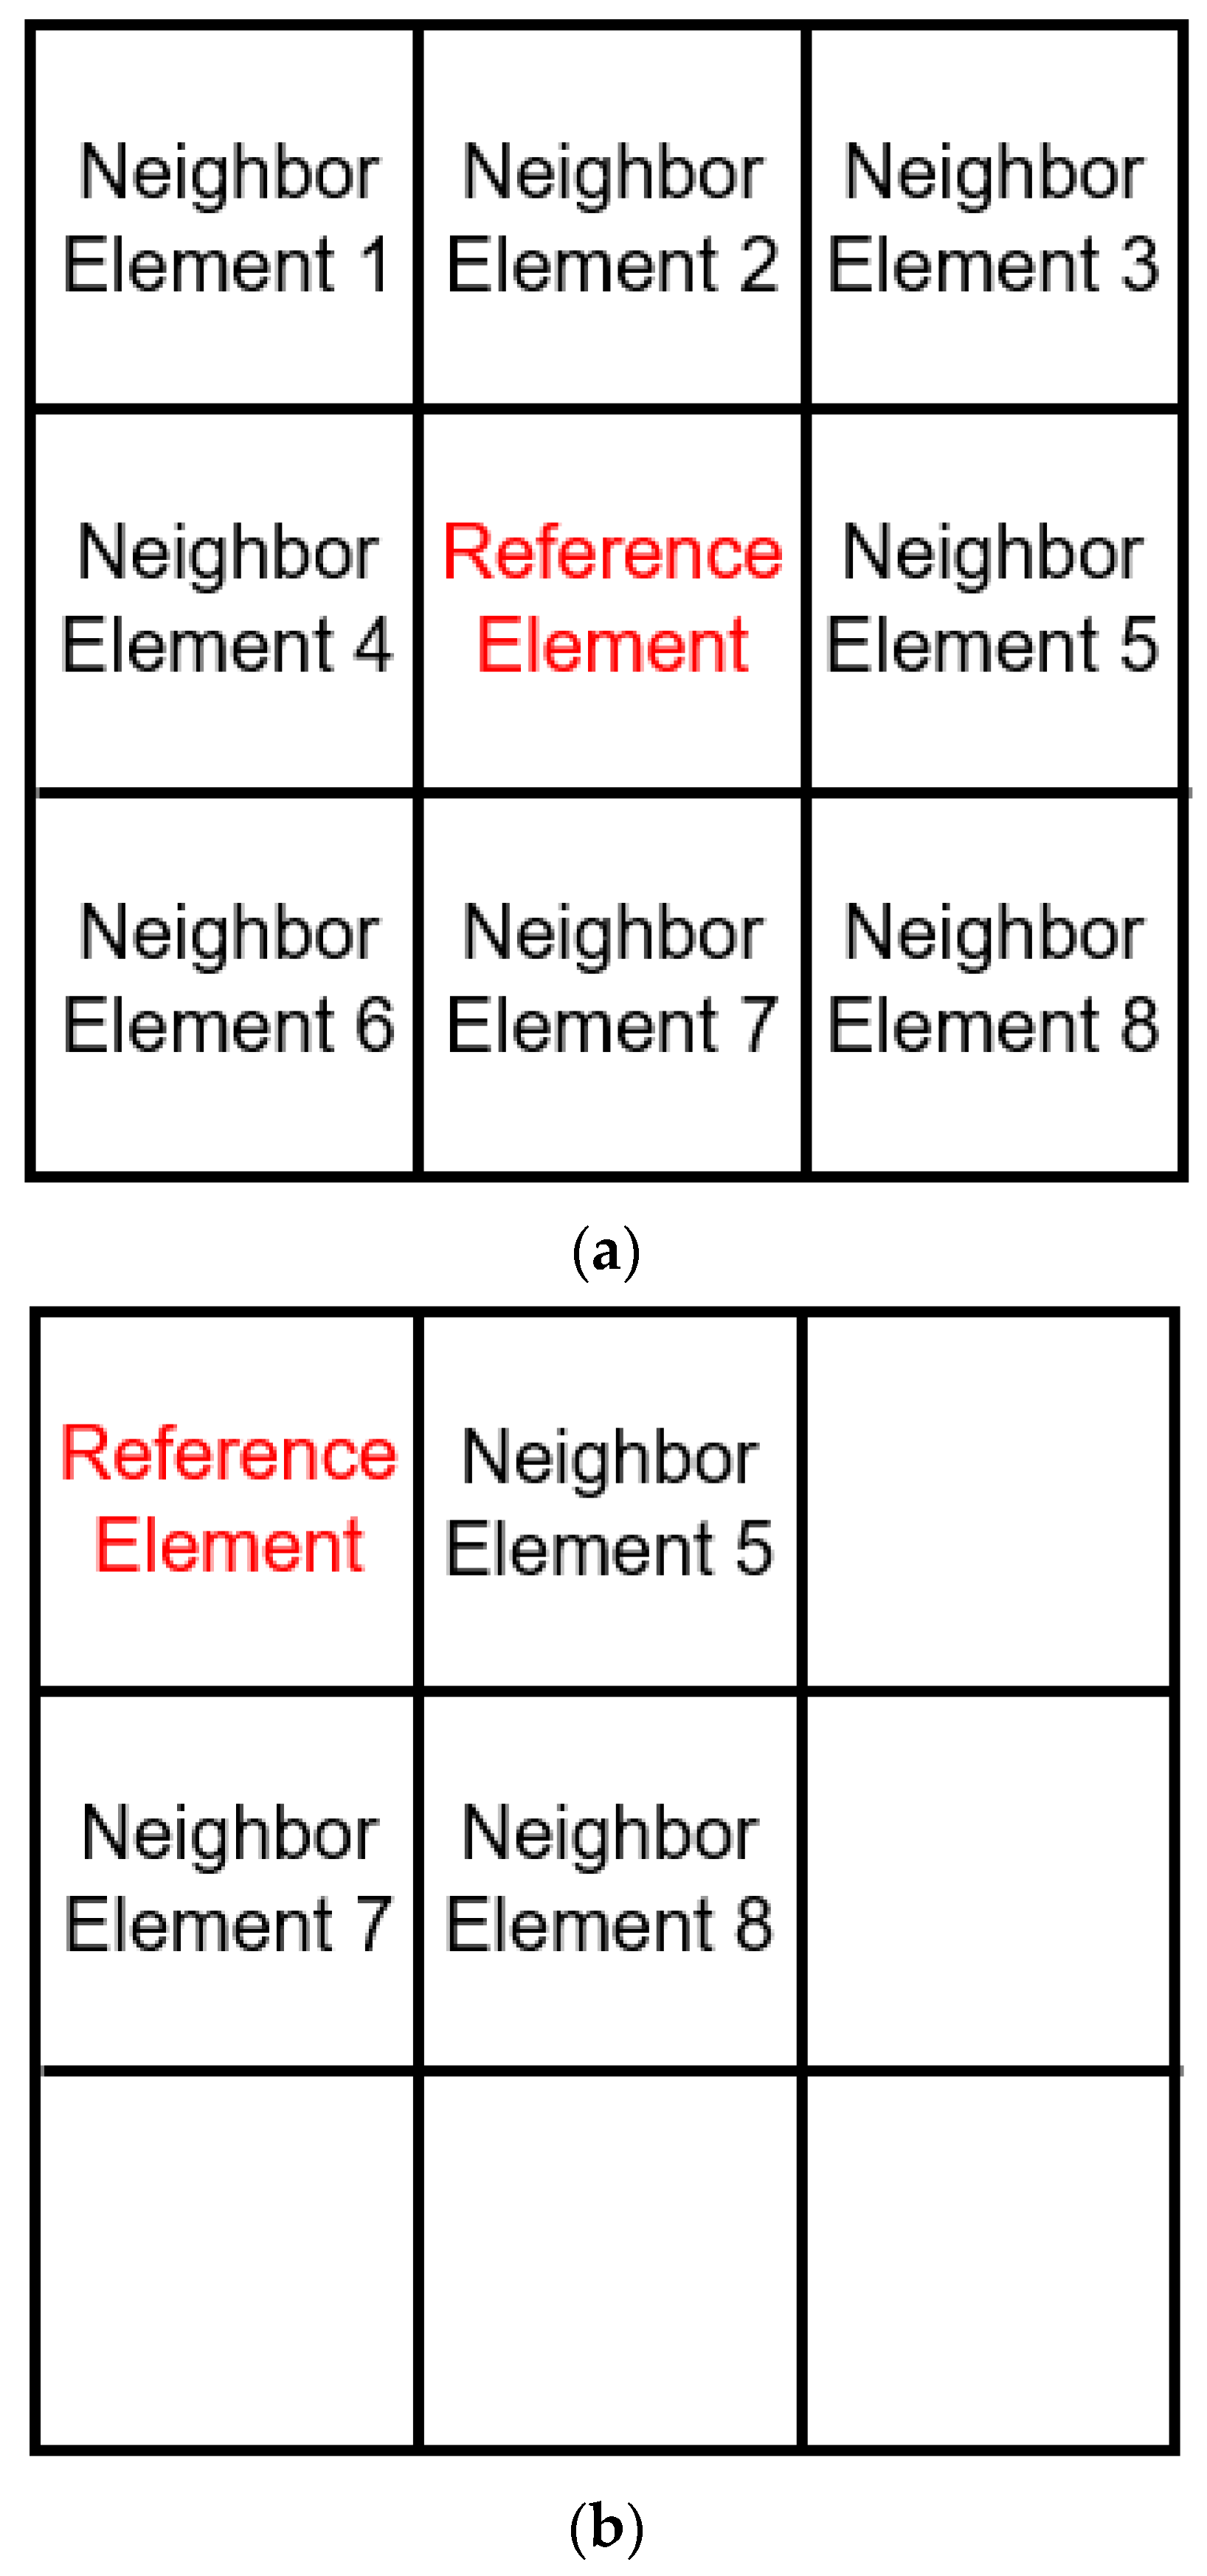
26], the thickness gradient criterion (TGC) correlates each of the elements of the finite element mesh with each of its neighbors. When the thickness ratio between two elements reaches a critical gradient (0.92), it is determined that necking occurred.
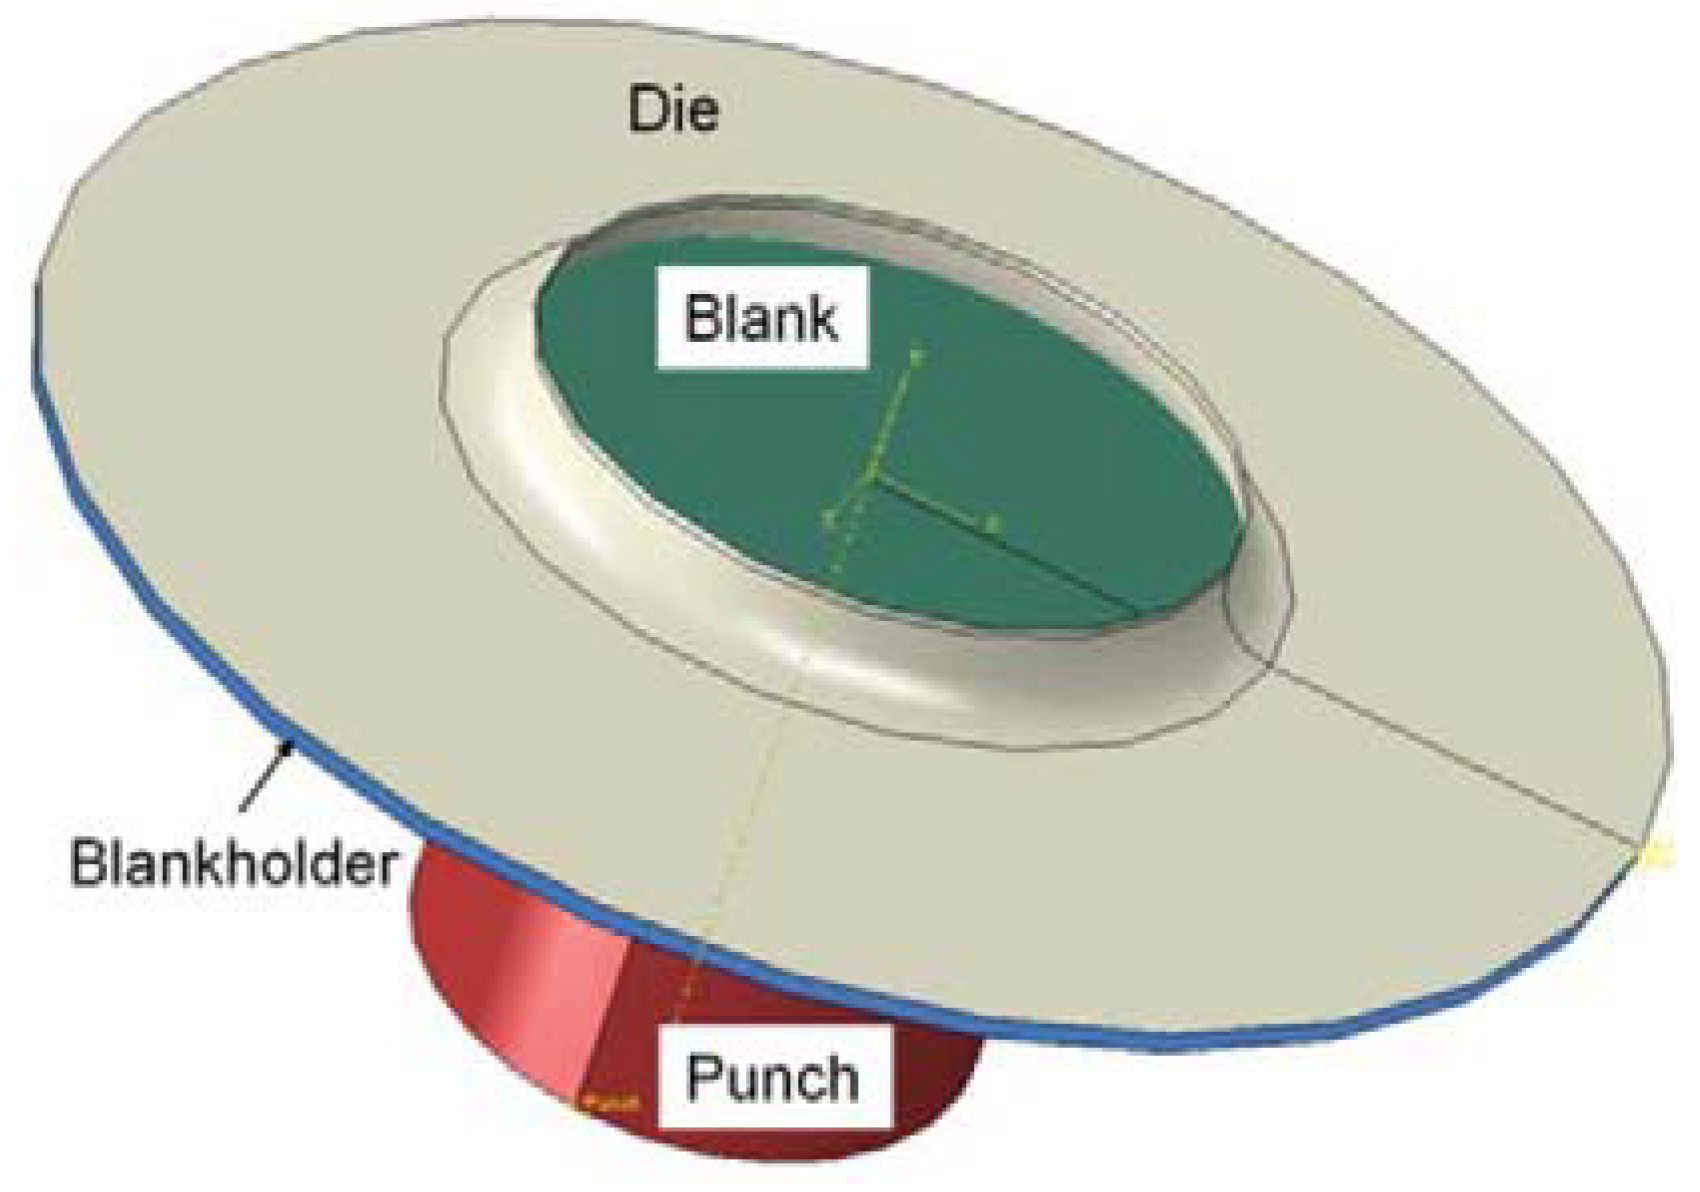
The present study investigates the effects of four temperature levels within the forming limits of two high-strength steels. As mentioned, limited literature is available on the temperature effect on the forming limit strain of high-strength steels, and the decrease or increase in forming limits at those temperatures is not completely understood. For this, the Nakazima method was performed experimentally and numerically modeled using the finite element software Abaqus (6-13) at room temperature and at elevated temperatures. The TGC was used to predict the onset of necking in the mathematical model. The remaining sections in the paper are laid out as follows.
Section 2 provides the materials investigated and the experimental and numerical technique studied to investigate the effect of temperature on the forming limit strain of high-strength steels.
Section 3 details the outcome result of the experiments and numerical analyses. It also deepens the discussion of the obtained results.
Section 4 concludes and summarizes the work.
3. Results and Discussion
The results obtained from the applied aforementioned methodologies are explained in this section. The material tensile stress–strain curve shown in
Figure 7 and
Figure 8 were used to feed and describe the material in the computational models for each of the four-temperature ranges. The strain hardening exponent “
n” and strength coefficient “
K” are also calculated from the tensile curves and are presented in
Figure 9 and
Figure 10. To obtain “
n” and “
K” values, the engineering stress–strain curves were converted to true stress–strain curves. Then, the true stress–strain curves were plotted on the log–log scale to find the straight-line slope, which is called the strain hardening exponent,
n. The strength coefficient
K will be determined from the y-intercept on the stress axis. From
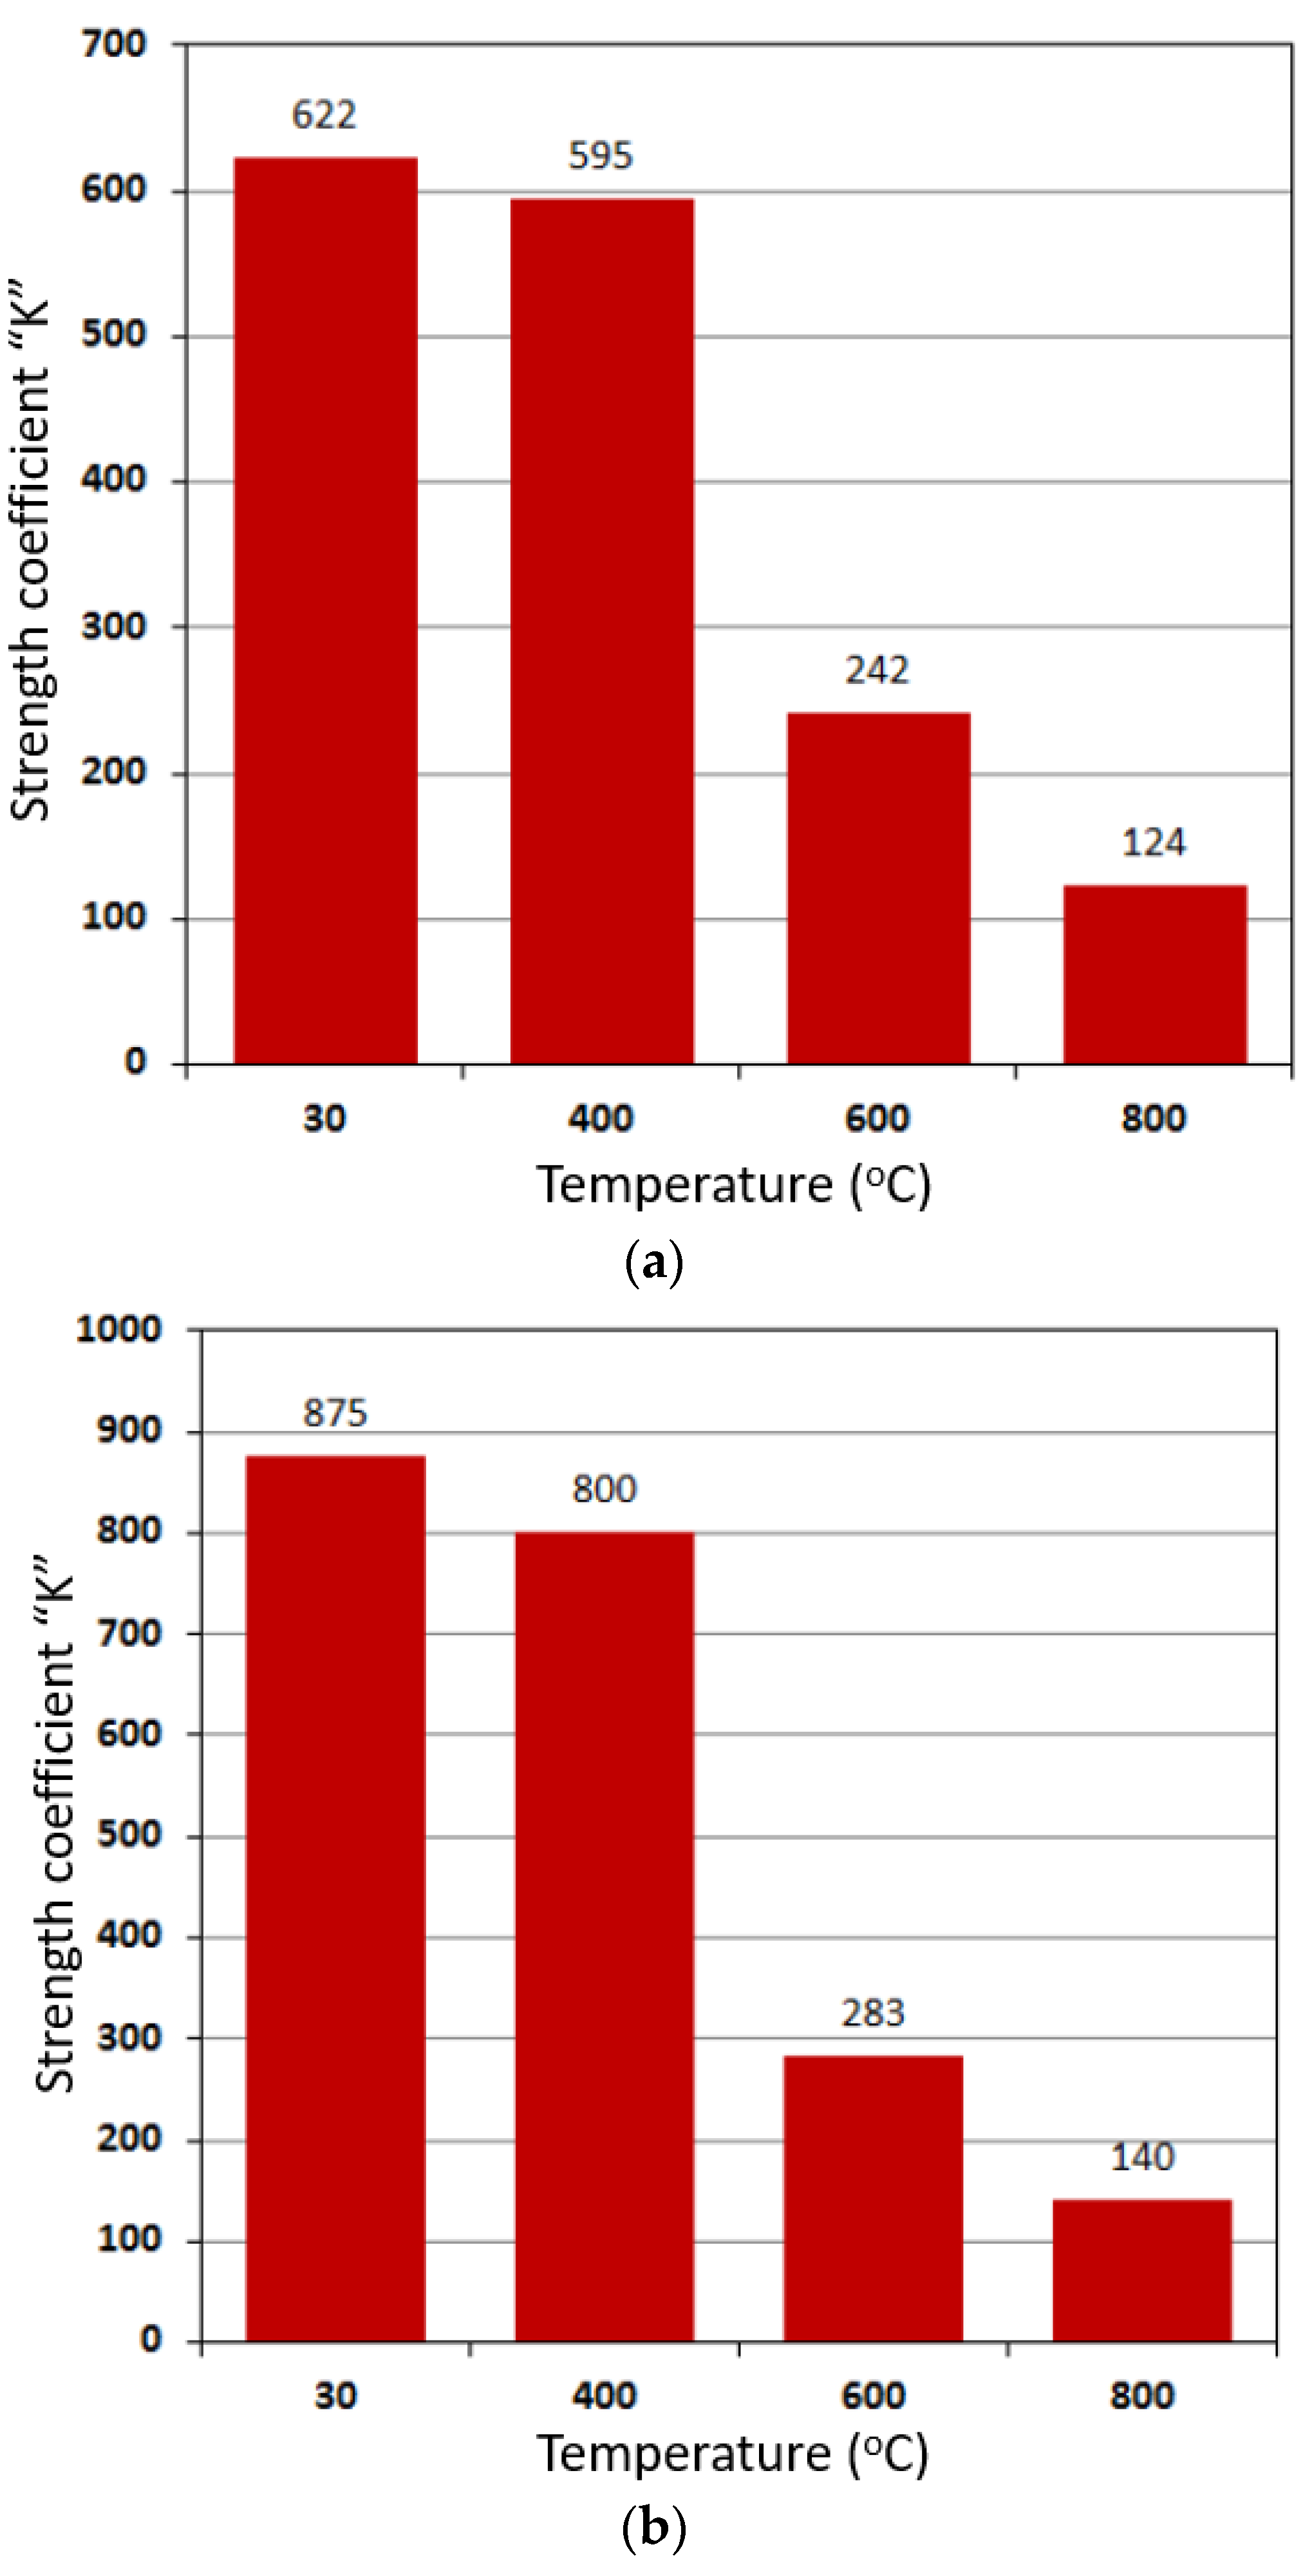
Figure 9, it can be observed that the strain hardening for both materials suddenly drops to very low value at 600 °C. However, at other tested temperatures, the value is very similar. At 800 °C, the strain hardening of DP steel shows a slight increase in the trend. For both steels, the strength coefficient shows a slight drop from 30 °C to 400 °C (
Figure 10). However, this value shows a sudden drop of 59% for HSLA and 64% for DP steel from 400 °C to 600 °C and then about 50% from 600 °C to 800 °C.
The temperatures of the sheet metal at the start and end of the punch movement during the experiments were measured using thermocouple and are detailed in
Table 5. Note that the experiments were performed only at room temperature (30 °C) and 400 °C. It can be seen that the starting temperatures were approximately 400 °C. The measured temperature is not accurate due to the fact that heat is lost in placing the sample in the punch–die set, making sure the followed procedure is safe for personnel and equipment. The table also shows the end temperature of the sheet metal. This measurement was taken when the computer shows that the drop in force means that instability occurred in the sheet metal. The drop in temperature is due to the contact with cold die and punch as well as the convection to the atmosphere.
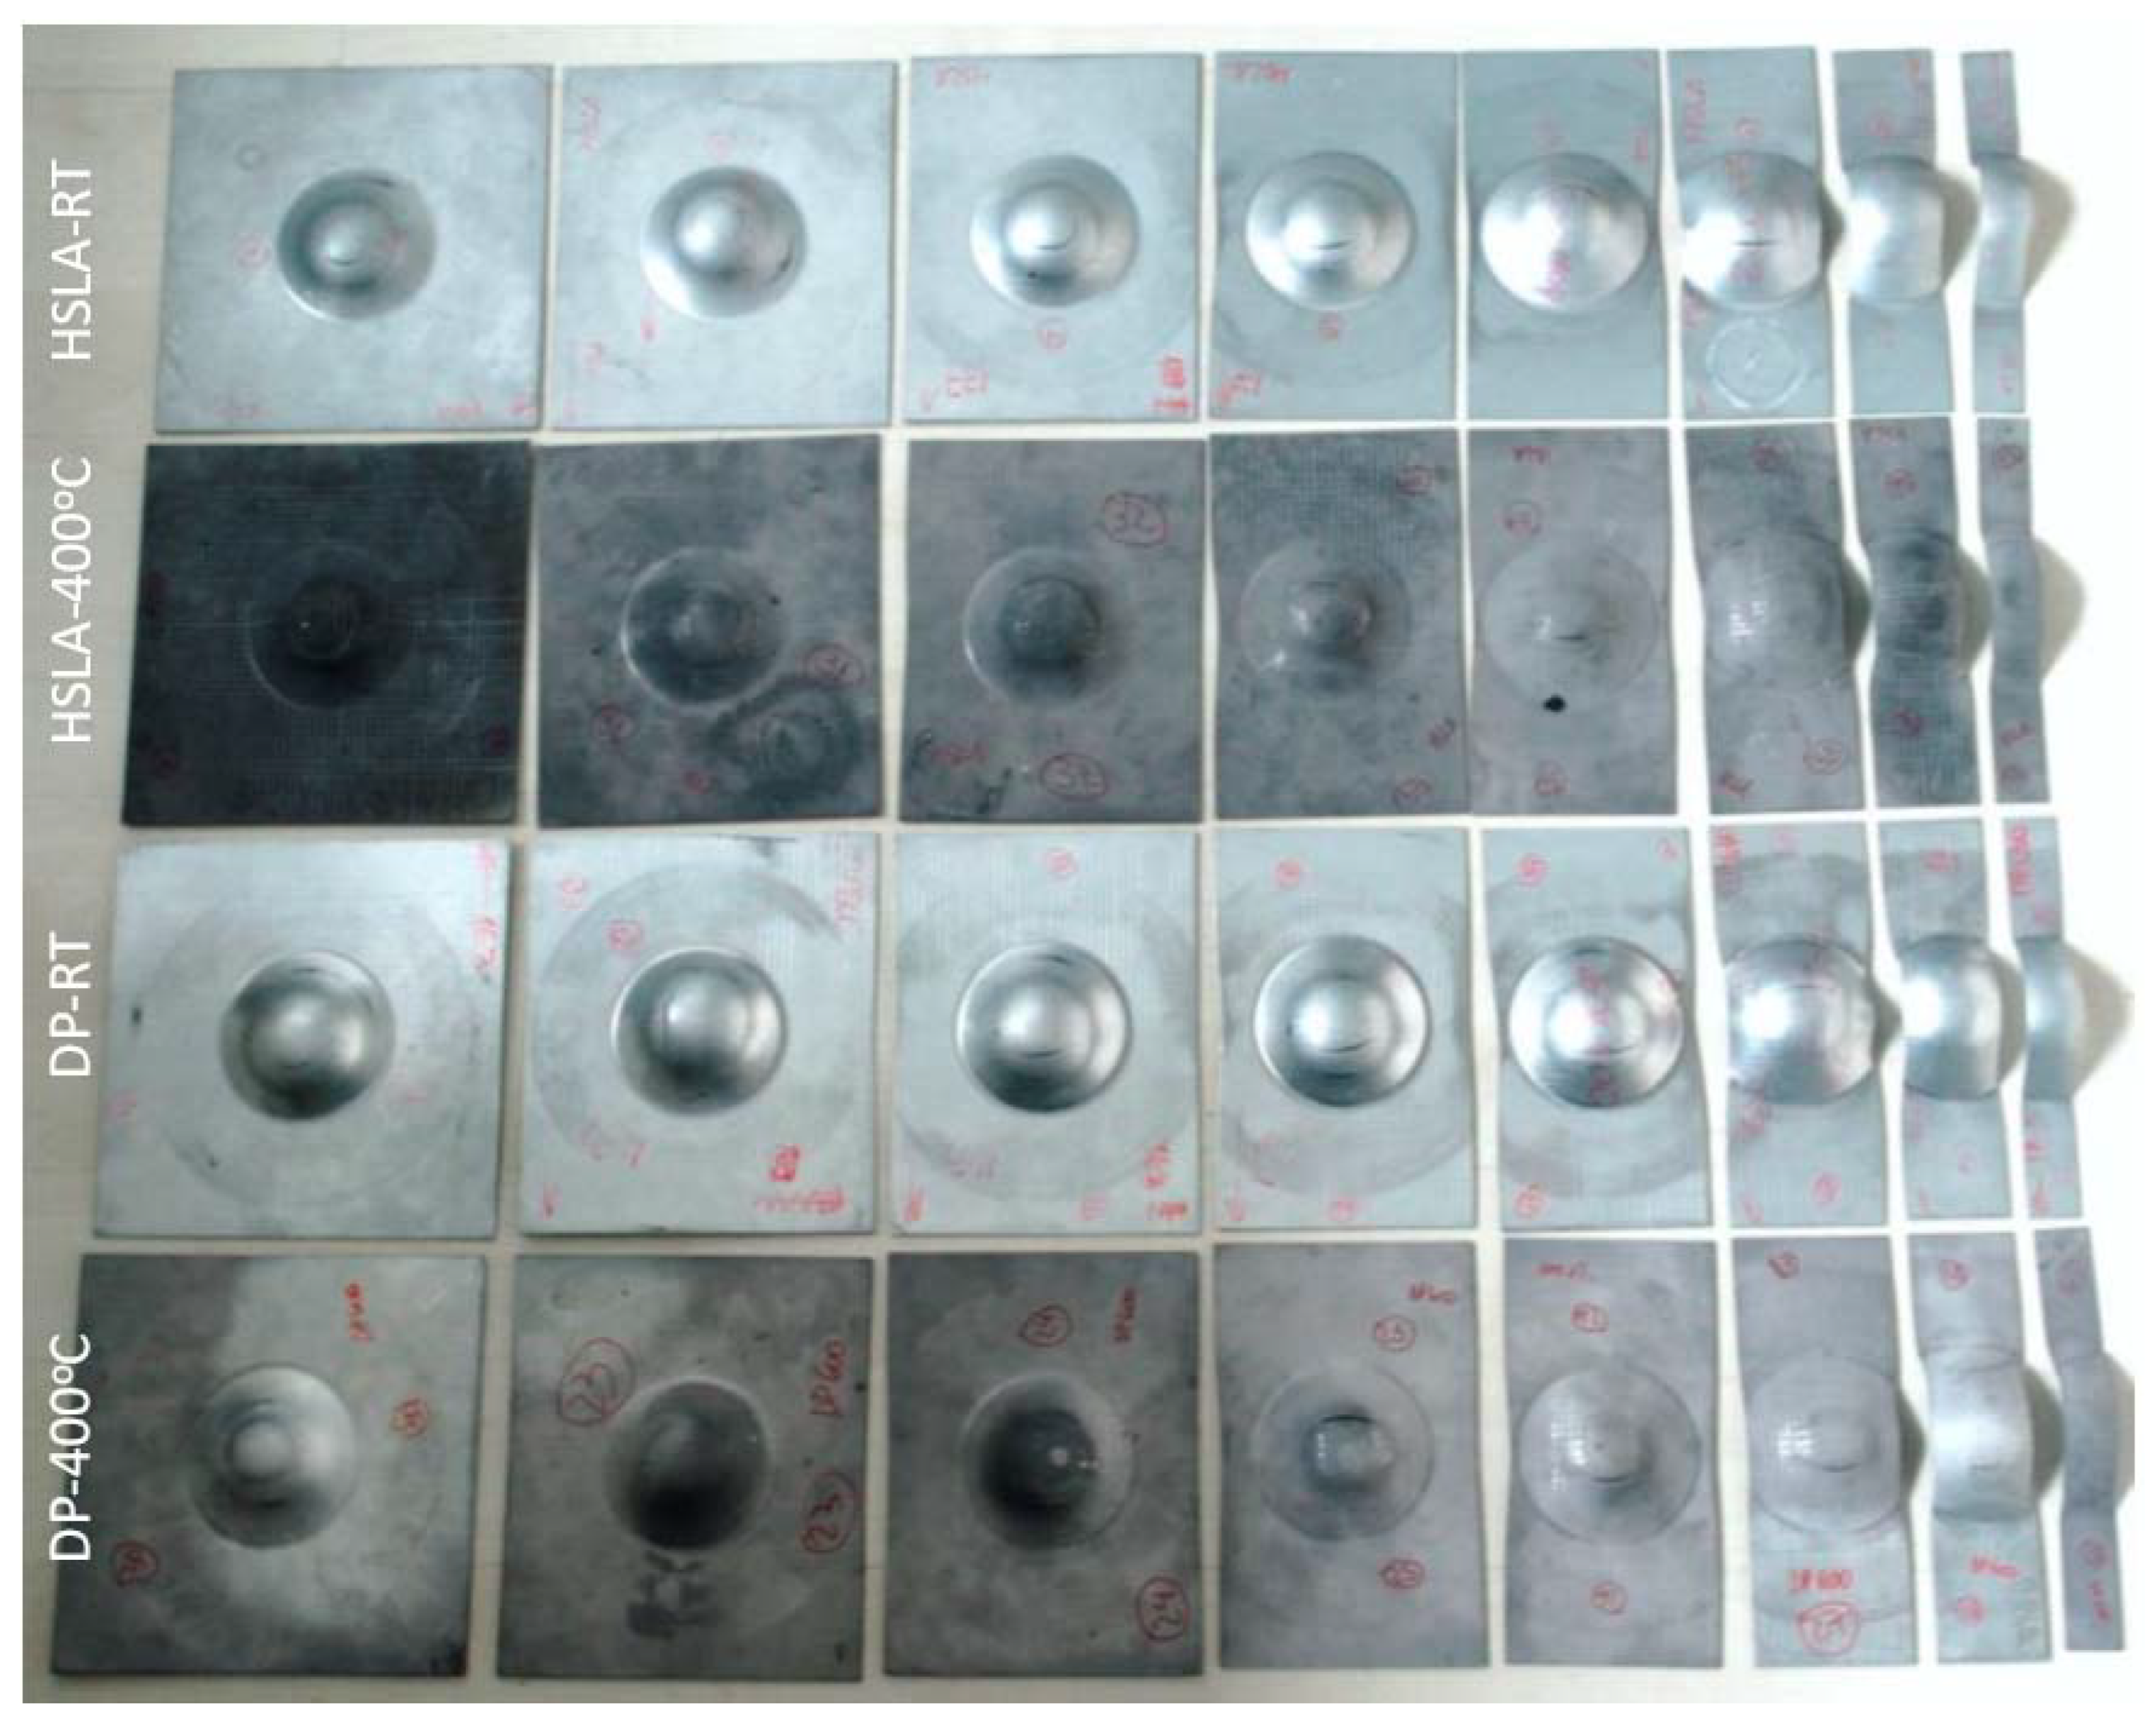
Figure 11 shows the experimental deformed samples of HSLA 350/440 and DP 350/600 at room temperature (RT) and at 400 °C.
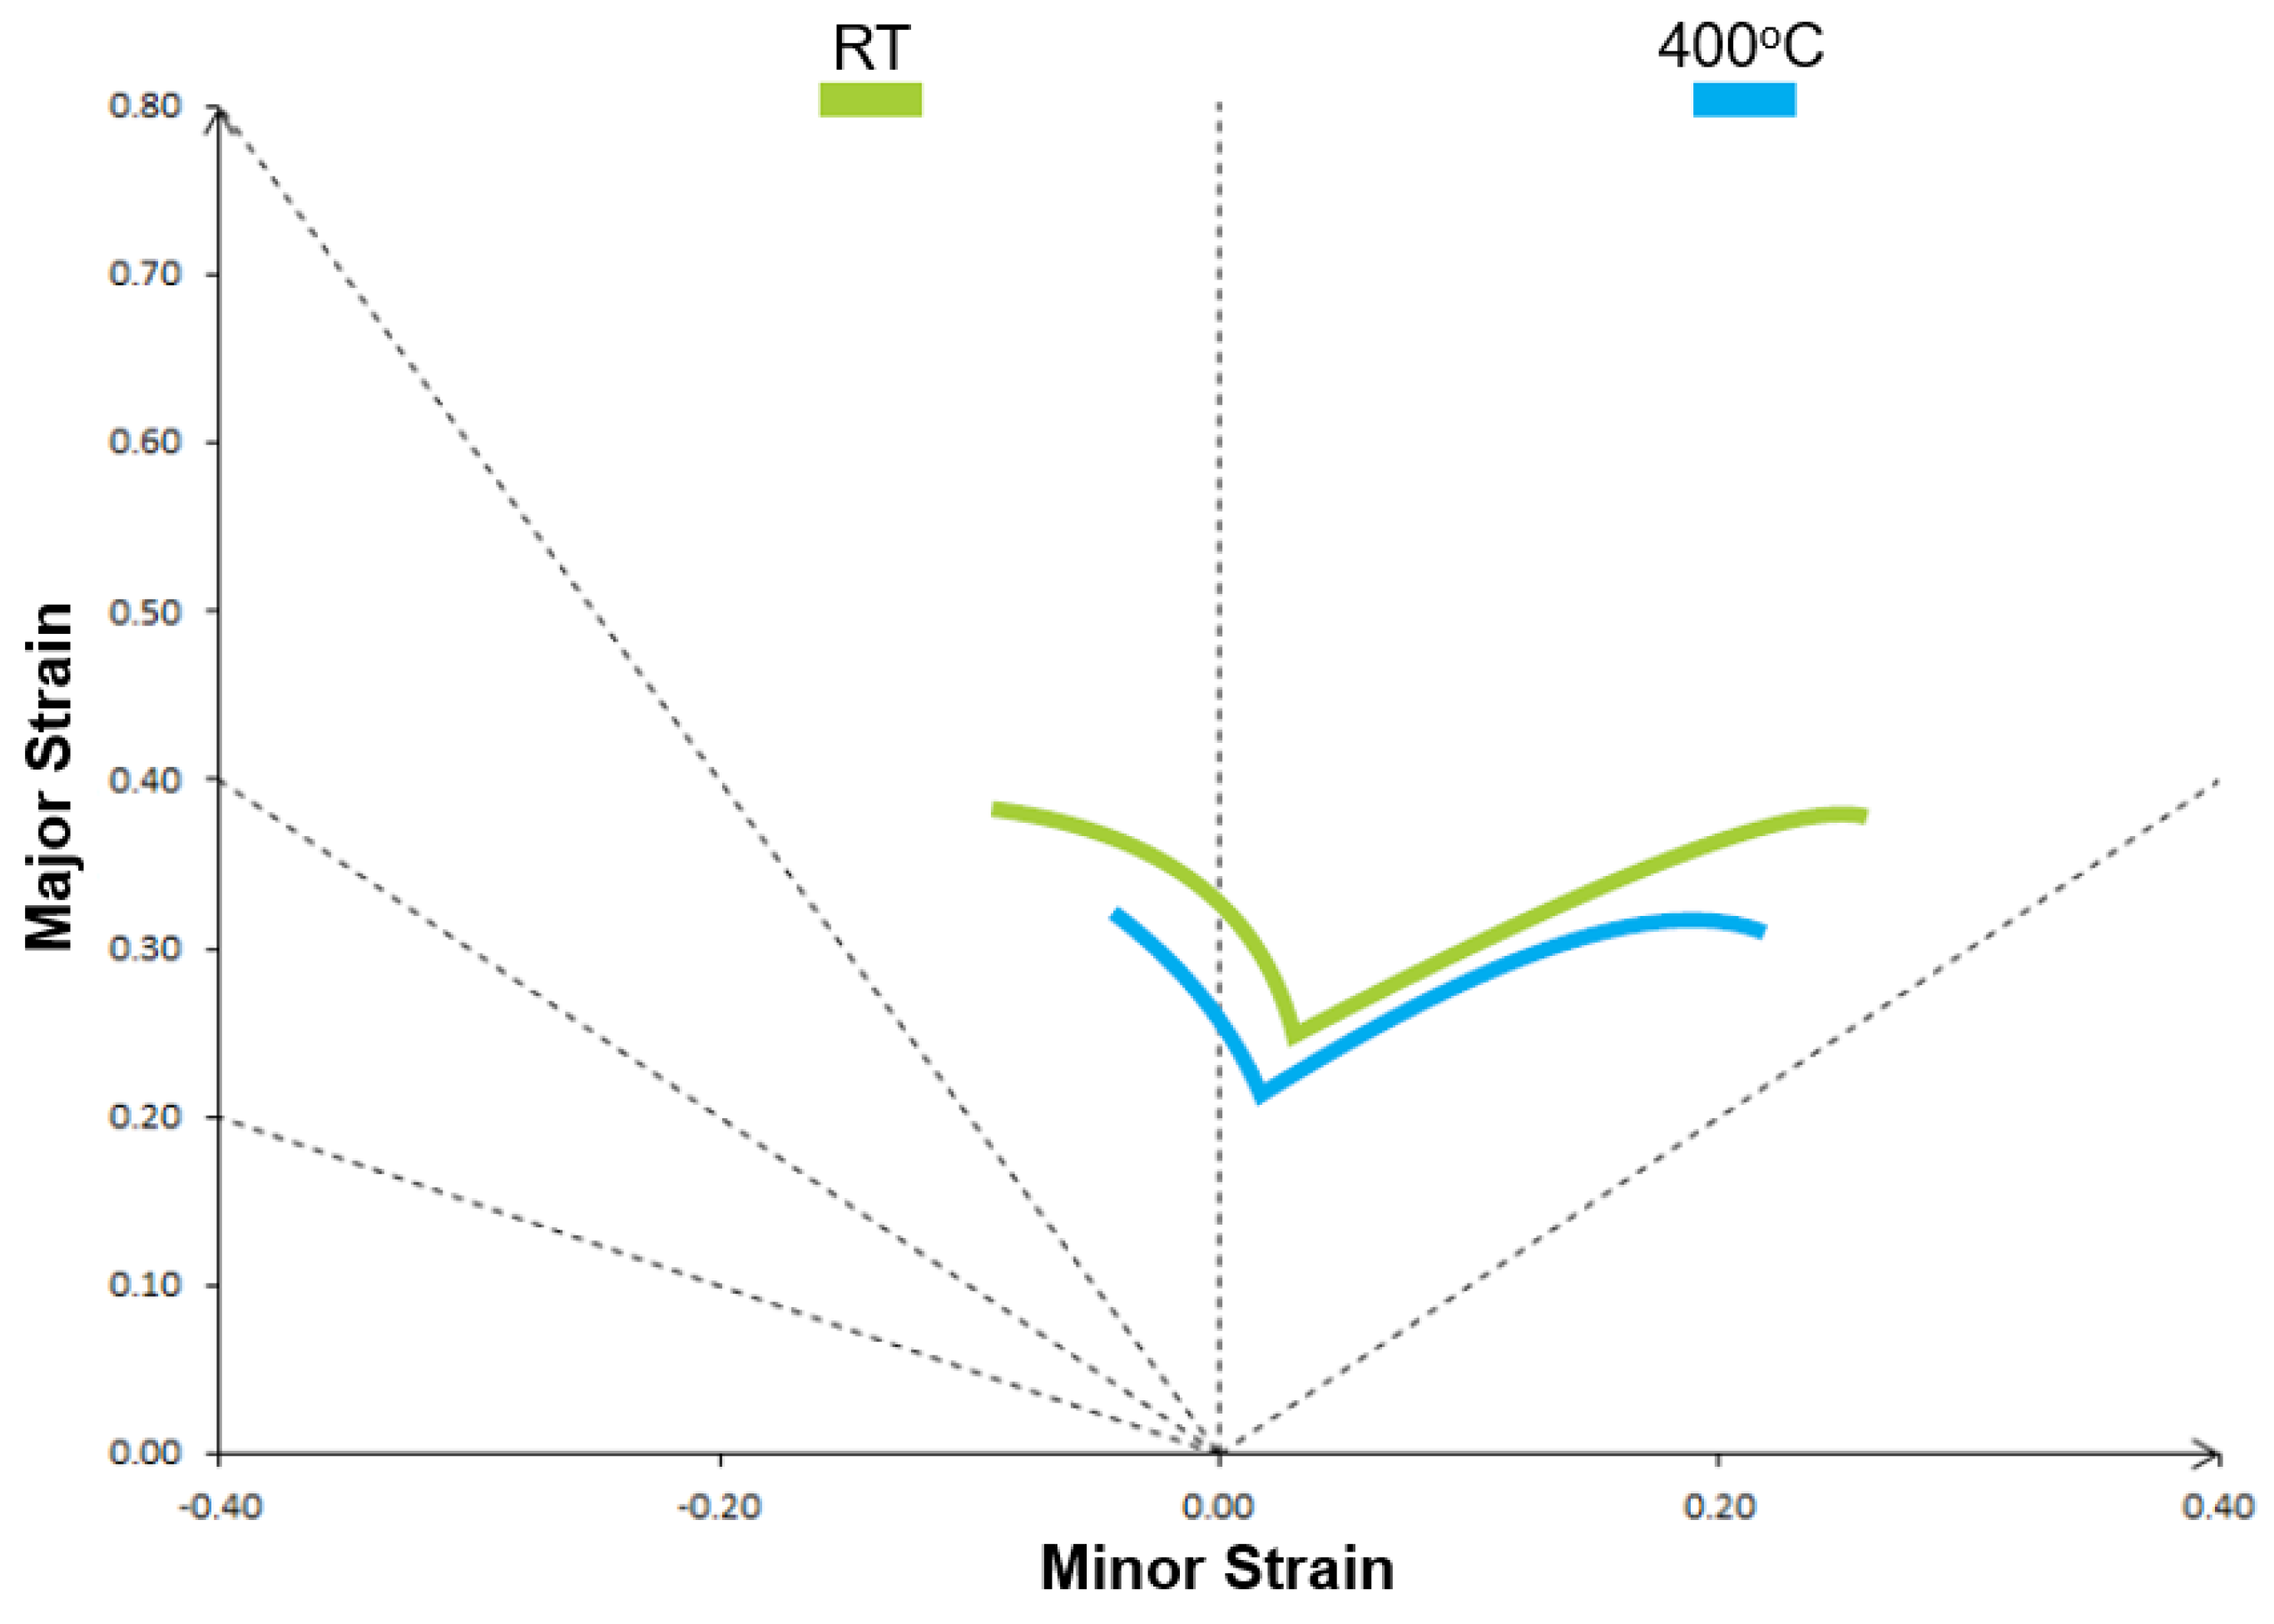
In
Figure 12, the two curves shown are plotted on the same graph in order to visually compare the difference in the behavior of the material at the two temperatures (RT and 400 °C) studied. It can be noted that the limits are very close for uniaxial and biaxial deformation modes, but the Figure shows significant difference at plane strain.
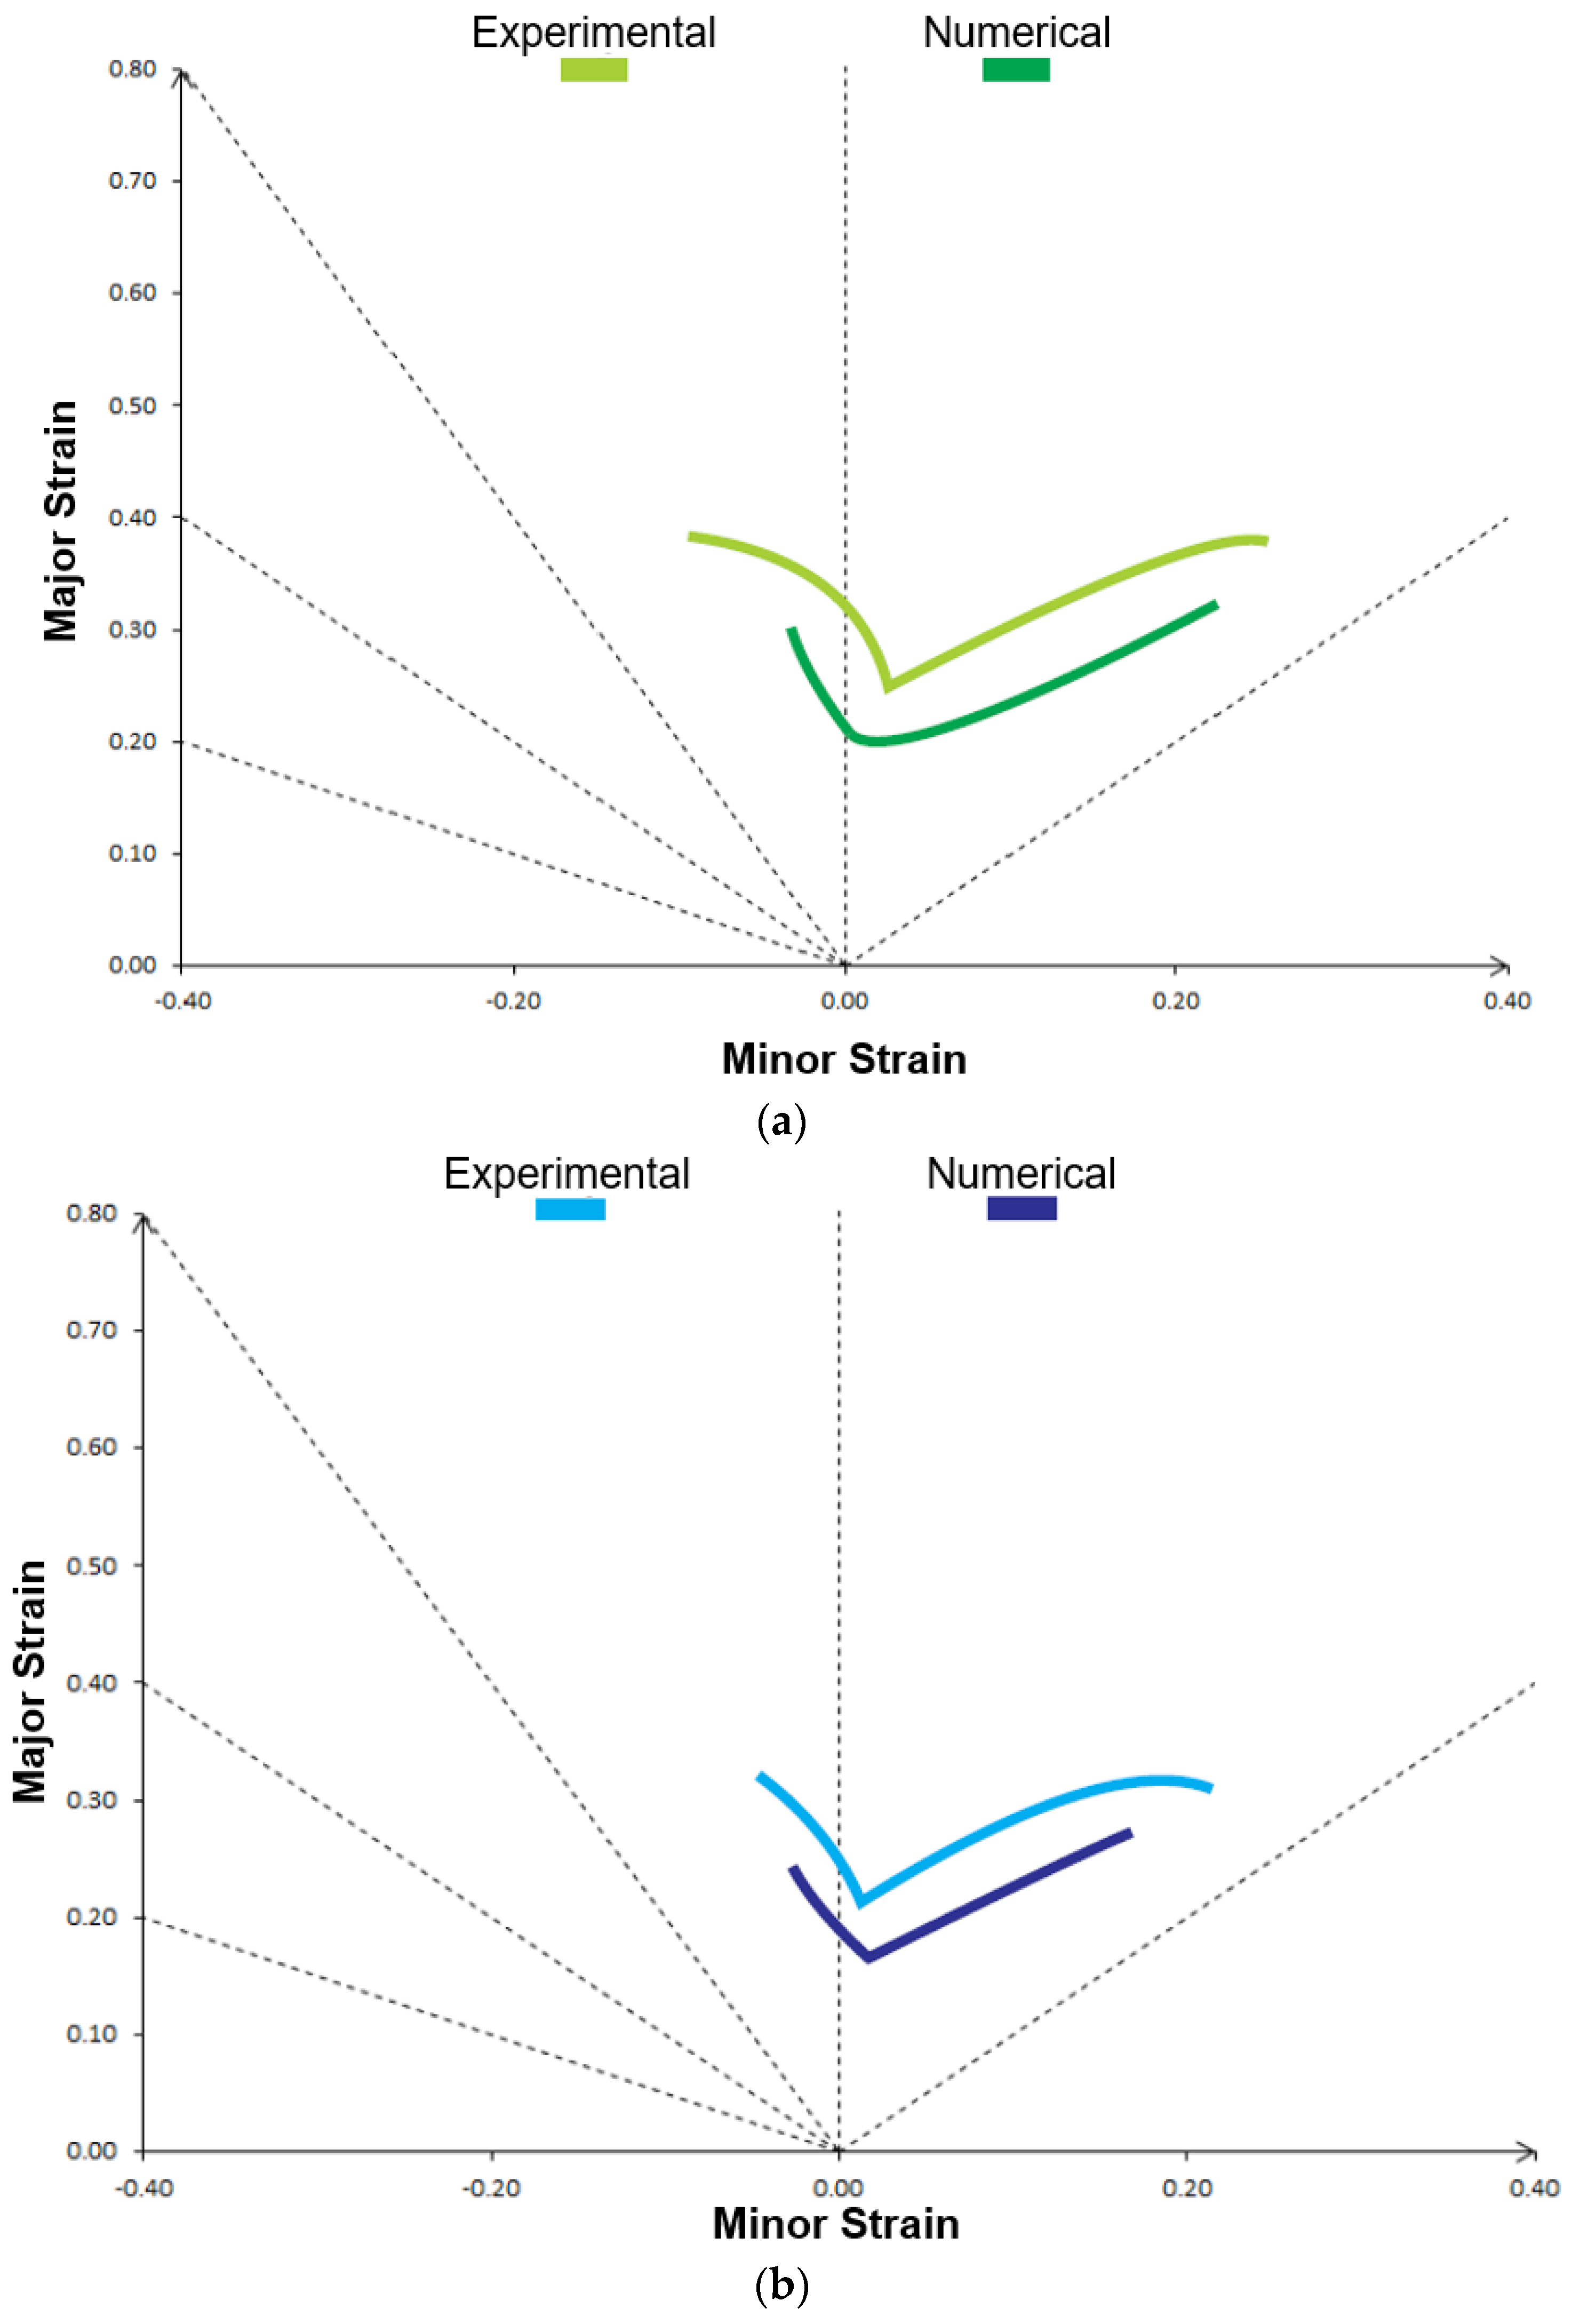
Figure 13a,b shows the comparison of experimental and numerical forming limits for HSLA steel at RT and 400 °C. It can be observed that the trend shows a good match, except at biaxial strain deformation.
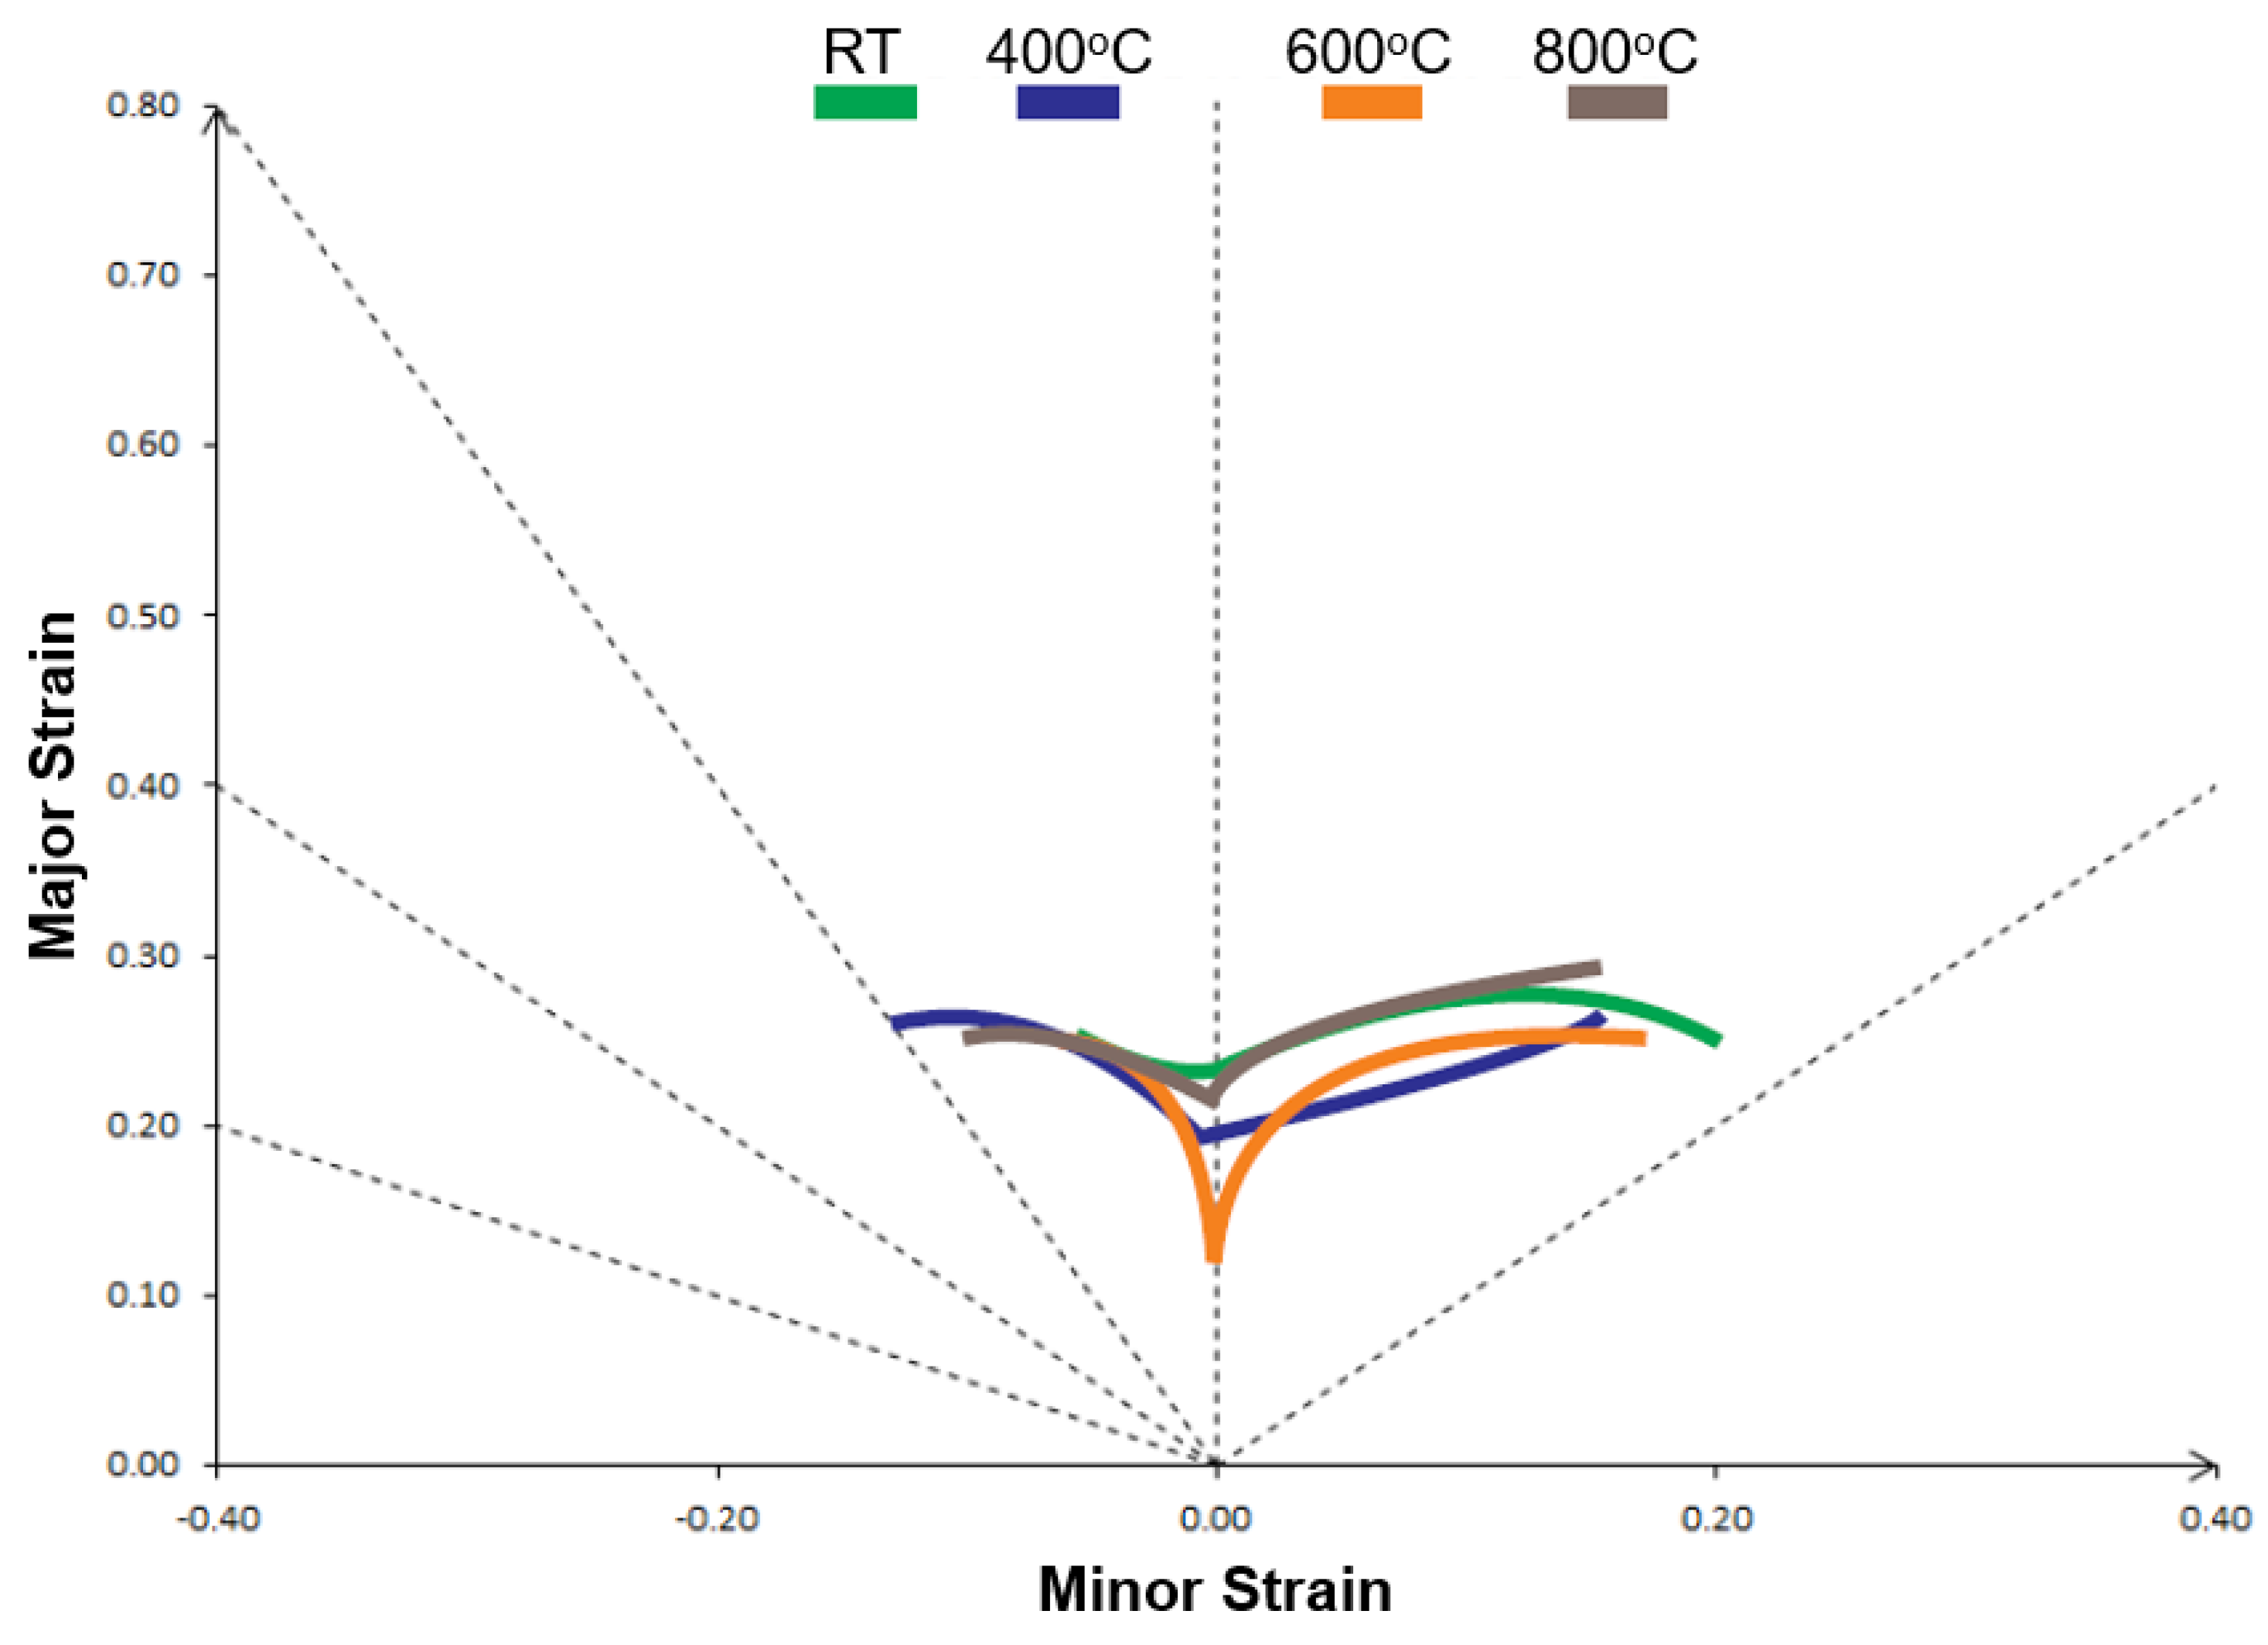
When the four predicted FLC curves from the simulations are compared (
Figure 14), it is noted that there is a decrease in the forming limits at the biaxial strain deformation at 400 °C and 600 °C, compared with the curve at 30 °C. For the plane strain state, this same trend is observed with the addition of a sharp drop in the curve representing the test at 600 °C. In the uniaxial strain state, the four curves are presented as much closer. The curve for the simulation prediction at 800 °C approaches all aspects of the FLC of 30 °C.
In terms of a quantitative comparison, three reference points were taken. In addition to the point on the central axis, which represents the plan strain deformation, the other two extreme deformations, i.e., the uniaxial and biaxial points of both curves, were also compared. The values indicated in
Table 6 corresponds to the largest deformation at the major strain axis.
For HSLA 350/440 steel experiments (
Figure 12 and
Table 6), a significant decrease in the forming limit supported by the material when subjected to the plane strain state was demonstrated (about 34%) when tested at temperature 400 °C compared with tests at room temperature. In contrast, when the other two strain states analyzed, the decreases observed were small—approximately 8% in uniaxial and 4% in biaxial. This may be disregarded in consideration of possible measurements errors.
Therefore, the trend found agrees with the experiments by Goud et al. [
11]; their experiments also experienced a significant drop in the forming limits for the plane strain deformation as the temperature increased from 150 °C to 300 °C, whereas the trend reversed at 450 °C. According to [
11], two possible causes may be responsible for this behavior. The first possibility would be related to the impact of temperature on the mechanical resistance of the material, with the resistance coefficient decreasing up to a temperature of 300 °C, and at 450 °C, it increased. This phenomenon was explained by the presence of silicon and other elements that would increase the density shift due to the dynamic deformation regime for the highest temperature level of 450 °C. For comparison, [
11] has 0.83% silicon and 0.39% manganese in their alloy. In this study, HSLA 350/440 steel has 0.4% silicon and 2.1% manganese. The second explanation presented by [
11] would be related to the effect of temperature on the coefficient of sensitivity to the strain rate. As this coefficient is directly associated with the strain hardening coefficient, Goud et al.’s [
11] study had “
n” varied as follows: 0.304 at RT, 0.274 at 150 °C, 0.289 at 300 °C, and 0.261 at 450 °C. In the present study, for HSLA 350/440, the “
n” varied as shown in
Figure 9a.
As seen in the experiments for RT and 400 °C, the limit strains are relatively close in uniaxial and biaxial deformation. A similar trend was observed in the simulated results (
Figure 14 and
Table 7). In the plane strain mode, the limit at 400 °C shows a drop of 17% and 50% at 600 °C when compared to the limit strains at 30 °C. In the uniaxial deformation mode, the difference is negligible, and in the biaxial strain mode, the drop represents around 13%. The numerical forming limits for 800 °C are very similar, in all aspects, to the 30 °C limit strain, with no difference greater than 10%. Therefore, the results from the numerical simulation also show an effect of temperature at the plane strain deformation mode.
According to experimental tests (
Figure 15 and
Table 8), a decrease in the FLC of the DP 350/600 occurred at a temperature of 400 °C (compared with tests at room temperature). In the three strain states, decreases are similar, i.e., in the order of 6% to 14%.
Figure 16a,b shows the comparison of experimental limits strains with the numerical prediction of the necking. It is observed that the curves do not closely agree; however, the experimental tensile stress–strain data do not provide an accurate replication of the micro deformation at the microstructure level, i.e., the interaction of the hard martensite phase with the softer ferrite phase.
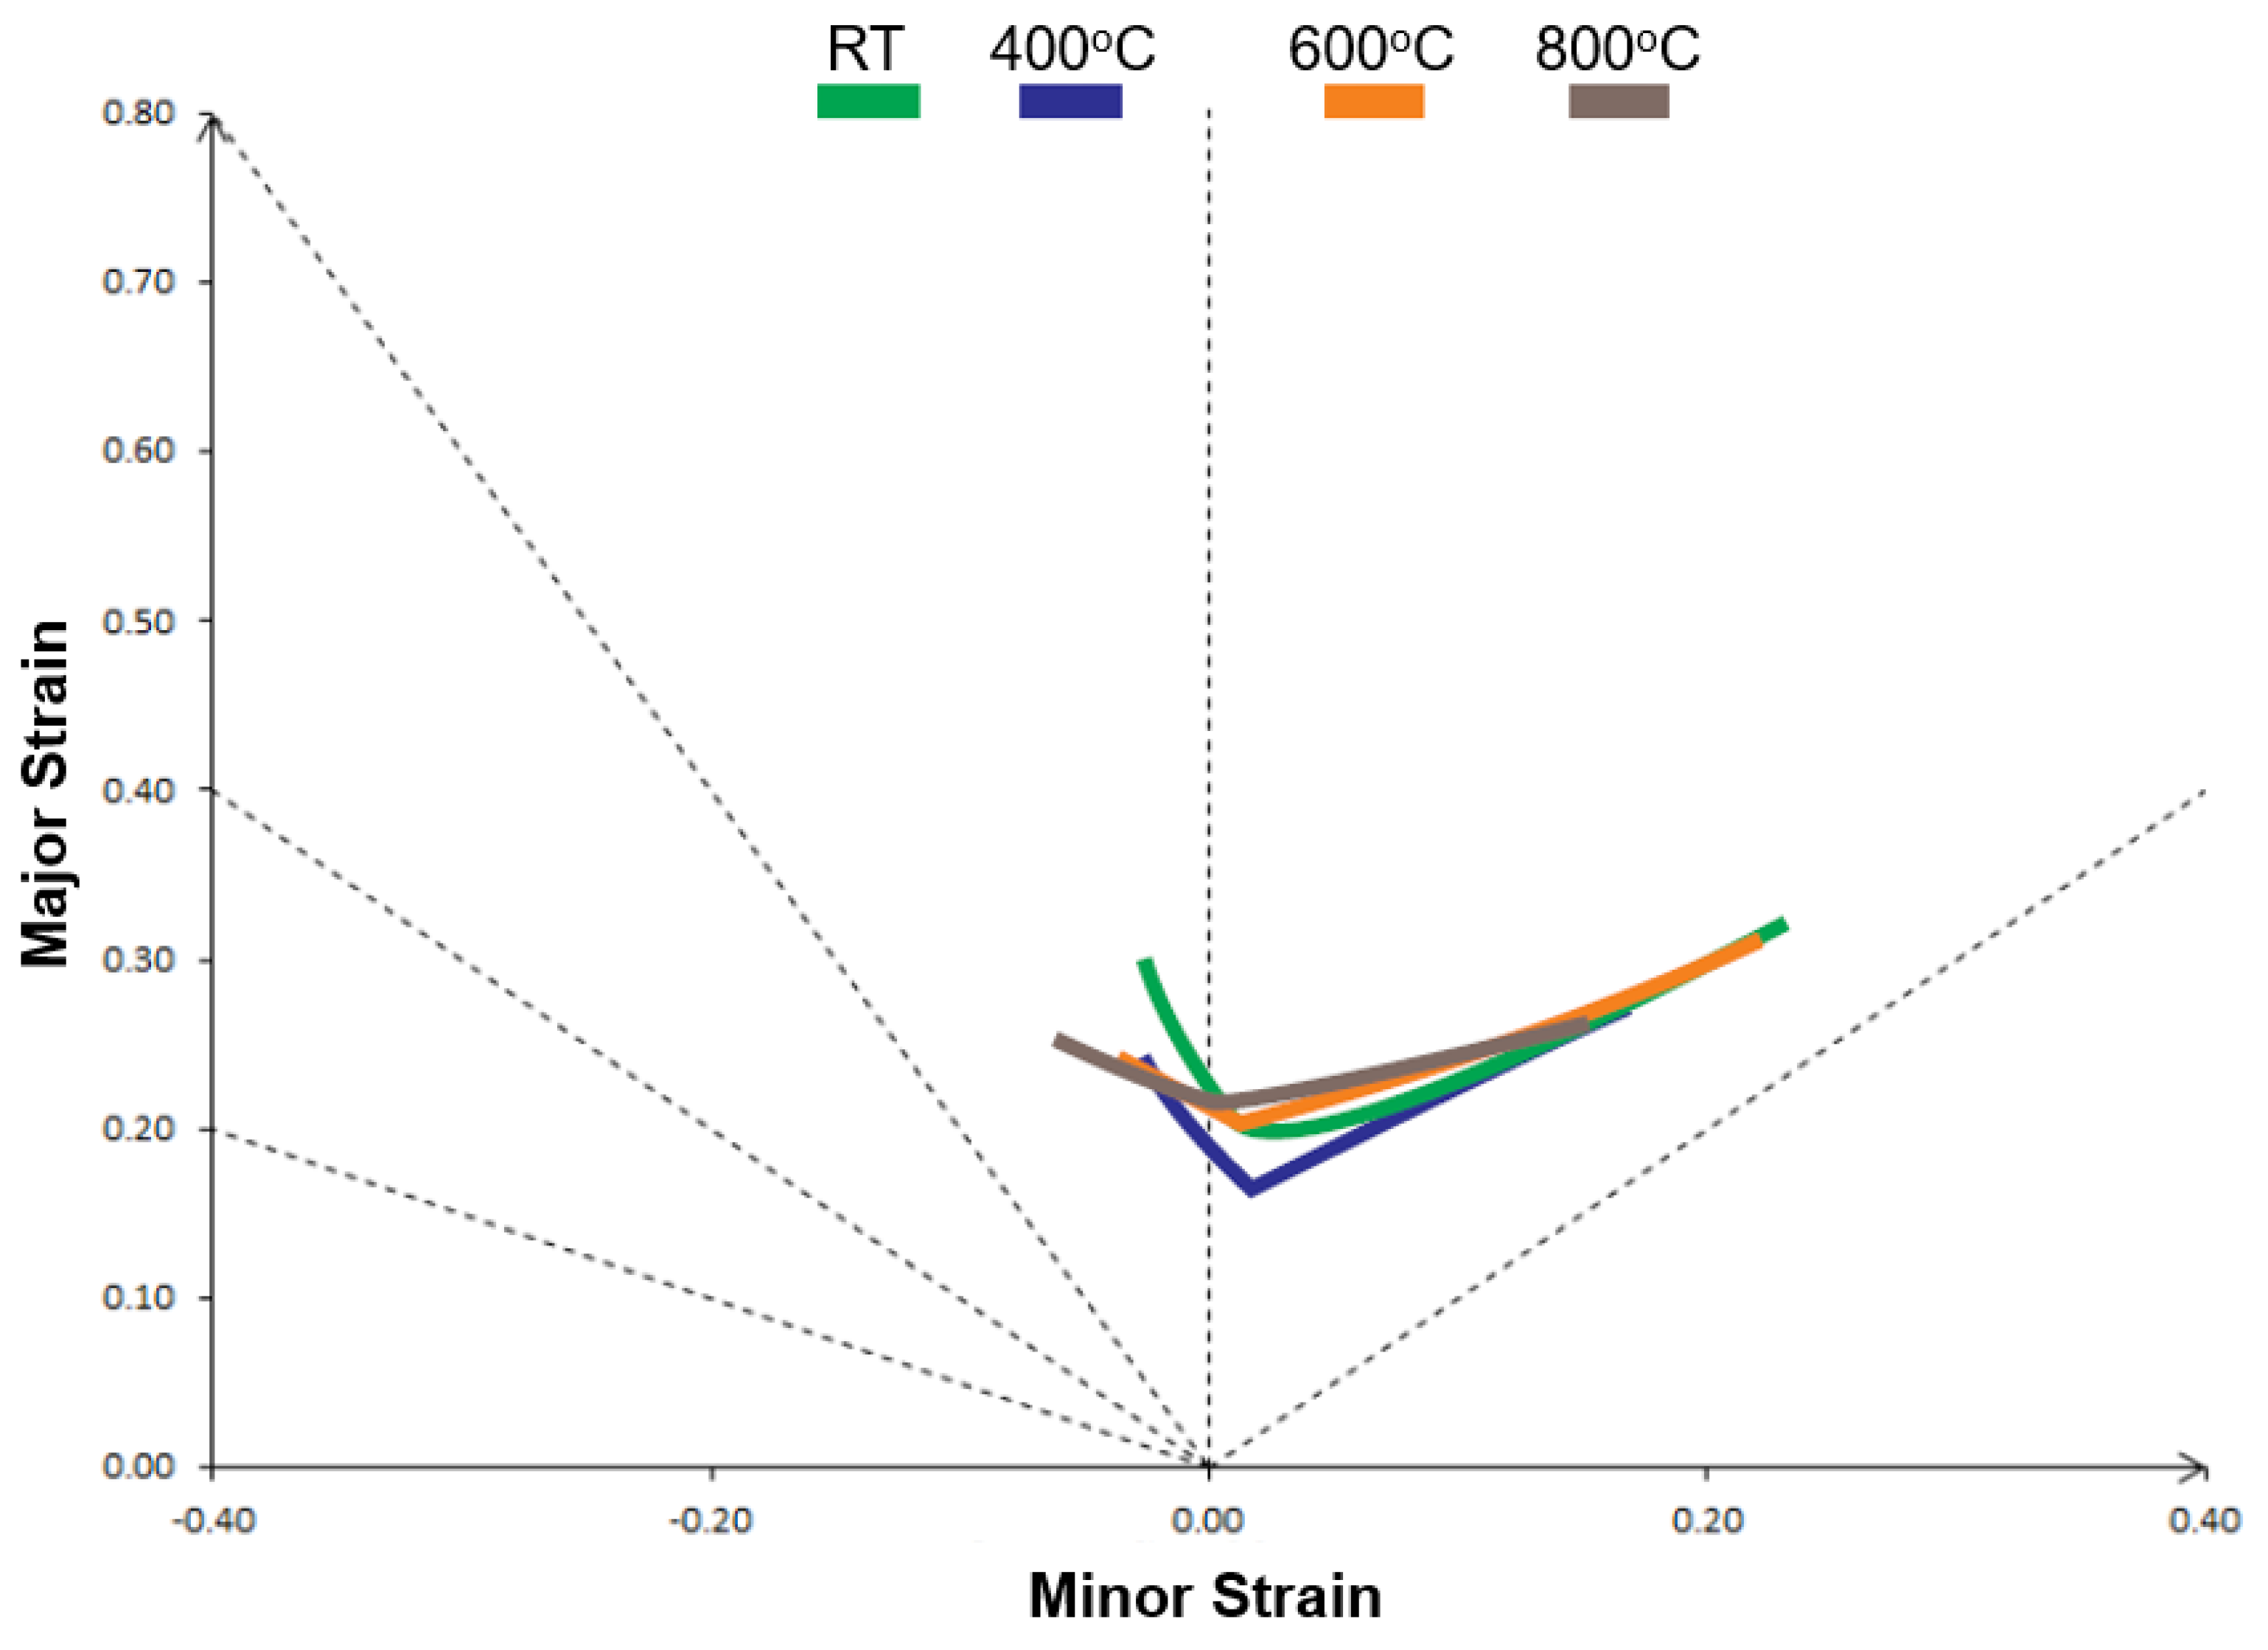
When the numerical FLC’s are compared (
Figure 17 and
Table 9), the biggest difference in the biaxial strain state between the curves is just over 5%. In the uniaxial strain state, the second highest limit is the FLC at 600 °C (about 22% below the FLC at 30 °C), followed by the FLC at 800 °C (about 24% lower) and 400 °C, with about 29% below the curve at 30 °C. For the plane strain state, the two highest temperature curves taken exceed the FLC at 30 °C, and at 400 °C, the curve shows a limit of about 15% less than 30 °C. If similar reasoning applied as explained by Goud et al. [
11], the effect of temperature would be a decrease in the limit strain on the plane strain deformation at 400 °C and then an increase to the similar value at room temperature. It is worth noting that DP 350/600 steel consist of 0.03% silicon and 0.6% manganese. Other reasoning may be related to the interaction of the hard and soft phases at higher temperature. At 400 °C, which is still lot lower than the eutectoid temperature, the deformation may be affected by the softer phase of ferrite, martensite may have held it strength, and due to higher strength difference, the material may have failed earlier than expected; while for 600 °C and 800 °C, they are just below and above the eutectoid temperature, where the martensite is about to change the phase, and the strength of this phase is comparatively less different than the softer ferrite phase; thus it has gained formability and shown higher limit strains.
