Article

Microstructural and Mechanical Analysis of Seamless Pipes Made of Superaustenitic Stainless Steel Using Cross-Roll Piercing and Elongation

by
Alberto Murillo-Marrodán
1,*,
Yury Gamin
2,
Liudmila Kaputkina
2,
Eduardo García
1,
Alexander Aleshchenko
2,
Hamed Aghajani Derazkola
1,
Alexey Pashkov
2 and
Evgeniy Belokon
2
1
Department of Mechanics, Design and Industrial Management, University of Deusto, Avda Universidades 24, 48007 Bilbao, Spain
2
Department of Metal Forming, National University of Science and Technology “MISIS”, 4 Leninsky pr., Moscow 119049, Russia
*
Author to whom correspondence should be addressed.
J. Manuf. Mater. Process. 2023, 7(5), 185; https://doi.org/10.3390/jmmp7050185
Submission received: 20 September 2023 / Revised: 10 October 2023 / Accepted: 11 October 2023 / Published: 14 October 2023
(This article belongs to the Special Issue Advances in Material Forming)

Abstract

:
The cross-roll piercing and elongation (CPE) is a forming process performed at high temperatures and high strain rates. The final product quality is strongly dependent on its microstructure. In this study, a finite element method (FEM) model was developed to better understand plastic deformation effects on microstructure during CPE and to analyze alternative thermo-mechanical processing routes. Specific models were used to simulate dynamic and meta-dynamic recrystallization (DRX and MDRX) for the processing of superaustenitic stainless steel (SASS). In addition, the CPE of SASS was investigated experimentally. The microstructure, mechanical properties, and chemical changes of the final product were assessed using optical microscopy, hardness testing, X-ray diffraction, and SEM-EDS. The results revealed higher temperatures and strain rates in the exterior area of the shell after piercing, and MDRX occurred in the whole thickness. However, an average grain size reduction of 13.9% occurred only in the shell middle and inner diameters. During elongation, the highest values of the strain rate and DRX were observed in the inner region, exhibiting a grain size reduction of 38%. Spread in terms of grain size and grain shape anisotropy was found to be less accentuated for tube samples as compared to the pierced shells.

1. Introduction

Superaustenitic stainless steel (SASS) is widely used in aerospace, nuclear power, chemical, oil, and other industries due to its high strength and excellent corrosion resistance [1,2,3]. This group includes 904L, which is a low-carbon, high-alloy, non-magnetic SASS. Due to the increased corrosion resistance, which is provided by the high content of Cr, Mo, and Ni in the chemical composition, this steel is used for operations in aggressive environments, including at elevated temperatures [4]. Therefore, these properties make this material highly suitable for the production of SASS tubes intended for long-term service conditions under high temperatures and pressures, mechanical loads, and self-weight [5].
There are several industrial manufacturing processes available to produce seamless pipes and tubes. Among the most prominent are pressing methods, such as forward and backward extrusion [6]. Other methods have been investigated, such as tubular channel angular pressing (TCAP) [7], that lead to ultrafine grained products but are limited to laboratory scale conditions [8]. However, in large tubular diameters, the hot cross-roll piercing and elongation method (CPE) is considered to be the most widespread [9,10]. In the CPE process, it is important to understand the microstructure formation and properties of the finished product. With regard to mechanical properties such as tensile strength, yield strength, and other characteristics, finer-grain-size structures play an important role [11]. Thus, data on the deformation behavior of a material under industrial conditions can be useful for reducing production costs, optimizing deformation parameters, and obtaining products of the required quality. In addition, dynamic (DRX), meta-dynamic (MDRX), and static (SRX) recrystallisation occur during such hot rolling and multi-stage drilling processes. These phenomena also contribute significantly to the formation of a certain grain structure and the required level of mechanical properties and, therefore, must be taken into account when developing the manufacturing process [12,13,14,15,16]. At the moment, a large number of studies have been carried out on the features of the stainless-steel tube piercing and rolling processes [17,18,19]. However, most of them have been aimed at studying the wear resistance of the tool, the accuracy of pipes, or the piercing parameters to be selected [20,21,22]. Those who focus their analysis on the microstructure of the material do so through the experimental study of samples collected after the process. This is the case of Ding et al. [23] who analyzed the resulting microstructure of magnesium alloyed seamless tubes, showing how the CPE process improved the UTS and elongation of the material.
Nevertheless, an alternative approach for assessing and improving tube-piercing processes is simulation. Zhang et al. [24] investigated the problems associated with the piercing of thick-walled tubes of bimodal titanium. With this aim, a finite element method (FEM) model of the CPE process was developed to analyze the deformation conditions, and experiments were performed afterward to conclude that the resulting bimodal structure is influenced by reduction rate and rolling speed. In a posterior study, the CPE of nickel alloys [25,26] was assessed by developing FEM simulations of the process. From the simulation results, a set of optimum process parameters to control the external separation layer defect in thick-walled tubes was proposed. Regarding the association between FE simulation and material restoration during the CPE process, Murillo-Marrodán et al. [27] developed an incremental constitutive model that allowed for the identification of the regions of the material that were exhibiting DRX, but no experiment confirmed the conclusions. Other contributions have established an indirect connection between the simulated deformation conditions and experiments by analyzing the microstructural changes of pierced tubes of nickel-based alloys [28].
In the case of austenitic steels, it is known that one of the effective methods of hardening is ageing; however, when hardened, such steels have a tendency of showing low-strength properties [29]. Therefore, depending on the product requirements, it may be possible to implement thermomechanical treatment (with quenching performed immediately upon hot deformation) of pipes with high ductility and low strength for the subsequent stage of the cold deformation of thin-walled pipes, or a full cycle including hot deformation followed with ageing of pipes, to increase strength.
The purpose of this study was to investigate the changes in the microstructure and properties of the SASS AISI 904L during CPE and quenching in the stages of piercing and elongation. The development of a FEM model and the experiments carried out were used to understand the deformation mechanisms and chemical changes of the material during the manufacturing process. The final goal was to assess the possibility of implementing such industrial technology for producing seamless tubes from this steel grade.

2. Materials and Methods

2.1. Tube Material

In this study, a SASS bar was used as tube material. The tube material was provided from a local market, and its chemical composition was evaluated in the laboratory. The composition is presented in Table 1.
In order to document AISI 904L properties before CPE, the microstructure of the provided bar was evaluated using optical microscopy. The microstructure of the external and central area of the bar transverse section was analyzed. The initial material had a heterogeneous microstructure with various kinds of inclusions. The average grain size in the external area of the bar was 20 µm, and it was 76 µm in the central zone. The optical microscopy images of the external and central areas of the provided AISI 904L SASS are presented in Figure 1a and 1b, respectively. The Vickers hardness of the billet in the central area was ~40 HV, while ~60 HV was measured in the external area.

2.2. Cross-Roll Piercing and Elongation Process

The CPE process was performed experimentally to analyze the tube material’s microstructural changes during plastic deformation. This process consists of two phases: first, the piercing phase, and second, the elongation phase. The schematic view of both piercing and elongation phases are presented in Figure 2a and Figure 2b, respectively.
Both phases were carried out with a MISIS-130D pilot mill (Figure 3a). The machine included working rolls, guiding tools, and power supplement sections. The barrel-shaped working rolls of the mill had a biconical gauge with an entry angle of roll cone φ1 = 2.5° and exit angle φ2 = 3°, respectively. The feed angle of the rolls was β = 14°. The gorge of the rolls (zero position of the deformation zone) was at the section of the maximum diameter of the roll. The material of the rolls was steel 45 with roll surface hardness of 200 HB. The rotational speed of the working rolls was set to 57 rpm, similar to those used in industrial processing of other steels. Guide shoes were made of high-nickel cast iron with hardness of 60–62 HRC. For the piercing stage, a plug of a 57 mm diameter with a taper angle of 6.5° was used. For the rolling stage, a cylindrical plug of a 57 mm diameter was used. The material of both mandrels was a high-Ni-based alloy. The temperature of the tool during piercing was equal to the ambient temperature (20–25 °C). The tool was cooled with water between passes. A forged round bar with a diameter of 80 mm and length of 220 mm was used as the incoming billet. A centering recess of 20 mm diameter and 30 mm depth was drilled in the center of the billet head end. Before deformation, billets (bars or shells) were heated in a chamber-type electric resistance furnace up to a temperature of 1170 °C for 60 min and 15 min, respectively. The transportation time of the billets from the furnace to the inlet of the piercing mill was ~8 s.
The dimensions of the resulting shells and pipes, the current load on the main drive electric motor, and the process time for piercing and elongation were recorded during the experiment. The wall thickness (WT) was measured at four points within 100 mm away from the pipe head and tail ends. The shell after piercing and the pipe after elongation were subjected to cooling with water at the exit of the pilot mill during the manufacturing process. For that purpose, several nozzles for water supply were installed at the exit of the stand at a distance of ~200 mm from the rolls end (Figure 3b). The time between exiting from the deformation zone and cooling with water was no more than 0.7 s in both stages of the process. The mandrel extraction operation took approximately 15 s in both stages; during this period, the section of interest of the shell/pipe was positioned under the water nozzles to cool down that region rapidly. Then, the pipe/shell was completely immersed in a container with water at a temperature of 20–25 °C. For further research, branch pipes 100 mm long were cut out from the area 100 mm away from the pipe head end, for which the time, temperature, and deformation conditions of rolling and cooling along the length can be considered the same.

2.3. Characterization

The microstructure was analyzed using Carl Zeiss Axio Lab. A1 optical microscope equipped with ImageJ (National Institute of Mental Health) program [27]. For microstructure evaluation, three zones across the pipe wall thickness were selected: external surface, mid-wall thickness, and near the internal surface. In addition, images of the microstructure were taken in the longitudinal section of the samples on the “flat spots” made on the external and internal surfaces as shown in Figure 4. The samples were polished using a diamond suspension cloth, followed with electrochemical etching in oxalic acid solution (the solution concentration was saturated) with a voltage of 3–4 V for 5 to 30 s.
Hardness measurements were carried out on a DUROLINE MH-6 hardness tester using the Vickers scale on both transverse and longitudinal specimens near the external and internal surfaces in the longitudinal section; the following parameters were used: load of 300 kgf, holding time of 10 s. The distribution of hardness in the cross-section of the pipe’s WT was created with steps of ≈0.5 mm; the number of measurements per point was ≥5.
X-ray structural analysis was performed on longitudinal samples using a DRON-8 general-purpose diffractometer. The scanning area corresponded to a distance of no more than 0.3 mm from the internal and external surfaces of the sample (Figure 4). Scanning parameters: radiation—CoKα; measurement range 2θ, from 25 to 120°; voltage, 40 kV; current, 20 mA; scanning step, 0.05°; exposure time, 4 s—discrete mode, processing performed using the PDF-2 database Release 2014 ICDD.

3. Modeling and Simulation of the Process

In this study, CPE was modeled and simulated using FEM. The FEM model of the piloting mill, including the stages of piercing and elongation, was developed in FORGE NxT. Firstly, the mathematical expressions implemented in the FE software to determine the material flow stress and microstructural changes during the CPE process are presented.
The flow stress of the material is dependent on the working conditions, namely, temperature, strain rate, and strain, according to:
σ = 3660.84 · e x p 0.0028 T · ε 0.066 · ε ˙ 0.1027 e x p 0.0387 ε ,
where σ is the flow stress, T is the temperature, ε is the strain, and ε ˙ is the strain rate. The prediction of the required conditions for the onset of dynamic softening mechanisms is considered to be one of the most relevant aspects of the microstructural changes. The Zener–Hollomon parameter Z was used to determine the deformation conditions (temperature and strain rate) at which DRX occurred.
Z = ε ˙ exp Q R T ,
where ε ˙ is the strain rate, Q is the activation energy of 443 kJ mol−1 [28], R is the universal gas constant, and T is the temperature. If Z exceeds the limiting condition Z c = 8.34 · 10 18 , the probability of DRX becomes very low, while for Z values lower than Z c , DRX occurs.
Moreover, once the previous condition is satisfied, the values of peak strain ε p   and critical strain ε c   for every deformation condition can be calculated according to [28]:
l n ε p = 11.21 + 0.24 l n Z , and
l n ε c = 12.39 + 0.25 l n Z ,
where Z is the Zener–Hollomon parameter. After calculating both the peak and the critical strain, the dynamically recrystallized volume fraction X d r x can be estimated using the kinetics model, resulting in
X d r x = 1 exp 0.0654 ε ε c ε p 1.73 .
In the case of MDRX, the onset depends on the simultaneous fulfilment of several conditions: the material presents plastic deformation higher than the critical value to initiate DRX ε > ε c , there is previous dynamic recrystallization in the region X d r x > 0 , and the material is not being deformed ( ε ˙ = 0 ) . In addition, the onset of MDRX also takes place whenever the material volume fraction recrystallizes dynamically reaches at least 95% ( X d r x > 0.95 ) [29].
The calculation of the meta-dynamically recrystallized volume fraction X m d r x was performed using Avrami-type equations based on the experimental work conducted by Zhang et al. [30]. For this purpose, firstly, the time required for a 50% meta-dynamically recrystallized volume fraction t 0.5 was calculated:
t 0.5 = 4.57 · 10 15 ε ˙ 0.35 exp 385.85 R T .
The time t 0.5 is mainly dependent on the chemical composition of the material and the deformation conditions. Then, the kinetic equation for calculating the volume fraction yields
X m d r x = 1 exp 0.693 t t 0.5 0.53 ,
where t is the time interval elapsed since the end of the plastic deformation. The higher the temperature, the greater the strain rate, and the faster the MDRX. The procedure chart implemented in Forge NxT for the determination of the microstructural changes is shown in Figure 5. The macroscopic field variables obtained from the FE simulation were used as the input data for the calculation in that subroutine.
The tools of the mill were defined as rigid, while the billet was considered to be elastic-viscoplastic according to Equation (1), which has been previously introduced. For the elements modeled as rigid, 2D triangular elements were used, while 3D tetrahedral P1+ linear elements with the bubble node were assigned to the deformable ones. The element size was 5 mm for the rolls, 2 mm for the shoes, and 1–2.5 mm for the plug at both stages of the manufacturing process (finer mesh in the plug tip). The resulting mesh for both the piercing and elongation phases can be observed in Figure 6. The thermal expansion of the billet was not considered during heating and piercing/elongation operations. However, the cooling of the pipe and its contraction were considered to compare the dimensional measures with the experimental ones. In addition, the cooling phase using the system described in Figure 3b was simulated, incorporating the initial cooling of the billet with a water jet directed to the pipe surface at the exit of the piercing mill and the pipe immersing into water at room temperature 15 s later.
Moreover, the initial temperature of the billet was 1170 °C, which corresponded to the in-furnace temperature prior to both piercing and elongation stages. In addition, billets cooling during transportation between the furnace and the mill guide was simulated in order to obtain a more accurate initial temperature distribution. The ambient temperature was set to 25 °C, the temperature of the dies was set to 50 °C for the shoes and the plug, while the rolls temperature was determined to be 80 °C. There was no initial load in terms of stress or strain on the billet. The friction conditions within the contacting areas and the heat transfer through radiation, convection, and contact between solids were taken into consideration. Regarding friction conditions, a constant-shear-friction model was used for the simulation of friction between the billet and other components [30]. The shear stress was determined using
τ = m · K ,
where m is the friction factor, and K is the material consistency, which is determined using
K = σ e q 3 .
The friction coefficients were m = 0.8 for the rolls and m = 0.2 for the shoes and the plug. Regarding the heat transfer coefficients used for the simulation, free convection with ambient media was assumed, emissivity was set to 0.5, and the contact conductance HTC was 10.000 W/m2K. For the surface of the pipe in contact with the water jet at the exit of the mill, the HTC value was 1.420 W/m2K, while the value of 2.600 W/m2K was used when the pipe was totally submerged into water for final cooling.

4. Results and Discussion

4.1. Geometrical Analysis

A geometrical analysis of the produced tubes was performed at the end of each of the following stages:
  • Stage 1: heating up, piercing, and quenching
  • Stage 2: heating up, piercing, heating up, elongation, and quenching
Piercing and elongation were carried out with the stable natural grip of the billet by the rolls, involving the stable movement of the rolling stock at the stationary stage of the process and a free exit out of the deformation zone. The experimental results of the pierced and elongated samples are shown in Figure 7a,b, with the simulation results in Figure 7c,d, respectively. The length of the initial billet was 220 mm. The geometrical analysis of the pierced shell shows a total length of 520 mm after piercing, which corresponds to an elongation rate of 2.36 times. In the case of the measured tube after elongation, it showed a final length of 490 mm (starting from an initial length of 320 mm), which leads to an elongation rate of 1.53 times. In the simulation, the elongation rates of both the piercing and elongation stages yielded a value of 2.2 and 1.54 times, respectively.
The geometrical analysis of the pierced shell shows that the mean diameter of the pierced product at 100 mm from the tip was 77.8 ± 0.1 mm, and the mean diameter at 100 mm from the tail of the pierced shell was 77.5 ± 0.1 mm. On the other hand, the geometrical analysis of the elongated tube shows that the mean diameter of the elongated tube at 100 mm from the tip was 73 ± 0.2 mm, and the mean diameter at 100 mm from the tail of the elongated tube was 72.3 ± 0.2 mm. The simulation results of the product diameter after the piercing and elongation phases were 79.2 mm and 73.07 mm, respectively. After piercing, the shells had a higher WT and diameter deviation from the tail end than from the head one. It was due to the short length of the shell, and, as a consequence, there was no centering of the shell by the rollers on the outlet side when exiting the deformation zone. After rolling, tube dimensions at the head and tail ends were similar. The deviation in the WT did not exceed 5%, and the deviation in the diameter was no more than 0.55%. The experimental measurement of the WT of the pierced and elongated tubes shows that the mean WT of the pierced tubes at 100 mm from the tip and at 100 mm from the tail was 9.3 ± 0.1 mm and 9.7 ± 0.3 mm, respectively. The mean WT of the elongated tube at 100 mm from the tip and at 100 mm from the tail was 6.4 ± 0.1 mm and 6.3 ± 0.1 mm, respectively. The comparisons between the experimental and simulation results of the tube thickness and wall thickness are presented in Figure 8a,b, respectively.

4.2. Microstructural Evaluation of Piercing Phase

First, the results of the first piercing stage are presented. Measurements were taken at three different points within the section of the shell at the outer, middle, and inner radii. In addition, the times when the material first contacted with the plug, completed its contact with the plug, and completed its contact with the mandrel were provided. The deformation conditions, namely, temperature and strain rate at each of the three points, were recorded and are presented in Figure 9a,b as related to the position in the rolling axial direction, where the gorge was (x = 0).
The temperature in the outer and middle sections of the shell was increased due to the friction with the rolls and plastic deformation energy dissipation. However, the internal region was initially cooled down when it contacted the plug. The reason was the low temperature of this element and the low friction and reduced plastic work at this moment. Afterward, the internal region was heated up as long as the strain was increased. According to the results of the temperature and strain rate measurements shown in Figure 9, the Zener–Hollomon parameter was calculated and used to analyze the deformation conditions. It can be pointed out that, as shown in Figure 10a, the Zener–Hollomon parameter did not reach the critical value Zc in the three areas of the shell thickness beyond which the dynamic recrystallization did not occur.
Firstly, dynamic recrystallization occurred in the material during deformation at the stage of the piercing operation. The strain rate had a higher value within the outer area of the shell, and the temperature was slightly higher than in the middle and inner areas. Thus, theoretically, the strain required for developing a similar DRX fraction in the material decreased with the increase in temperature and decrease in the strain rate. At the stage of the piercing operation, the strain was first concentrated within the outer area of the shell, and as soon as the shell transverse area was reduced, the deformation extended to the middle and inner areas. As can be seen in Figure 10b, the DRX fraction was first increased within the outer shell area, but as long as the material was subjected to piercing, the lower strain rate in the middle and inner areas (see Figure 9b) contributed to a higher DRX fraction within the aforementioned areas. Figure 11 shows the microstructure and histograms of the grain size distribution for the outer surface (exterior) and middle and inner surfaces (interior) of the pierced tube.
The results indicate that the grain size of the pierced shell at some sections (interior and middle) was smaller than the raw material. This was not the case for the external region. As a result, the internal microstructure was finer in different parts of the pierced tube than in other areas. The results show that the average grain size on the pierced tube’s interior, middle, and exterior surfaces was 26 µm, 65 µm, and 66 µm, respectively. The average grain size of AISI 904L steel in the exterior area (initial value of 20 µm) increased by 30%. The average grain size of AISI 904L steel in the middle (initial value of 76 µm) and interior (initial value of 76 µm) areas decreased by 14.5% and 13.2%, respectively. Despite the higher strain rate in the exterior area of AISI 904L steel during piercing, the grain size in the middle and interior areas of the tube had grain refinement.
Figure 12a shows the values of the DRX volume fraction during piercing. As it was previously described, the DRX fraction in the inner and middle areas of the shell was higher than that within the external area. The external area was deformed first within the contact area with the rolls; however, no full DRX occurred within these areas, reaching the values of 80–100%. On the contrary, the inner area showed full recrystallization within the section near the plug tip: during material rolling, prior to the transverse area reduction, full DRX was achieved under the impact of the low strain rate within that area.
Based on Figure 12a, it can be shown how DRX occurred within the area where the material contacted the plug, and once the material reached the gorge position, the softening mechanism was completed. On the contrary, MDRX started upon the completion of the transverse area reduction, once the material DRX had already occurred. It is important to notice that the FE model describes the potential for developing MDRX in the remaining volume fraction that has not reached full DRX. Thus, for the regions that reach full MDRX, it would mean that the material completes both the dynamic and postdynamic recrystallization. Differences between the change in the MDRX fractions in different areas of the shell section are shown in Figure 12c.
The SEM image of the microstructure evolution of the pierced tube is presented in Figure 13. The results consist of low and high magnifications from the interior area of the tube (Figure 13a) and exterior area of the tube (Figure 13b).
The results show grains with different sizes in both cases. It confirms that the growth rate of the DRX grain is not very high in this steel during the piercing process. The microstructure of different areas is inhomogeneous due to various mechanical stresses (compression, tension, and shear) during the piercing phase of the raw material. Lamellar colonies and the high percentage of dynamic recrystallization cannot be detected in a high magnification of the microstructure. The DRX grains and small percentage of MDRX can be detected in the high magnification of the microstructure depicted in Figure 13a,b. By comparing the interior and exterior areas of the pierced tube, it can be concluded that MDRX in the exterior area is lower than in the interior area. Due to the higher cooling rate of the exterior area with air and rolls, the exterior area of the tube experienced a higher heat loss. Therefore, DRX growth decreases, and DRX nucleation for MDRX is limited. A closer analysis of the exterior area (Figure 13c) revealed that DRX nuclei did not grow during piercing, which is the main reason for the difference in MDRX between the interior and exterior areas.
Both the inner and middle areas had a higher MDRX rate and reached full meta-dynamically recrystallized volume fractions at the exit of the mill; however, the outer area showed lower values and required more time to achieve a full MDRX volume fraction. The MDRX change of the shell is shown in Figure 14a,b. The inner and middle areas were subjected to MDRX upon DRX completion. Therefore, as can be seen in Figure 14, MDRX occurred within the area between the plug tip and the rolls gorge, where the material was rotating without being deformed by the rolls. However, the external area of the shell showed a lower MDRX rate before the material exited the rolling mill (200 mm after the rolls gorge). At that point, the MDRX rate increased until reaching the position of the water jets to cool the external area of the pipe after piercing (250 mm after the rolls gorge).
As soon as the shell exited the piercing mill, the quenching process started through the action of the water jets as illustrated in Figure 3b. The water jets cooled down the shell surface upon exiting the piercing mill at that stage, and once the shell was completely pierced, the quenching process started. Water jets were used for the local cooling of one area only for 15 s. This is the time required to extract the plug from the inside, and once the plug is extracted, the shell is submerged into water. A total of four equally spaced points within the area of investigation were used to monitor the temperature change throughout the shell thickness during quenching. The results are shown in Figure 14c.
Figure 14c shows that the material quenching resulted in various cooling rates throughout the shell’s WT areas under analysis. We considered quenching at temperatures from 1200 °C to 200 °C to analyze the cooling rates, and these average cooling rates, as measured within the external, inner, and middle areas, are specified in Table 2.
Based on the values listed in Table 2, it could be concluded that the action of the water-cooling jets on the external surface at the beginning of the quenching process resulted in a higher cooling rate (31.5 °C/s) as compared to other areas, while the inner area showed the lowest value of 22.8 °C/s. Fifteen seconds later, there was a temperature difference of 130 °C between the external and internal surfaces of the shell. Then, the shell was submerged into water, and the cooling rates showed the opposite distribution behavior: with the inner area showing the highest cooling rate throughout the entire quenching process with the value of 50.4 °C/s. Twenty-five seconds later, both the external and inner areas of the shell showed the same cooling rate. Regarding the middle points, both the external and inner middle points showed the same cooling rate during the entire quenching process. The cooling treatment applied to the pierced tube after the piercing phase had no significant effect on the chemical structure of 904L steel. This cooling procedure was used mainly due to the release of internal stress. The most considerable effect of the selected cooling rate was on the grain growth of the pierced tube. The EDS map from the internal and external parts of the pierced tube after the cooling stage shows the uniform chemical distribution. The selected chemical elements percentage tables and EDS map are presented in Tables S1 and S2 and Figures S1 and S2 in the Supplementary Electronic Document at the end of the manuscript.

4.3. Microstructure Evaluation of Elongation Phase

The second stage of the pipe production process included measurements taken at three different points across the finished pipe section at the outer, middle, and inner radius, similar to those taken at the previous stage. The results of the temperature change and the average strain rate are shown in Figure 15.
For elongation, the temperature change involved a lower heating of the material as compared to the previous piercing stage, and regarding the strain rate, the values were slightly lower, and the distribution was the opposite. The higher strain rates were concentrated within the inner area, while the external area contacting the rolls showed the lowest strain rate. The thermal softening due to DRX tended to occur within the entire pipe section given that the critical value Zc was not exceeded at that stage in any of the analyzed areas as shown in Figure 16a. The dynamically recrystallized fraction evolution was different for the external, middle, and inner areas of the pipe thickness. The evolution of the dynamically recrystallized volume fraction is shown in Figure 16b.
Figure 17 shows the microstructure and histograms of the grain size distribution for different zones of the cross-section of the elongated pipe: near the external surface, in the middle of the wall thickness, and near the internal surface of the pipes. Meanwhile, the microstructure and histograms of the average grain size value in the longitudinal section were analyzed in the external and internal regions of the shell and pipe. The largest effect of the grain structure refinement was observed on the pipe samples upon elongation. This seemed to be natural since the finer-grained structure after piercing was subjected to deformation. Short-term heating to the same temperature did not cause grain growth. At the same time, a finer grain contributed to the earlier (in terms of hot deformation degree) development of recrystallization. Therefore, it could be more likely for the dynamic recrystallization to occur during elongation than during piercing. Moreover, under the given conditions, the final structure could be affected by post-deformation, the so-called static processes. The microstructure and histogram of the longitudinal section of the pierced and elongated samples show the same trend by cross-section. The longitudinal section of the pierced and elongated samples’ microstructures are presented in Figures S3 and S4 in the Supplementary Electronic Document at the end of the manuscript. The results show that the average grain size in the elongated tube’s interior, middle, and exterior surfaces were 27 µm, 36 µm, and 41 µm, respectively. The thermo-mechanical action during the elongation process changed the microstructure of the pierced tube. The average grain size of the elongated tube compared to the pierced tube had a similar structure in the exterior, a 45% decrease in the middle, and a 38% decrease in the interior area.
A comparison of the specific features of the grain structure in the transverse and longitudinal sections proved the occurrence of a greater development of recrystallization in the rolled pipe: the average grain size decreased significantly in both sections. Based on the ratio of the grain size average value in the cross-section to the grain size average value in the longitudinal section of the samples D ¯ / D ¯ (Table 3), which showed the anisotropy of the grain shape to some extent, no full recrystallization occurred; and the extent of recrystallization propagation increased from the internal to the external surfaces, which was specifically noticeable for the pierced shells.
The inner area was fully recrystallized before reaching the rolls gorge, showing higher recrystallization kinetics. The external area started showing DRX at the point where the material first contacted the rolls, but the kinetics of DRX were low as compared to the external or middle areas. Concerning the middle area, it exhibited DRX after the other two areas exhibited theirs; however, it reached a fully recrystallized volume fraction at the same location (in the gorge). The kinematics of DRX were higher within the external area due to the higher strain rates, while the middle area showed high kinetics of DRX due to the higher local temperature as compared to the other two areas. The material DRX volume fraction evolution at the elongation stage is shown in Figure 18.
In Figure 18, we can see how DRX occurred in the area of material contact with the roll within the external area and also in the area of contact with the plug in the pipe cavity. In the middle area of the tube’s WT, it occurred at a later stage; thus, a V-shaped distribution was found across the pipe thickness. Once the material approached the gorge position, the DRX softening mechanism was completed. For MDRX, it started upon the completion of the transverse area reduction when the material DRX was completed. Figure 18c shows differences existing between the change in the MDRX fractions in different areas of the shell section. As can be seen in Figure 19c, MDRX started first in the inner area as compared to the middle and external areas. The MDRX rate in all areas was similar given that the differences in the temperature and strain rate were not significant. However, a higher MDRX was found in the inner area due to the higher strain rate within that area. The microstructure of the elongated tube is presented in Figure 19. The microstructure in the interior and exterior areas shows that many DRX grains are refined and are near the original grain boundaries. In addition, equiaxed grains with straight boundaries was detected in both areas. According to the results, the forming temperature and strain rate in the elongation phase were lower than in the piercing phase. The process temperature had a direct effect on the MDRX grain size. The lower temperature of the material in the elongation phase compared to the piercing one led to a smaller MDRX grain size. The higher temperature in the piercing phase accelerated the dislocations’ motion and sped up the recovery process. During MDRX, grain growth was the primary process of the microstructure variation. Throughout the tube-forming process, the temperature varied the grain growth velocity. A higher temperature increased the grain growth velocity. As a result, the difference in temperature between the interior and exterior areas of the tube affected the grain growth velocity and led to differences in MDRX in these areas. Furthermore, a higher strain rate also led to increasing deformation energy along the tube. A higher deformation energy reduced the dynamic recovery and increased the driving force for MDRX. MDRX and DRX grains (Figure 19c) show that the strain rates and temperatures of all tube parts were not uniform. The simulation results indicated these phenomena and are discussed in advance.
Figure 20 shows the evolution of MDRX in the pipe during the elongation stage. In the inner area, MDRX started upon the completion of DRX; thus, as can be seen, there was a meta-dynamically recrystallized volume fraction at the rolls gorge. However, the middle and external areas of the pipe showed a lower MDRX rate until the material had already advanced beyond the rolls gorge. At that point, the MDRX rate increased until reaching the position of the water jets that cooled the pipe’s outer area after elongation (250 mm after the rolls gorge). There, the meta-dynamically recrystallized volume fraction was the same throughout the entire pipe sections and did not reach 90%.
When the pipe exited the piercing mill, the quenching process followed a scheme similar to that previously detailed during piercing. The water jets cooled down the pipe surface, and upon the completion of the pipe piercing, pipe quenching started. Water jets were used for the local cooling of only one area for 15 s; then, the pipe was immersed into water. Four equally spaced points were used to monitor any changes in the temperature throughout the pipe’s WT within the area under investigation. The results are shown in Figure 20c. As can be noticed, the material quenching process resulted in various cooling rates within the areas of pipe’s WT. The quenching process at temperatures from 1150 °C to 100 °C was considered to analyze the aforementioned cooling rates. To this aim, the average cooling rates measured for the external, middle external, middle inner, and inner areas are specified in Table 4. Based on the listed values, it can be concluded that the action of the water-cooling jets on the external surface at the beginning of the quenching process resulted in a higher cooling rate (33.9 °C/s) as compared to the rest of the areas. However, the difference at this stage was lower than the one found during piercing. Fifteen seconds later, the temperature difference between the external and internal surfaces was 61.4 °C. Then, when the pipe was submerged into water, the inner area showed the highest cooling rate with the value of 47 °C/s. Therefore, the trend is similar to the quenching process performed after piercing. However, the differences in the cooling rates across the pipe thickness were found to be lower compared to the ones determined during the previous quenching process. Therefore, it can be stated that the quenching process performed after elongation was quite uniform. Finally, 25 s later, both the external, middle, and inner areas showed a similar cooling rate that resulted in a uniform temperature distribution throughout the pipe’s WT.
The cooling rate of the elongated tube had similar effects after the piercing phase. The chemical structure of the element distribution of 904L steel after elongation was uniform. The EDS map of the internal and external parts of the elongated tube after the cooling stage is presented in Tables S3 and S4 and Figures S5 and S6 in the Supplementary Electronic Document at the end of the manuscript. Both dynamic and meta-dynamic recrystallization occurred simultaneously during deformation in the stages of piercing and elongation due to a combination of a high temperature and strain rate. Upon deformation, as well as during accelerated cooling, partial static recrystallization can occur until the temperature reaches 750 °C. The decrease in grain size found in the fabricated samples, the preservation of grain size differences across the shell section, and the anisotropy of the grain shape are all typical of the inner surface where recrystallization was not complete. Incomplete recrystallization could even be appreciated in the parameters of grain distribution by size. For the inner layers of shells, the distribution width and left-side asymmetry were noticeably larger. After elongation, the SRX process was interrupted at the initial stage due to the higher cooling rate of the thin-walled pipe, as judged by the preserved D~Z correlation throughout the pipe cross-section. The existing differences in the structure and hardness across the shell section, detected after piercing, were difficult to control due to differences in temperature and deformation conditions attributed to the shell wall thickness. The differences in processes parameters and structural changes observed for various shell areas (particularly, less recrystallization within the inner layers of the shell) are likely to be related to the initially larger grain size as well as to a higher temperature as compared to elongation.

4.4. X-ray Diffraction Analysis

A preservation of the deformation structure, i.e., incomplete recrystallization, was found with the minor increase in the X-ray diffraction line widths, which was generally characteristic of hot deformation. The rapid quenching of thinner rolled pipes contributed to the preservation of a more uniform grain size across the section as well as made it possible to prevent decomposition and preserve solid solution alloying. The results of the X-ray diffraction analysis are shown in Figure 21. According to the results, the austenite lattice period for the shells samples after piercing systematically proved to be less than that of the samples hardened after pipe rolling. There was only one case (a pierced shell sample at a distance of 0.3 mm from the external surface) of the value being larger, and it was the maximum value achieved during the experiments (γ = 3.6033 Å), which apparently corresponded to the maximum dissolution of excess constituents that could occur under the given heating conditions (1170 °C, 60 min). With the decrease in temperature, the decomposition of the solid solution (aging) and decrease in the austenite lattice period could occur. Depending on the stage and intensity of the processes, various options for properties (strength, plasticity, viscosity, corrosion resistance, etc.) changing could be implemented. The strain aging processes are dependent on the temperature–time conditions of cooling and on the deformation structure. As a rule, there is a range of temperature and holding time values corresponding to the significant increase in the material alloy strength when hardening due to the dispersion of particle through precipitation exceeds solid solution softening due to the decrease in its alloying, which is used in practice for alloy hardening. The hardening effect of particles was found to decrease due to the particles’ enlargement in the case of over-aging, and a general decrease in strength was observed.

4.5. Hardness

The analysis of the level and nature of the hardness distribution across the section of the rapidly cooled samples of shells and pipes after piercing and elongation phases (Figure 22 and Table 5) confirmed the structural changes under observation. The lowest hardness (140–150 HV) and uniform hardness were observed in the samples of pipes quenched after elongation. The minor fluctuations (≤10 HV) within less than 2 mm from the external pipe wall could be caused by the weaker development of recrystallization and greater preservation of the deformation structure, i.e., additional aging could be carried out for pipe strengthening.
Slower and non-uniform cooling across the section and various structural conditions of the thick-walled samples resulted in a large spread of hardness values for different shells, as well as in the complicated and difficult-to-control nature of the hardness distribution across the wall thickness. Hardness equalization was observed only at a large (more than 4.5 mm) distance from the external water-cooled wall, which obviously occurred due to over-aging caused by slower cooling.
Ageing, which resulted in the precipitation of second-phase particles and material strength enhancement, was observed during both shell and pipe cooling to the temperature of 400 °C. Based on the data obtained from X-ray diffraction analysis and hardness measurements, ageing after piercing occurred extremely rapidly (<15–20 s) at quite high temperatures. Spread in terms of grain size and grain shape anisotropy was found to be less accentuated for pipe samples as compared to the pierced shell. Therefore, during elongation, ageing occurred to a lesser extent and at lower temperatures.

5. Conclusions

In this study, an alternative procedure for manufacturing seamless SASS tubes through thermomechanical processing based on the CPE process was assessed. This process was executed using a pilot mill followed by accelerated cooling. To reproduce the real industrial conditions during the manufacturing process, industrial-scale equipment was used. FEM was used to simulate material behavior and microstructural transformations. An analysis of the alterations in the microstructure and properties of the tube was carried out on the basis of the experimental results and the FEM simulation results, and the following conclusions were drawn:
  • The pierced shell and elongated tube average diameters were 77.7 mm and 72.7 mm, respectively. It shows a slight deviation from the FEM-predicted values of 79.2 mm and 73.07. The pipes produced showed deviations of no more than 0.55% in diameter and no more than 5% in wall thickness. The deformation of steel 904L involved an increased slip within the deformation zone (axial rate factor of 0.6–0.7) that should be considered when choosing rolling rate parameters.
  • The simulation results enabled the selection of desired pipe properties, which can assist industries in managing AISI 904L steel deformation, temperature, and processing time to achieve a range of final pipe characteristics. The structure and properties of the incoming material should be considered when using the model to provide more accurate data.
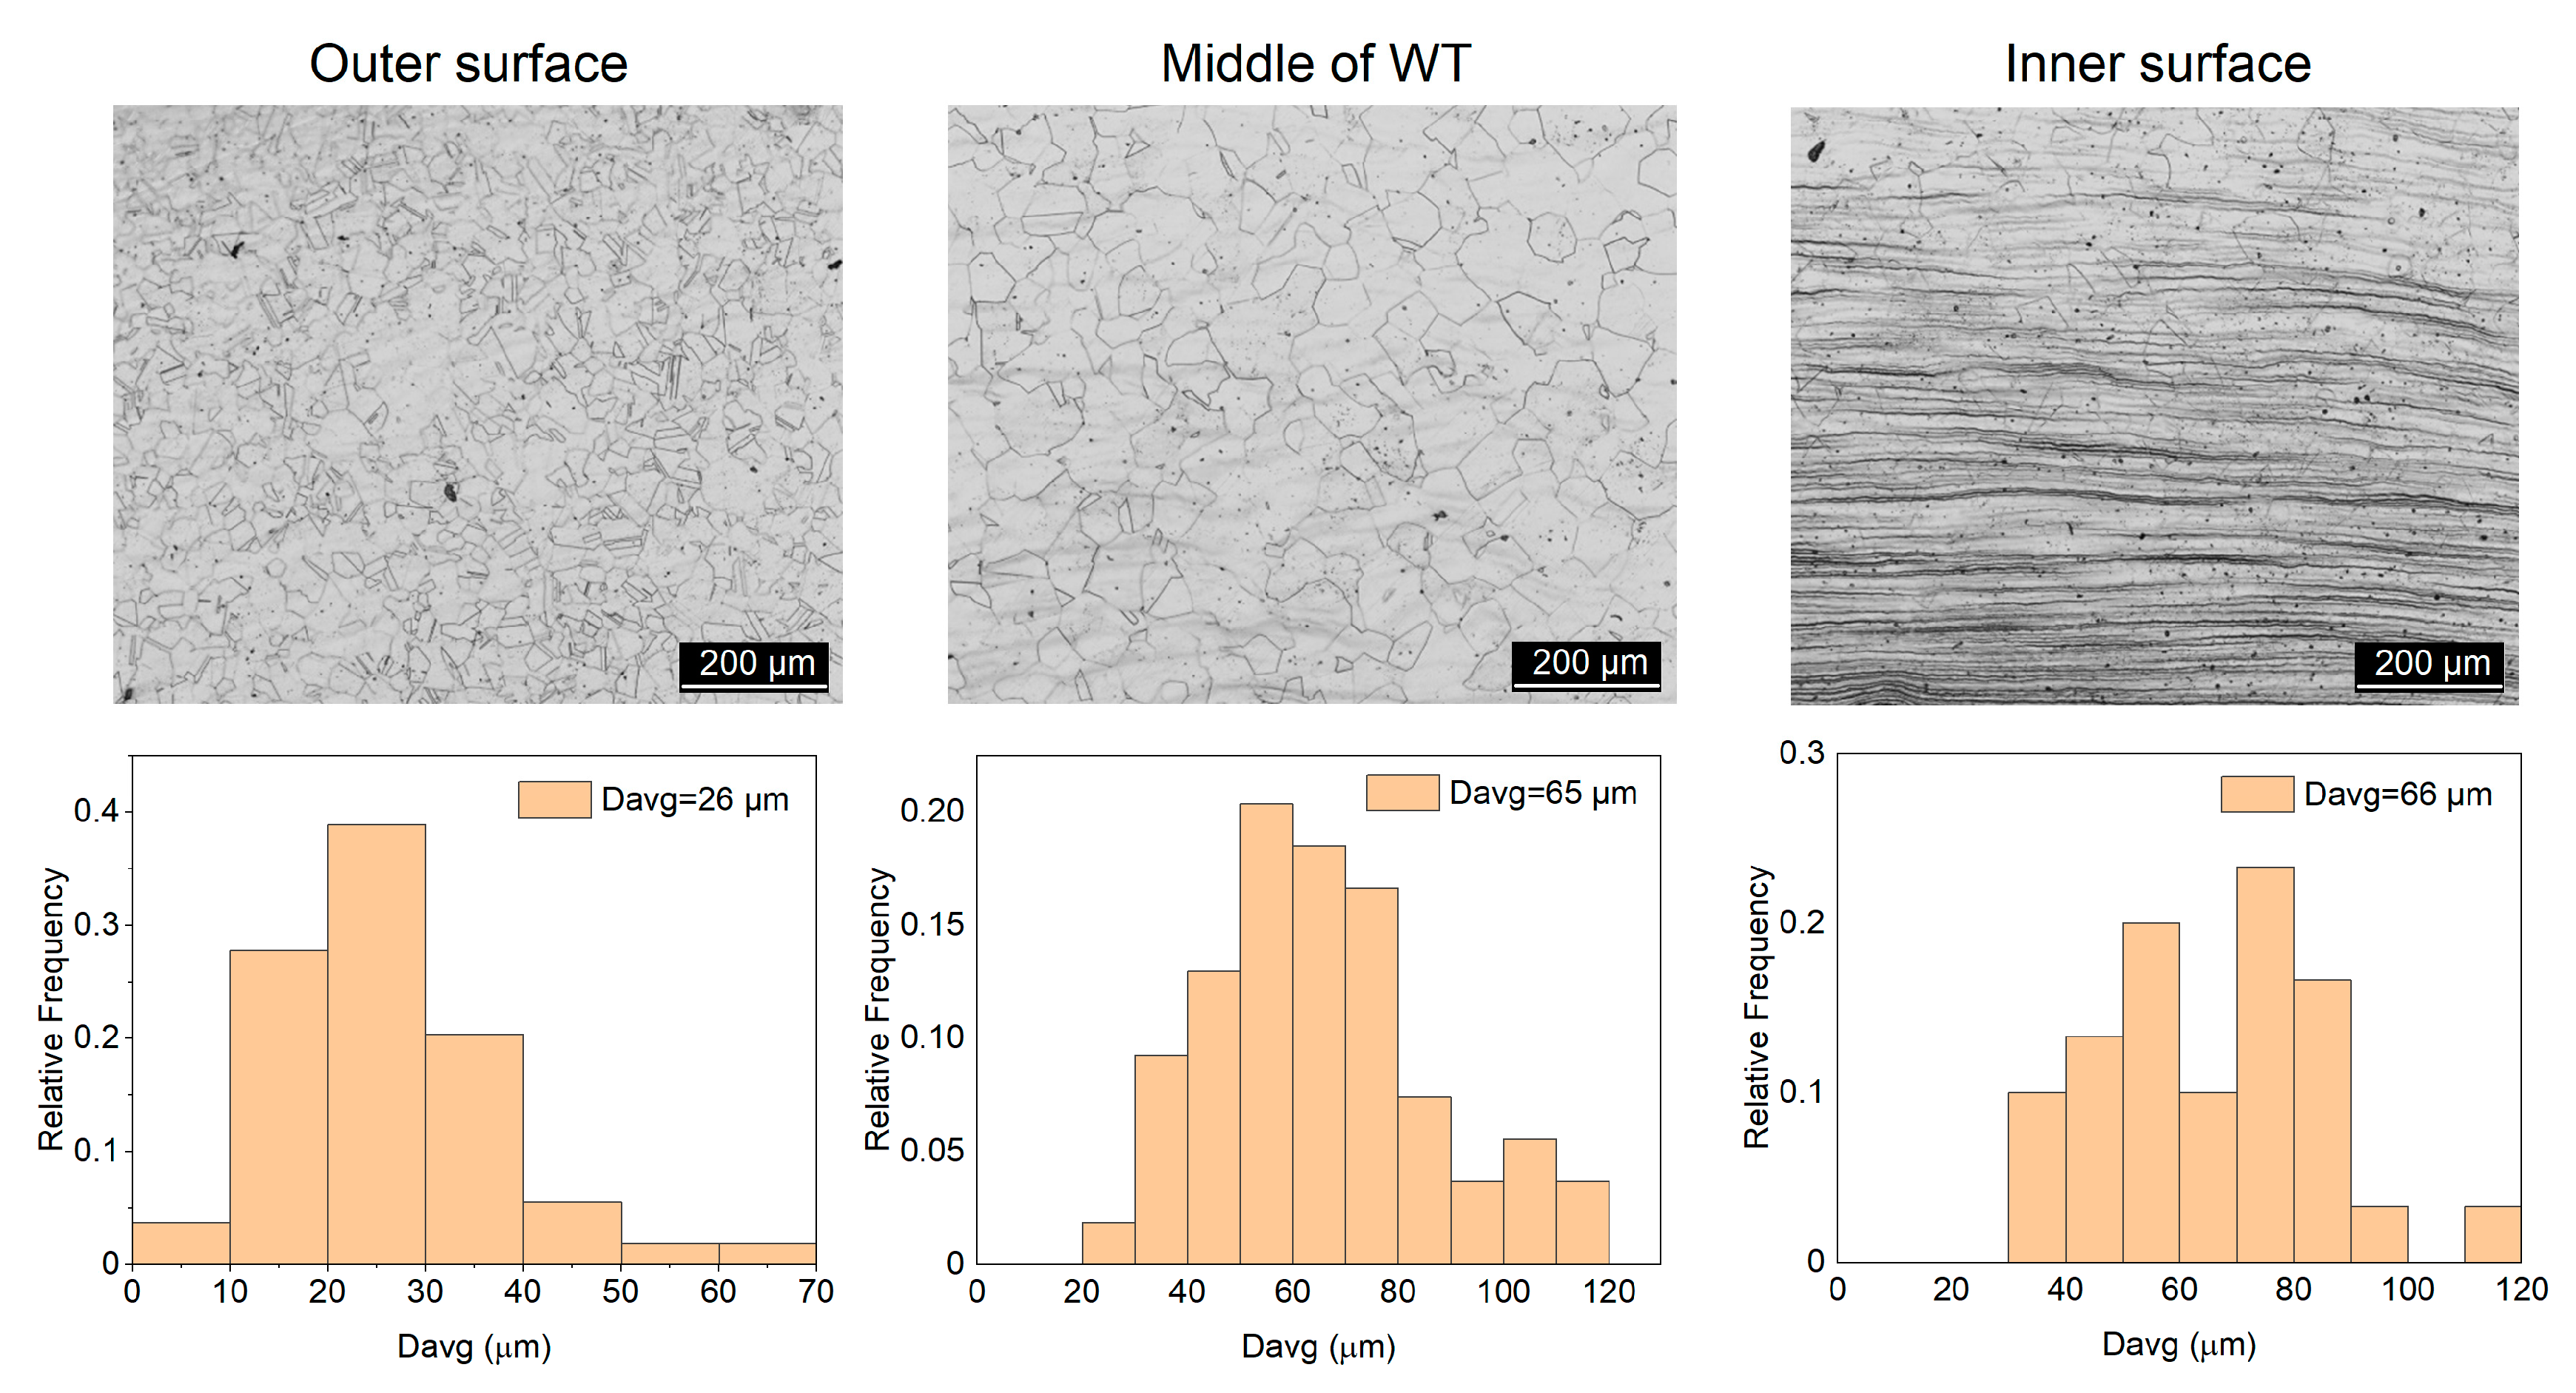
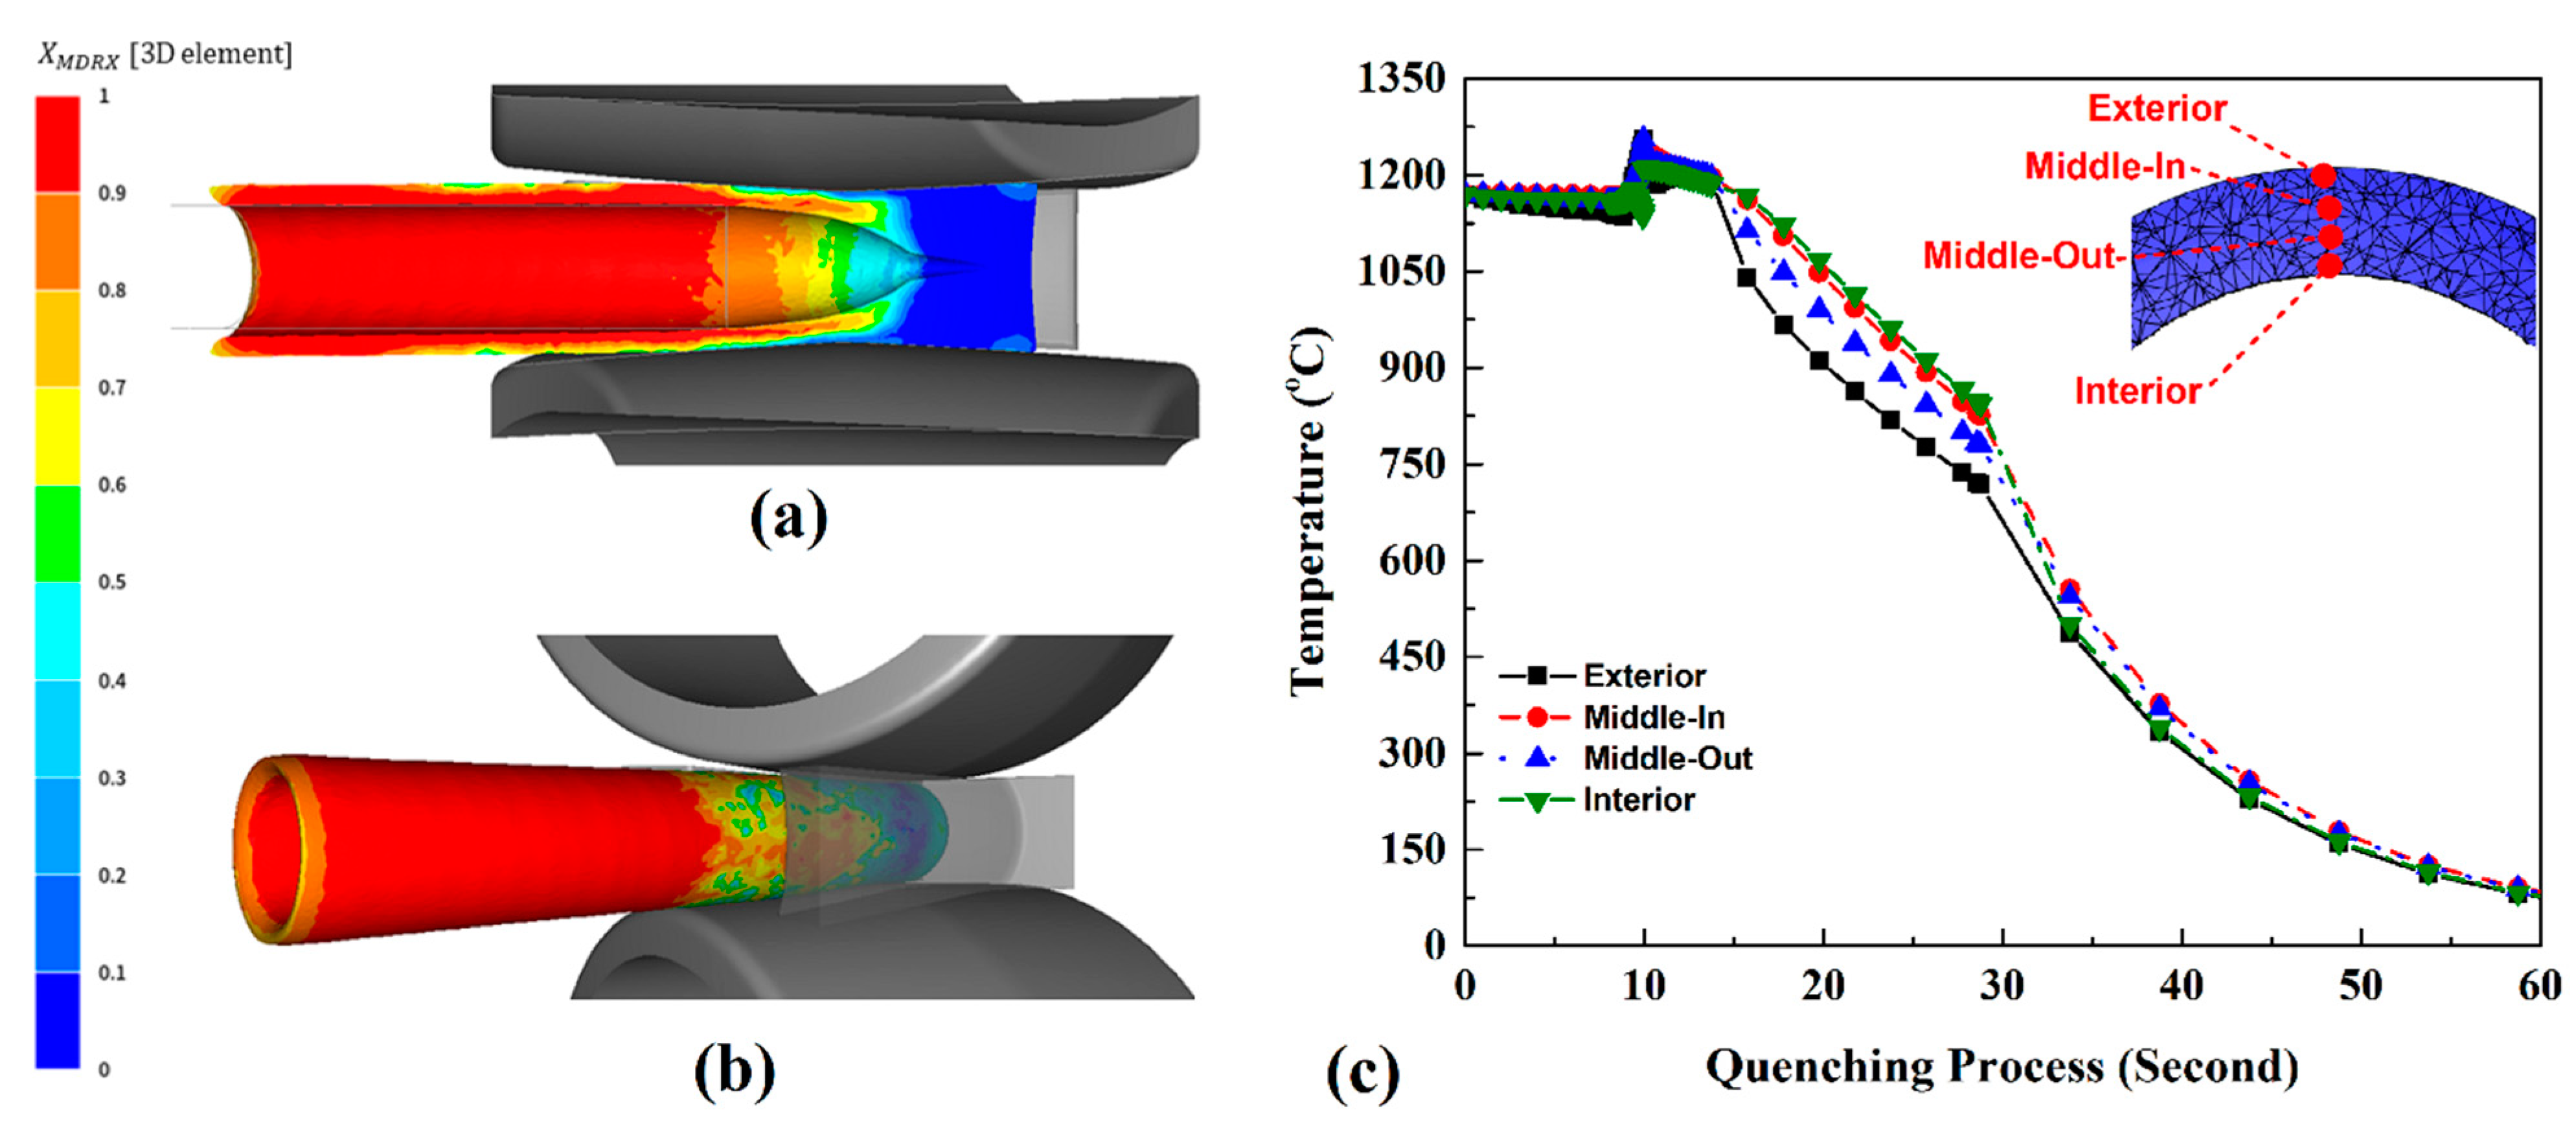
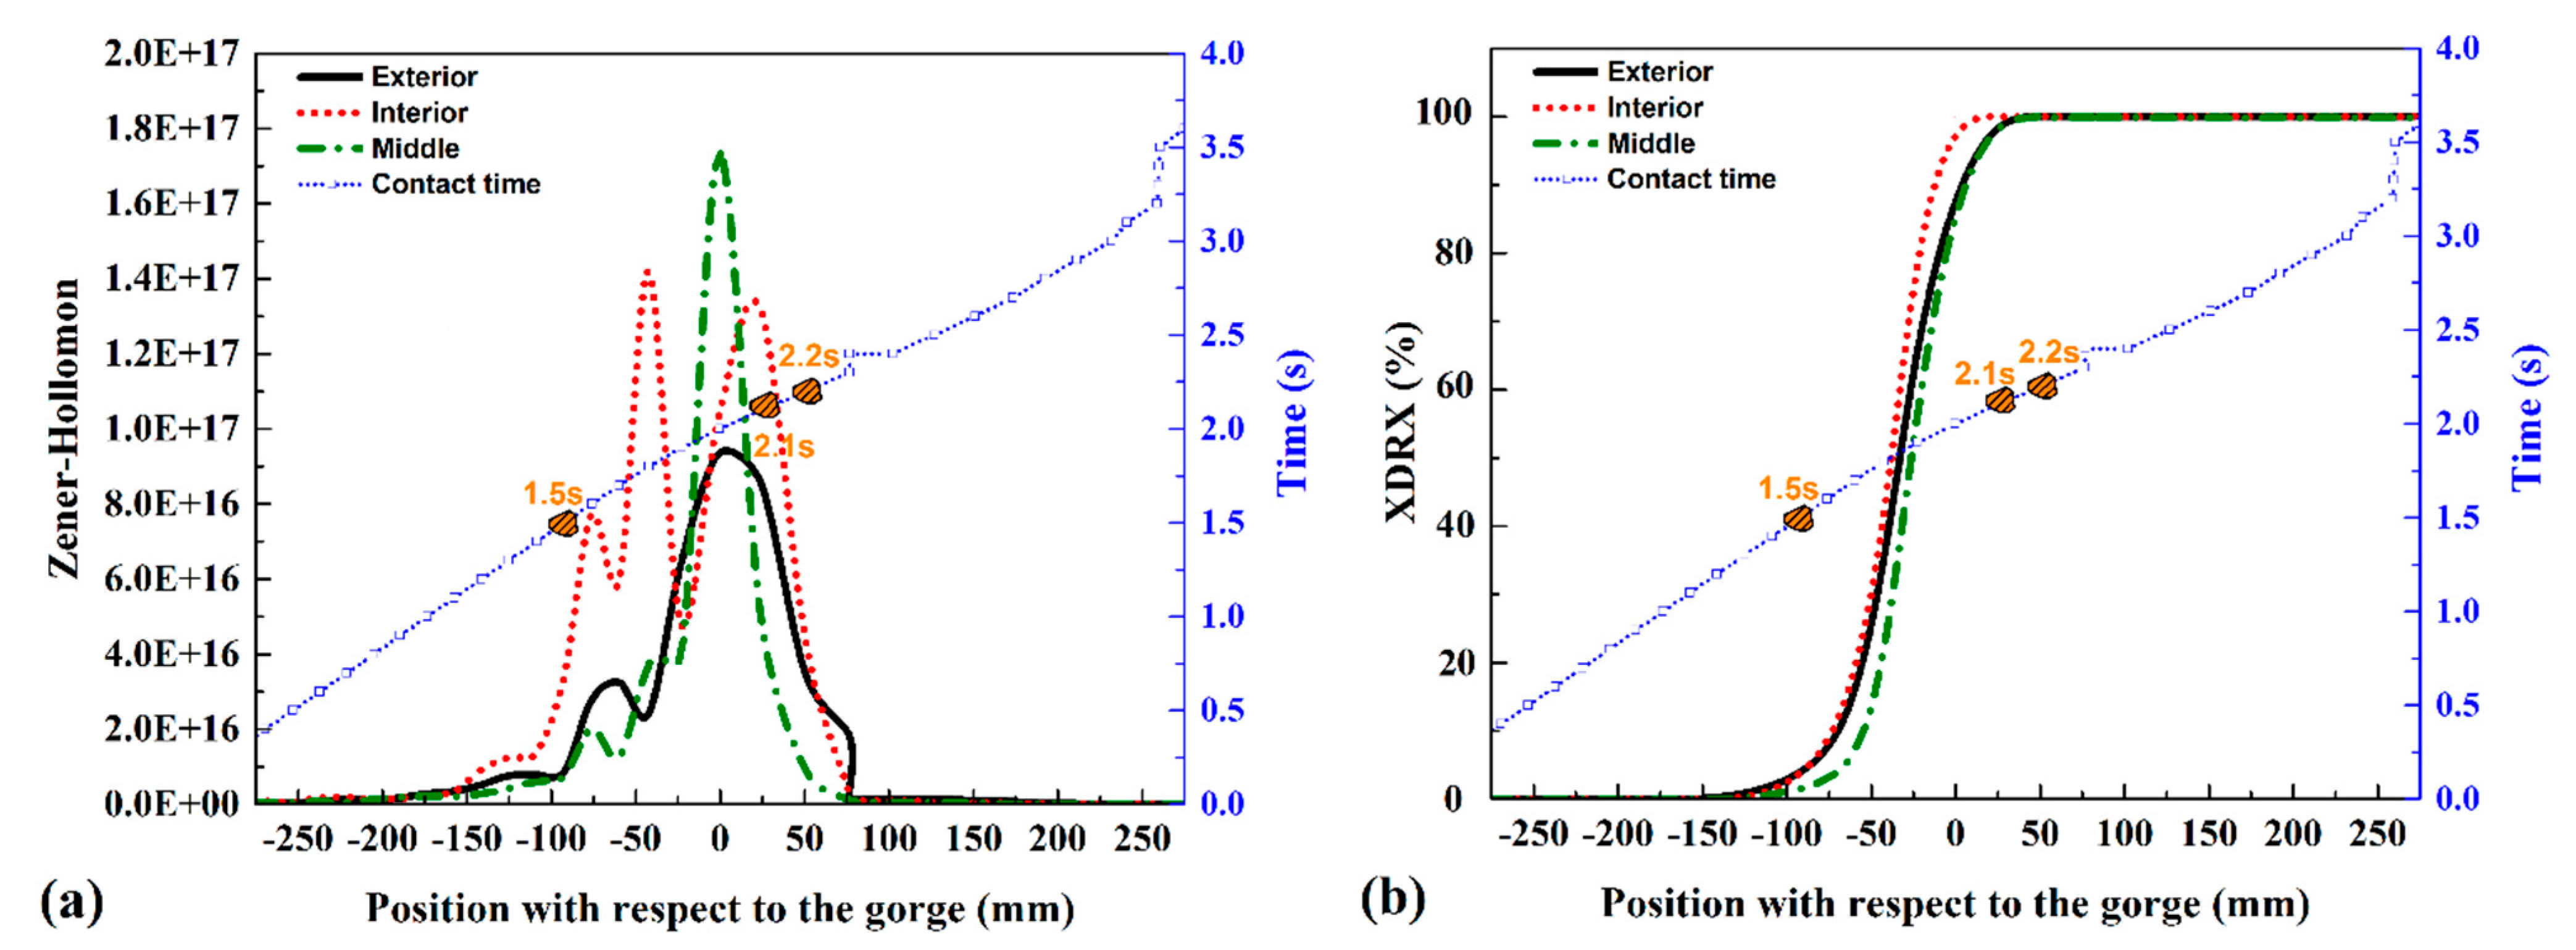
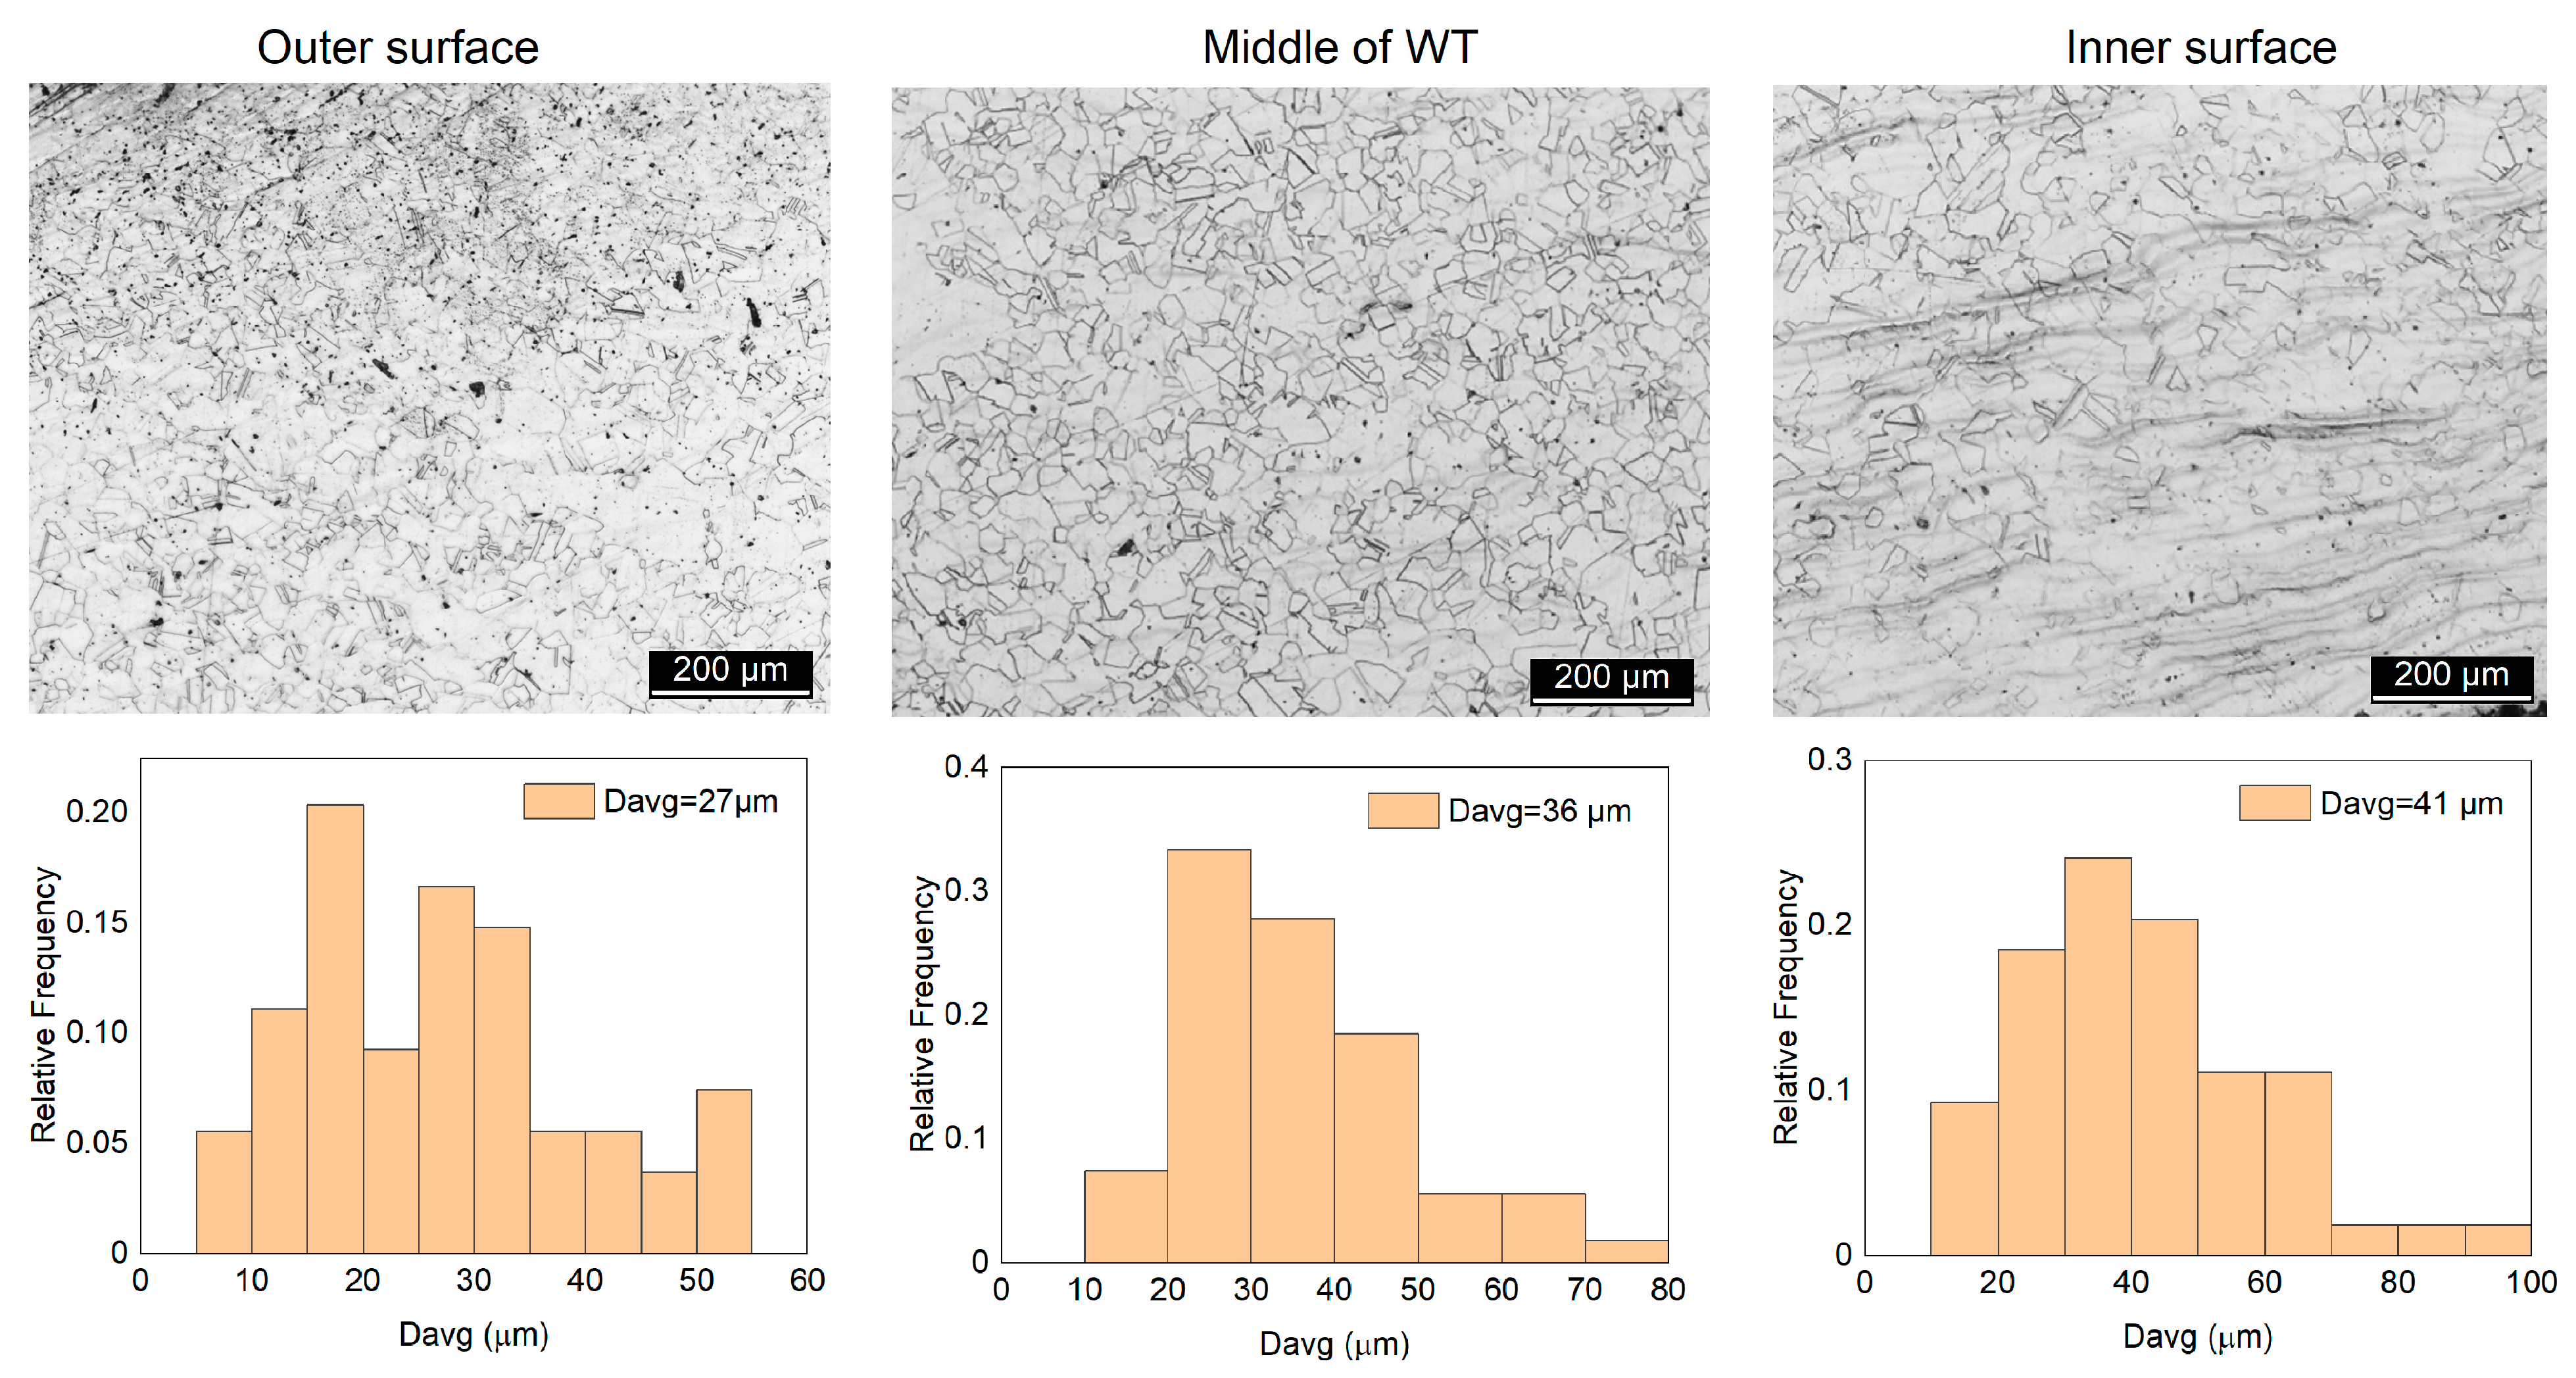
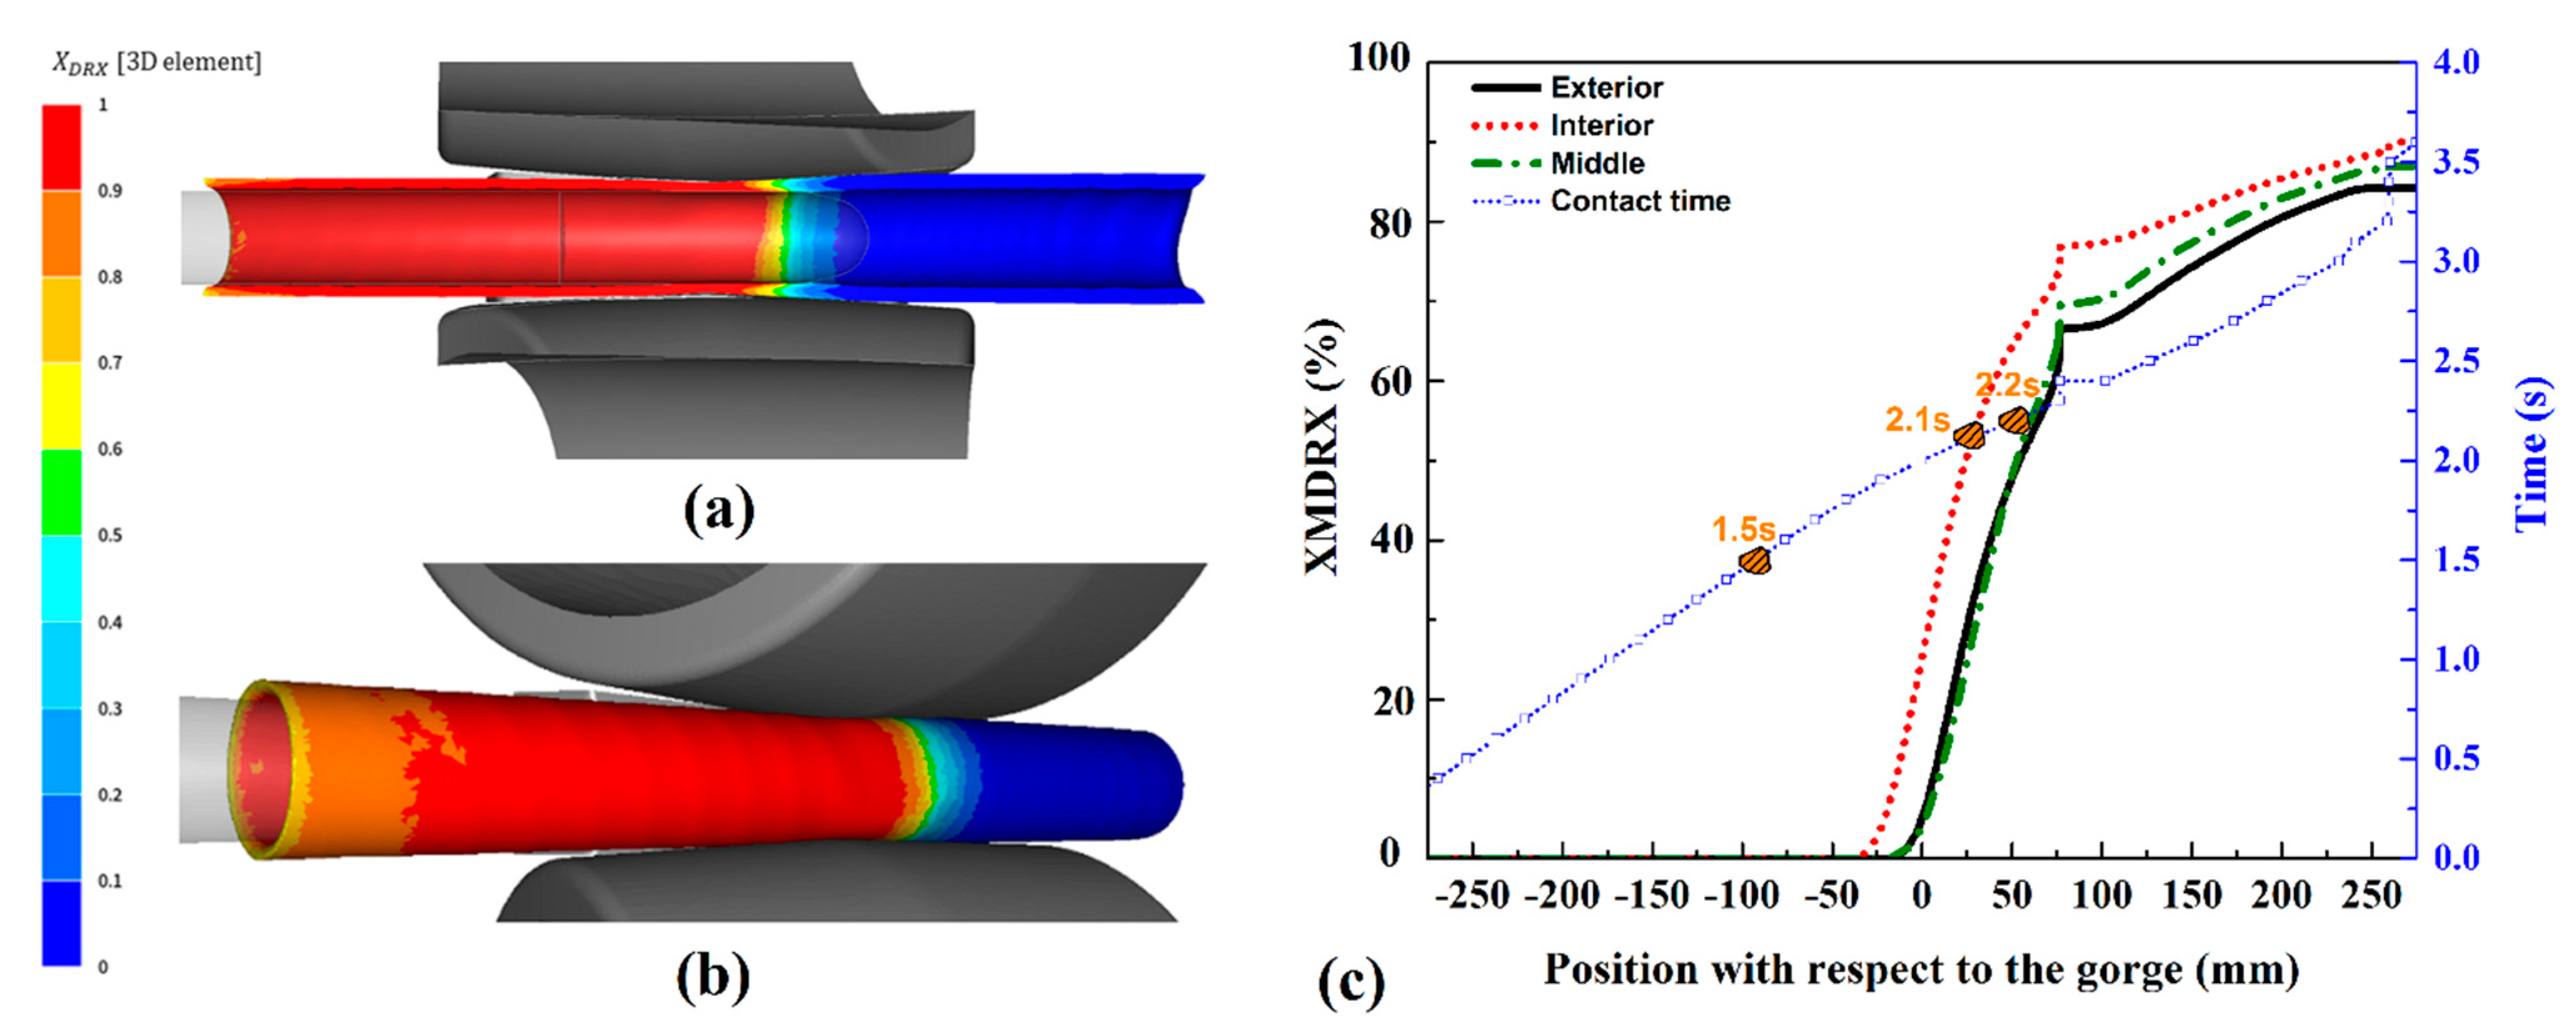
  • The calculated time, temperature, and anticipated parameters of recrystallization during deformation and cooling were quite consistent with the actually performed processes and made it possible to analyze the trends in structural changes and, consequently, structure-sensitive properties of finished products. The exterior area of AISI 904L steel tube showed a higher homogeneous grain distribution but did not display a reduction in its average grain size, which ranged between 20 µm and 27 µm. In contrast, the middle and interior regions of AISI 904L steel experienced significant reductions, especially after elongation, with average grain sizes starting at 76 µm, which decreased by 52.7% and 46.1%, respectively.
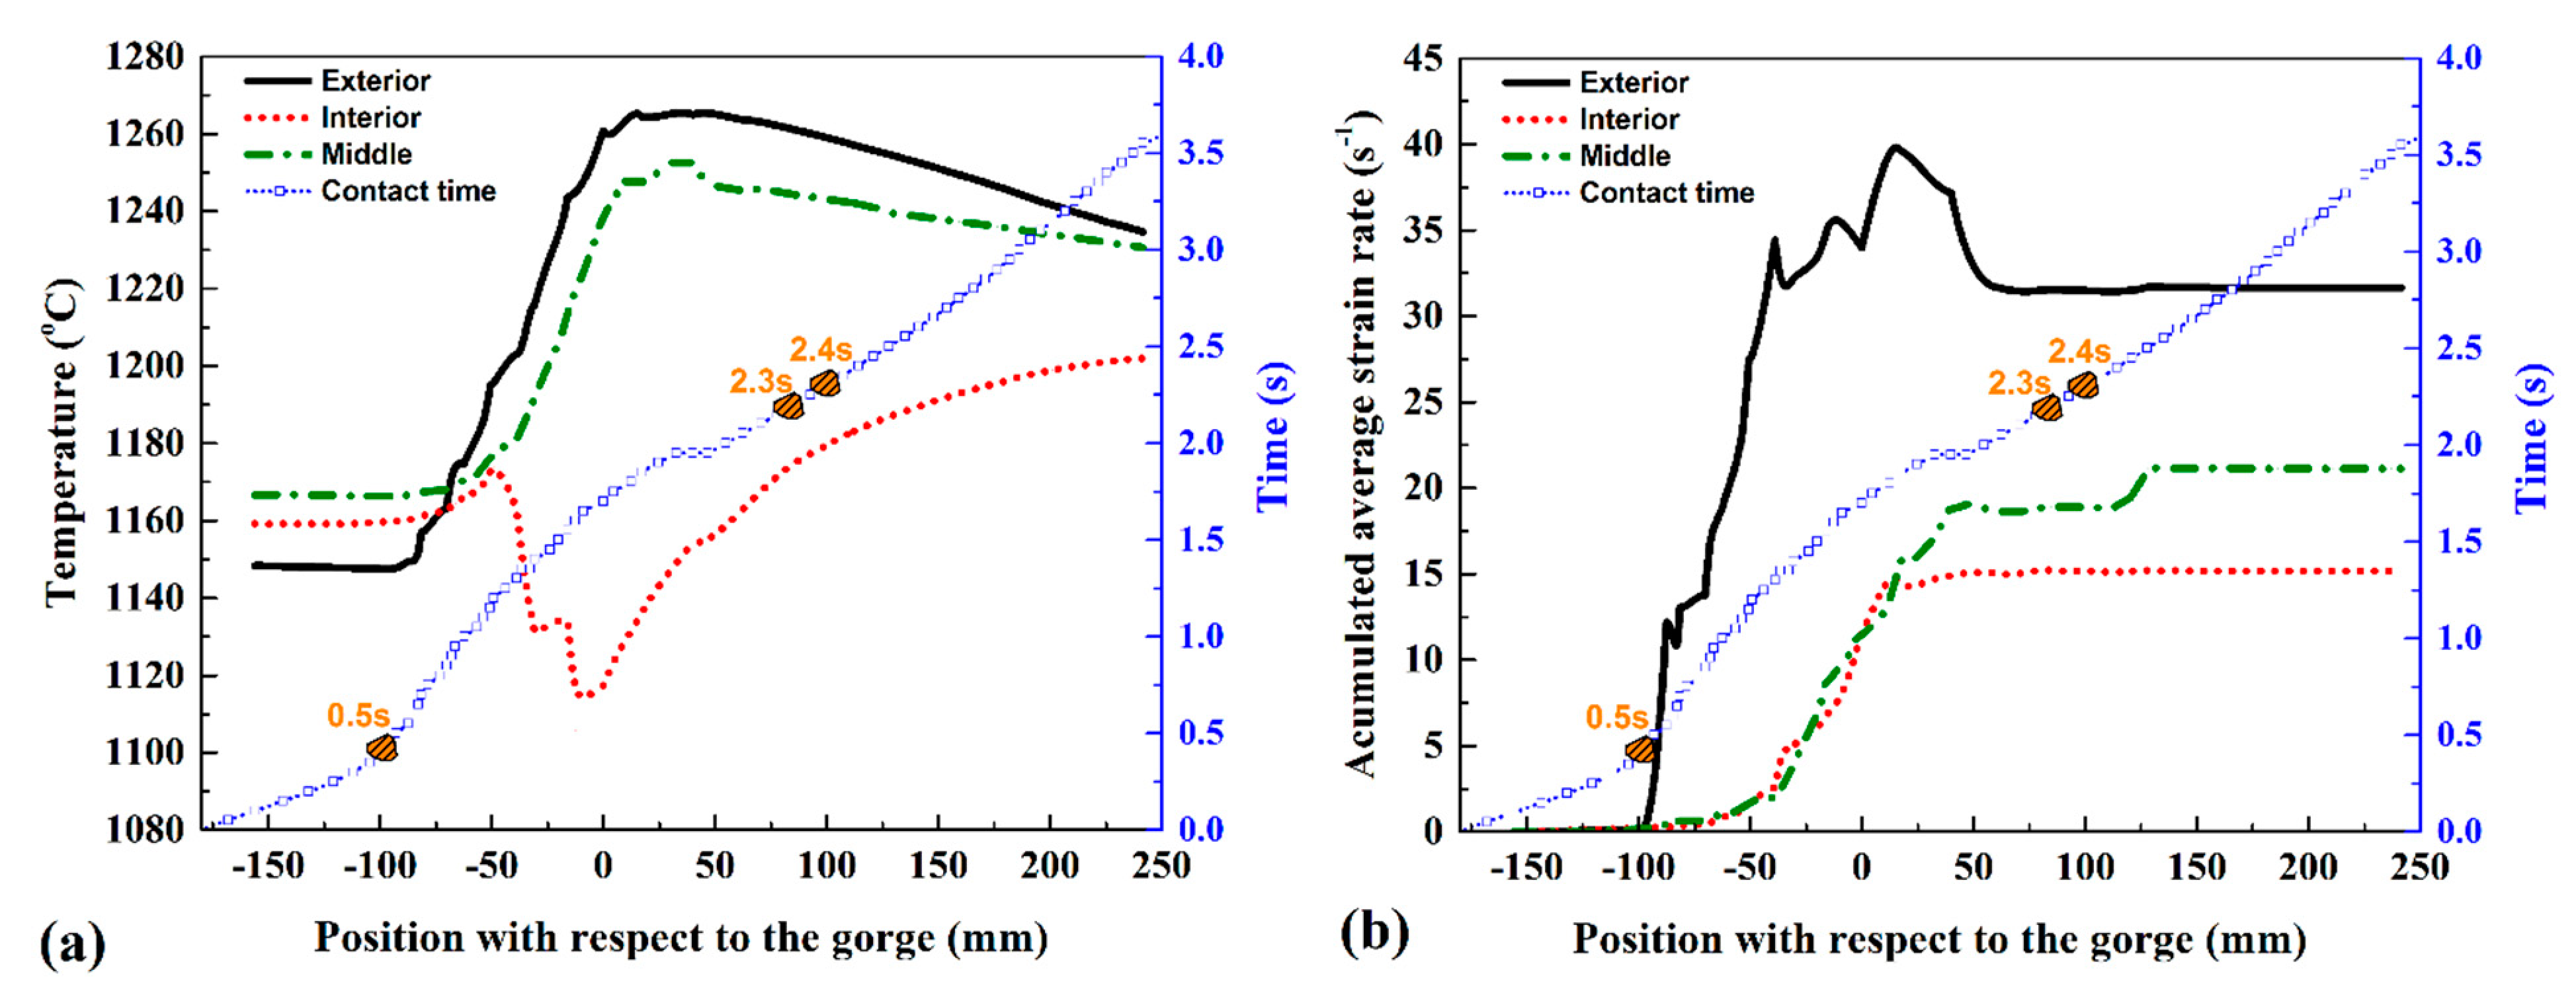
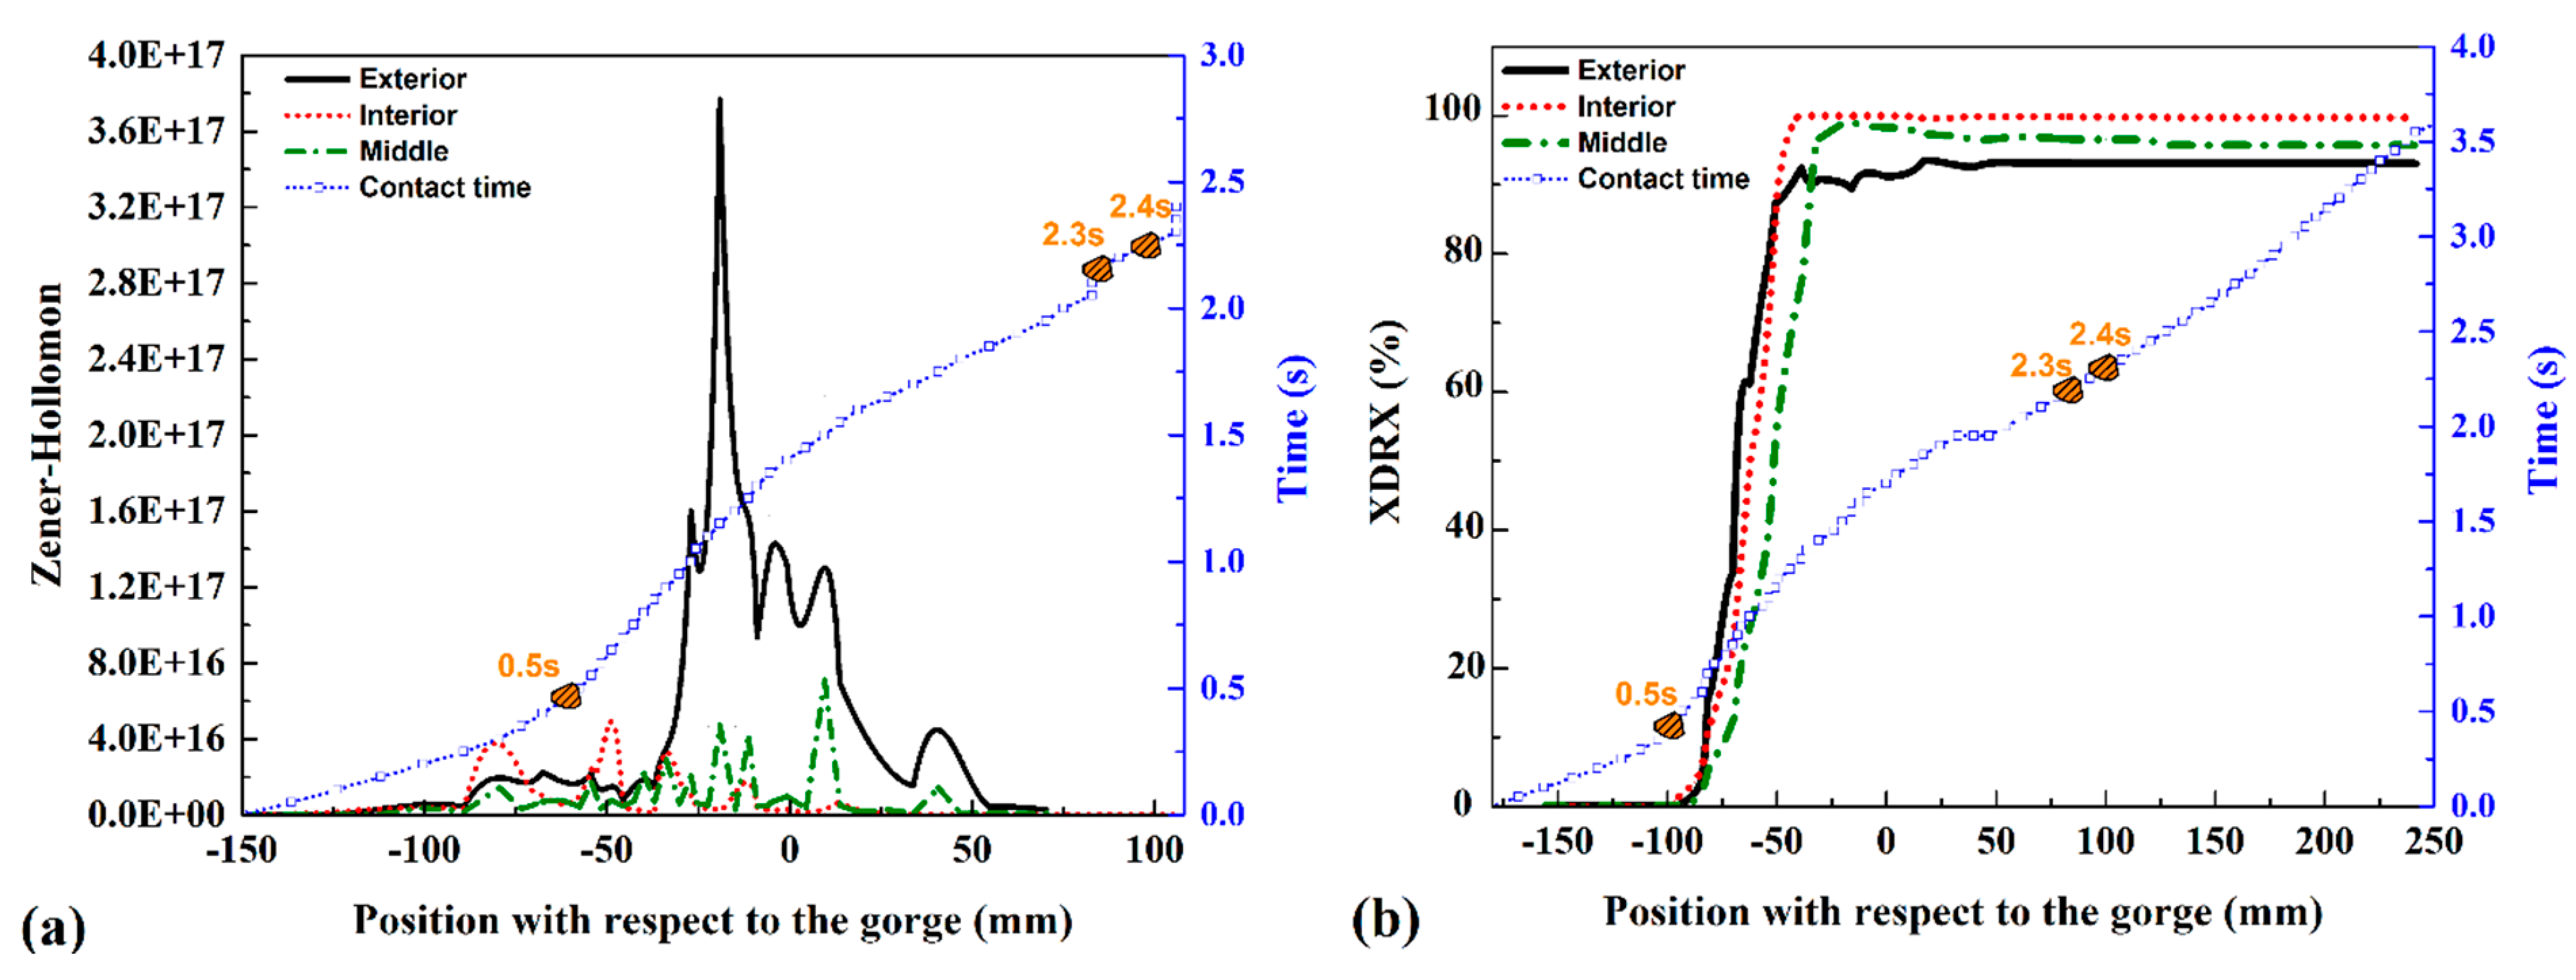
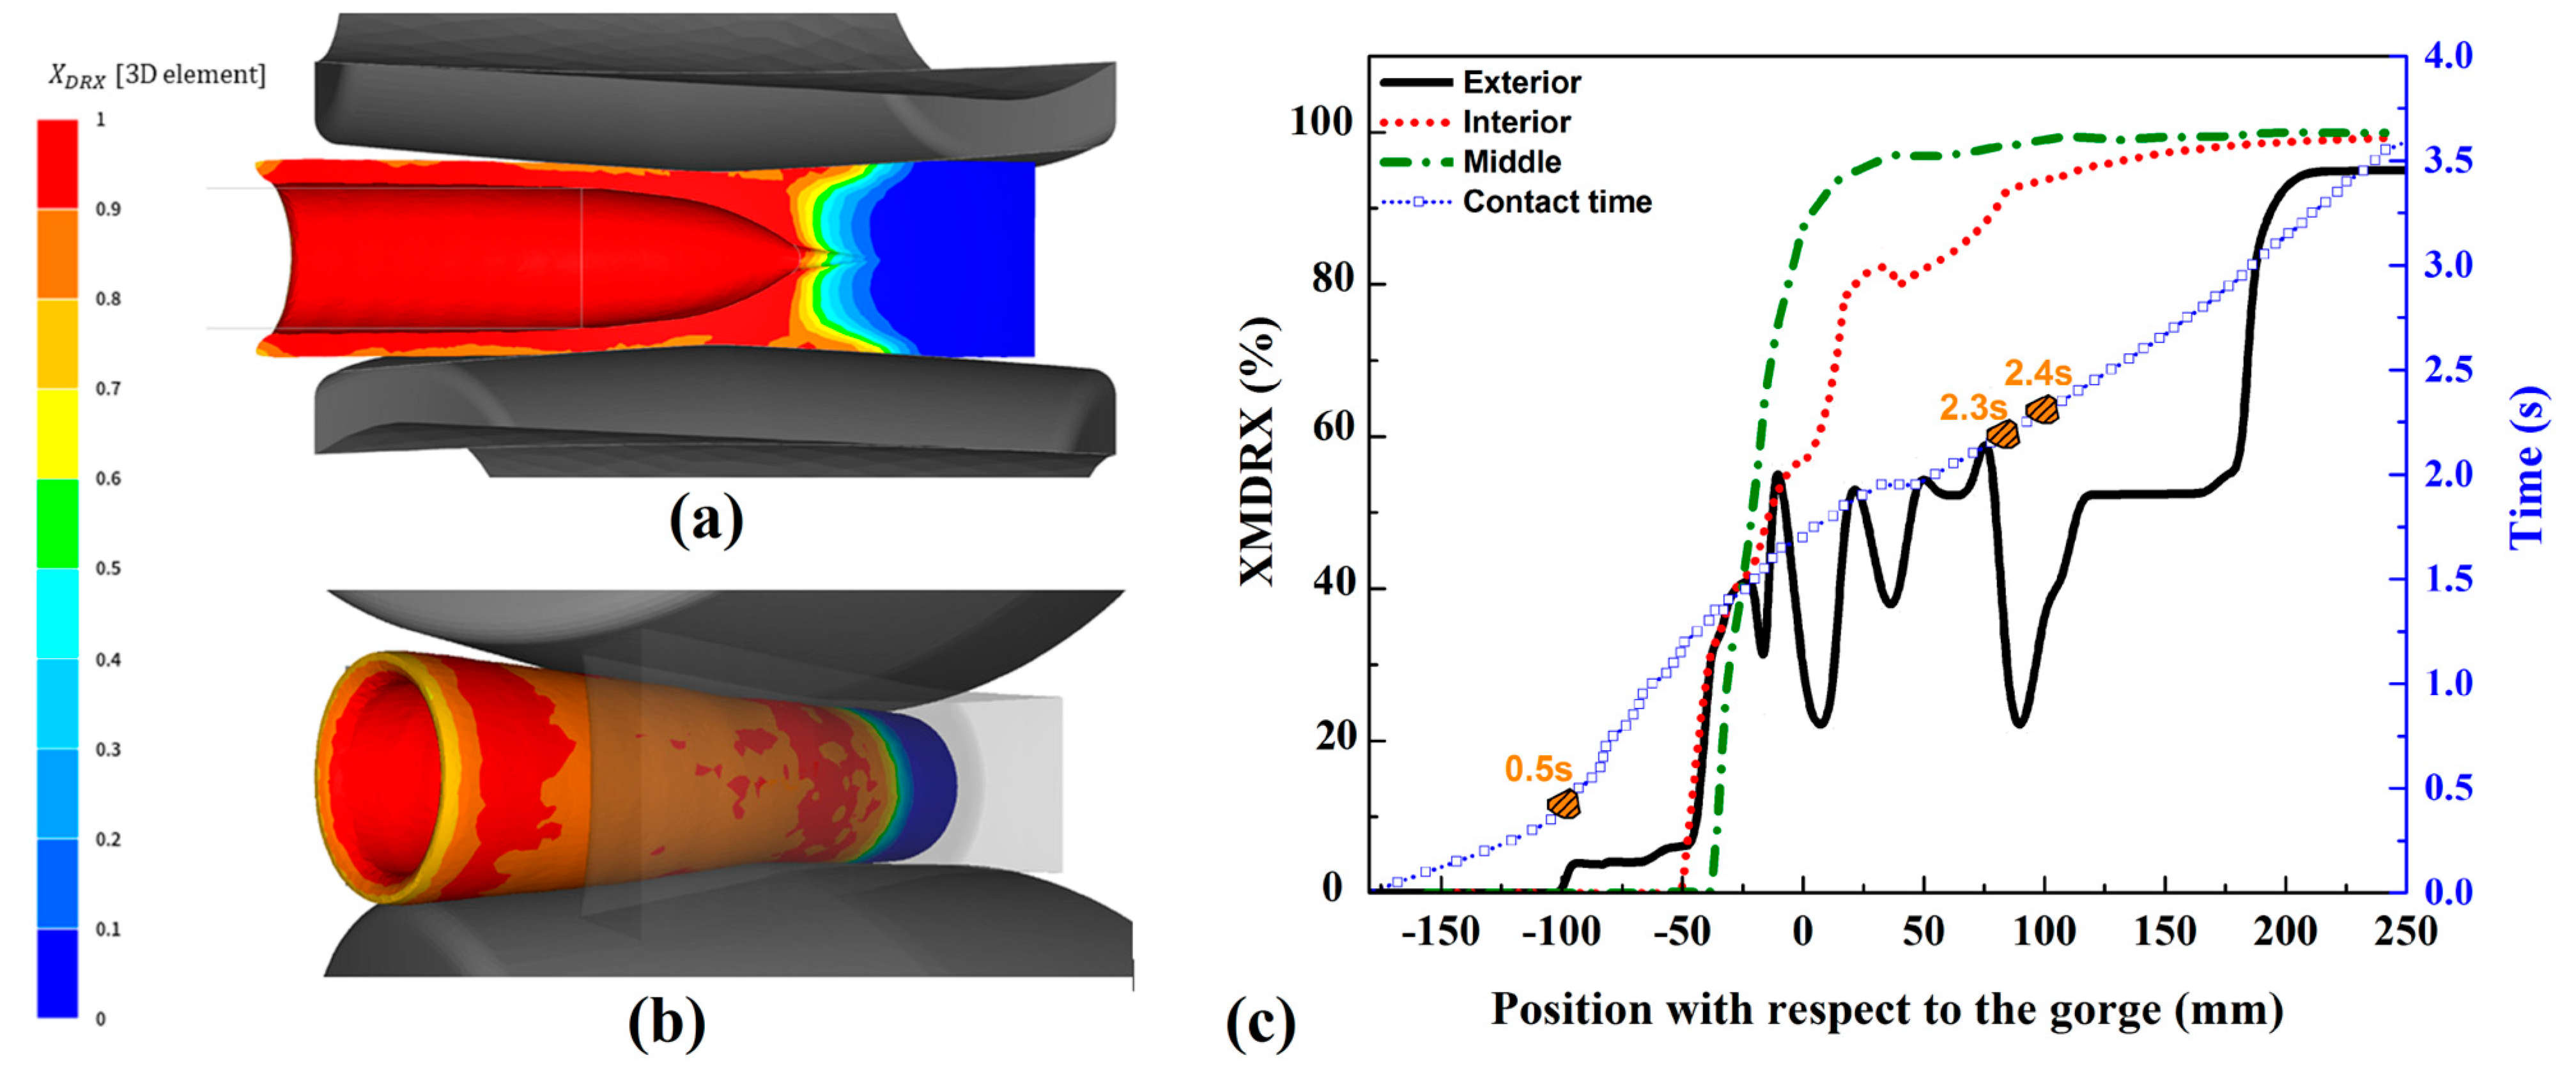
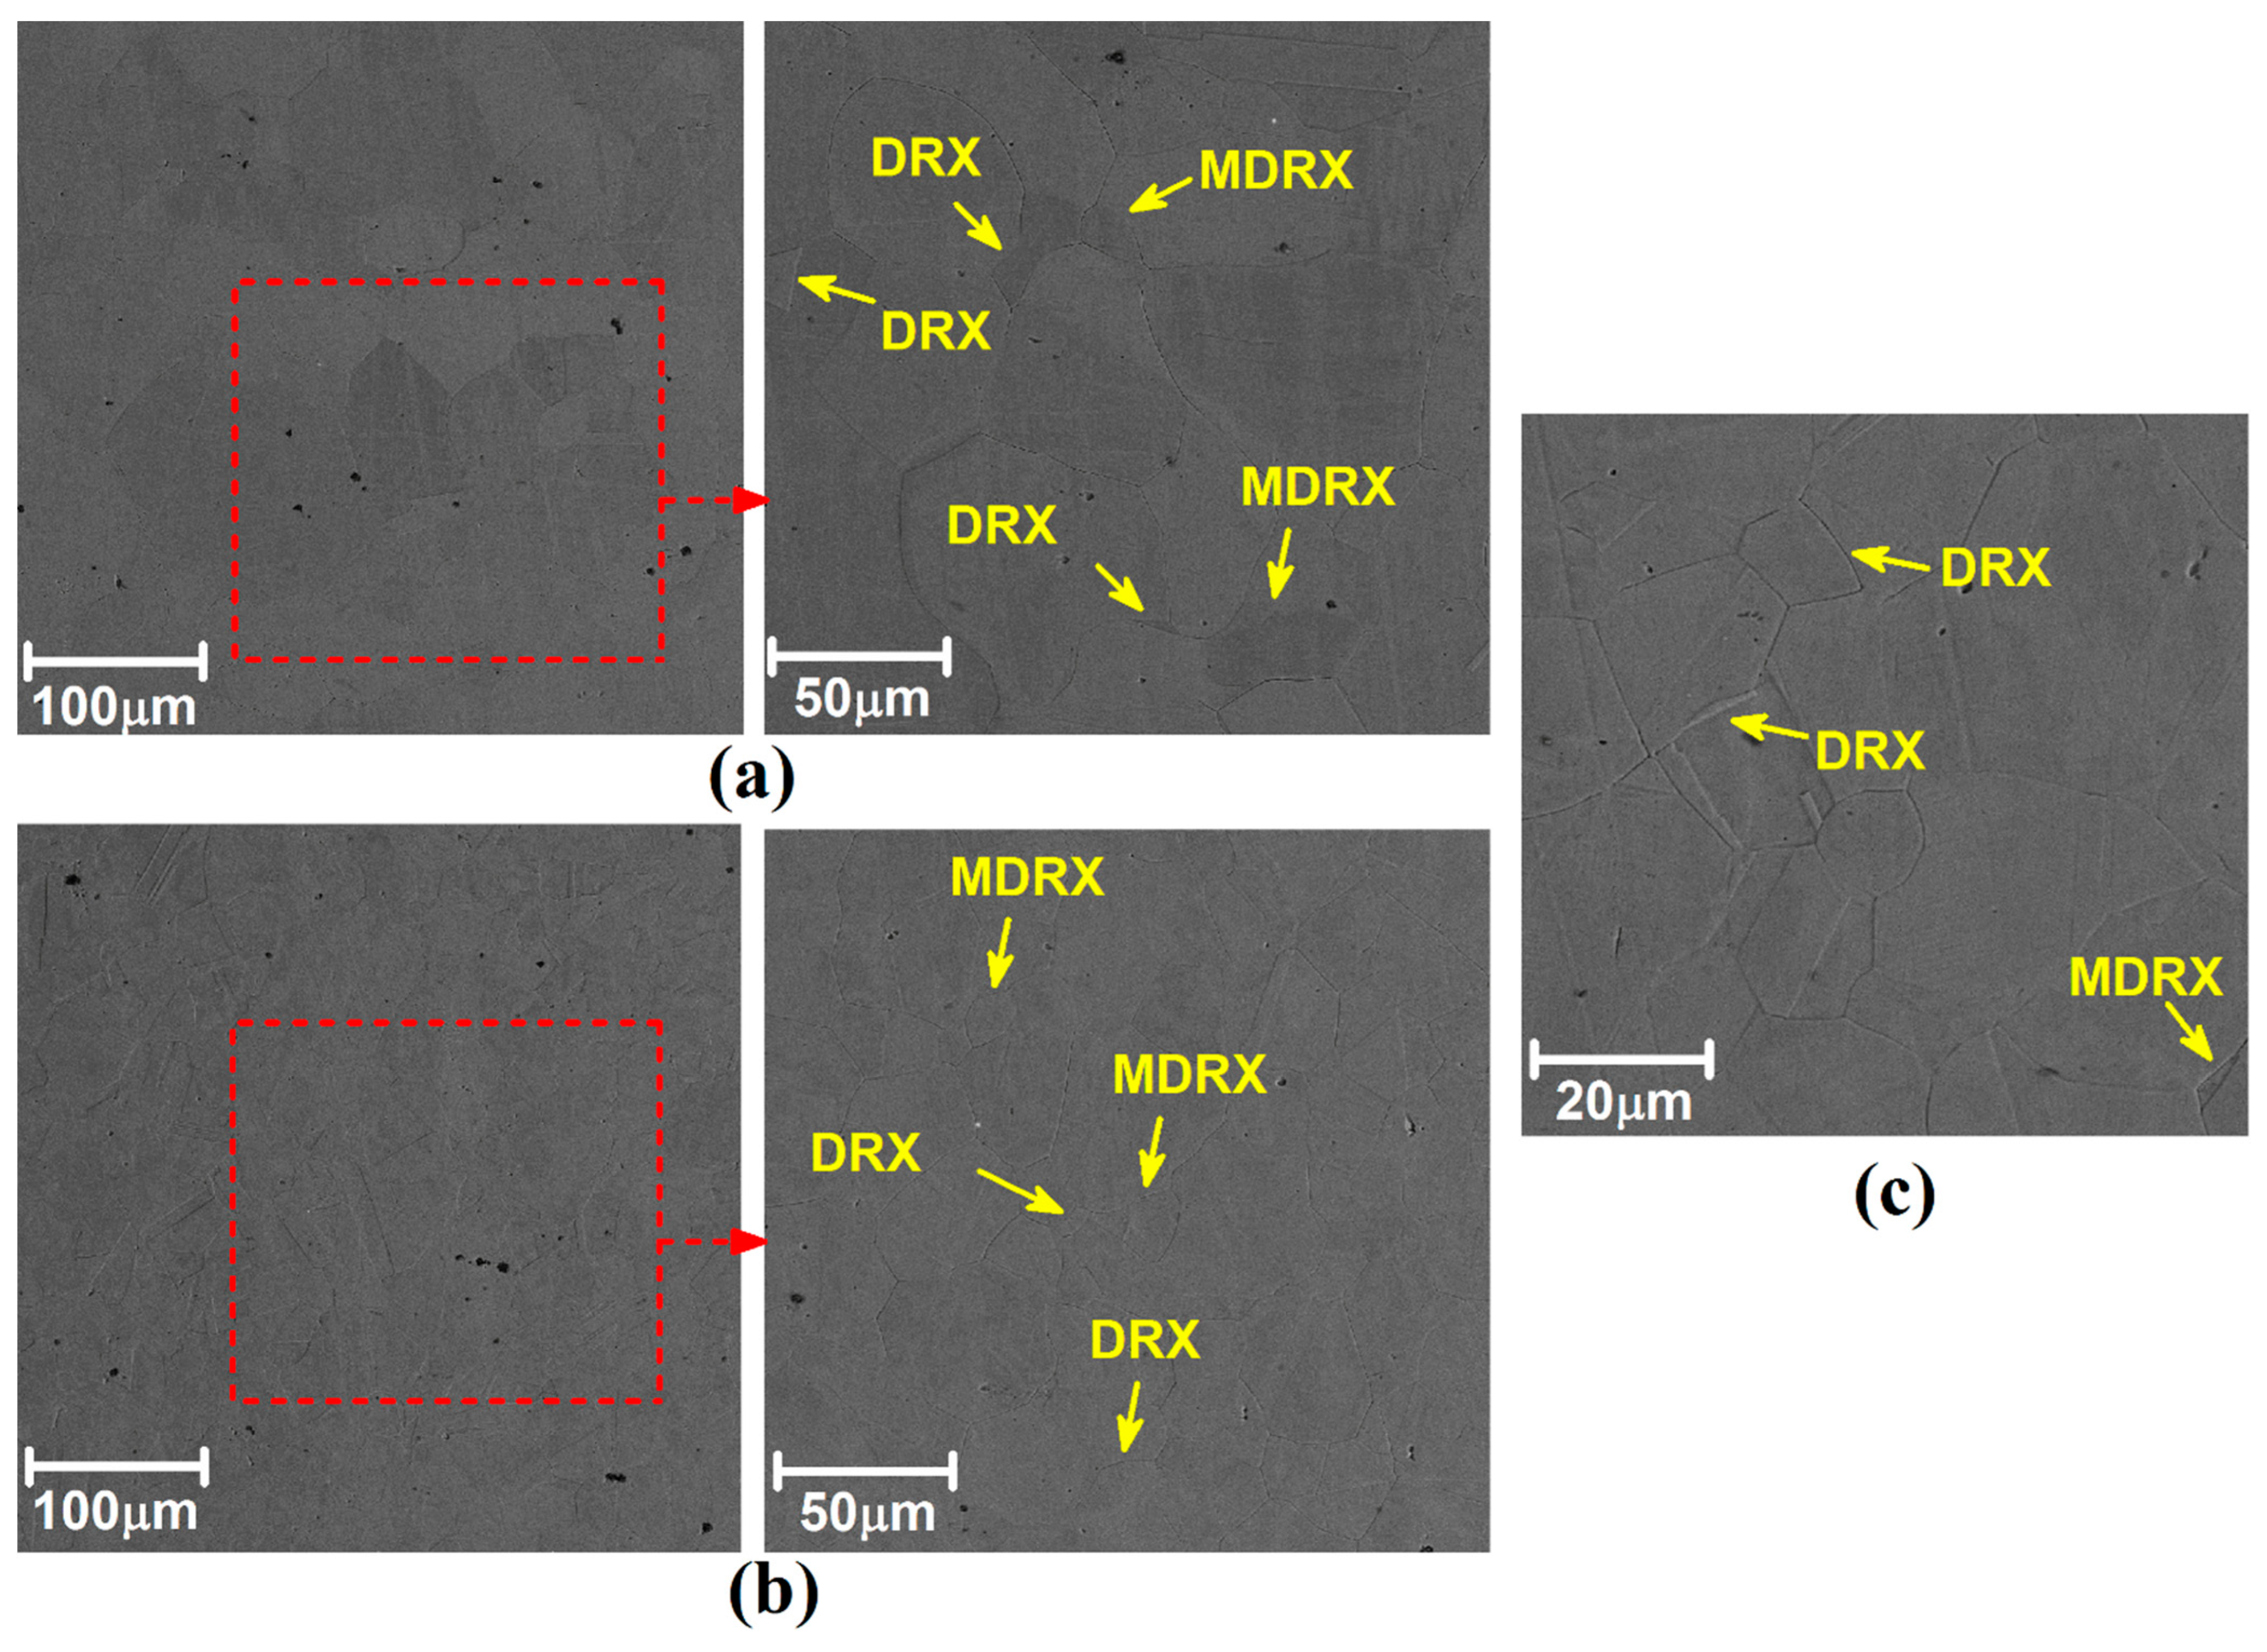
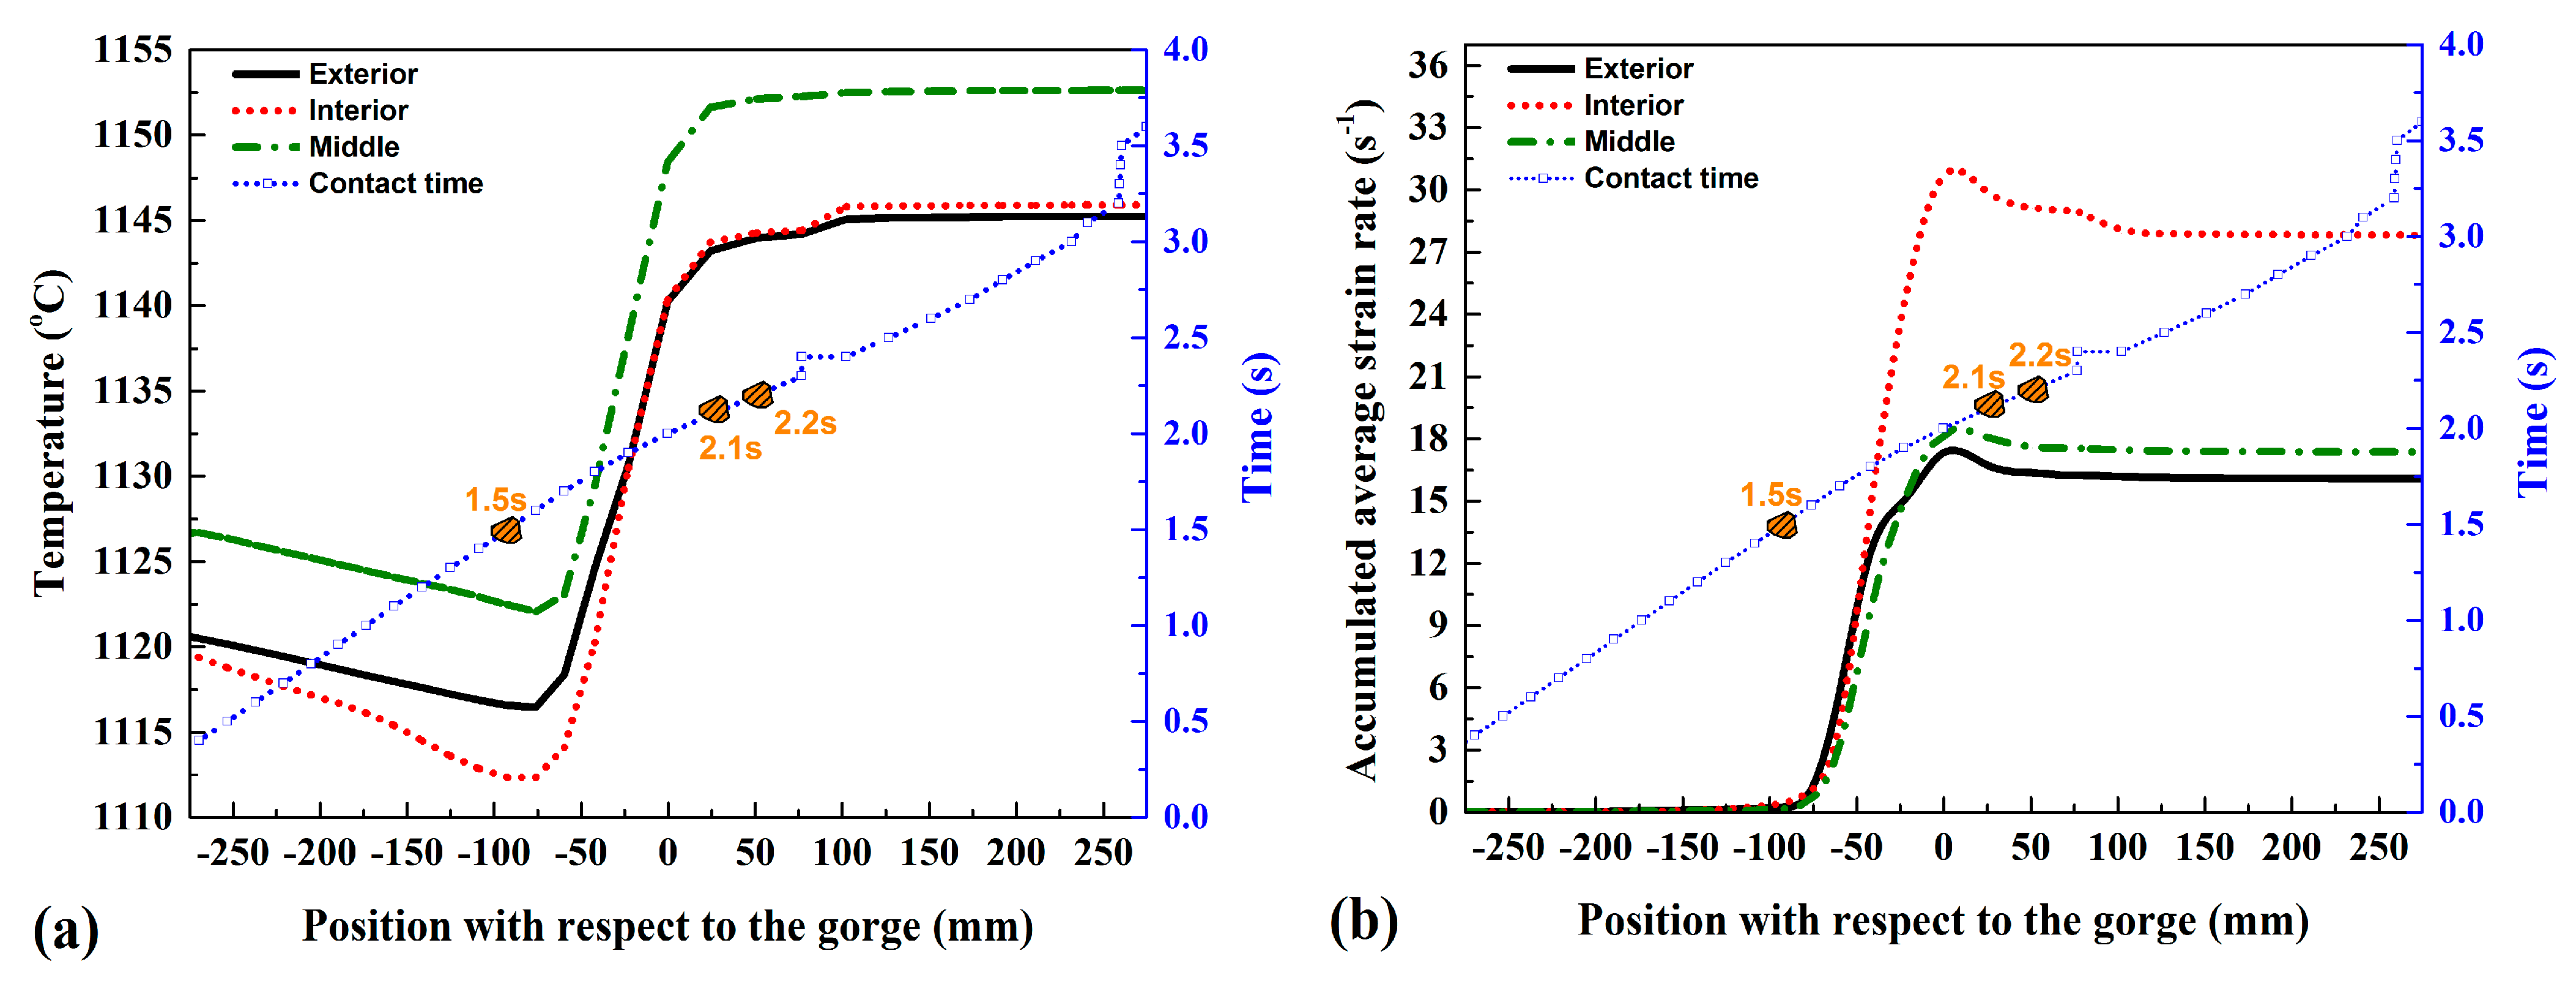
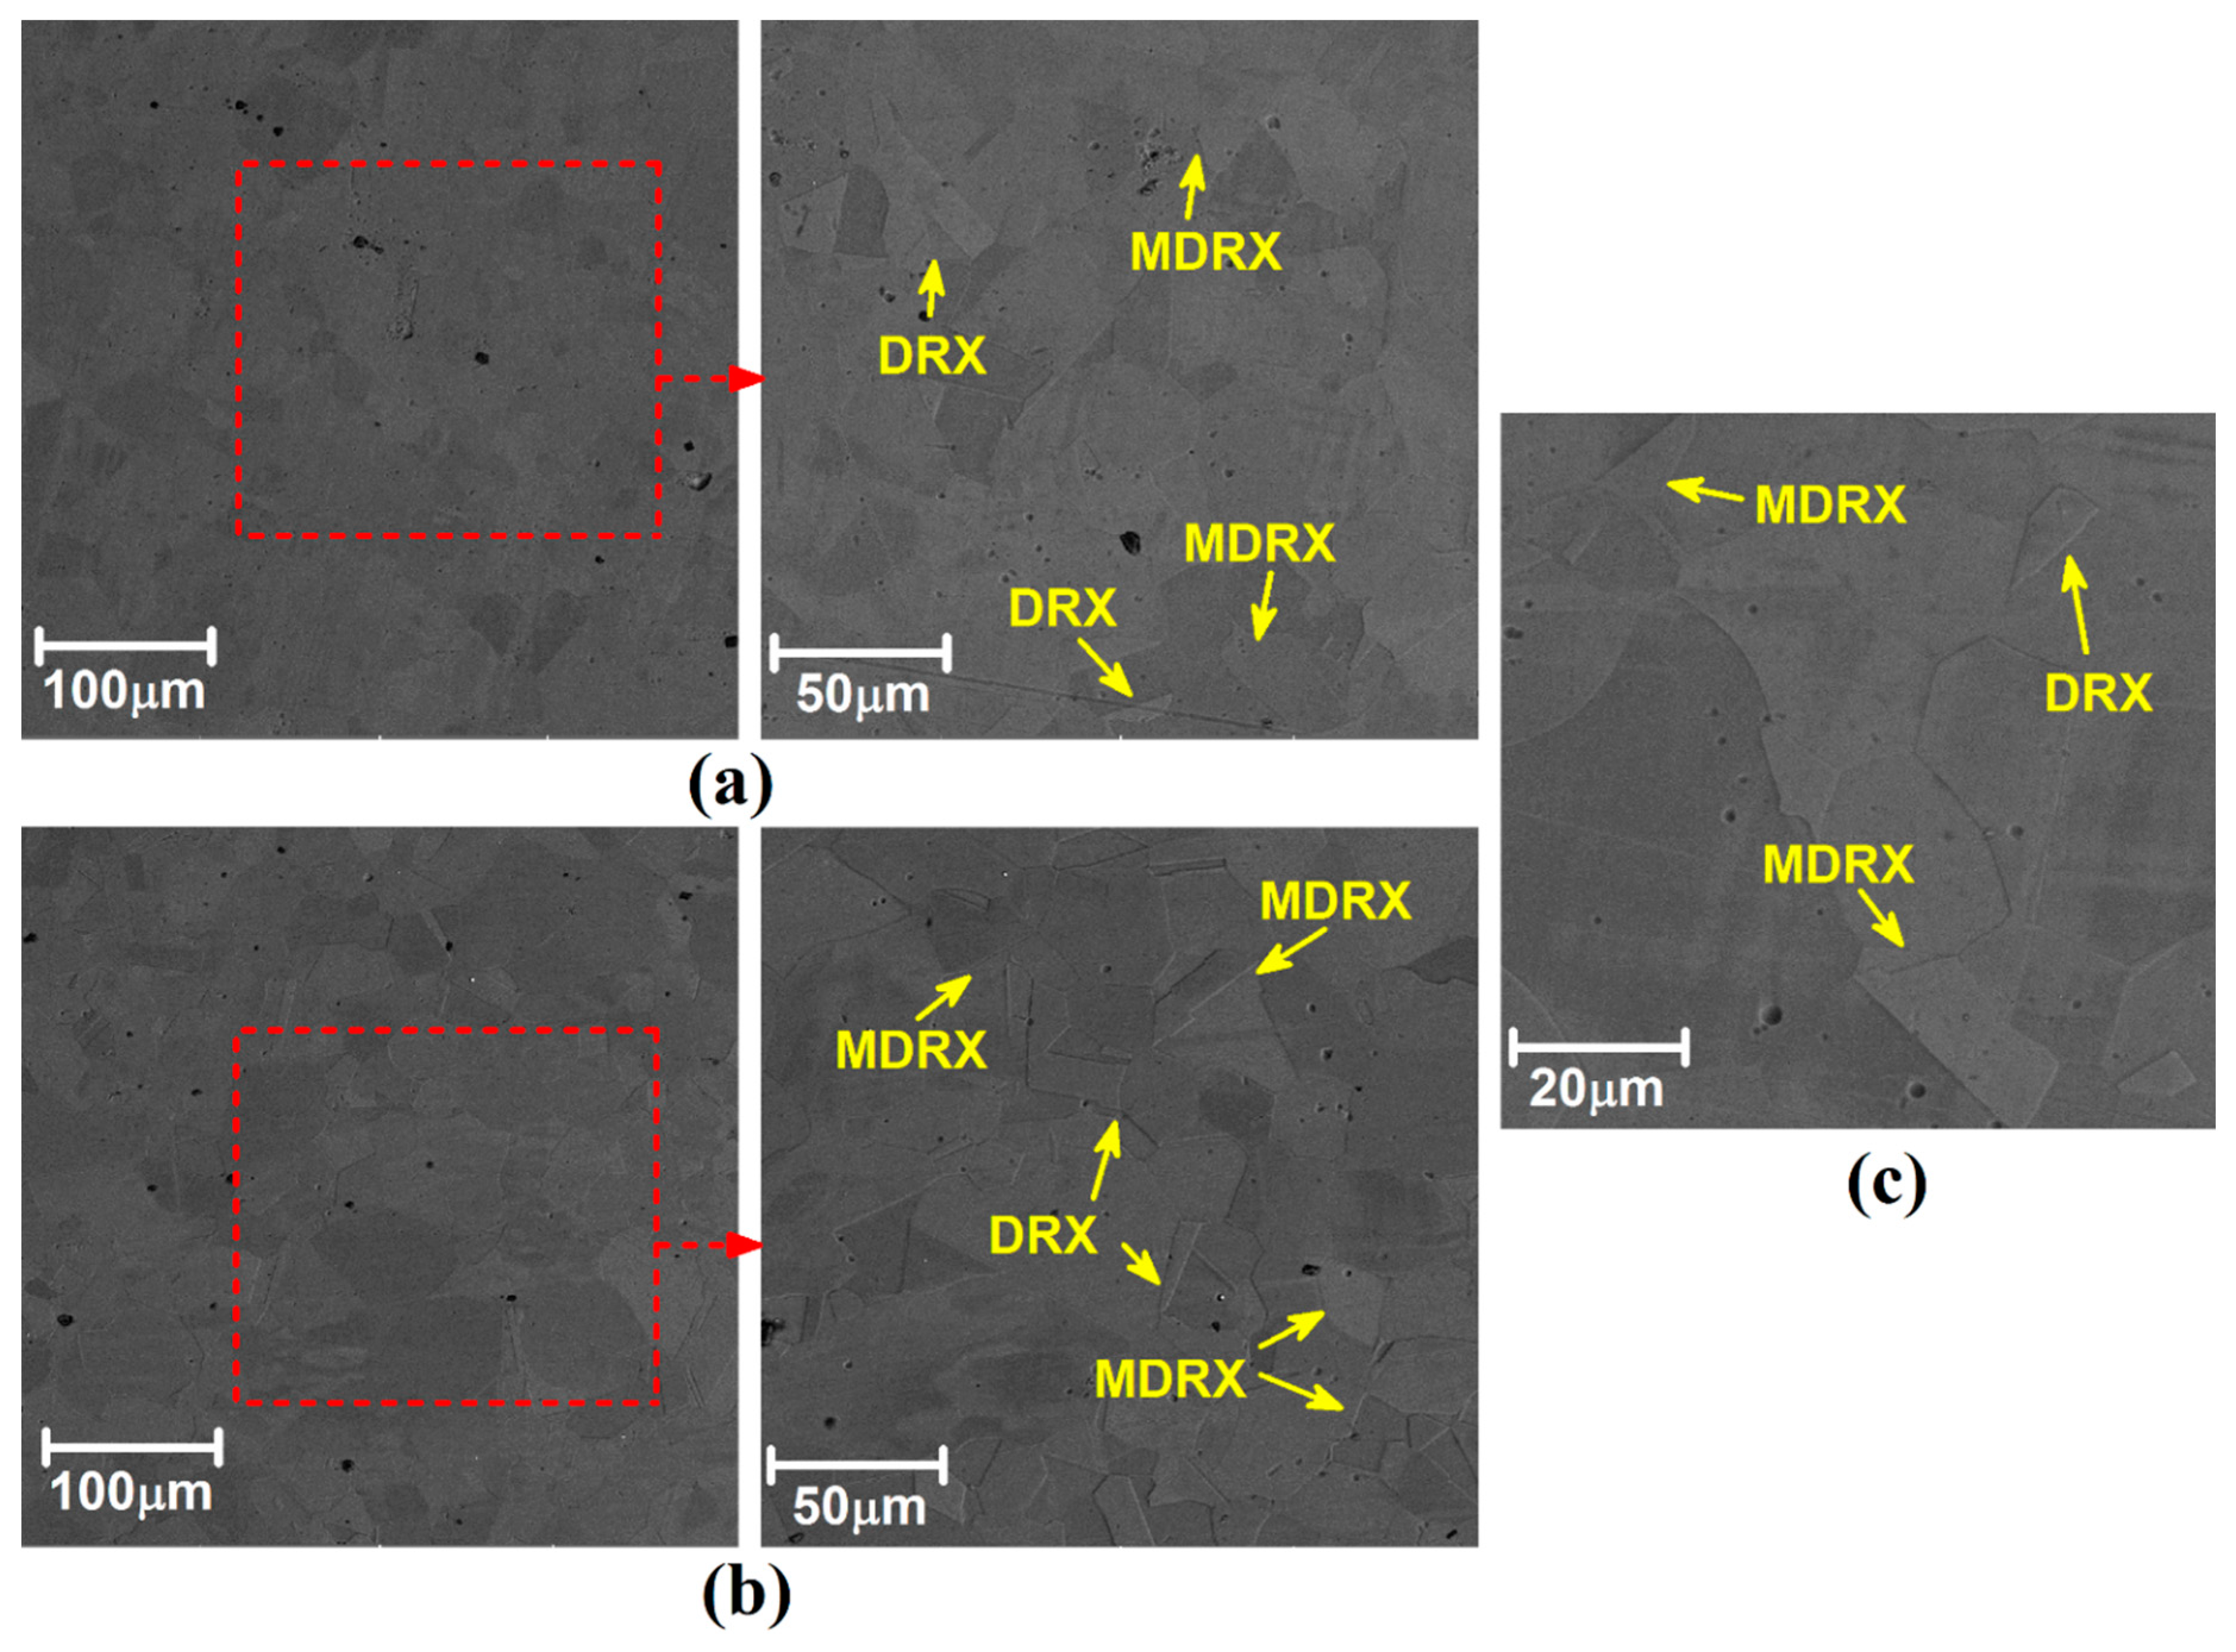
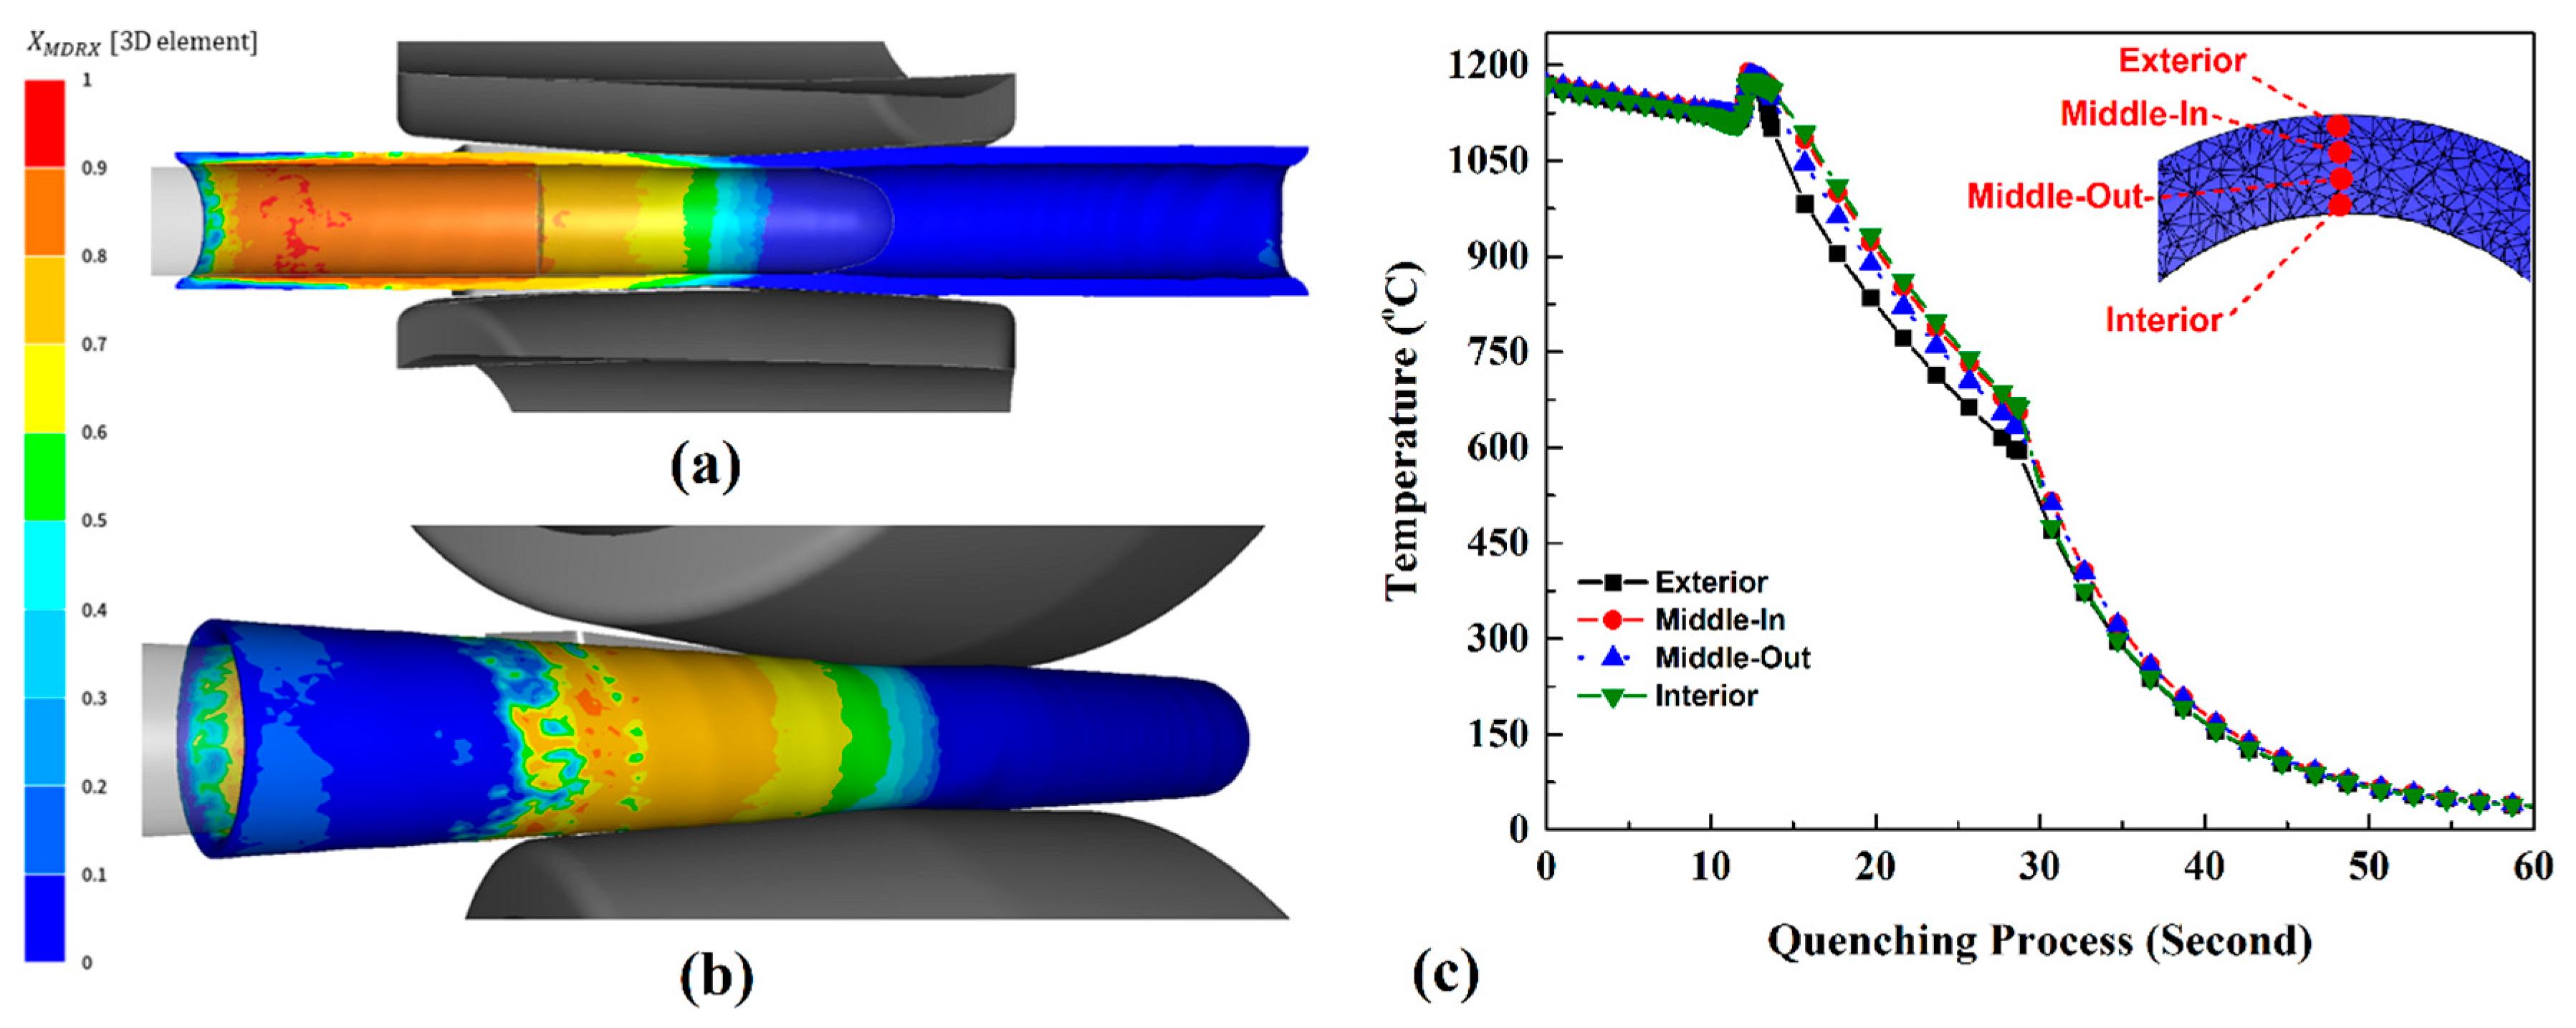
  • Dynamic and meta-dynamic recrystallization occurred during the deformation of SASS 904L due to the combination of a high temperature and deformation rate. Upon exiting the deformation zone, at the beginning of accelerated cooling, partial static recrystallization was found. Significant deformation heating during piercing (70–100 °C) resulted in the enhancement of strength properties in most heated areas due to the dispersion of particles through precipitation during ageing. The rapid cooling of thin-walled pipes after elongation made it possible to preserve a more homogenous cross-sectional microstructure as well as to prevent decomposition and retain solid solution alloying.
  • The average hardness measurements for the internal and external surfaces of the pierced shell were 155 ± 3 HV and 140 ± 3 HV, respectively. Similarly, the average hardness values for the internal and external surfaces of the elongated pipe were determined to be 149 ± 3 HV and 140 ± 4 HV, respectively. Monitoring changes in hardness can prove valuable to various industries, especially in subsequent processes like cold deformation or welding. The proposed method, which includes accelerated spray cooling as the pipes exit the deformation zone, holds promise for producing pipes with consistent structural and property characteristics. This innovative approach eliminates the need for additional heat treatments, enhancing production efficiency. It is also crucial to ensure the uniform accelerated cooling of both the external and internal surfaces of the pipes, which can be achieved by directing water through specialized openings in the plug rod.

Supplementary Materials

The following supporting information can be downloaded at: https://www.mdpi.com/article/10.3390/jmmp7050185/s1, Figure S1. EDS analysis map of internal part of pierced tube; Figure S2. EDS analysis map of external part of pierced tube; Figure S3. Optical microstructure of samples, longitudinal section; Figure S4. Histograms of average grain size distribution within the longitudinal section for (a) external surface, and (b) internal surface of pierced shell. Histograms of average grain size distribution within the longitudinal section for the (c) external surface and (d) internal surface of the elongated pipe; Figure S5. EDS analysis map of internal part of elongated tube; Figure S6. EDS analysis map of external part of elongated tube; Table S1. EDS results of element analysis of internal area of pierced tube; Table S2. EDS results of element analysis of external area of pierced tube; Table S3. EDS results of element analysis of internal area of elongated tube; Table S4. EDS results of element analysis of external area of elongated tube; Selected chemical elements percentage tables, longitudinal section of pierced and elongated samples’ microstructures, and EDS map of the internal and external parts of the elongated tube after the cooling stage.

Author Contributions

Conceptualization, A.M.-M. and Y.G.; Formal analysis, H.A.D., A.P. and E.B.; Investigation, H.A.D., A.P. and E.B.; Methodology, A.M.-M. and L.K.; Resources, E.G. and A.A.; Supervision, E.G. and A.A.; Writing—original draft, A.M.-M. and Y.G.; Writing—review and editing, L.K., E.G. and A.A. All authors have read and agreed to the published version of the manuscript.

Funding

This study received financial support from the Department of Education of the Basque Government for the Research Group program IT1507-22.

Data Availability Statement

The data presented in this study are available on request from the corresponding author.

Conflicts of Interest

The authors declare no conflict of interest. The funders had no role in the design of the study; in the collection, analyses, or interpretation of data; in the writing of the manuscript; or in the decision to publish the results.

References

  1. Odette, R.; Zinkle, S. Structural Alloys for Nuclear Energy Applications; Elsevier: Amsterdam, The Netherlands, 2019; ISBN 978-0-12-397349-8. [Google Scholar]
  2. Sunny, K.T.; Korra, N.N. A Systematic Review about Welding of Super Austenitic Stainless Steel. Mater. Today Proc. 2021, 47, 4378–4381. [Google Scholar] [CrossRef]
  3. Fritz, J. Practical Guidelines for the Fabrication of Austenitic Stainless Steels, 2nd ed.; International Molybdenum Association (IMOA): London, UK, 2020; ISBN 978-1-907470-13-4. [Google Scholar]
  4. Ebrahimi, G.R.; Keshmiri, H.; Arabshahi, H. Mechanical Characteristics of Superaustenitic Stainless Steel Type 30Cr25Ni32MO3 at Elevated Temperatures. Mater. Sci. Appl. 2010, 1, 323–328. [Google Scholar] [CrossRef]
  5. Zhao, J.; Qiu, F.; Xu, C. Review of Creep-Thermomechanical Fatigue Behavior of Austenitic Stainless Steel. Crystals 2023, 13, 70. [Google Scholar] [CrossRef]
  6. Jamali, S.S.; Faraji, G.; Abrinia, K. Hydrostatic Radial Forward Tube Extrusion as a New Plastic Deformation Method for Producing Seamless Tubes. Int. J. Adv. Manuf. Technol. 2017, 88, 291–301. [Google Scholar] [CrossRef]
  7. Faraji, G.; Mashhadi, M.M.; Bushroa, A.R.; Babaei, A. TEM Analysis and Determination of Dislocation Densities in Nanostructured Copper Tube Produced via Parallel Tubular Channel Angular Pressing Process. Mater. Sci. Eng. A 2013, 563, 193–198. [Google Scholar] [CrossRef]
  8. Chan, W.L.; Fu, M.W.; Yang, B. Study of Size Effect in Micro-Extrusion Process of Pure Copper. Mater. Des. 2011, 32, 3772–3782. [Google Scholar] [CrossRef]
  9. Galkin, S.P.; Aleschenko, A.S.; Romantsev, B.A.; Gamin, Y.V.; Iskhakov, R.V. Effect of Preliminary Deformation of Continuously Cast Billets by Radial-Shear Rolling on the Structure and Properties of Hot-Rolled Chromium-Containing Steel Pipes. Metallurgist 2021, 65, 185–195. [Google Scholar] [CrossRef]
  10. Romanenko, V.P.; Sizov, D.V. Evaluating the Adequacy of a Mathematical Model of the Piercing of a Billet Into an Ultra-Thick-Walled Shell on a Two-High Rotary Rolling Mill. Metallurgist 2014, 57, 830–836. [Google Scholar] [CrossRef]
  11. Radionova, L.V.; Perevozchikov, D.V.; Makoveckii, A.N.; Eremin, V.N.; Akhmedyanov, A.M.; Rushchits, S.V. Grain Growth during Mechanical Processing of Austenitic Stainless Steel AISI 321. Metals 2023, 13, 1421. [Google Scholar] [CrossRef]
  12. Momeni, A.; Dehghani, K.; Keshmiri, H.; Ebrahimi, G.R. Hot Deformation Behavior and Microstructural Evolution of a Superaustenitic Stainless Steel. Mater. Sci. Eng. A 2010, 6, 1605–1611. [Google Scholar] [CrossRef]
  13. Bradaskja, B.; Pirnar, B.; Fazarinc, M.; Fajfar, P. Deformation Behaviour and Microstructural Evolution During Hot Compression of AISI 904L. Steel Res. Int. 2011, 82, 346–351. [Google Scholar] [CrossRef]
  14. Wang, X.; Chandrashekhara, K.; Buchely, M.F.; Lekakh, S.; Van Aken, D.C.; O’Malley, R.J.; Ridenour, G.W.; Scheid, E. Experiment and Simulation of Static Softening Behavior of Alloyed Steel during Round Bar Hot Rolling. J. Manuf. Process. 2020, 52, 281–288. [Google Scholar] [CrossRef]
  15. Cao, X.; Wang, B.; Zhou, J.; Shen, J. Application of Unified Constitutive Model of 34CrNiMo6 Alloy Steel and Microstructure Simulation for Flexible Skew Rolling Hollow Shafts. J. Manuf. Process. 2022, 76, 598–610. [Google Scholar] [CrossRef]
  16. Han, Y.; Qiao, G.; Sun, J.; Zou, D. A Comparative Study on Constitutive Relationship of As-Cast 904L Austenitic Stainless Steel during Hot Deformation Based on Arrhenius-Type and Artificial Neural Network Models. Comput. Mater. Sci. 2013, 67, 93–103. [Google Scholar] [CrossRef]
  17. Yin, Y.; Li, S.; Kang, Y.; Wang, P.; Wang, X.; Li, G. Influence of Technological Parameters on Lamination Defect of Large Diameter Heavy Wall P92 Seamless Steel Pipe Elongated by 2-Roll Rotary Rolling Process. Cailiao Kexue Yu Gongyi/Mater. Sci. Technol. 2014, 22, 123–128. [Google Scholar]
  18. Song, C.; Wang, H.; Sun, Z.; Xu, J.; Chen, H.; Yin, W. A New Hot-Rolled Lightweight Steel with Ultra-High Strength and Good Ductility Designed by Dislocation Character and Transformation Strain. Scr. Mater. 2022, 212, 114583. [Google Scholar] [CrossRef]
  19. Skripalenko, M.M.; Rogachev, S.O.; Romantsev, B.A.; Bazhenov, V.E.; Skripalenko, M.N.; Danilin, A.V. Microstructure and Hardness of Hollow Tube Shells at Piercing in Two-High Screw Rolling Mill with Different Plugs. Materials 2022, 15, 2093. [Google Scholar] [CrossRef]
  20. Murillo-Marrodán, A.; García, E.; Barco, J.; Cortés, F. Analysis of Wall Thickness Eccentricity in the Rotary Tube Piercing Process Using a Strain Correlated FE Model. Metals 2020, 10, 1045. [Google Scholar] [CrossRef]
  21. Mikhalkin, D.V.; Korsakov, A.A.; Panasenko, O.A.; Pyankov, K.P. Parameters of the Deformation Zone and Boundary Conditions of the Piercing Process. Metallurgist 2021, 65, 137–146. [Google Scholar] [CrossRef]
  22. Romantsev, B.A.; Aleshchenko, A.S.; Tsyutsyura, V.Y.; Tyshchuk, I.N.; Lube, I.I. Features of Piercing Mill TPA 50-200 Working Roll Wear During Rolling Continuously-Cast and Hot-Rolled Billets. Metallurgist 2017, 60, 1062–1069. [Google Scholar] [CrossRef]
  23. Ding, X.; Kuai, Y.; Li, T.; Zhou, Y.; Shuang, Y. Enhanced Mechanical Properties of Magnesium Alloy Seamless Tube by Three-Roll Rotary Piercing with Severe Plastic Deformation. Mater. Lett. 2022, 313, 131655. [Google Scholar] [CrossRef]
  24. Zhang, Z.; Liu, D.; Yang, Y.; Zheng, Y.; Pang, Y.; Wang, J.; Wang, H. Explorative Study of Rotary Tube Piercing Process for Producing Titanium Alloy Thick-Walled Tubes with Bi-Modal Microstructure. Arch. Civ. Mech. Eng. 2018, 18, 1451–1463. [Google Scholar] [CrossRef]
  25. Zhang, Z.; Liu, D.; Zhang, R.; Yang, Y.; Pang, Y.; Wang, J.; Wang, H. Experimental and Numerical Analysis of Rotary Tube Piercing Process for Producing Thick-Walled Tubes of Nickel-Base Superalloy. J. Mater. Process. Technol. 2020, 279, 116557. [Google Scholar] [CrossRef]
  26. Zhang, Z.; Liu, D.; Li, N.; Man, T.; Wang, J.; Pang, Y.; Yang, Y. Investigations on External Separation Layer Defect of Nickel-Based Superalloy in Rotary Tube Piercing Process. Int. J. Adv. Manuf. Technol. 2022, 121, 517–541. [Google Scholar] [CrossRef]
  27. Murillo-Marrodán, A.; Garcia, E.; Barco, J.; Cortés, F. Application of an Incremental Constitutive Model for the FE Analysis of Material Dynamic Restoration in the Rotary Tube Piercing Process. Materials 2020, 13, 4289. [Google Scholar] [CrossRef] [PubMed]
  28. Zhang, Z.; Liu, D.; Yang, Y.; Wang, J.; Zheng, Y.; Zhang, F. Microstructure Evolution of Nickel-Based Superalloy with Periodic Thermal Parameters during Rotary Tube Piercing Process. Int. J. Adv. Manuf. Technol. 2019, 104, 3991–4006. [Google Scholar] [CrossRef]
  29. Che, P.; Wang, S.; Cheng, Y.; Wei, L.; Li, X.; Xu, H. Effect of Aging on the Toughness of Heat-Resistant 22Cr-15Ni-4Cu Austenitic Steel. J. Phys. Conf. Ser. 2021, 1965, 012071. [Google Scholar] [CrossRef]
  30. Murillo-Marrodan, A.; Garcia, E.; Cortes, F. A Study of Friction Model Performance in a Skew Rolling Process Numerical Simulation. Int. J. Simul. Model. 2018, 17, 569–582. [Google Scholar] [CrossRef]
Figure 1. Microstructure of the incoming billet cross section (a) on the external area and (b) in the central area.
Jmmp 07 00185 g001
Figure 2. Schematic view and geometrical dimensions of (a) piercing and (b) elongation phases.
Jmmp 07 00185 g002
Figure 3. The rolling stand (view from the output side) of the (a) MISIS-130D piercing mill and (b) the cooling system.
Jmmp 07 00185 g003
Figure 4. Scheme of microstructure and XRD sampling and measuring.
Jmmp 07 00185 g004
Figure 5. Routine for the computation of microstructural changes.
Jmmp 07 00185 g005
Figure 6. FE mesh used in the model: (a) isometric view of piercing phase, (b) isometric view of elongation phase, (c) lateral view of piercing phase, and (d) lateral view of elongation phase.
Jmmp 07 00185 g006
Figure 7. The appearance of shells (a) after piercing and (b) tubes after elongation. Simulation results of produced shell after (c) piercing and (d) tube after elongation.
Jmmp 07 00185 g007
Figure 8. Comparison between simulation and experimental results of (a) tube diameter and (b) wall thickness.
Jmmp 07 00185 g008
Figure 9. Change in temperature (a) and average strain rate (b) within the external, middle, and inner areas across the shell thickness.
Jmmp 07 00185 g009
Figure 10. (a) Zener–Hollomon parameter for the piercing phase, (b) DRX volume fraction as related to the gorge position.
Jmmp 07 00185 g010
Figure 11. Optical microscopic image from microstructure of outer, middle, and inner areas of pierced samples. Histograms of average grain size distribution in outer, middle, and inner areas of pierced samples.
Jmmp 07 00185 g011
Figure 12. DRX volume fraction during the piercing stage at the (a) internal section and (b) outer view. (c) Evolution of MDRX volume fraction as related to the gorge position.
Jmmp 07 00185 g012
Figure 13. SEM image of tube microstructure after piercing phase in (a) interior and (b) exterior areas. (c) High magnification of tube’s exterior area.
Jmmp 07 00185 g013
Figure 14. MDRX volume fraction during the piercing stage at (a) internal section and (b) outer view. (c) Temperature change through the shell wall section during quenching.
Jmmp 07 00185 g014
Figure 15. (a) Temperature change and (b) the average strain rate value in the external, middle, and inner areas of the pipe thickness.
Jmmp 07 00185 g015
Figure 16. (a) Zener–Hollomon parameter for the piercing phase, (b) Evolution of the DRX fraction as related to the gorge position.
Jmmp 07 00185 g016
Figure 17. Optical microscopic image from microstructure of outer, middle, and inner areas of elongated samples. Histograms of average grain size distribution in outer, middle, and inner areas of pierced samples.
Jmmp 07 00185 g017
Figure 18. DRX volume fraction during the piercing stage at the (a) internal section and (b) outer view. (c) Evolution of the MDRX fraction as related to the gorge position.
Jmmp 07 00185 g018
Figure 19. SEM image of tube microstructure after elongation in (a) interior and (b) exterior areas. (c) High magnification of tube exterior area.
Jmmp 07 00185 g019
Figure 20. MDRX volume fraction during the elongation stage at (a) internal section and (b) outer view. (c) Temperature change within the shell thickness section during quenching.
Jmmp 07 00185 g020
Figure 21. Results of X-ray diffraction analysis.
Jmmp 07 00185 g021
Figure 22. Distribution of hardness across the wall thickness section.
Jmmp 07 00185 g022
Table 1. Chemical composition of AISI 904L steel.
CCrNiSiMnMoPSCuTiFe
0.04723.428.70.70.572.950.0320.0093.250.79rest
Table 2. Cooling rates of the external, middle, and inner areas during quenching.
Time (s)External (°C/s)Middle out. (°C/s)Middle in. (°C/s)Inner (°C/s)
0–1531.527.924.722.8
15–2538.541.044.950.4
25–3517.419.419.817.8
35–457.78.78.87.9
Table 3. Ratio of the grain size average value in the cross-section to the one in the longitudinal section.
Sample D ¯ / D ¯ Ratio
External SurfaceInternal Surface
Pierced shell1.22.2
Elongated pipe1.61.7
Table 4. Cooling rates of the external, middle, and inner areas during quenching.
Time (s)Outer (°C/s)Middle out. (°C/s)Middle in. (°C/s)Interior (°C/s)
0–1533.934.633.933.1
15–2540.242.444.747.0
25–3511.812.912.911.9
Table 5. Hardness of samples for pipes’ external and internal surfaces.
SampleHardness HV
External SurfaceInternal Surface
Pierced shell155 ± 3140 ± 3
Elongated pipe149 ± 3140 ± 4
Disclaimer/Publisher’s Note: The statements, opinions and data contained in all publications are solely those of the individual author(s) and contributor(s) and not of MDPI and/or the editor(s). MDPI and/or the editor(s) disclaim responsibility for any injury to people or property resulting from any ideas, methods, instructions or products referred to in the content.

