Article

Study of SLA Printing Parameters Affecting the Dimensional Accuracy of the Pattern and Casting in Rapid Investment Casting

Department of Mechanical & Aerospace Engineering, School of Engineering & Digital Sciences, Nazarbayev University, 53 Kabanbay Batyr Avenue, Nur-Sultan City 010000, Kazakhstan
*
Authors to whom correspondence should be addressed.
J. Manuf. Mater. Process. 2022, 6(5), 109; https://doi.org/10.3390/jmmp6050109
Submission received: 4 August 2022 / Revised: 21 September 2022 / Accepted: 21 September 2022 / Published: 28 September 2022

Abstract

:
Dimensional accuracy and geometric characteristics of the manufactured parts bear significant importance in product assembly. In Rapid Investment Casting, these characteristics can be affected by the printing parameters of the Additive Manufacturing method used in the pattern production process. Stereolithography is one of the important AM techniques mostly exploited in RIC due to its accuracy, smooth surface, and precision. However, the effect of SLA printing parameters on the dimensional accuracy and geometric characteristics have not been studied thoroughly. This study considers an experimental approach to study the effect of SLA printing parameters such as layer thickness, build angle, support structure density, and support touchpoint size on the dimensional accuracy and geometrical characteristics of the Castable Wax printed patterns and the Al cast parts. Taguchi’s Design of Experiment was used to define the number of experimental runs. SolidCast simulation was used to design the orientation of casting feeder to achieve directional solidification. Coordinate Measuring Machine measurements of deviations in the printed and cast parts were analyzed using the “Smaller-the-better” scheme in the two-step optimization method of Taguchi experiments. Build angle and Layer thickness were identified to be the first and the second most impactful parameters, respectively, affecting both the dimensional and geometric accuracy of Castable Wax patterns and Al cast parts, with optimal values of 0 deg and 0.25 μm, respectively. Both printed and cast parts had twice as many deviations in geometry as in dimensions. The sphere roundness and angularity were found to be the most and least accurate geometric characteristics, respectively. The dimensions in the Z direction were more accurate than in the X-Y directions, showing the smallest size deviations for height measurements and large deviations in the length, width, and diameter of the hole.

1. Introduction

Investment casting (IC), also known as lost wax casting, is a near net shape and high-quality metal part manufacturing process. Precision and ability to cast high complexity geometries for mass production makes IC preferable over other casting methods like sand casting, in industries like medicine, automotive, aerospace, military, firearm, power generation, energy, gas and oil, food, jewelry, and custom commercial needs [1]. Conventionally, the IC process consists of four main stages: pattern making, shell/mold building, metal pouring, and shell removal from cast parts [2]. Traditional IC wax patterns are made using metal molds–prepared hard tooling. The advances in Additive Manufacturing (AM) technologies allow to integrate the 3D printing methods into the IC pattern making stage. Integration of AM into the IC process is called rapid investment casting (RIC). If conventional IC pattern production costs around USD 1415–70,752 and may take 2–16 weeks including the metal mold production for a new pattern, RIC can reduce the production cost and lead time by 60% and 89% respectively, due to the elimination of metal mold fabrication process [3,4]. Prakash et al. [5] compared the life cycle analysis of conventional IC and RIC production of aluminum casts. Their study showed that RIC resulted in a reduction of production time, cost, energy consumption, and carbon emissions by 19%, 93%, 70%, and 71%, respectively.
AM techniques can be applied in the RIC process through direct and indirect approaches. Direct RIC implies printing of the wax pattern using a 3D printer, while in the indirect RIC the wax pattern is cast using 3D printed molds [6]. For complex geometry pattern production, direct RIC is preferable over the indirect one, as in the indirect approach pattern mold can be damaged [7]. Experimental comparison of conventional IC with direct and indirect RIC performed by Chua et al. [8] showed that for small batch size production direct RIC is more efficient in terms of lead time and total cost of production.
IC is also known as a precise casting method, where dimensional accuracy of the final cast product is of importance. In the RIC process, dimensional accuracy of the cast parts can be affected by the printing parameters of the 3D printing technology chosen for the pattern production. In this study, Stereolithography (SLA) was chosen as the pattern printing method due to its accuracy and precision. Stereolithography (SLA) was the first technique used in the first rapid investment casting (RIC) attempts [9]. SLA provides better accuracy and precision of the printed parts over other printing technologies, such as Fused Deposition Modeling (FDM). However, dimensional accuracy is dependent upon different printing parameters. Although SLA is widely used 3D printing technology, there are less studies about the effect of SLA printing parameters on dimensional accuracy than, for example, about FDM/FFF [2,10].
The main concern about the use of SLA in RIC comes from high thermal expansion of photopolymers (resins) used in printing, which causes the shell cracking during dewaxing heating. Therefore, during photopolymerization of liquid resin, thicker samples will result in more volume expansion due to high thermal expansion [11,12]. This volumetric change during photopolymerization causes dimensional variations of the part [13]. UV treatment as a post-processing method might be needed in case of poor photopolymerization. Thus, controlled photopolymerization is of great importance. The photopolymerization process is mainly dependent on the laser power and laser exposure time [14,15]. Some studies [6,16] showed the importance of these factors for the dimensional accuracy of the part. Laser exposure time can be managed by the printing speed. Depth of light polymerization for each resin might differ due to its composition.
In addition, built orientation and positioning on the build platform were studied by Unkovskiy et al. [17]. In their study, parts built at 45° build angle and placed far from the build platform edges provided good dimensional accuracy. Similar results with the highest precision and good surface finish of the part when building at 45° build angle were obtained in another study [18]. In both studies, 0°, 45°, and 90° build directions were considered. Study investigating the effect of several factors, including resin type, printing resolution, positioning, alignment, target structure, and the type and number of support structures on the part’s surface roughness, revealed that alignment on the printing bed is less influential than other studied parameters [10]. They also reported other relevant parameters such as exposure time, speed of build platform movement from the tank, and tank temperature, which might affect the part surface finish and accuracy. They have stated that increased printing speed results in poor surface finish, which might be explained with the poor polymerization due to less exposure time at higher printing speed. Alharbi et al. [19] studied different build angles along with support types and found that among nine build angles tested (90°, 120°, 135°, 150°, 180°, 210°, 225°, 240°, and 270°) the 120° build angle showed the minimum dimensional deviations when printed with both thin and thick support types. Thin support structures resulted in better dimensional accuracy [20]. The most accurate surgical templates were produced at 0° and 45° build angles and the least accurate at 90° (among 0°, 30°, 45°, 60°, and 90°) in the study by Rubayo et al. [21]. In terms of less printing time, 0° was the most effective and 90° was the least, while in terms of material consumption 90° was better than 0°. A study about the effect of build angles and layer thickness on fit and internal gap of printed dental prosthesis by Park et al. [16] reported that 45° and 60° angles result in smaller internal gap and marginal discrepancy, and therefore provide the most dimensionally accurate results.
Resolution along the z- axis is defined by the layer thickness [12]. Layer thickness is one of the important parameters in all additive manufacturing techniques that affects the surface roughness and accuracy. Favero et al. [22] performed a study with three different layer heights: 25, 50, and 100 μm, and observed more deviations in parts printed with 25 μm layer thickness, while the least deviations were accounted for at 100 μm. Despite that, another study concerning the same layer thickness values for SLA printed casts from gray and cast resins, concluded that there are no statistically significant differences in accuracy among them, and only printing time doubles with decreased layer height [23,24]. Similar results were obtained by Loflin et al. [25] when assessing the printed orthodontic models and 100 μm layer thickness was recommended by them due to reduced printing time. However, 100 μm layer thickness of SLA printed parts produced the lowest printing accuracy in the study by Zhang et al. [26] who compared 25, 50, and 100 μm layer thicknesses in DLP (Digital Light Processing) and SLA printers. Park et al. [16] investigated the fit and internal gap of SLA printed resin dental prosthesis and found 100 µm layer thickness provided the best fit and 50 µm layer thickness offered smaller internal gap among studied 25, 50, and 100 μm layer thicknesses.
Dimensional accuracy of RIC products is an essential characteristic for prosthetic dentistry [27]. Comparison between the copings fabricated by milling and RIC with patterns printed by PolyJet and SLA printing methods were made by [28]. The accuracy of the parts was assessed by the marginal gap measurement between the produced copings and the implants. SLA showed a maximum of 0.128 mm and minimum of 0.042 mm deviation from the coping design. Another comparison of SLA printed patterns and the milled patterns used in the IC for post and core production was performed by [29]. Compared to the milled resin patterns SLA printed patterns showed dimensional stability of patterns and the cast parts. However, both studies only compare the ability of SLA applied RIC with conventional methods of production, but do not study the effect of SLA on dimensional accuracy of RIC products. Dimensional accuracy of the RIC-produced parts were studied in [7,30,31]. In these studies, FDM printing technology was applied as the pattern production method. Application of SLA printing technology in RIC is not properly studied.
Table 1 presents the summary of literature review findings.
All these studies focused on the effect of printing parameters on the printed parts only, but few works analyze the relationship between the SLA printing parameters and dimensional accuracy of cast parts. In addition, application of SLA printing technology in RIC is mostly studied for the cost effectiveness of the process [2,32]. There is a lack of studies focusing on the dimensional and geometric accuracy of the RIC parts produced with the use of SLA printed patterns using benchmark models. In this research, aluminum cast parts and SLA printed wax patterns are investigated for dimensional accuracy and geometric characteristics by varying the SLA printing parameters. In addition, the critical parameters and optimum values for printing parameters were identified to achieve better dimensional and geometric accuracies.

2. Materials and Methods
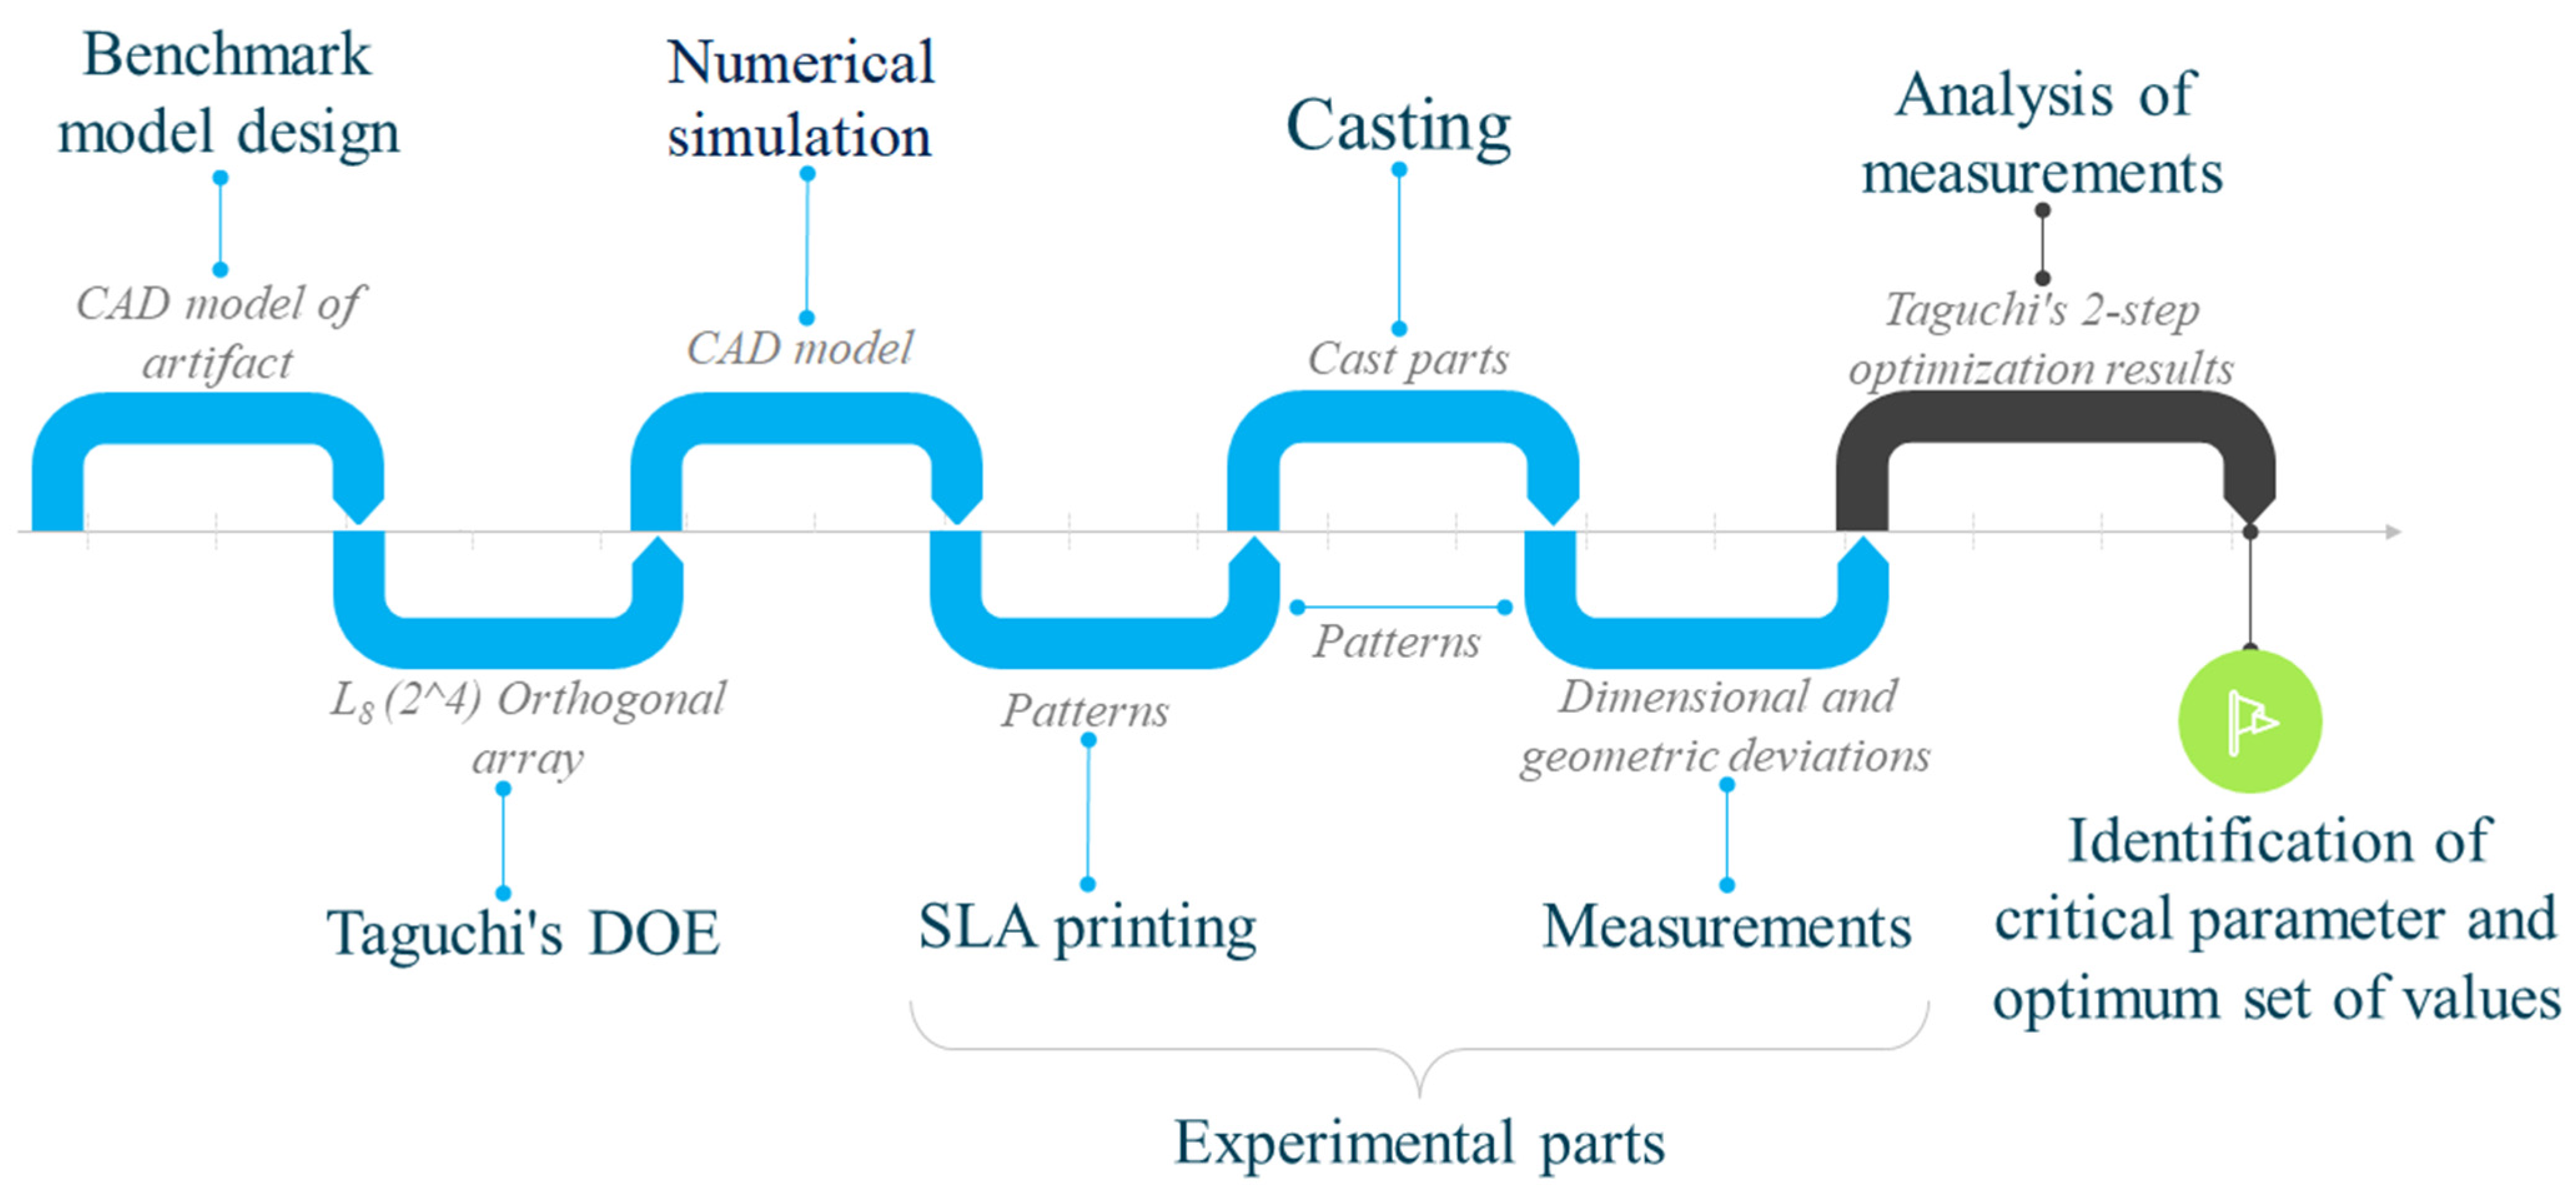
This section describes the methodology used, the design of the benchmark, DOE, numerical simulations, and data analysis that were done in this study.

2.1. Methodology

This study consists of eight stages as shown in Figure 1. Firstly, the benchmark model of pattern was designed. Then, Taguchi’s Design of Experiments (DOE) was applied to set the parameter values for experimental run. Following this DOE, numerical simulation of solidification was performed in SolidCast to verify the casting assembly design. Patterns were printed and measured. Then, patterns were cast and cast parts were measured. In the last steps, measurement results were analyzed to identify the critical parameter and optimum set of values.

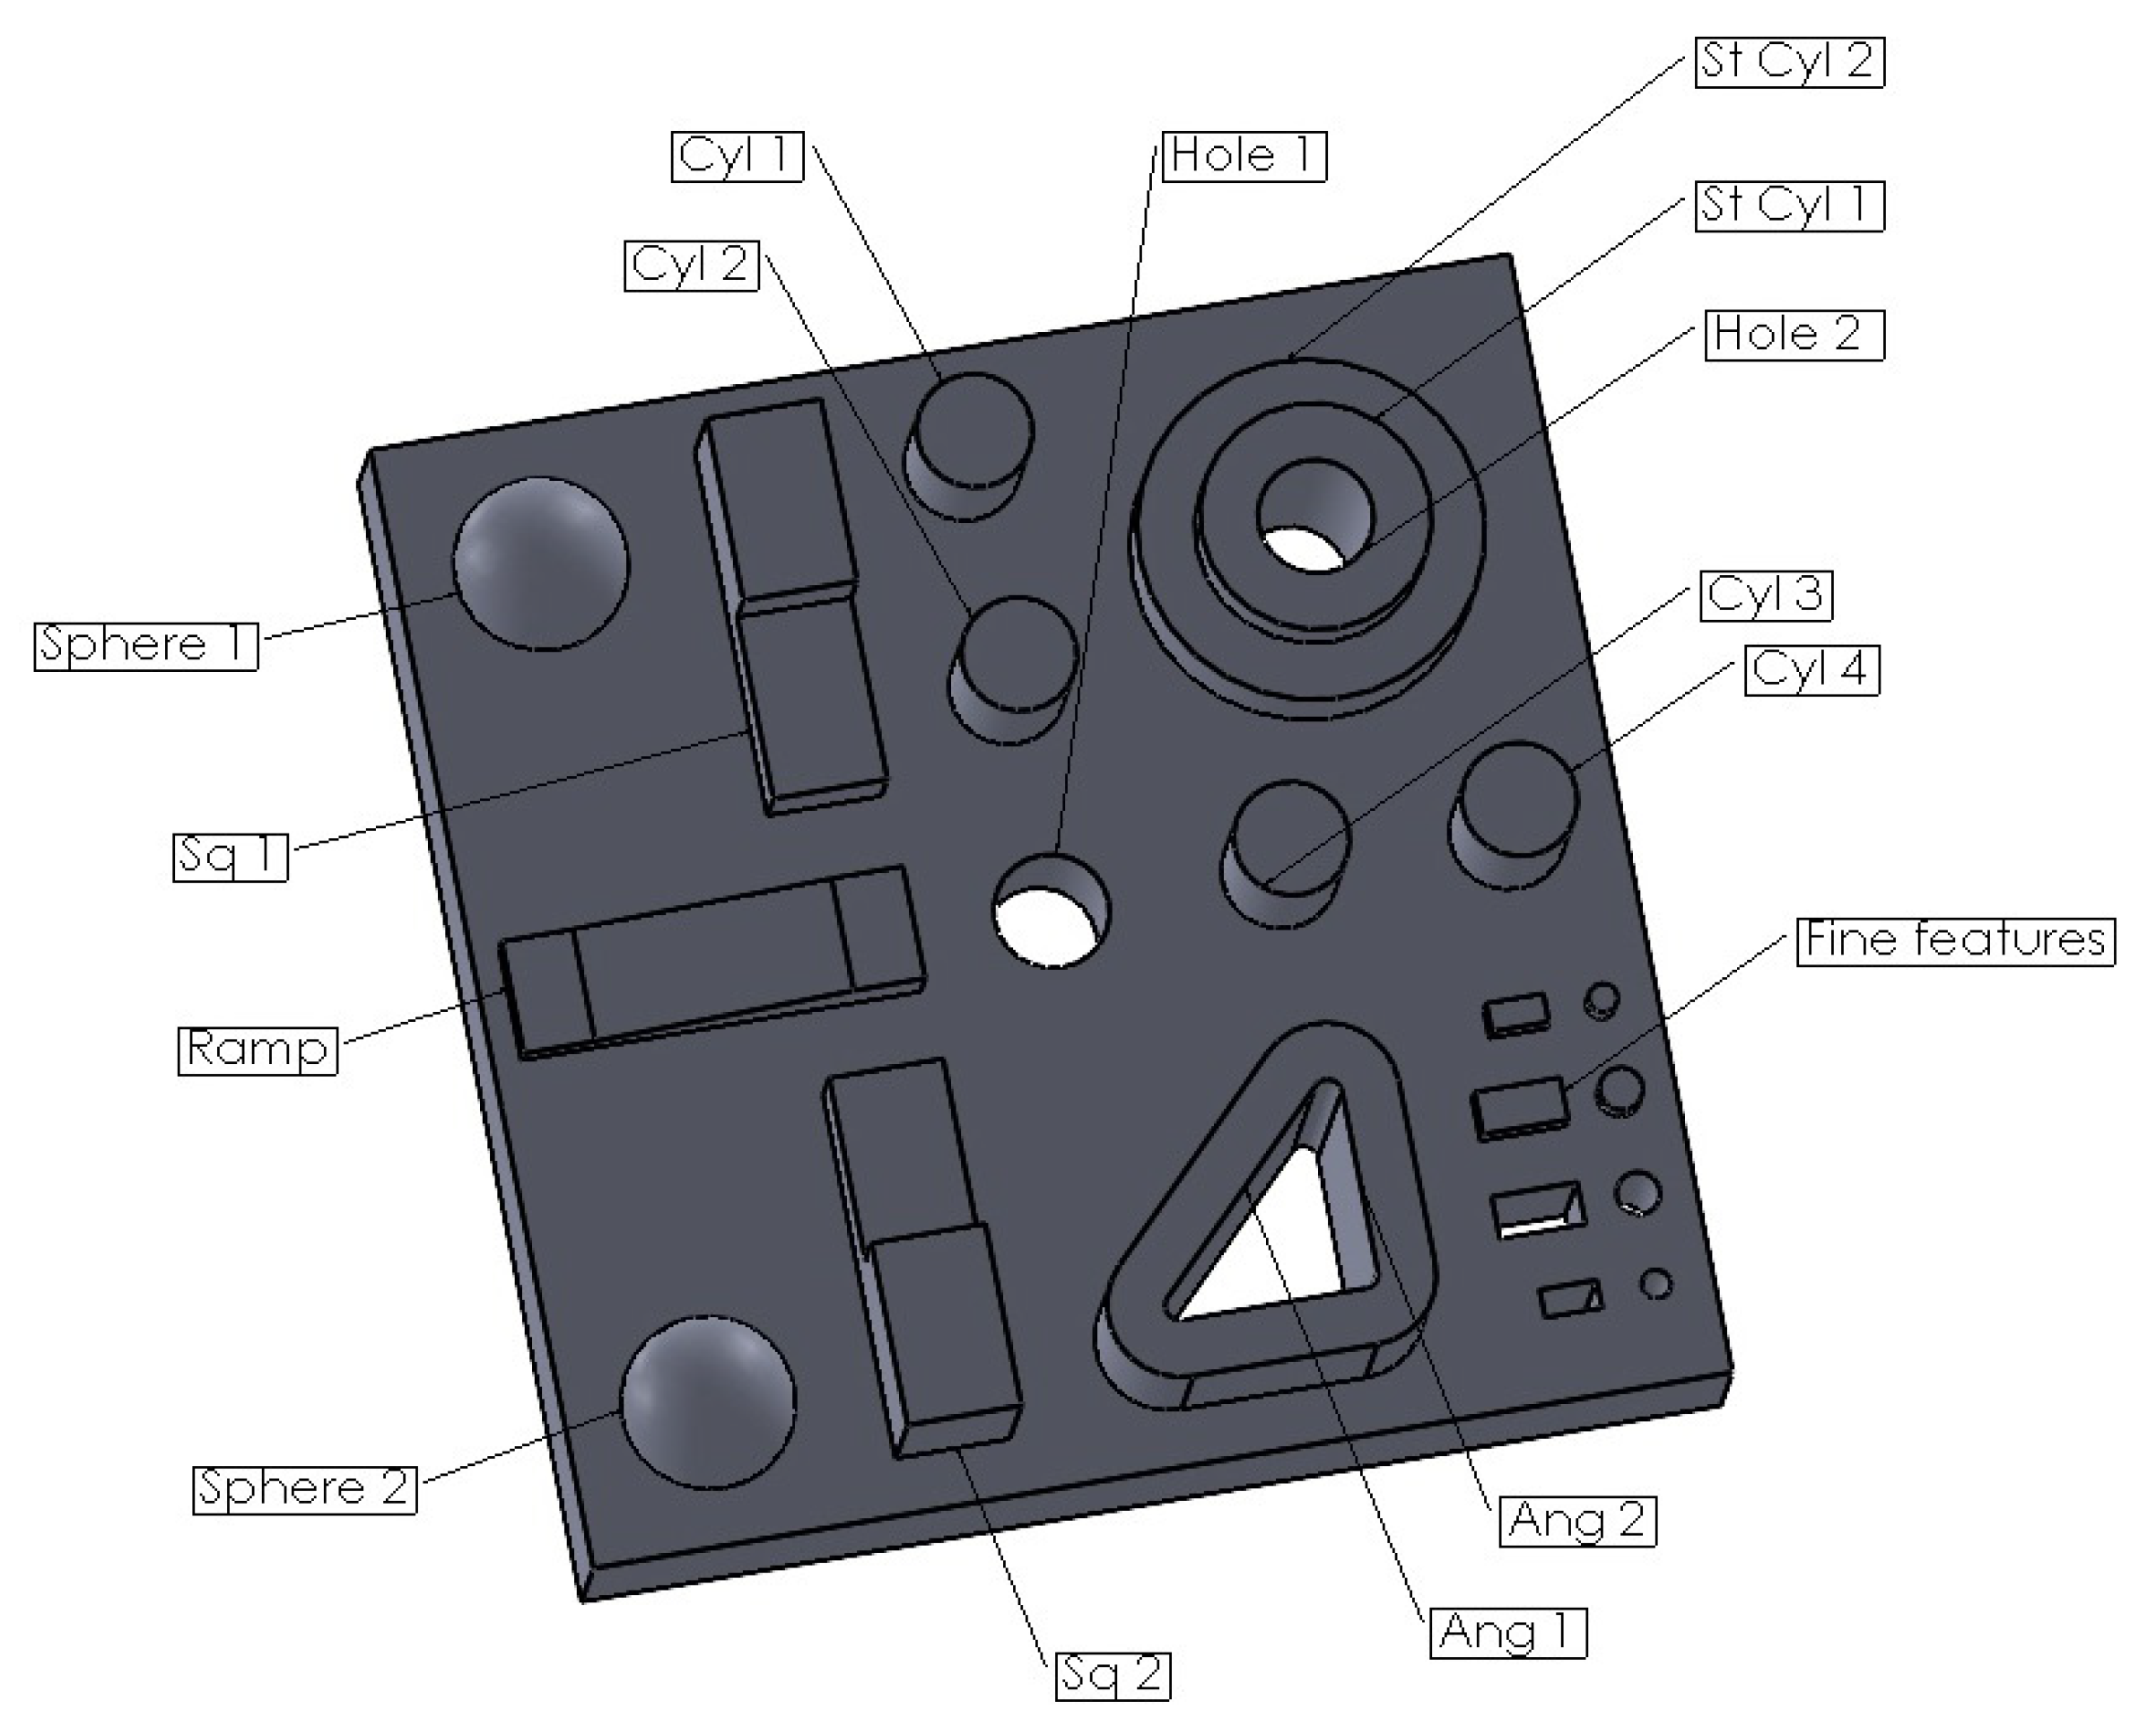
2.1.1. Benchmark Model Design

Artifacts are benchmark models to test the limitations or capabilities of certain technology. Several benchmark models [27,33,34,35,36,37,38] were developed in the past to study different AM technologies for the ability to print various features. The benchmark model in [38] has the necessary features to study flatness, parallelism, perpendicularity, concentricity of cylindrical surfaces, angularity, thickness, and roundness. However, it has excess repetition of features and the cylindrical bosses located along the diagonal lines. The new benchmark model was developed for this study based on the previous literature eliminating the unnecessary features like overhangs, cones, features on the base sides, too much repetition of the features, and positioning the cylinder bosses parallel to the base sides. The latter allows to measure positioning along the X and Y axes of the printer, since the parts will be positioned with sides parallel to the sides of the printing bed. The new model of artifact for pattern was created using SolidWorks software. Pattern designs were tested for printability and castability before performing an experimental run. The new benchmark model contains extruded boss and hole features of rectangular and cylindrical shapes, small features, spherical and ramped features, as well as diagonal line feature for angularity check; see Figure 2. A drawing of the benchmark model is given in Appendix A, Figure A1.

2.1.2. Taguchi’s Design of Experiments

SLA printing parameters studied in this paper are layer thickness, build orientation, support touchpoint size and support structure density. Table 2 shows the four parameters used by the printer and their assigned control levels. There are only two levels that were chosen for each parameter. The reason for this is that the Form 3 printer provides only two variations of layer thickness for Castable Wax material. To match the number of other parameter levels, only two levels were chosen for the other parameters. In addition, considering the large number of experiments associated with the printing and casting, our study aims to focus on investigating the important findings while keeping the number of experiments not so time consuming.
Build angle and layer thickness were one of the mostly studied and influential parameters in the reviewed literature [10,16,17,18,19,20,21,22,24,25,26]. Layer thickness values were chosen from the available values for the Castable wax material. Build angle values were chosen according to the literature results, stating that 0 deg and 45 deg orientations show better results than 90 deg and above [10,16,17,18,19,20,21]. Support density and support touchpoint size were chosen as they were the available and adjustable parameters other than the first two provided by the PreForm software for Form 3/3+ printers. Support density and touchpoint size values below 0.75 and 0.5, respectively, caused support breakage during trial-and-error printing process. Considering that small changes in these values caused a problem, the critical values (0.75 and 0.5, correspondingly) and values for one step above them were chosen as parameter levels for the study.
To study the effect of these available parameters on the dimensional accuracy of the artifact model, the Taguchi method of parametric design of experiment (DOE) was used. Considering the amount of experimental work and several parameters to study, the Taguchi method suits the investigation purpose better than other statistical approaches of parametric study analysis, as it enables to reduce the number of experimental runs while identifying the sensitivity and significance of the parameter [39].
Taguchi’s experimental design was developed using MiniTab 19 software. For the given parameters (factors) and levels L8 (2^4), Orthogonal Array was created with 8 rows, as shown in Table 3. Each row has a setting for a distinct experimental run for SLA printing. Printing of 1–4 runs with 25 μm and 5–8 runs with 50 μm layer thickness values required around 24 h and 12 h, respectively. Each experimental run was repeated 3 times for consistent results.

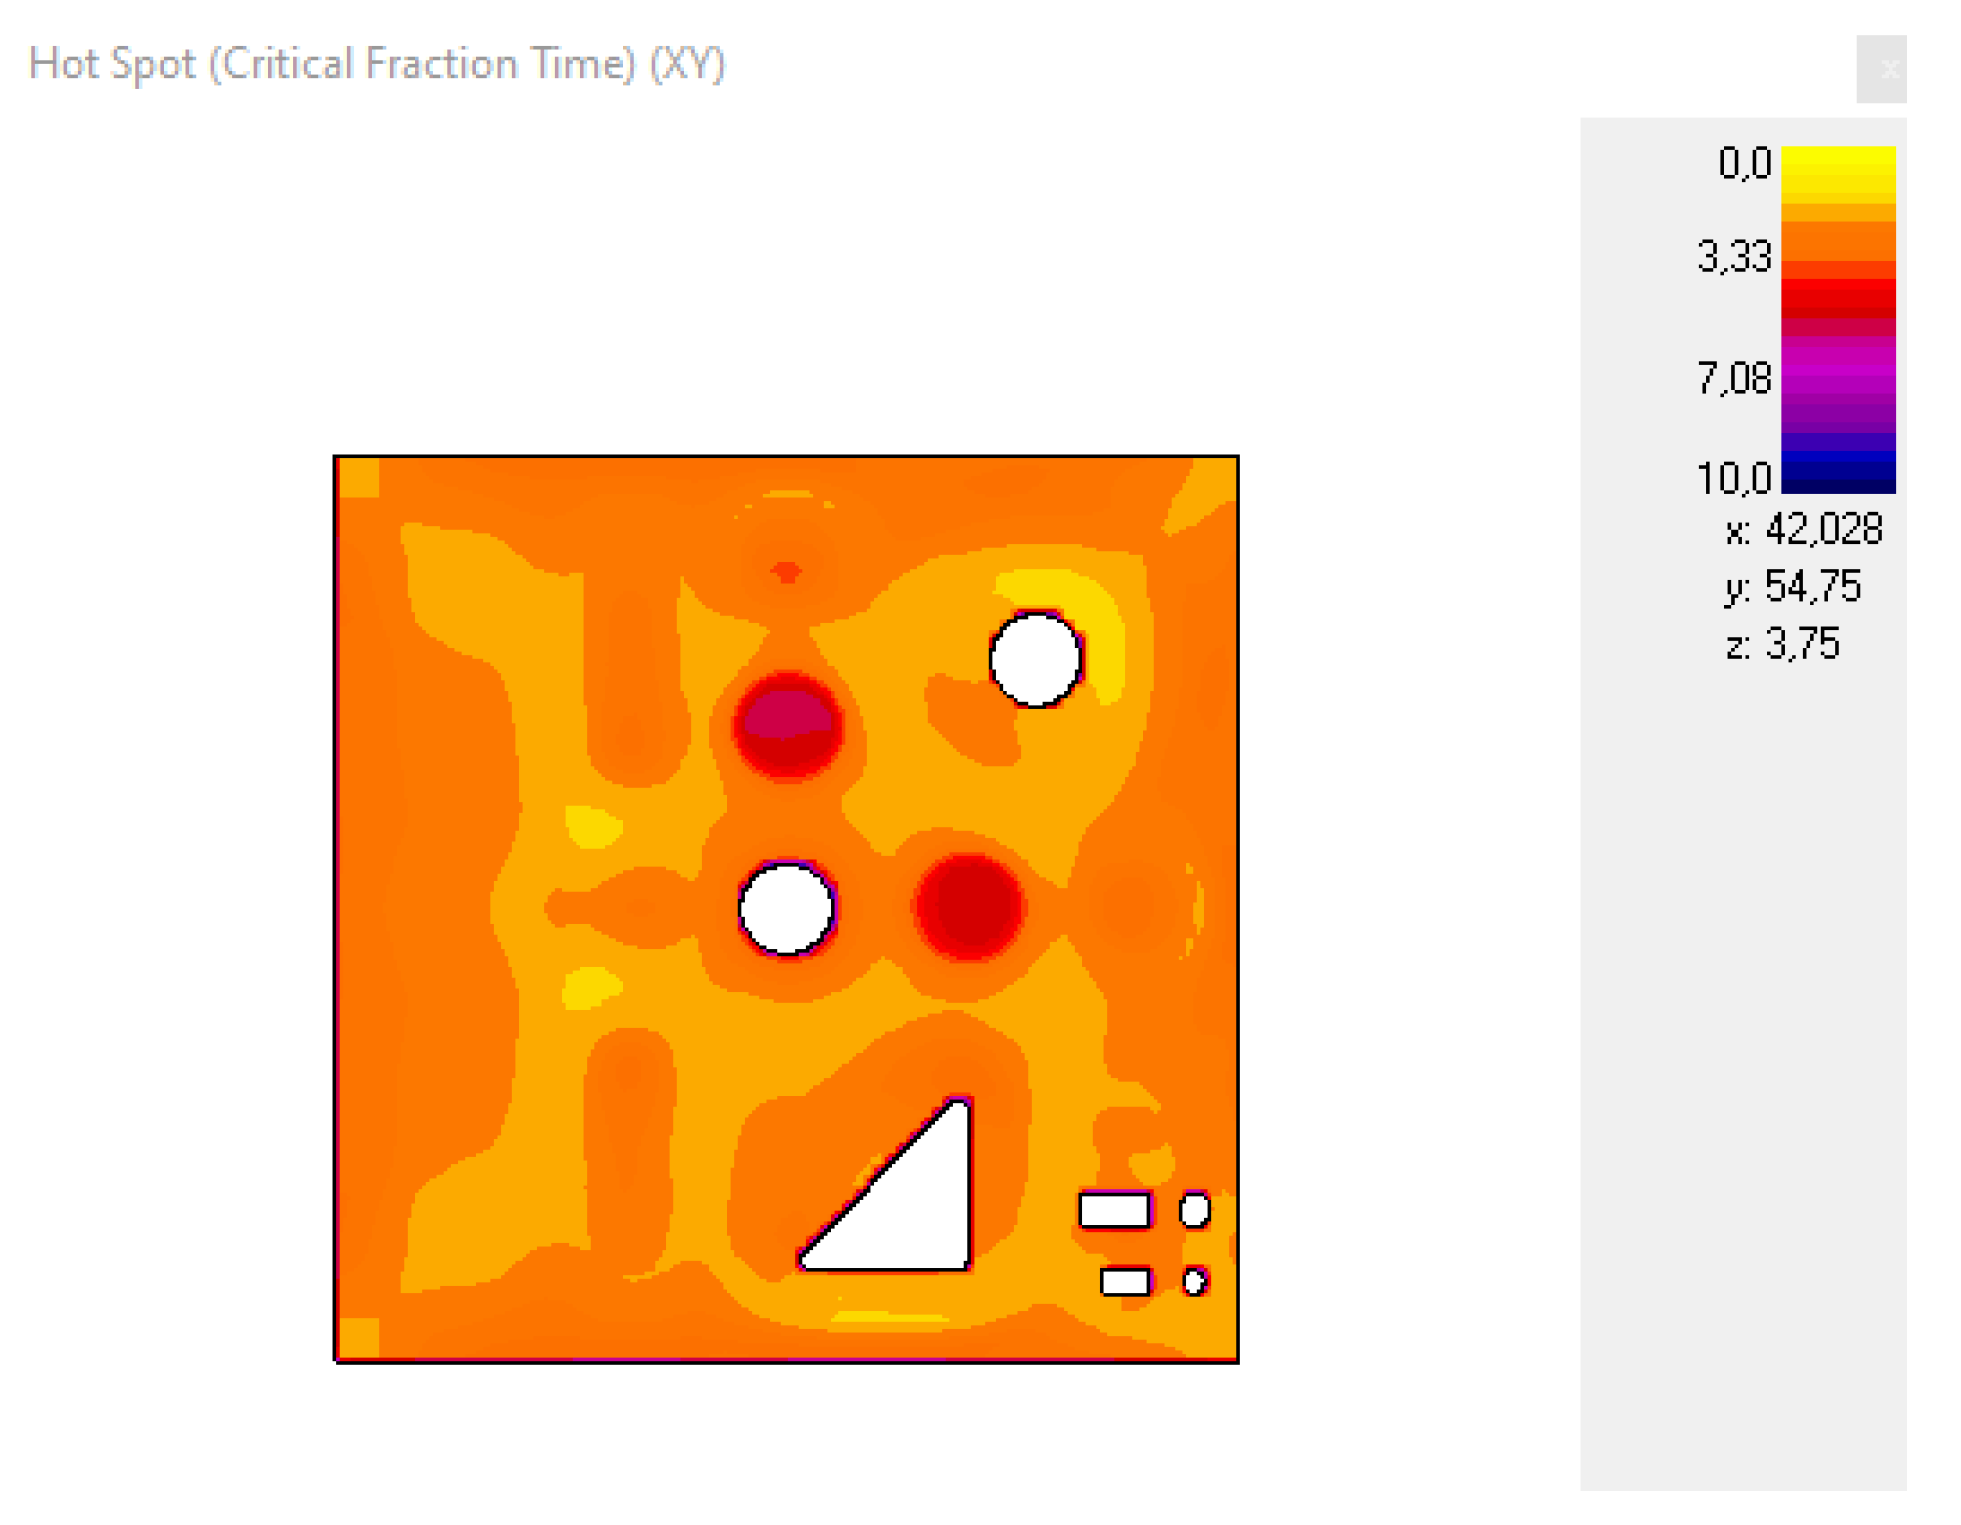
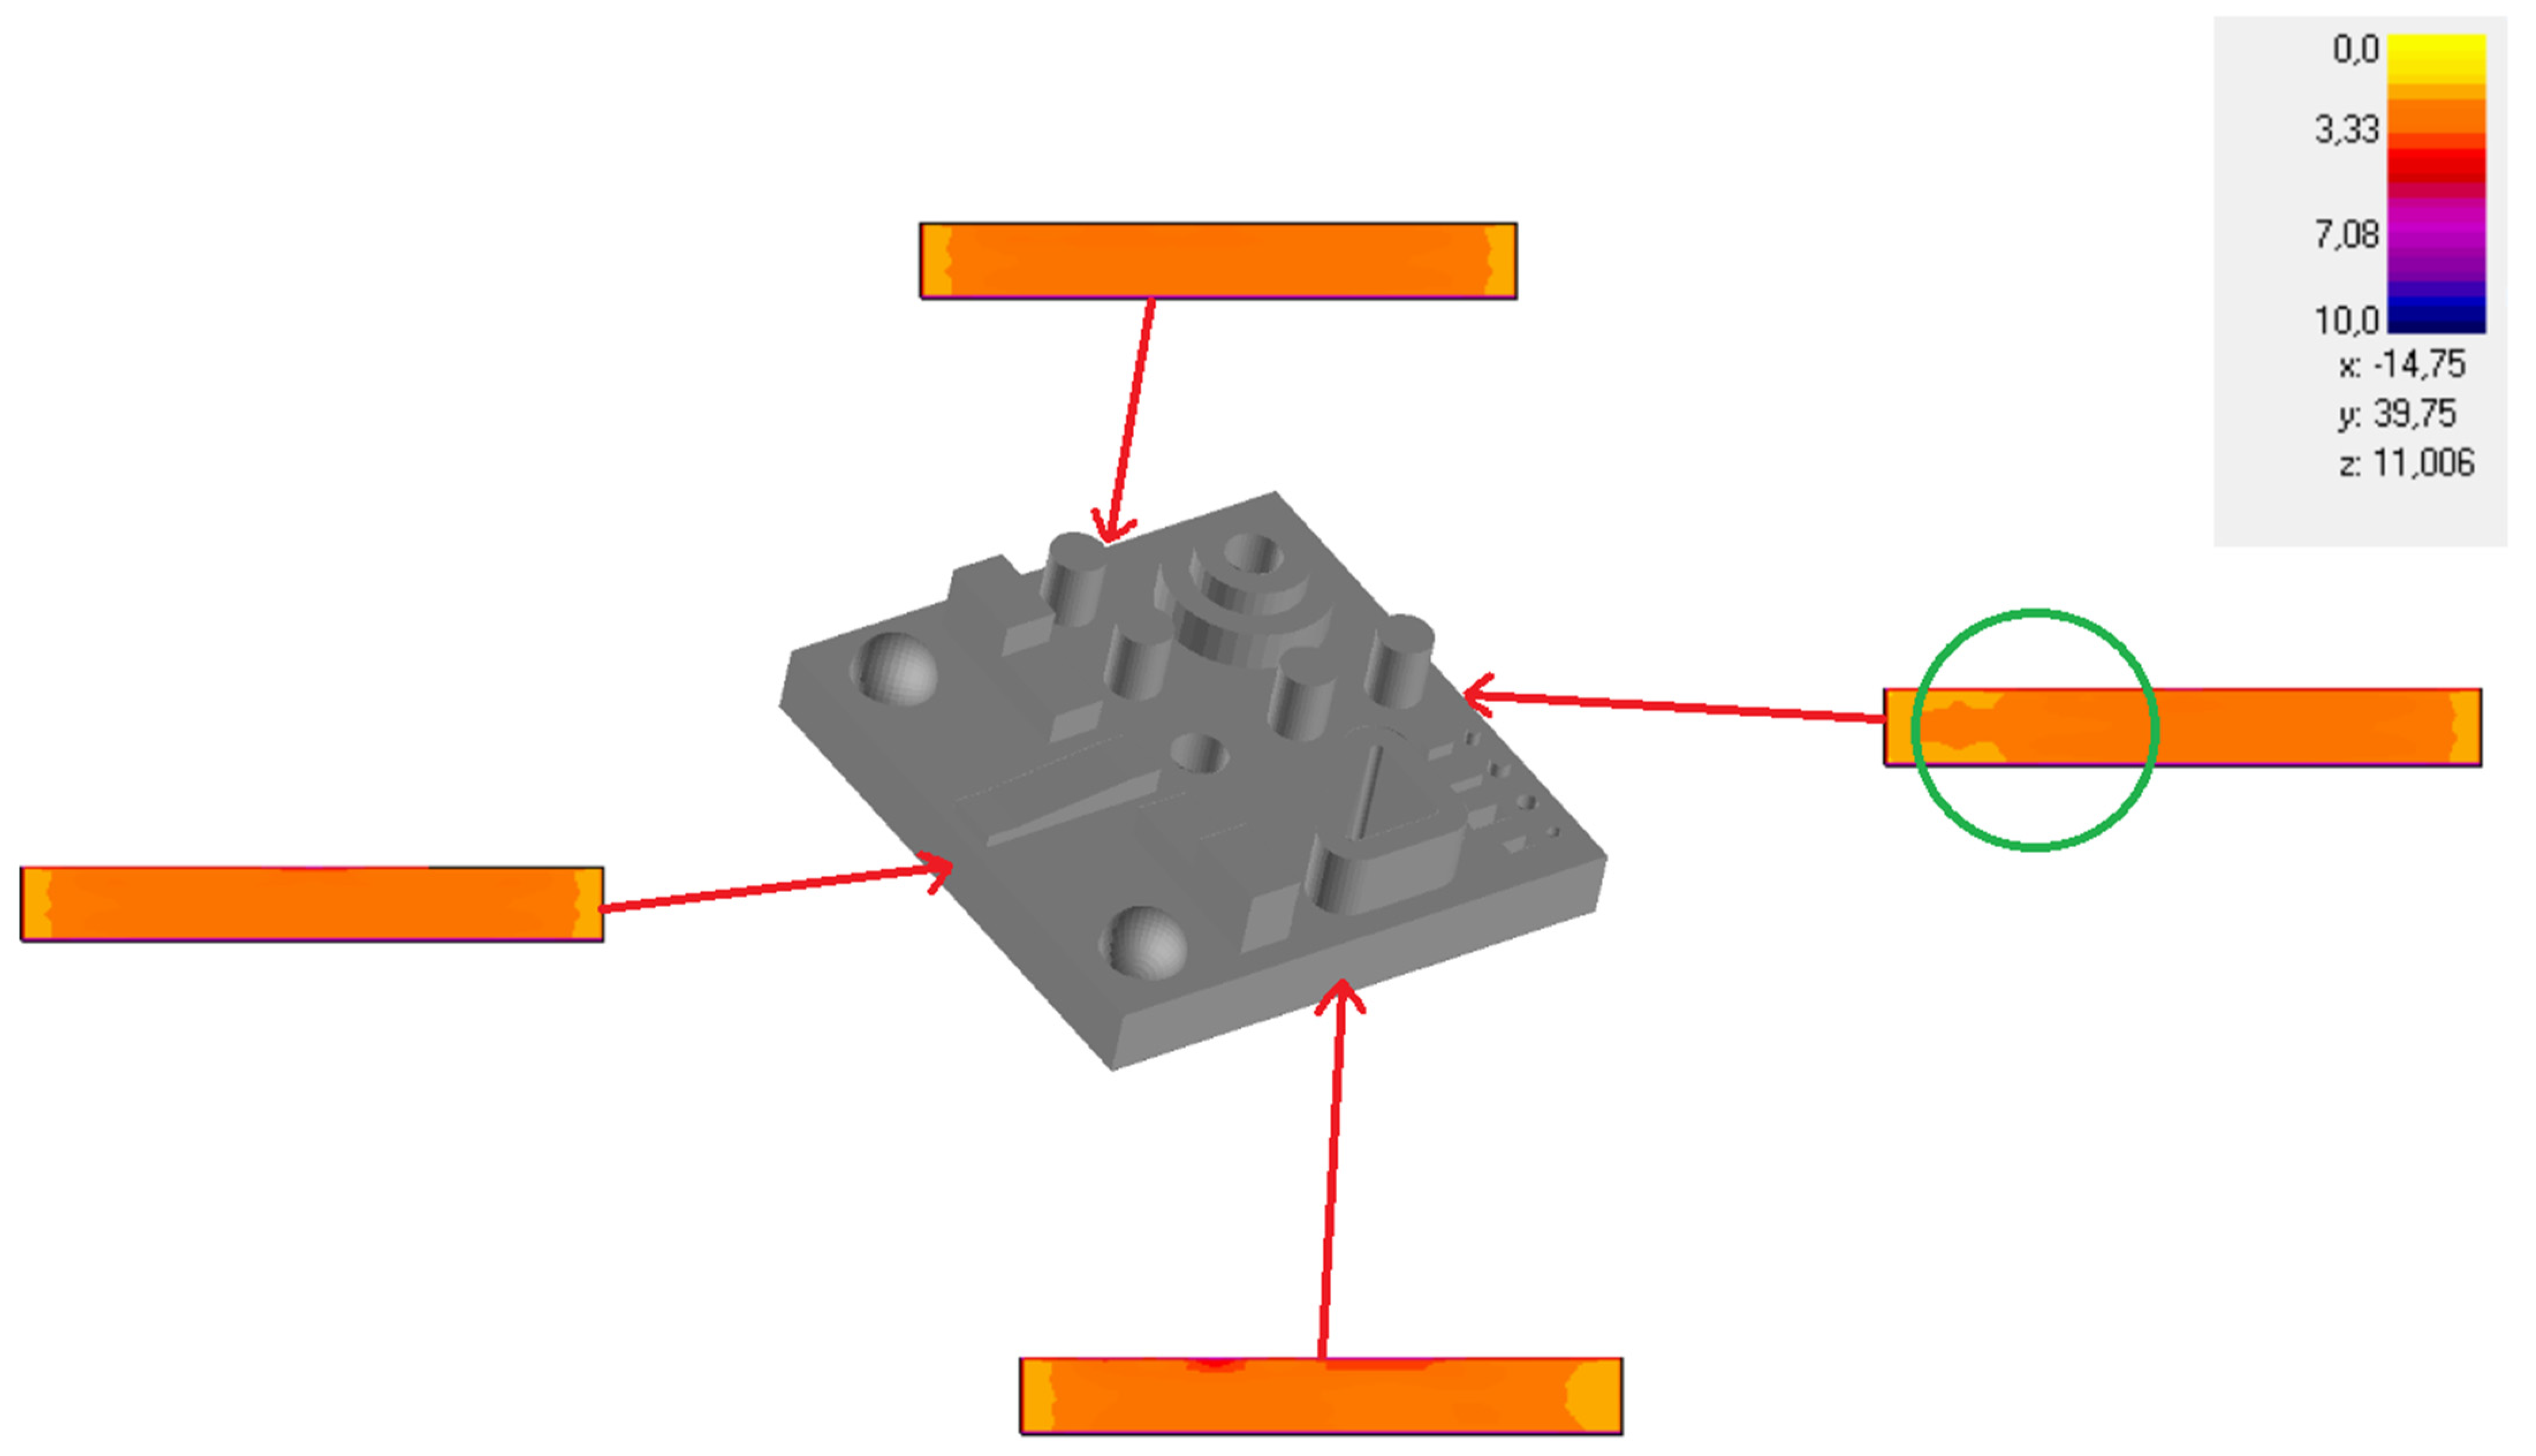
2.1.3. Numerical Simulation

Solidification simulation is an important step before proceeding to the casting process, as it can show possible casting defects. Hot spot is one of the problems that can lead to casting defects which can be identified using solidification simulation. Identification of the hot spot locations can help to improve the gating system design [40,41]. Adding the gating system feeder to the closer to hot spot locations guarantees directional solidification which can reduce the solidification shrinkage [41]. Thus, simulation results can help to reduce the possible dimensional inaccuracies due to failure in directional solidification. SolidCast 8.1.1 casting simulation software was applied to study the solidification process. Materials and boundary conditions are given in the Table 4.
Boundary conditions: The external heat transfer coefficient was 45.44 W/m2/K and interface heat transfer coefficient was 1000 W/m2 K [42]. Shell thickness is was mm. Air gap during solidification was not considered.
SolidCast uses the Finite Difference Method to discretize the simulation domain and creates structured rectangular grid (mesh) described by node size. To ensure that meshing does not affect the simulation results, sensitivity analysis of Critical Fraction Solid (CFS) time and Hot Spot (HS) values to the mesh size was performed in mesh verification, as shown in Table 5. Values of these two characteristics are taken from the same spot on the Cut Plane plots in the simulation results of each mesh size. Initial mesh size was 1 mm, which is the same as the finest feature size on the benchmark model, which then was decreased to 0.5 mm and 0.25 mm to increase the accuracy of the simulation results. Percentage difference of the CFS and HS values were calculated to find how the mesh size affects the results. Percentage difference less than 5% means that further refinement of the mesh will not affect the results significantly. Thus, 0.25 mm mesh size with 3.8% is chosen as the final node size for the simulation. It took 14,480 timesteps and 1,568,000 nodes to simulate the solidification of the pattern.
SolidCast performs transient thermal analysis to simulate the casting defects that can occur during solidification. It is assumed that taller and more massive features are more likely to have hot spots in the base and feature connected area.
The important casting defect investigated is the hot spot (HS), which depicts the regions on the casting that remains liquid longer than other regions. In the SolidCast simulations, HS is calculated by comparing either critical fraction solid time (CFS) or solidification time. The hot spot depicted in Figure 3 is based on the CFS time. CFS is the time when the metal reaches the CFS temperature, after which the liquid metal cannot move. HS has values from 0 to 10 shown in the legend in Figure 3 and Figure 4, where 0 means the most isolated hot liquid metal which solidifies last.
Hot spot is basically located within the part in the thicker feature foundations and no hot spot detected on the side faces, as shown in Figure 4. As there is no significant hot spot location on the outer sides of the pattern, the feeder is added on the side flat surface closer to the area with less HS value as shown with green circle in Figure 4.

2.1.4. Experimental part I. SLA Printing

Form 3 Low Force Stereolithography (LFS) 3D Printer from Formlabs was used for the Experimental part I (pattern printing) with PreForm 3.22.1 Software, and Castable wax V1 FLCWPU01 as a printing material. Specifications of the printer and the material is given in Table 6.
Castable Wax is designed to reduce the thermal expansion of the printed component during its burnout process in RIC. Zero ash content and 20% wax content photopolymer led to the clean burnout. Photopolymers used in the SLA printing undergo shrinkage during post curing [43,44]. In this study, only support removal and pattern washing in IPA to remove excess liquid resin were performed after printing as a post-process activity and no post-curing was performed with the printed patterns, so the only shrinkage that can occur is caused by cooling time after the end of printing [45]. To achieve consistency of the cooling shrinkage effect on the measurements, all printed patterns had the same 1-day cooling time between the end of printing and the measurements.

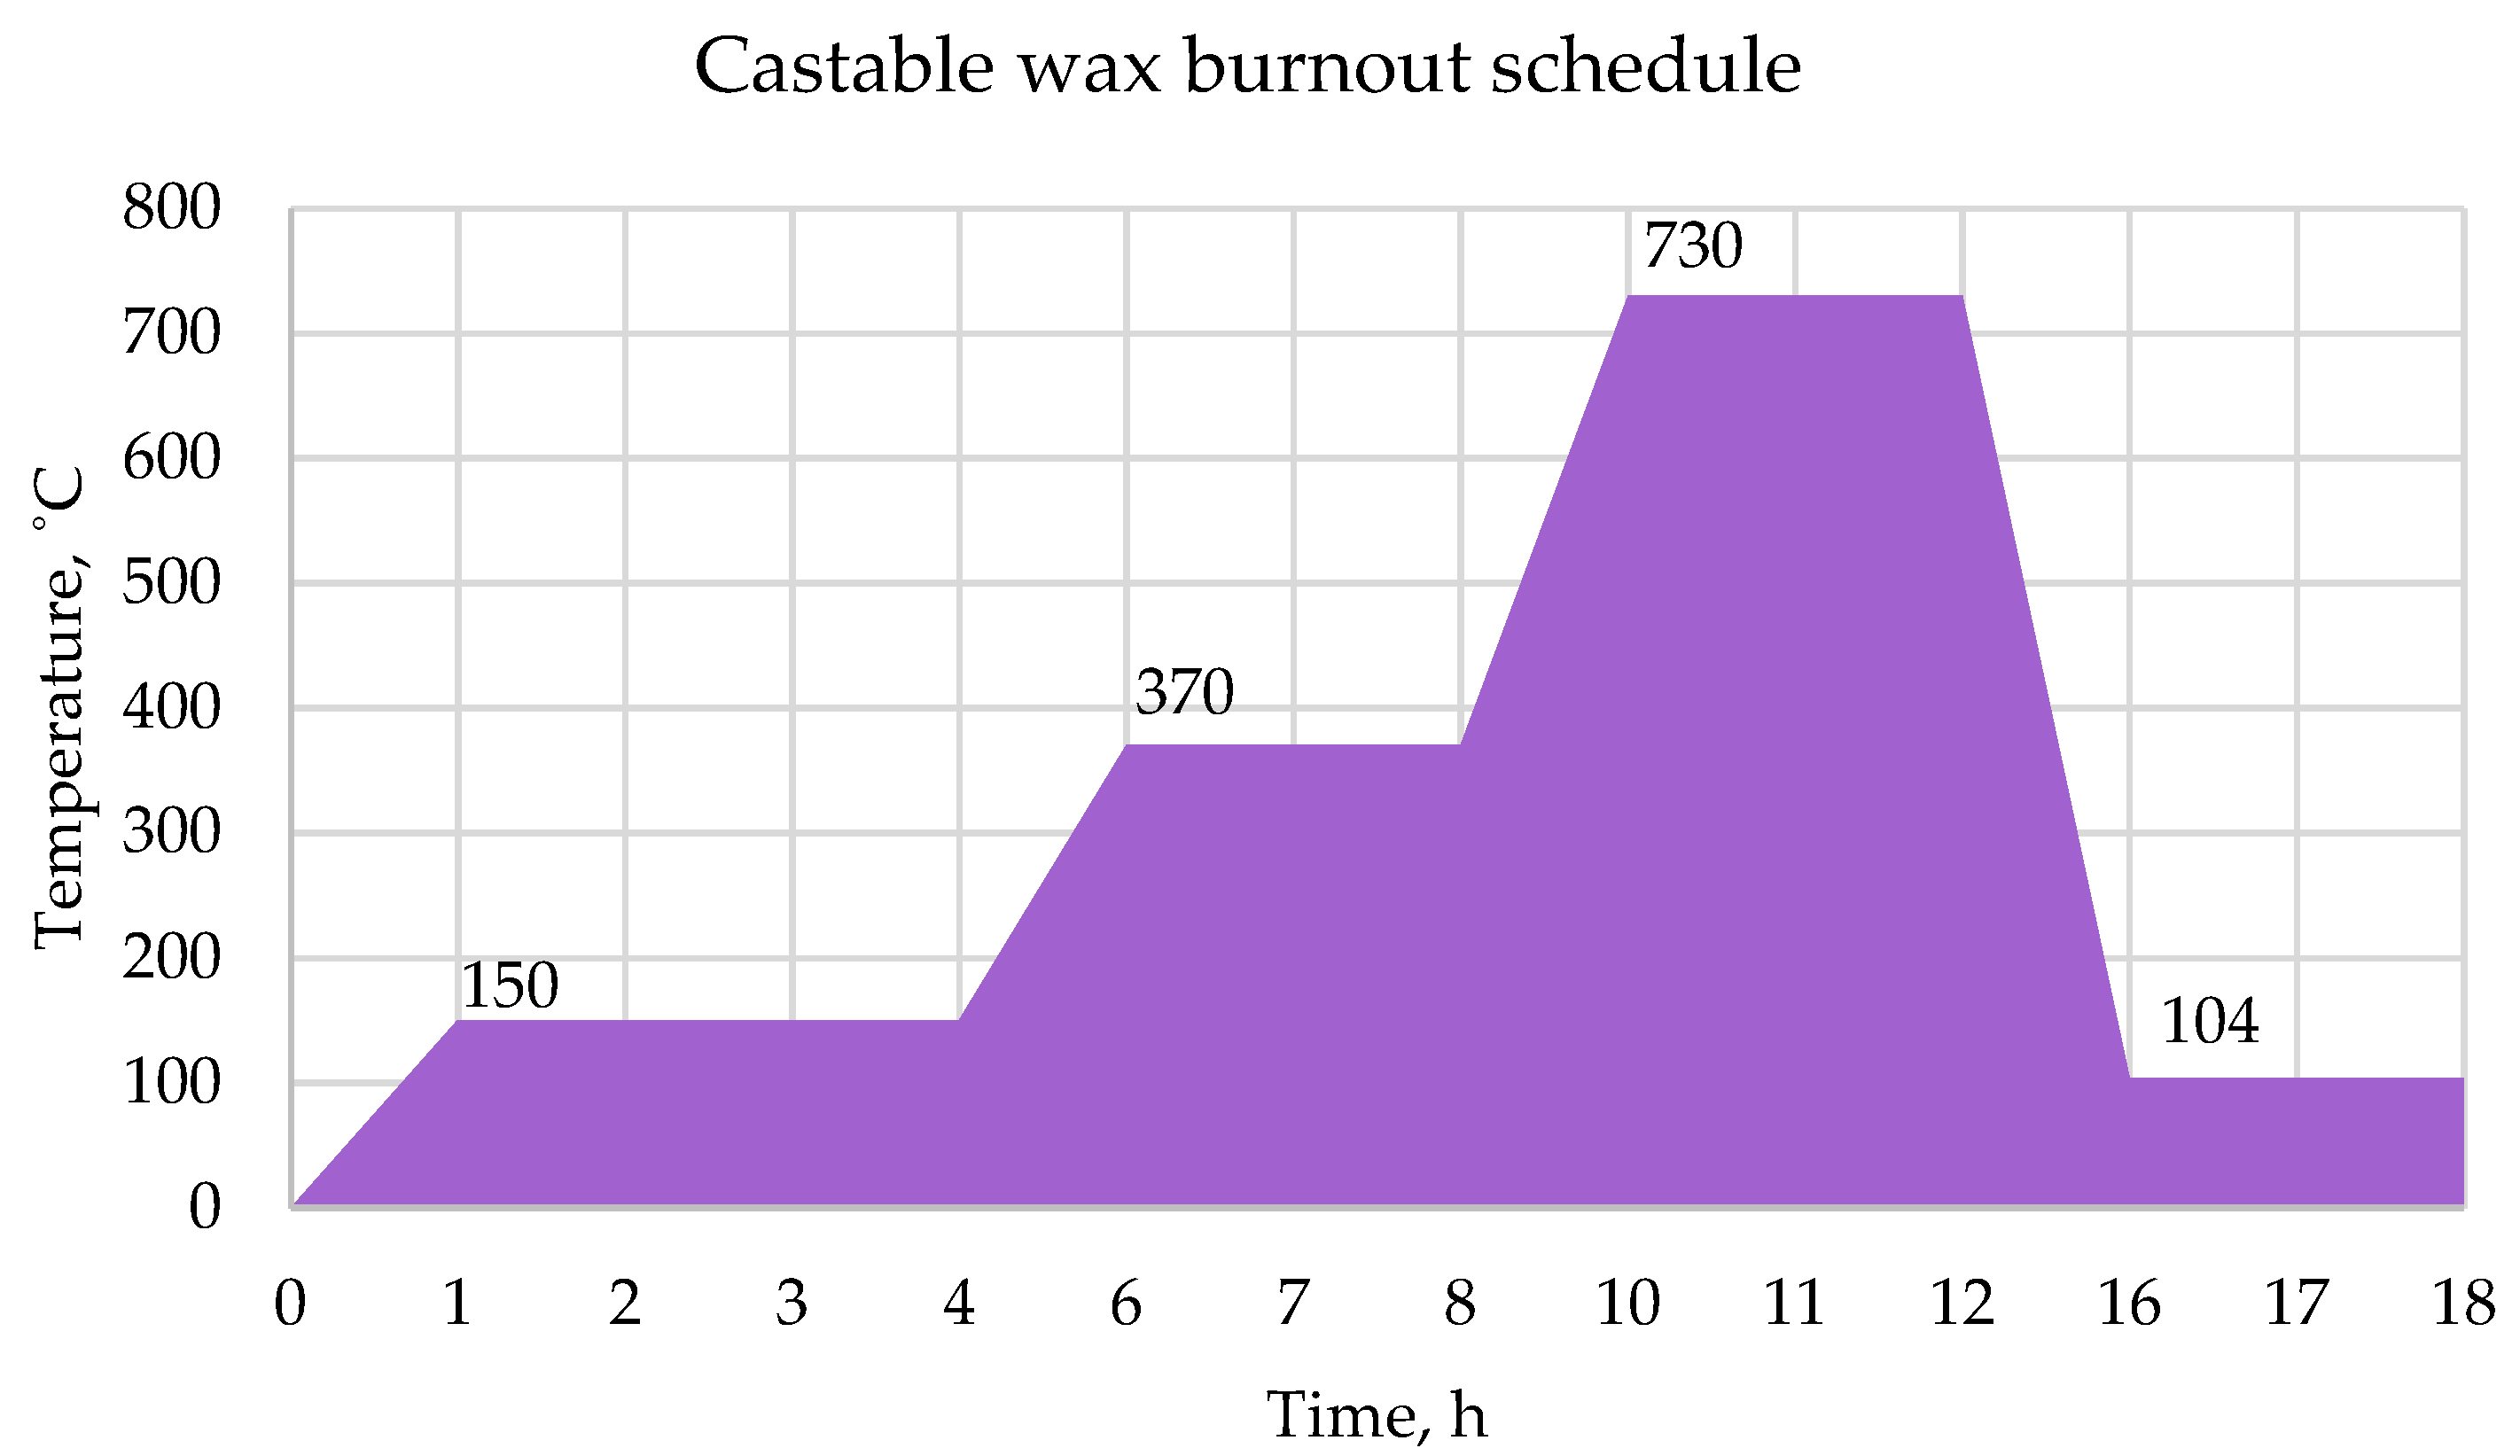
2.1.5. Experimental Part II. Casting

Experimental part II consists of conventional IC steps: the mold around the wax casting tree is built using plaster; the mold is then burned out in the kiln according to the castable wax burnout cycle as shown in Figure 5 [46,47]; and the metal is melted in the furnace and then poured into the mold cavity. Casting parameters are given in Table 7.
“Nabertherm more than heat 30–30,000 °C K1/13” metal melting furnace is used in the experiments, which is dedicated for melting non-ferrous metals with the limit temperature at 1330 °C. Commonly used non-ferrous metals used in the investment casting are aluminum, magnesium, and zinc with melting temperatures of 660 °C, 651 °C, and 419 °C, respectively [48]. Shrinkage is the casting defect that occurs during and after molten metal solidification. The shrinkage percentage for aluminum is 6.5%, for magnesium is 4%, and for zinc is 3% [49]. Although the melting temperature and shrinkage percentage for Al is greater than of Mg and Zn, for this experimental study, pure Al was selected as the casting metal due to its availability and low price. The chemical composition of Al was 99.5% Al and 0.5% Cu.
For consistency in the casting process, the same constant casting parameters were held for each experiment as shown in Table 6. As the temperature of the kiln reached 104 °C, the flask with the mold was held there for another hour while the metal was melted in another furnace. The thickness of the shell was the same for each part due to the constant size of the flask. No other additions were added to support the shell. Ambient temperature was held constant at 26 °C as the experiments were held in a room with controllable HVAC system.

2.1.6. Measurements

Measurements were carried out using Zeiss Duramax Coordinate Measuring Machine (CMM) equipped with Calypso programming software. Patterns were fixed on the CMM bed to automate the measurement process, without repeated creation of measurement plans for each pattern and casting.
Figure 2 shows the features on the pattern and their labels. To measure the dimensional accuracy and geometric characteristics, these features were used as shown in Table 8. Ramp and fine features were observed visually to check the ability of the casting to cast these features.

2.1.7. Analysis of Measurements

The results of measurements were gathered in Excel and calculated deviations for dimensional accuracy and geometric characteristics of both patterns and cast parts were then used in Minitab 19 as a response factor for further Taguchi Design analysis.
Taguchi design was analyzed using a 2-step optimization process by using two response characteristics including Signal-to-Noise (S/N) ratio and means. In the first step, response tables for S/N ratio were used to find the most significant factors reducing the variability. In the S/N ratio analysis, the “Smaller is Better” metric was used to identify the factor resulting in the lowest dimensional deviations. In the second step response tables for Means were analyzed to find the factors with the significant effect on moving the mean to the target value.

2.1.8. Identification of Critical Parameters and Optimum Set of Values

In the response tables in Minitab 19, the averaged response characteristics for each factor level and delta statistics were calculated. Delta is the difference between the highest and the lowest response characteristic (S/N ratio and means) values for each factor level [50]. Response tables also consist of the delta value ranking, with the highest delta value assigned with ranking 1, and the lowest delta value assigned with the ranking number equal to the number of all factors involved in the analysis. These rankings for S/N ratio and means for patterns and cast parts were combined in separate tables in Excel to sum the rankings and identify the most influential parameter (factor) in achieving the good dimensional accuracy and geometric characteristics. Optimum parameter levels for good dimensional accuracy and geometric characteristics in both cast parts and printed patterns were then identified based on the lowest average S/N ratio values provided in the response tables.

3. Results and Discussion

The experimental part I and II, and measurement analysis results are presented here. The first section describes the printing and casting results, while second section provides the measurement results and analysis.

3.1. Experimental Results

This section has two subsections which provide the pictures of the printed patterns, as well as cast parts.

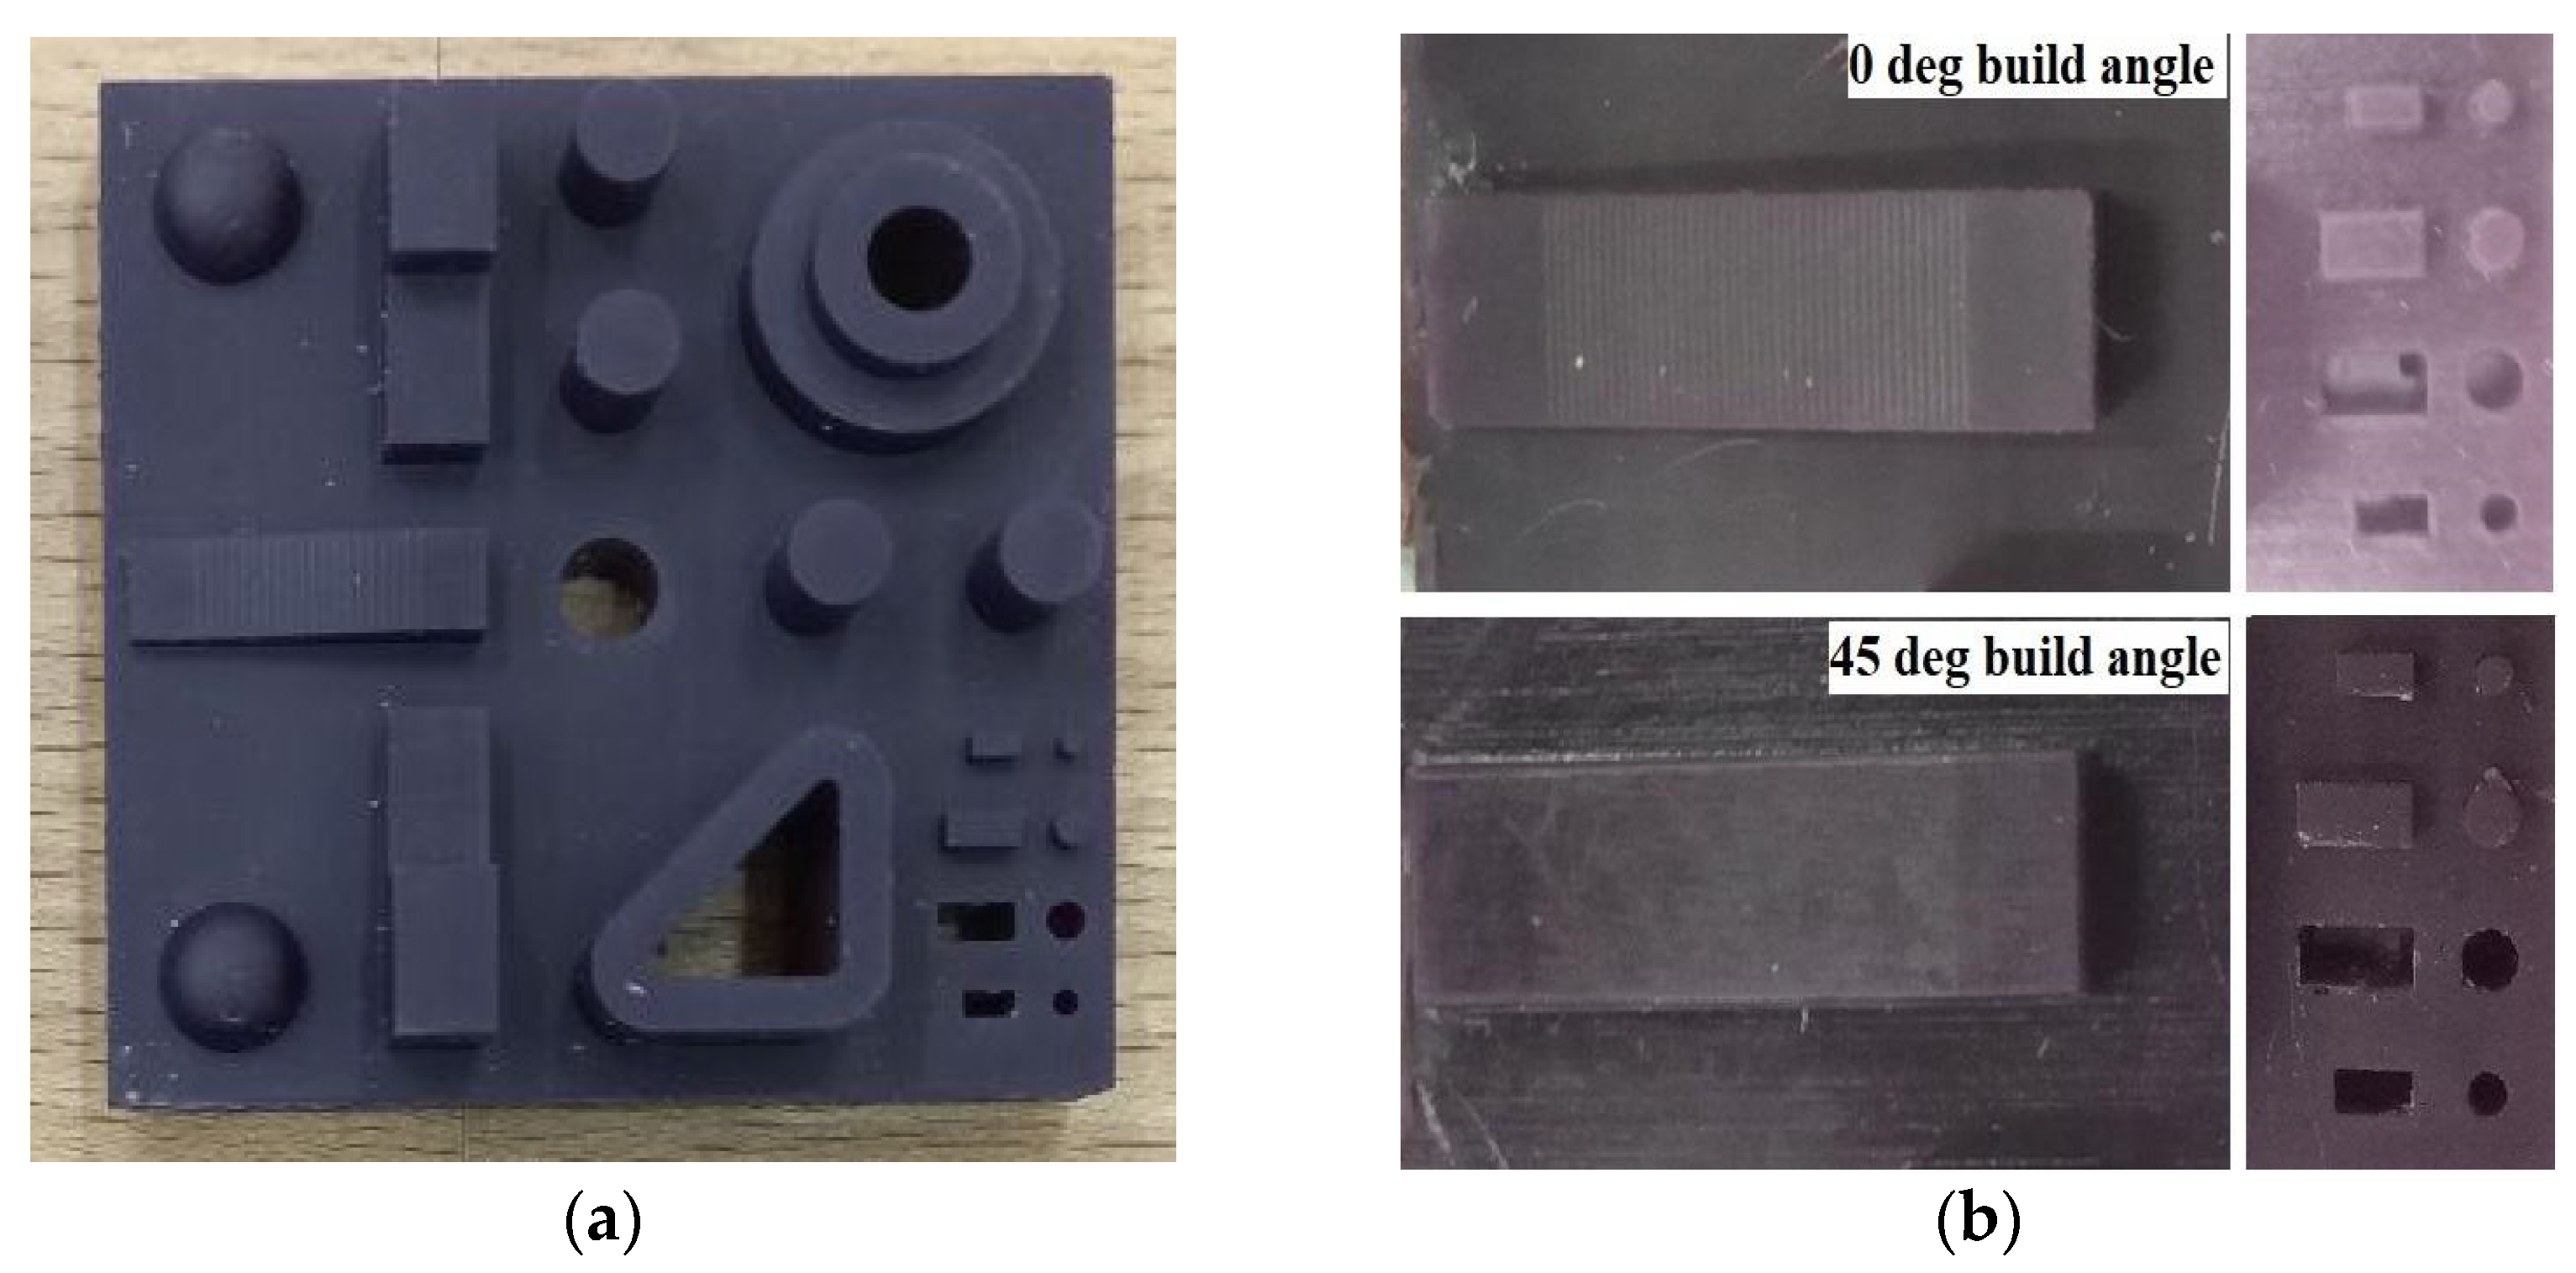
3.1.1. Printing Results

Twenty-four patterns were printed out according to the DOE parameter settings; one of them is shown in Figure 6a.
Ramp and fine features are shown in Figure 6b. All patterns printed at runs #1–2 and #5–6 with the 0 degree build angle had the staircase effect on the ramp surface.

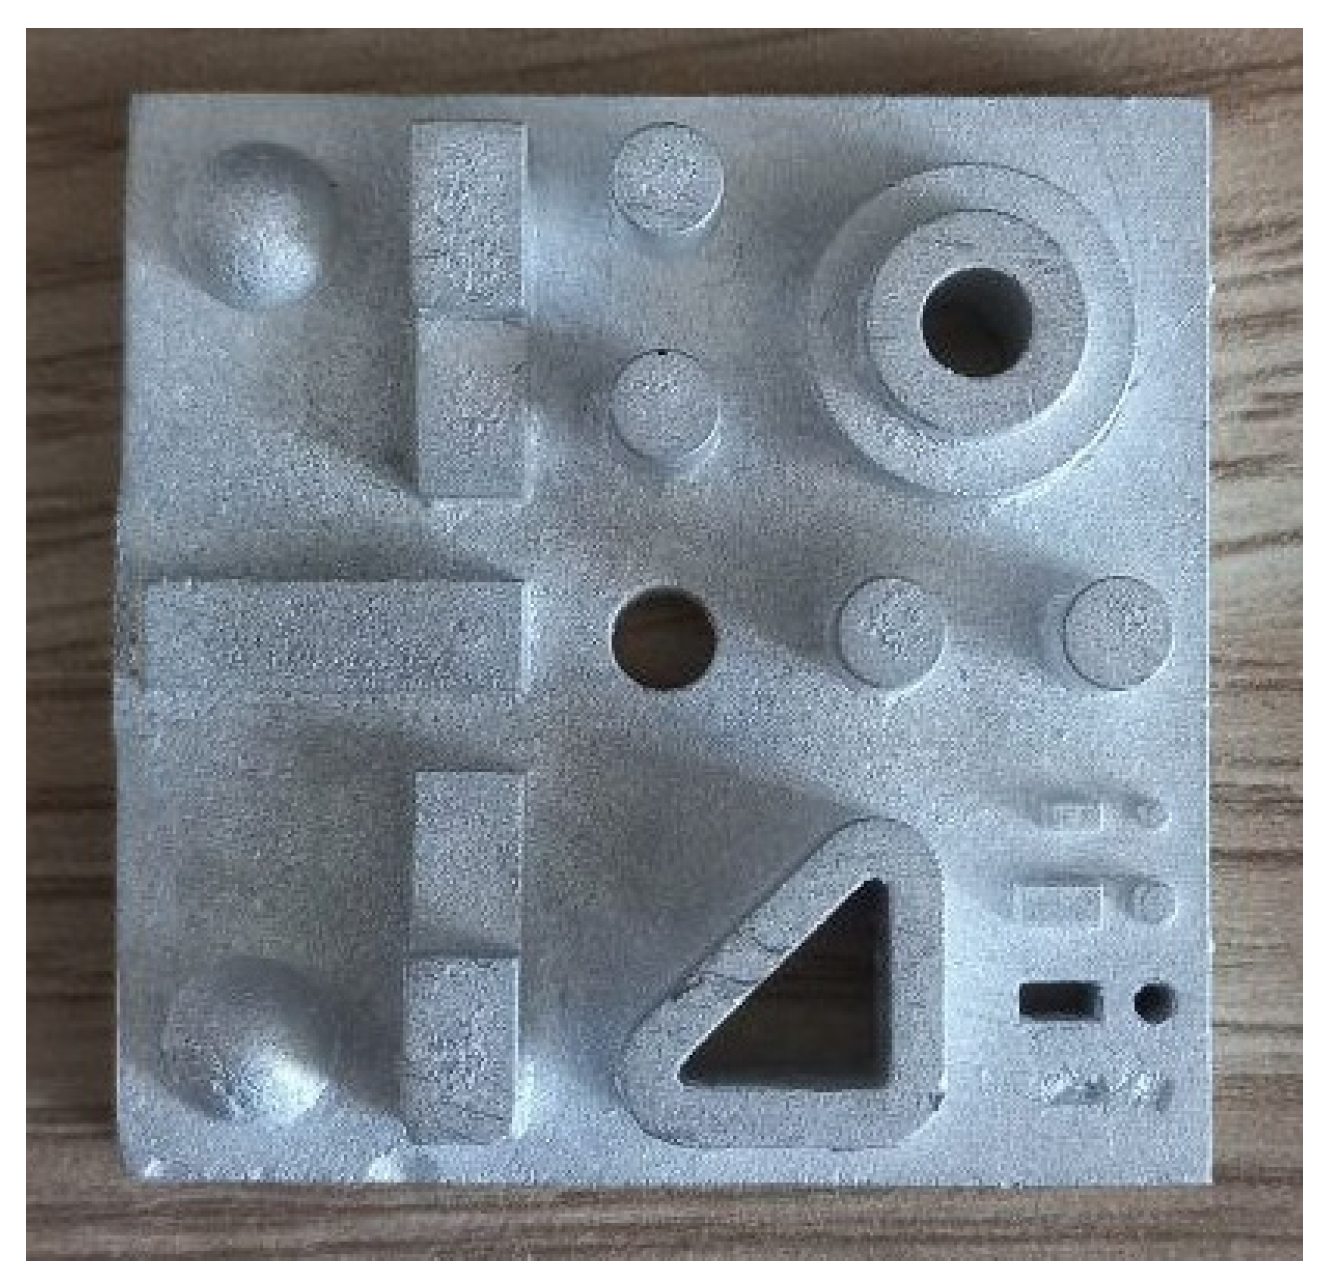
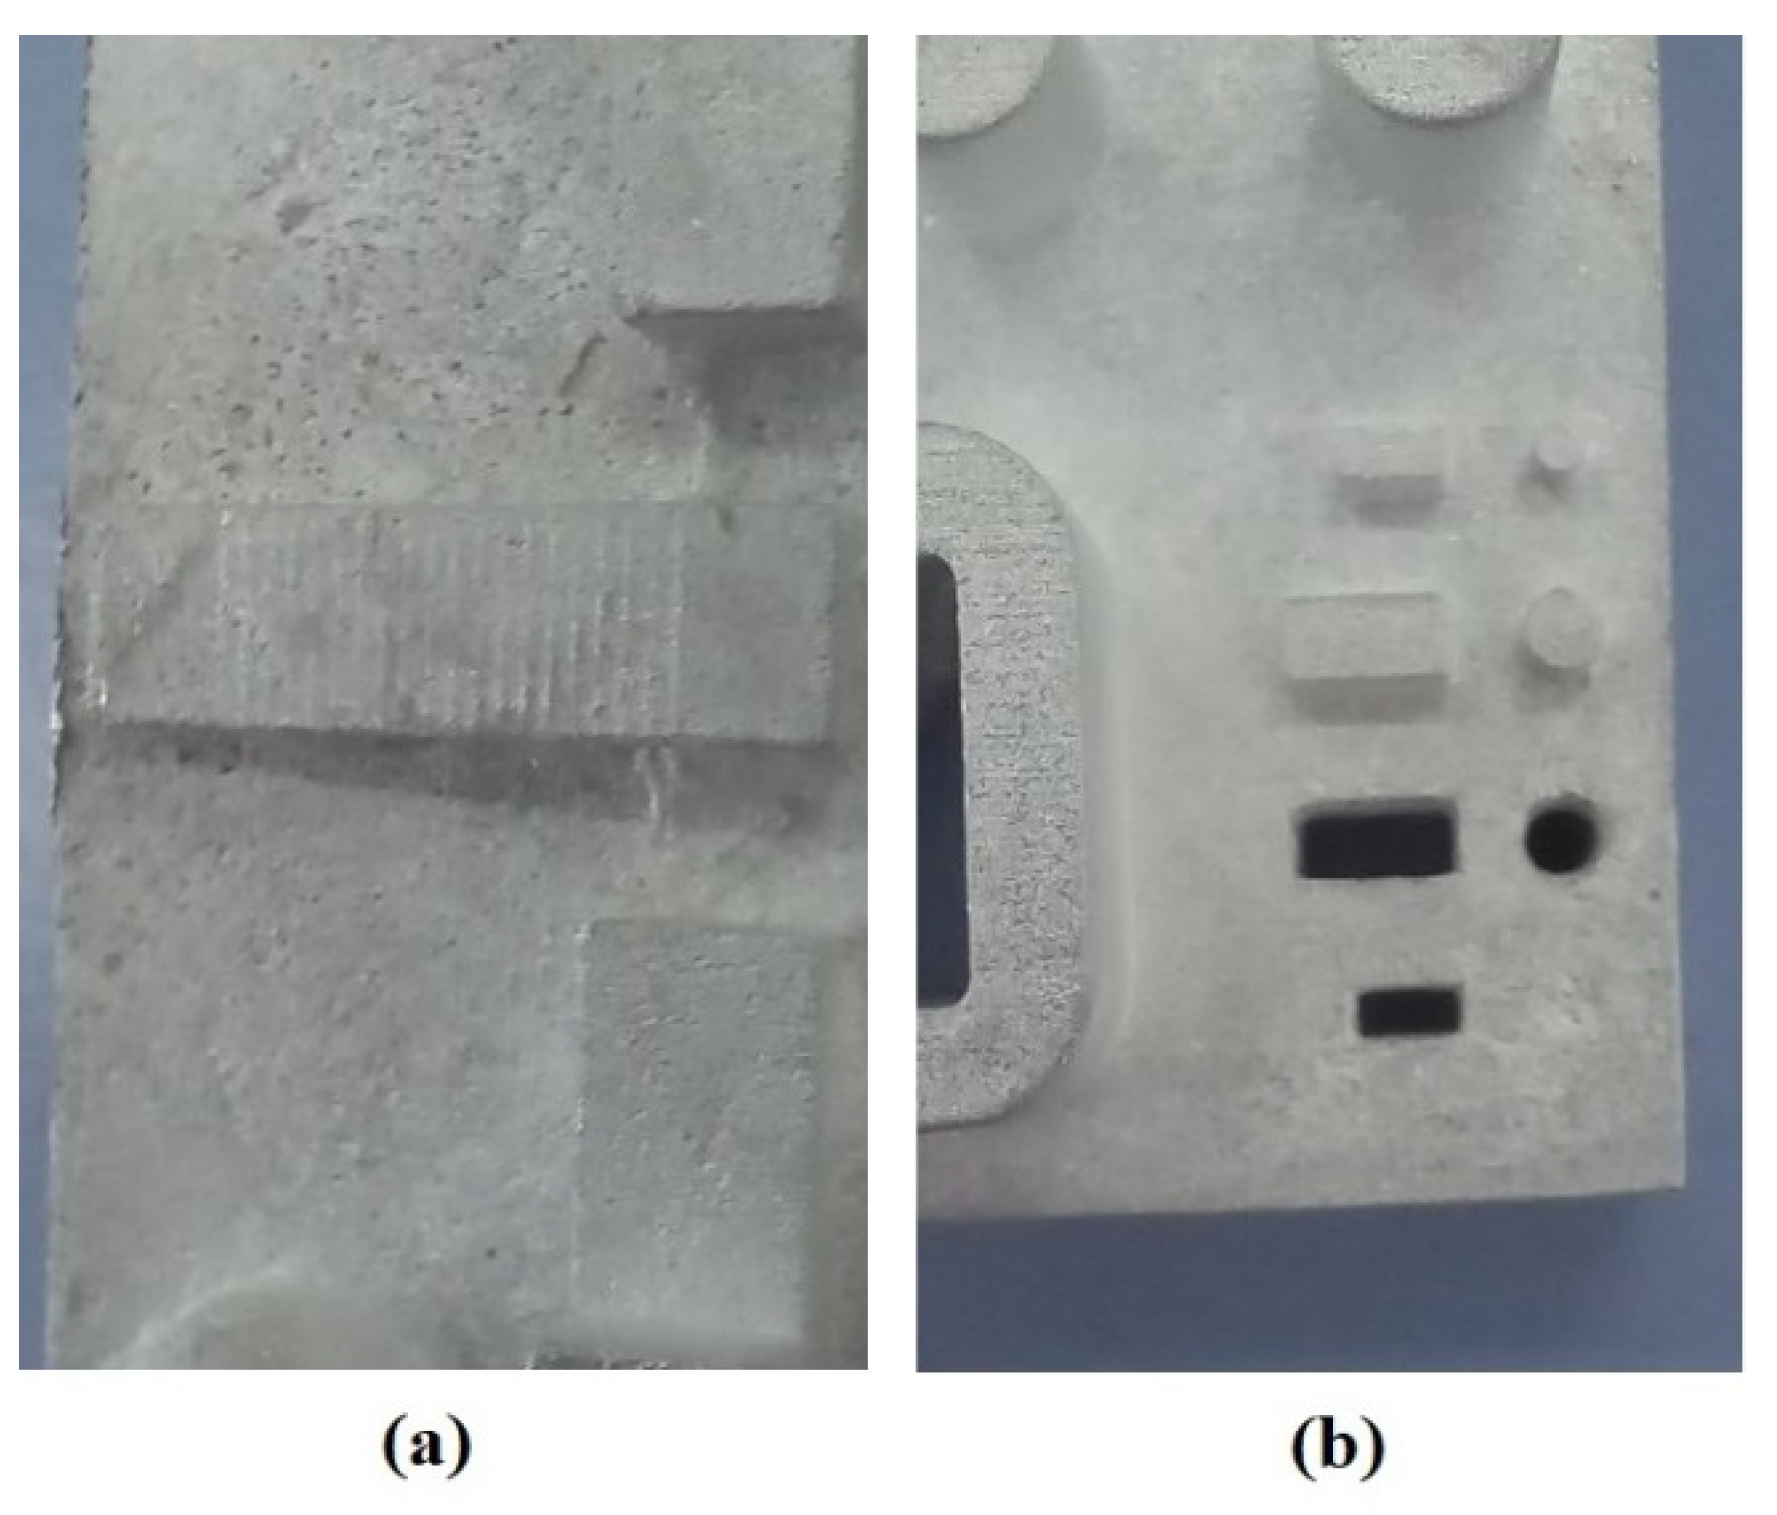
3.1.2. Casting Results

The results of the 24 cast parts are shown in Figure 7. Although the staircase effect is an unwanted surface finish defect of printed parts, the ability of RIC to properly cast those staircase effects proves that RIC is a precision casting method. The casting of patterns printed at 0 degree build angle with the staircase effects on the ramp feature is shown in Figure 8.
Prior to the casting process, the flask with the mold is checked for any visible cracks after burnout process. Mold quality after burnout process appeared to be good. During the experiments no cracks or damage were detected on the outer surface of the molds, and no mold breakage happened during metal pouring.

3.2. Measurement and Analysis

Measurements of printed patterns and cast parts were analyzed separately and then compared. For both cases, analysis was performed for dimensional accuracy and the geometric characteristics. The dimensional deviations from nominal value were used as the response value for S/N ratio and Mean analysis in Minitab 19, and results were combined in Excel.

3.2.1. Printed Patterns

Dimensional Accuracy

All printed 24 patterns (with three repeated printings of each eight runs) were measured for dimensional accuracy. Features were grouped according to the measurement dimension, like diameter, length, width, and height. Features are named as “D.4_Cyl 1-4”, where D means for which dimension the given feature was measured, 4 means the nominal dimension, Cyl represents the feature label showed in Figure 2, 1–4 means Cyl 1, Cyl 2, Cyl 3, and Cyl 4. The other features are labeled in the same manner. Dimensional deviations, maximum and minimum ranges of measured values, and average dimensional values of all features are presented in Table 9.
The effect of SLA printing parameters’ variations on the dimensional accuracy of printed patterns is represented by dimensional deviations in Table 9. Overall, magnitude of deviations was less than 0.1 mm, which agrees with the SLA printed denture measurements in [17]. Furthermore, it shows that the SLA printer is more accurate than FDM printer which had deviations around 0.25 mm [51]. Among cylindrical features, it has been observed that dimensional deviation increased with the increased diameters, and among the same sized cylindrical features holes had larger deviations than extruded ones. Deviations from nominal dimensions were greater for circular features compared to the rectangular features. Circular features were undersized, which can be the result of Castable Wax shrinkage. However, rectangular features were oversized which agrees with the study in [14]. Length, width, and height measurement results present that accuracy along Z direction was greater than along X and Y directions. This agrees with the study [14], which reveals that SLA printer is more accurate in Z direction than X-Y plane dimensions.
Table 10 represents the S/N ratio analysis result in terms of the delta value rankings. Four parameters were ranked from 1 to 4 according to the delta values calculated for each feature measurement. Rank 1 means the most significant and 4 means the least significant parameter. Then, all rankings of each parameter were summed together and again ranked based on the same pattern, and the least value is the most significant and the most value is the least significant. The mean ranking of parameters for dimensional accuracy of the pattern is given in Table A1 in Appendix A.
Response for S/N ratio ranking in Table 10 shows that the most significant factor was the (B) build angle being the most influential parameter, followed by (A) layer thickness, (C) support density, and (D) touchpoint size. This order of significance of parameters shows their effect on dimensional accuracy of printed patterns.
Based on the S/N ratio analysis and Mean response analysis the optimum level for each parameter at each feature measurement was identified according to the “Smaller is Better” metrics, meaning the smallest dimensional deviation, as shown in the Table 11. The number of occurring frequencies of each level for each parameter was summed, and the most occurring frequency was chosen as the optimum level of parameter to achieve a good dimensional accuracy of printed patterns.

Geometric Characteristics

The average measured values, measurement ranges, and the deviations for geometric characteristics of features across all 24 printed patterns is presented in Table 12. Flatness, concentricity, roundness, parallelism, and perpendicularity features were measured having a nominal value of 0. For flatness the Top surface of the pattern was taken as a 0 reference. Concentricity of stepped cylinders had the coordinates of the Hole 2 as the reference 0 position. Parallelism and perpendicularity had 0° and 45° difference between the measured planes as the 0 reference, respectively. Roundness is measured by taking the Spheres radius as the reference.
It can be seen from Table 12 that the most deviations occur in printing the angular feature and flat surface with the 0.2626 mm and −0.2277 mm deviation from nominal value, respectively. Other geometric characteristics of the printed features had dimensional deviations less than 0.08 mm. positioning in X direction is slightly better than in Y direction.
S/N ratio response ranking of the geometric characteristic measurements is shown in Table 13. The ranking is performed similarly to the previous S/N ratio rankings of dimensional accuracy measurements. The mean ranking of parameters for geometric accuracy of the pattern is given in Table A2 in Appendix A.
It can be seen from Table 13 that (B) build angle was the most sensitive parameter in achieving a good geometric characteristic with minimal deviations from nominal value. The least important parameters for this purpose were the (D) touchpoint size.
Based on the S/N ratio response tables and Mean response analysis, the optimum levels of parameters for achieving good geometric characteristics were identified in Table 14. The most frequently occurring level was chosen as the optimum level for each parameter.
To achieve minimal deviations from nominal values in dimensional accuracy and geometric characteristics, the following parameters sets with optimum values are identified from the analysis made. Table 15 summarizes the analysis findings and shows the optimum parameters for both purposes.

3.2.2. Casting

The measurement of geometrical features and the geometric characteristics of the cast are discussed in the section.

Dimensional Accuracy

The patterns measured above were then used in the casting process as patterns for the casting mold creation. The cast Al parts were then measured with the same CMM machine for the dimensional accuracy and geometrical characteristics. Measurement results were analyzed in the similar way as discussed in pattern measurement sections above, as shown in Table 16.
Figure 9 represents the comparison between dimensional deviation of printed patterns and cast parts.
Comparing the dimensional deviation from nominal value between patterns and cast parts shown in Figure 9, the largest difference was observed in hole dimension with 0.0852 mm, and dimensional deviations of other features fluctuate between 0.229 mm and 0.0692 mm. It can be observed from Table 9 and Table 16 and Figure 9 that the features which had positive deviations in printed patterns, had smaller positive or even negative deviations in cast parts, and the features that had negative deviations in printed patterns, had greater negative deviations in cast parts. This resulted in the oversized features in cast parts compared to the same features in printed patterns. Considering that deviations are calculated as the measured value subtracted from the nominal value, the negative dimensional deviation means oversized and positive deviation value means undersized feature. For the circular features, the cylinders and spheres in the printed patterns were undersized, and in the cast parts were oversized. This can be caused by the expansion of the Castable Wax pattern during the burnout process due to its high thermal expansion. In fact, some cast parts had metal penetration defect on the edges of the base and features. This shows that during thermal expansion of the pattern, small cracks were created in the shell on the edges of the base and features. These created gaps in the shell were penetrated by molten metal. Cracks were small and did not reach the outer surface of the mold. Metal penetration observed in some cast parts are shown in the Appendix A, Figure A2. This results in the expansion of boss extruded features and shrinkage of the holes in the mold cavity, so that the mold dimensions are slightly greater than the nominal dimensions for boss extruded features and smaller for holes. This explains the smaller diameter of the holes in the cast parts than in the printed patterns. Overall, this trend is consistent throughout all the features except for the last two features representing the height measurements. The cast parts showed greater deviation than in patterns for height measurements, resulting in the reduction of height of the stepped rectangular features in the cast parts compared to the same features in the printed patterns. This can be caused by the Castable Wax expansion in X-Y directions and shrinkage in Z direction during burnout process, as well as significant shrinkage of Al in Z direction during solidification.
It can be found from Table 17 that the most significant factor that affects the dimensional accuracy of cast parts is (B) build angle followed by (A) layer thickness, and the least significant factor is (D) touchpoint size. The same was obtained for the printed patterns. The mean ranking of parameters for dimensional accuracy of the cast parts is given in Table A3 in Appendix A.
Table 18 presents the optimum levels for each parameter identified according to the S/N ratio and Mean response analysis, with the Smaller is Better S/N ratio metric.

Geometric Characteristics

Geometric characteristics of the cast parts were measured as was measured in patterns using the same CMM equipment and measurement plan. Table 19 shows the averaged measurement results, range, and deviations from nominal value. Nominal values for the flatness, concentricity, roundness, parallelism, and perpendicularity were explained in the Geometric Characteristics section.
Figure 10 shows the comparison between geometric deviations of printed and cast part from the nominal value.
It can be seen from Figure 10 that the cast parts have smaller positive deviations and greater negative deviations compared to the patterns.
This can be the result of thermal expansion of the Castable Wax patterns during the burnout process. As a result, the mold cavity for boss features expands and the holes shrink. The positive Y.36 and Y.28 height characteristics show that both patterns and cast parts shrink in Z direction. Cast parts have greater deviations in height than patterns, which represents the significant shrinkage of Al in Z direction compared to Castable Wax. The same was concluded in the dimensional accuracy section for casting measurements.
Table 20 presents the S/N ration response ranking based on the delta values, with the smallest ranking showing the most significant factor, and the greatest ranking showing the least significant factor. The mean ranking of parameters for geometric accuracy of the cast parts is given in Table A4 in Appendix A.
As can be seen from Table 20, the (B) build angle and (D) touchpoint size were the most significant factors affecting the S/N ratio, and the (C) Support density was the least significant factor. Similar rankings were done with the responses for means, shown in Table A4.
Optimum levels for parameters were chosen based on the S/N ratio and Mean response analysis, as shown in Table 21.
Dimensional accuracy and good geometric characteristics of the cast parts can be obtained using the optimum parameters shown in Table 22.
Overall, for SLA printed patterns Build angle was the most influential parameter followed by Layer thickness affecting both the dimensional accuracy and geometric characteristics, and the least influential was Touchpoint size parameter. The same is true for cast parts, with the exception of Support density identified as the least influential parameter affecting the geometric characteristics of cast parts. Considering that Build angle and Layer thickness are the significant parameters for both printed patterns and cast parts, it can be concluded that optimum levels for these parameters must be similar, which was shown in Table 15 and Table 22.
In the pattern measurement analysis, Castable Wax solidification shrinkage was the uncontrollable noise factor and printing parameters were controllable factors. For the casting, Castable Wax expansion and the metal shrinkage during solidification were the uncontrollable noise factors and casting parameters were the controllable factors. To achieve consistent results and reduce the effect of noise factors, patterns were held for the same amount of time before measurements and the mold making process. This could help to achieve the similar photopolymer shrinkage in the patterns. Casting parameters were held constant throughout the experiments and the time before quenching was also constant, which leads to the same conditions for metal solidification. Although these precautions were made, metal shrinkage and photopolymer expansion effect cannot be eliminated completely.
The same cylindrical features were undersized in the patterns, while oversized in the cast parts. Rectangular features were oversized in both patterns and cast parts. Positioning in the Y axis was less accurate than in X axis, which can be seen by larger deviations along Y coordinates in both patterns and cast parts. Overall, dimensional, and geometric deviations had the similar tendency with the same oversized features having more deviation in cast parts than patterns, and undersized features having smaller deviations in cast parts than in patterns. Figure 11 shows this main tendency in dimensional deviations of cast and printed parts.

4. Conclusions

This study investigated the evaluation of the effect of SLA printing parameters on the dimensional accuracy and geometric characteristics of RIC parts. In this study, four available control parameters were used in the investigation, including layer thickness, build angle, support density and support touchpoint size for SLA. The benchmark model design for the patterns was developed to study the effect of these parameters. Solidification simulation was performed in SolidCast to verify the casting tree design and find the feeder location to achieve directional solidification. Twenty-four patterns were printed using Taguchi DOE and measured using CMM. Patterns then were cast and cast parts were measured. Taguchi 2 step optimization method was used to analyze the measurement results and significant parameter and optimum levels for parameters were established. The following concluding remarks can be drawn from this study.
  • The most impactful critical factor affecting the dimensional accuracy and geometric characteristics of both the Castable Wax printed patterns and Al cast parts was the Build angle, and the second most impactful factor was the Layer thickness according to the S/N ratio ranking of parameters based on the “Smaller-the-better” scheme. The optimum values for these critical parameters to achieve good dimensional and geometric accuracies in printed and cast parts were the same, 0 deg build angle and 0.25 μm layer thickness. These values were found using Castable Wax, and differ from what is reported in the literature, where it is stated that 45 deg angle gives the best accuracy for other photopolymers.
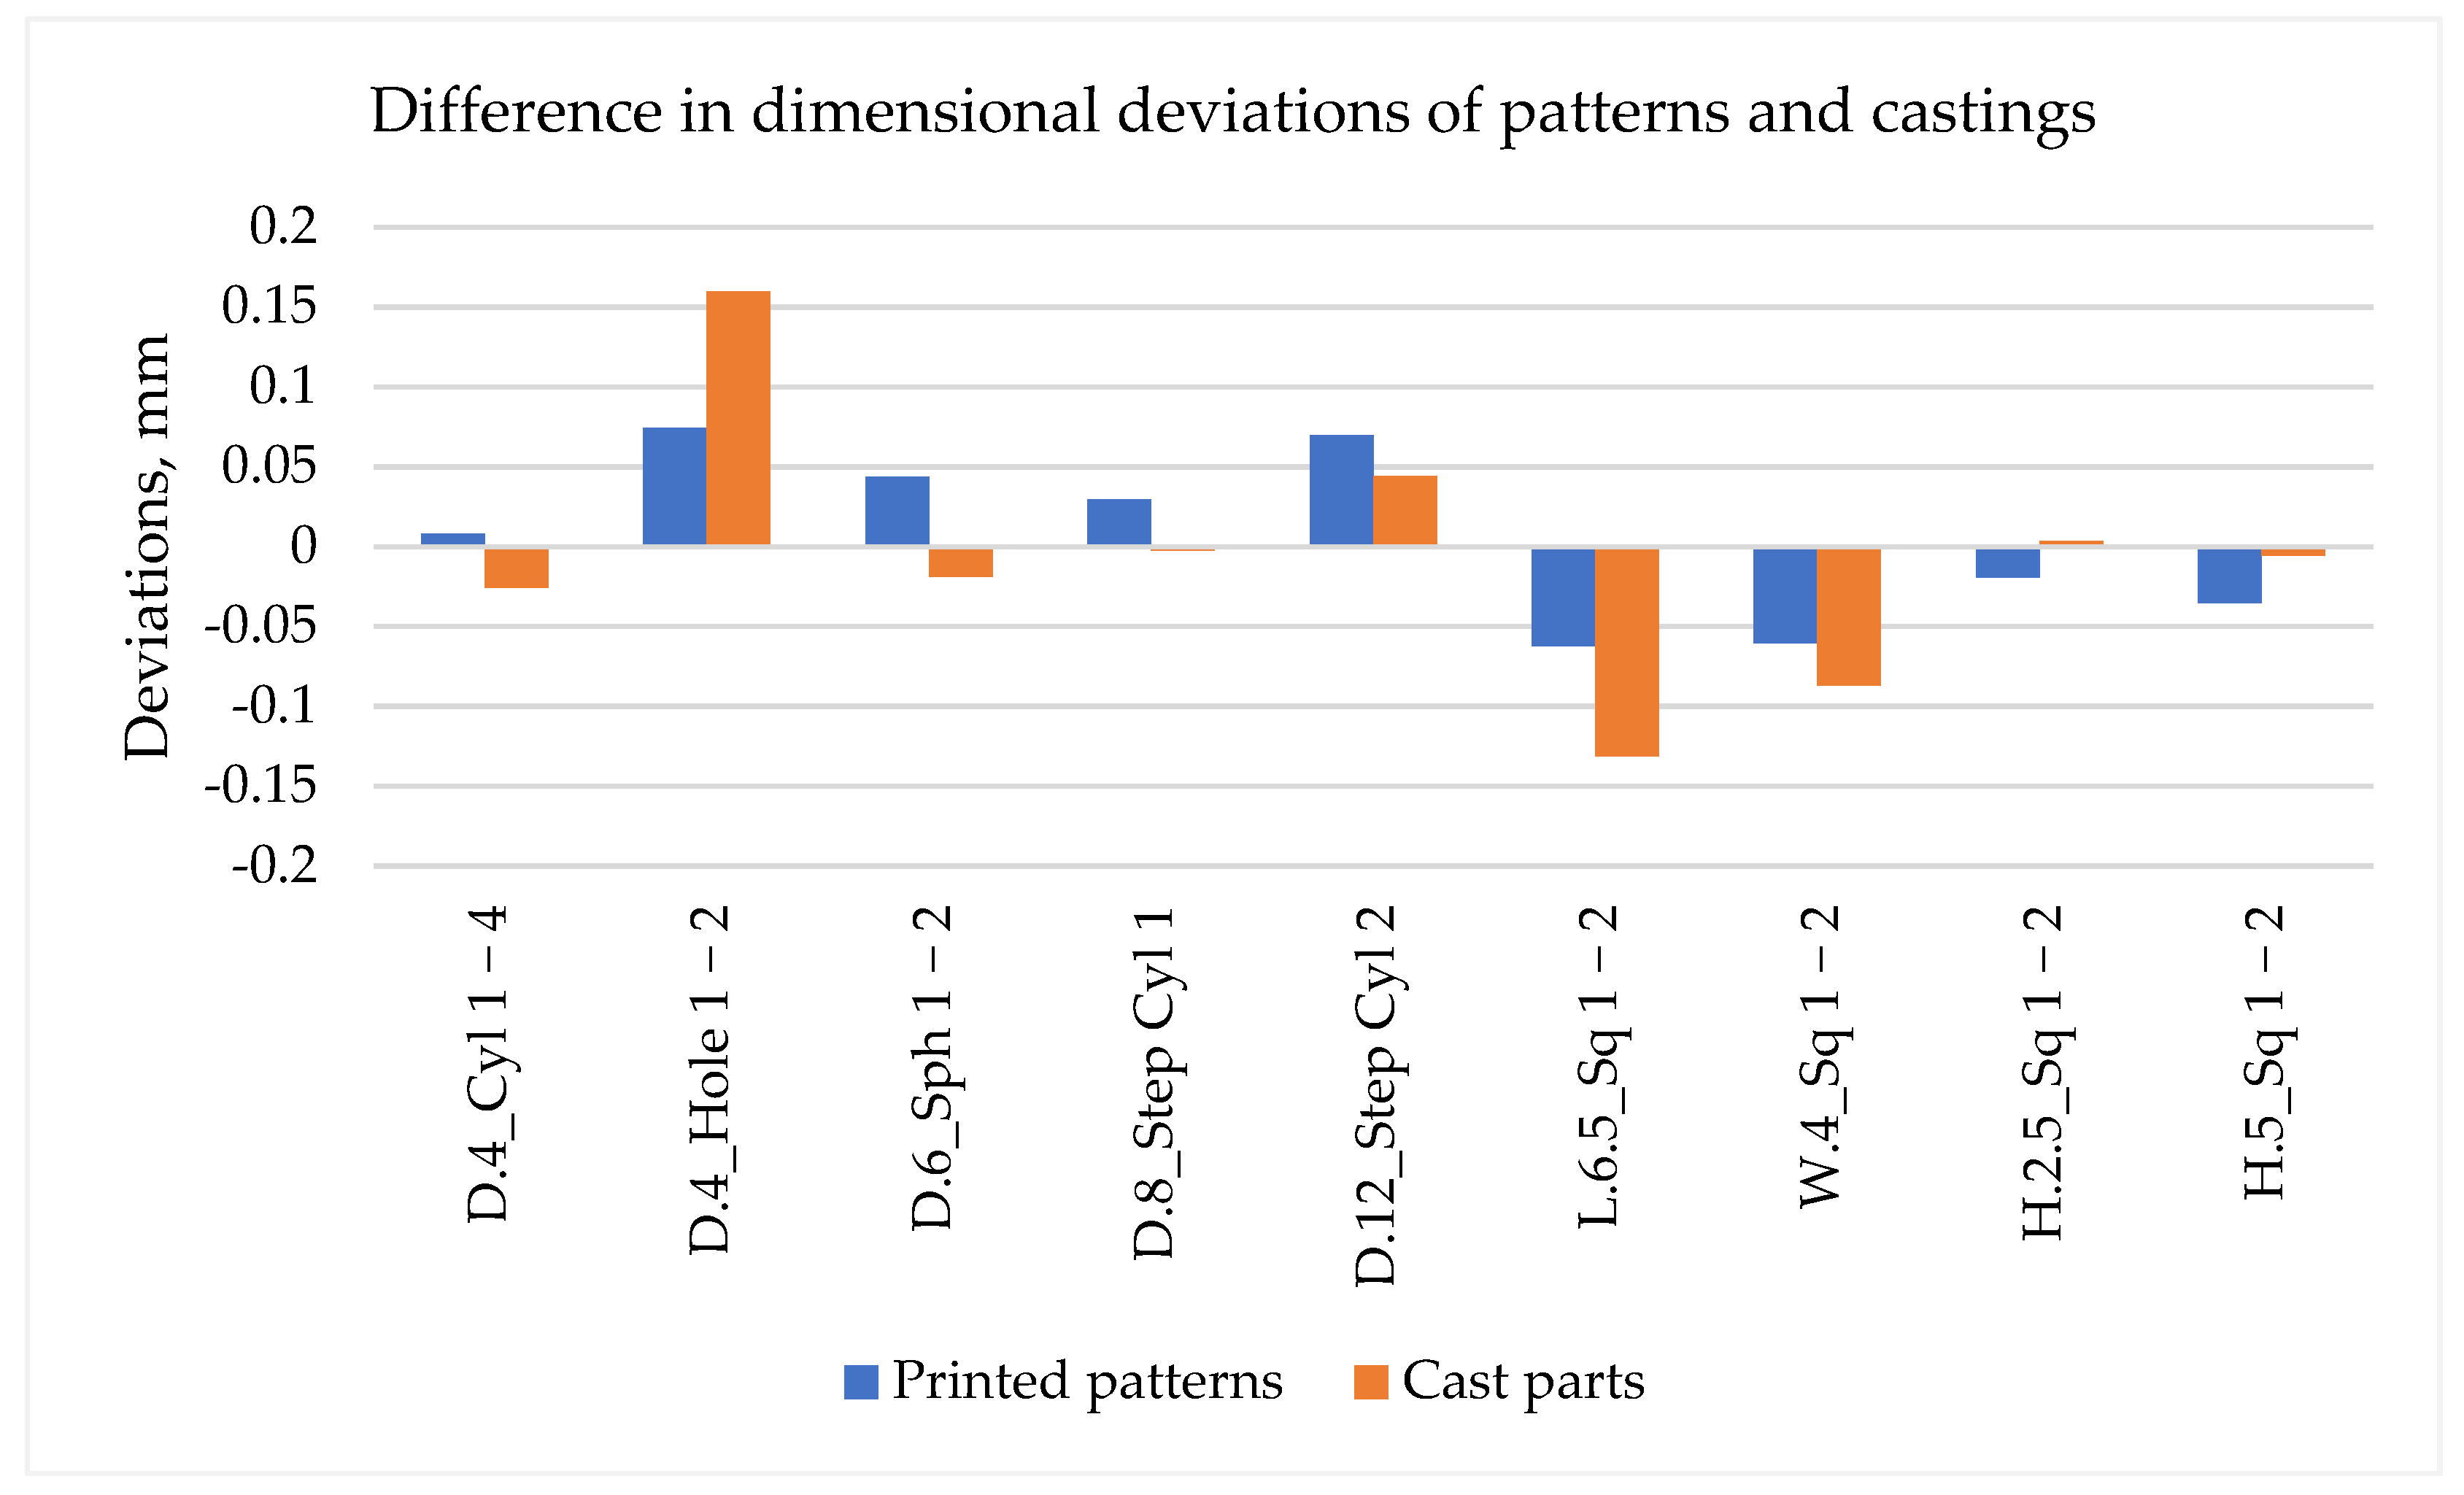
  • The measurement results of both printed patterns and cast parts revealed that dimensional deviations increase with increased diameter in cylindrical features. Holes had larger dimensional deviations than boss cylinders and were undersized by 1.9% and 4% in printed and cast parts, respectively.
  • Accuracy in height (Z direction) of the rectangular features were better than the accuracy in X-Y directions. In Z direction deviations were 0.7% and 0.1% in printed and cast parts, respectively, while in X-Y directions average deviations were 1.25% and 2.1% in printed and cast parts, respectively. Circular features had deviations 1.3% more than rectangular features in patterns, and had deviations 13% less than rectangular features in cast parts.
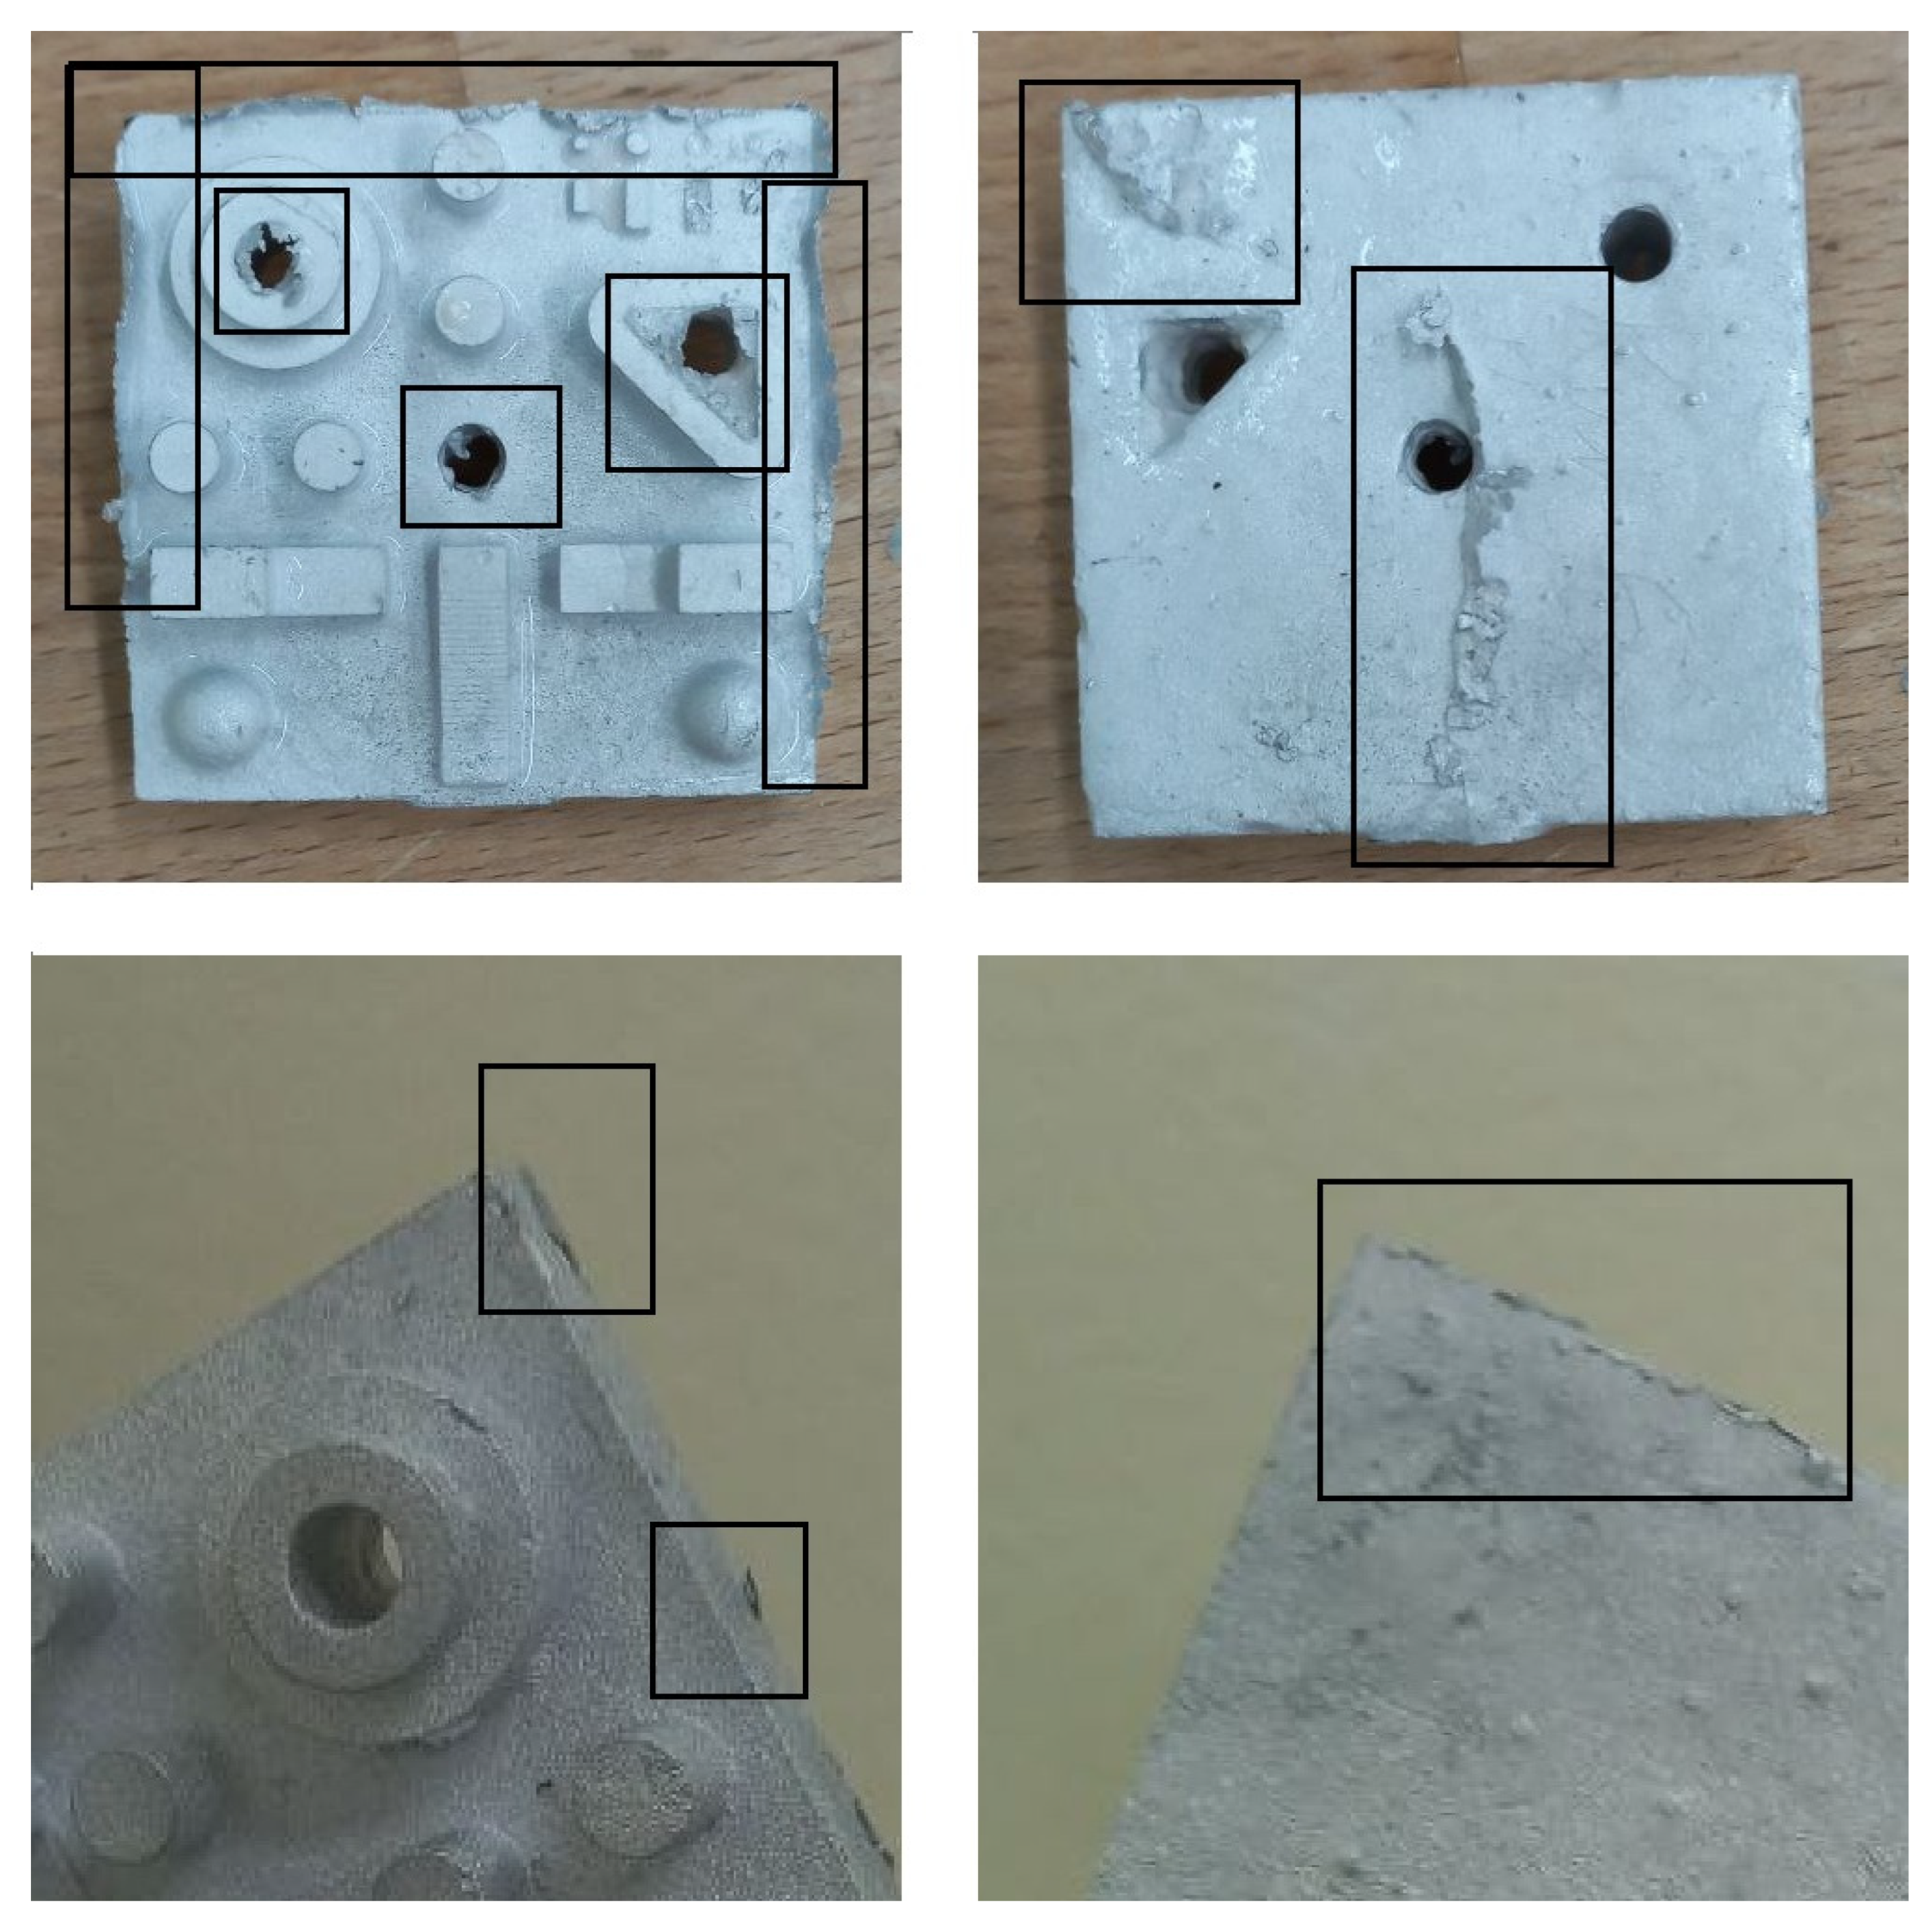
  • Staircase effects on printed patterns were replicated in the cast parts showing the ability of the casting process to cast the small deviations on the surface. Fine features with diameters and width less than 2 mm were not cast properly.
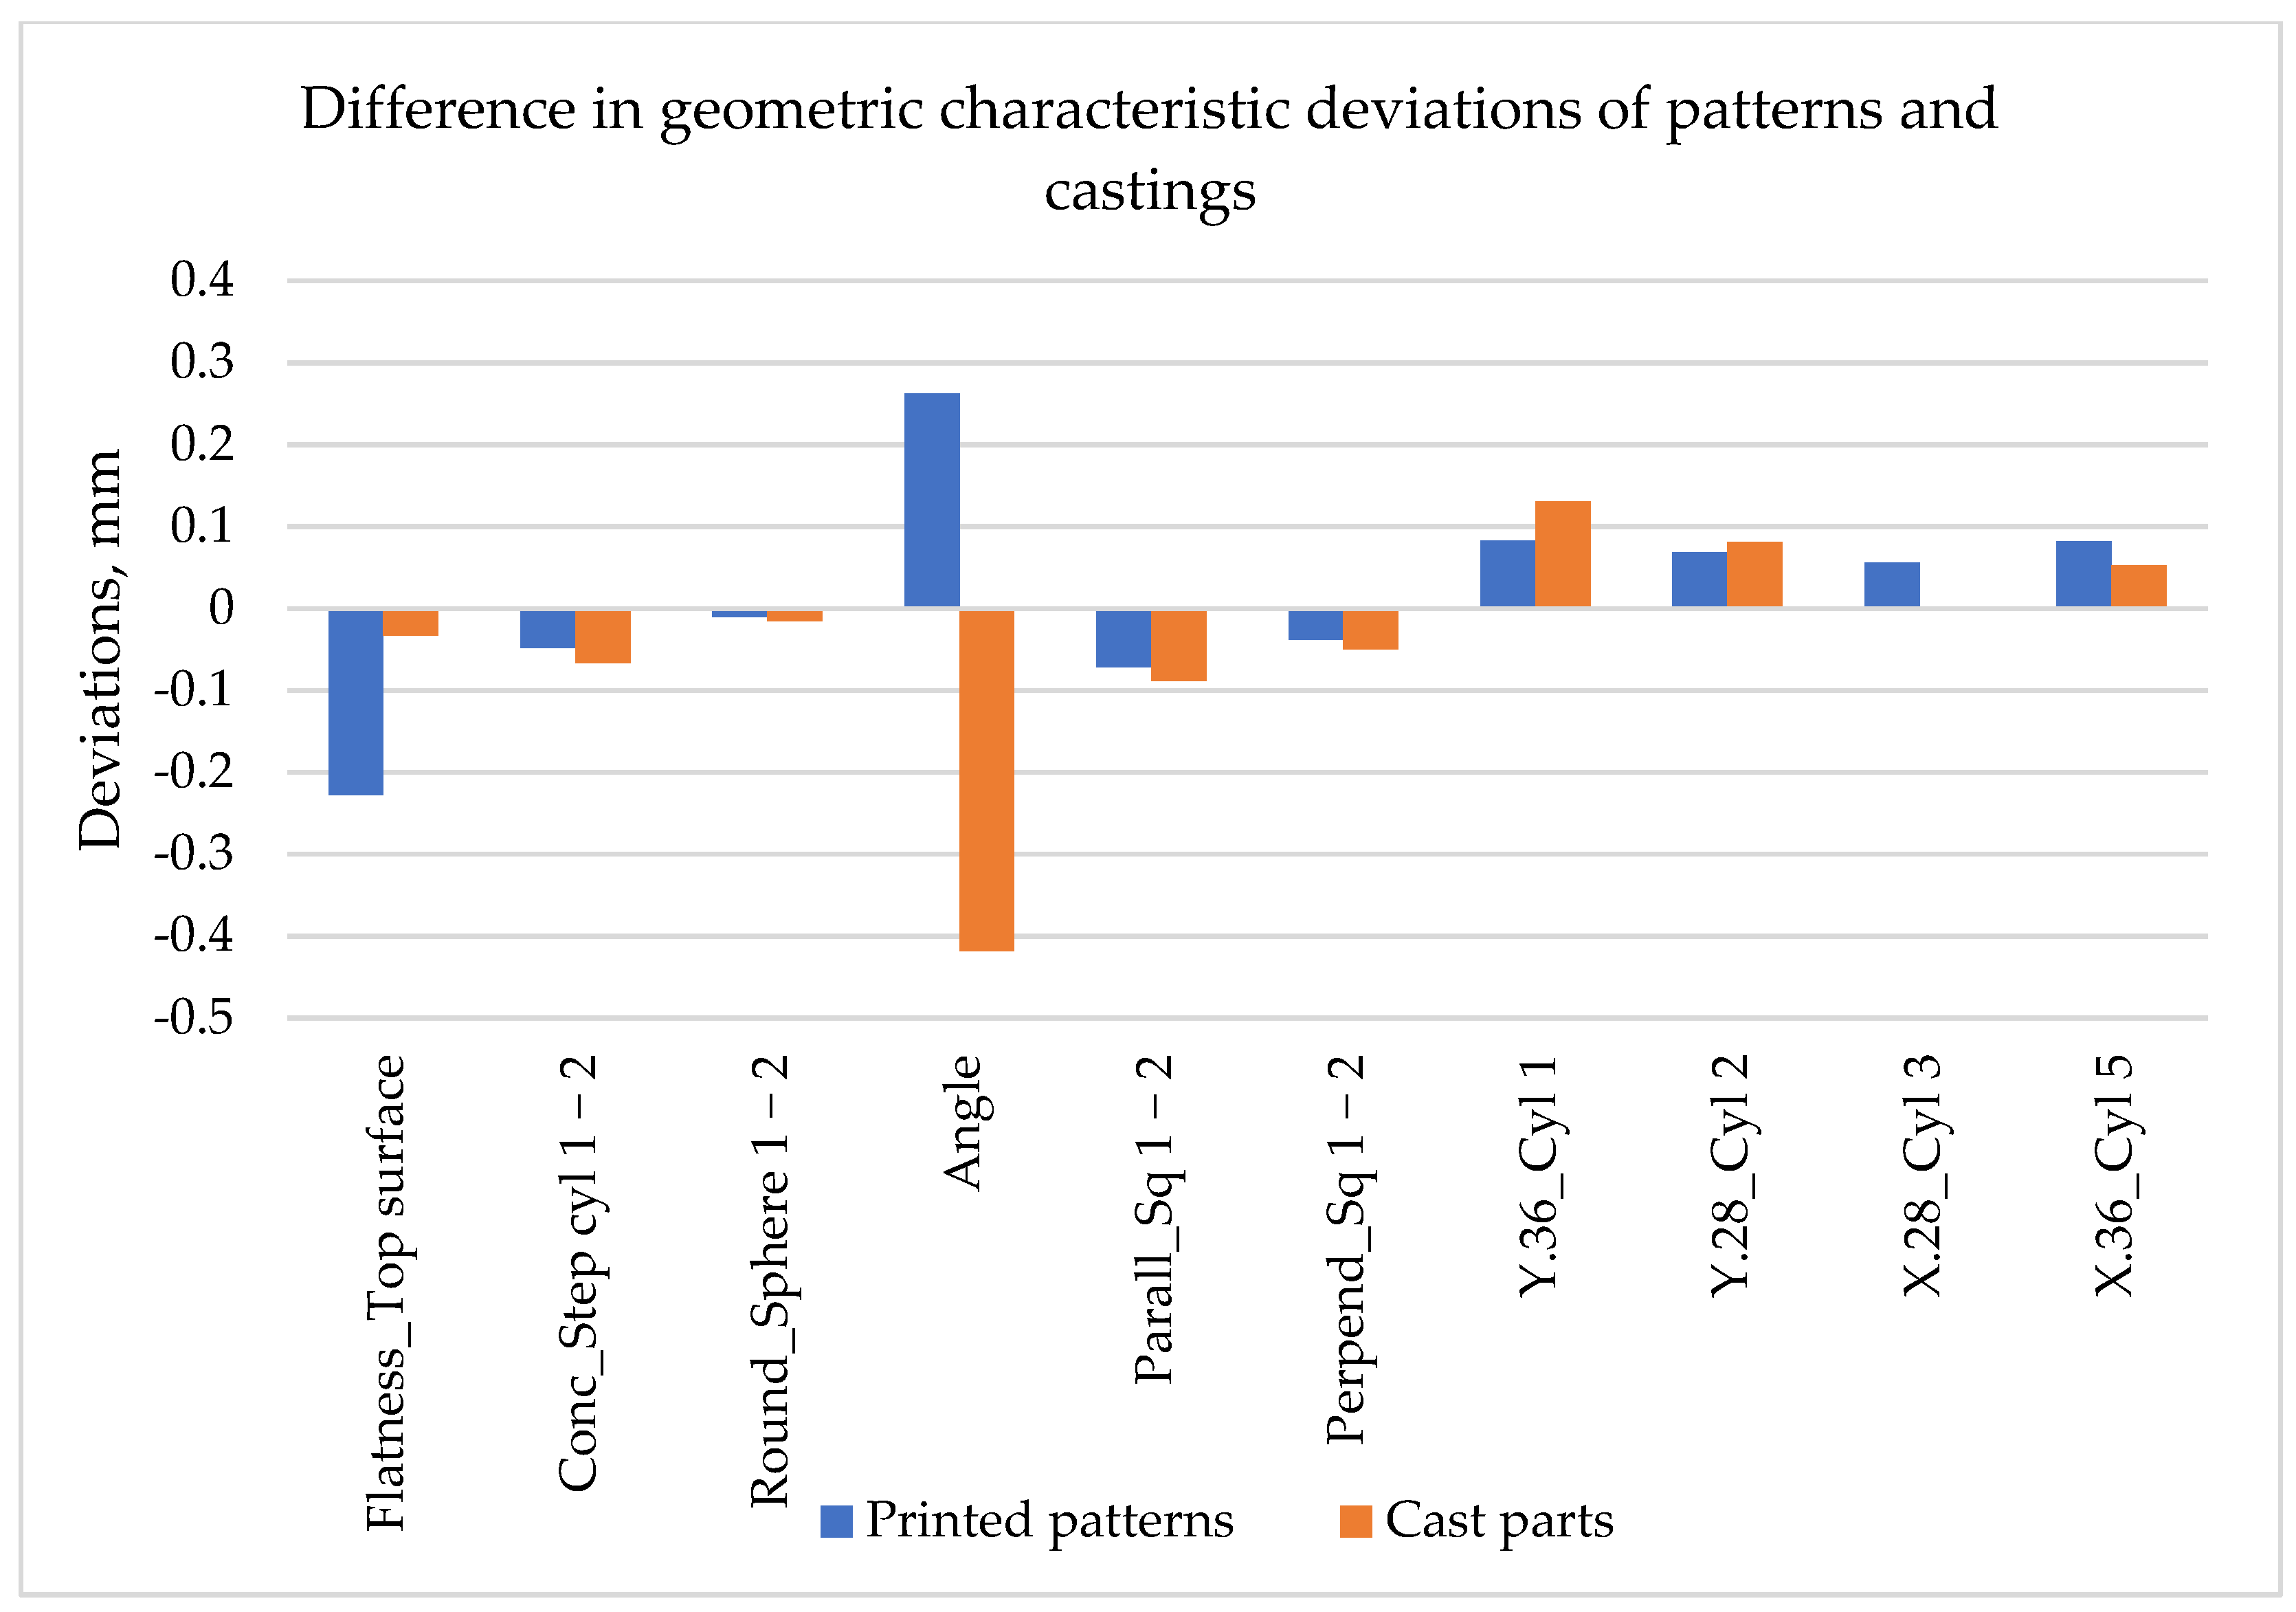
  • On average, the geometric characteristics had twice as many deviations as the dimensional characteristics. The most accurate geometric characteristic was the sphere roundness both in printed and cast parts, showing 0.011 mm and 0.016 mm deviations in average, respectively. The angularity was the least accurate geometric characteristic, showing 0.23 mm and 0.42 mm deviations in printed and cast parts, correspondingly.
  • Form 3 LF SLA printer had 0.1 mm dimensional accuracy in average for printed Castable Wax parts.
The dimensional deviations and the geometric deviations affect the ability of the product to perfectly fit the other parts during assembly. These characteristics are important not only in industries like aerospace, automotive, etc., but are essential in implant productions. This study considered both characteristics and identified the critical parameter affecting them and optimum parameter settings to achieve good dimensional accuracy and geometric characteristics of printed and cast parts in RIC.
This study provides the optimized parameters settings for dimensional accuracy and geometric characteristics of the printed patterns and the cast parts which can be developed further by complicating the benchmark models with thin and curved features, as well as lateral features to study the repeatability in the Z direction. Another development can be related to the casting material. The current study was limited with the furnace ability to melt only low melting temperature nonferrous metals. Further investigation can be made using other non-ferrous metals or commonly used ferrous metals.

Author Contributions

Methodology, Investigation, Writing (original draft, review and editing): N.B.; Review and Editing: A.P. and D.T.; Conceptualization and Supervision: D.T. and A.P.; Funding acquisition: D.T.; All authors are involved in discussions of the results. All authors have read and agreed to the published version of the manuscript.

Funding

This research was funded under the target program No OR07665556 for project entitled “Additive Manufacturing Systems and Metal Powders for the Kazakhstani industry”, by the Ministry of Industry and Infrastructure Development of the Republic of Kazakhstan.

Institutional Review Board Statement

Not applicable.

Informed Consent Statement

Not applicable.

Data Availability Statement

Data will be available on request.

Conflicts of Interest

The authors declare no conflict of interest.

Appendix A

Figure A1. New artifact model with dimensions, in mm.
Jmmp 06 00109 g0a1
Figure A2. Metal penetration issue in cast parts: thin metal flakes on the edges.
Jmmp 06 00109 g0a2
Table A1. Mean ranking of parameters for dimensional accuracy of patterns.
FeatureA: Layer ThicknessB: Build AngleC: Support DensityD: Touchpoint Size
D.4_Cyl 1-42134
D.4_Hole 1-21234
D.6_Sph 1-24123
D.8_Step Cyl 14213
D.12_Step Cyl 23124
L.6.5_Sq 1-24123
W.4_Sq 1-24123
H.2.5_Sq 1-23142
H.5_Sq 1-24123
Sum29112129
Ranking of sums3123
Table A2. Mean ranking of parameters for geometric characteristic of patterns.
CharacteristicsA: Layer ThicknessB: Build AngleC: Support DensityD: Touchpoint Size
Flatness1243
Conc_Step cyl 1-21234
Round_Sphere 1-23214
Angle3124
Parall_Sq 1-24132
Perpend_Sq 1-24123
Y.36_Cyl 13214
Y.28_Cyl 24312
X.28_Cyl 31243
X.36_Cyl 51234
Sum25182433
Ranking of sums3124
Table A3. Mean ranking of parameters for dimensional accuracy of cast parts.
FeatureA: Layer ThicknessB: Build AngleC: Support DensityD: Touchpoint Size
D.4_Cyl 1-44132
D.4_Hole 1-21234
D.6_Sph 1-23124
D.8_Step Cyl 13142
D.12_Step Cyl 22134
L.6.5_Sq 1-23124
W.4_Sq 1-24123
H.2.5_Sq 1-21324
H.5_Sq 1-22143
Sum23122530
Ranking of sums2134
Table A4. Mean ranking of parameters for geometric characteristic of cast parts.
CharacteristicsA: Layer ThicknessB: Build AngleC: Support DensityD: Touchpoint Size
Flatness_1324
Conc_Step cyl 1-21423
Round_Sphere 1-23241
Angle4123
Parall_Sq 1-24123
Perpend_Sq 1-24132
Y.36_Cyl 13142
Y.28_Cyl 22341
X.28_Cyl 34321
X.36_Cyl 51432
Sum27232822
Ranking of sums3241

References

  1. Berman, S. Investment Castings | What Are Investment Castings Used for? 2017. Available online: https://www.ferralloy.com/investment-castings-applications/ (accessed on 4 May 2022).
  2. Mukhtarkhanov, M.; Perveen, A.; Talamona, D. Application of Stereolithography Based 3D Printing Technology in Investment Casting. Micromachines 2020, 11, 946. [Google Scholar] [CrossRef] [PubMed]
  3. Pattnaik, S.; Jha, P.K.; Karunakar, D.B. A review of rapid prototyping integrated investment casting processes. Proc. Inst. Mech. Eng. Part L J. Mater. Des. Appl. 2014, 228, 249–277. [Google Scholar] [CrossRef]
  4. Cheah, C.M.; Chua, C.K.; Lee, C.W.; Feng, C.; Totong, K. Rapid prototyping and tooling techniques: A review of applications for rapid investment casting. Int. J. Adv. Manuf. Technol. 2005, 25, 308–320. [Google Scholar] [CrossRef]
  5. Prakash, C.; Singh, S.; Kopperi, H.; Ramakrihna, S.; Mohan, S. Comparative job production based life cycle assessment of conventional and additive manufacturing assisted investment casting of aluminium: A case study. J. Clean. Prod. 2021, 289, 125164. [Google Scholar] [CrossRef]
  6. Lee, C.; Chua, C.K.; Cheah, C.M.; Tan, L.H.; Feng, C. Rapid investment casting: Direct and indirect approaches via fused deposition modelling. Int. J. Adv. Manuf. Technol. 2004, 23, 93–101. [Google Scholar]
  7. Kumar, P.; Ahuja, I.; Singh, R. Application of fusion deposition modelling for rapid investment casting—A review. Int. J. Mater. Eng. Innov. 2012, 3, 204–227. [Google Scholar] [CrossRef]
  8. Chua, C.; Feng, C.; Lee, C.W.; Ang, G.Q. Rapid investment casting: Direct and indirect approaches via model maker II. Int. J. Adv. Manuf. Technol. 2005, 25, 26–32. [Google Scholar] [CrossRef]
  9. Greenbaum, P.; Khan, S. Direct investment casting of rapid prototype parts: Practical commercial experience. In Proceedings of the 2nd European Conference on Rapid Prototyping, Nottingham, UK, 15–16 July 1993. [Google Scholar]
  10. Arnold, C.; Monsees, D.; Hey, J.; Schweyen, R. Surface quality of 3D-printed models as a function of various printing parameters. Materials 2019, 12, 1970. [Google Scholar] [CrossRef] [PubMed]
  11. Lee, S.; Park, W.; Cho, H.; Zhang, W.; Leu, M. A neural network approach to the modelling and analysis of stereolithography processes. Proc. Inst. Mech. Eng. Part B J. Eng. Manuf. 2001, 215, 1719–1733. [Google Scholar] [CrossRef]
  12. Garcia, E.A.; Ayranci, C.; Qureshi, A.J. Material property-manufacturing process optimization for form 2 vat-photo polymerization 3D Printers. J. Manuf. Mater. Processing 2020, 4, 12. [Google Scholar] [CrossRef]
  13. Islam, M.; Gomer, H.; Sacks, S. Comparison of dimensional accuracies of stereolithography and powder binder printing. Int. J. Adv. Manuf. Technol. 2016, 88, 3077–3087. [Google Scholar] [CrossRef]
  14. Mucci, V.; Arenas, G.F.; Duchowicz, R.; Cook, W.D.; Vallo, C. Influence of Thermal Expansion on Shrinkage During Photopolymerization of Dental Resins Based on bis-GMA/TEGDMA. Dent. Mater. Off. Publ. Acad. Dent. Mater. 2008, 25, 103–114. [Google Scholar] [CrossRef] [PubMed]
  15. Foteinopoulos, P.; Papacharalampopoulos, A.; Stavropoulos, P. On thermal modeling of Additive Manufacturing processes. CIRP J. Manuf. Sci. Technol. 2018, 20, 66–83. [Google Scholar] [CrossRef]
  16. Park, G.; Kim, S.; Heo, S.; Koak, J.; Seo, D. Effects of Printing Parameters on the Fit of Implant-Supported 3D Printing Resin Prosthetics. Materials 2019, 12, 2533. [Google Scholar] [CrossRef] [PubMed]
  17. Unkovskiy, A.; Bui, P.H.-B.; Schille, C.; Geis-Gerstorfer, J.; Huettig, F.; Spintzyk, S. Objects build orientation, positioning, and curing influence dimensional accuracy and flexural properties of stereolithographically printed resin. Dent. Mater. 2018, 34, e324–e333. [Google Scholar] [CrossRef] [PubMed]
  18. Hada, T.; Kanazawa, M.; Iwaki, M.; Arakida, T.; Soeda, Y.; Katheng, A.; Otake, R.; Minakuchi, S. Effect of Printing Direction on the Accuracy of 3D-Printed Dentures Using Stereolithography Technology. Materials 2020, 13, 3405. [Google Scholar] [CrossRef] [PubMed]
  19. Alharbi, N.; Osman, R.; Wismeijer, D. Factors influencing the dimensional accuracy of 3d-printed full-coverage dental restorations using stereolithography technology. Int. J. Prosthodont. 2016, 29, 503–510. [Google Scholar] [CrossRef] [PubMed]
  20. McCarty, M.; Chen, S.; English, J.; Kasper, F. Effect of print orientation and duration of ultraviolet curing on the dimensional accuracy of a 3-dimensionally printed orthodontic clear aligner design. Am. J. Orthod. Dentofac. Orthop. 2020, 158, 889–897. [Google Scholar] [CrossRef] [PubMed]
  21. Rubayo, D.; Phasuk, K.; Vickery, J.; Morton, D.; Lin, W. Influences of build angle on the accuracy, printing time, and material consumption of additively manufactured surgical templates. J. Prosthet. Dent. 2021, 126, 658–663. [Google Scholar] [CrossRef] [PubMed]
  22. Favero, C.; English, J.; Cozad, B.; Wirthlin, J.; Short, M.; Kasper, F. Effect of print layer height and printer type on the accuracy of 3-dimensional printed orthodontic models. Am. J. Orthod. Dentofac. Orthop. 2017, 152, 557–565. [Google Scholar] [CrossRef] [PubMed]
  23. Piedra-Cascón, W.; Krishnamurthy, V.; Att, W.; Revilla-León, M. 3D printing parameters, supporting structures, slicing, and post-processing procedures of vat-polymerization additive manufacturing technologies: A narrative review. J. Dent. 2021, 109, 103630. [Google Scholar] [CrossRef]
  24. Resende, C.D.; Quirino Barbosa, T.; Moura, G.; Rizzante, F.P.; Mendonça, G.; Zancopé, K.; das Neves, F.D. Cost and effectiveness of 3-dimensionally printed model using three different printing layer parameters and two resins. J. Prosthet. Dent. 2021, in press. [Google Scholar] [CrossRef] [PubMed]
  25. Loflin, W.; English, J.; Borders, C.; Harris, L.; Moon, A.; Holland, J.; Kasper, F. Effect of print layer height on the assessment of 3D-printed models. Am. J. Orthod. Dentofac. Orthop. 2019, 156, 283–289. [Google Scholar] [CrossRef] [PubMed]
  26. Zhang, Z.; Li, P.; Chu, F.; Shen, G. Influence of the three-dimensional printing technique and printing layer thickness on model accuracy. J. Orofac. Orthop. / Fortschr. Der Kieferorthopädie 2019, 80, 194–204. [Google Scholar] [CrossRef] [PubMed]
  27. Mantada, P.; Mendricky, R.; Safka, J. Parameters influencing the precision of various 3d printing technologies. MM Sci. J. 2017, 2017, 2004–2012. [Google Scholar] [CrossRef]
  28. Khaledi, A.-A.; Farzin, M.; Akhlaghian, M.; Pardis, S.; Mir, N. Evaluation of the marginal fit of metal copings fabricated by using 3 different CAD-CAM techniques: Milling, stereolithography, and 3D wax printer. J. Prosthet. Dent. 2020, 124, 81–86. [Google Scholar] [CrossRef]
  29. Piangsuk, T.; Dawson, D.; El-Kerdani, T.; Lindquist, T. The Accuracy of Post and Core Fabricated with Digital Technology. J. Prosthodont. 2022. online ahead of print. [Google Scholar] [CrossRef]
  30. Cheng, P.; Khan, S. Dimensional accuracy and surface finish of investment casting parts by indirect additive manufacturing from fused filament fabrication. IOP Conf. Ser. Mater. Sci. Eng. 2018, 429, 012100. [Google Scholar] [CrossRef]
  31. Kumar, P.; Singh, R.; Ahuja, I. Investigations on dimensional accuracy of the components prepared by hybrid investment casting. J. Manuf. Processes 2015, 20, 525–533. [Google Scholar] [CrossRef]
  32. Wu, H.; Li, D.; Tang, Y.; Guo, N.; Cui, F.; Sun, B. Rapid casting of hollow turbine blades using integral ceramic moulds. Proc. Inst. Mech. Eng. Part B J. Eng. Manuf. 2009, 223, 695–702. [Google Scholar] [CrossRef]
  33. Stavropoulos, P.; Foteinopoulos, P.; Papapacharalampopoulos, A. On the Impact of Additive Manufacturing Processes Complexity on Modelling. Appl. Sci. 2021, 11, 7743. [Google Scholar] [CrossRef]
  34. Foteinopoulos, P.; Esnault, V.; Komineas, G.; Papacharalampopoulos, A.; Stavropoulos, P. Cement-based additive manufacturing: Experimental investigation of process quality. Int. J. Adv. Manuf. Technol. 2020, 106, 4815–4826. [Google Scholar] [CrossRef]
  35. Gargiulo, E.P. Stereolithography process accuracy: User experience. In Proceedings of the 1st European Conference on Rapid Prototyping, Nottingham, UK, 6–7 July 1992; pp. 187–207. [Google Scholar]
  36. Mahesh, M.; Wong, Y.; Fuh JY, H.; Loh, H.T. Benchmarking for comparative evaluation of RP systems and processes. Rapid Prototyp. J. 2004, 10, 123–135. [Google Scholar] [CrossRef]
  37. Mahmood, S.; Talamona, D.; Goh, K.L.; Qureshi, A.J. Fast Deviation Simulation for “Fused Deposition Modelling” Process. In Proceedings of the 14th CIRP CAT 2016—CIRP Conference Computer Aided Tolerancing, Procedia CIRP, Gotherburg, Sweden, 18–20 May 2016; pp. 327–332. [Google Scholar] [CrossRef]
  38. Moylan, S.; Slotwinski, J.; Cooke, A.; Jurrens, K.; Alkan Donmez, M. An Additive Manufacturing Test Artifact. J. Res. Natl. Inst. Stand. Technol. 2014, 119, 429–459. [Google Scholar] [CrossRef] [PubMed]
  39. Chen, Z.; Li, D.; Zhou, W. Process parameters appraisal of fabricating ceramic parts based on stereolithography using the Taguchi method. Proc. Inst. Mech. Eng. Part B J. Eng. Manuf. 2012, 226, 1249–1258. [Google Scholar] [CrossRef]
  40. Wang, J.; Sama, S.; Lynch, P.; Manogharan, G. Design and Topology Optimization of 3D-Printed Wax Patterns for Rapid Investment Casting. Procedia Manuf. 2019, 34, 683–694. [Google Scholar] [CrossRef]
  41. Kabnure, B.; Shinde, V.; Patil, D. Quality and yield improvement of ductile iron casting by simulation technique. Mater. Today Proc. 2020, 27, 111–116. [Google Scholar] [CrossRef]
  42. Browne, D.; O’Mahoney, D. Interface heat transfer in investment casting of aluminum alloys. Metall. Mater. Trans. A 2001, 32, 3055–3063. [Google Scholar] [CrossRef]
  43. Bagalkot, A.; Pons, D.; Symons, D.; Clucas, D. The Effects of Cooling and Shrinkage on the Life of Polymer 3D Printed Injection Moulds. Polymers 2022, 14, 520. [Google Scholar] [CrossRef]
  44. Zhou, J.G.; Herscovici, D.; Chen, C.C. Parametric process optimization to improve the accuracy of rapid prototyped stereolithography parts. Int. J. Mach. Tools Manuf. 2000, 40, 363–379. [Google Scholar] [CrossRef]
  45. Using Castable Wax Resin. n.d. Available online: https://support.formlabs.com/s/article/Using-Castable-Wax-Resin?language=en_US (accessed on 6 September 2022).
  46. Ultra-Vest® MAXX™ Investments. 2022. Available online: https://www.ransom-randolph.com/_files/ugd/cc5f22_4044309c88244e85a19f95210a1b53e1.pdf (accessed on 27 August 2022).
  47. Castable Wax: Jewelry Pattern Burnout Process. 2022. Available online: https://manufat.com/download/Formlabs_Castable_Wax_Usage_Guide.pdf (accessed on 27 August 2022).
  48. Stefanescu, D. Science and Engineering of Casting Solidification, 2nd ed.; Springer: New York, NY, USA, 2008; p. 67. [Google Scholar]
  49. Ye, R. Decreasing Shrinkage in Metal Die-Casting. 3ERP Prototyping. 2022. Available online: https://www.3erp.com/blog/decreasing-shrinkage-metal-die-casting/#:~:text=Solidification%20shrinkage%20is%20the%20next,4%25%20or%203%25%20respectively (accessed on 4 April 2022).
  50. Methods and Formulas for Analyze Taguchi Design. n.d. Available online: https://support.minitab.com/en-us/minitab/21/help-and-how-to/statistical-modeling/doe/how-to/taguchi/analyze-taguchi-design/methods-and-formulas/methods-and-formulas/ (accessed on 1 September 2022).
  51. Mahmood, S.; Qureshi, A.; Talamona, D. Taguchi based process optimization for dimension and tolerance control for fused deposition modelling. Addit. Manuf. 2018, 21, 183–190. [Google Scholar] [CrossRef]
Figure 1. Methodology workflow.
Jmmp 06 00109 g001
Figure 2. Benchmark model schematics.
Jmmp 06 00109 g002
Figure 3. Hot spot (based on CFS time) cut plane.
Jmmp 06 00109 g003
Figure 4. Hot spot (based on CFS time) cut plane on the side faces with the feeder addition location shown with green circle.
Jmmp 06 00109 g004
Figure 5. Burnout schedule.
Jmmp 06 00109 g005
Figure 6. (a) Printed pattern. (b) Ramps and fine features printed at 0 and 45 degrees of build angle.
Jmmp 06 00109 g006
Figure 7. Cast part.
Jmmp 06 00109 g007
Figure 8. Close up view of casting part: (a) staircase effect on the cast ramp feature, (b) fine features.
Jmmp 06 00109 g008
Figure 9. Comparison of dimensional deviations from the nominal value for patterns and castings.
Jmmp 06 00109 g009
Figure 10. Comparison of Geometric characteristics deviations from the nominal value for patterns and castings.
Jmmp 06 00109 g010
Figure 11. Deviations in the cast and printed parts.
Jmmp 06 00109 g011
Table 1. Summary of literature review.
SourceAM MethodStudy FocusFindings
Lee et al. [11]
Mucci et al. [13]
Islam et al. [14]
SLAThe effect of Laser exposure time on the dimensional accuracy of printed partIncreased printing speed leads to less laser exposure time and causes poor polymerization, resulting in poor accuracy and surface finish
Arnold et al. [10]
Unkovskiy et al. [17]
SLAThe effect of Printing direction/positioning on the build platform on the dimensional accuracy of printed partNo significant effect on the dimensional accuracy
Recommended to build the part far from the platform edges
Arnold et al. [10]
Park et al. [16]
Unkovskiy et al. [17]
Hada et al. [18] Alharbi et al. [19]
McCarty et al. [20]
Rubayo et al. [21]
SLAThe effect of Build angle on the dimensional accuracy of printed part45° gives better dimensional accuracy;
0° consumes less time but more material, and vice versa for 90°
Piedra-Cascón et al. [12]
Park et al. [16]
Favero et al. [22]
Dias Resende et al. [24]
Loflin et al. [25]
Zhang et al. [26]
SLAThe effect of Layer thickness on the dimensional accuracy of printed partSmall difference between 25, 50, and 100 μm layer thicknesses in terms of dimensional accuracy;
100 μm was mostly recommended due to faster printing time
Khaledi et al. [28]
Piangsuk et al. [29]
SLAThe dimensional accuracy of milled and RIC partsCompared the SLA assisted RIC copings with milled copings. Parts produced by using of SLA showed dimensional stability of patterns and cast parts over milled parts.
Cheng et al. [30]
Kumar et al. [31]
Kumar et al. [7]
FDMThe dimensional accuracy of RIC partsPost processing of FDM printed patterns does not significantly affect the dimensional accuracy of cast parts. 90° orientation in FDM is best for dimensional accuracy of cast parts.
Table 2. Parameters and control levels.
ParametersLevel 1Level 2
A: Layer thickness (μm)2550
B: Build angle (deg)0 45
C: Support density0.751
D: Support touchpoint size (mm)0.50.6
Table 3. Design of Experiments (DOE).
#ABCD
11111
21122
31212
41221
52112
62121
72211
82222
Table 4. Casting and mold material characteristics used in SolidCast.
Casting MaterialMold Material
Al 518Silica Sand
Thermal conductivity, [W/m/K]96.170.59
Specific heat, [J/kg/K]962.31075.3
Density, [kg/m3]25741521
Casting temperature, [C]700104
Solidification temperature, [C]437-
Table 5. Sensitivity analysis of Critical Fraction Solid (CFS) time and Hot Spot (HS).
Mesh SizeCFS TimeDifferenceHSDifference
1 mm0.063---1.642---
0.5 mm0.0687.9%1.81910.8%
0.25 mm0.0714.4%1.753.8%
Table 6. SLA printer and Castable Wax characteristics.
Form 3 LF SLA PrinterCastable Wax V1 FLCWPU01
Build volume: 145 × 145 × 185 mmTensile Modulus: 220 MPa
Laser Spot Size:85 micronsElongation at Break: 13%
Operating temperature:35 °CAsh Content (TGA): 0.0–0.1%
Laser specifications:Class 1 Laser Product
Wavelength 405 nm laser
Wax content: 20%
Table 7. Casting parameters.
Casting ParametersParameter Values
Casting temperature700 °C
Temperature of the mold prior to casting104 °C
Pouring speed2.5 cm/s
Height of the ladle above the pouring basin2.5 cm
Time before quenching1 h
Table 8. Types of Features used for dimensional accuracy and geometric characteristics measurements.
Dimensional AccuracyGeometric Characteristics
DimensionFeaturesCharacteristicFeatures
DiameterCyl 1-4 Flatness Top surface
Hole 1-2ConcentricitySt cyl 1-2 and Hole 2
St cyl 1-2 ParallelismSq 1-2
Sphere 1-2PerpendicularitySq 1-2 and Top surface
Width Sq 1-2 RoundnessSphere 1-2
Length Sq 1-2AngularityAng 1-2
Height Sq 1-2PositioningCyl 1-4
Table 9. Printed patterns measurement results for dimensional accuracy, in mm.
DimensionFeaturesNominal ValueAverage Measured ValueRangeAverage Deviation
MaxMin
DiameterD.4_Cyl 1-443.99214.07133.93570.0079
D.4_Hole 1-243.92574.03613.77260.0743
D.6_Sph 1-265.95666.03455.88240.0434
D.8_Step Cyl 187.97058.00457.91770.0295
D.12_Step Cyl 21211.930211.976511.86880.0698
LengthL.6.5_Sq 1-26.56.56986.65486.4771−0.0623
WidthW.4_Sq 1-244.06064.26674.0049−0.0606
HeightH.2.5_Sq 1-22.52.51942.67722.4763−0.0194
H.5_Sq 1-255.03535.19894.9628−0.0353
Table 10. S/N ratio ranking of parameters for dimensional accuracy of patterns.
FeatureA: Layer ThicknessB: Build AngleC: Support DensityD: Touchpoint Size
D.4_Cyl 1-41243
D.4_Hole 1-21243
D.6_Sph 1-24132
D.8_Step Cyl 14312
D.12_Step Cyl 23124
L.6.5_Sq 1-22143
W.4_Sq 1-23124
H.2.5_Sq 1-23142
H.5_Sq 1-22314
Sum23152527
Ranking of sums2134
Table 11. Optimum levels of parameters for dimensional accuracy of patterns.
FeatureA: Layer ThicknessB: Build AngleC: Support DensityD: Touchpoint Size
D.4_Cyl 1-41121
D.4_Hole 1-21222
D.6_Sph 1-21111
D.8_Step Cyl 11221
D.12_Step Cyl 21122
L.6.5_Sq 1-22211
W.4_Sq 1-21221
H.2.5_Sq 1-21112
H.5_Sq 1-22121
Level 17536
Level 22463
Optimum level1121
Table 12. Printed patterns measurement results for geometric characteristics, in mm.
CharacteristicsFeaturesNominal ValueAverage Measured ValueRangeAverage Deviation
MaxMin
FlatnessTop surface00.22775.05970.0050−0.2277
ConcentricityConc_Step cyl 1-200.04860.13500.0117−0.0486
RoundnessRound_Sphere 1-200.01060.06300.0003−0.0106
AngularityAngle4544.737446.223643.44690.2626
ParallelismParall_Sq 1-200.07200.27470.0264−0.0720
PerpendicularityPerpend_Sq 1-200.03850.14890.0109−0.0385
PositionY.36_Cyl 13635.917036.042435.79230.0830
Y.28_Cyl 22827.931728.042127.80410.0683
X.28_Cyl 32827.944227.995327.84370.0558
X.36_Cyl 53635.918335.985135.81610.0817
Table 13. S/N ratio ranking of parameters for geometric characteristic of patterns.
CharacteristicsA: Layer ThicknessB: Build AngleC: Support DensityD: Touchpoint Size
Flatness1423
Conc_Step cyl 1-21234
Round_Sphere 1-23214
Angle2143
Parall_Sq 1-24132
Perpend_Sq 1-23124
Y.36_Cyl 14213
Y.28_Cyl 24312
X.28_Cyl 31234
X.36_Cyl 51324
Sum24212233
Ranking of sums3124
Table 14. Optimum levels of parameters for geometric characteristic of patterns.
CharacteristicsA: Layer ThicknessB: Build AngleC: Support DensityD: Touchpoint Size
Flatness_2121
Conc_Step cyl 1-21112
Round_Sphere 1-21212
Angle2111
Parall_Sq 1-21221
Perpend_Sq 1-21211
Y.36_Cyl 12112
Y.28_Cyl 22112
X.28_Cyl 31112
X.36_Cyl 51112
Level 16784
Level 24326
Optimum level1112
Table 15. Optimum values of parameters for dimensional accuracy and geometric characteristic of patterns.
ParametersDimensional AccuracyGeometric Accuracy
LevelValueLevelValue
A: Layer thickness, (μm)125125
B: Build angle, (deg)1010
C: Support density2110.75
D: Touchpoint size10.520.6
Table 16. Casting measurement results for dimensional accuracy, in mm.
DimensionFeaturesNominal ValueAverage Measured ValueRangeAverage Deviation
MaxMin
DiameterD.4_Cyl 1-444.02574.09093.9767−0.0257
D.4_Hole 1-243.84053.93463.57130.1595
D.6_Sph 1-266.01916.11605.9109−0.0191
D.8_Step Cyl 188.00278.03378.0242−0.0027
D.12_Step Cyl 21211.955711.996711.89670.0443
LengthL.6.5_Sq 1-26.56.63156.74826.6723−0.1315
WidthW.4_Sq 1-244.08684.25194.0146−0.0868
HeightH.2.5_Sq 1-22.52.49642.57522.42880.0036
H.5_Sq 1-255.00575.11485.0060−0.0057
Table 17. S/N ratio ranking of parameters for dimensional accuracy of cast parts.
FeatureA: Layer ThicknessB: Build AngleC: Support DensityD: Touchpoint Size
D.4_Cyl 1-44123
D.4_Hole 1-21234
D.6_Sph 1-22143
D.8_Step Cyl 11324
D.12_Step Cyl 22134
L.6.5_Sq 1-24132
W.4_Sq 1-24123
H.2.5_Sq 1-21432
H.5_Sq 1-22143
Sum21152628
Ranking of sums2134
Table 18. Optimum levels of parameters for dimensional accuracy of cast parts.
FeatureA: Layer ThicknessB: Build AngleC: Support DensityD: Touchpoint Size
D.4_Cyl 1-42212
D.4_Hole 1-21111
D.6_Sph 1-21222
D.8_Step Cyl 11112
D.12_Step Cyl 21122
L.6.5_Sq 1-22221
W.4_Sq 1-21221
H.2.5_Sq 1-21122
H.5_Sq 1-22121
Level 16534
Level 23465
Optimum level1122
Table 19. Casting measurement results for geometric characteristics, in mm.
CharacteristicsFeaturesNominal ValueAverage Measured ValueRangeDeviation
MaxMin
FlatnessTop surface00.03310.09030.0167−0.0331
ConcentricityConc_Step cyl 1-200.06670.25790.0090−0.0667
RoundnessRound_Sphere 1-200.01550.04500.0002−0.0155
AngularityAngle4545.418246.958644.1689−0.4182
ParallelismParall_Sq 1-200.08880.22710.0241−0.0888
PerpendicularityPerpend_Sq 1-200.05010.10410.0188−0.0501
PositionY.36_Cyl 13635.869736.099635.63040.1303
Y.28_Cyl 22827.919428.134427.69500.0806
X.28_Cyl 32827.998328.144227.83350.0017
X.36_Cyl 53635.947736.095635.78950.0523
Table 20. S/N ratio ranking of parameters for geometric characteristic of cast parts.
CharacteristicsA: Layer ThicknessB: Build AngleC: Support DensityD: Touchpoint Size
Flatness_1324
Conc_Step cyl 1-22431
Round_Sphere 1-23241
Angle3124
Parall_Sq 1-24132
Perpend_Sq 1-23142
Y.36_Cyl 13142
Y.28_Cyl 22341
X.28_Cyl 34132
X.36_Cyl 51432
Sum26213221
Ranking of sums2131
Table 21. Optimum levels of parameters for geometric characteristic of cast parts.
CharacteristicsA: Layer ThicknessB: Build AngleC: Support DensityD: Touchpoint Size
Flatness2212
Conc_Step cyl 1-22111
Round_Sphere 1-22212
Angle1212
Parall_Sq 1-21121
Perpend_Sq 1-22122
Y.36_Cyl 11111
Y.28_Cyl 21111
X.28_Cyl 31222
X.36_Cyl 51222
Level 16564
Level 24546
Optimum level11 or 212
Table 22. Optimum values of parameters for dimensional accuracy and geometric characteristic of cast parts.
ParametersDimensional AccuracyGeometric Accuracy
LevelValueLevelValue
A: Layer thickness, (μm)125125
B: Build angle, (deg)1010
C: Support density2110.75
D: Touchpoint size20.620.6
Publisher’s Note: MDPI stays neutral with regard to jurisdictional claims in published maps and institutional affiliations.

