Article

Multi-Messenger Radio Frequency and Optical Diagnostics of Pulsed Laser Ablation Processes

by
Mahdieh Samimi
1,2,*,
Hassan Hosseinlaghab
3,
Éanna McCarthy
2,4 and
Patrick J. McNally
1,2
1
School of Electronic Engineering, Dublin City University, Dublin 9, D09 W6Y4 Dublin, Ireland
2
Science Foundation Ireland, I-Form Advanced Manufacturing Research Centre, D09 NR58 Dublin, Ireland
3
Independent Consultancy, Dublin 9, D11 E4A6 Dublin, Ireland
4
School of Mechanical and Manufacturing Engineering, Dublin City University, Dublin 9, D09 W6Y4 Dublin, Ireland
*
Author to whom correspondence should be addressed.
J. Manuf. Mater. Process. 2022, 6(5), 106; https://doi.org/10.3390/jmmp6050106
Submission received: 12 August 2022 / Revised: 10 September 2022 / Accepted: 15 September 2022 / Published: 22 September 2022

Abstract

:
In this report, a novel non-contact, non-invasive methodology for near and quasi real-time measurement of the structuring of metal surfaces using pulsed laser ablation is described. This methodology is based on the use of a multi-messenger data approach using data from Optical Emission Spectroscopy (OES) and Radio Emission Spectroscopy (RES) in parallel. In this research, radio frequency (RF) emission (in the range of 100–400 MHz) and optical emission (200–900 nm) were investigated and acquired in real-time. The RES and OES data were post-processed and visualized using heat maps, and, because of the large data sets acquired particularly using in RES, Principal Component Analysis (PCA) statistics were used for data analysis. A comparison between in-process RES-OES data and post-process 3D images of the different ablated holes generated by a picosecond laser with different powers (1.39 W, 1.018 W, and 0.625 W) on aluminum (Al) and copper (Cu) was performed. The real-time time-series data acquired using the Radio and Optical Emission Spectroscopy technique correlate well with post-process 3D microscopic images. The capability of RES-OES as an in operando near real-time diagnostic for the analysis of changes of ablation quality (cleanliness and symmetry), and morphology and aspect ratios (including the diameter of ablated holes) in the process was confirmed by PCA analysis and heat map visualization. This technique holds great promise for in-process quality detection in metal micromachining and laser-metal base manufacturing.

Graphical Abstract

1. Introduction

The importance of in-process detection is of vital consideration for the understanding and control of laser-based materials processing [1]. The lack of non-invasive and in situ process detection and control acts as a brake on the scale-up of the laser-based ablating and Additive Manufacturing (AM) to industrial levels [2,3,4]. In order to track the ablating or melting process, it is critical to record the morphological changes of surface or melt pool changes, and preferably in real-time.
In order to find an appropriate method, a variety of research has been conducted [1,5]. For example, one in-process method, which can record the removal of material from surfaces, is the combination of a pyrometer and CCD camera. These are expensive options, which also require special alignment systems and cannot illustrate the surface change occurring during ablation or melting [1,6]. In addition, some methods such as contact-based ultrasonic testing can be applied in contact with the surface target and cannot recognize morphological parameters [5]. This technique is, of course, a contact technique by definition. One of the difficulties that cannot yet be solved using non-contact techniques is how to diagnose the morphological changes of the laser-metal interaction during the process. These characteristics can be studied using post-process techniques such as microscopy and profilometer [5]. Thus, there is a need for non-contact in-process measurement techniques for real-time analysis of the development of the surface morphology.
The measurement technique presented in this article includes the capture of RES and OES simultaneously, and in real-time, when the laser interacts with the metal being processed proximal to the ablation. Further details of these will be given below. Quite a number of the quality characteristics of ablated surfaces (e.g., width, depth, cleanliness, symmetry) are related to complex physical-thermal-chemical phenomena [7]. In this work it is demonstrated that one can understand the formation of these characteristics during the process based on the multi-messenger RES-OES approach outlined herein.
The OES and RES techniques have been used separately in previous works in various uses and with different applications [8,9]. However, this work in this paper has significantly different technical arrangements and data analysis approaches. It is the combined application of RES-OES to laser-material interaction systems such as laser ablation that leads to a new approach for in-process analysis of the morphological aspects of the laser-material interaction and outcome. In this work, the novel technique was applied to perpendicular ablation of both copper and aluminum with 1064 nm wavelength light to investigate its application in a typical scenario. While these materials are highly reflective to light in this range and the plasma plume may occlude the ablation site, 1060–1070 nm laser light is commonly applied top-down in additive manufacturing and laser processing [10,11,12,13,14]. The effectiveness of RES-OES in determining the surface quality and changes in geometry in this scenario is reported.

2. Materials and Methods

2.1. Experimental Set-Up

For this investigation, a Q-switched picosecond pulsed 1064 nm Nd:YAG laser, (BrightSolutions 1064 WEDGE HF) was used as the laser ablation source. The repetition rate of the laser was 10 kHz with a 600 ps pulse width and a 140 µm focused beam diameter. The maximum average output power was 1.4 W and, during the experiments, three nominal power levels were used: Maximum power = 1.39 W, Medium Power = 1.018 W and Minimum Power = 0.625 W. This power selection was used to produce different ablated holes in order to correlate their characteristics via RES and OES. These preliminary studies necessarily required numerous compromises, which, of course, did include what equipment was available to us. The process laser beam was kept normal to the metallic surface. This was done in order to ensure the tightest beam diameter possible in order to ensure symmetry across the ablated surface while the materials were removed from the ablated region. If the laser is tilted at an angle other than normal to the surface, then the geometrics of the beam become more complicated (i.e., the tight circular beam now becomes an extended oval, which makes the analysis more complex for a first study). The availability of a 1064 nm wavelength laser turns out to be fortuitous. Since there is a higher level of reflectivity from the surface, this also means that proportionately less energy is absorbed by the metals. This in itself means that the ablation process is relatively weak leading to ablated material which itself is spread out over not too great a volume (i.e., across the surface of the metal and up-and-down sidewalls of the ablation surface). This makes the data analysis more straightforward.

2.2. In-Process Spectroscopy System

The multi-messenger system comprises the simultaneous capture of Radio and Optical Emission Spectroscopy data. A schematic diagram of the experimental arrangement is illustrated in Figure 1. The Radio Emission Spectroscopy (RES) method is comprised principally of a BicoLOG 30100E active antenna (spectral range: 30 MHz–1 GHz) and a Spectrum Analyser (ThinkRF 5550 Spectrum Analyser: 9 kHz–8 GHz, real-time bandwidth (RTBW) up to 100 MHz). The Optical Emission Spectroscopy system contained a collecting lens, fiber optic and spectrometer (Ocean Optics USB2000 Fiber Optic Spectrometer, Oceanview software used). The recording of data with both methods was carried out simultaneously using the control software for each system (Oceanview for OES and RTSA of ThinkRF for RES) on a computer laptop (Latitude 5300 DELL, Intel(R) Core(TM) i7-8665U CPU processor, clock speed 1.90 GHz 2.11 GHz, running Windows 10). A diagram of the experimental setup, the combined RES-OES system, is shown in Figure 1.
The recording was performed from the start of the ablation to the end of the process. The ablating process was conducted for two seconds for each hole and during this time, all parameters of the laser (power, repetition rate and frequency) remained stable. The ablation was performed in air and at atmospheric pressure.
The recorded data was smoothed using the Savitzky–Golay (SG) [15] method and afterward filtered from background noise, and finally they were visualized on Heat Map plots and analyzed by the PCA method. The phases of recording and analyzing data are summarized in the flowchart in Figure 2.

2.3. Heat Map and PCA Method

A heat map is a visual representation of a data matrix that reveals the row and column hierarchical cluster structure at the same time [16]. It uses different colors to indicate the magnitude of each monitoring value. Due to human sensitivities to color, heat maps visualize data in a color-coded format, offering a graphic representation of the data distribution and characteristics at a glance, allowing a fast visual assessment of unusual data features [16,17]. Therefore, heat maps convey complex information clearly and comprehensively at a glance, and this is the reason why they have been utilized for the virtualization of RES-OES data and for the analysis of OES data.
As the RES datasets are large, PCA was applied to find the trends in RF emissions during the recording time (two seconds). PCA involves reducing a data set’s dimensionality to a new data set of “derived variables” that account for decreasing amounts of variance [18]. Through this method, key information can be extracted from the data set. PCA calculations were carried out using Python code in this work. References [19,20,21] provide detailed discussions of the mathematical basis and principal component analysis calculations.

2.4. Post-Process Microscopy

The nature of the ablated laser micro-holes was studied using a VHX-2000 (Keyence) 3D Optical Microscope. Images were taken at three magnifications, ×500, ×1000 and ×2000, which were changed according to size of the holes.
After collecting this in-process and post-process data and analyzing them, comparisons between changes in the RES-OES data and morphological characteristics were carried out in order to elucidate a useful correlation with the morphology of the ablated surface in-process.

2.5. Materials

In order to investigate different types of laser hole morphology, the data were recorded for the three nominal laser output powers (Maximum power = 1.39 W, Medium Power = 1.018 W, and Minimum Power = 0.625 W) using elemental aluminum and copper sheets. Aluminum sheet (485-515-573 1050 A standard—99.5% purify) with 1.2 mm thickness and Copper sheet (BS2874/C101 standard—99.9% purify) with 0.35 mm thickness were used in these experiments.

3. Results and Discussion

The result package of measurements investigated in this study includes in-process records (RES-OES) and post-process 3D images of the surface morphology of holes ablated on untreated Al and Cu. Figure 3 shows an example of this package.
The visualized and analyzed in-process measurements results, Heat Map and PCA outputs, respectively, were compared with the post-process microscopic images in order to find out what quality and morphological aspects of the ablation process can be diagnosed and detected with the new technique.
The next sections will discuss the physics of plasma plumes in the ablation process, followed by details of the statistical correlations between RES-OES and the morphologies of the ablated holes.

3.1. Physical Phenomena of Plasma Plumes

On the macroscopic scale, when high-energy laser (picosecond laser) pulses interact with the surface, most of the laser energy (nhν where n is the number of photons, h is Planck’s constant and ν is the laser frequency) is received by the first layer(s) of atoms located at the surface (Figure 4) and a plasma is formed. Therefore, ions and an increased density of higher-energy electrons absorb more energy, and their temperature increases, which leads to minimum Boltzmann factor (∆E/kT), where ∆E is differential energy of upper level and lower levels, k is the Boltzmann constant and T is the temperature according to the Boltzmann distribution law [22]. Thus, according to the Boltzmann distribution N2 = N1e(−E/kT), where N1 is the number of electrons in the ground level (lower level) and N2 is electron in the excitation level (higher level), the largest population of ne and ni (number of electrons and ions in plasma, respectively) will be produced over the first layer or so. When the density of electrons/ions at a certain point rises above the uniform background, their forward and backward motion across an equilibrium position defined by Coulomb forces results in an ion plasma frequency (ωpi = [(nie2)/(miɛ0)]1/2), which is dependent on ni, electron charge (e), and ion mass (mi) [23].
The electrons and ions of the lower layers (shown in Figure 4) receive less energy from the laser, leading to a lower kT and, thus, a higher ∆E/kT ratio. Therefore, the population of ne and ni is decreased, and this process repeats for the next lower level again until the temperature of the layer reaches the melting point temperature. Because the melted material is denser than gas, this fluid can transfer thermal energy to neighboring atoms, electrons, ions, and neutral atoms and, thus, create a melt pool. Herein, because of temperature decreases, the ratio of ∆E/kT increases in comparison to the higher layers. Consequently, in this stage, the numbers of electrons and ions are less than the upper layer with lower energy, and, accordingly, ωpi begins to decrease. Different intensities of ωpi are generated during this period of time. These frequencies tend to occur in the 100–500 MHz range for “normal” operating conditions. The aforementioned discussion applies to ωpe as well.
High temperatures lead to higher collision rates, which in turn lead to vaporized material containing neutral atoms, ions, electrons, particle ejection, etc., which is commonly called a laser-produced plasma plume, and it expands away from the melting pool surface [24,25,26,27]. The melted particles with the pressure of the plasma plume are ejected from the hole (laser-metal interaction) point, and these particles have oscillation frequencies associated with the range of ωpi frequencies previously mentioned.

3.2. Correlation/Relationships of RES with Quality and Morphology Characteristics of Ablated Surfaces

Some of the generated ion plasma frequencies, which are discussed above, are damped in the hole and cannot be received by a radio frequency antenna but the particles ejected from inside of the hole can be detected by the antenna via its associated ωpi frequency. During the ablation process, the ejected particles from the hole are accumulated on the edge of the crater or expand on the surface (Figure 5 and Figure 6c1–c3). They produce debris on the surface around the ablated hole. Thus, it is expected that processes related to this ejecta can be monitored by RES. Examples include debris on the surface and expansion of particles on the surface from the edge of the crater (which form the effective diameter of the hole) to more distant locations on the surface.
Depending on the different parameters which impact the interaction of the laser with the metal (laser power, metal surface roughness, metal surface slope, air pressure, to name a few), the laser ablation process leads to surfaces with wider or narrow aspect ratios, deeper or shallower holes, etc. Altogether, all these changes can be more easily discerned on Heat Maps (see Figure 5 and Figure 6).
A straightforward time-series method is used to identify the morphological developments on the metal surfaces during laser-metal interaction. During data recording, the range of emitted ωpi radio frequency energy can be recognized by RES for each 59 ms time segment across the typical 2 s in each experiment. PCA analysis of the spectra is used to identify the main trends in this regard. The PCA data reveal statistically significant clustering which correlates well with the metal surface morphology changes induced by the laser-metal ablation interaction. These are illustrated in Figure 5 and Figure 6, which show, respectively, the RES Heat Maps, the PCA data analysis, and data from 3D microscopy of the ablated regions at the end of the ablation process. The chief aim of using the PCA method in this step is to non-invasively and non-destructively evaluate the quality of the hole and the proportional changes of the hole features.
By comparing these PCA results (including sections b in Figure 5 and Figure 6 for Al and Cu, respectively) and 3D microscopic images (sections c and d in Figure 5 and Figure 6), the relationship/correlation is observable. In brief, when the PCA data shows clustering of points, e.g., Figure 5b1 and Figure 6b2 it appears that the laser produces a much cleaner (i.e., less debris surrounding the ablated hole) and a more symmetrical hole (see Figure 5c1,d1 and Figure 6c2,d2). In contrast, if the PCA data clustering is not present, then the ablated holes are surrounded with more debris on the surface (Figure 5b2 and Figure 6b1), and a much more asymmetrical ablation (see Figure 5c2,d2 and Figure 6c1,d1).
In order to tabulate this, a cleanliness factor can be defined, α, which can be described as follows:
α = tan 1 ( Height   of   debris Width   of   debris )
If a cleaner ablation surface is formed, then angle α is smaller, and there is a greater correlation of RES spectra confirmed via PCA and vice versa (see sections b1–b3) and (c1–c3) of Figure 5 and Figure 6, respectively). For assistance with visualization, further perspectives of the PCA figures can be found in Appendix A. The measured values of α obtained from the 3D microscopic images are shown in (c1–c3) of Figure 5 and Figure 6. More details with respect to the analysis of α are illustrated in Appendix B.
In addition, PCA can highlight deviations from symmetry as the ablated hole is forming. For example, the greater the RES correlation within the PCA data, the more symmetrical is the ablated hole (see Figure 5b1,d1 and Figure 6b2,d2).
Accordingly, there is a clear relationship between the RES data and the quality (cleanliness and symmetry) of the ablated holes (Figure 5 and Figure 6). One can observe this ability to discriminate for cleanliness and symmetry most easily in Figure 5, where Figure 5b1 shows the data for a clean and more symmetrical hole. There is decreasing cleanliness (i.e., more debris) and increasing asymmetry observable in Figure 5b3 and this is observably worse in Figure 5b2. This evolution of cleanliness and symmetry of the ablated hole is also observable in Figure 6b1–b3 in sequence.
For a more precise metric, the clustering of the PCA points has been statistically analyzed, and the salient features of this clustering can be captured using numerical measures that show the tightening and widening of the clusters in PCA outputs (Figure 7 and Figure 8).
In our analysis, the condensed clusters were found and the maximum number of points making up each cluster determined. The condensed clusters were found based on the DBSCAN algorithm [28]. In this method, an undefined number of clusters of undefined shape are identified by finding points that are within a specific neighborhood distance of each other. The minimum number of points for the clusters was set to two in this work. Based on these statistical measurements, a correlation between the statistical significance of the PCA data itself to the morphology/cleanliness has been found. It is found that when clustering is greater for better-ablated holes, the number of points in the cluster increase, and even the number of clusters with the same maximum points grows (see Figure 7 and Figure 8). A noted previously, for further clarity, different perspectives of the PCA figures are shown in Appendix A.
To arrange the PCA plots in Figure 7 and Figure 8, the maximum points of clusters were compared, and, if the maximum points of clusters were the same, the number of clusters was calculated to evaluate the tighter spreads of PCA points. This definition is presented in the bracket format (Maximum points in clusters, number of clusters). This sequence shows that the greater the cohesion between PCA points, the cleaner and more symmetric ablated hole are produced (see Figure 5 and Figure 7 for Al and Figure 6 and Figure 8 for Cu).
Finally, the Diameter of Hole (DoH), a significant geometrical parameter of the ablated hole quality, can also be recognized by RES. The dispersion of points (spectra) in the PCA analysis of RES confirms a correlation with the changes of DoH (becoming larger or smaller), see sections (b) and (c) of Figure 5 and Figure 6. If the PCA data shows greater dispersion, then a hole with a greater DoH is formed on the surface.
In summary, with respect to the aforementioned descriptive parameters which RES can diagnose/track, when the data points on the PCA analysis are less clustered, the ablated hole ablation is of lower quality (more surface debris, more expansion on the surface, wider hole diameter, less clean, less symmetry) and vice versa.

3.3. Relation of OES with Morphological Characteristics of the Ablated Surface

From an optical spectroscopy viewpoint, the optical emission from the ablation site, where the laser interacts with the metal, can be received by the collecting lens. As the collecting lens port is located at a specific angle and distance from the laser ablating point (approximately 45° and 2 mm in this experiment), it has a relatively low acceptance angle and, therefore, can receive limited spherical radiation. If the hole ablated is deeper, and the laser interacts with the material inside of the hole, the light will be reflected and refracted in the hole and cannot be recorded from outside of the hole. Thus, when the ablation goes deeper into the hole the high-intensity radiation falls off in intensity rather quickly, as indicated by the shape of the red regions (maximum OES intensity) on the Heat Maps of Figure 9a3 and Figure 10a2, for example. In this case, the inside wall of the hole acts as a barrier, so any optical radiation cannot be readily recorded. In addition, when the ablating point is expanding on the surface, more radiation is received by the collecting lens leading to an observed increase in the high-intensity red regions on the OES Heat Maps (see Figure 9a2 and Figure 10a1). Therefore, changes to the depth and width (diameter) of ablated holes can be recognized by OES. This is confirmed by an analysis of those parameters in the microscopic images and, in particular, by observing the surface undulations using a stylus profilometer.
Consequently, the length of time of the most intense OES emission (which reaches a maximum just below an emission wavelength (λ) of 500 nm) has a direct empirical relationship with the width of ablation and an inverse relation with the depth of the hole. In order to describe this phenomenon, a parameter r is defined as follows, which was calculated for each hole using the profilometer data, as shown in Figure 9 and Figure 10.
r = (Width of hole)/(Height or depth of hole)
A larger r means that a higher intensity of optical emissions is recorded for a longer time and vice versa. For example, in Figure 9 the OES emission intensity at λ ≈ 500 nm remains longer in (a2), followed in longevity by (a1) and the shortest is (a3), which correlate well with the profilometer measurements. Figure 11 illustrates r vs. this longevity of OES for λ ≈ 500 nm. Therefore, OES can reveal information on the geometrical aspects of the ablated hole.
Finally, by way of further confirmation, a summary of the correlation between DoH, α and the PCA statistical clustering factor (Maximum points in clusters, number of clusters) from RES is shown in Figure 12. These confirm the efficacy of the combined multi-messenger RES-OES approach towards understanding and ultimately predicting the outcome of laser-surface ablation processes.

4. Conclusions

A novel in-process Multi-Messenger Methodology (RES-OES) was used to study the quality of the morphology of laser-material interactions. An example of this is the laser ablation process wherein a high-power laser beam (picosecond laser) imparts optical and thermal energy into the surface regions of a sample material causing it to be removed. The RES method can record the spectra of ion plasma frequencies associated with the removal process of ejected surface materials, and OES can measure the optical emission spectra in the 200–900 nm wavelength range for of this interaction.
The possibility of using RES-OES as a multi-messenger non-contact, in situ and in operando means for the recognition of quality and morphological aspects of the ablation point was demonstrated and analyzed. These characteristics which can be recognized by RES-OES for different trial metal sheets, i.e., Al, Cu, using by Heat Map and PCA analysis of the RES-OES data. The specific relations that can be elucidated include:
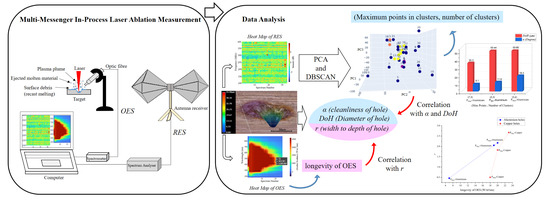
  • Finished Surface Quality: Correlation of ablated surface cleanliness and symmetry of ablated holes with RES data;
  • Variation in Ablated Hole Uniformities Changes of the height/depth of hole, and the Diameter of Hole (DoH) using a combination of OES and RES data.

5. Patents

Patent Application was filed on 25 July 2022 based on this work.

Author Contributions

Conceptualization, M.S., H.H. and P.J.M.; Formal analysis, M.S., H.H. and É.M.; Investigation, M.S.; Methodology, M.S. and H.H.; Software, M.S. and É.M.; Supervision, P.J.M.; Validation, M.S.; Writing—original draft, M.S.; Writing—review & editing, M.S. and P.J.M. All authors have read and agreed to the published version of the manuscript.

Funding

This publication has emanated from research supported by a research grant from Science Foundation Ireland (SFI) under Grant Number 16/RC/3872 and is co-funded under the European Regional Development Fund.

Data Availability Statement

The data presented in this study are available on request from the corresponding author and not publicly available due to the data forms part of an ongoing study.

Acknowledgments

The authors acknowledge the Nano Research Facility in Dublin City University for the 3D microscopy.

Conflicts of Interest

The authors declare no conflict of interest.

Appendix A

Figure A1. A series of differing perspectives for the PCA analysis of Figure 5b.
Jmmp 06 00106 g0a1
Figure A2. A series of differing perspectives for the PCA analysis of Figure 6b.
Jmmp 06 00106 g0a2
Figure A3. A series of differing perspectives for the PCA analysis of Figure 7): (a) PMax-Aluminum; (b) PMin-Aluminum; and (c) PMed-Aluminum.
Jmmp 06 00106 g0a3
Figure A4. A series of differing perspectives for the PCA analysis of Figure 8. (a) PMed-Copper; (b) PMin-Copper; and (c) PMax-Copper.
Jmmp 06 00106 g0a4

Appendix B

Figure A5. Additional 3D microscopy images used to measure α values Figure 5c. (c1) PMax-Aluminum; (c2) PMed-Aluminum; and (c3) PMin-Aluminum.
Jmmp 06 00106 g0a5
Figure A6. Additional 3D microscopy images used to measure α Figure 6c. (c1) PMax-Copper; (c2) PMed-Copper; and (c3) PMin-Copper.
Jmmp 06 00106 g0a6

References

  1. Purtonen, T.; Kalliosaari, A.; Salminen, A. Monitoring and adaptive control of laser processes. Phys. Procedia 2014, 56, 1218–1231. [Google Scholar] [CrossRef]
  2. Grasso, M.; Colosimo, B.M. Process defects and in situ monitoring methods in metal powder bed fusion: A review. Meas. Sci. Technol. 2017, 28, 044005. [Google Scholar] [CrossRef]
  3. Spears, T.G.; Gold, S.A. In-process sensing in selective laser melting (SLM) additive manufacturing. Integr. Mater. Manuf. Innov. 2016, 5, 16–40. [Google Scholar] [CrossRef]
  4. Everton, S.K.; Hirsch, M.; Stravroulakis, P.; Leach, R.K.; Clare, A.T. Review of in-situ process monitoring and in-situ metrology for metal additive manufacturing. Mater. Des. 2016, 95, 431–445. [Google Scholar] [CrossRef]
  5. Sharratt, B.M. Non-Destructive Techniques and Technologies for Qualification of Additive Manufactured Parts and Processes; Sharratt Research and Consulting Inc.: Victoria, BC, Canada, 2015. [Google Scholar]
  6. Bayle, F.; Doubenskaia, M. Selective laser melting process monitoring with high speed infra-red camera and pyrometer. In Fundamentals of Laser Assisted Micro-and Nanotechnologies; International Society for Optics and Photonics: Bellingham, WC, USA, 2008; Volume 6985, p. 698505. [Google Scholar] [CrossRef]
  7. Dowding, C. Laser ablation. In Advances in Laser Materials Processing; Elsevier: Amsterdam, The Netherlands, 2010; pp. 575–628. [Google Scholar] [CrossRef]
  8. Lough, C.S.; Escano, L.I.; Qu, M.; Smith, C.C.; Landers, R.G.; Bristow, D.A.; Chen, L.; Kinzel, E.C. In-situ optical emission spectroscopy of selective laser melting. J. Manuf. Process. 2020, 53, 336–341. [Google Scholar] [CrossRef]
  9. Kelly, S.; McNally, P.J. Remote sensing of a low pressure plasma in the radio near field. Appl. Phys. Express 2017, 10, 096101. [Google Scholar] [CrossRef]
  10. Ekoi, E.J.; Degli-Alessandrini, G.; Zeeshan Mughal, M.; Vijayaraghavan, R.K.; Obeidi, M.A.; Groarke, R.; Kraev, I.; Krishnamurthy, S.; Brabazon, D. Investigation of the microstructure and phase evolution across multi-material Ni50.83Ti49.17-AISI 316L alloy interface fabricated using laser powder bed fusion (L-PBF). Mater. Des. 2022, 221, 110947. [Google Scholar] [CrossRef]
  11. McCann, R.; Hughes, C.; Brabazon, D. Laser Powder Bed Fusion of Aluminium Alloy 6061 for Ultra-High Vacuum Applications. Key Eng. Mater. 2022, 926, 242–249. [Google Scholar] [CrossRef]
  12. Marimuthu, S.; Dunleavey, J.; Liu, Y.; Smith, B.; Kiely, A.; Antar, M. Characteristics of hole formation during laser drilling of SiC reinforced aluminium metal matrix composites. J. Mater. Process. Technol. 2019, 271, 554–567. [Google Scholar] [CrossRef]
  13. Ancona, A.; Röser, F.; Rademaker, K.; Limpert, J.; Nolte, S.; Tünnermann, A. High speed laser drilling of metals using a high repetition rate, high average power ultrafast fiber CPA system. Opt. Express 2008, 16, 8958–8968. [Google Scholar] [CrossRef] [PubMed]
  14. Grupp, M.; Reinermann, N. Copper Welding with High-Brightness Fiber Lasers. Laser Tech. J. 2017, 14, 25–29. [Google Scholar] [CrossRef]
  15. Vivó-Truyols, G.; Schoenmakers, P.J. Automatic Selection of Optimal Savitzky−Golay Smoothing. Anal. Chem. 2006, 78, 4598–4608. [Google Scholar] [CrossRef] [PubMed]
  16. Wilkinson, L.; Friendly, M. The history of the cluster heat map. Am. Stat. 2009, 63, 179–184. [Google Scholar] [CrossRef]
  17. Kellom, M.; Raymond, J. Using dendritic heat maps to simultaneously display genotype divergence with phenotype divergence. PLoS ONE 2016, 11, e0161292. [Google Scholar] [CrossRef] [PubMed]
  18. Abdi, H.; Williams, L.-J. Principal component Analysis. Wiley Interdiscip. Rev. Comput. Stat. 2010, 2, 433–459. Available online: https://www.google.com/search?q=Abdi+H%2C+Williams+L-J.+2010.+Principal+component+Analysis.Wiley+Interdisciplinary+Reviews%3A+Computational+statistics%2CVol.+2&rlz=1C1GCEB_enIE876IE876&sourceid=chrome&ie=UTF-8 (accessed on 13 April 2022). [CrossRef]
  19. Green, P.E. Analzing Multivariate Data; Hinsdale Ill; The Dryden Press: New York, NY, USA, 1978. [Google Scholar]
  20. Brereton, R.G. Chemometrics: Data Analysis for the Laboratory and Chemical Plant; John Wiley & Sons: Hoboken, NJ, USA, 2003. [Google Scholar]
  21. Massart, D.; Vandeginste, B.M.; Deming, S.N.; Michotte, Y.; Kaufman, L. Chemometrics: A Textbook; Vol. 2 in: Data Handling in Science and Technology; Elsevier, Vrije Universiteit Brussel: Brussels, Belgium, 1988; ISBN 0-444-42660-4. [Google Scholar]
  22. Dendy, R.O. Plasma Physics: An Introductory Course; Cambridge University Press: Cambridge, UK, 1995. [Google Scholar]
  23. Bittencourt, J.A. Fundamentals of Plasma Physics; Springer Science & Business Media: New York, NY, USA, 2004. [Google Scholar]
  24. Rafique, M.S.; Khaleeq-Ur-Rahman, M.; Anwar, M.S.; Ashfaq, F.M.A.; Siraj, K. Angular distribution and forward peaking of laser produced plasma ions. Laser Part. Beams 2005, 23, 131–135. [Google Scholar] [CrossRef]
  25. Franghiadakis, Y.; Fotakis, C.; Tzanetakis, P. Energy distribution of ions produced by excimer-laser ablation of solid and molten targets. Appl. Phys. A 1999, 68, 391–397. [Google Scholar] [CrossRef]
  26. Krása, J.; Láska, L.; Rohlena, K.; Pfeifer, M.; Skála, J.; Králiková, B.; Straka, P.; Woryna, E.; Wolowski, J. The effect of laser-produced plasma expansion on the ion population. Appl. Phys. Lett. 1999, 75, 2539–2541. [Google Scholar] [CrossRef]
  27. Fukushima, K.; Kanke, Y.; Badaye, M.; Morishita, T. Velocity distributions of ions in the ablation plume of a Y1Ba2Cu3Ox target. J. Appl. Phys. 1995, 77, 5406–5410. [Google Scholar] [CrossRef]
  28. Ester, M.; Kriegel, H.-P.; Sander, J.; Xu, X. A density-based algorithm for discovering clusters in large spatial databases with noise. In Proceedings of the Second International Conference on Knowledge Discovery and Data Mining (KDD-96), Portland, OR, USA, 2–4 August 1996; Volume 96, pp. 226–231. [Google Scholar]
Figure 1. A diagram of the experimental setup.
Jmmp 06 00106 g001
Figure 2. Diagram/flowchart of in-process techniques to find the correlation between recorded data and microscopic images.
Jmmp 06 00106 g002
Figure 3. In-process visualization of (a) OES Heat Map and (b) RES Heat Map and (c) post-process microscopic images. For the OES heat maps and RES heat maps 25 and 34 spectra were taken across 2 s of ablation time, so each “spectrum number” corresponds to a period time of approximately 80 ms and 59 ms, respectively.
Jmmp 06 00106 g003
Figure 4. Schematic representation of the effect of a single laser pulse on a metal surface colored by red, yellow and blue, respectively, representing higher temperatures in the upper layers and lower temperatures in subsequent layers.
Jmmp 06 00106 g004
Figure 5. (a1a3): RES heat map; (b1b3): PCA of RES (where x: first principal component, y: second principal component and z: third principal components of PCA analysis); (c1c3): “Up-side” of Microscopic images; (d1d3): “Down-side “of Microscopic images. 1: Maximum laser Power, 2: Medium laser Power, and 3: Minimum laser Power to the Aluminum target.
Jmmp 06 00106 g005
Figure 6. (a1a3): RES heat map; (b1b3): PCA of RES (where x: first principal component, y: second principal component and z: third principal components of PCA analysis); (c1c3): “Up-side” of Microscopic images; (d1d3): “Down-side “of Microscopic images. 1: Maximum Power of laser, 2: Medium Power, and 3: Minimum Power of laser to the Copper target.
Jmmp 06 00106 g006
Figure 7. PCA clustering arranged according to the maximum points in their clusters identified by DBSCAN for Al from tighter (a) to wider (c): (a) PMax-Aluminum; (b) PMin-Aluminum; and (c) PMed-Aluminum where PC1: first principal component; PC2: second principal component; and PC3: third principal component of PCA analysis. The different colored dots (yellow, orange and purple) regarding founded clusters by DBSCAN and the numbers in red: (Maximum points in clusters, number of clusters) of these clusters.
Jmmp 06 00106 g007
Figure 8. PCA clustering arranged according to the maximum points in their clusters identified by DBSCAN for Cu from tighter (a) to wider (c): (a) PMed-Copper; (b) PMin-Copper; and (c) PMax-Copper where PC1: first principal component; PC2: second principal component; and PC3: third principal component of PCA analysis. The different colored dots (yellow, orange and purple) regarding founded clusters by DBSCAN and the numbers in red: (Maximum points in clusters, number of clusters) of these clusters.
Jmmp 06 00106 g008
Figure 9. OES spectra of laser-aluminum interaction. (a1a3): Heat map of OES; (b1b3): profilometer data from 3D microscope; 1: Maximum Power; 2: Medium Power; and 3: Minimum Power of laser.
Jmmp 06 00106 g009
Figure 10. OES spectra of laser-copper interaction. (a1a3): Heat-map of OES; (b1b3): profilometer data from 3D microscope; 1: Maximum Power; 2: Medium Power; and 3: Minimum Power of laser.
Jmmp 06 00106 g010
Figure 11. Summary of OES analysis: r factor (depth and width of crater) vs. longevity of λ ≈ 500 nm OES emission.
Jmmp 06 00106 g011
Figure 12. Summary of RES analysis: DoH and α parameters and statistical cluster factors from the PCA analysis of the RES data.
Jmmp 06 00106 g012
Publisher’s Note: MDPI stays neutral with regard to jurisdictional claims in published maps and institutional affiliations.

