
Physical Simulation of Laser Surface Treatment to Study Softening Effect on Age-Hardened Aluminium Alloys

Abstract
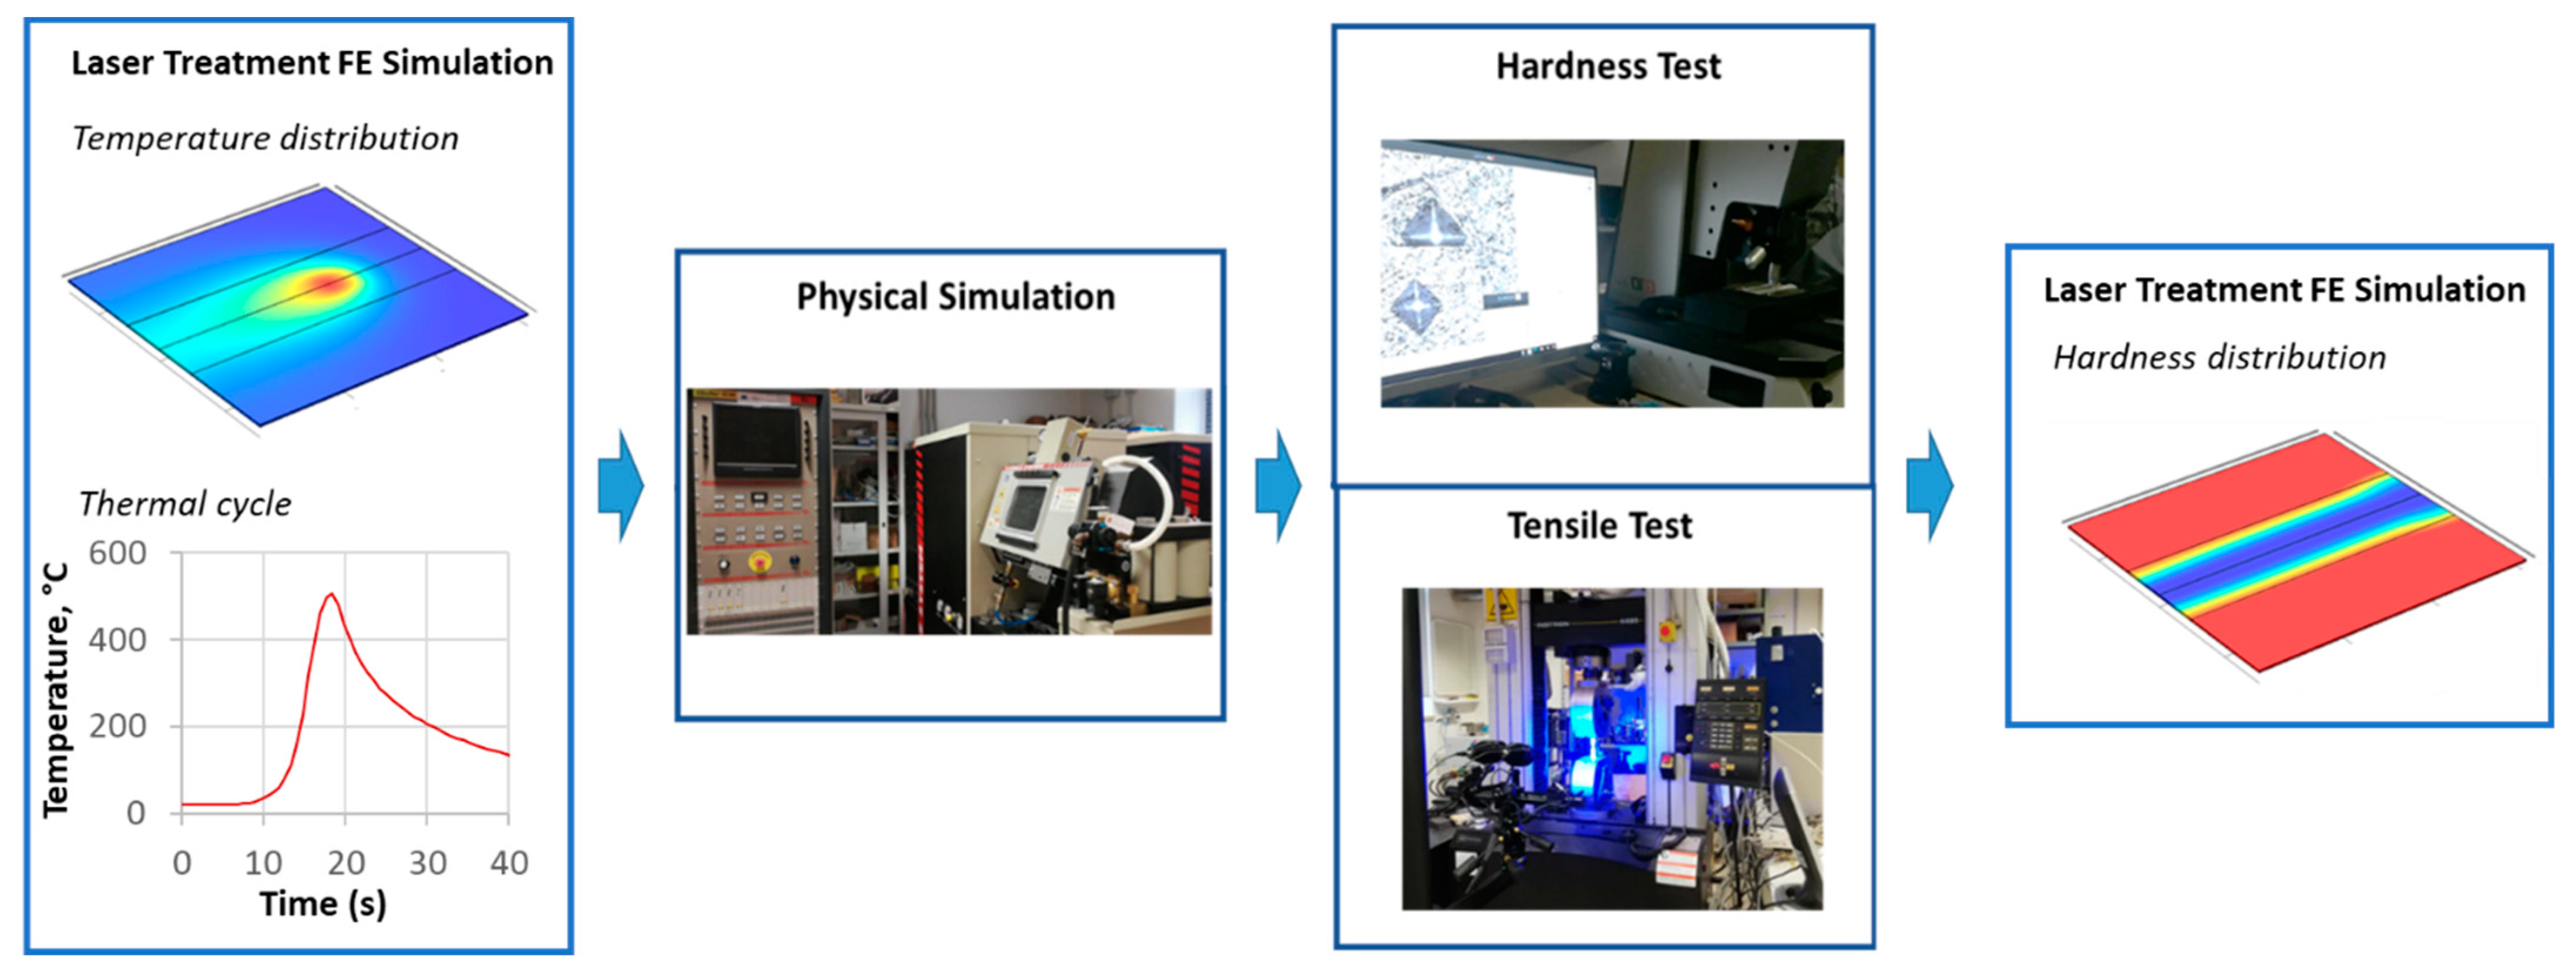
:1. Introduction
2. Materials and Methods
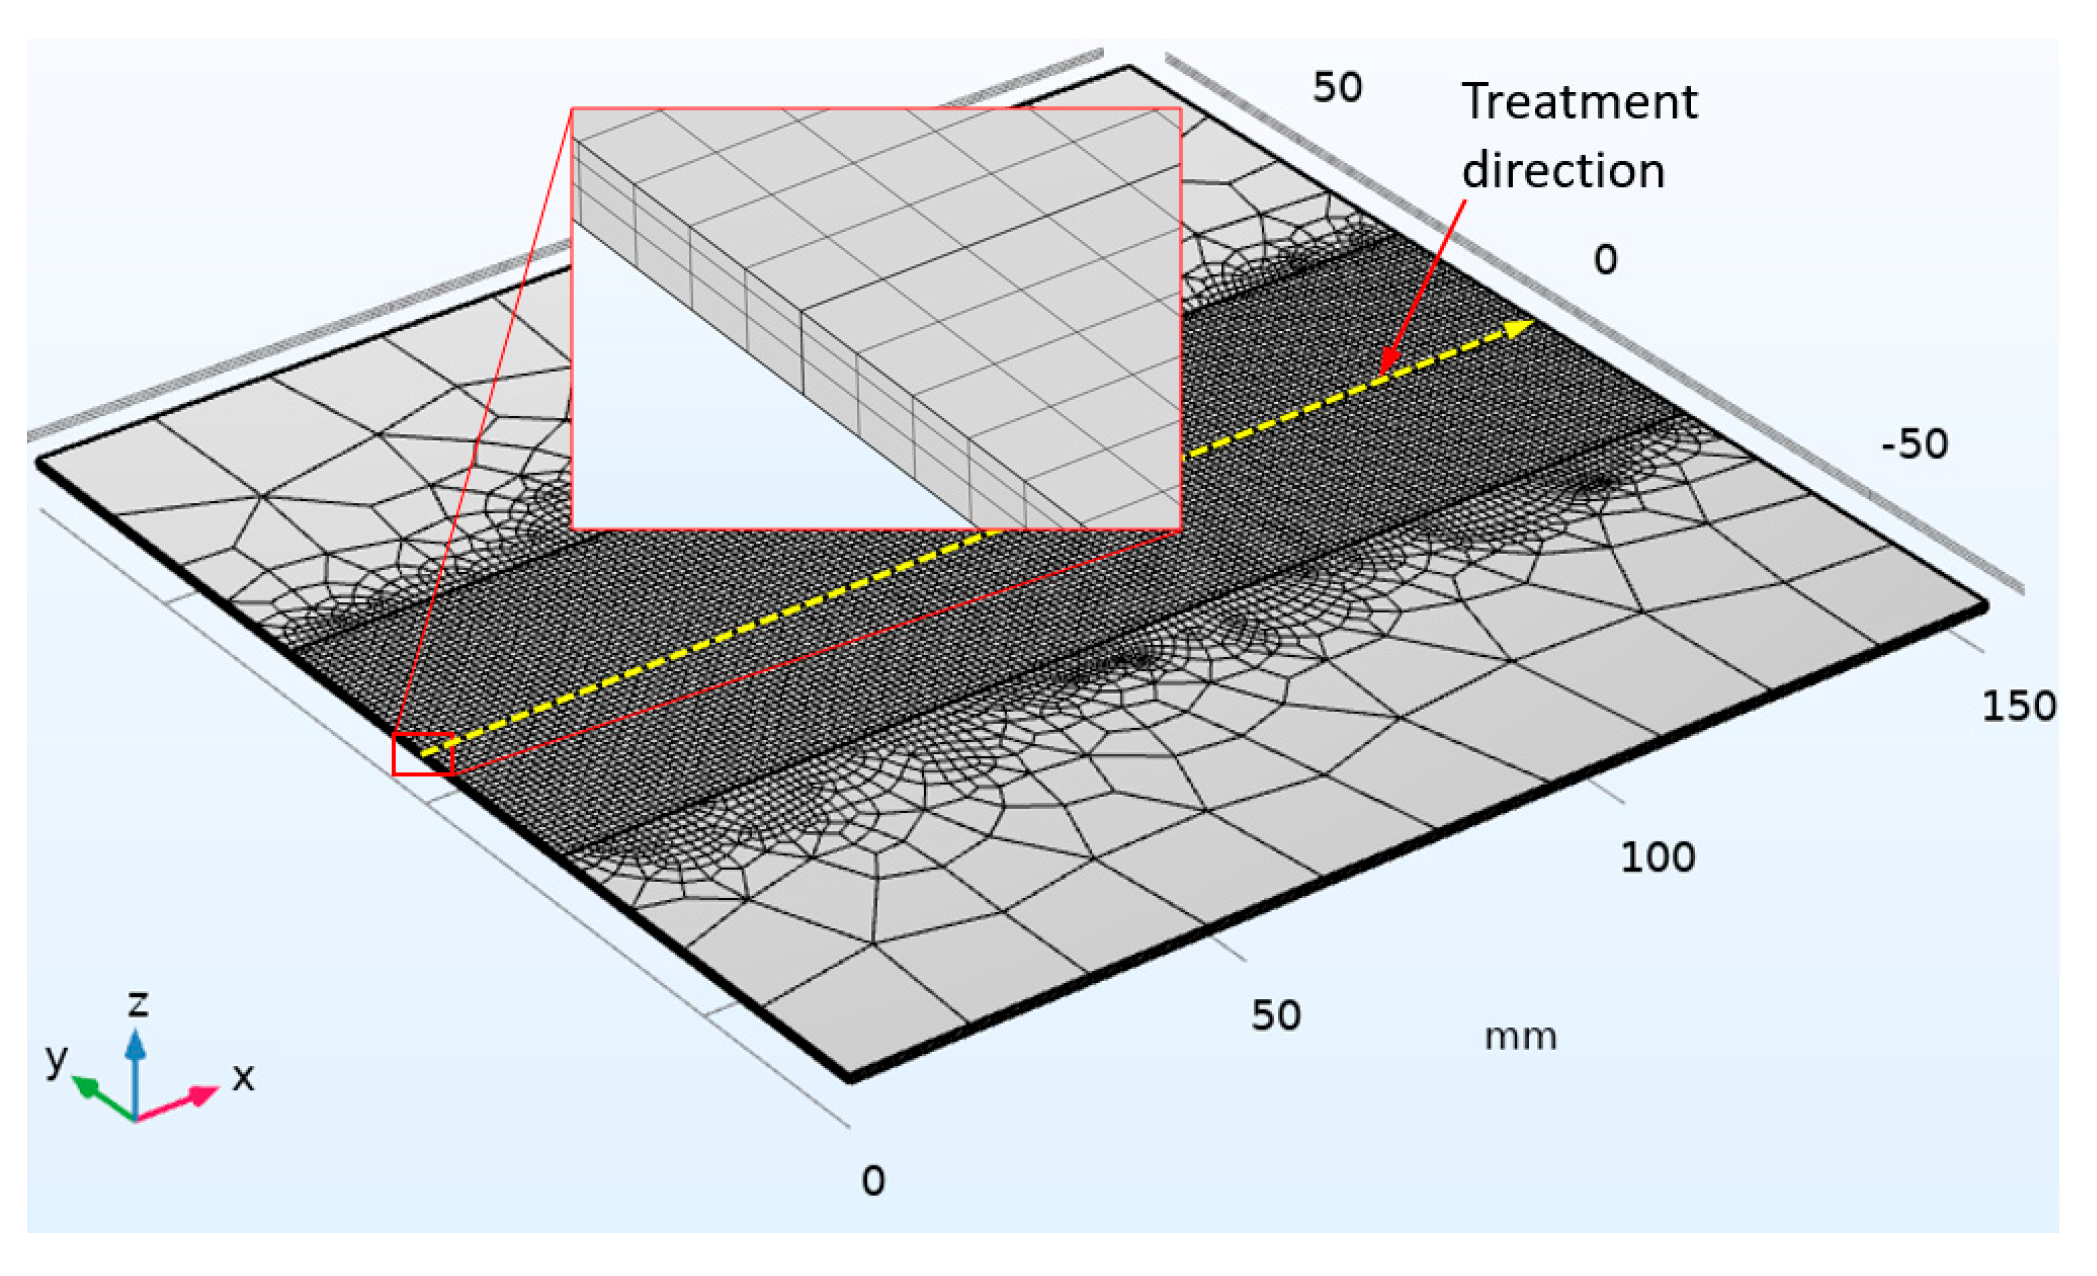
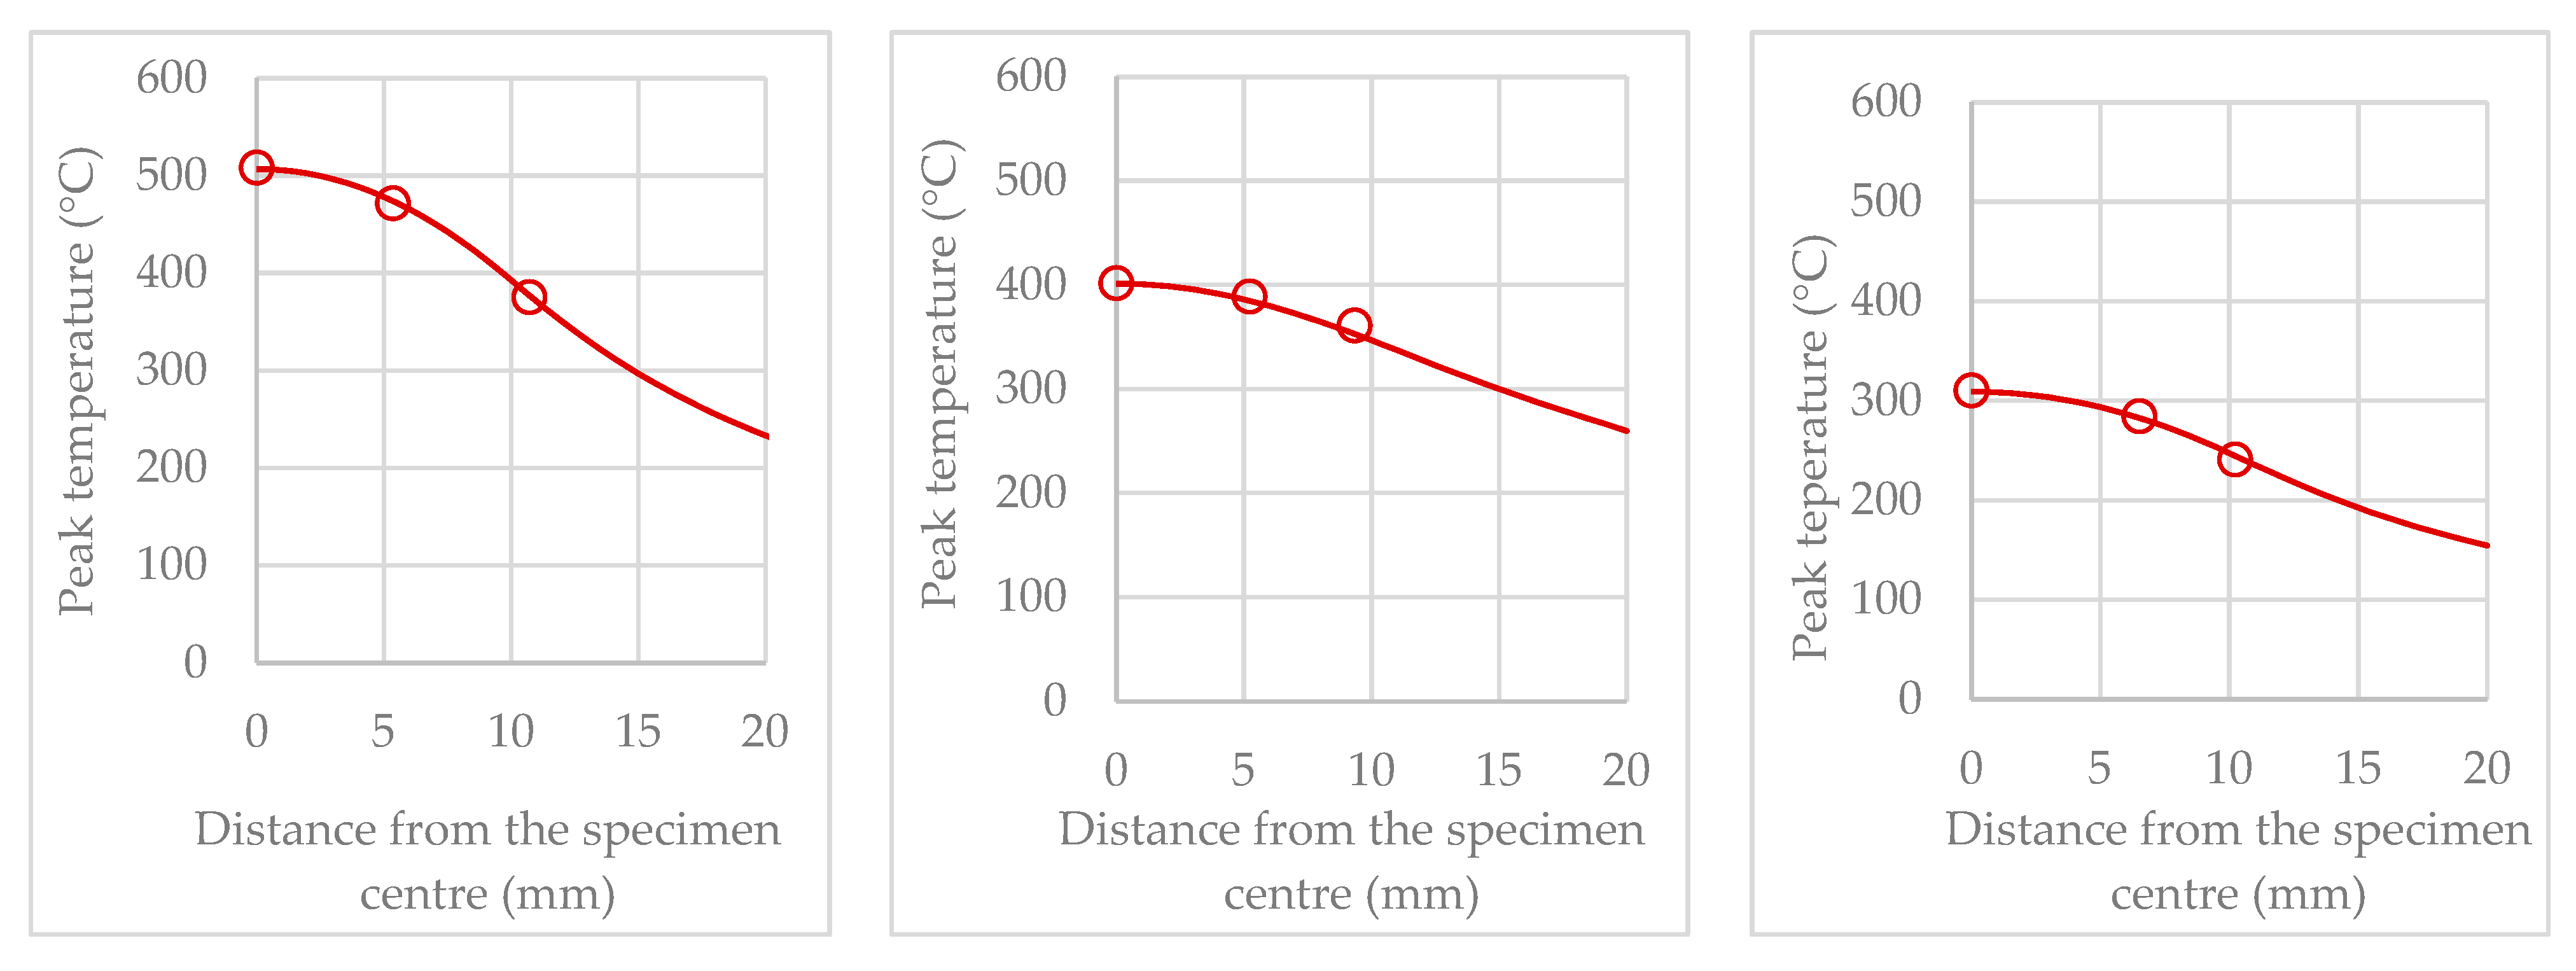
2.1. FE Model of the LHT and Definition of Investigated Laser Thermal Cycles
2.2. Physical Simulation of LHT
2.3. Hardness Tests on Tapered Specimen for Softening Investigation
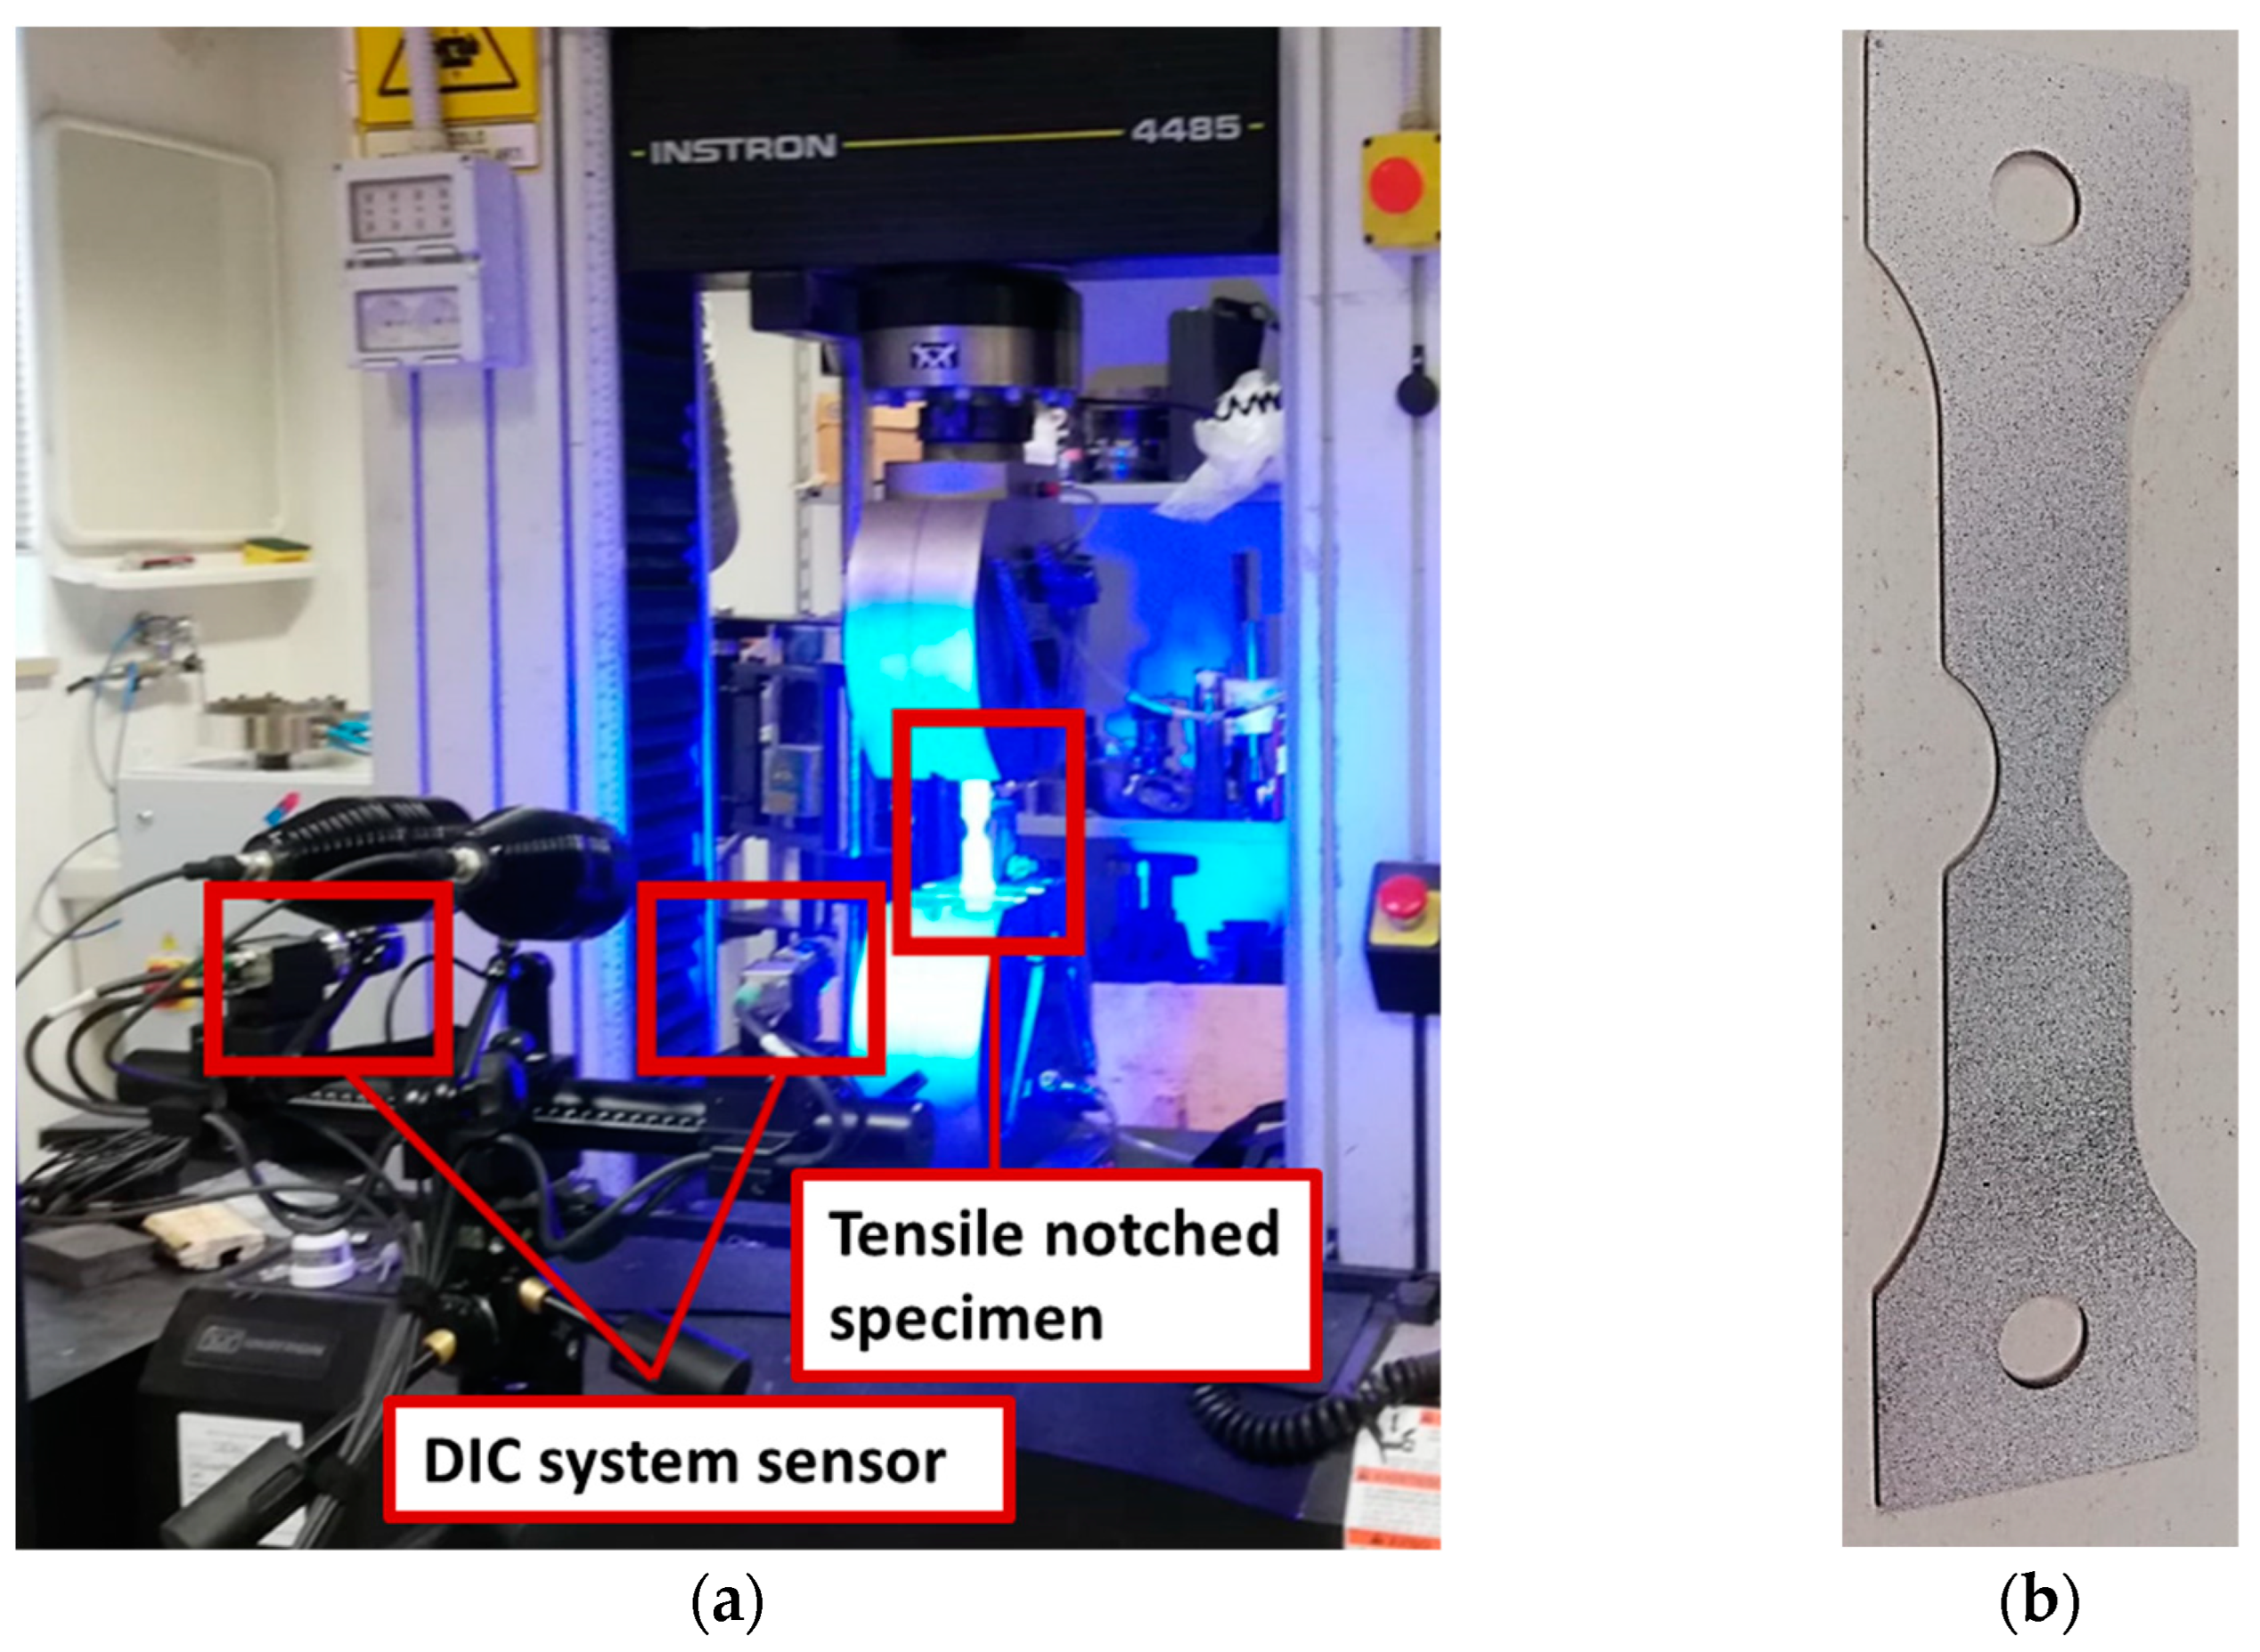
2.4. Tensile Tests on Notched Specimen for Deformability Investigation
3. Results and Discussion
3.1. Physical Simulation Test Results
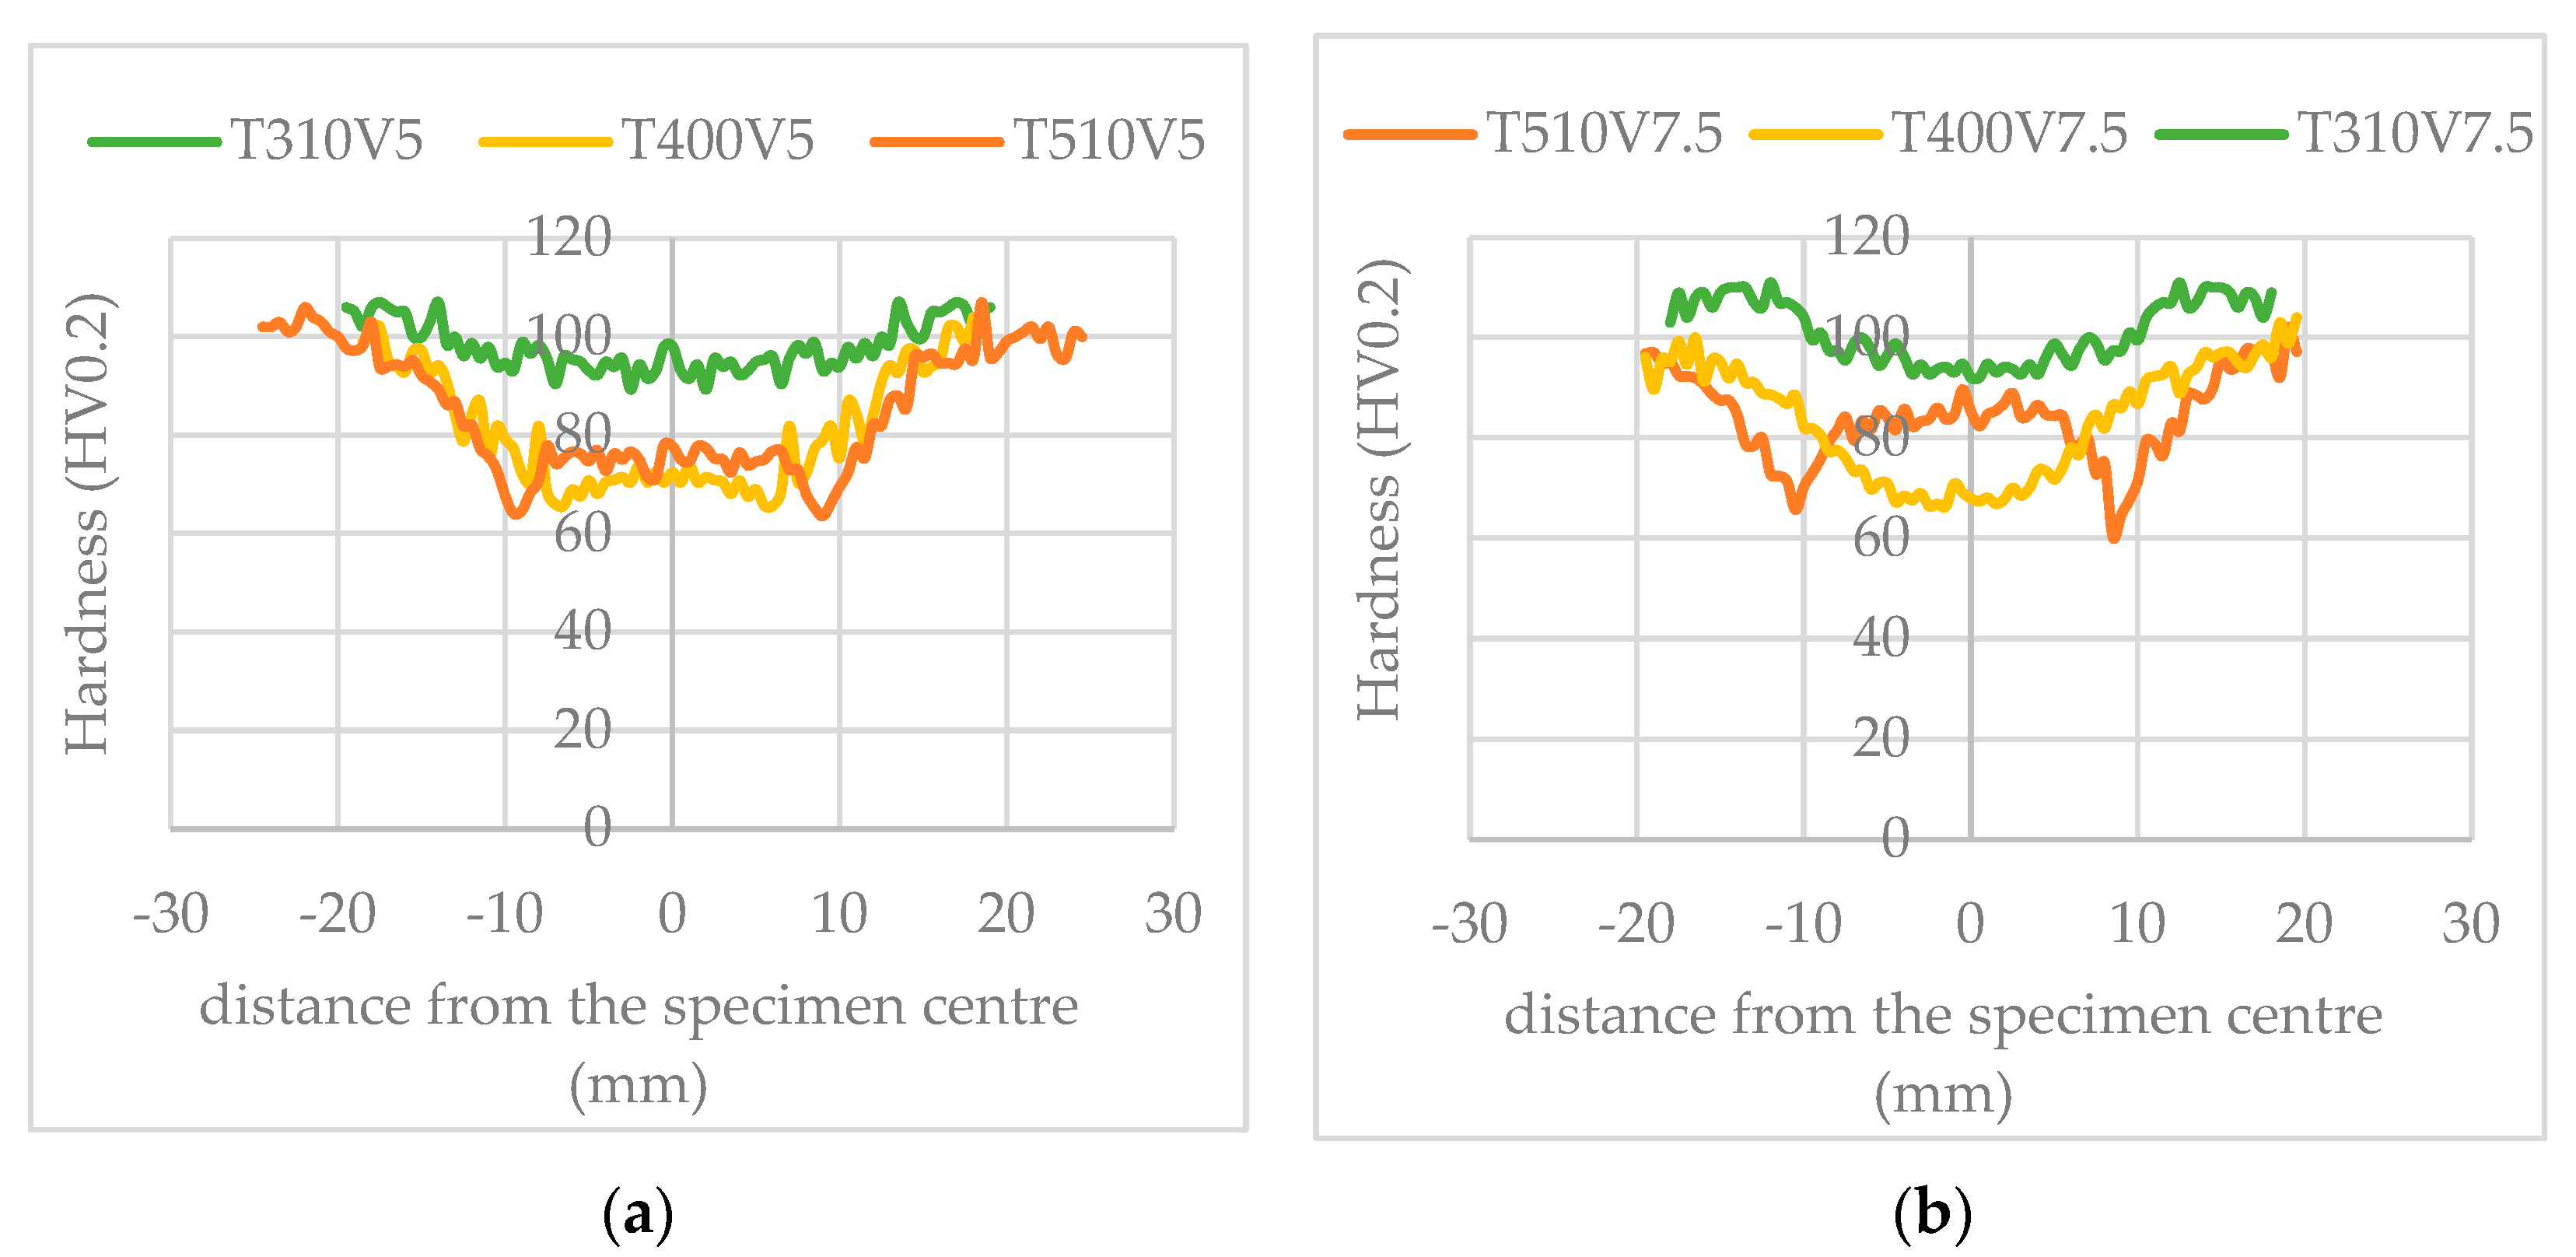
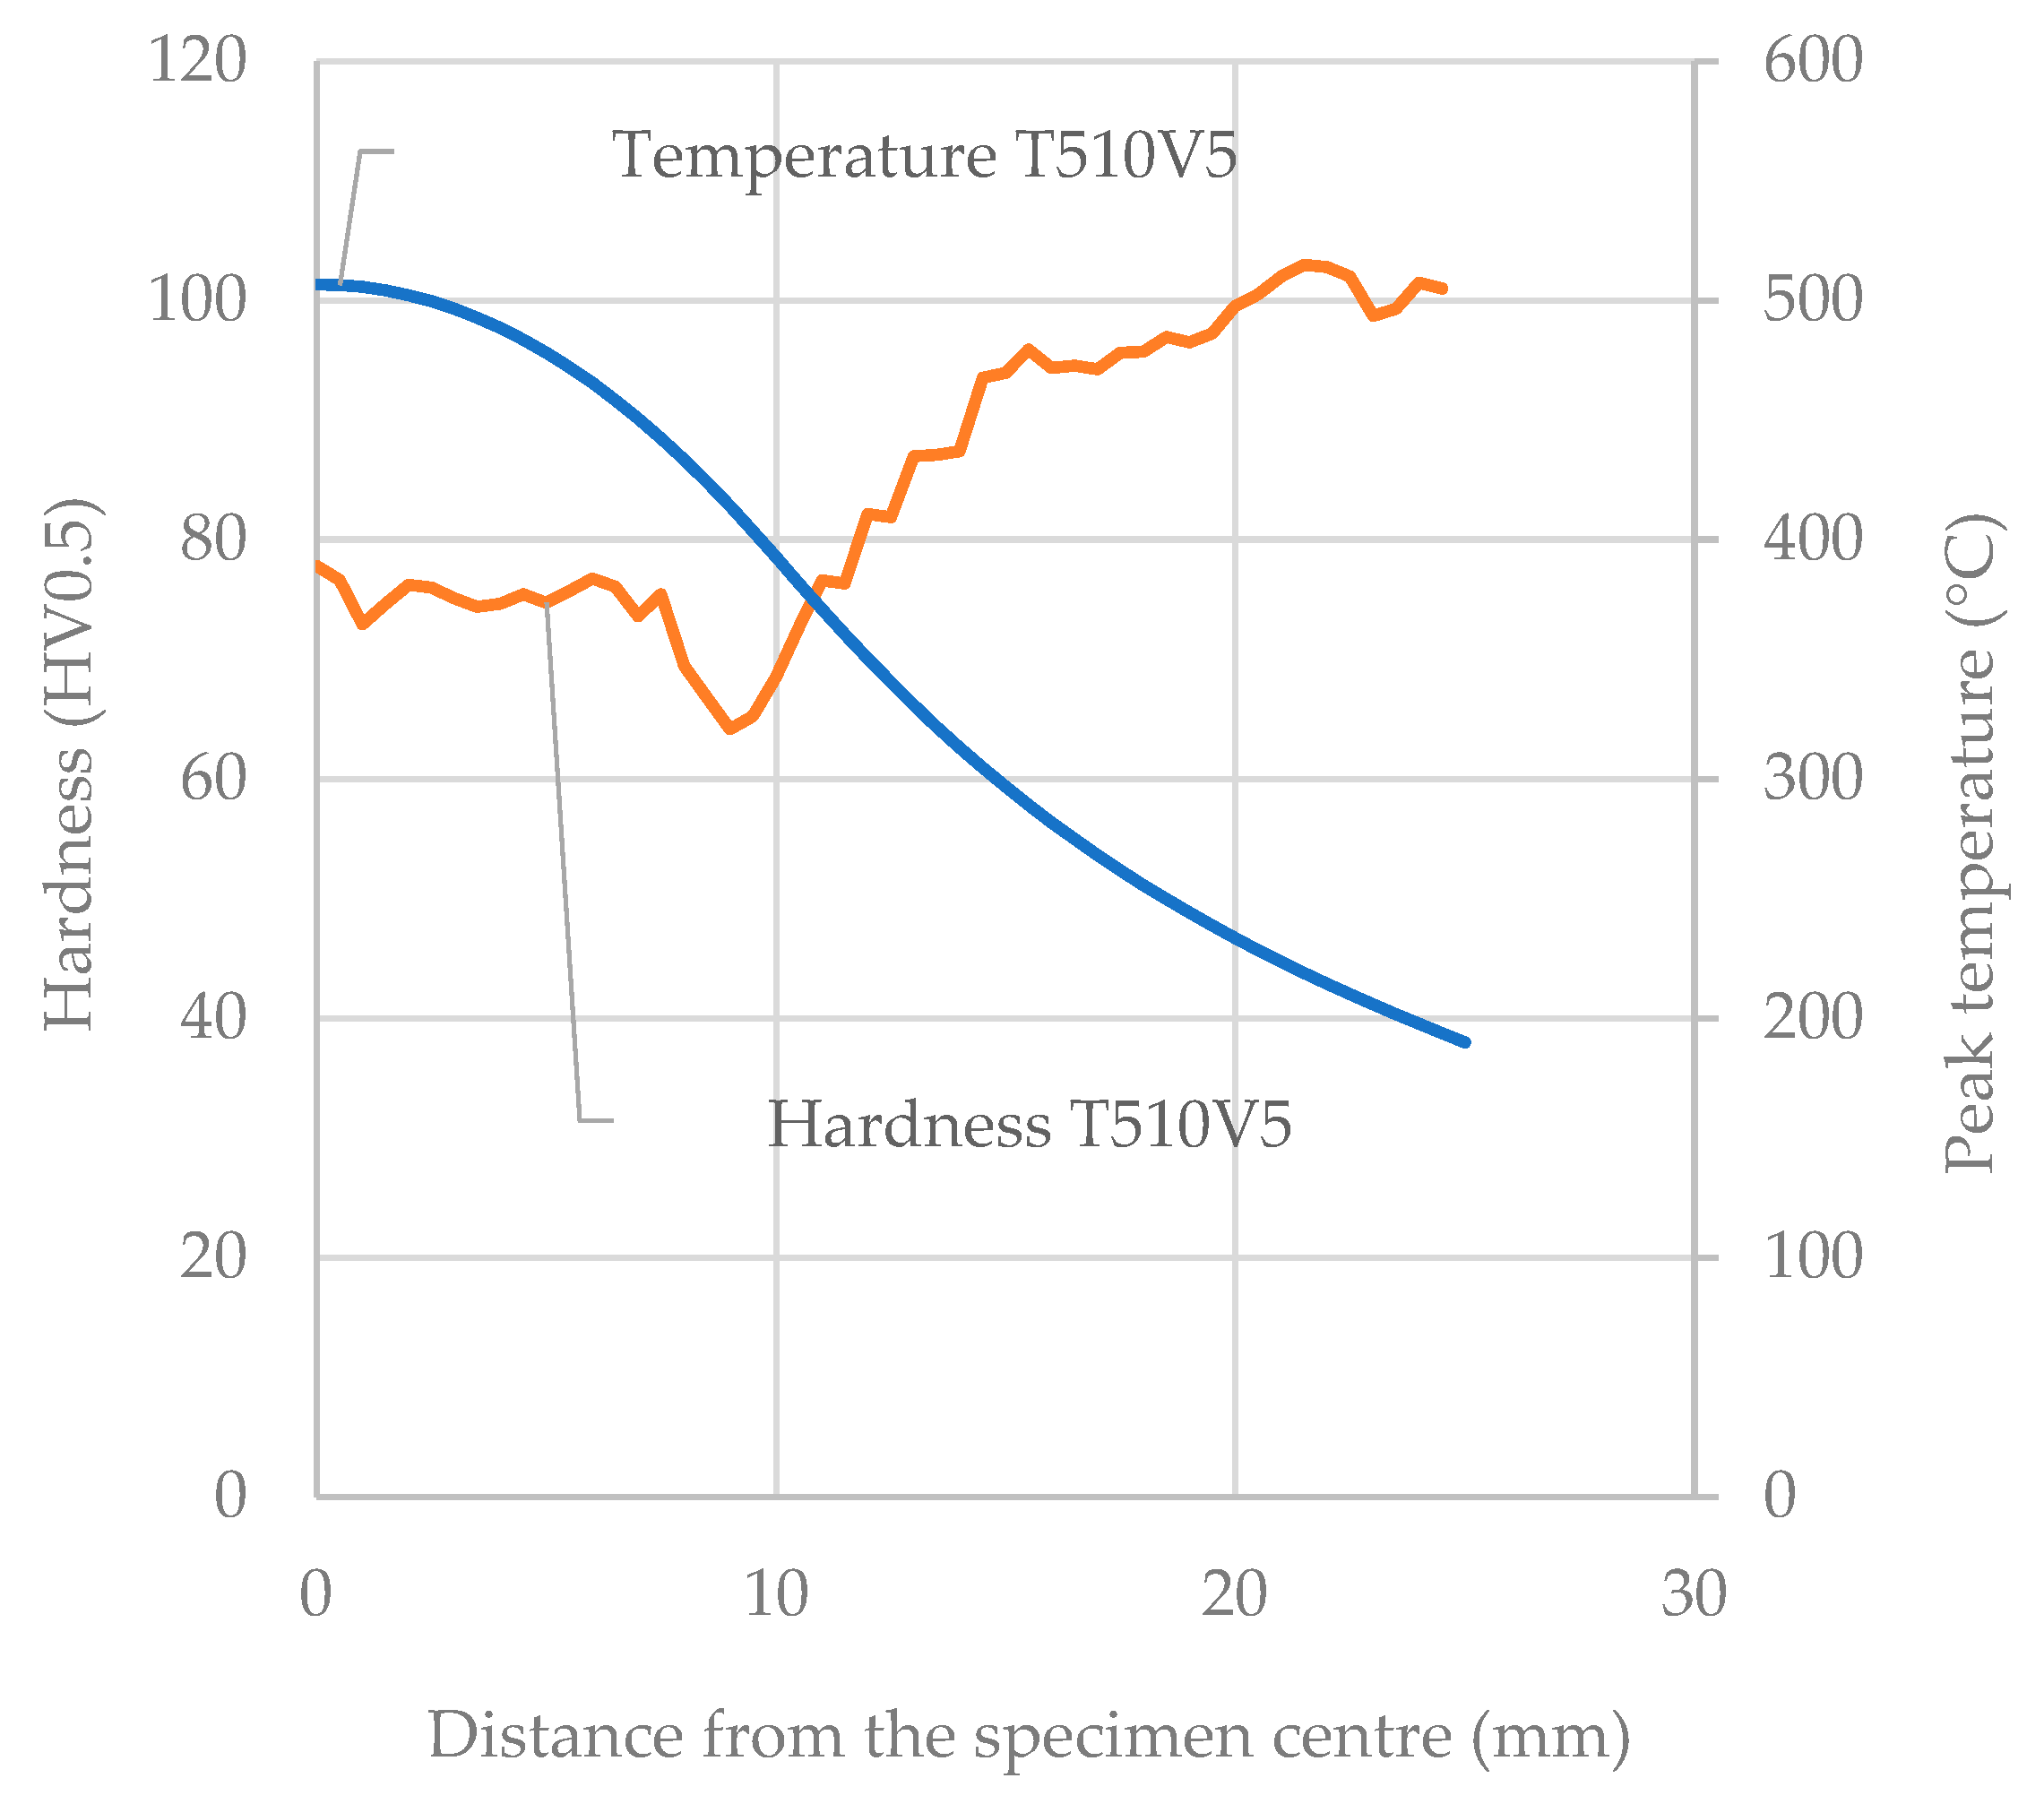
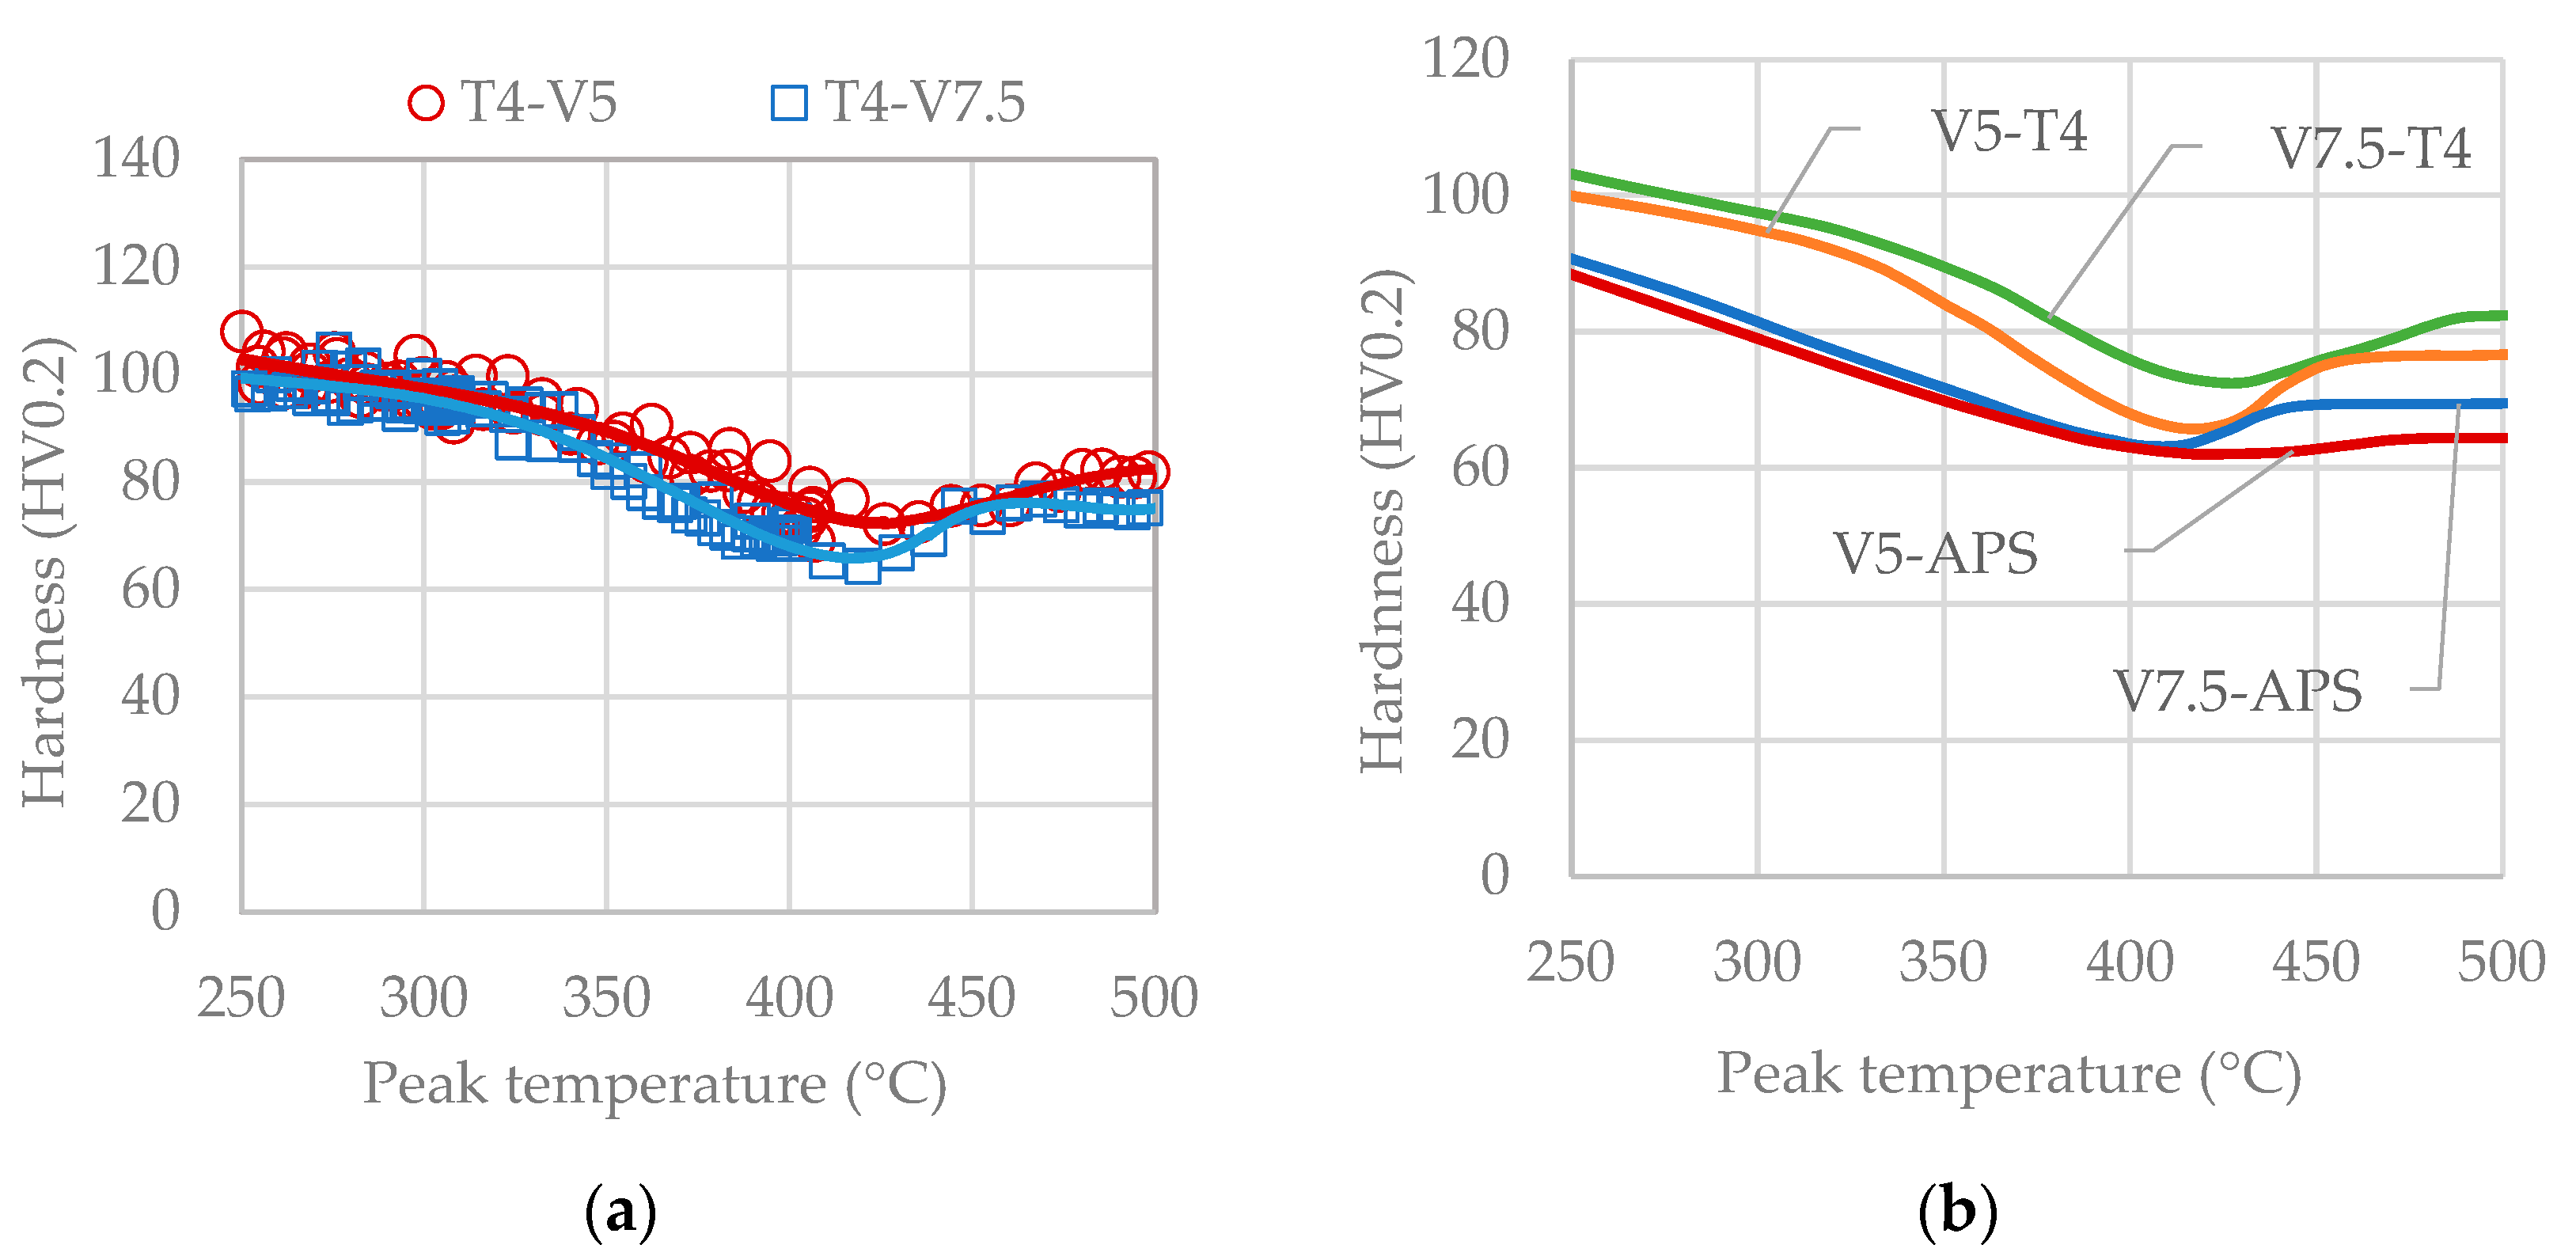
3.2. Effects of Thermal Cycles on Material Softening
3.3. Effect of Thermal Cycles on Material Deformability
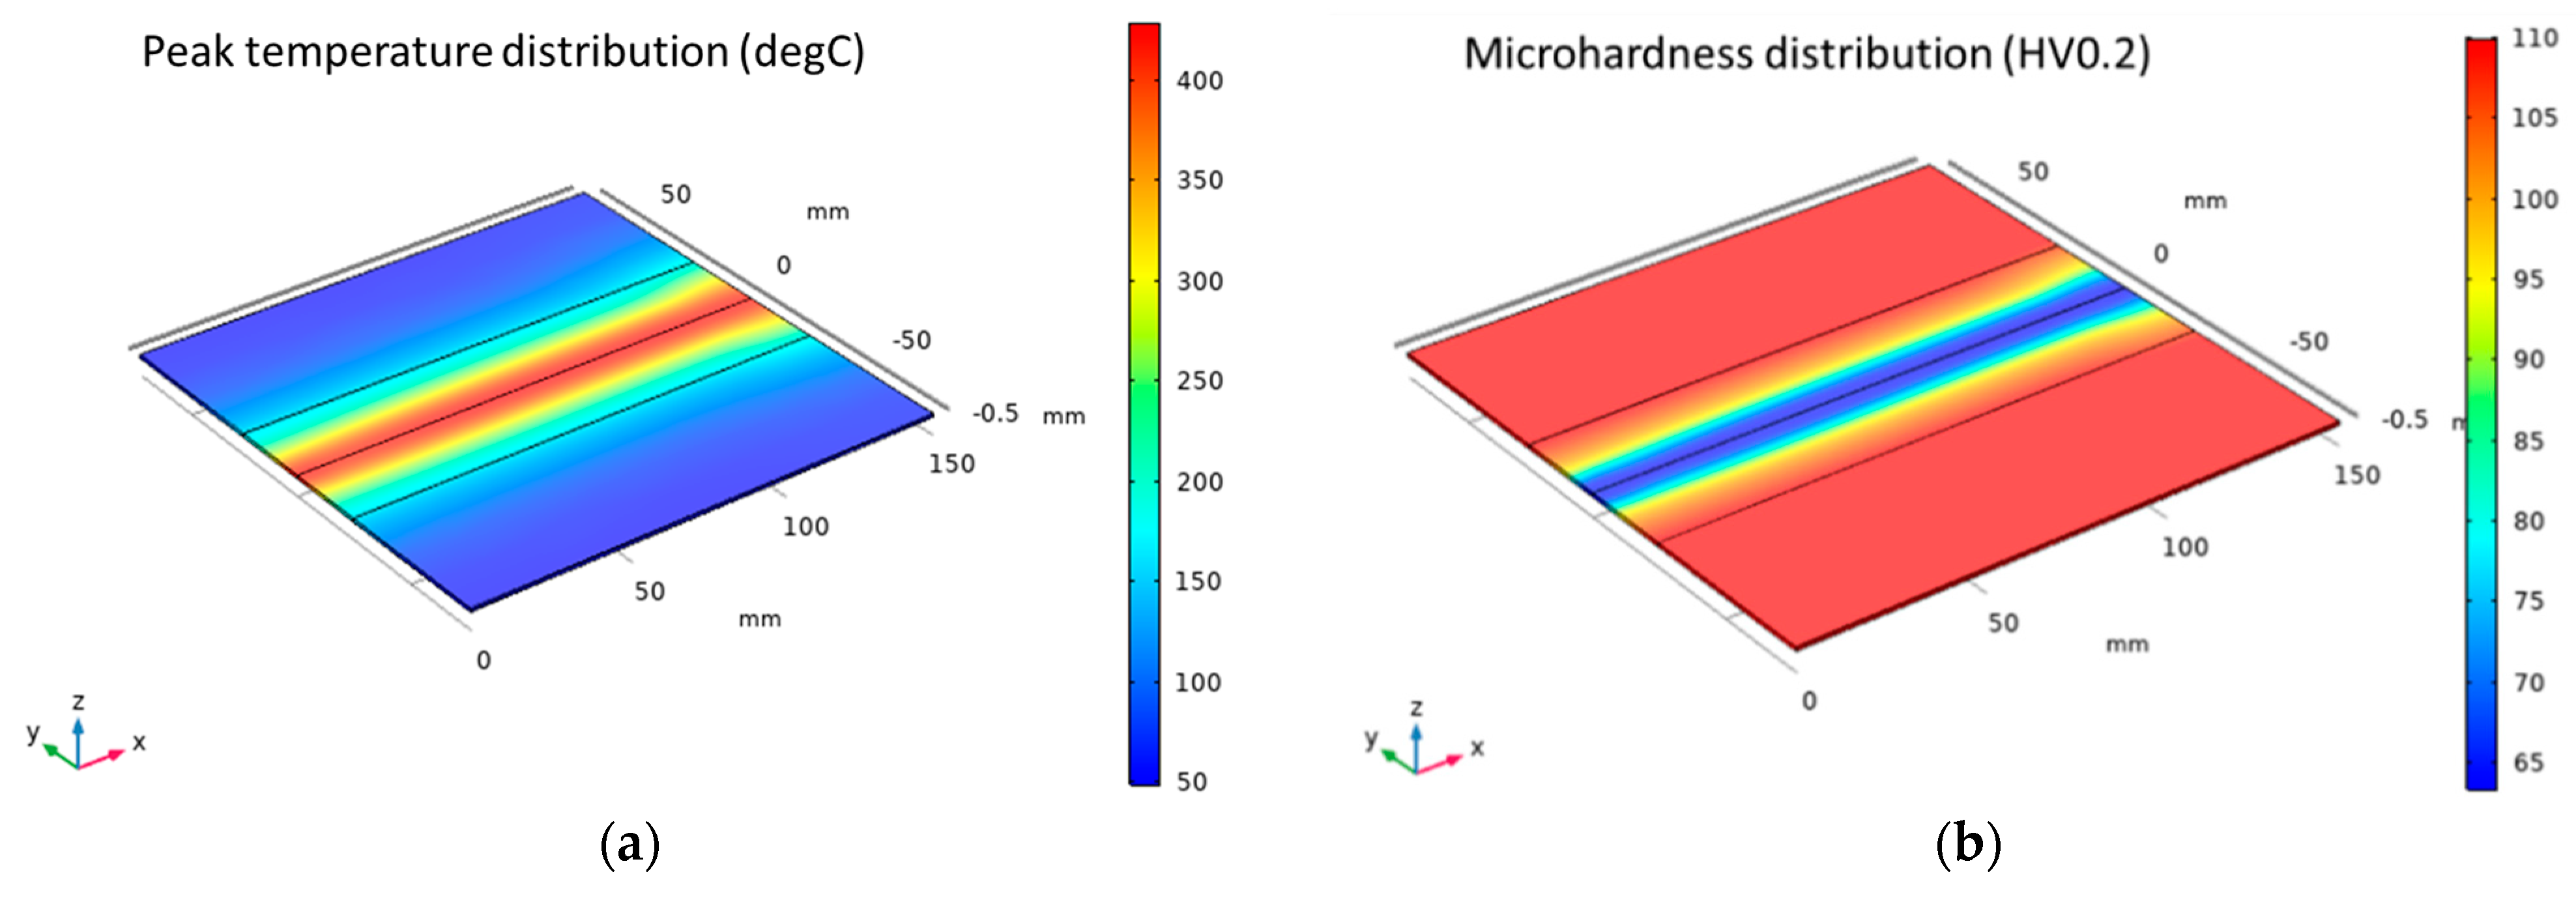
3.4. Results Applied to the Laser Treatment
4. Conclusions
Author Contributions
Funding
Data Availability Statement
Acknowledgments
Conflicts of Interest
References
- Conrads, L.; Hirt, G.; Hama-Saleh, R.; Weisheit, A. Lightweight design using local heat treatment of cold rolled steels. Lightweight Des. Worldw. 2018, 11, 52–57. [Google Scholar] [CrossRef]
- Merklein, M.; Johannes, M.; Lechner, M.; Kuppert, A. A review on tailored blanks—Production, applications and evaluation. J. Mater. Process Tech. 2014, 214, 151–164. [Google Scholar] [CrossRef]
- Madhusudhana, H.K.; Gaitonde, V.N.; Jangali, G.S. A Review on Lightweight Metal Component Forming and its Application. J. Phys. Conf. Ser. 2021, 2070, 012246. [Google Scholar] [CrossRef]
- Siefert, K.; Sulzberger, A.; Merklein, M. Investigation on induction heat treatment to enhance the formability of aluminum alloy AA5182. In Proceedings of the International Conference on Technology of Plasticity ICTP, Aachen, Germany, 25–30 September 2011. [Google Scholar]
- Hogg, M. Herstellung und Umformung Lokal Wärmebehandelter Platinen; DGM Informationsges sellschaft mbH: Frankfurt, Germany, 2006. [Google Scholar]
- Merklein, M.; Böhm, W.; Lechner, M. Tailoring material properties of aluminum by local laser heat treatment. Phys. Proc 2012, 39, 232–239. [Google Scholar] [CrossRef]
- Geiger, M.; Merklein, M.; Vogt, U. Aluminum tailored heat treated blanks. Prod Eng. 2009, 3, 401–410. [Google Scholar] [CrossRef]
- Zarini, S.; Mostaed, E.; Vedani, M.; Previtali, B. Formability enhancement of Al 6060 sheets through fiber laser heat treatment. Int. J. Mater. Form. 2017, 10, 741–751. [Google Scholar] [CrossRef]
- Rigas, N.; Merklein, M. Experimental investigation of distortion behavior of laser heat treated blanks. Procedia CIRP 2020, 94, 557–560. [Google Scholar] [CrossRef]
- Staud, D.; Merklein, M. Inverse approach to the forming simulation of tailored heat treated blanks. Int. J. Mater. Form. 2008, 1, 37–40. [Google Scholar] [CrossRef]
- Available online: https://gleeble.com/ (accessed on 1 September 2020).
- Palmieri, M.E.; Lorusso, V.D.; Tricarico, L. Laser-induced softening analysis of a hardened aluminum alloy by physical simulation. Int. J. Adv. Manuf. Tech. 2020, 111, 1503–1515. [Google Scholar] [CrossRef]
- Machhammer, M.; Sommitsch, C. The interaction between short-term heat-treatment and the formability of an Al-Mg-Si alloy regarding deep drawing processes. In IOP Conference Series: Materials Science and Engineering; IOP Publishing: Bristol, UK, 2016; Volume 159. [Google Scholar]
- Fröck, H.; Graser, M.; Milkereit, B.; Reich, M.; Lechner, M.; Merklein, M.; Kessler, O. Precipitation Behaviour and Mechanical Properties during Short-Term Heat Treatment for Tailor Heat Treated Profiles (THTP) of Aluminium Alloy 6060 T4. In Proceedings of the 15th International Conference on Aluminum Alloys, Chongqing, China, 12–16 June 2016. [Google Scholar]
- Javaheri, E.; Lubritz, J.; Graf, B.; Rethmeier, M. Mechanical properties characterization of welded automotive steels. Metals 2020, 10, 1. [Google Scholar] [CrossRef]
- Zhang, Z.L.; Hauge, M.; Thaulow, C.; Ødegård, J. A notched cross weld tensile testing method for determining true stress–strain curves for weldments. Eng. Fract. Mech. 2002, 69, 353–366. [Google Scholar] [CrossRef]
- Mandziej, S.T. Physical simulation of metallurgical processes. Mater. Technol. 2010, 44, 105–119. [Google Scholar]
- Cao, L.; Rometsch, P.A.; Couper, M.J. Clustering behaviour in an Al–Mg–Si–Cu alloy during natural ageing and subsequent under-ageing. Mat. Sci. Eng. A 2013, 559, 257–261. [Google Scholar] [CrossRef]
- Zhang, W.; He, H.; Xu, C.; Yu, W.; Li, L. Precipitates dissolution, phase transformation, and re-precipitation-induced hardness variation in 6082-T6 alloy during mig welding and subsequent baking. JOM 2019, 71, 2711–2720. [Google Scholar] [CrossRef]
- Merklein, M.; Graser, M.; Lechner, M. Experimental investigation of heat-treated aluminum profiles. Key Eng. Mat. 2015, 651, 59–64. [Google Scholar] [CrossRef]
- Merklein, M.; Lechner, M.; Schneider, T.; Plettke, R. Tailored heat treated profiles-enhancement of the forming limit of aluminum profiles under bending load. Key Eng. Mat. 2012, 504, 375–380. [Google Scholar] [CrossRef]
- Kumar, N.; Rao, P.N.; Jayaganthan, R.; Brokmeier, H.G. Effect of cryorolling and annealing on recovery, recrystallisation, grain growth and their influence on mechanical and corrosion behaviour of 6082 Al alloy. Mater. Chem. Phys. 2015, 165, 177–187. [Google Scholar] [CrossRef]


| Si | Fe2 | Cu | Mn | Mg | Cr2 | Zn2 | Ti2 | Al |
|---|---|---|---|---|---|---|---|---|
| 0.70–1.30 | ≤0.50 | ≤0.10 | 0.4–1 | 0.6–1.20 | ≤0.25 | ≤0.20 | ≤0.10 | Balance |
| T (°C) | k (W/(m ∗ K)) | Cp (J/(kg/∗K)) | ρ (kg/cm3) |
|---|---|---|---|
| 20–600 | 182.15 + 0.0611 × T | 893.65 + 0.5771 × T | 2.7645 − 0.0002 × T |
| Treatment Code | v (mm/s) | Tpeak (°C) |
|---|---|---|
| T510V5 | 5 | 510 |
| T400V5 | 5 | 400 |
| T310V5 | 5 | 310 |
| T510V7.5 | 7.5 | 510 |
| T400V7.5 | 7.5 | 400 |
| T310V7.5 | 7.5 | 310 |
| Specimen Type | Gleeble Test | Hardness Test | Tensile Test | ||
|---|---|---|---|---|---|
| Sample State | Repetitions | Sample State | Repetitions | ||
| tapered | Thermal cycles according to laser treatment condition in Table 3 (Figure 8) | APS | 2 | ||
| T4 | 2 | ||||
| notched | APS | 3 | |||
| T4 | 3 | ||||
| State | T (°C) | HV0.2 |
|---|---|---|
| APS | 118 | |
| 50–420 | ||
| 420–470 | ||
| 470–520 | ||
| T4 | 118 | |
| 50–410 | ||
| 410–450 | ||
| 450–520 |
Publisher’s Note: MDPI stays neutral with regard to jurisdictional claims in published maps and institutional affiliations. |
© 2022 by the authors. Licensee MDPI, Basel, Switzerland. This article is an open access article distributed under the terms and conditions of the Creative Commons Attribution (CC BY) license (https://creativecommons.org/licenses/by/4.0/).
Share and Cite
Palmieri, M.E.; Tricarico, L. Physical Simulation of Laser Surface Treatment to Study Softening Effect on Age-Hardened Aluminium Alloys. J. Manuf. Mater. Process. 2022, 6, 64. https://doi.org/10.3390/jmmp6030064
Palmieri ME, Tricarico L. Physical Simulation of Laser Surface Treatment to Study Softening Effect on Age-Hardened Aluminium Alloys. Journal of Manufacturing and Materials Processing. 2022; 6(3):64. https://doi.org/10.3390/jmmp6030064
Chicago/Turabian StylePalmieri, Maria Emanuela, and Luigi Tricarico. 2022. "Physical Simulation of Laser Surface Treatment to Study Softening Effect on Age-Hardened Aluminium Alloys" Journal of Manufacturing and Materials Processing 6, no. 3: 64. https://doi.org/10.3390/jmmp6030064
APA StylePalmieri, M. E., & Tricarico, L. (2022). Physical Simulation of Laser Surface Treatment to Study Softening Effect on Age-Hardened Aluminium Alloys. Journal of Manufacturing and Materials Processing, 6(3), 64. https://doi.org/10.3390/jmmp6030064