Article

Investigating the Influence of Material Extrusion Rates and Line Widths on FFF-Printed Graphene-Enhanced PLA

The School of Engineering and Built Environment, Faculty of Science and Engineering, Anglia Ruskin University, Chelmsford CM1 1SQ, UK
*
Author to whom correspondence should be addressed.
J. Manuf. Mater. Process. 2022, 6(3), 57; https://doi.org/10.3390/jmmp6030057
Submission received: 21 April 2022 / Revised: 12 May 2022 / Accepted: 23 May 2022 / Published: 24 May 2022

Abstract

:
Fused filament fabrication (FFF) is a widely used additive manufacturing process that can produce parts from thermoplastics. Its ease of operation and wide variety of materials make it a popular choice for manufacturing. To leverage such benefits, the commonly used thermoplastics (e.g., PLA and ABS) are impregnated with nanoparticles, short or continuous fibers, and other additives. The addition of graphene nanoplatelets to PLA makes for a high-quality filament possessing enhanced mechanical, electrical, and thermal properties. Even with the advancement in materials, the optimisation of the process parameter remains the most complex aspect for FFF. Therefore, this study investigates the influence of two under-researched and overlooked processing parameters (material extrusion rates and line widths) on commercially available graphene-enhanced PLA (GPLA). Nine different material extrusion rates (70% to 150%) and five different line widths (0.2 mm to 1 mm) were used to manufacture GPLA specimens using a low-cost, desktop-based 3D printer, as per British and international standards. The study analyses the influence of these two processing parameters on mass, dimensional accuracy, surface texture, and mechanical properties of GPLA specimens. A non-destructive test has also been conducted and correlated with three-point flexural test to establish its applicability in evaluating flexural properties of GPLA. The results how that small line widths provide more accuracy with longer print times whereas large line widths offer more strength with shorter printing times. Increase in material extrusion rates adversely affect the surface finish and hardness but positively influence the flexural strength of GPLA specimens. The study shows that the manipulation of material extrusion rates and line widths can help designers in understanding the limitations of the default printing settings (100% material extrusion rate and 0.4 mm line width) on most desktop 3D printers and identifying the optimal combination to achieve desired properties using the FFF process.

1. Introduction

One of the most popular AM methods, based on the principle of material extrusion, is called fused filament fabrication (FFF), or fused deposition modelling (FDM). This process makes use of thermoplastics to manufacture products by depositing melted material layer-by-layer [1,2,3,4,5,6]. The systems working on the principle of FFF/FDM are termed as 3D printers [7,8]. The FFF process has several notable advantages such as ease of operation, wide variety of materials, and cost-effectiveness [9,10,11,12]. PLA, ABS, and ASA are examples of commonly used thermoplastics for FFF and they have been widely researched over the years [13,14,15,16,17,18] for the optimization of their processing parameters to achieve properties. For example, Aslani et al. [19] investigated the effects of extraction temperature and wall thickness on the dimensional accuracy and surface roughness of FFF-printed PLA parts. Using the Taguchi approach and Grey relational analysis, they showed that high extraction temperature and median wall thickness values optimize both dimensional accuracy and surface roughness for PLA. Similarly, Vanaei et al. [20] analysed the influence of extrusion temperature, print-bed temperature, printing speed, and layer height on PLA by means of physicochemical and mechanical characterizations. They also undertook in-situ measurement of temperature profile during deposition and found that the influence of increasing the extruder temperature is more significant in comparison with other process parameters. For ABS, Nuñez et al. [21] investigated the dimensional accuracy, flatness, and surface texture of FFF-printed ABS parts. They found that the layer thickness and infill density influence the surface finish and dimensional accuracy of the parts. The results showed that low layer thicknesses and high infill densities were favorable for better surface finish. However, improved dimensional accuracy was a result of high layer thicknesses and infill densities. Dawoud et al. [22] studied the effects of raster angle and gap on the mechanical properties of ABS parts. They concluded that a raster angle layup of −45°/+45° offer maximum tensile and impact strength, whereas highest flexural strength was recorded for a 0/90° scaffolding system. As far as ASA is concerned, Kumar et al. [23] analysed the influence of infill percentage and build direction on tensile strength and flexural strength of ASA parts. The results showed that the tensile strength of ASA parts made by FDM is higher compared to injection molded parts in literature. However, lower flexural strength was observed upon comparison as well. Martínez et al. [24] investigated the effects of layer thickness and printing temperatures on the mechanical and tribological response of ASA parts. They found that ASA parts with higher layer thickness resulted in lower resistance to tribological wear effects (in terms of friction coefficient and wear rate), but also exhibited lower tensile strength. They achieved a reduction in the coefficient of friction near to 65% in the average value through the variation of the layer thickness of the ASA parts. It is, therefore, evident that optimisation of process parameters is critical in achieving the desired results in FFF-printed parts.
In addition to optimisation of process parameters, efforts are continuously being made to improve the properties of the commonly used thermoplastics (e.g., PLA, ABS, and ASA) through the incorporation of particles, fibers, or nanomaterial reinforcements [25,26,27]. Graphene nano-platelets (GNP) have also become exceedingly popular due to their excellent properties especially incorporated with PLA for 3D printing [28]. Such a filament provides improved operating temperature performance, high rigidity, good impact strength, and excellent interlayer adhesion for smooth printing. Rigorous research is being undertaken to leverage such properties of graphene enhanced PLA (GPLA) material for FFF. Caminero et al. [29] studied the effects of GNP reinforcement and showed that the incorporation of such platelets helps in enhancing the mechanical properties, dimensional accuracy, and surface texture of PLA parts. El Magri et al. [30] analysed the combined effect of process parameters, loading amplitude, and frequency on fatigue behavior of GPLA parts. Their experimental results showed that the fatigue lifetime depends on the process parameters as well as the loading amplitude and frequency. García et al. [31] evaluated the geometric properties of dimensional accuracy, flatness error, surface texture, and surface roughness for PLA as well as GPLA as a function of build orientation, layer thickness, and feed rate. They showed that the properties were not significantly affected by the chosen printing parameters for both materials. On the other hand, Butt et al. [32] analysed the impact of extrusion temperatures and material extrusion rates on PLA and GPLA. They showed that GPLA is more adversely affected due to changes in these printing parameters and how they can be leveraged to achieve desired results in products. Cicero et al. [33] investigated the effects of three different raster orientations (0/90, 30/−60, and 45/−45) on tensile and fracture specimens of PLA and GPLA. They observed that the addition of GNPs resulted in significant improvement of tensile and fracture properties for specimens printed at 30/−60 and 45/−45. However, they did not observe this phenomenon in raster orientation of 0/90. Camargo et al. [34] also analysed the impact of infill and layer thickness on GPLA parts for their tensile strength, flexural strength, and impact energy. They concluded that tensile strength and flexural strength, increased as the infill increased, while impact energy decreased as infill increased.
As discussed, optimisation of process parameters is key in achieving desired results in FFF-printed parts. However, users can still manufacture prototypes using the default settings of different slicer software packages. Even though these settings will produce a product, it might not be the most optimal product due to a lack of optimisation. There are many different processing parameters that are often modified by users. However, one often overlooked parameter is the material extrusion rate or extrusion multiplier (expressed in percentage). It specifies the rate at which the printer will extrude the material out from the nozzle in unit time [32]. A flow rate of 100% is typically used to avoid issues of under-extrusion (gaps/voids between layers) and over-extrusion (accumulation of extra material). These common issues can lead to defective products with poor properties. Therefore, research studies have focused on identifying under/over extruded parts, but limited literature is available in this context. Tanikella et al. [35] developed a two-step screening process to detect under-extruded parts to avoid quality issues with desktop 3D printers. Jin et al. [36] developed a real-time monitoring and autonomous correction system capable of automatically changing the printing parameters upon detecting under- or over-extrusion images. On the other hand, Forman et al. [37] purposefully used under-extrusion to print thin and flexible textiles called DefeXtiles using a common 3D printer for different applications such as fashion design prototyping, interactive objects, aesthetic patterning, and single-print actuators. These examples show the significance of material extrusion rate and how it can be manipulated to achieve desired results.
Considering the presented literature, it is clear that FFF requires optimization of its process parameters. Therefore, this study aims to investigate the influence of two under-researched and overlooked parameters, i.e., material extrusion rate and line width for FFF-printed GPLA. These are commonly set by default on 3D printing software packages as 100% and equal to the diameter of the extrusion nozzle, respectively. This work can help understand their cumulative effect on GPLA parts to achieve desired results. The next section (Section 2) details the materials and methods used in this study. An extensive analysis is presented in Section 3 discussing the influence of these two processing parameters on GPLA parts. Finally, material quality characterisation and conclusions of this work are outlined in Section 4 and Section 5, respectively.

2. Methodology

2.1. Materials and 3D Printing

HDPlas® PLA-GNP-A filament from 3D Haydale Ltd., (Loughborough, UK) was used to manufacture specimens to analyze the effects of nine different material extrusion rates (or flow rates expressed as percentages) and five different line widths. The reason for choosing such a range of these processing parameters is to ensure that their cumulative effect can be analysed for the composite GPLA material. Specimens under 100% material extrusion rate are considered as under-extruded and over this value are considered as over-extruded, leading to differences in the properties of printed parts [32]. An interval of 10% was used to study the effect of material extrusion rate as it increased from under to over-extruded specimens. For line widths, nozzle diameter is usually the reference and dictates how small or large line width can be printed. Based on the 0.4 mm diameter nozzle, the minimum value that the printer can print with appropriate pressure inside the nozzle is 0.2 mm, whereas the maximum can be 1 mm and these are the values chosen for the analysis. It is to be noted that these are two under-researched and overlooked processing parameters for the FFF process and this study will help understand their cumulative effect on FFF-printed GPLA parts. The GPLA used in this work comprise HDPlas® functionalized graphene nanoplatelets of a planar size between 0.3–5 μm, that helps to improve dispersion and bonding within the PLA polymer [38]. Anet® ET4 Pro desktop 3D printer was used to manufacture 80 mm × 25 mm × 3 mm (L × W × H) rectangular specimens as per BS EN ISO 178: 2019 [39]. Ultimaker Cura 4.11.0 [40] was used to generate G-code files based on the different combinations of the two processing parameters as shown in Table 1. The settings for material extrusion rate and line width were modified with the Cura software to generate the required files for 3D printing. The printed GPLA specimens are shown in Figure 1. Five specimens for each combination of the processing parameters were evaluated while all other parameters were kept constant (shown in Table 2). The reason for keeping all the other parameters constant is to ensure that they do not affect the results of the study that is focused on analysing the influence of material extrusion rates and line widths.

2.2. Measurements and Experimental Testing

Since increasing the material extrusion rate adds more material, mass measurement was needed and CBK 8H weighing scale (Adam Equipment, UK) with a resolution of 0.1 g was used for this purpose. Similarly, to ascertain the cumulative effect of material extrusion rate and line widths, the dimensions of the rectangular specimens were measured using a digital Vernier caliper. Surface texture analysis was undertaken using Surftest SJ-210 (Mitutoyo, UK) contact-type surface profilometer [41]. Ra (average surface roughness) and Rq (root mean square) were quantitatively measured at micro-meter level from the specimens. The traverse direction was diagonal to the building direction at an angle of 45°, as per ISO 21920-2:2021 [42]. Three measurements were taken on each specimen with a measuring speed of 0.5 mm/s. After surface analysis, strain was measured upon the application of a static load where two metallic strain gauges were bonded to both sides of a specimen in a half bridge configuration because it instils more sensitivity by measuring both tensile (positive) and compressive strain (negative). BF350-3 AA type metal foil resistance strain gauges were used with a resistance of 350 ± 0.1 ohms, sensitivity factor of 2.0–2.20, and precision level of 0.02 [43]. They were bonded on the surfaces of the rectangular specimens with cyanoacrylate adhesive [44]. A static load of 1000 g (1 kg) was applied to the specimen, as shown in Figure 2, and the resistance values from the strain gauges were recorded using a HBM Data Acquisition System QuantumX MX 1615B system running Catman DAQ software with a half bridge configuration. After strain measurements, the rectangular specimens were subjected to indentation hardness as per BS EN ISO 868:2003 [45] using a Shore D durometer. The indentation was measured on five different points along the length to obtain an average hardness value for all the specimens. The hardness test was followed by three-point flexural testing on a TIRAtest 2810 Universal Testing Machine with a speed of 2 mm/min as per BS EN ISO 178:2019 [39]. The diameter of the former and supports was 10 mm, and the specimens were placed in such a way to ensure a support span length of 60 mm for the test.

3. Results and Discussions

3.1. Measurement of Mass

Both material extrusion rate and line widths can result in an increased mass for a specific specimen. On the other hand, they can help in getting the parts printed faster. In any case, it is imperative to ascertain the cumulative effect of these two parameters on the GPLA specimens. Therefore, the rectangular specimens were placed atop the CBK 8H weighing scale and their results were compared to estimations provided by Ultimaker Cura software estimations (Table 1). It is to be noted that slicing software packages automatically set the material extrusion rate to 100%. However, calibration is needed to ensure that the 3D printer is extruding the appropriate amount of material for the part. The primary reason for modifying this parameter is to avoid over- or under-extrusion [35,36]. Most materials can be extruded at a flow rate between 90% and 110% [32]. In this work, the specimens printed at 70%, 80%, and 90% material extrusion rates can be considered as under-extruded (gaps/voids between layers) whereas specimens printed above 100% can be considered as over-extruded (accumulation of extra material). On the other hand, the line width is also selected as equal to the nozzle diameter (0.4 mm for Anet® ET4 Pro 3D printer). The normal range is between 100% and 120% of the nozzle diameter. Small extrusion widths can provide more accuracy with longer print times whereas large extrusion widths offer more stability with shorter printing times. This work is aimed at analysing the influence of material extrusion rates and line widths to ensure that that the optimal combination can be identified for different applications.
To analyse the results, the percentage differences of the GPLA specimens are calculated by subtracting the measured value from the expected value (Table 1), dividing by the expected value and multiplying by 100 to get the percentage. For example, mass of 6.76 g was measured for 70% material extrusion rate and 0.2 mm line width and the expected value is 7 g (Table 1). This results in ((6.76–7)/7) × 100 = −3.43%. All the percentage differences have been calculated using this relation. For the measurement of mass, the percentage differences are shown in Figure 3. It is clear that as the extrusion flow rate increased from under-extruded to over-extruded specimens, the mass decreased as indicated by a larger negative percentage difference. This can be attributed to the fact that with the increased extrusion rate, excess material gets swept away and accumulate on the edges as the nozzle make a pass over the printed surface and break away in beads/pieces with every pass of the nozzle as the part is completed. The same as can be observed with increase in line width. A higher line width provides mass value closer to the estimated value as opposed to a lower value except for 100% material extrusion rate where the negative percentage difference increased with increase in line width. It is evident that GPLA is unable to provide the same mass values as estimated; therefore, adjustments should be made to account for the discrepancies as per the results obtained for mass measurements.

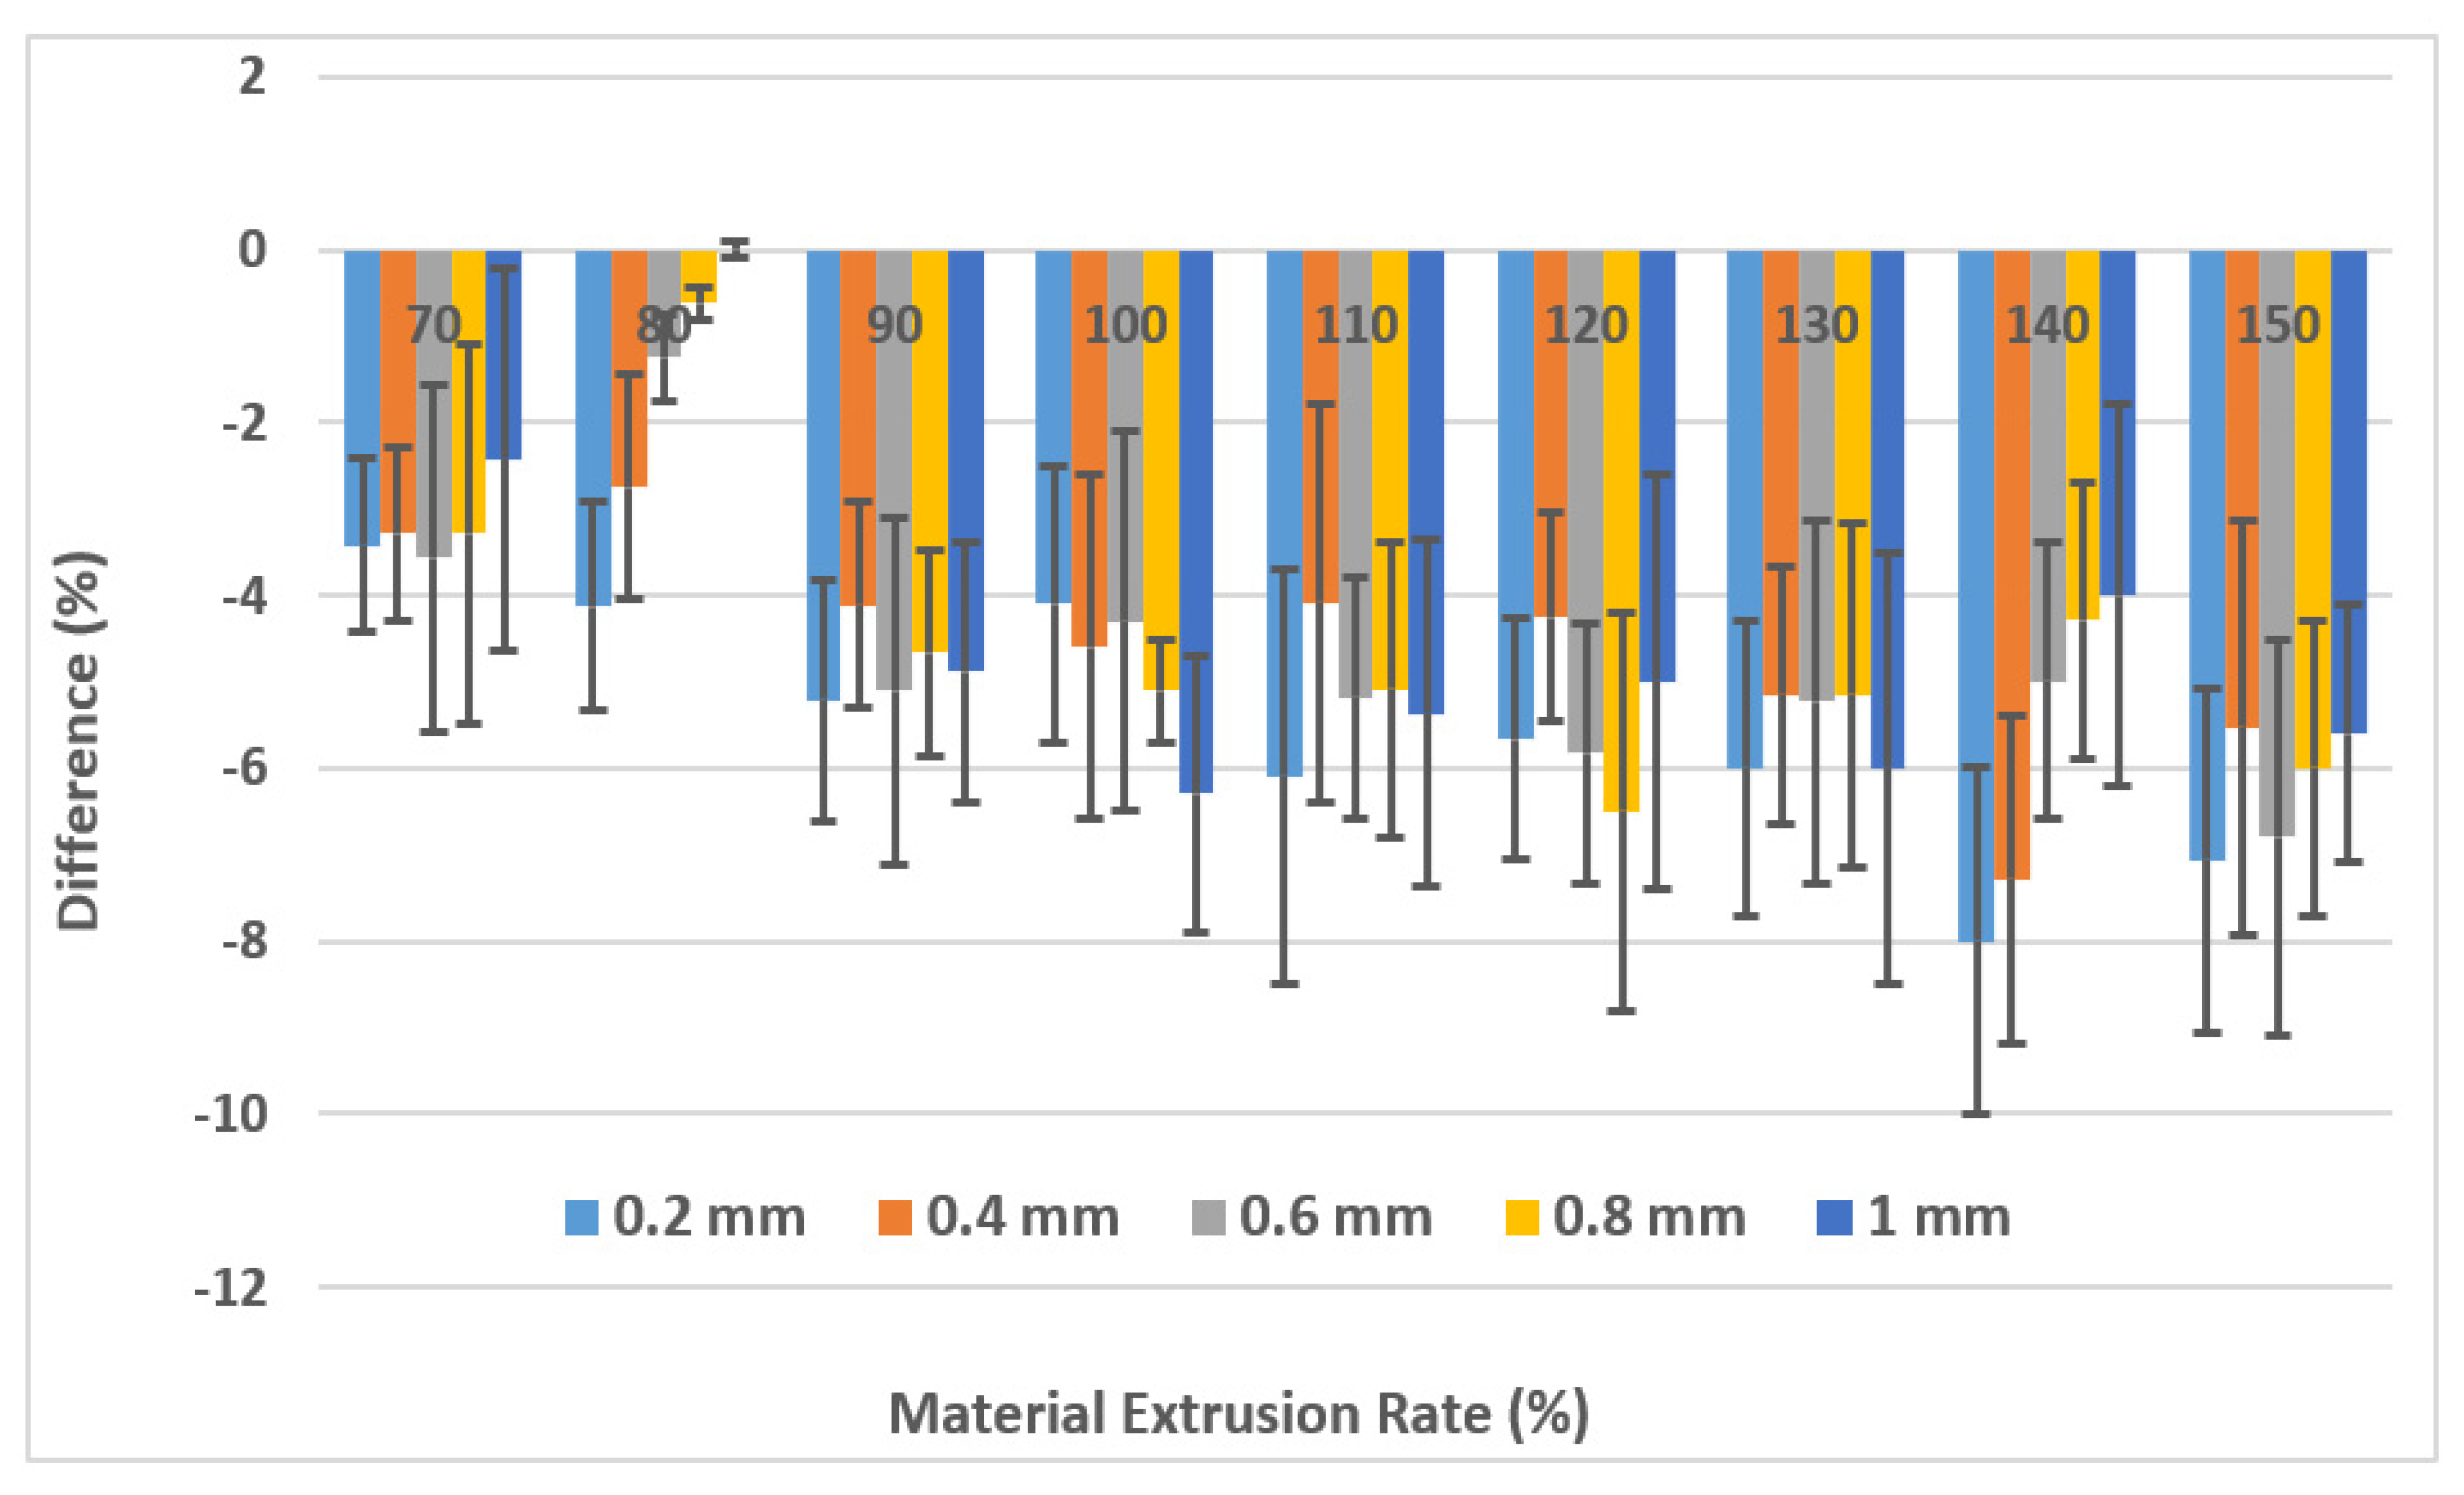
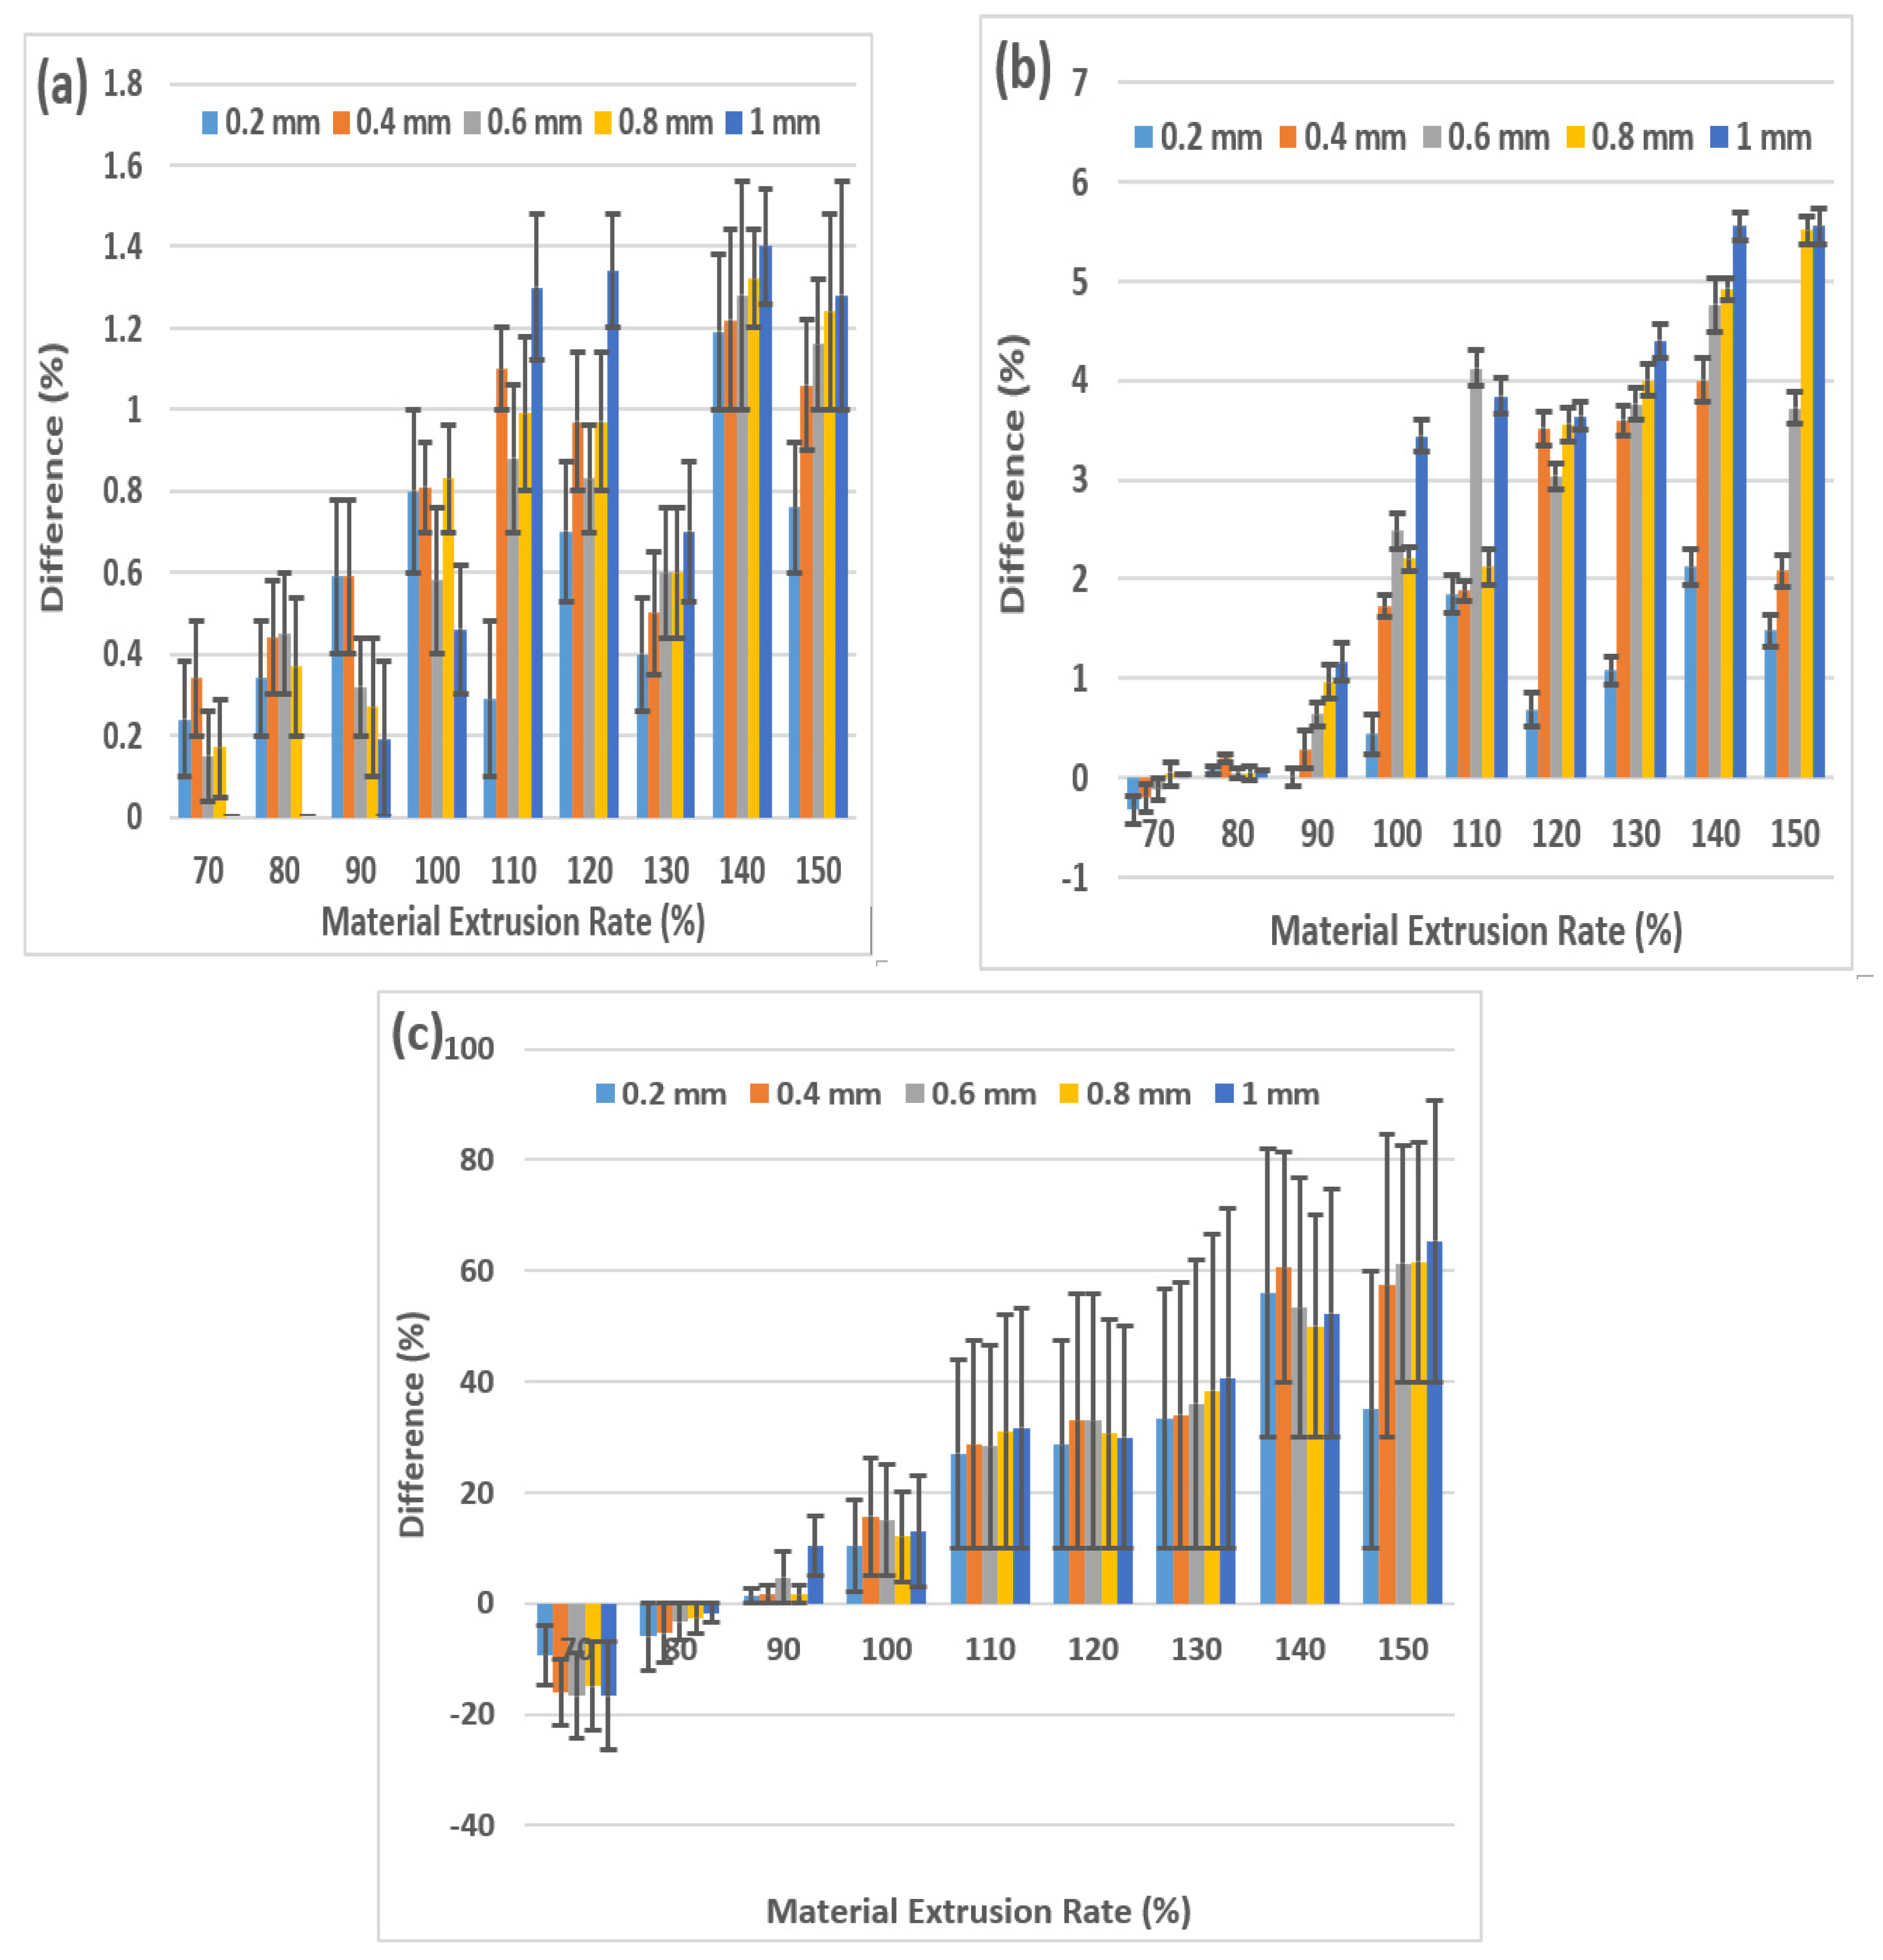
3.2. Dimensional Analysis

The FFF is a popular option for manufacturing but is often criticised for producing dimensional inaccuracies due to its layer-by-layer deposition of the printed material [29,46,47]. This is problematic if the part being printed is to be fitted within an assembly or to be used for a specified application where dimensional accuracy is required. Considering the two parameters being modified here add excess material, it is important to know the extent of dimensional inaccuracy produced by them. The dimensions of the GPLA specimens were measured using a digital Vernier caliper and their deviations were recorded as shown in Figure 4.
It is evident from Figure 4a that all the specimens showed positive percentage differences (<1.33%) meaning that they exceeded the length values of the CAD file, but not to a significant extent. Furthermore, the under-extruded specimens showed better dimensional accuracy as less material is deposited whereas all the over-extruded specimens showed higher positive percentage differences. At larger line widths, better accuracy along the X-axis was observed for under-extruded specimens. However, the deviation became larger with increase in line width for all other specimens. Along the Y-axis (Figure 4b), the same pattern was observed as with the X-axis. The under-extruded specimens showed better dimensional accuracy compared to over-extruded ones as more material was deposited at higher extrusion rates. However, better accuracy was observed at lower line widths along the Y-axis due to excess material being moved to the sides with each pass of the nozzle at larger line widths combined with high extrusion rates. The differences along the Y-axis are still not significant (<6%). Figure 4c shows the deviations along the Z-axis and makes it clear why the mass values were higher as the differences are a little over 60% for the highest extrusion rate. Under-extruded specimens (70% and 80%) showed lower thickness values, but 90% extrusion rate showed the optimal values at all line widths. The most consistent values along the Z-axis were observed at 100% extrusion rate at all line widths. As the extrusion rate and line widths increased, the thickness also increased for all the over-extruded specimens with the smallest line width offering the optimal results. This dimensional analysis on GPLA specimens as a result of material extrusion rates and line widths show that they are significantly affected along the Z-axis due to material accumulation and comparatively less adversely affected along the remaining two axes. These results also align well with the mass measurements discussed in Section 3.1.

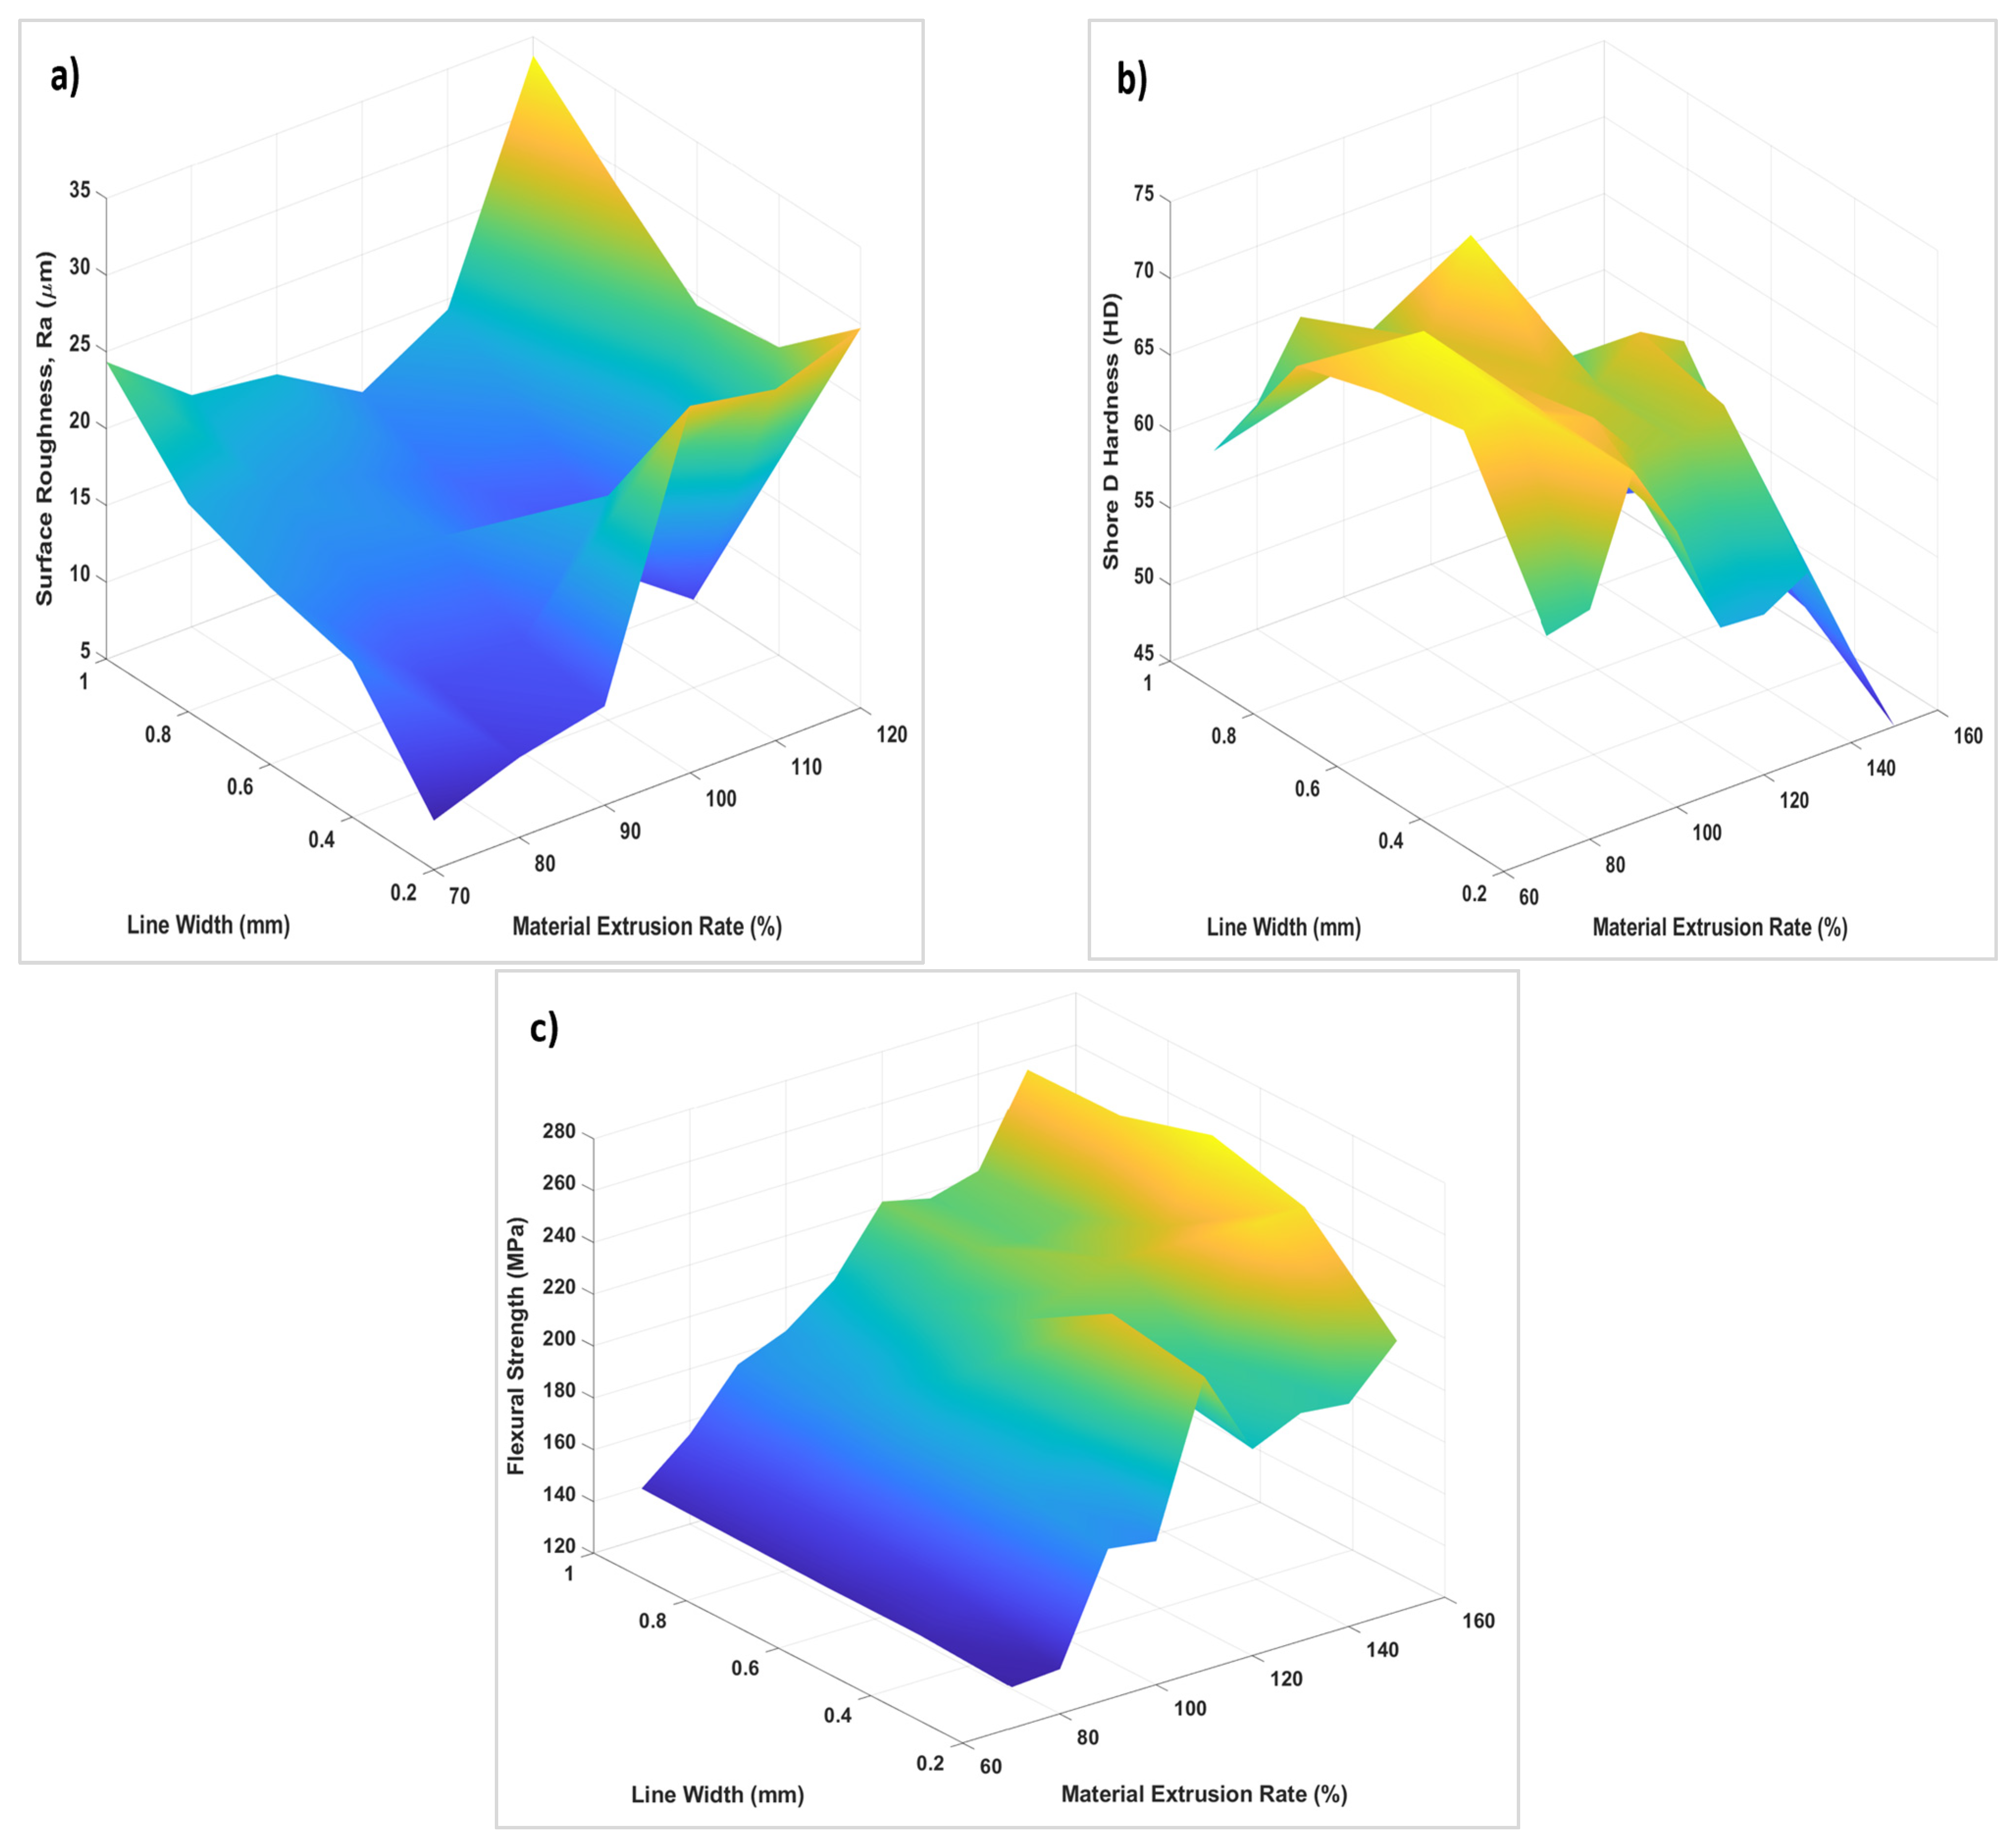
3.3. Surface Roughness Analysis

The layer-be-layer nature of the FFF process result in clear lines that can be felt or clearly seen with the naked eye. Without optimisation of processing parameters, this could become a serious issue when a good surface finish is required. Parts made by FFF suffer greatly from this problem [12,32,47,48,49,50] and with the material extrusion rate as well as line width, more material is being added, leading to gaps (under-extrusion) or material accumulation (over-extrusion) during the printing process. To assess the surface roughness of the GPLA specimens, Surftest SJ-210 contact-type surface profilometer was used and all the specimens were measured with the traverse direction being diagonally across the building direction at an angle of 45°. It is to be noted that over-extruded specimens exhibit poor surface finish due to material accumulation and hence have resulted in their peak/valley measurements exceeding the 360 µm range of the profilometer. Therefore, the specimens shown in this section only range from 70% to 120%. The average surface roughness (Ra) values measured along the length of the rectangular specimens are shown in Figure 5. It can be seen that the surface roughness increased with increase in extrusion rates as more material get deposited. It started lower for under-extruded specimens and then increased gradually for over-extruded specimens [32]. The surface roughness was also affected by increase in line widths as all the under-extruded specimens exhibited higher values with larger line widths. This is because at larger line widths, more material covers the surface and can create excessive overlap leading to higher values of peaks/valleys during measurements. As the extrusion rate increased, smaller line widths resulted in higher roughness values due to difficulties in generating a uniform filament flow and showed better results at 0.6 mm and 0.8 mm line widths (for 100% and 110% extrusion rates). At 120% extrusion rate, a pattern similar to other over-extruded specimens was observed but with the exception that the highest surface roughness value was observed at the largest line width. The lowest overall surface roughens values were observed for extrusion rates of 80% and 90% for all line widths, indicating that better surface finish can be achieved by extruding at lower extrusion rates [32].

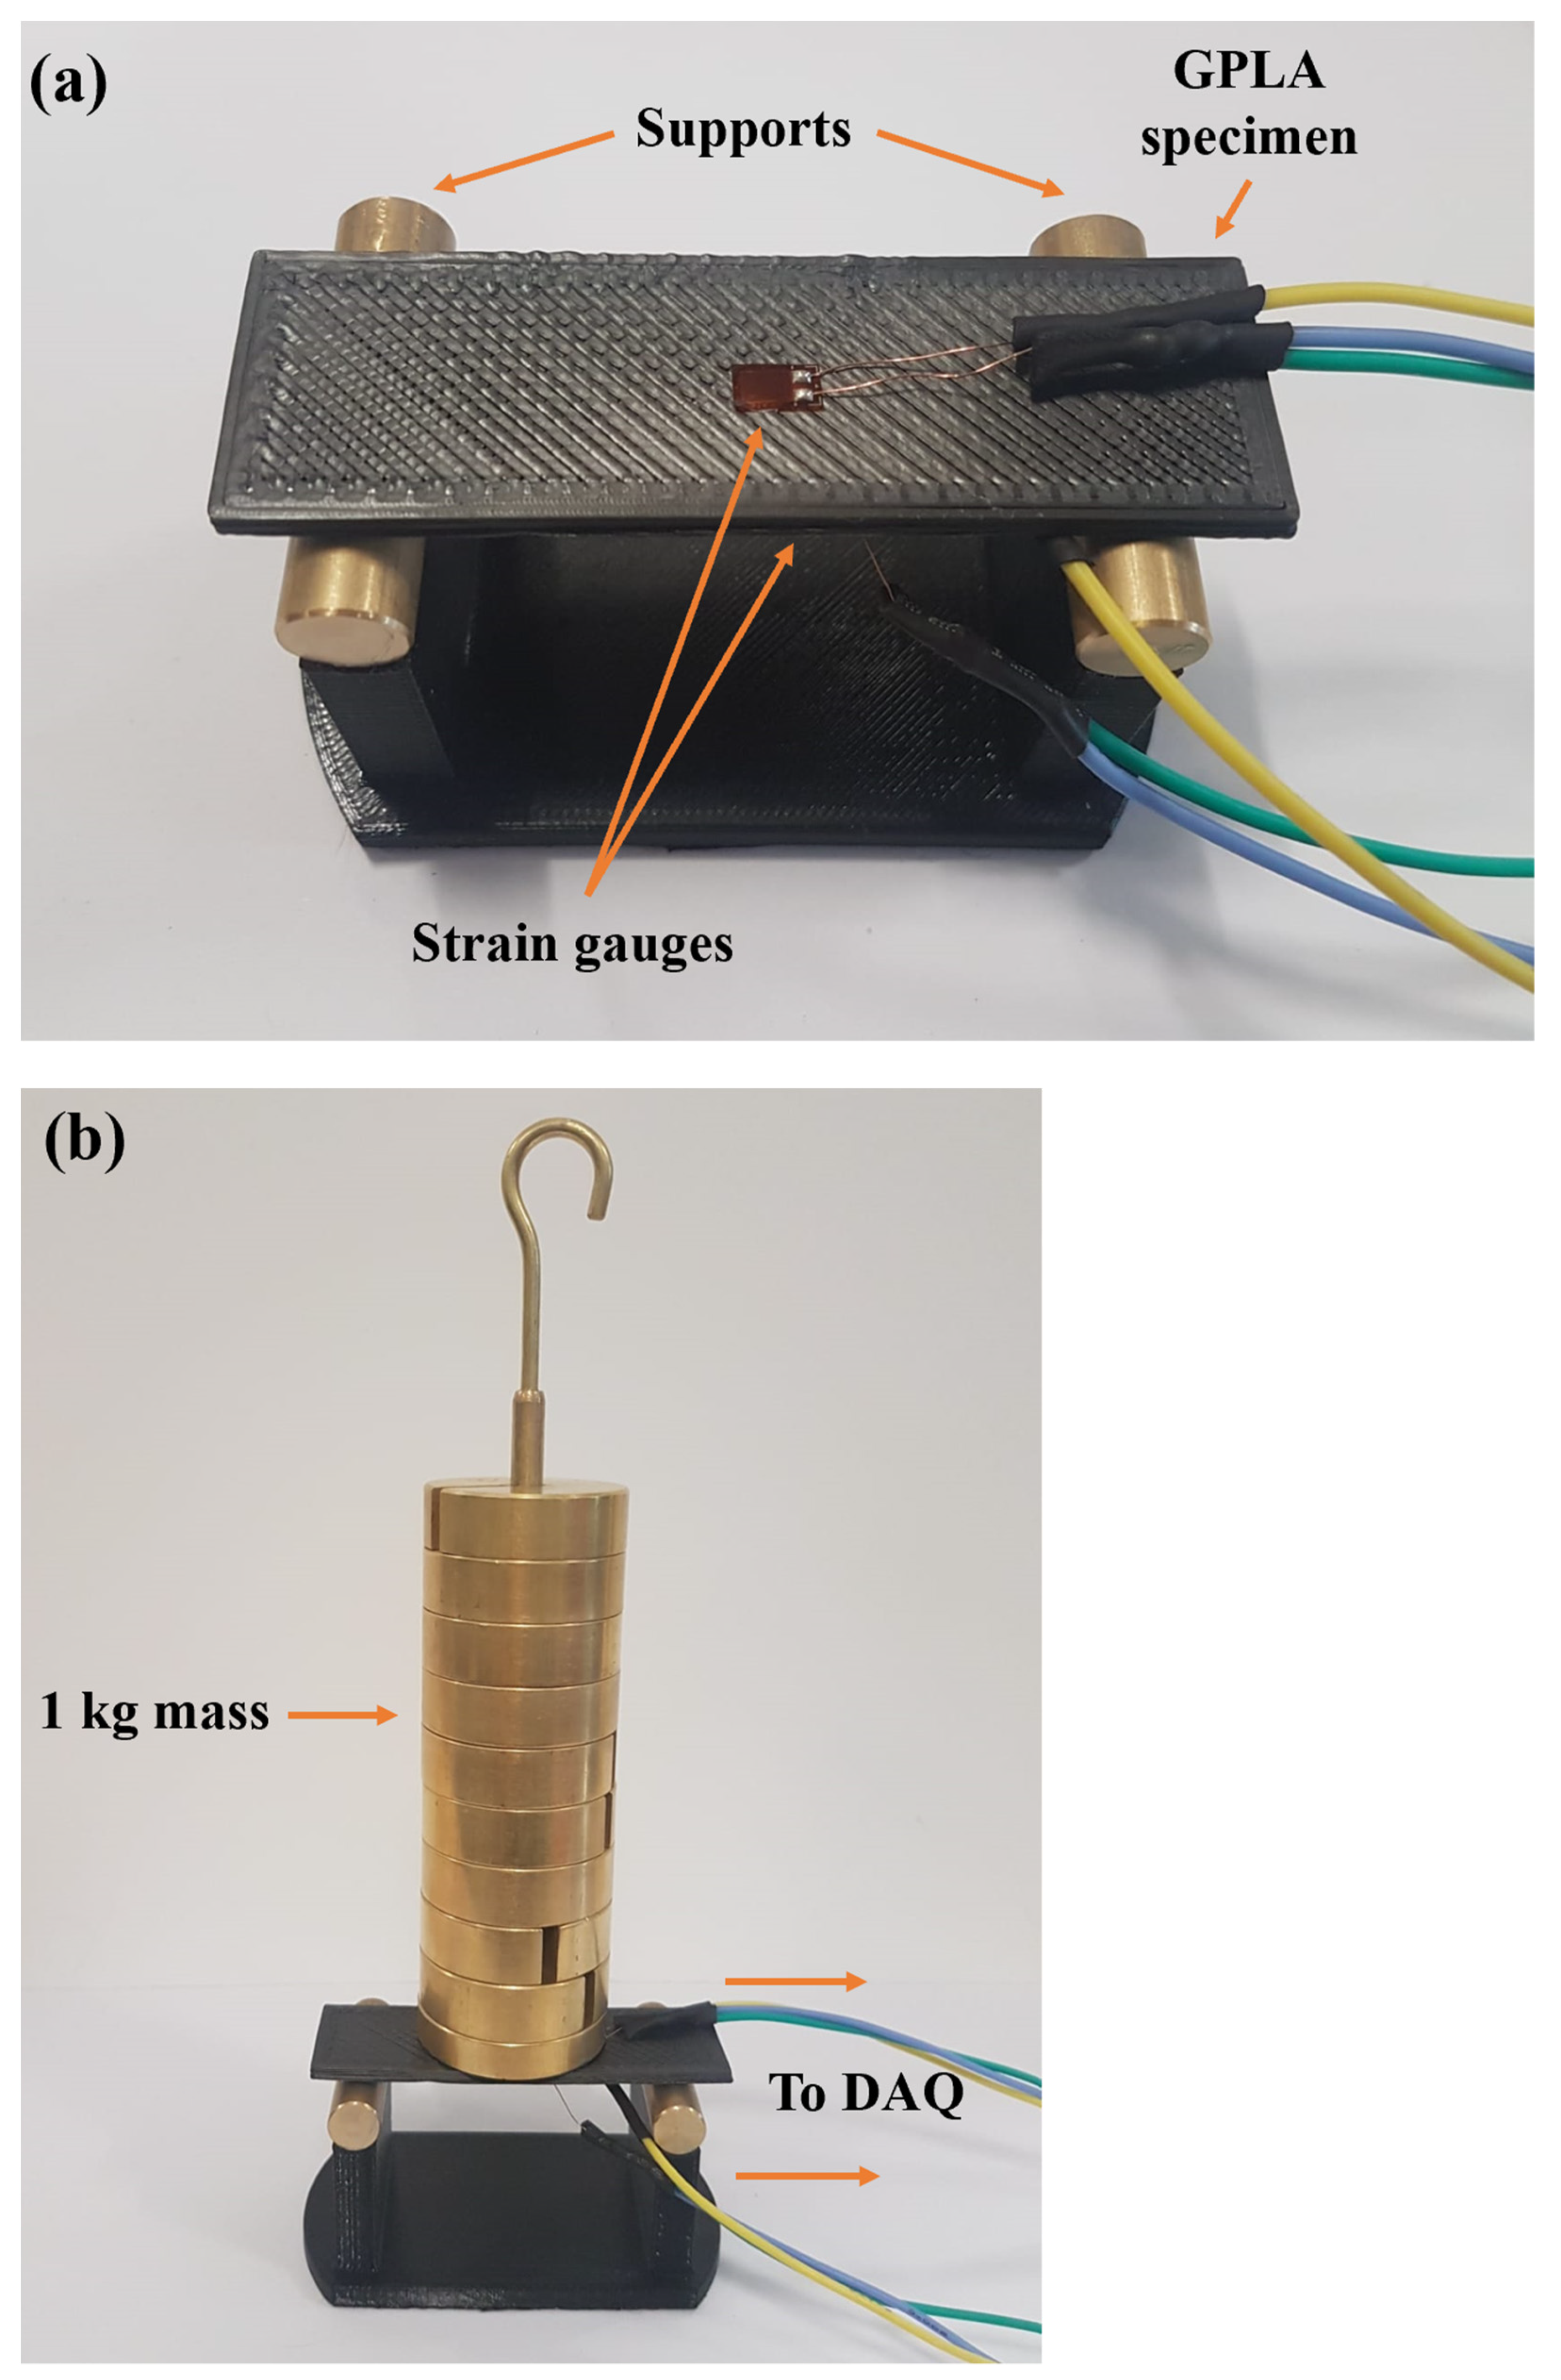
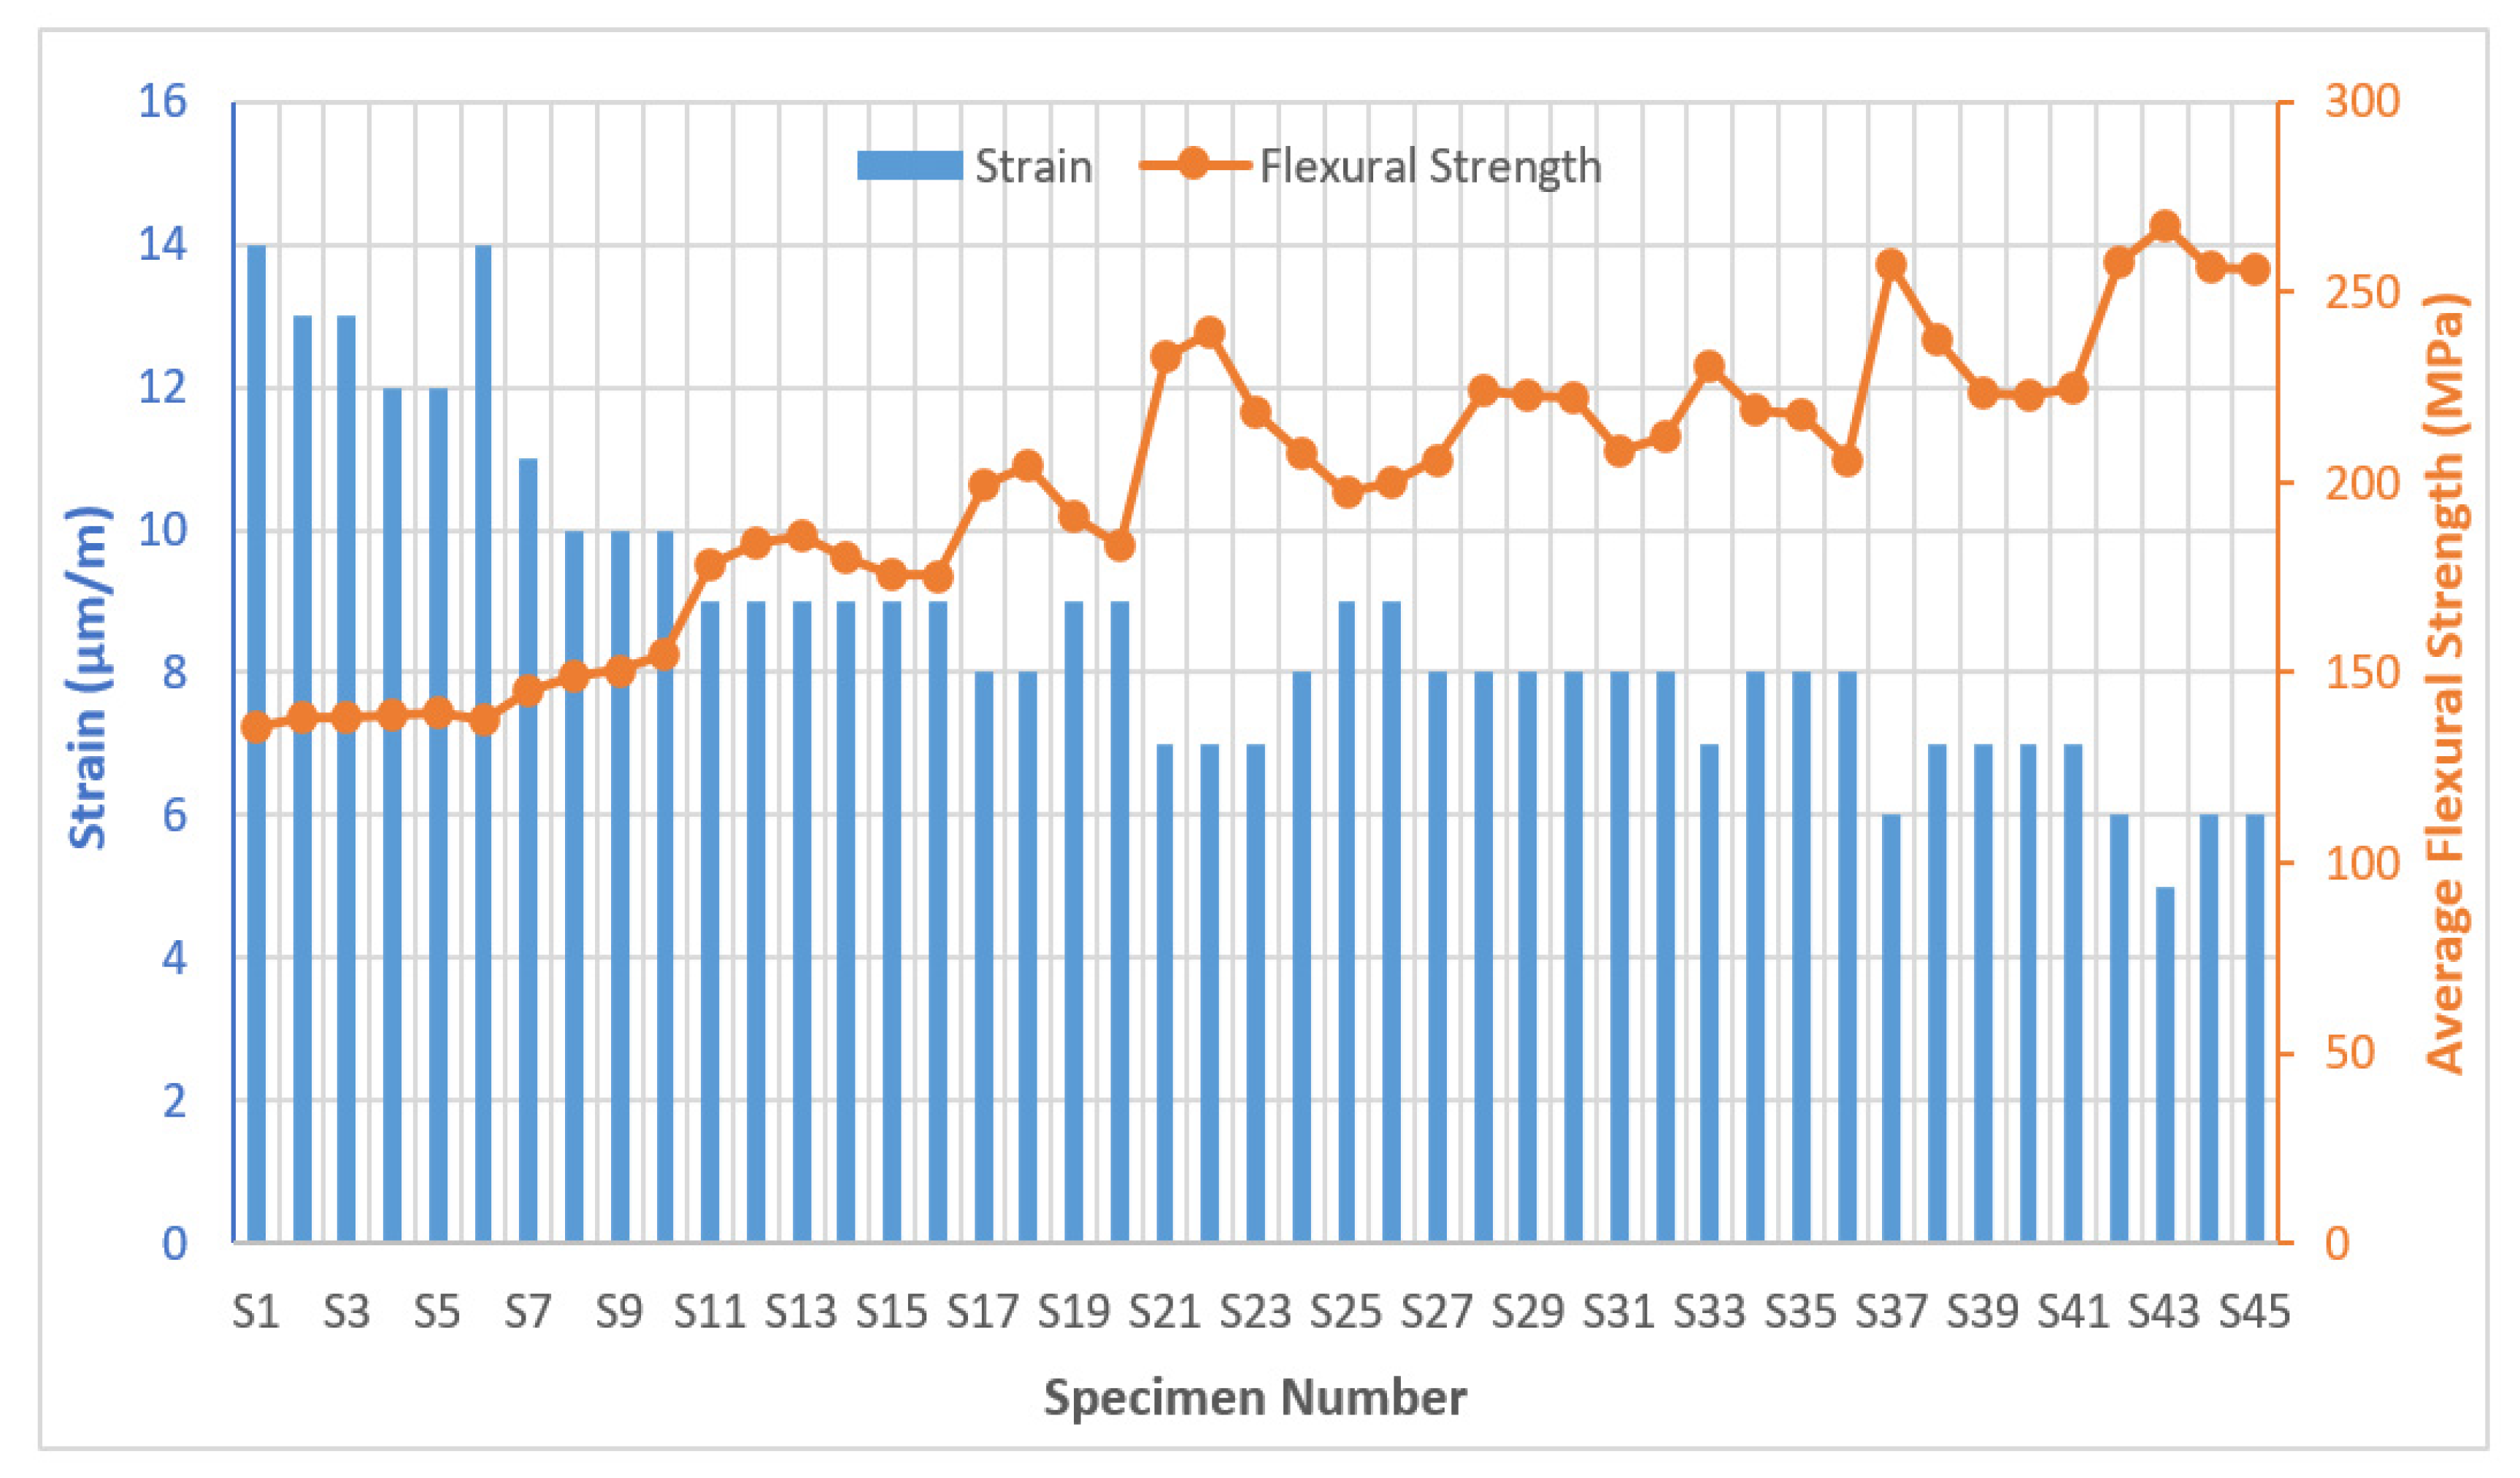
3.4. Strain Measurement

Strain measurement is being used in this study as a non-destructive test (NDT). Two 350-ohm strain gauges were bonded to all the rectangular specimens to measure strain upon the application of a static load of 1000 g (1 kg) at room temperature. The specimens were placed on two rollers of 10 mm diameter, and the strain values were recorded using the HBM QuantumX MX 1615B system. The upper strain gauge recorded the compressive strain whereas the lower gauge measured the tensile strain as the load is being applied in the middle of the specimen where the gauges were bonded [44]. The results of the static loading are shown in Figure 6. It is evident that the strain values decreased with the increase in both extrusion rates and line widths, indicating that at higher rates and larger line widths the specimens deflected less due to the presence of more material and thicker layers. The lowest strain values were observed for the highest extrusion rate of 150% for all line widths whereas the highest values were seen at the lowest extrusion rate of 70%. This is a useful non-destructive test that can help in evaluating the properties of a material. It is to be noted that several factors could affect the strain measurements. They include the size and placement of the strain gauges as well as ambient noise and temperature. the conditions were kept consistent in this case and the application of load, albeit static, is similar to how a three-point flexural test is conducted. Therefore, this non-destructive test can form the basis for evaluating the flexural properties of the GPLA specimens (Section 3.6).

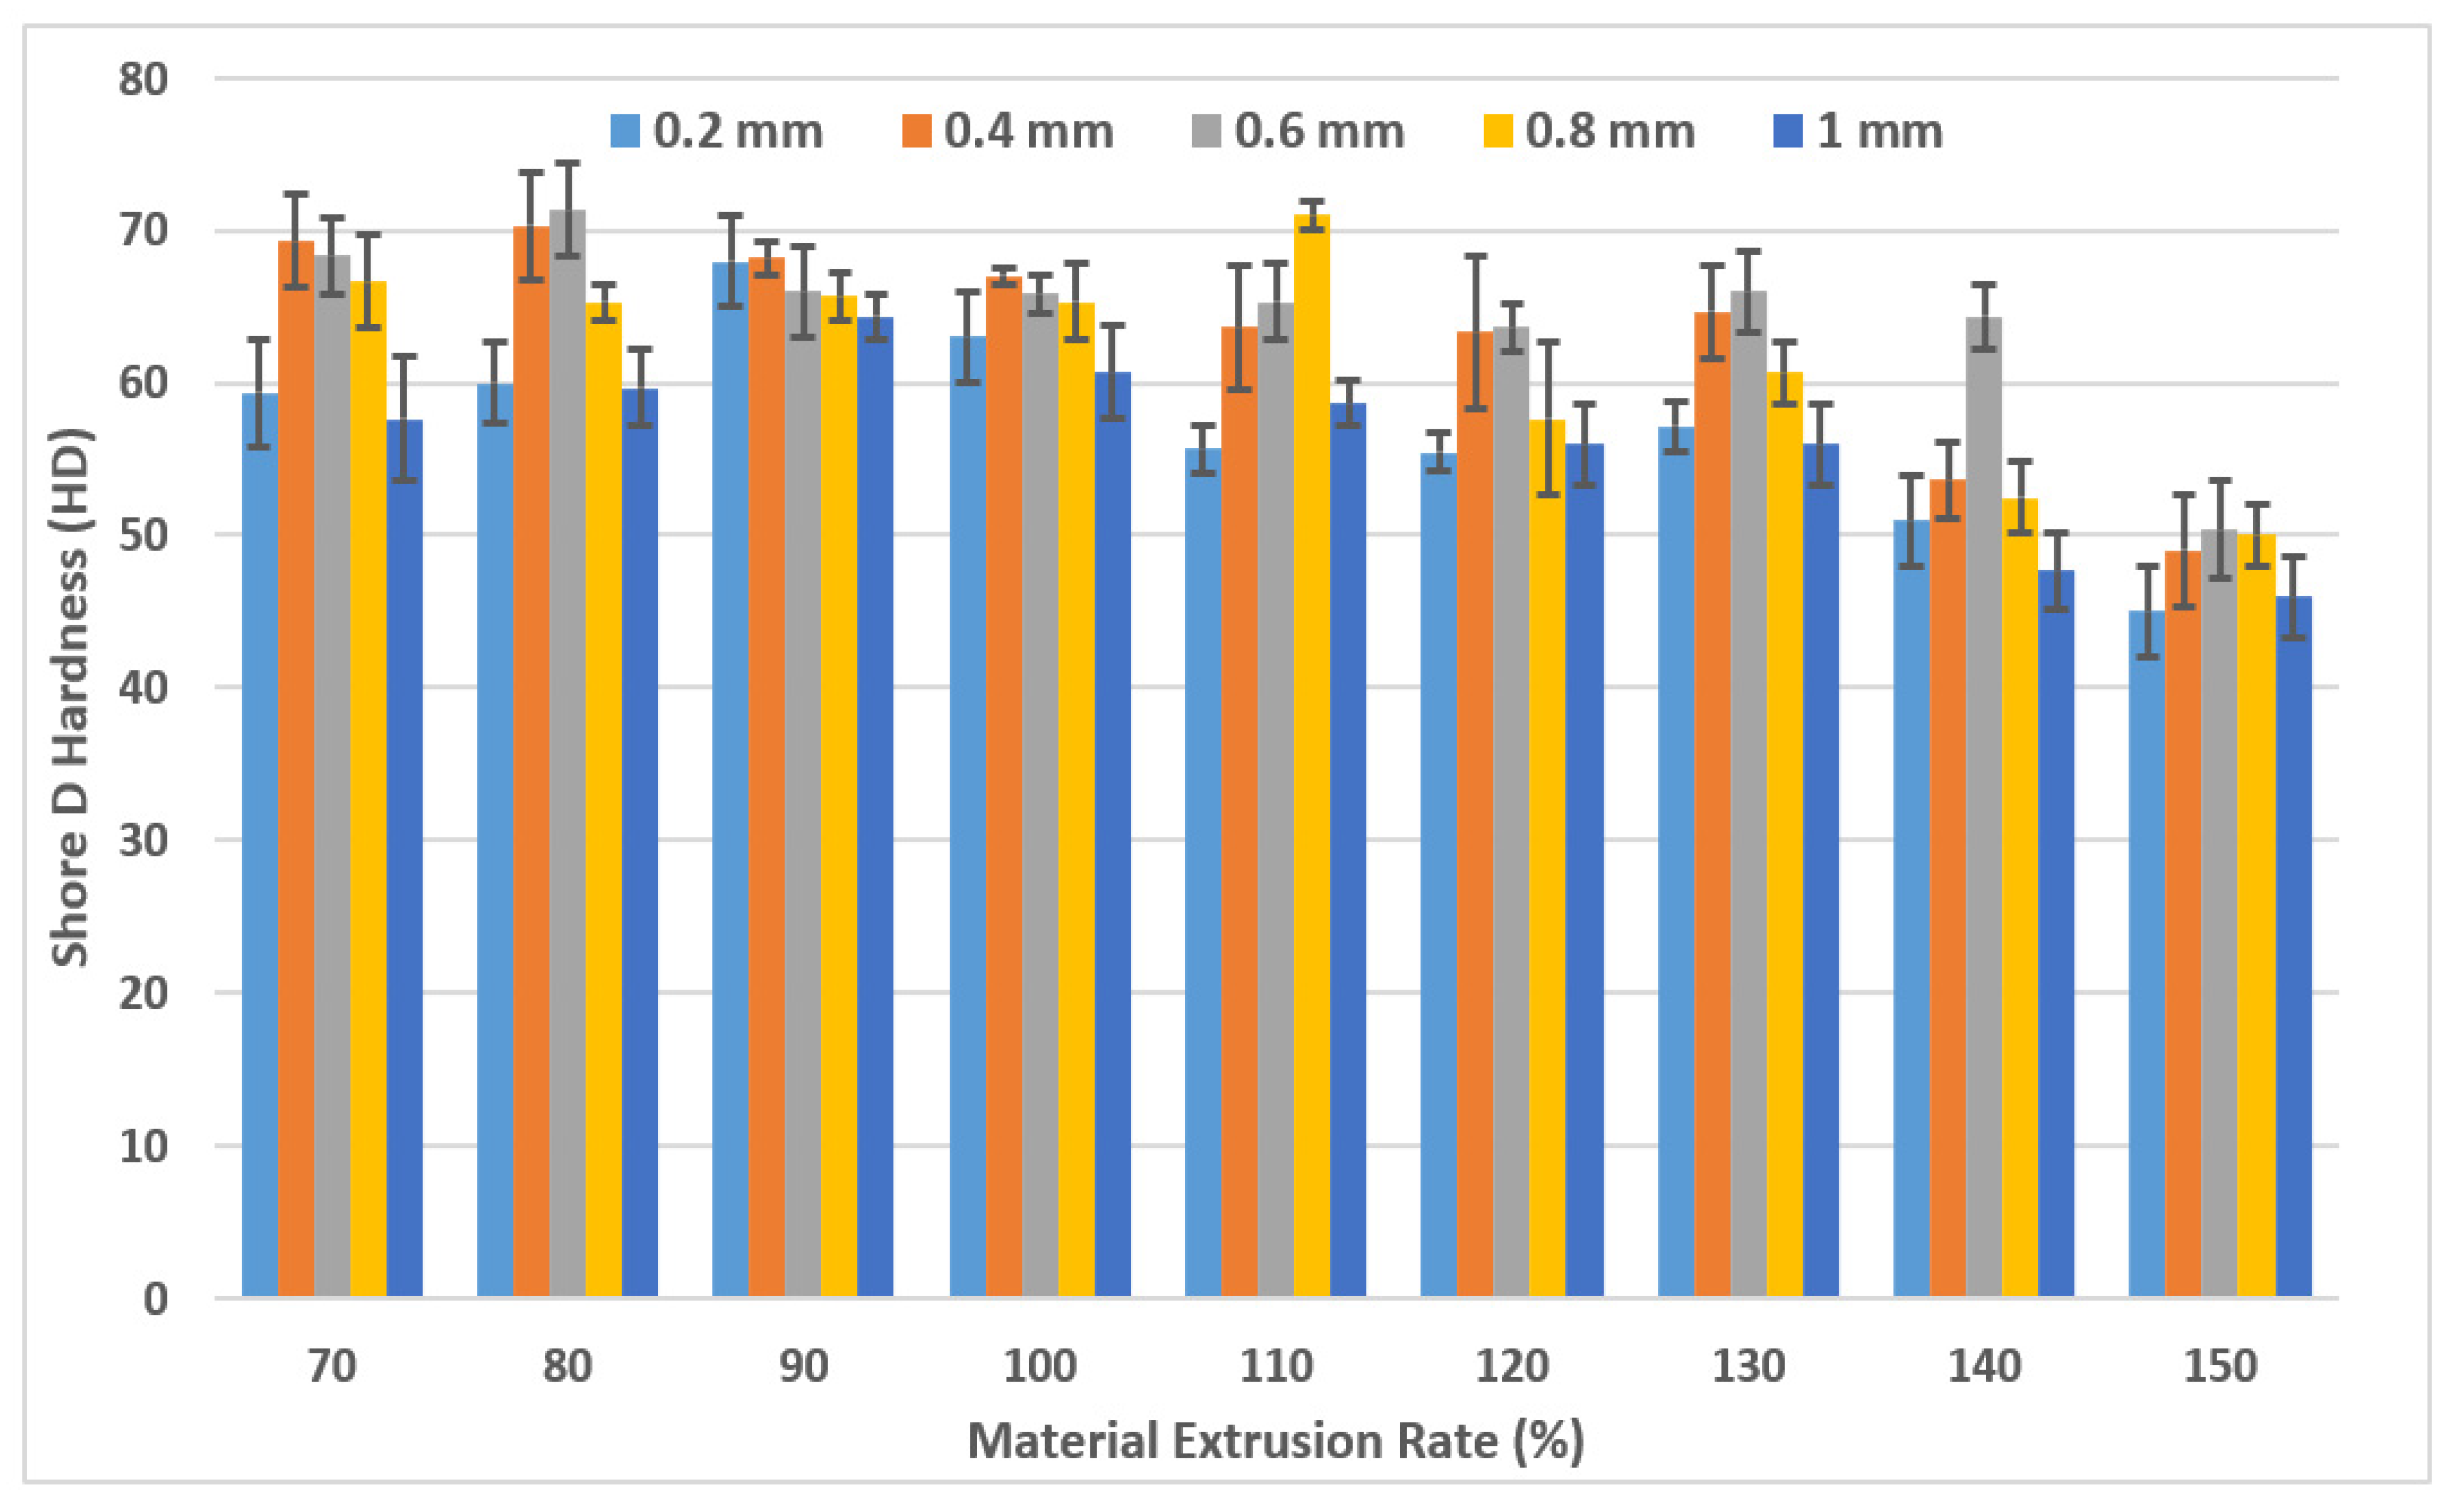
3.5. Hardness Testing

Hardness is the resistance to permanent deformation exhibited by a material because of penetration by another harder material. This resistance is higher if the atoms at the surface are tightly packed with each other resulting in higher hardness values [9]. Indentation hardness testing leaves behind marks or imprints on the tested parts. The results from hardness testing are shown in Figure 7. It is evident that the hardness values reduced with the increase in extrusion rates. This is because the excess material accumulated on the surface of the specimens left behind higher peaks and lower valleys with minimal support underneath to resist deformation due to indentation. It can also be seen that the hardness values are the lowest at smaller and larger line widths. The issue with smaller line width is that it is difficult to generate a uniform filament flow as the filament lines trickle unevenly onto the printing plate and can melt in the process. Larger line width can offer a more spread-out layer that is unable to provide substantial resistance to the indentation. The line widths of 0.4 mm, 0.6 mm, and 0.8 mm showed the highest values for all the different extrusion rates. The highest hardness numbers were obtained at extrusion rate of 90% whereas the lowest were obtained at 150%. These results indicate that high hardness numbers can be achieved through under-extrusion and at line widths larger than the nozzle diameter.

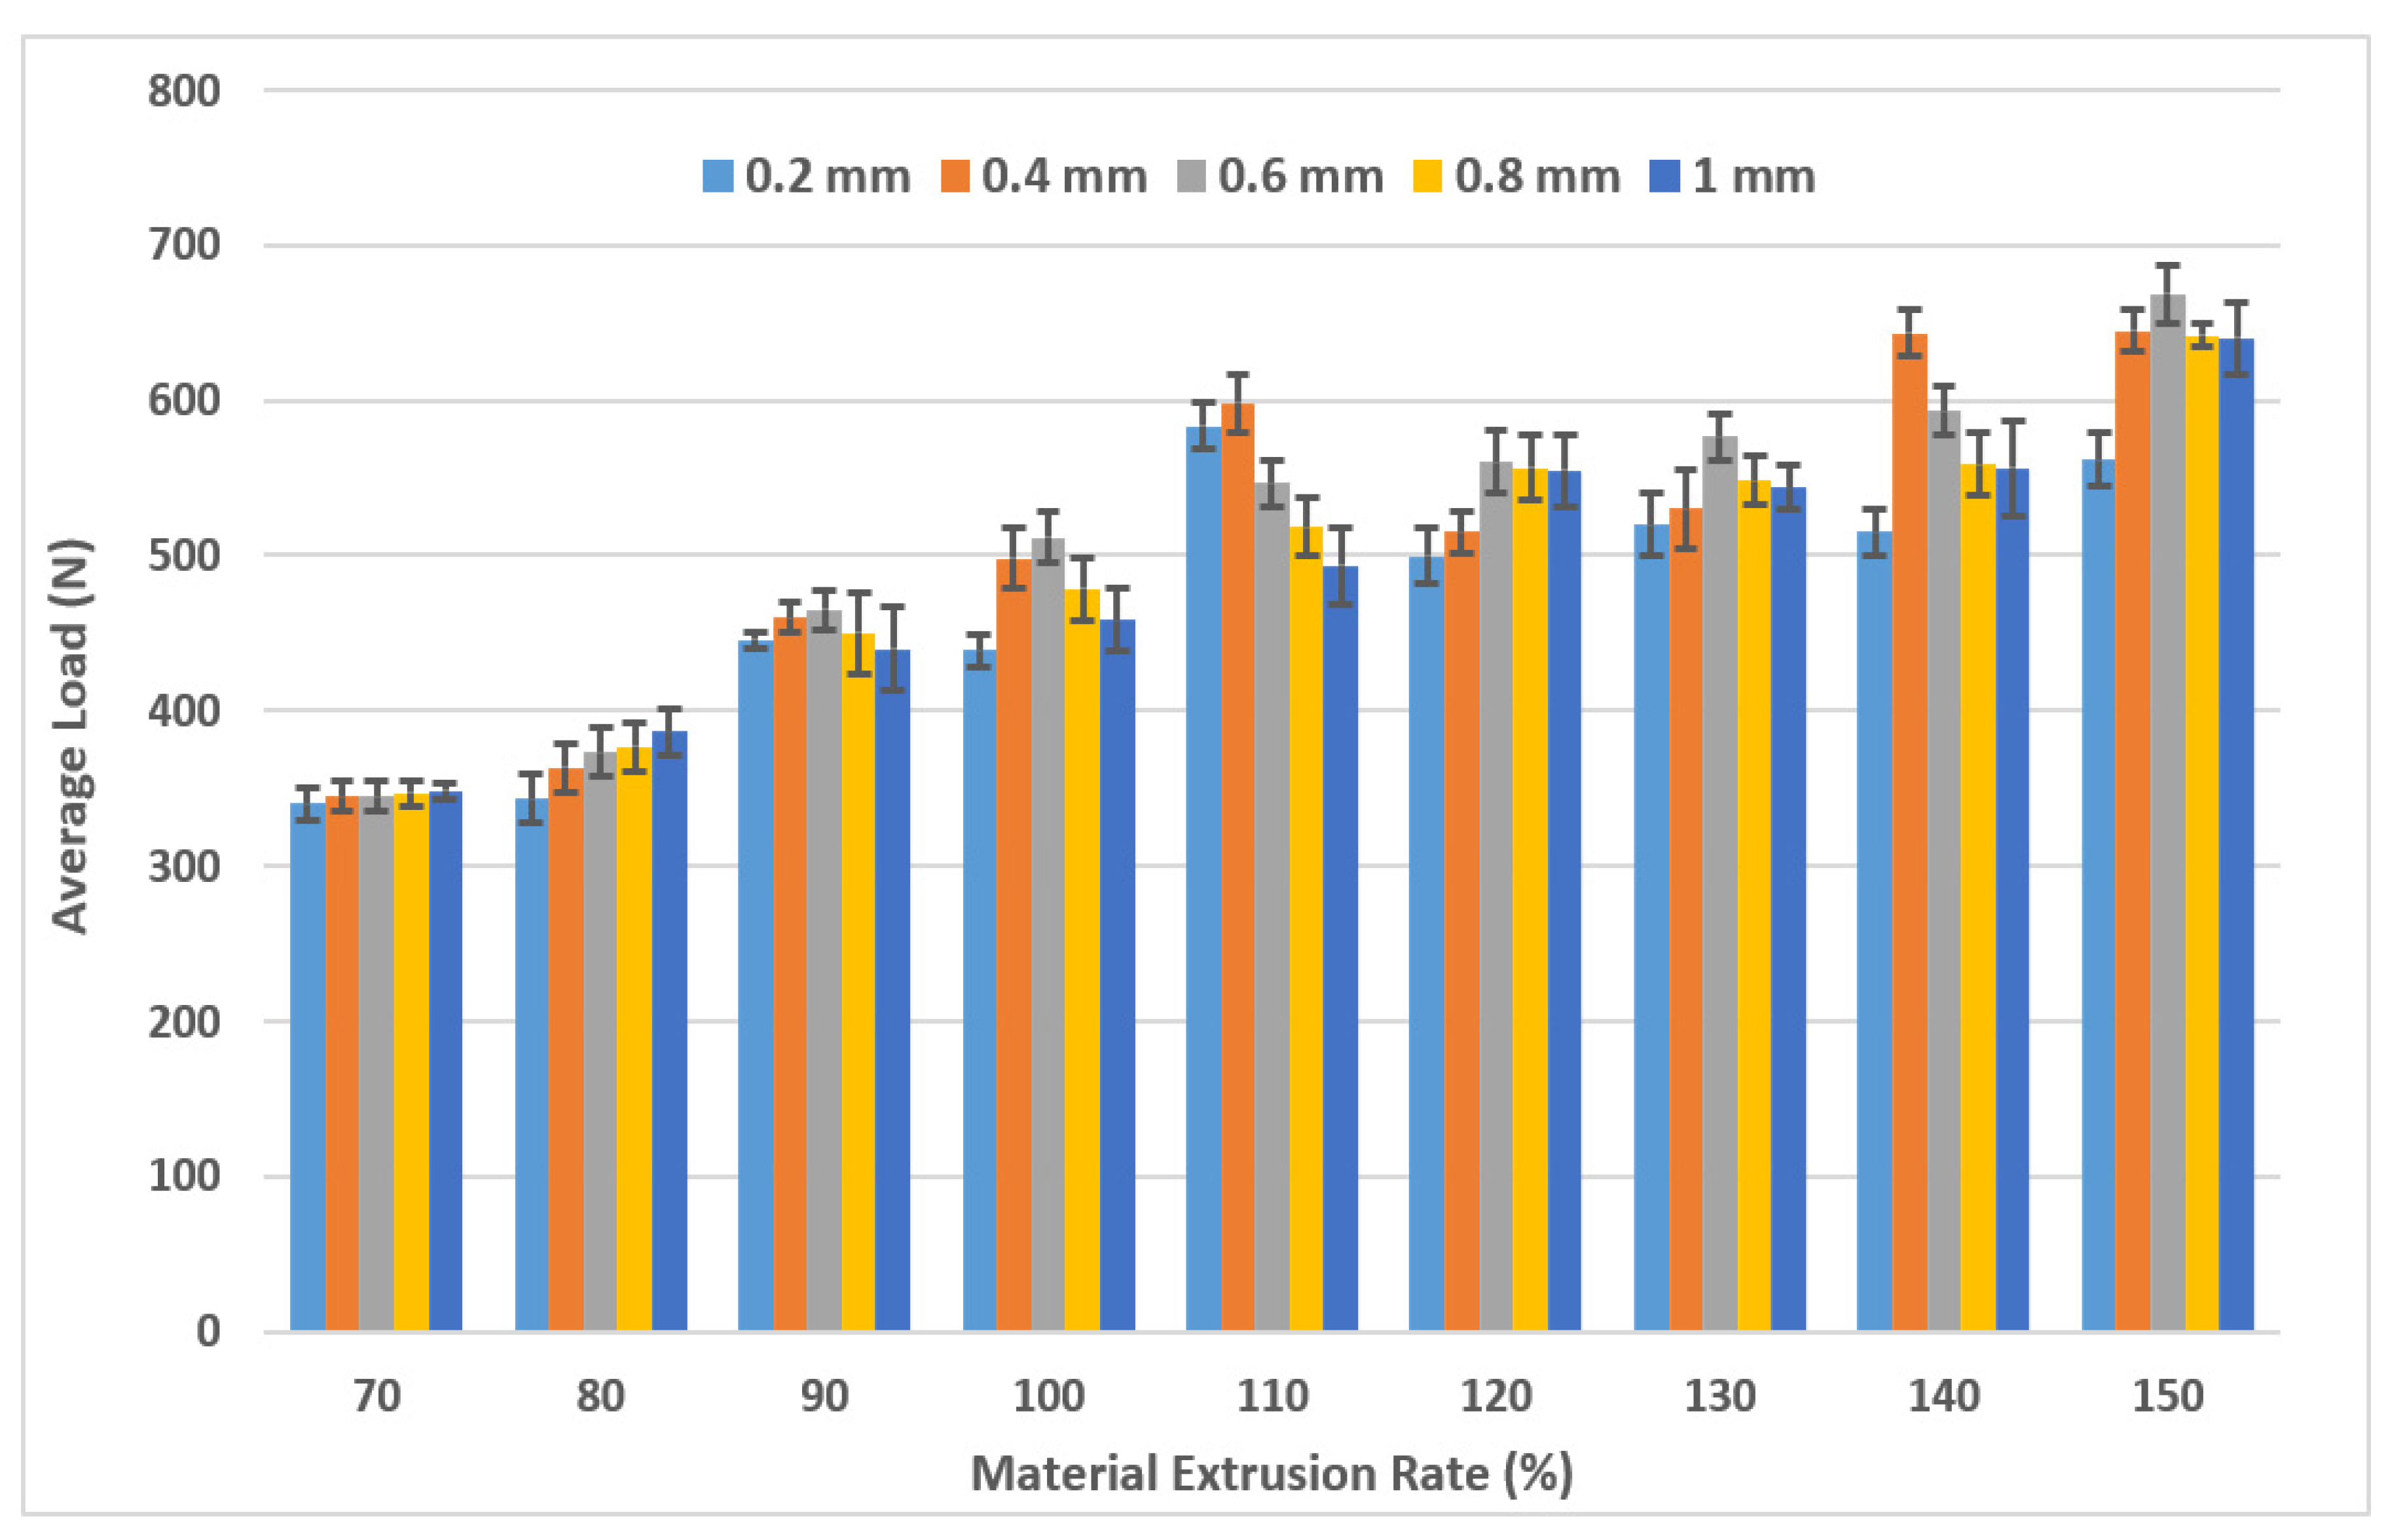
3.6. Three-Point Flexural Testing

Increasing the extrusion rate and line width results in faster prints. However, printing time is often a non-factor to achieve desired properties in parts. A three-point flexural test measures the force required to bend a beam under three-point loading conditions. It is used to determine the flex or bending properties of a material and for selection of parts that will support loads without flexing [9,22,51]. The results from the three-point flexural testing are shown in Figure 8. It can be seen that as the extrusion rate increased, the load required to fracture the specimens also increased due to the presence of excess material as discussed in Section 3.1 and Section 3.2. This increased in fracture load values is because higher extrusion rates and larger line widths require the pressure inside the nozzle to be higher as well to squeeze the material out of the nozzle and this additional pressure does not only squeeze the material to the sides but also presses the individual layers together more, thus, improving the bonding between the layers. Similar to hardness testing, the smallest and the largest line widths do not always provide the highest load values, but the in-between line widths show better results in terms of exhibiting higher fracture loads.
To assess the applicability of the strain measurements (Section 3.4) and their correlation with the flexural testing, a compound graph is shown in Figure 9. It can be seen that there is an exceptionally good correlation between the strain values and the average flexural strength of all the combinations. This could be attributed to the fact that the setup for strain measurements is quite similar to the three-point flexural testing as a load, albeit static, is being applied in the middle of the rectangular specimens. It is also evident that the influence of the two processing parameters, i.e., extrusion rate and line width has been well-captured. The strain values show a clear dip upon an increase in flexural strength as specimens exhibiting higher resistance to bending show lower strain values.

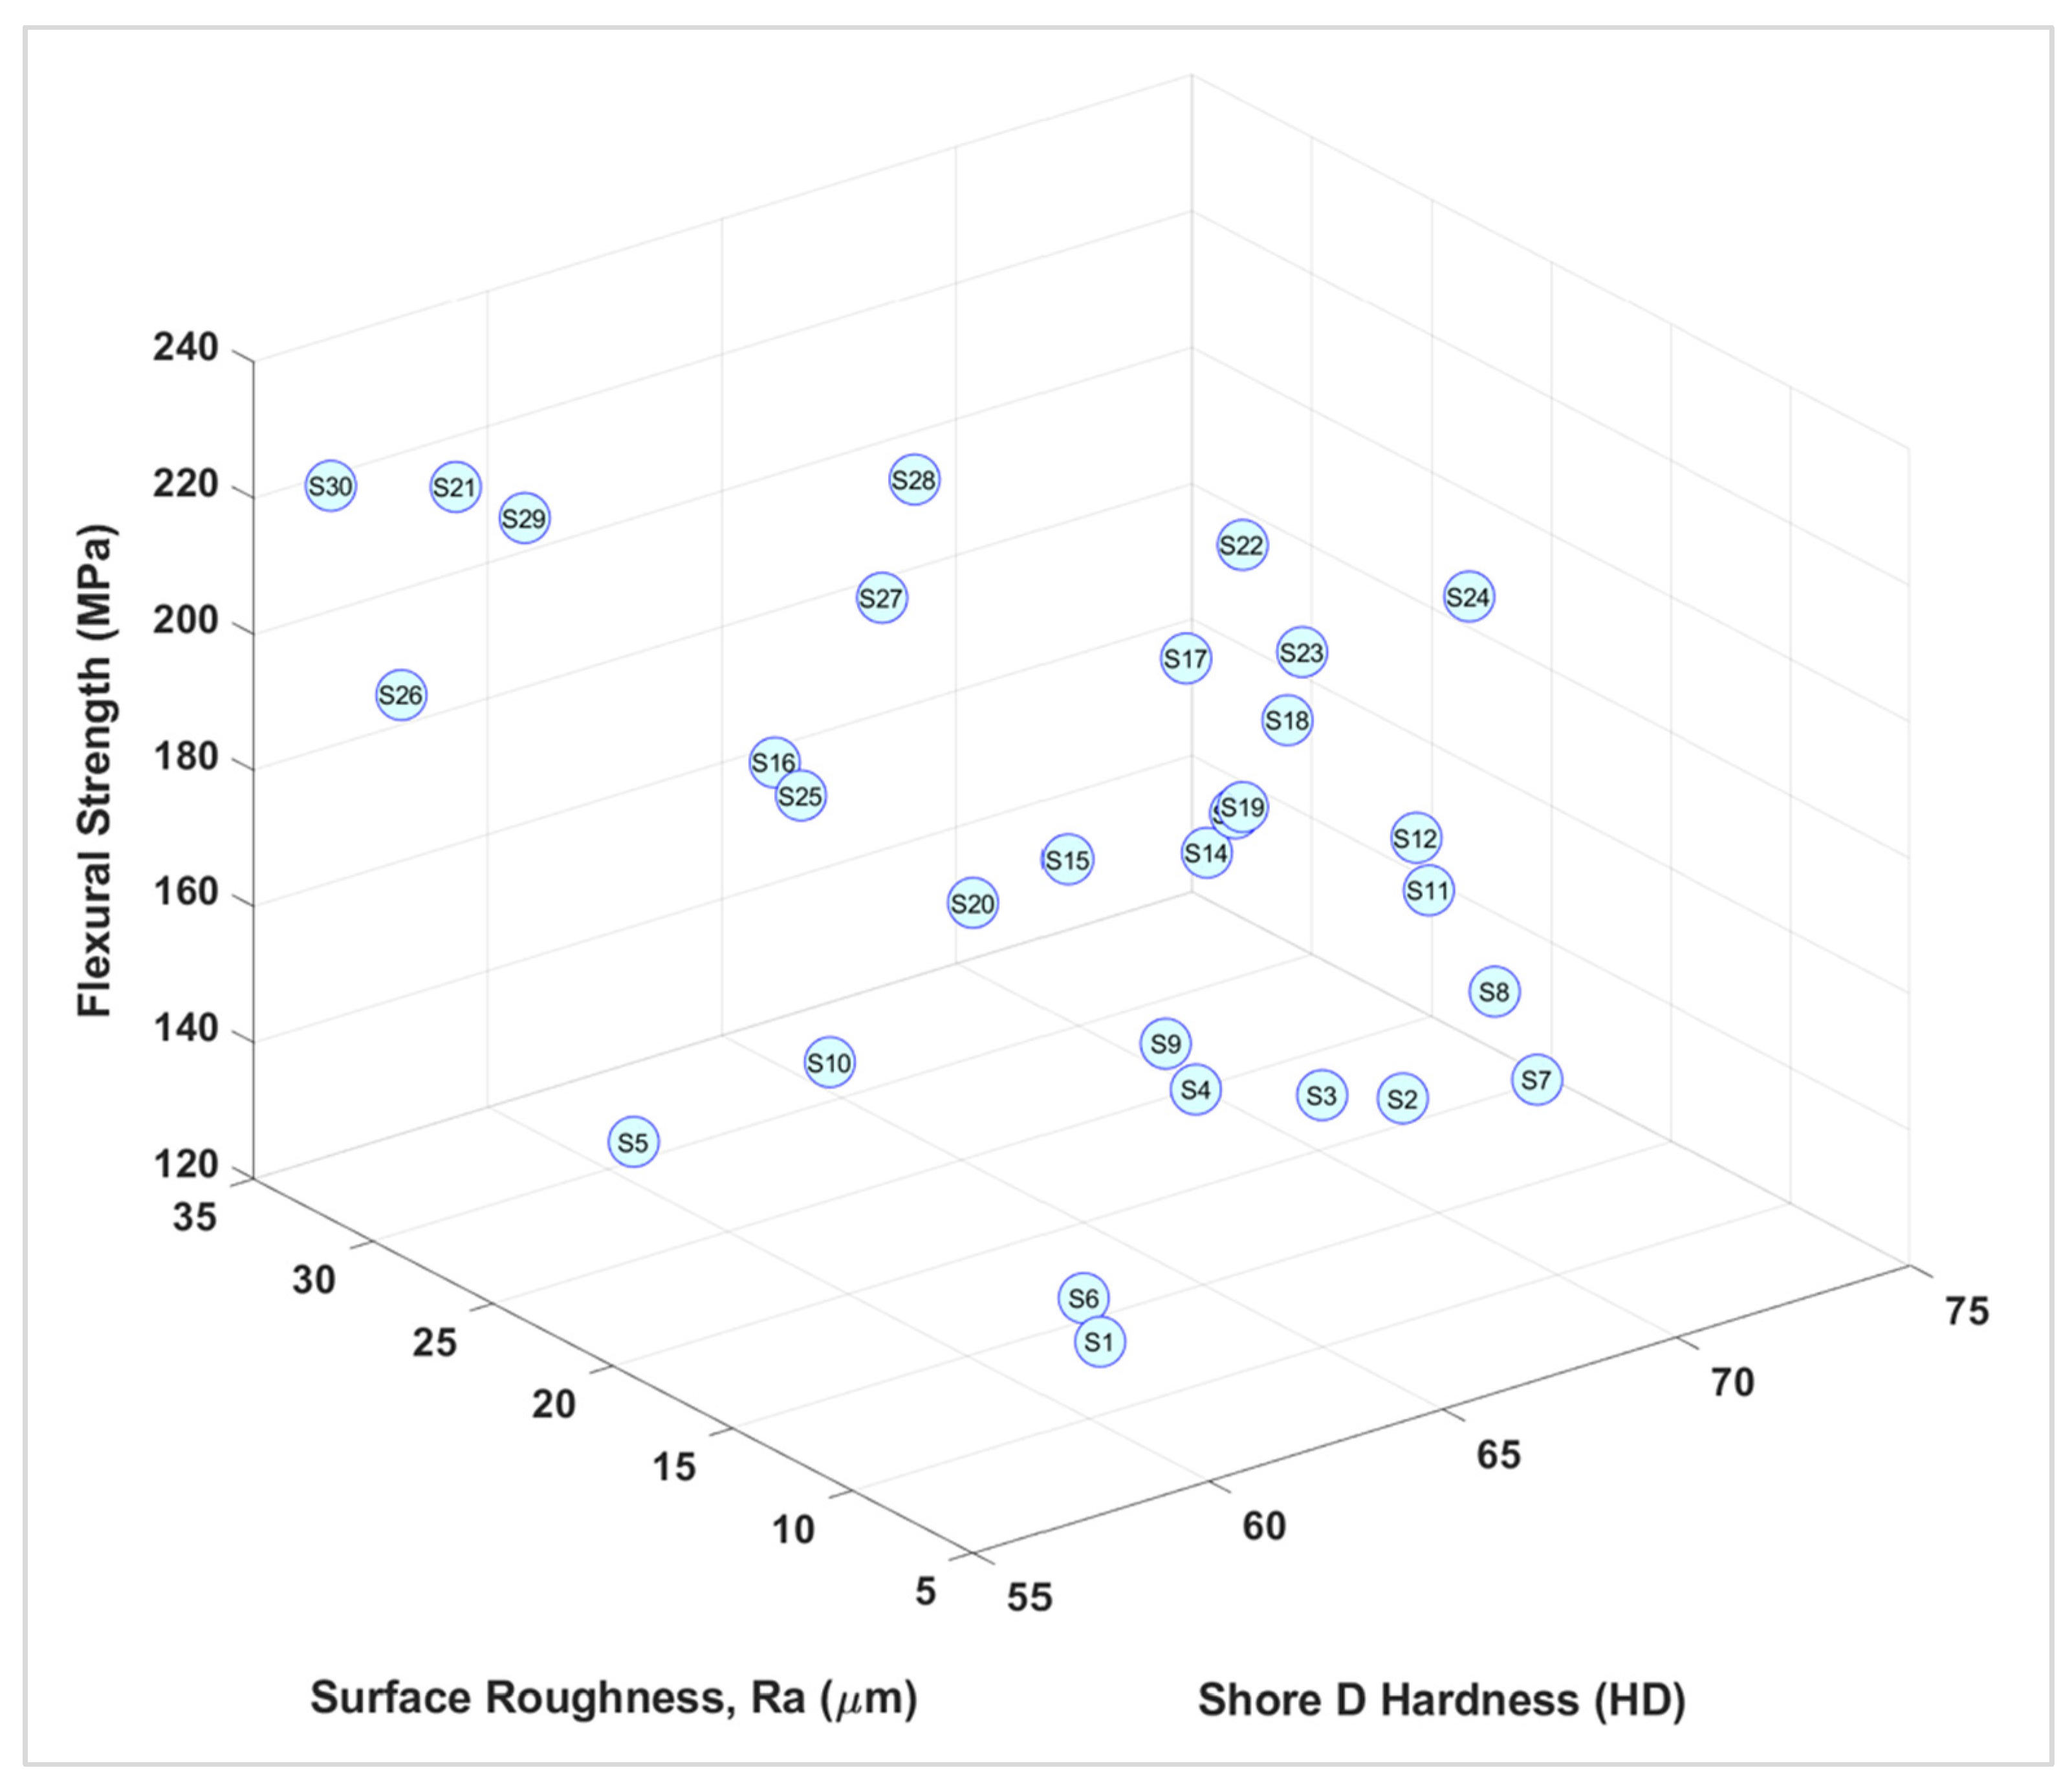
4. Material Quality Characterization

The focus of his work is to analyse the influence of material extrusion rates and line widths on GPLA to provide an in-depth understanding of the trade-offs that can be made while manufacturing parts using the FFF process specifically in terms of dimensional accuracy, surface texture, hardness, and flexural strength. These are common issues associated with FFF-printed parts [11,12,13,14,15,16,17,18,19,20,21,22,23,24,25,26,27,32,34,46,47,48,49,50,51]. It has been established through the results in this work that small line widths provide more accuracy with longer print times whereas large line widths offer more stability with shorter printing times. Modifying the processing parameters of material extrusion rate and line widths can help in achieving desired properties in FFF-printed thermoplastic products. Therefore, it is imperative to understand their effect and avoid using the default values set by slicing software packages (i.e., 100% material extrusion rate and 0.4 mm line width).
It has been observed that surface roughness increases with increasing extrusion rates, which is an issue. On the other hand, the hardness and average flexural strength values also increase with higher extrusion rate and larger line widths. This demonstrates a direct correlation of these parameters to the mechanical properties of the manufactured parts and require optimisation of these parameters. Therefore, to understand the cumulative influence of material extrusion rates and line widths on FFF-printed GPLA specimens, surface plots for surface roughness, hardness, and flexural strength are shown in Figure 10. While all surface plots show a consistent gradient as the line width and material extrusion rate is increased for the specimens (upward for the flexural strength, downward for the hardness, and a monkey saddle shape for the surface roughness), there are some noteworthy extremums giving more insight into their correlation. For example, the global minimum surface roughness is observed at 70% material extrusion rate and 0.2 mm line width (approx. 8.2 µm). However, there is local minimum of 10.7 µm at 110% material extrusion rate and 0.4 mm line width. This local minimum for surface roughness correspond to the local maximum for both flexural strength and hardness. This is due to the fact that as the extrusion rate increase, more material is added to the specimen, resulting in poor surface finish (high surface roughness values). On the other hand, the excess material add to the flexural strength and hardness of the specimen (to a certain level) as more material can resist the flexural load and indentation. This is a useful consideration and should be kept in mind while manipulating the material extrusion rates and line widths for desired results. This is also the reason that the surface roughness analysis was only done up to 120% material extrusion rate as afterwards, the surface roughness values go out of range for the Surftest SJ-210 profilometer. It should also be noted that the local extremums for all three parameters are observed between 110 and 120% material extrusion rates and at line widths of 0.4 mm and 0.6 mm.
If the focus is on achieving the optimal surface finish, then the extrusion rates and line widths can be adjusted as per the results presented in this work for GPLA. However, when the objective is to combine various attributes together, then the combinations of different extrusion rates and line widths become important to ensure that the optimal combination can be identified for the application. Consider a scenario with specific requirements of surface finish, hardness, and flexural strength, then the first thing would be to know these values for the different combinations of extrusion rates and line widths. These combinations are already shown in Table 1. The next step would be to plot these three attributes against each other with the different specimens to visualise their distribution [32] as shown in Figure 11. In this context, consider that a product made of GPLA is needed with a maximum surface roughness of 14 µm, hardness of over 65 HD, and flexural strength of more than 200 MPa. Considering that GPLA specimens over 120% extrusion rate were out of range for surface roughness measurements (meaning they had an extremely poor surface finish), only the first 30 specimens (up to 120% material extrusion rate) are plotted in Figure 10. It can be seen that only two combinations fulfil the three defined attributes of surface roughness, hardness, and flexural strength, i.e., S18 and S23. Their description is provided in Table 3. All the requirements are fulfilled by these specimens, and they show the significance of using different extrusion rates and line widths. In both cases, the line width is more than the conventional 0.4 mm and represents that larger line widths can also prove to be useful based on product requirements. In this case, either of these specimens can be manufactured as their properties are very similar. However, S23 should be preferred as it shows slightly better characteristics with comparatively lower surface roughness and higher flexural strength. This is an important aspect of the analysis that helps in quantifying the results and enabling the user in understanding the limitations of the default slicer software settings as well as identifying the impact of manipulating different processing parameters to achieve optimal results for different applications.

5. Conclusions

Material extrusion rate and line width are two under-researched and overlooked parameters in FFF and are automatically set by slicing software packages to 100% and equal to the extrusion nozzle diameter, respectively. However, their modification can help in achieving better results in terms of dimensional accuracy, surface texture, and mechanical properties. This study has presented an extensive analysis on the influence of nine different material extrusion rates (70% to 150%) and five different line widths (0.2 mm to 1 mm) on FFF-printed GPLA parts. The results show that manipulation of these two processing parameters is critical to identify the optimal combination and achieve desired results.
In terms of mass, increase in material extrusion rates and line widths resulted in mass reduction due to excess material getting swept away and accumulating on the edges as the nozzle make a pass over the printed surface and breaking away in beads/pieces with every pass of the nozzle as the part is completed. The dimensions were not significantly affected along the X and Y axes. However, increase in material extrusion rates and line widths led to significant increase in thickness (along the Z-axis) of the GPLA specimens. The lowest surface roughness was obtained for under-extruded specimens at 80% and 90%. As the extrusion rate increased, smaller line widths resulted in higher roughness values due to their inability to deposit material uniformly. These results indicate that better surface finish can be achieved by extruding at lower extrusion rates.
Strain measurements were recorded as a non-destructive test using two 350-ohm strain gauges on each specimen. Strain values decreased with the increase in both extrusion rates and line widths, indicating that at higher rates and larger line widths, the specimens deflected less due to the presence of excess material and thicker layers. Indentation hardness testing showed that the hardness values reduced with the increase in extrusion rates. Furthermore, the highest values for all the different extrusion rates were observed at line widths of 0.4 mm, 0.6 mm, and 0.8 mm. Three-point flexural testing showed that the flexural strength gradually increased with increase in material extrusion rates due to thicker specimens requiring more force to fracture. Like hardness testing, the highest flexural strength was observed line widths of 0.4 mm, 0.6 mm, and 0.8 mm. Moreover, a good correlation between the strain values and the average flexural strength was observed due to the setup of the non-destructive test being similar to the three-point flexural testing, indicating the effectiveness of the NDT in evaluating the flexural properties of GPLA specimens.
The results presented in this work can be extremely beneficial to manufacturers as they investigate two under-researched and overlooked processing parameter (i.e., material extrusion rate and line width) in FFF. They can help identify the limitations of the default settings and can support in achieving desired results in parts made by FFF. It has been demonstrated that increasing the material extrusion rate and line width can add more material and save time in addition to significantly affecting the dimensional accuracy, surface texture, and mechanical properties of GPLA specimens. Designers and manufacturers can use these results and modify the processing parameters to produce better products in a timely manner using FFF. For future work, more processing parameters can be incorporated to investigate their cumulative effect on the properties of composite FFF filaments using complex geometries in varied sizes.

Author Contributions

Conceptualization, J.B.; methodology, J.B.; validation J.B.; formal analysis J.B. and R.B.; investigation, J.B. and R.B.; resources, J.B., R.B. and V.M.; data curation, J.B., R.B. and V.M.; writing—original draft preparation, J.B.; writing—review and editing, J.B.; visualization, J.B. and R.B.; project administration, J.B. and R.B. All authors have read and agreed to the published version of the manuscript.

Funding

This research received no external funding.

Data Availability Statement

The data used in this research work can be made available upon request.

Conflicts of Interest

The authors declare no conflict of interest.

References

  1. Bourell, D.; Kruth, J.P.; Leu, M.; Levy, G.; Rosen, D.; Beese, A.M.; Clare, A. Materials for additive manufacturing. CIRP Ann. 2017, 66, 659–681. [Google Scholar] [CrossRef]
  2. Butt, J.; Mohaghegh, V.; Sadeghi-Esfahlani, S.; Shirvani, H. Subtractive and Additive Manufacturing Applied to Drilling Systems. In Advances in Terrestrial Drilling: Ground, Ice, and Underwater; CRC Press: Boca Raton, FL, USA, 2020; p. 39. [Google Scholar]
  3. Li, N.; Huang, S.; Zhang, G.; Qin, R.; Liu, W.; Xiong, H.; Shi, G.; Blackburn, J. Progress in additive manufacturing on new materials: A review. J. Mater. Sci. Technol. 2019, 35, 242–269. [Google Scholar] [CrossRef]
  4. Butt, J.; Shirvani, H. Additive, subtractive, and hybrid manufacturing processes. In Advances in Manufacturing and Processing of Materials and Structures; CRC Press: Boca Raton, FL, USA, 2018; pp. 187–218. [Google Scholar]
  5. Gomes, T.E.; Cadete, M.S.; Dias-de-Oliveira, J.; Neto, V. Controlling the properties of parts 3D printed from recycled thermoplastics: A review of current practices. Polym. Degrad. Stab. 2022, 196, 109850. [Google Scholar] [CrossRef]
  6. Gardner, J.M.; Stelter, C.J.; Sauti, G.; Kim, J.W.; Yashin, E.A.; Wincheski, R.A.; Schniepp, H.C.; Siochi, E.J. Environment control in additive manufacturing of high-performance thermoplastics. Int. J. Adv. Manuf. Technol. 2022, 119, 6423–6433. [Google Scholar] [CrossRef]
  7. Gao, J. Production of multiple material parts using a desktop 3D printer. In Advances in Manufacturing Technology XXXI: Proceedings of the 15th International Conference on Manufacturing Research, Incorporating the 32nd National Conference on Manufacturing Research, University of Greenwich, London, UK, 5–7 September 2017; IOS Press: Amsterdam, The Netherlands, 2017; Volume 6, p. 148. [Google Scholar]
  8. Butt, J.; Onimowo, D.A.; Gohrabian, M.; Sharma, T.; Shirvani, H. A desktop 3D printer with dual extruders to produce customised electronic circuitry. Front. Mech. Eng. 2018, 13, 528–534. [Google Scholar] [CrossRef]
  9. Butt, J.; Oxford, P.; Sadeghi-Esfahlani, S.; Ghorabian, M.; Shirvani, H. Hybrid Manufacturing and Mechanical Characterization of Cu/PLA Composites. Arab. J. Sci. Eng. 2020, 45, 9339–9356. [Google Scholar] [CrossRef]
  10. Struzziero, G.; Barbezat, M.; Skordos, A.A. Assessment of the benefits of 3D printing of advanced thermosetting composites using process simulation and numerical optimisation. Addit. Manuf. 2022, 54, 102719. [Google Scholar] [CrossRef]
  11. Butt, J.; Bhaskar, R. Investigating the effects of annealing on the mechanical properties of FFF-printed thermoplastics. J. Manuf. Mater. Process. 2020, 4, 38. [Google Scholar] [CrossRef]
  12. Alsoufi, M.S.; Elsayed, A.E. How surface roughness performance of printed parts manufactured by desktop FDM 3D printer with PLA+ is influenced by measuring direction. Am. J. Mech. Eng. 2017, 5, 211–222. [Google Scholar]
  13. Cojocaru, V.; Frunzaverde, D.; Miclosina, C.O.; Marginean, G. The Influence of the Process Parameters on the Mechanical Properties of PLA Specimens Produced by Fused Filament Fabrication—A Review. Polymers 2022, 14, 886. [Google Scholar] [CrossRef]
  14. Kechagias, J.; Chaidas, D.; Vidakis, N.; Salonitis, K.; Vaxevanidis, N.M. Key parameters controlling surface quality and dimensional accuracy: A critical review of FFF process. Mater. Manuf. Process. 2022, 1–22. [Google Scholar] [CrossRef]
  15. Correia, C.; Gomes, T.E.; Gonçalves, I.; Neto, V. Reprocessability of PLA through Chain Extension for Fused Filament Fabrication. J. Manuf. Mater. Process. 2022, 6, 26. [Google Scholar] [CrossRef]
  16. Lu, X.; Zhang, X.; Li, Y.; Shen, Y.; Ma, Y.; Meng, Y. Enhanced Low-Velocity Impact Resistance of Helicoidal Composites by Fused Filament Fabrication (FFF). Polymers 2022, 14, 1440. [Google Scholar] [CrossRef] [PubMed]
  17. Brčić, M.; Kršćanski, S.; Brnić, J. Rotating Bending Fatigue Analysis of Printed Specimens from Assorted Polymer Materials. Polymers 2021, 13, 1020. [Google Scholar] [CrossRef]
  18. Butt, J.; Bhaskar, R.; Mohaghegh, V. Investigating the Effects of Ironing Parameters on the Dimensional Accuracy, Surface Roughness, and Hardness of FFF-Printed Thermoplastics. J. Compos. Sci. 2022, 6, 121. [Google Scholar] [CrossRef]
  19. Aslani, K.E.; Chaidas, D.; Kechagias, J.; Kyratsis, P.; Salonitis, K. Quality performance evaluation of thin walled PLA 3D printed parts using the taguchi method and grey relational analysis. J. Manuf. Mater. Process. 2020, 4, 47. [Google Scholar] [CrossRef]
  20. Vanaei, H.; Shirinbayan, M.; Deligant, M.; Raissi, K.; Fitoussi, J.; Khelladi, S.; Tcharkhtchi, A. Influence of process parameters on thermal and mechanical properties of polylactic acid fabricated by fused filament fabrication. Polym. Eng. Sci. 2020, 60, 1822–1831. [Google Scholar] [CrossRef]
  21. Nuñez, P.J.; Rivas, A.; García-Plaza, E.; Beamud, E.; Sanz-Lobera, A. Dimensional and surface texture characterization in fused deposition modelling (FDM) with ABS plus. Procedia Eng. 2015, 132, 856–863. [Google Scholar] [CrossRef]
  22. Dawoud, M.; Taha, I.; Ebeid, S.J. Mechanical behaviour of ABS: An experimental study using FDM and injection moulding techniques. J. Manuf. Process. 2016, 21, 39–45. [Google Scholar] [CrossRef]
  23. Kumar, S.R.; Sridhar, S.; Venkatraman, R.; Venkatesan, M. Polymer additive manufacturing of ASA structure: Influence of printing parameters on mechanical properties. Mater. Today Proc. 2021, 39, 1316–1319. [Google Scholar] [CrossRef]
  24. Martínez, J.M.V.; Vega, D.P.; Salguero, J.; Batista, M. Evaluation of the printing strategies design on the mechanical and tribological response of acrylonitrile styrene acrylate (ASA) additive manufacturing parts. Rapid Prototyp. J. 2022, 28, 479–489. [Google Scholar] [CrossRef]
  25. Butt, J.; Hewavidana, Y.; Mohaghegh, V.; Sadeghi-Esfahlani, S.; Shirvani, H. Hybrid manufacturing and experimental testing of glass fiber enhanced thermoplastic composites. J. Manuf. Mater. Process. 2019, 3, 96. [Google Scholar] [CrossRef] [Green Version]
  26. Heidari-Rarani, M.; Rafiee-Afarani, M.; Zahedi, A.M. Mechanical characterization of FDM 3D printing of continuous carbon fiber reinforced PLA composites. Compos. Part B Eng. 2019, 175, 107147. [Google Scholar] [CrossRef]
  27. Yu, S.; Hwang, Y.H.; Hwang, J.Y.; Hong, S.H. Analytical study on the 3D-printed structure and mechanical properties of basalt fiber-reinforced PLA composites using X-ray microscopy. Compos. Sci. Technol. 2019, 175, 18–27. [Google Scholar] [CrossRef]
  28. Mohan, V.B.; Lau, K.T.; Hui, D.; Bhattacharyya, D. Graphene-based materials and their composites: A review on production, applications and product limitations. Compos. Part B Eng. 2018, 142, 200–220. [Google Scholar] [CrossRef]
  29. Caminero, M.Á.; Chacón, J.M.; García-Plaza, E.; Núñez, P.J.; Reverte, J.M.; Becar, J.P. Additive manufacturing of PLA-based composites using fused filament fabrication: Effect of graphene nanoplatelet reinforcement on mechanical properties, dimensional accuracy and texture. Polymers 2019, 11, 799. [Google Scholar] [CrossRef] [Green Version]
  30. El Magri, A.; Vanaei, S.; Shirinbayan, M.; Vaudreuil, S.; Tcharkhtchi, A. An investigation to study the effect of process parameters on the strength and fatigue behavior of 3D-printed PLA-graphene. Polymers 2021, 13, 3218. [Google Scholar] [CrossRef]
  31. García, E.; Núñez, P.J.; Chacón, J.M.; Caminero, M.A.; Kamarthi, S. Comparative study of geometric properties of unreinforced PLA and PLA-Graphene composite materials applied to additive manufacturing using FFF technology. Polym. Test. 2020, 91, 106860. [Google Scholar] [CrossRef]
  32. Butt, J.; Bhaskar, R.; Mohaghegh, V. Investigating the effects of extrusion temperatures and material extrusion rates on FFF-printed thermoplastics. Int. J. Adv. Manuf. Technol. 2021, 117, 2679–2699. [Google Scholar] [CrossRef]
  33. Cicero, S.; Martínez-Mata, V.; Castanon-Jano, L.; Alonso-Estebanez, A.; Arroyo, B. Analysis of notch effect in the fracture behaviour of additively manufactured PLA and graphene reinforced PLA. Theor. Appl. Fract. Mech. 2021, 114, 103032. [Google Scholar] [CrossRef]
  34. Camargo, J.C.; Machado, Á.R.; Almeida, E.C.; Silva, E.F.M.S. Mechanical properties of PLA-graphene filament for FDM 3D printing. Int. J. Adv. Manuf. Technol. 2019, 103, 2423–2443. [Google Scholar] [CrossRef]
  35. Tanikella, N.G.; Wittbrodt, B.; Pearce, J.M. Tensile strength of commercial polymer materials for fused filament fabrication 3D printing. Addit. Manuf. 2017, 15, 40–47. [Google Scholar] [CrossRef] [Green Version]
  36. Jin, Z.; Zhang, Z.; Gu, G.X. Autonomous in-situ correction of fused deposition modeling printers using computer vision and deep learning. Manuf. Lett. 2019, 22, 11–15. [Google Scholar] [CrossRef]
  37. Forman, J.; Dogan, M.D.; Forsythe, H.; Ishii, H. DefeXtiles: 3D Printing Quasi-Woven Fabric via Under-Extrusion. In Proceedings of the 33rd Annual ACM Symposium on User Interface Software and Technology, 20–23 October 2020; pp. 1222–1233. [Google Scholar]
  38. Haydale. Available online: https://www.haydale.com/products/ (accessed on 21 March 2022).
  39. BS EN ISO 178:2019; Plastics—Determination of Flexural Properties. British, European and International Standard: London, UK, 2019.
  40. Ultimaker Cura: Advanced 3D Printing Software, Made Accessible. Available online: https://ultimaker.com/en/products/ultimaker-cura-software (accessed on 21 March 2022).
  41. Mitutoyo: Surftest SJ-210 [inch/mm]. Available online: https://www.mitutoyo.com/wp-content/uploads/2016/09/J-section-Surftest.pdf (accessed on 20 April 2022).
  42. ISO 21920-2:2021; Geometrical Product Specifications (GPS)—Surface Texture: Profile—Part 2: Terms, Definitions and Surface Texture Parameters. International Organization for Standardization (ISO): Geneva, Switzerland, 2021.
  43. HBM: Strain Gauge Amplifier—QuantumX MX1615B/MX1616B. Available online: https://www.hbm.com/en/3053/quantumx-mx1615b-bridge-amplifier-for-strain-gauges/ (accessed on 20 April 2022).
  44. Butt, J.; Shirvani, H. Experimental analysis of metal/plastic composites made by a new hybrid method. Addit. Manuf. 2018, 22, 216–222. [Google Scholar] [CrossRef]
  45. BS EN ISO 868:2003; Plastics and Ebonite–Determination of Indentation Hardness by Means of a Durometer (Shore Hardness). British, European and International Standard: London, UK, 2018.
  46. Noriega, A.; Blanco, D.; Alvarez, B.J.; Garcia, A. Dimensional accuracy improvement of FDM square cross-section parts using artificial neural networks and an optimization algorithm. Int. J. Adv. Manuf. Technol. 2013, 69, 2301–2313. [Google Scholar] [CrossRef]
  47. Garg, A.; Bhattacharya, A.; Batish, A. On surface finish and dimensional accuracy of FDM parts after cold vapor treatment. Mater. Manuf. Process. 2016, 31, 522–529. [Google Scholar] [CrossRef]
  48. Kim, M.K.; Lee, I.H.; Kim, H.C. Effect of fabrication parameters on surface roughness of FDM parts. Int. J. Precis. Eng. Manuf. 2018, 19, 137–142. [Google Scholar] [CrossRef]
  49. Alsoufi, M.S.; Elsayed, A.E. Surface roughness quality and dimensional accuracy—A comprehensive analysis of 100% infill printed parts fabricated by a personal/desktop cost-effective FDM 3D printer. Mater. Sci. Appl. 2018, 9, 11–40. [Google Scholar] [CrossRef] [Green Version]
  50. Alsoufi, M.S.; Elsayed, A.E. Quantitative analysis of 0% infill density surface profile of printed part fabricated by personal FDM 3D printer. Int. J. Eng. Technol. 2018, 7, 44–52. [Google Scholar] [CrossRef] [Green Version]
  51. Rajpurohit, S.R.; Dave, H.K. Flexural strength of fused filament fabricated (FFF) PLA parts on an open-source 3D printer. Adv. Manuf. 2018, 6, 430–441. [Google Scholar] [CrossRef]
Figure 1. Printed GPLA specimens.
Jmmp 06 00057 g001
Figure 2. Strain measurement: (a) positioning of the strain gauges; and (b) placement of mass for measurements.
Jmmp 06 00057 g002
Figure 3. Percentage differences for mass measurements.
Jmmp 06 00057 g003
Figure 4. Dimensional analysis: (a) along X-axis; (b) along Y-axis; and (c) along Z-axis.
Jmmp 06 00057 g004
Figure 5. Surface roughness measurements.
Jmmp 06 00057 g005
Figure 6. Results from strain measurements.
Jmmp 06 00057 g006
Figure 7. Results from indentation hardness testing.
Jmmp 06 00057 g007
Figure 8. Results from three-point flexural testing.
Jmmp 06 00057 g008
Figure 9. Correlation between strain measurements and flexural strength.
Jmmp 06 00057 g009
Figure 10. Surface plots: (a) average surface roughness; (b) average hardness; and (c) average flexural strength.
Jmmp 06 00057 g010
Figure 11. Three-axes plot for surface roughness, hardness, and flexural strength.
Jmmp 06 00057 g011
Table 1. Combination of processing parameters (E = material extrusion rate; W = line width).
#ParametersMass (g)Print Time (min)#ParametersMass (g)Print Time (min)
S170E, 0.2W7111S24110E, 0.8W1132
S270E, 0.4W757S25110E, 1W1126
S370E, 0.6W738S26120E, 0.2W12111
S470E, 0.8W732S27120E, 0.4W1257
S570E, 1W726S28120E, 0.6W1238
S680E, 0.2W8111S29120E, 0.8W1232
S780E, 0.4W857S30120E, 1W1226
S880E, 0.6W838S31130E, 0.2W13111
S980E, 0.8W832S32130E, 0.4W1357
S1080E, 1W826S33130E, 0.6W1338
S1190E, 0.2W9111S34130E, 0.8W1332
S1290E, 0.4W957S35130E, 1W1326
S1390E, 0.6W938S36140E, 0.2W14111
S1490E, 0.8W932S37140E, 0.4W1457
S1590E, 1W926S38140E, 0.6W1438
S16100E, 0.2W10111S39140E, 0.8W1432
S17100E, 0.4W1057S40140E, 1W1426
S18100E, 0.6W1038S41150E, 0.2W15111
S19100E, 0.8W1032S42150E, 0.4W1557
S20100E, 1W1026S43150E, 0.6W1538
S21110E, 0.2W11111S44150E, 0.8W1532
S22110E, 0.4W1157S45150E, 1W1526
S23110E, 0.6W1138
Table 2. Processing parameters for GPLA [32].
#ParametersDescription
1Infill density (%)100
2Infill patternLines
3Layer height (mm)0.2
4Nozzle size (mm)0.4
5Material extrusion rate (%)70, 80, 90, 100, 110, 120, 130, 140, and 150
6Line widht (mm)0.2, 0.4, 0.6, 0.8, and 1
7Extrusion temperature (°C)180, 190, 200, and 210
8Print bed temperature (°C)60
9Deposition speed (mm/s)50
10Fan speed (%)100
Table 3. Description of optimal combinations (E = material extrusion rate; and W = line width).
#ParametersPrint Time
(min)
Surface Roughness (µm)Hardness
(HD)
Flexural Strength (MPa)
S18100E, 0.6W3813.165.83204.67
S23110E, 0.6W3811.5165.33218.67
Publisher’s Note: MDPI stays neutral with regard to jurisdictional claims in published maps and institutional affiliations.

