Article

Surface Qualification Toolpath Optimization for Hybrid Manufacturing

1
George W. Woodruff School of Mechanical Engineering, Georgia Institute of Technology, Atlanta, GA 30332, USA
2
Oak Ridge National Laboratory, Knoxville, TN 37932, USA
*
Author to whom correspondence should be addressed.
J. Manuf. Mater. Process. 2021, 5(3), 94; https://doi.org/10.3390/jmmp5030094
Submission received: 30 June 2021 / Revised: 18 August 2021 / Accepted: 25 August 2021 / Published: 27 August 2021
(This article belongs to the Special Issue Direct Digital Manufacturing with Additive Manufacturing/3D Printing)

Abstract

:
Hybrid manufacturing machine tools have great potential to revolutionize manufacturing by combining both additive manufacturing (AM) and subtractive manufacturing (SM) processes on the same machine tool. A prominent issue that can occur when going from AM to SM is that the SM process toolpath does not account for geometric discrepancies caused by the previous AM step, which leads to increased production times and tool wear, particularly when wire-based directed energy deposition (DED) is used as the AM process. This work discusses a methodology for approximating a part’s surface topology using on-machine contact probing and formulating an optimized SM toolpath using the surface topology approximation. Three different geometric surface approximations were used: triangular, trapezoidal, and a hybrid of both. SM toolpaths were created using each geometric approximation and assessed according to three objectives: reducing total machining time, reducing surface roughness, and reducing cutting force. Different prioritization scenarios of the optimization goals were also investigated. The optimal surface approximation that yielded the most improvement in the optimization was determined to be the hybrid surface topology approximation. Furthermore, it was shown that when the machining time or cutting force optimization goals were prioritized, there was little improvement in the other optimization goals.

1. Introduction

While additive manufacturing (AM) has demonstrated its potential to be a disruptive technology it still suffers from many drawbacks with regard to the creation of functional part surfaces, low dimensional accuracy, and defects from the deposition process. To counter these disadvantages, modern subtractive manufacturing (SM) machine tools are incorporating AM technology to create hybrid machine tools [1]. These machine tools have the ability to deposit material and remove material to manufacture a part with the production speed and material efficiency of AM and the dimensional accuracy of SM. Of the many deposition processes available, a popular one is wire feedstock-directed energy deposition (DED). This process uses a focused heat source, such as a laser or an electrical arc, to melt inexpensive welding wire and deposit it on to a substrate. However, this process can also have unpredictable results that can cause defects and irregular part surfaces which can in turn adversely affect the SM process [2,3].
The irregular geometric surfaces caused by wire-based DED pose substantial challenges and provide singular opportunities for optimization of subtractive manufacturing toolpaths. The gains provided from such optimization are especially applicable in the context of a hybrid machine tool where additive and subtractive manufacturing capabilities exist on the same machine. There have been a variety of methods utilized for generating SM toolpaths for hybrid manufactured parts, however, many have not taken into account the geometric discrepancies that can arise from deposition. Liou et al. [4] were one of the first to investigate 5-axis hybrid manufacturing machine tools using powder feedstock DED, and their process generated the additive and subtractive toolpaths prior to the actual production process, such that the SM toolpath did not account for AM geometric defects. More recently, Chen et al. [5] used the aforementioned toolpath generation approach, but this did not consider the actual as-built geometry in determination of SM toolpaths. Rodrigues et al. [6] also investigated wire DED and applied traditional 3-axis SM facing operations to the top surfaces of as-built AM parts without using online measuring equipment to adjust the SM toolpath. Another approach taken by Fuchs et al. [7] involved characterization of surface waviness of AM part surfaces to determine a suitable machining tolerance for deposition geometries. Similarly, Zhang et al. [8] simulated the effect of different steps over distances between beads in the construction of planar parts and used additional deposition toolpaths to correct perimeter defects. While these methods have made strides in advancing hybrid AM/SM approaches, they are either inefficient due to lack of utilization of as-built AM geometry in SM toolpath generation or they require extensive characterization experiments to implement. Since parts manufactured by hybrid manufacturing machine tools may need to undergo multiple AM and SM process steps, it is therefore desirable to optimize the subtractive operation toolpath in a manner that incorporates measurements of the as-built AM part surface and can be achieved without the use of prior characterization experiments.
Current methods of traditional SM toolpath optimization are not well suited to this task as they have not incorporated the surface waviness and geometric process defects inherent to the AM process. However, certain foundational aspects of these methods can be brought in to the SM toolpath optimization for as-built AM parts. Maiyar et al. [9] and Shaik et al. [10] optimized the machining parameters for Inconel 718 and Al-6061 alloys, respectively, with a focus on achieving high surface quality and material removal rate. It should be noted that superalloys like Inconel 718 can retain their mechanical properties at high temperatures, which makes them difficult to machine due to higher tool wear, thus requiring a more in depth analysis of machining considerations [11]. While the present work is not focused on nickel superalloy machining, this illustrates how subtractive manufacturing optimization has been used on a material-specific basis in past work. Corso et al. [12] performed a similar optimization study with a focus on implementing different optimization algorithms. An et al. [13] conducted a study specific to face milling operations that varied parameters to minimize production cost and machining time with surface roughness and cutting force as constraints. Yan et al. [14] conducted an in-depth multi-objective study that focused on optimizing cutting energy, surface roughness, and machining time. These studies regarding subtractive toolpath optimization focus on optimizing machining parameters without considering the toolpath or the part geometry. Castelino et al. [15] explored optimizing the order of different toolpath segments in order to reduce the overall travel time between segments by utilizing approaches to the classical traveling salesman problem. This study generated an algorithm that can be applied to different part geometries. Lazoglu et al. [16] varied the XY plane orientation angle of the subtractive toolpath in a ball milling operation to determine the orientation that yielded the lowest cutting force. Ali et al. [17] tested different face-milling toolpath strategies (e.g., raster, zig zag) to determine the strategy that optimized surface finish and material removal rate. Hernandez et al. [18] developed on optimization algorithm for continuous machining operations, independent of workpiece geometry, where optimal cutting parameters were chosen to maximize tool life and material removal rate.
As mentioned previously, it is desirable to incorporate as much information as possible about the part surface’s geometry to achieve an effective toolpath optimization. This need illustrates a unique challenge of hybrid manufacturing since subtractive operations must be performed in between deposition operations, and so part surface geometry must likewise be gathered iteratively. This differs from considerations used in machining of forged or cast parts as in those situations the part dimensions are much more controlled through the use of molds and the well understood mechanics of the casting and forging processes. Heralic et al. [19] utilized a laser profilometer to incorporate geometric data about each deposition bead into a closed loop control algorithm to minimize variations in the layer height but this approach is not suitable for commercial hybrid machines as those controller architectures lack flexible configurability. Additionally, the cost of laser profilometers may be prohibitive to manufacturers. It is here where the technological advances achieved in Industry 4.0 should be leveraged to facilitate and improve the hybrid manufacturing process [20]. A common method of determining the geometry of part features is to use an on-machine touch probe to digitize the part’s surface as it is an efficient use of existing equipment and most modern machine tools already have one. Both Praniewicz et al. [21] and Kim et al. [22] used an on-machine touch probe to digitize the geometry of turbine blades and use that geometry to formulate toolpaths for component repair workflows. An added benefit of using these on-machine probes is that modern machine tool controllers come equipped with capabilities that allow probe data to read from the controller and be transmitted to the user and incorporated into a digital representation of the part. Stavropoulos et al. [23] also investigated hybrid manufacturing processes for turbine blade repair but used a 3D scanner to inspect the blade geometry.
Special consideration must be given to the process workflow of hybrid manufacturing and where online inspection and SM toolpath optimization could be best applied. The hybrid manufacturing process as described by Davila et al. [24] consists of repeated cycles of DED and SM operations until the final part geometry is achieved. This simplistic workflow can be expanded to accompany both component repair and new component manufacturing operations. The most common hybrid manufacturing workflow for repair or remanufacturing of components is one whereby damaged components are scanned, defects are machined, and then material is added and remachined to the final shape. This workflow process is utilized heavily in turbine blade repair [21,22]. Stavropoulos et al. [23] generated multiple hybrid manufacturing workflows and assessed each according to a variety of KPIs. For manufacturing new components, Chen at al. [5] proposed a unique workflow where conventional stock material was partially machined and only certain features were deposited with AM and then subsequently machined. Zheng et al. [25] developed a complex method involving feature extraction of the desired CAD geometry and the formulation of AM and SM toolpaths for remanufacturing components. Davila et al. [24] proposed a workflow for manufacturing components from a substrate wherein the DED and SM steps are repeated such that only the part geometry from roughing SM operations is achieved, after which the finishing SM operation is conducted to bring the part within final dimensions and tolerances. The present work is focused on applying an SM toolpath optimization for the surface qualification facing operation, which is the point in the hybrid manufacturing workflow where the top surface of an as-built DED part is being prepared for the next deposition process step. Since such an operation would happen frequently in the hybrid manufacturing process, it would be ideal to use an on-machine touch probe to gather geometric data about the part surface [20]. However, one drawback to using the touch probe in this case is that there is an inherent process time problem since using more probe points to gather information about the part surface inevitably results in large increases in process time. This effect is compounded when considering the fact that the surface qualification of the part may need to happen multiple times throughout the part’s build. Therefore, it is desirable to approximate the surface of wire-based DED components using geometries that require a low number of probe points per deposited bead of material. However, this surface approximation must be robust enough such that collisions are avoided and feed rates for non-cutting movements can be increased safely [20]. The present work is focused on examining how such geometric approximations can be incorporated into an optimization of the SM toolpath of the hybrid manufacturing process and how different geometric surface approximations affect the results of that optimization.

2. Background

One of the most common defects that is especially detrimental in all metal AM processes is the build-up of deposited material that occurs during the start and stop points and the corners of a deposition track. This defect occurs due to the fact that the material deposition rate is constant through the AM process, while the traverse rate of the deposition head accelerates when starting, stopping, or rounding a corner, as characterized by Cajella et al. [26]. In the case of a simple wall specimen, the overbuilding at the deposition start and stop points results in a part surface that has a cup-shaped geometry with tall wall ends and a low middle portion of the wall. An approximation of this geometry can be seen in Figure 1 below.
There are two main manufacturing issues that arise due to this cup-shaped geometry defect. First, there is the issue of increased air cutting. Air cutting is when a cutting tool is traversing over a part at a cutting feed rate but not actually engaging with the part. The cup-shaped geometry defect produces many regions where air cutting occurs, as illustrated in Figure 1a below. The many air cutting sections needlessly increase production time since the cutting tool moves at a cutting feed rate when not in contact with the workpiece. Therefore, it is desirable to incorporate the geometric information gained from probing so that appropriate increases to the feed rate can be applied to the toolpath during these air-cutting sections. This approach is similar to the technique of feed rate scheduling, wherein the feed rate is adjusted depending on predetermined cutting forces [27]. In this case, the feed rate is increased to the rapid feed rate during sections of no tool load, i.e., air cutting. The other prominent issue is the irregular tool loading due to the changing slopes of the cup-shaped geometry. Figure 1b below shows that when the cutting tool engages with a section of the part geometry that has a positive slope, there is an increase in the tool’s axial depth of cut which causes there to be irregular tool loading along a given toolpath. This irregular tool loading is undesirable for a number of reasons. It has been shown in multiple studies that having a constant engagement of the tool with the workpiece, and therefore constant cutting force, can improve tool wear by minimizing cutting force spikes and improve machining accuracy by minimizing the variations of the tool’s deflection during cutting [28,29]. This would be beneficial in decreasing chatter as well, since Chuangwen et al. [30] found that increased tool wear and cutting depth led to increased amplitude of cutting vibrations that can lead to regenerative chatter [31]. To minimize the cutting force and make the engagement of the cutting tool more uniform, adaptive toolpaths must be created that conform to the cup-shaped geometry, as shown in Figure 1c.
An SM toolpath optimization methodology must be utilized to counter both of the issues previously described. This can be achieved by varying the axial depth of cut and the cutting feed rate to achieve toolpaths that minimize the cutting force and machining time, as illustrated in Figure 1d below. For each selection of an axial depth of cut and cutting feed rate for the adaptively layered toolpaths, the feed rate of the air cutting sections of each toolpath segment, shown in green in Figure 1d, is increased to the rapid traverse feed rate of the machine. Lastly, in addition to minimizing the machining time and the cutting force, the surface roughness must also be minimized. This is done to avoid regenerative chatter and to achieve the desired surface finish for the part [31].
Currently, there is a knowledge gap in applying SM toolpath optimization to the facing of irregular part surfaces, as well as a method of efficiently gathering enough geometric data about the part’s surface so that a proper toolpath optimization can be applied. The purpose of this work was to examine different geometric approximations of a wire-based DED part surface that use minimal probe points and to then use those geometric approximations as the basis for optimization of the surface qualification facing operation. The optimization results for the different geometric surface approximations were evaluated to determine if there was an optimal geometric surface approximation for the cup-shaped geometry.
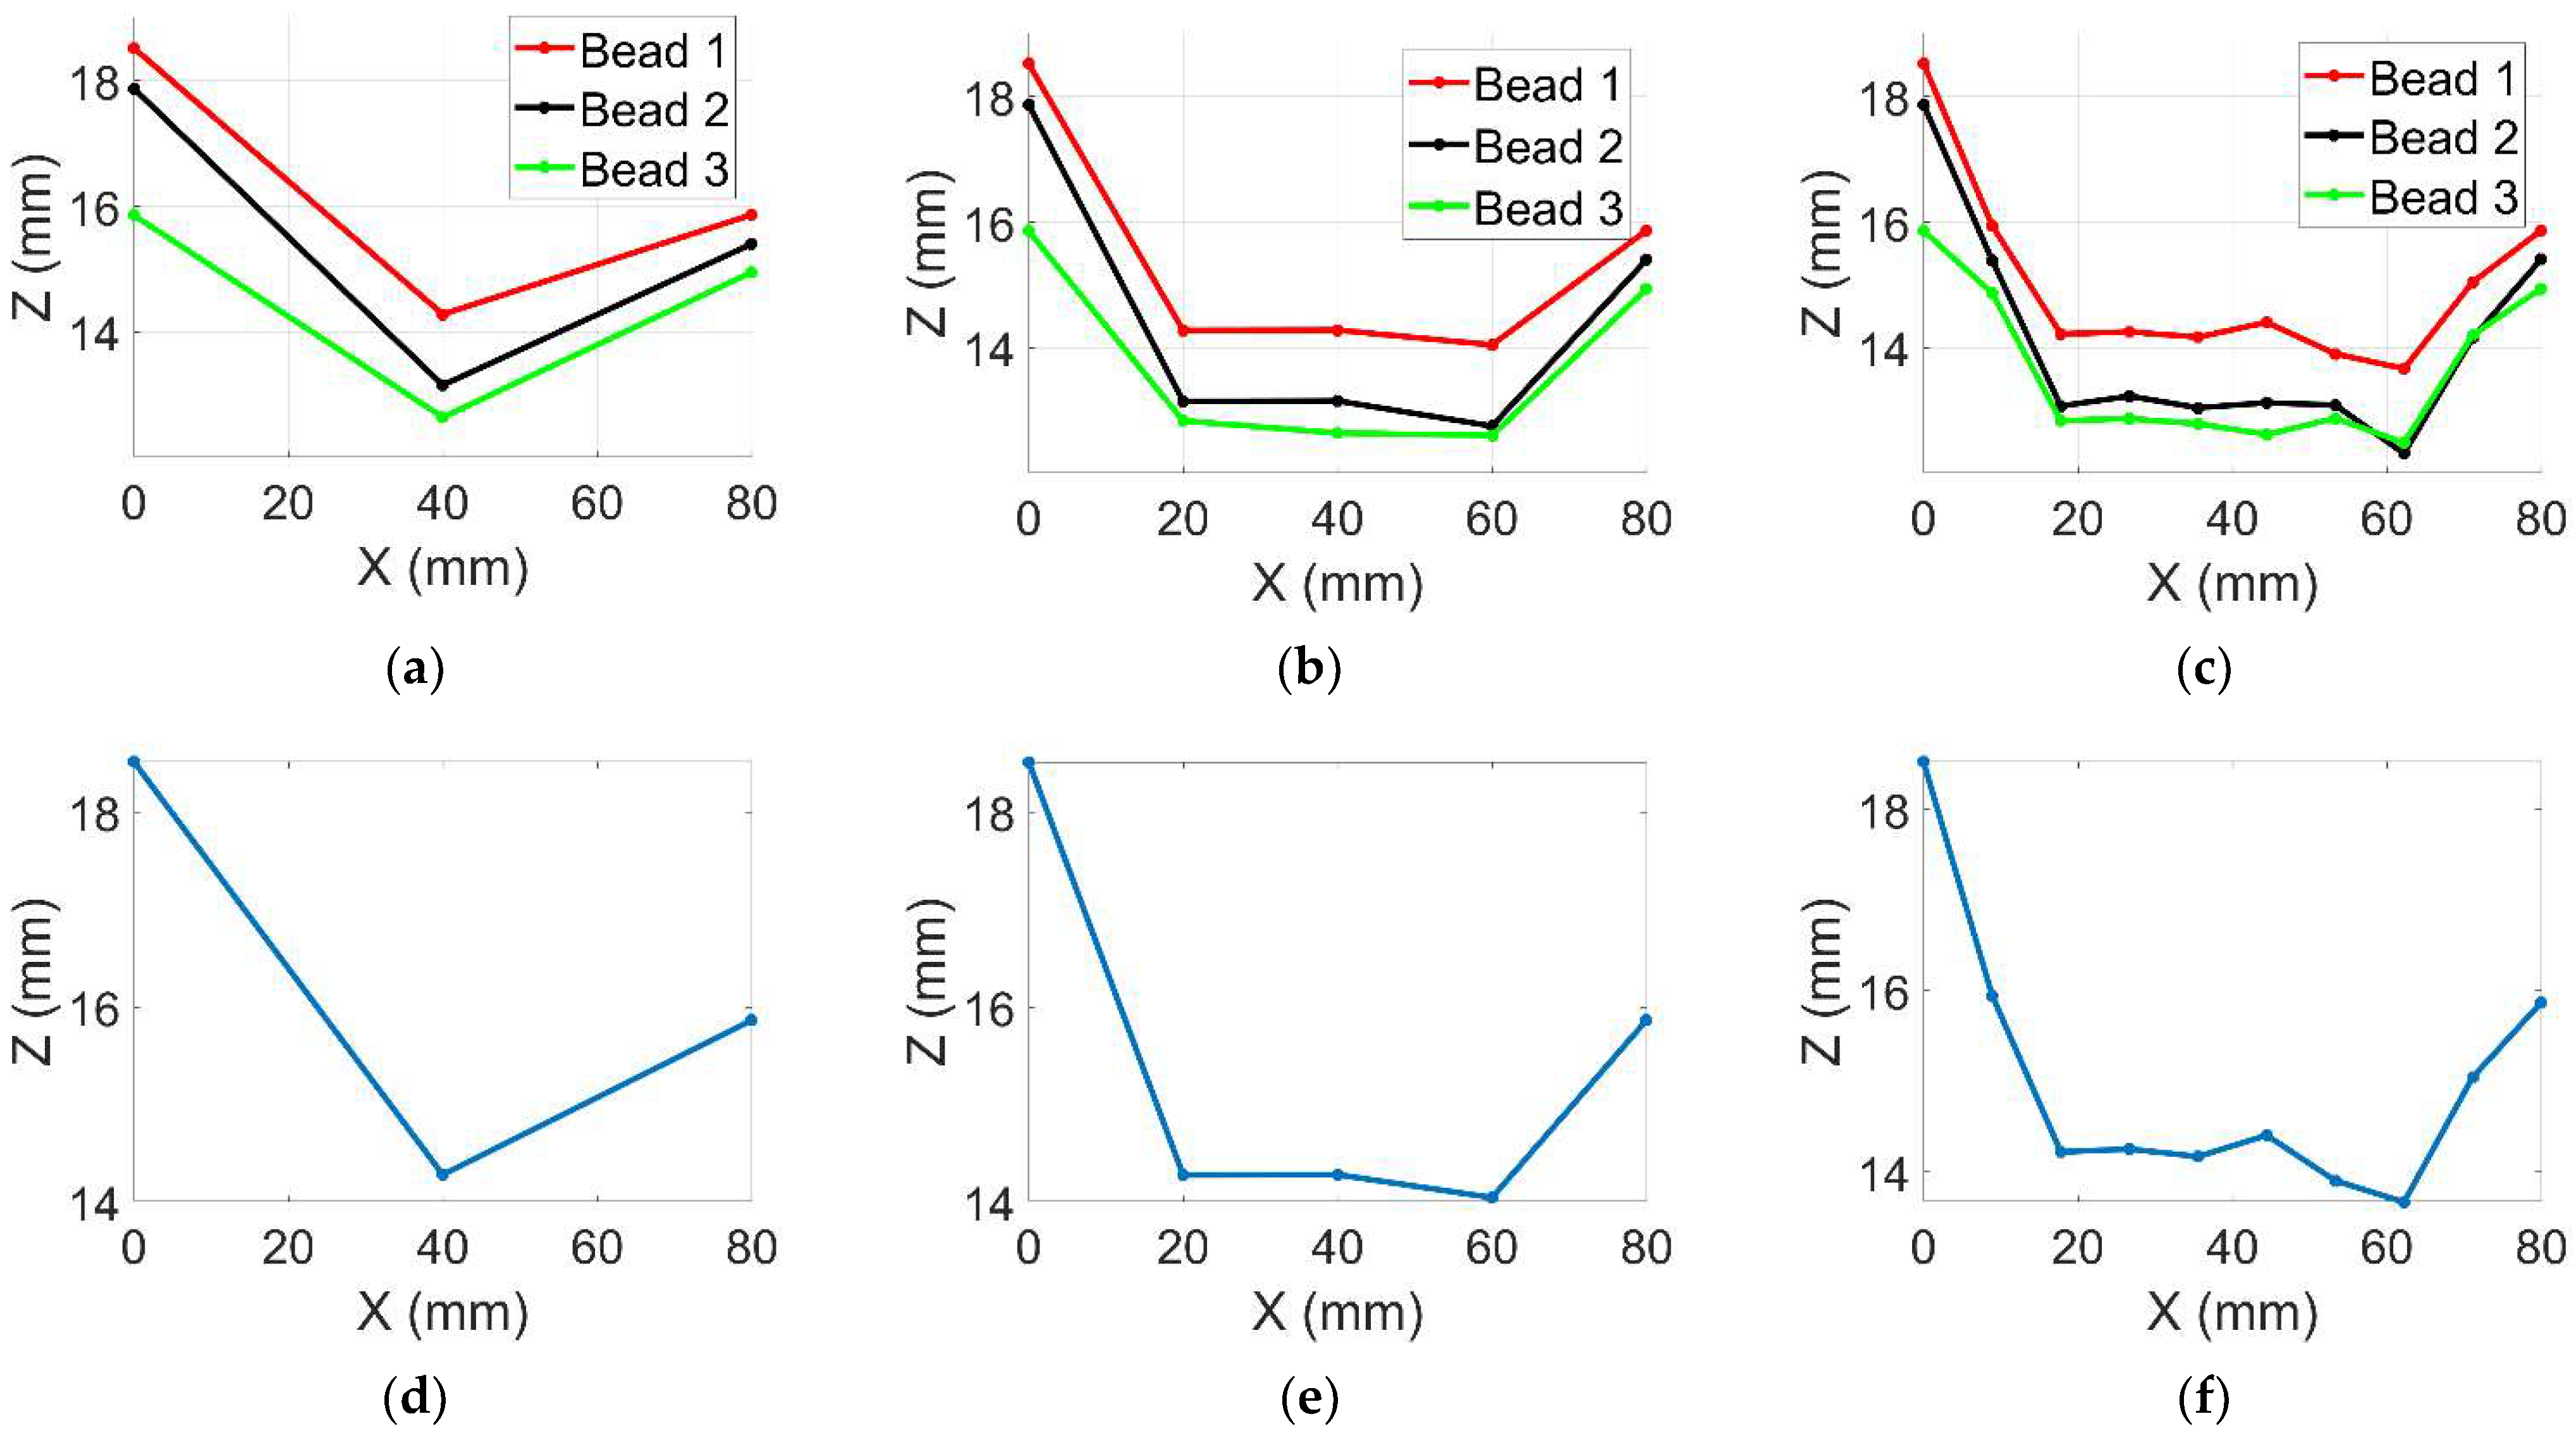
An overview of the experimental process is described here. The first stage of the experimental methodology used in this work was to probe each bead of the deposited part to generate a height profile for each bead. Then, the height profiles for each bead were consolidated into one height profile that was used for the entire top surface of the part. To generate this singular height profile, the highest height value from among the individual beads’ height profiles at each successive probe location along the length of the wall was used. Next, a digitized part surface was created from the consolidated probe height profile by connecting the individual probe points. Finally, the SM toolpath was optimized using an optimization methodology.

3. Materials and Methods

3.1. Sample Part Fabrication

The hybrid machine tool used was a Mazak VC-500A/5X AM HWD, from Mazak Corporation in Florence KY, USA, which is a 5-axis vertical machining center augmented with a 4 kW laser and deposition head. The machine tool chosen for the probing operation was the Mazak VC-500A/5X, which is purely a subtractive manufacturing machine tool. The Renishaw touch probe used for the probing operations features its own set of G-Code instructions that can be used to program canned cycle probing operations for typical part features like bosses, webs, and bores. It was also able to perform single surface probing operations to determine work piece offsets. After setting the work piece Z offset value as the build plate surface and substituting the expected part height into the G-Code, one can generate a series of probe commands to perform probing operations along the part surface’s XY plane by using XY values from the part’s deposition path to achieve a desired probing resolution. This probing resolution was measured in unit length/probe point, where the unit length was the distance traveled along the part’s deposition path. Both machines use an on-machine Renishaw touch probe and feature MTConnect capable controllers. MTConnect is a communications protocol that is used to read process data from machine tool controllers. The probing data was then published to a message broker via a gateway on the machine controller, in the manner described by Parto et al. [32].
To test the experimental methodology, a sample straight wall artifact was fabricated using the Mazak HWD. The part was made from 1.14 mm diameter ER316LSi 316L stainless steel wire with the properties shown in Table 1. The wall artifact had dimensions of 6.58 × 79.94 × 11.51 mm, with a layer thickness of 1.39 mm. The deposition parameters used for the part can be seen in Table 2. The part thickness was not less than 5 mm and its height was less than 30 mm so it was not a thin wall structure as defined by Budak et al. [33].
The path planning of the part was made to exaggerate the cup-shaped geometry defect. Instead of using a raster pattern to deposit the three bead thick part, each bead was deposited as a single track with the same deposition direction. However, the deposition direction for all three beads was rotated 180 degrees for each alternating layer of the part. The Mazak VC-500A/5X AM HWD utilized a constant deposition feed rate in between the start and stop points of each bead that was maintained by the machine tool’s controller throughout the deposition path of each bead to minimize variations in deposition geometry that could occur due to changes in deposition feed rate.

3.2. Geometric Surface Approximations

Three geometric approximation profiles were considered in the present work. The first approach was a triangular approach composed of three probe points per bead, with one each at the wall ends and another in the middle. The second approach was a trapezoidal approach composed of five probe points per bead, with one each at the wall ends, and three more equally spaced between the wall ends. The last approach was a hybrid approach using five probe points per bead with a lower probing resolution at the wall ends. Figure 2 below shows an example of how a single bead’s surface would be represented with these geometric approximations.
The height profile of the geometric approximation is shown in red. Note that the Z dimension of the part has been truncated to only show the part geometry above the desired Z height. With these geometric approximations, there are three key path geometry parameters: the path length, the difference in height of the start and stop points (also known as the corner height), and the absolute height difference between the highest and lowest points of the height profile. Note that the triangular approximation’s height profile in Figure 2a consists of two straight lines that connect the start point to the middle point and the middle point to the stop point. The trapezoidal approximation height profile in Figure 2b consists of four straight lines that connect the points together, but the lines that connect the three intermediate points together are all horizontal. The hybrid approximation’s height profile in Figure 2c consists of four straight lines that connect the points together, but the second and fourth probe points are located closer to the start and stop points. This allows the hybrid approximation to better conform to the cup-shaped geometry. Using the simplified geometry of straight lines for the approximations allows for the equations of those lines to be easily found in the typical linear format.

3.3. Toolpath Optimization Formulations

The formulation of the SM toolpath optimization problem was composed of varying input parameters that were subject to a variety of different constraints. The input parameters discussed earlier in this work were the axial depth of cut, or adaptive layer thickness (mm), and the adaptive feed rate (mm/min). The constraints for these input parameters are given below:
0.01 < do < StepDown
0.1 < fo < fmax
where do is the adaptive layer thickness, StepDown is the axial depth of cut used in the non-optimized cutting condition (0.5 mm), fo is the adaptive feed rate, and fmax is maximum available cutting feed rate on the machine tool (8000 mm/min). There were also additional constraints put on the optimization goal values of machining time and cutting force. To have viable optimized toolpaths when compared to the non-optimized toolpaths, it is desirable for the optimized machining time value to be less than or equal to the non-optimized machining time value. If the optimized machining time value was greater than the non-optimized machining time value, then the added process time of the probing operation would make the optimized solution undesirable. Likewise, if the optimized cutting force was greater than the non-optimized cutting force, there would be worse tool performance so that the optimized solution is not desirable.
The optimization goals for each set of input parameters were calculated from the input parameters, and the equations for those goals can be seen below. The calculation for machining time was computed by adding the machining times for each single cutting tool pass depending on the geometric approximation being used:
T total = 1 n T n
where Ttotal is the total machining time and Tn is the machining time for cutting tool pass n. The cutting force can be approximated as follows [31,34]:
P =   F c   ×   V
V = π   ×   D   ×   N
  P = u   ×   MRR
MRR = r   ×   d   ×   f
By setting Equations (4) and (5) equal to each other and solving for cutting force Fc:
F c = u   ×   r   ×   d o   ×   f o π   ×   D   ×   N
where P is the cutting power, V is the surface speed, D is the tool diameter, N is the RPM, u is the material’s specific cutting energy, MRR is the material removal rate and r is the radial depth of cut. For standardization purposes, the tool used in every optimization scenario was a 4-flute end mill with 25.4 mm diameter kept at a constant 859 RPM. This tool configuration was chosen such that the entire width of the wall artifact could be machined in a single pass. It should also be noted that the tool’s radial depth of cut was kept constant equal to the wall width stated earlier. Since only the do and fo parameters were being changed in this optimization, it was useful for the scope of this work to represent the cutting force as being proportional to the product of the two input parameters.
F c   α   d o   ×   f o
The average surface roughness of the part was likewise calculated using an analytical equation [34]:
Ra =   s z , o   4   ×   ( tan ( K ) + cot ( K ) )
s z , o = f o N   ×   Nt
where sz,o is the feed per tooth, K is the lead angle of the tool, and Nt is the number of teeth of flutes of the tool. To make the analytical solution more applicable to a variety of cutting tools, it was useful to represent the surface roughness as being proportional to sz,o:
R a   α   f o ( N   ×   Nt )
These expressions for the different optimization goals were then normalized based on the highest goal value from the various iterations of the input parameters and put into an objective function. The objective function was determined by a weighted sum of the normalized optimization goals. This formulation was useful as different prioritizations of the optimization goals in the objective function can be achieved by changing the weight values. The weight values must also add up to 1, which is an Archimedean formulation of the objective function [35]. This method of single objective optimization with multiple criteria was also used by Krimpenis et al. [36] in their machining optimization study. The objective function can be seen below, along with the Archimedean weights constraint:
G = W T   ×   ( T Total ( d o ,   f o ) T max ) + W R   ×   ( R a ( f o ) R a , max ) + W F   ×   ( F c ( d o ,   f o ) F max )
W T + W R   + W F   = 1
In this analysis, the objective function values for all scenarios were calculated and the scenario with input parameters that corresponded to the lowest objective function value was chosen as the optimal result. MATLAB version 2019 was used as the computer software in this work and no special packages or add-ins were required.

4. Results

4.1. Manufactured Part

Using the optimal deposition parameters described earlier, a wire feedstock DED part was manufactured and is shown below in Figure 3. The part produced by the Mazak HWD had visible signs of the cup-shaped geometry defect as seen by the areas circled in green. For scale, a 1” gauge block was put onto the part. Due to the deposition feed rate being constant, as mentioned in Section 3.1, the geometric defects highlighted in green can be attributed to the deposition path strategy.

4.2. Probing and Surface Approximations

Three different probing operations were performed on the part: a three-point, a five-point, and a 10-point per bead probing cycle. The data from the probing operations can be found in Supplementary Tables S1–S3. The generated probing toolpaths probe each bead of the part’s top layer using an increasing number of probe points. Probing toolpaths that used more probe points were able to obtain more information about the part surface; however, this came at the cost of increasing probe process time. The data from the three- and five-point probing cycles were used to construct the triangular and trapezoidal approximations, whereas the data from the 10-point probing cycle were used to form the hybrid approximation and as a higher fidelity digitized part surface to evaluate the different geometric approximations. The probing operation generated a point cloud of XYZ data, so to simplify the analysis the probe data from the height profiles of all three beads were consolidated into a single height profile. Figure 4a–c show the probe data of the three beads for the 3-point (pt), 5 pt, and 10 pt probing operations, respectively. It can be seen that each of the individual bead’s height profiles were distinct. As mentioned earlier in Section 2, the consolidated height profiles were created by taking the highest probe data points from among the three beads for each probe location along the X axis. The consolidated height profiles shown in Figure 4d–f below validated the choices of the triangular and trapezoidal geometric approximations as they conform to the 3 pt and 5 pt consolidated height profiles shown in Figure 4d,e, respectively. It is also worth noting that the higher fidelity 10 pt consolidated height profile in Figure 4f shows that the increases in height due to the cup-shaped geometry defect occur fairly close to the start and stop points of the part. This further validates the choice of the hybrid geometric surface approximation which has a higher concentration of probe points at the start and stop of the part.
The geometric approximations for the part surface can be overlaid with the height profile generated from the higher fidelity 10 pt probing operation to make some qualitative assessments of each approximation’s advantages and disadvantages. In Figure 5 below, the triangular approximation can be seen in red, overlaid with the higher fidelity height profile in black. From Figure 5a, it can be seen that the geometry produced from the triangular approximation is fairly dilated when compared to the higher fidelity height profile. This means that there is a higher safety margin for protecting the tool from crashing into peaks in the actual height profile of the part that may not have been detected by the probing operation. However, this means that the tool spends more time air cutting the dilated geometry which increases the machining time. The trapezoidal approximation shown in Figure 5b has complementary advantages and disadvantages to the triangular approximation. The horizontal base of the trapezoidal approximation increases the risk that an undetected peak in the actual height profile of the part causes a tool crash since the tool is traveling at rapid traverse rates. Consequently, the increased portion of the toolpaths that has the tool traveling at rapid traverse rates contributes to a lower machining time. The hybrid approximation is seen in Figure 5c and does a good job of compromising between the triangular and trapezoidal approximations. The triangular bottom portion of the hybrid approximation allows for the increased safety of dilated geometry yet the sections of the approximation that conform to the higher fidelity height profile reduced the toolpath sections where the tool is traveling at a cutting feed rate and thus can decrease machining time.

4.3. Optimized Subtractive Toolpath

To properly evaluate the optimization results, they must be compared to the non-optimized cutting condition which uses the same feed rate and axial depth of cut. For uniformity, all milling toolpaths were composed of a single cutting pass per each level in the Z direction and the feed direction was always from left to right in the X+ direction. The non-optimized subtractive toolpath is shown below in Figure 6a. For more clarity, the range of the figure in Z has been truncated to show the part’s height profile above the desired Z height. Additionally, there is separation of the toolpath segments into cutting and rapid feed rate sections. The optimized toolpaths for each approximation are projected onto the higher fidelity height profile of the part, shown in red, as seen below in Figure 6. From Figure 6b, it can be seen that the optimized toolpath of the triangular approximation has produced the most dilated geometry and has indeed provided a higher safety margin for protecting the tool from crashing into peaks in the actual height profile. Figure 6c shows that there is a significant portion of the toolpath segments that are rapid feed rate sections which indicates a faster overall machining time. However, there is also little protection against any undetected peaks in the height profile. Lastly, the optimized toolpath using the hybrid approximation, shown in Figure 6d, shows how it conforms well to the higher fidelity height profile of the part at the start and stop points of the part but provides a more dilated geometry for the middle of the part. This is beneficial as it can contribute to a decreased machining time while reducing the risk of crashing that is inherent in the minimal probe point operations.

5. Discussion

The numerical comparison of the non-optimized and optimized objective values can be found in Table 3, Table 4, Table 5 and Table 6 below. The numerical results for each prioritization scenario are given as a percentage change in the parameter of interest from the non-optimized cutting condition. The equal prioritization scenario, where all of the the objective function weights Wt, Wr, and Wf were set to 0.33 was analyzed first and the results can be seen in Table 3 below. Overall there was a significant improvement over the non-optimized cutting condition, with the smallest magnitude percent change being ~30%. The hybrid and trapezoidal surface approximations yielded comparable percent changes in machining time of 44.00% and 45.32%, respectively, which should be expected since those surface approximations were less conservative that the triangular surface approximation. Similarly, the percent change in machining time and cutting force for the hybrid and trapezoidal surface approximations only varied by 5%. The triangular surface approximation performed the worst out of the three, with the smallest magnitude percent changes in machining time, surface roughness, and cutting force.
The previous section focused on optimization results where each optimization objective was prioritized equally. However, this is seldom the case in an actual production environment. Depending on the component produced, the material being used, or the production schedule, different optimization objectives may need to be prioritized above others. To understand the relationship between prioritization of optimization objectives and different geometric approximations used, several scenarios were tested where each optimization objective was prioritized above the others. To establish prioritization of different objectives, the weight of the prioritized objective was set 0.8, and the other two weights were set at 0.1 so that all weights summed to 1.
The first objective that was prioritized was the machining time. From the results in Table 4 it can be seen that although there was a substantial decrease in machining time of 57–68% across all surface approximations, the surface roughness parameter actually increased from the non-optimized condition by as much as 20% for the triangular surface approximation. The cutting force, however, experienced only a slight decrease in the percent change from the non-optimized cutting condition of a maximum magnitude of 2.75% which may be acceptable in a production environment. The trapezoidal and hybrid surface approximations again had very similar results and the maximum difference between them was 2.6%.
The next objective that was prioritized was the cutting force. From the results in Table 5 it can be seen that there was a substantial decrease in cutting force of 74–83% across all surface approximations and there was a substantial decrease in surface roughness of 68–80% across all surface approximations. There was only marginal improvement in the machining time from the non-optimized cutting condition of a maximum magnitude of 2.75%. The similar range of improvement between the cutting force and surface roughness can be explained by the fact that they are both directly proportional to the feed rate. The trapezoidal and hybrid surface approximations again had very similar results and the maximum difference between them was 3.3%.
The last objective that was prioritized was the surface roughness. From the results in Table 6 it can be seen that there was again a substantial decrease in cutting force of 65–70% across all surface approximations and there was a substantial decrease in surface roughness of 57–67% across all surface approximations. The triangular surface approximation yielded a lower magnitude reduction in the range of 21–40%. The similar range of improvement between the cutting force and surface roughness can be explained by the fact that they are both directly proportional to the feed rate. The trapezoidal and hybrid surface approximations again had very similar results and the maximum difference between them was 3.68%.
From inspection of the numerical values of the percent changes in the objective prioritization scenarios, it would appear that the trapezoidal approximation would be the ideal approach since it resulted in the highest percent decreases. However, the trapezoidal approximation was also the approach most at risk for crashing the tool into unexpected peaks in the actual part height profile. If the wire DED process is not well understood and the outcome of the deposition is not well controlled, the risk of crashing could be even higher. The hybrid approximation had percent decreases in the equal prioritization and surface roughness prioritization scenarios that were lower than those of the trapezoidal approximation, but only by a few percentage points as mentioned earlier. Additionally, the hybrid approximation has the added benefit of being less susceptible to undetected peaks in the height profile.
Up to this point, the probing operation process time has not yet been taken into account when considering the overall optimization process time, while the probe process uses minimal points so that probing time must be accounted for when comparing the optimization process to the non-optimized toolpath. As such, Figure 7a below shows a comparison of the non-optimized machining time to the different total optimization process times using the hybrid geometric approximation for each of the four objective prioritization scenarios. It can be seen that the total optimization process time exceeded the non-optimized process time for each of the four objective prioritization scenarios, with the lowest and highest total process times for the optimized conditions being 2.36 min and 3.69 min compared to the non-optimized condition’s total process time of 1.95 min. The process time data can be found in Supplementary Table S4.
It is important to note that this comparison was for a part that is three beads wide and assumed to be machined using a single facing pass per layer. Therefore, it is desirable to determine the effect of the number of beads being probed per part and the number of facing passes being taken per layer. Figure 7b shows that when the number of beads is reduced to one, the total optimization process time was lower than the non-optimized process time of 1.95 min for every objective prioritization scenario except the cutting force prioritization. The lowest total process time was 1.20 min for the machining time prioritization optimization scenario. Figure 7c shows that when the number of facing passes was increased to two, the total optimization process time was lower than the non-optimized process time of 3.89 min for every objective prioritization scenario, with the lowest total process time being 2.36 min. This serves as a guidance on how to select which hybrid machine tool, in terms of its bead width capability, to use for certain parts. It also can be inferred that this optimization process is most useful for parts constructed of fewer, thicker beads as that drastically reduces the probing time and thus the overall optimization process time.

6. Conclusions

In this work an optimization strategy for facing the surfaces of wire-based DED parts was presented. Geometrics gathered about wire-based DED part surfaces via an on-machine touch probe were used to construct a digitized part surface using different geometric surface approximations and then different optimization scenarios were conducted in which individual optimization objectives of minimizing machining time, cutting force, and surface roughness were prioritized.
The hybrid approximation was the preferred approximation option as the resultant toolpath provided a low risk of crashing the tool into unknown geometry and yielded significant improvements in machining time, surface roughness or cutting force, depending on the prioritization scenario, which lagged only slightly behind those of the trapezoidal approximation by around 3%. An analysis of the different optimization prioritization scenarios concluded that the prioritization scenarios where machining time and cutting force were prioritized resulted in poor improvements in the other two optimization objectives of around 0.1–3.8%, with the machining time prioritization actually resulting in an increase in surface roughness for all geometric surface approximations. While some production scenarios may wish to prioritize machining time or cutting force, it is important to realize the performance trade-offs in the other optimization objectives.
When the overall optimization process time, which considers probing and optimized machining, was compared to the non-optimized process time for different numbers of facing passes and beads per part it was shown that the optimized process time was substantially lower than the non-optimized process time when the number of beads per part was decreased and when the machining operation was conducted with multiple facing passes. This means that this optimization process is well suited for parts constructed of a few thick beads rather than many thinner ones. Finally, the optimization strategy utilized in this work lends itself to covering a multiplicity of different optimization objectives. The objective function can be easily expanded to include additional terms that represent different optimization objectives and thus can be tailored to fit a variety of production scenarios.
There were several limitations to this study that can be improved upon in future work. First, the present analysis of cutting forces and surface roughness are theoretical, and as such do not take into account real-world uncertainties that affect the surface roughness and cutting force calculations. Furthermore, the effects of tool wear have not been included in the surface roughness calculations. While the wall artifact used in this study is small enough that tool wear may not be significant, this would not be the case for larger components or full-scale production. Additionally, the repeatability of the probing operation results should be investigated since variance in the present probing results would affect both the final surface approximation and the overall process time. Future research could investigate the use of other algorithms (e.g., pattern search or genetic optimization) to address the optimization problem.

Supplementary Materials

The following are available online at https://www.mdpi.com/article/10.3390/jmmp5030094/s1, Table S1: Probe_Data_3pts_SmallFront, Table S2: Probe_Data_5pts_SmallFront, Table S3: Probe_Data_10pts_SmallFront, Table S4: Process Time Data, MATLAB Script: Adaptive Slicing.

Author Contributions

Conceptualization, A.T., C.S.; methodology, A.T.; software, A.T.; validation, A.T., C.S., T.K.; formal analysis, A.T.; investigation, A.T.; resources, A.T., C.S., T.K.; data curation, A.T.; writing—original draft preparation, A.T.; writing—review and editing, T.K., C.S.; supervision, T.K., C.S.; project administration, T.K., C.S.; funding acquisition, T.K., C.S.. All authors have read and agreed to the published version of the manuscript.

Funding

This work is funded by the Department of Energy DE-EE0008303.

Data Availability Statement

Data is contained within this article and Supplementary Material. The data presented in this study are available in folder labeled “Supplementary Material”.

Acknowledgments

This work was supported by Oak Ridge National Laboratory and by the Department of Defense (DoD) through the National Defense Science and Engineering Graduate (NDSEG) Fellowship Program.

Conflicts of Interest

The authors declare no conflict of interest. The funders had no role in the design of the study; in the collection, analyses, or interpretation of data; in the writing of the manuscript, or in the decision to publish the results.

References

  1. Nagel, J.K.S.; Liou, F.W. Hybrid Manufacturing System Design and Development. Manuf. Syst. 2012, 11, 223–224. [Google Scholar]
  2. Cortina, M.; Arrizubieta, J.I.; Ruiz, J.E.; Ukar, E.; Lamikiz, A. Latest Developments in Industrial Hybrid Machine Tools that Combine Additive and Subtractive Operations. Materials 2018, 11, 2583. [Google Scholar] [CrossRef] [Green Version]
  3. Xu, F.; Dhokia, V.; Colegrove, P.; McAndrew, A.; Williams, S.; Henstridge, A.; Newman, S. Realisation of a multi-sensor framework for process monitoring of the wire arc additive manufacturing in producing Ti-6Al-4V parts. Int. J. Comput. Integr. Manuf. 2018, 31, 785–798. [Google Scholar] [CrossRef]
  4. Liou, F.W.; Slattery, K.; Kinsella, M.; Newkirk, J.; Chou, H.; Landers, R. Applications of a Hybrid Manufacturing Process for Fabrication of Metallic Structures. Rapid Prototyp. J. 2007, 13, 236–244. [Google Scholar] [CrossRef]
  5. Chen, N.; Frank, M. Process planning for hybrid additive and subtractive manufacturing to integrate machining and directed energy deposition. Procedia Manuf. 2019, 34, 205–213. [Google Scholar] [CrossRef]
  6. Rodrigues, T.; Duarte, V.; Miranda, R.M.; Santos, T.; Oliveira, J.P. Current Status and Perspectives on Wire and Arc Additive Manufacturing (WAAM). Materials 2019, 2, 1121. [Google Scholar] [CrossRef] [Green Version]
  7. Fuchs, C.; Baier, D.; Semm, T.; Zaeh, M.F. Determining the machining allowance for WAAM parts. Prod. Eng. 2020, 14, 629–637. [Google Scholar] [CrossRef]
  8. Zhang, W.; Soshi, M.; Yamazaki, K. Development of an additive and subtractive hybrid manufacturing process planning strategy of planar surface for productivity and geometric accuracy. Int. J. Adv. Manuf. Technol. 2020, 109, 1479–1491. [Google Scholar] [CrossRef]
  9. Maiyar, L.; Ramanujam, R.; Venkatesan, K.; Jerald, J. Optimization of Machining Parameters for End Milling of Inconel 718 Super Alloy Using Taguchi Based Grey Relational Analysis. Procedia Eng. 2013, 64, 1276–1282. [Google Scholar] [CrossRef] [Green Version]
  10. Shaik, J.H.; Srivinas, J. Optimal selection of operating parameters in end milling of Al-6061 work materials using multi-objective approach. Mech. Adv. Mater. Mod. Process. 2017, 3, 5. [Google Scholar] [CrossRef] [Green Version]
  11. Suarez, A.; Veiga, F.; Polvorosa, R.; Artaza, T.; Holmberg, J.; Lopez de Lacalle, L.N.; Wretland, A. Surface integrity and fatigue of non-conventional machined Alloy 718. J. Manuf. Process. 2019, 48, 44–50. [Google Scholar] [CrossRef]
  12. Corso, L.L.; Zeilmann, R.P.; Nicola, G.L.; Missell, F.P.; Gomes, H.M. Using optimization procedures to minimize machining time while maintaining surface quality. Int. J. Adv. Manuf. Technol. 2013, 65, 1659–1667. [Google Scholar] [CrossRef]
  13. An, L.; Yang, P.; Zhang, H.; Chen, M. Multi-Objective Optimization for Milling Operations using Genetic Algorithms under Various Constraints. Int. J. Netw. Distrib. Comput. 2014, 2, 108–114. [Google Scholar] [CrossRef] [Green Version]
  14. Yan, J. Multi objective optimization of milling parameters–the tradeoffs between energy, production rate, and cutting quality. J. Clean. Prod. 2013, 52, 462–471. [Google Scholar] [CrossRef]
  15. Castelino, K.; D’Souza, R.; Wright, P.K. Toolpath optimization for minimizing airtime during machining. J. Manuf. Syst. 2003, 22, 173–180. [Google Scholar] [CrossRef]
  16. Lazoglu, I.; Manav, C.; Murtezaoglu, Y. Tool path optimization for free form surface machining. CIRP Ann. Manuf. Technol. 2009, 58, 101–104. [Google Scholar] [CrossRef]
  17. Ali, R.A.; Mia, M.; Khan, A.M.; Chen, W.; Gupta, M.K.; Pruncu, C.I. Multi-Response Optimization of Face Milling Performance Considering Toolpath Strategies in Machining of Al-2024. Materials 2019, 12, 1013. [Google Scholar] [CrossRef] [PubMed] [Green Version]
  18. Hernandez, A.; Beno, T.; Repo, J.; Wretland, A. Integrated optimization model for cutting data selection based on maximal MRR and tool utilization in continuous machining operations. CIRP J. Manuf. Sci. Technol. 2016, 13, 46–50. [Google Scholar] [CrossRef]
  19. Heralic, A.; Christiansson, A.; Lennartson, B. Height control of laser metal-wire deposition based on iterative learning control and 3D scanning. Opt. Lasers Eng. 2012, 50, 1230–1241. [Google Scholar] [CrossRef]
  20. Iqbal, A.; Zhao, G.; Suhaimi, H.; He, N.; Hussain, G.; Zhao, W. Readiness of subtractive and additive manufacturing and their sustainable amalgamation from the perspective of Industry 4.0: A comprehensive review. Int. J. Adv. Manuf. Technol. 2020, 111, 2475–2498. [Google Scholar]
  21. Praniewicz, M.; Kurfess, T.; Saldana, C. Adaptive geometry transformation and repair for hybrid manufacturing. Procedia Manuf. 2018, 26, 228–236. [Google Scholar] [CrossRef]
  22. Kim, M.J.; Praniewicz, M.; Kurfess, T.; Saldana, C. Adaptive repair and digitization for hybrid manufacturing. Procedia Manuf. 2019, 34, 154–160. [Google Scholar] [CrossRef]
  23. Stavropoulos, P.; Bilkas, H.; Avram, O.; Valente, A.; Chryssolouris, G. Hybrid subtractive-additive manufacturing processes for high value-added metal components. Int. J. Adv. Manuf. Technol. 2020, 111, 645–655. [Google Scholar] [CrossRef]
  24. Davila, J.L.; Neto, P.I.; Noritomi, P.Y.; Coelho, R.T.; Da Silva, J. Hybrid manufacturing: A review of the synergy between directed energy deposition and subtractive processes. Int. J. Manuf. Technol. 2020, 110, 3377–3390. [Google Scholar] [CrossRef]
  25. Zheng, Y.; Liu, J.; Ahmad, R. A cost-driven process planning method for hybrid additive-subtractive remanufacturing. J. Manuf. Syst. 2020, 55, 248–263. [Google Scholar] [CrossRef]
  26. Cajella, A.; Tabernero, I.; Ealo, J.A.; Campa, F.J.; Lamikiz, A.; Lopez de Lacalle, L.N. Feed rate calculation algorithm for the homogeneous material deposition of blisk blades by 5-axis laser cladding. Int. J. Adv. Manuf. 2014, 74, 1219–1228. [Google Scholar]
  27. Tunc, L.; Ozkirimli, O.; Budak, E. Machining strategy development and parameter selection in 5-axis milling based on process simulations. Int. J. Adv. Manuf. Technol. 2016, 85, 1483–1500. [Google Scholar] [CrossRef]
  28. Jasco, A.; Matyasi, G.; Szalay, T. The fast constant engagement offsetting method for generating milling toolpaths. Int. J. Adv. Manuf. Technol. 2019, 103, 4293–4305. [Google Scholar]
  29. Uddin, M.S.; Ibaraki, S.; Matsubara, A.; Nishida, S.; Kakino, Y. Constant Engagement Tool Path Generation to Enhance Machining Accuracy in End Milling. JSME Int. J. 2006, 49, 43–49. [Google Scholar] [CrossRef] [Green Version]
  30. Chuangwen, X.; Jianming, D.; Yuzhen, C.; Huayuan, L.; Zhicheng, S.; Jing, X. The relationships between cutting parameters, tool wear, cutting force, and vibration. Adv. Mech. Eng. 2018, 10, 1–14. [Google Scholar] [CrossRef]
  31. Kalpakjian, S.; Schmid, S. Manufacturing Processes for Engineering Materials, 5th ed.; Pearson Education, Inc.: Upper Saddle River, NJ, USA, 2008; pp. 416–522. [Google Scholar]
  32. Parto, M. A secure MTConnect compatible IoT platform for machine monitoring through integration of fog computing, cloud computing, and communication protocols. Ph.D. Thesis, Georgia Institute of Technology, Atlanta, GA, USA, 14 December 2017. [Google Scholar]
  33. Budak, E.; Altinas, Y. Modeling and avoidance of static form errors in peripheral milling of plates. Int. J. Mach. Tools Manuf. 1995, 35, 459–476. [Google Scholar] [CrossRef]
  34. Liang, S.; Shih, A. Analysis of Machining and Machine Tools, 1st ed.; Springer: New York, NY, USA, 2015; pp. 9–43. [Google Scholar]
  35. Rao, S.S. Engineering Optimization: Theory and Practice, 4th ed.; John Wiley & Sons Inc.: Hoboken, NJ, USA, 2009; pp. 1–118. [Google Scholar]
  36. Krimpenis, A.; Fountas, N. Balancing multiple criteria in formulation of weighted, single-objective genetic algorithm optimization for CNC machining problems. Adv. Manuf. 2016, 4, 178–188. [Google Scholar] [CrossRef]
Figure 1. Approximation of the cup-shaped geometry (black outline) with corresponding toolpath issues: (a) non-optimized toolpath showing air cutting toolpath sections (green) and engagement toolpath sections (blue); (b) non-optimized toolpath showing a spike in tool load; (c) partially optimized toolpath that makes tool load more uniform; (d) fully optimized toolpath that minimizes machining time, cutting force, and surface roughness.
Jmmp 05 00094 g001
Figure 2. Example single bead surface approximations using: (a) triangular approach; (b) trapezoidal approach; (c) hybrid approach. Height profile is shown in red, desired Z height is shown by the dotted blue line.
Jmmp 05 00094 g002
Figure 3. As-built wire directed energy deposition (DED) part: (a) on substrate with 1” gauge block for scale; (b) side view of part. The green circles indicate the overbuilt regions of the cup geometry.
Jmmp 05 00094 g003
Figure 4. Raw probe data for each bead: (a) 3 pt probing; (b) 5 pt probing; (c) 10 pt probing; consolidated height profiles: (d) 3 pt probing; (e) 5 pt probing; (f) 10 pt probing.
Jmmp 05 00094 g004
Figure 5. Sample part surface approximation using: (a) triangular approach; (b) trapezoidal approach and (c) hybrid approach. Height profile is shown in red, desired Z height is shown by the dotted blue line, and higher fidelity height profile is shown in black. Note that the higher fidelity height profile overlaps the hybrid surface approximation at the ends of the wall profile.
Jmmp 05 00094 g005
Figure 6. (a) Non-optimized subtractive toolpath; (b) optimized subtractive toolpath using triangular surface approximation; (c) optimized subtractive toolpath using trapezoidal surface approximation; (d) optimized subtractive toolpath using hybrid surface approximation. Height profile is shown in red, desired Z height is shown by the dotted pink line. Cut feed segments are indicated by blue lines and rapid feed segments are indicated by green lines.
Jmmp 05 00094 g006
Figure 7. Process time breakdown for: (a) 3 beads and 1 facing pass; (b) 1 bead and 1 facing pass; (c) 3 beads and 2 facing passes.
Jmmp 05 00094 g007
Table 1. Wire properties.
%C%Cr%Ni%Mo%Mn
0.0218.913.72.32.0
%Si%P%S%Cu%Fe
0.890.020.010.22balance
Table 2. Sample part deposition parameters.
Feed Rate (mm/min)Laser Power (W)Hot Wire Power (W)Wire Feed Rate (m/min)
106722507004.45
Table 3. Equal objective prioritization results.
Geometric
Approximation
% Change from Non-Optimized Machining Time% Change from Non-Optimized
Surface Roughness
% Change from Non-Optimized Cutting Force
Triangular−31.48−48.20−57.49
Trapezoidal−45.32−63.10−66.03
Hybrid−44.00−58.36−61.80
Table 4. Machining time objective prioritization results.
Geometric
Approximation
% Change from Non-Optimized Machining Time% Change from Non-Optimized
Surface Roughness
% Change from Non-Optimized Cutting Force
Triangular−57.36+21.76−0.13
Trapezoidal−69.45+5.67−2.75
Hybrid−68.56+8.20−0.62
Table 5. Cutting force objective prioritization results.
Geometric
Approximation
% Change from Non-Optimized Machining Time% Change from Non-Optimized
Surface Roughness
% Change from Non-Optimized Cutting Force
Triangular−1.66−68.77−74.40
Trapezoidal−3.86−82.64−83.96
Hybrid−0.58−80.12−81.85
Table 6. Surface roughness objective prioritization results.
Geometric
Approximation
% Change from Non-Optimized Machining Time% Change from Non-Optimized
Surface Roughness
% Change from Non-Optimized Cutting Force
Triangular−21.79−57.41−65.00
Trapezoidal−40.07−67.50−70.25
Hybrid−36.39−65.30−68.16
Publisher’s Note: MDPI stays neutral with regard to jurisdictional claims in published maps and institutional affiliations.

