Article

Experimental and Numerical Assessment of the Hot Sheet Formability of Martensitic Stainless Steels

1
Professorship for Forming and Joining, Chemnitz University of Technology, 09107 Chemnitz, Germany
2
Institute of Materials Science and Engineering, Chemnitz University of Technology, 09107 Chemnitz, Germany
*
Author to whom correspondence should be addressed.
J. Manuf. Mater. Process. 2020, 4(4), 122; https://doi.org/10.3390/jmmp4040122
Submission received: 7 October 2020 / Revised: 8 December 2020 / Accepted: 14 December 2020 / Published: 16 December 2020
(This article belongs to the Special Issue Metal Forming and Joining)

Abstract

:
Hot formed sheet components made of Martensitic Stainless Steels (MSS) can achieve ultra-high strengths in combination with very high corrosion resistance. This enables to manufacture complex lightweight sheet components with longer lifespan. Nevertheless, the hot formability of MSS sheets has not been accurately evaluated considering high temperatures and complex stress and strain states. In this work, the hot sheet formability of three MSS alloys under thermomechanical process conditions was investigated. Initially, mechanical properties of this sheet material were determined by uniaxial tensile test. Finite Element Method (FEM) simulation of a hot deep drawing process was performed under consideration of thermo physical calculated material models using the software JMatPro® and Simufact Forming® 15.0. The resulting strains and cooling rates developed locally in the work piece during the forming process were estimated. The numerical results were validated experimentally. Round cups were manufactured by hot deep drawing process. The resulting maximum drawing depth and hardness were measured. In general, all three alloys developed very good formability at forming temperatures between 700 and 900 °C and increased hardness values. However, they are highly susceptible to chemical composition, austenitization temperature, dwell time, and flange gap. A statistic approach is given to explain the correlation between hardness and its influencing factors.

1. Introduction

The martensitic stainless steels (MSS) are Fe–Cr–C alloys, which exhibit a carbon content between 0.1 and 1 wt.%. The chromium content is between 11.5 and 18 wt.%, and the nickel content is in a range from 0 to 5 wt.%. The advantage of MSS is that they are characterized by their high corrosion resistance in combination with high strength. The technological benefits are high chemical stability combined with high hardness, resulting in an excellent wear and cutting resistance [1]. MSS are therefore used for cutting tools, turbines or ball bearings [2]. At present, bulk-formed components made of MSS are usually hot forged and sheet metal components are currently produced in soft annealed condition by cold forming. Regardless of the forming process, the desired mechanical properties are achieved by a subsequent heat treatment consisting of hot forming and quenching with subsequent tempering. To manufacture complex sheet metal components, however, the plastic strain achievable by cold forming often is not sufficient. This disadvantage can be compensated by a combined forming and heat treatment, i.e., a thermomechanical treatment. This mainly involves hot forming of the sheet metal and its quenching in the forming tools during this process, currently known as press hardening. Up to now, however, only manganese-boron steels have been used as primary alloys for press hardening.
The potential of MSS for the production of sheet metal components similar to press hardening has already been demonstrated and tested by preliminary investigations and the production of demonstrators [3,4]. In contrast to manganese-boron steels, press-hardened sheet metal components made of MSS can achieve ultra-high strengths in combination with very good corrosion resistance. This could enable the production of complex-shaped sheet metal components with a longer lifespan. Nevertheless, a basic understanding of the relationships between process parameters, microstructure development as well as material and service properties and corrosion behaviour is still required [4,5,6]. The MSS alloys were comprehensively characterized mechanically and microstructurally under consideration of the conditions of conventional bulk forming processes [7,8]. However, this detailed knowledge is not sufficient to evaluate the feasibility of the hot sheet-forming process. The requirements under which the sheet is formed occur under very different conditions. In this paper, the hot formability during deep drawing tests of three MSS sheet metal alloys and their relation to their microstructural development is investigated. For this first approach, reliable computer-aided tools were used to analyze the hot formability of sheet metal. These are the Java-based tools JMatPro® (version 7.0, Guildford, UK) (Java-based Material Properties) and FEM (Finite Element (FE) Method)-based forming simulation software. This research is divided into three sections. In the first section, specific process parameters were selected to evaluate the hot formability of the MSS alloys, which was done by means of cup drawing tests. The hot formability of the alloys was numerically evaluated by FE-simulation of the hot deep drawing process for the production of round cups. For this purpose, material models calculated with the software JMatPro® were implemented into the software Simufact Forming® (version 15.0, Hamburg, Germany). The strain distribution in the cup, the occurring plastic strain and cooling rates as well as local contact pressures were predicted by FE-calculation. In the following section, the hot deep drawability and the occurring forming forces for the alloys were evaluated. The resulting values of hardness as a function of specific process parameters were used to assess the hot formability of the MSS alloys. In the final section, the relationship between the thermomechanical behavior of the alloys and the metallurgical parameters described in the first section was discussed.

2. Materials and Methods

2.1. Initial State of Test Material

Within the scope of the investigations, three different martensitic stainless steels were examined in their thermomechanical behavior and the resulting mechanical properties. The selected MSS alloys X12Cr13, X30Cr13 and X46Cr13 differ mainly in their chemical composition, which was determined by optical emission spectrometry (OES) using a Bruker Tasman Q4 (Bruker, Billerica, MA, USA). The mechanical properties of the raw material in its initial state were determined in a tensile test. For this purpose, the H&P Inspekt 150 universal testing machine was used. The test material itself is sheet metal with a thickness of 1.5 mm.

2.2. Experimental Methods

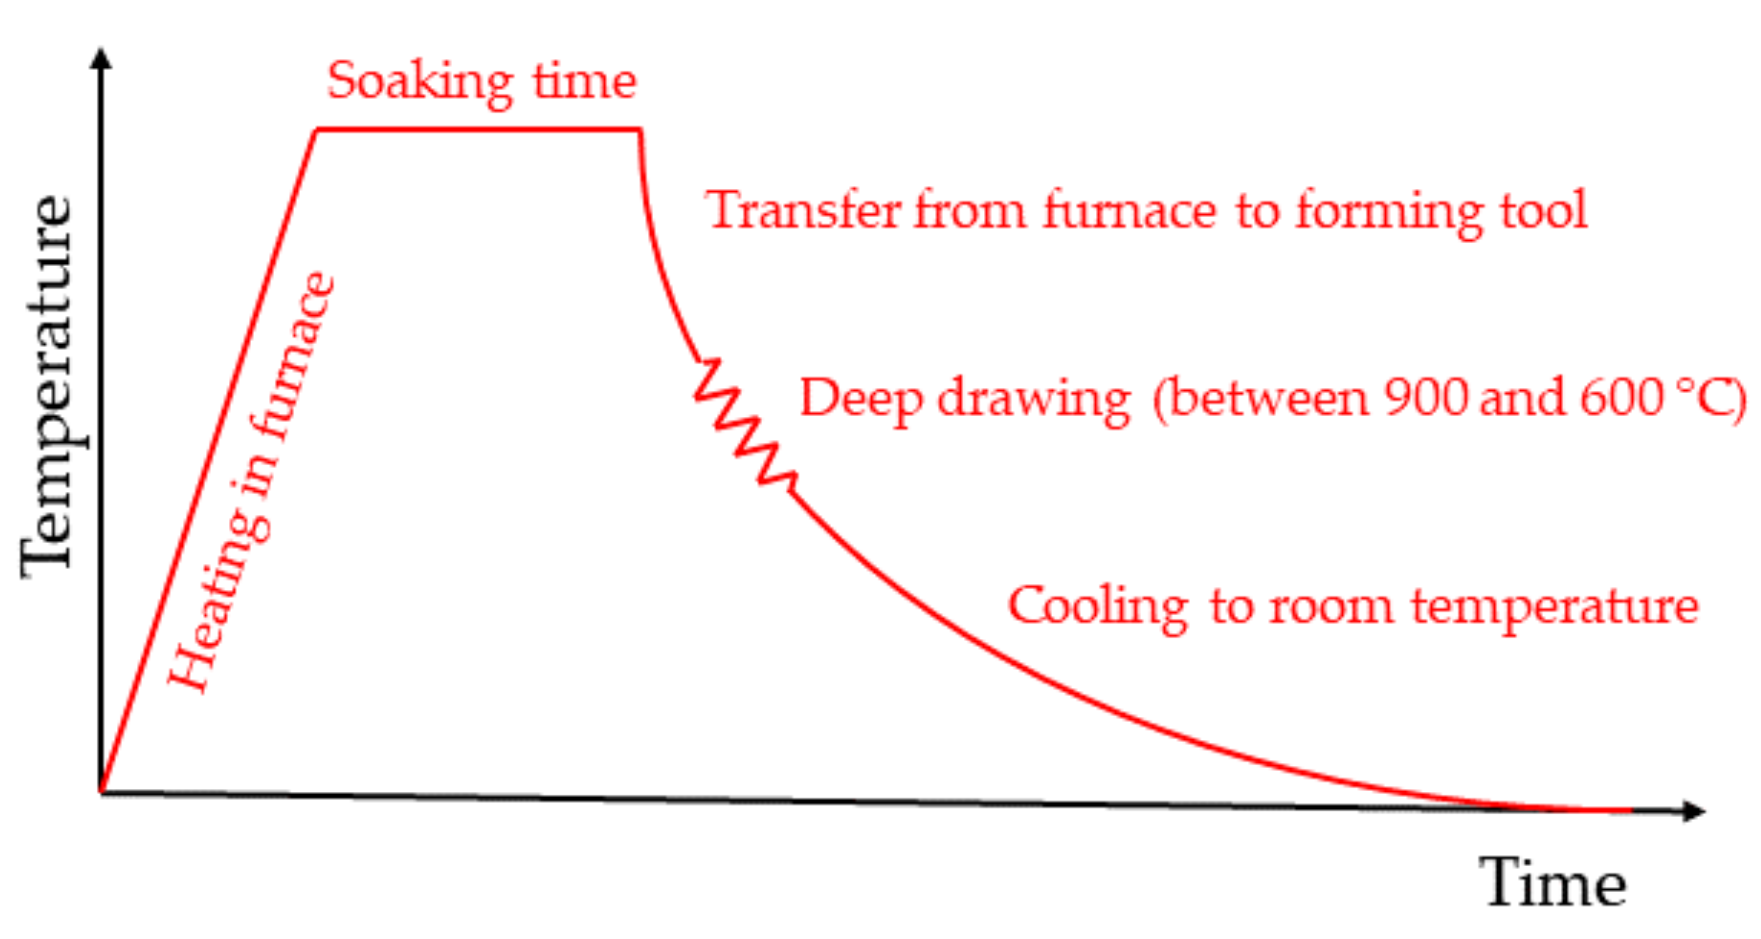
2.2.1. Procedure and Parameter Setup for the Thermomechanical Treatment of MSS

The general procedure of the thermomechanical treatment is divided into several steps, as illustrated in Figure 1.
According to Figure 1, the sheet is austenized by heating it to a peak temperature in a furnace. The thermal treatment is performed for 300 s at 1050 °C, and for 120 s and 300 s at 1150 °C. After the soaking time, the austenized blank is transferred manually to the forming tool and remains there until it is cooled down to the respective forming temperature. The deep drawing process begins when the forming temperature is reached. While forming, the blank is simultaneously quenched due to its contact with the unheated tool. After forming, the formed sheet is removed from the tool and cooled down to room temperature in still air. Table 1 shows a summary of the test parameters used for the deep drawing tests. The relevant parameters are austenitization temperature, austenitization time and forming temperature. The parameter selection is based on previously reported investigations [9,10]. Three experiments are carried out for each of the selected conditions to ensure the statistical certainty.

2.2.2. Definition of the Forming Temperature

During forming of hot sheets in cold tools, cooling of the sheet material occurs. Therefore, it is not possible to refer to constant forming temperatures. An alternative approach is therefore to determine the temperature of the sheet metal at the beginning of the forming process after air cooling and without contact to the tool. For this purpose, preliminary experiments were carried out in which only the cooling time of the sheet metal is shown after its removal from the laboratory furnace LM 512 (Linn High Therm®, Hirschbach, Germany). The sheets were austenitized at 1050 °C as well as at 1150 °C. The temperature of the blank was measured with spot-welded thermocouples immediately after leaving the furnace, so that the time interval required to cool the blank to the desired forming temperature was precisely defined. Consequently, time intervals could be estimated, i.e. how long a sheet has to remain in the atmosphere to reach 700 °C, 800 °C or 900 °C. These time intervals were defined as the experimental start of the forming process. Based on the measured temperature/time curves, the thermal conditions in the FE-simulation could be adjusted to match the experiment with the simulation.

2.2.3. Experimental Hot Deep Drawing Test

The three different alloys were evaluated using a deep drawing test for cups to determine their maximum deep drawability depending on several test parameters. For this purpose, circular blanks with a thickness of 1.5 mm and a diameter between 170 mm and 200 mm were cut. In this test, these blanks were austenitized in a furnace at different holding times and temperatures and then transferred to a cup drawing tool. Deep drawing is then carried out using a punch, which forms a cup from the sheet. The tool (see Figure 2a) is unheated during the entire test procedure. A simplified CAD design of the tool is shown in Figure 2b. The active elements punch (yellow), hold-down (blue) and drawing die (green) are separated from the rest of the tool by insulation (orange). The tool was installed in a servo screw press DUNKES ES1-S4-80/30 with a nominal force of 800 kN in the ram and 300 kN in the cushion. The electric drives enable very precise motion profiles that are measured by an integrated, precision positioning system. The drawing tool for these experiments forms deep drawn cups with an inner diameter of 100 mm. The drawing gap, which is the clearance between the punch sidewall and the drawing die, is equal to 2 mm. The drawing ratio β is the relationship between the initial blank diameter Db and the punch diameter DTool (β = Db/DTool), which is between 1.7 and 2.0 respectively. The deep drawing process was carried out at a ram speed of 20 mm/s and a flange gap (distance between die and blank holder) of 2.5 mm. The forming operation was stopped with the fracture of the deep drawn cup. All tests were carried out with a boron nitride spray from Proline as lubricant.

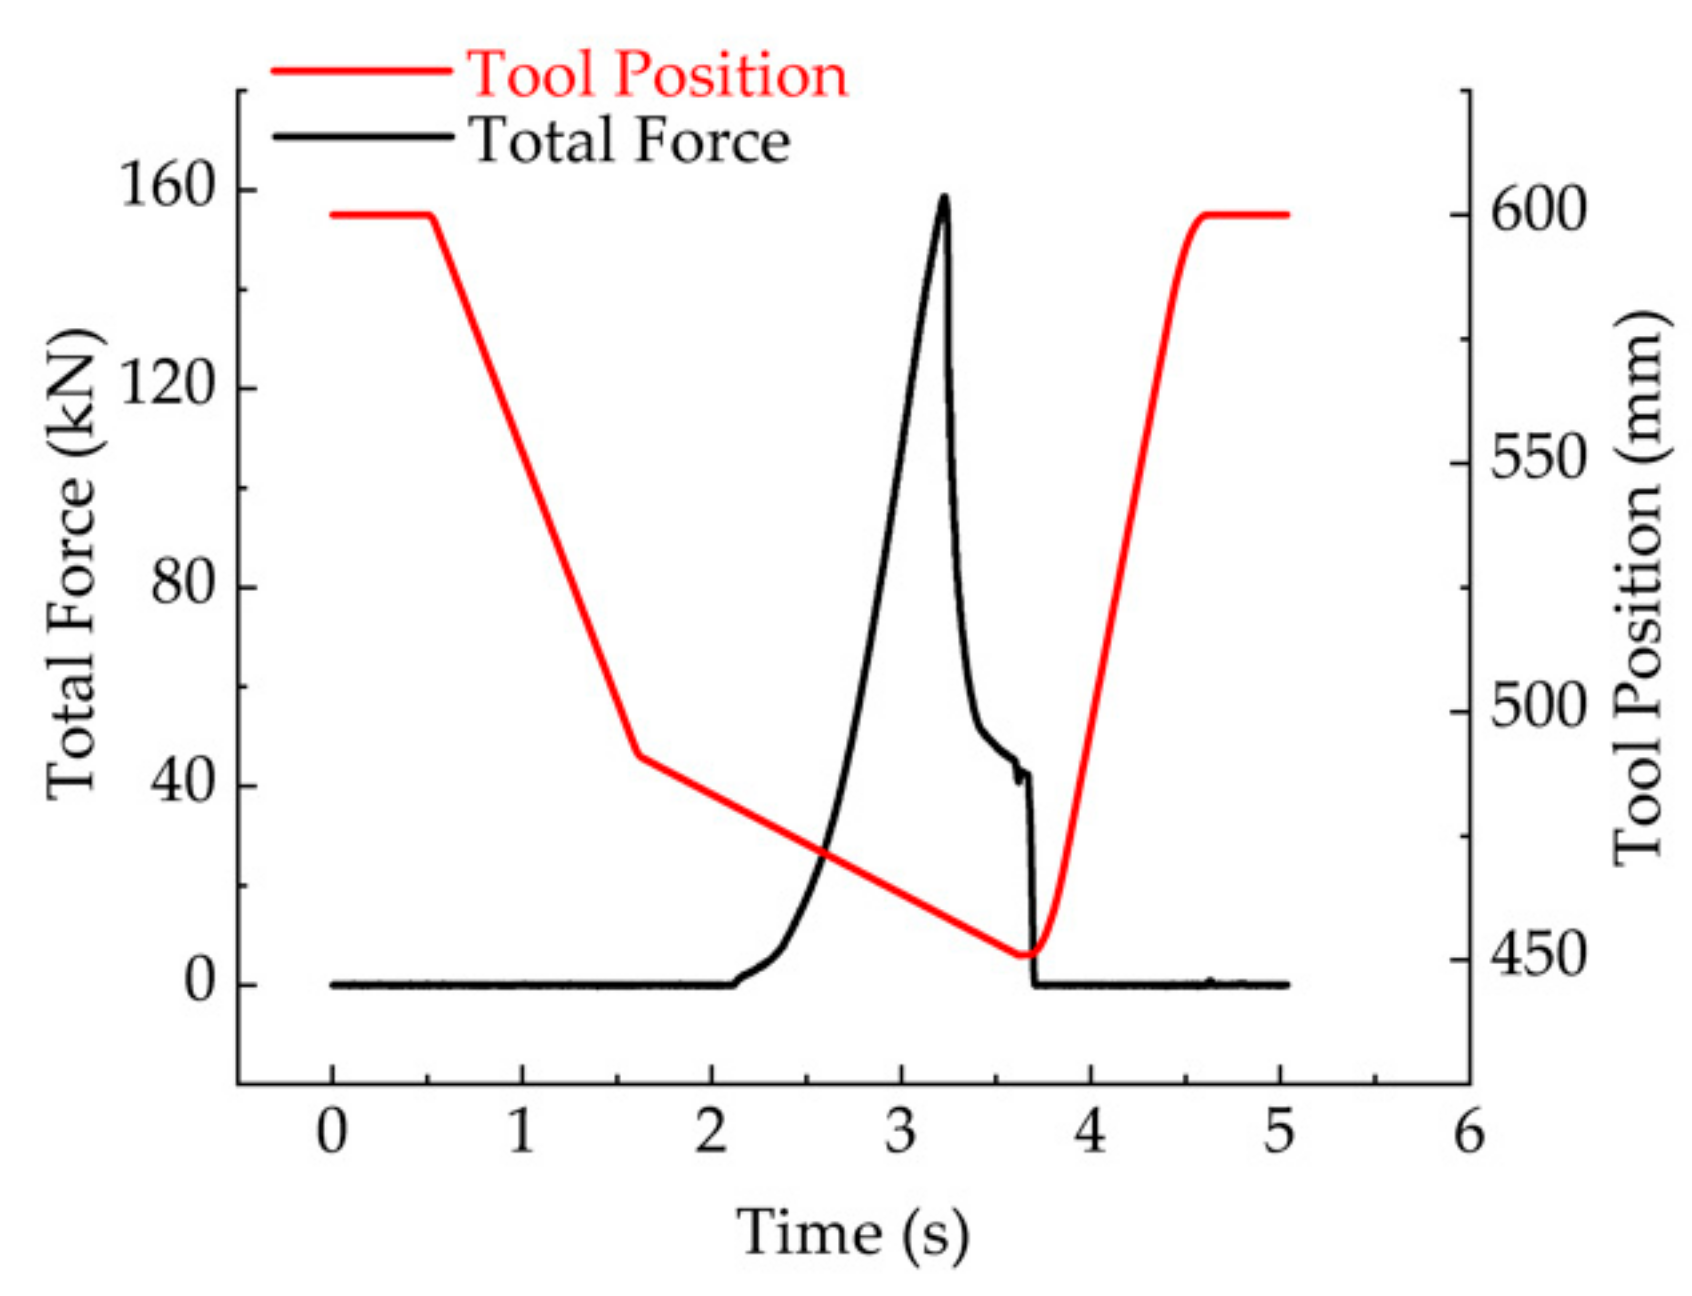
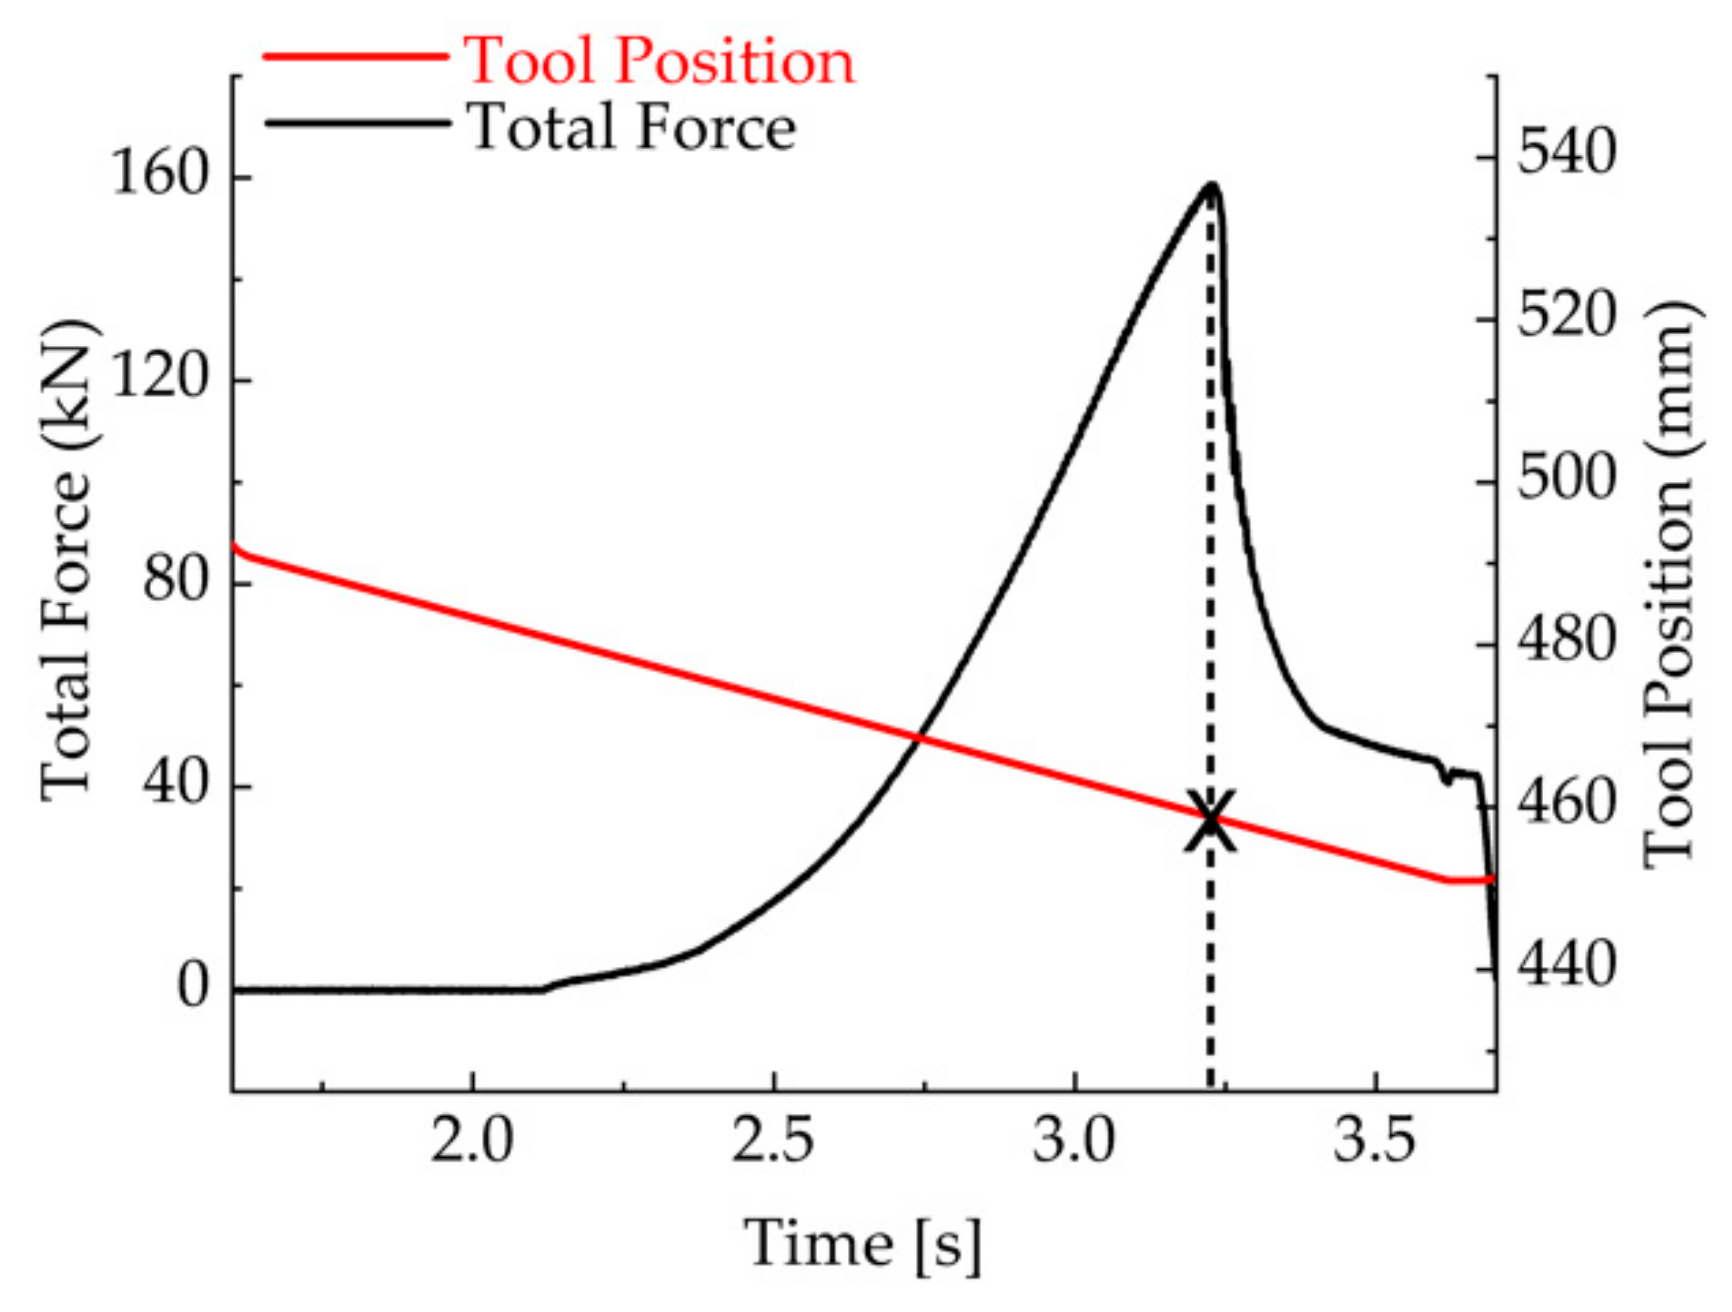
2.2.4. Determination of the Maximum Drawing Force and Maximum Drawing Depth

As previously mentioned, the maximum drawing depth was determined by using the data of displacement by time and force by time monitored by the press, as shown in Figure 3. If a crack occurs during the deep drawing test, load cells of the press will simultaneously register a force drop. Using the data of displacement by time monitored by the press, it is possible to determine the exact position of the tool when the force drop occurs. The point of the intersection shown in Figure 4 indicates the maximum drawing depth. The maximum allowed drawing depth depends on the diameter of the blank, regardless of the flange gap. For the blank diameter of 170 mm, the maximum allowed drawing depth is 40 mm. After this depth, no material is available anymore between die and blank holder, i.e., the blank is completely drawn-through.

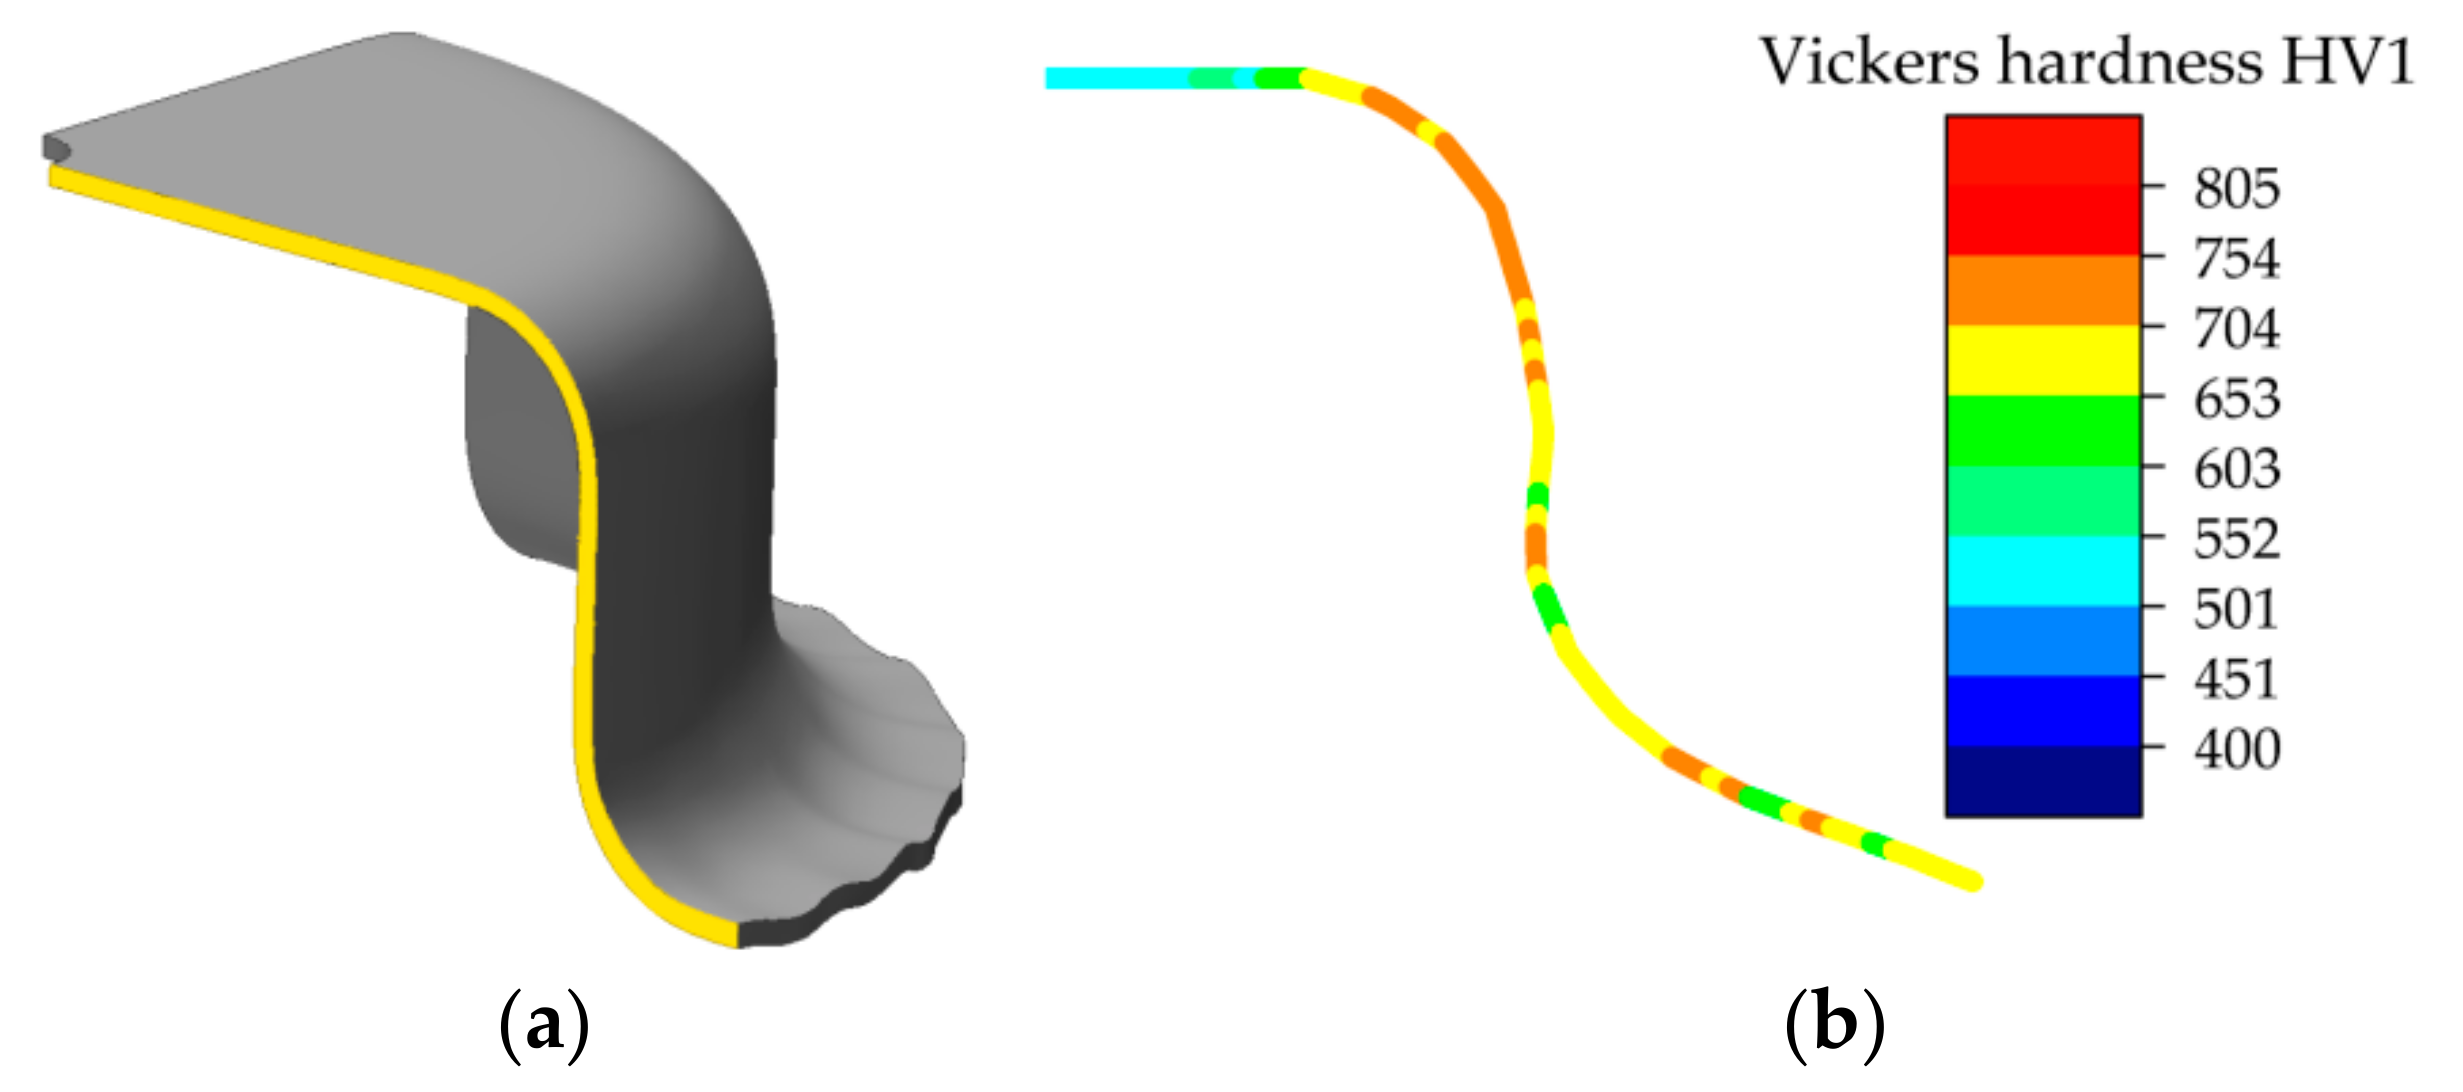
2.2.5. Determination of the Maximum Hardness of Specimen

The hardness of the cup after the thermomechanical treatment gives a significant indication of how effective and homogeneous the increase in strength is and where maximum hardness values can be expected. For this purpose, the thermomechanically-treated cups are cut longitudinally and the hardness values HV1 are determined for one half of the cross section. An example of a measuring surface is given in Figure 5a (yellow area). The measurement was carried out using the EMCO-TEST® DuraScan 70 hardness tester. The adjacent hardness values, HV1, allow conclusions to be drawn about the hardness distribution and its homogeneity. In the example in Figure 5b, the hardness curve for X46C13 is given after austenitization at 1150 °C for 120 s and subsequent forming at 900 °C. The maximum hardness occurs in the radius between bottom and wall of the cup. From these hardness values, the mean value and the standard deviation are determined in order to compare them with the hardness values of cups, produced with other thermomechanically test parameters.

2.3. Thermophysical Calculations

Based on the CalPhaD method, JMatPro® enables the calculation of the phases and respective chemical local phase compositions of different steels (with general steel database) [8,11,12]. The respective chemical composition and grain size are taken into account. Further models, such as the Kirkaldy model, are implemented to calculate Time-Temperature-Transformation (TTT) and Continuous-Cooling-Temperature (CCT) diagrams [8]. Further information can be found in [13,14]. This calculation approach was chosen to predict material properties that could otherwise only be obtained by a higher experimental effort. On the basis of the chemical composition, the ASTM grain size 9 and the preceding austenitization at 1050 °C, mechanical and thermal material properties could be concluded for the three alloys. The subsequently calculated elastic-plastic material model included flow curves as a function of temperature and strain rate; phase transition temperatures based on TTT and CCT diagrams; and physical and thermophysical properties as a function of temperature, namely density, specific heat, thermal conductivity, coefficient of thermal expansion, modulus of elasticity, and Poisson’s ratio. A file with the data of all material properties was created and then imported into the material database of the FE-software.

2.4. Structure of the FE-Model

The thermomechanical treatment of the MSS sheet metal alloys was simulated using the FE-software Simufact Forming® 15.0. The simulation setup was divided into a transfer process of the austenitized sheet into the forming tool and the subsequent forming process in the press. Before starting the transfer process, the blank temperature was raised to the austenitization temperature. The real-time temperature profile during heating was not taken into account in the simulation to simplify the process. The transfer duration was based on the experimental tests. The duration and sequence of the simulated forming process depended on motion profile data in the ram and cushion press. The ram speed was set at a constant 20 mm/s for all tests until a drawing depth reached a maximum value of 40 mm. The flange gap, which is the distance between drawing die and blank holder including sheet thickness, was set to 2.5 mm for all simulated tests. The tools were modelled as rigid bodies with heat transfer. The blank was modelled in 3D and consists of 31,000 hexahedral elements. The friction coefficient according to Coulomb was set to be constant at µ = 0.2. The coefficient of heat transfer to the environment is temperature-dependent; the coefficient of heat transfer between tool and workpiece is dependent on the contact pressure. According to the cooling experiments at chilled air (see Section 3.2), which were controlled by thermocouples, the heat transfer coefficient (HTC) is set to HTC = 10 W/(m2 K) and the emissivity to ε = 0.6. This leads to a high correlation between the experimental cooling curves and the simulated cooling curves. The material models for the alloys required for the simulation were calculated with the software JMatPro® using the chemical compositions summarized in Section 3.1. Files with the data of all material properties were created for each alloy and austenitization state. These data were then imported into the material database of the Simufact Forming® software. The FE simulations were carried out separately for several thermomechanical treatments, which were experimentally performed before, as illustrated in Table 2. The plastic strain that occurred in the component during the forming process was used to characterize the deep drawing properties of the alloys by FE-simulation. In order to correctly analyze and compare the plastic strain, certain areas of the resulting component were selected to locally evaluate the plastic strain. For this purpose, specific near-surface points located along the cross section of the blank were evaluated.

2.5. Statistical Study–Analysis of Variance

The main objective for employing analysis of variance (ANOVA) was to investigate the significance of process parameters, affecting the resulting hardness and maximum drawing depth. The software OriginPro® (v. 2018G, OriginLab, Northampton, MA, USA) with its implemented design of experiments application was used.

3. Results

3.1. Martensitic Stainless Steel Alloys

The chemical compositions of the three different MSS, X12Cr13, X30Cr13 and X46Cr13 that were investigated in this research work are given in Table 3. The analysis was done in the sheets’ initial states and mainly reveals the difference in the carbon content, which varies from 0.11 wt.% for X12Cr13 and 0.35 wt.% for X30Cr13 to 0.48 wt.% for X46Cr13. Compared to X12Cr13, the latter MSS shows a threefold and fourfold carbon content, respectively. There are also differences in other alloying elements, such as chromium and nickel, which are responsible for the corrosion resistance. The alloy X12Cr13 shows the lowest Cr content with 11.54 wt.%, which increases by about 2 wt.% for X30Cr13. Smaller differences of only 0.15 wt.% exist between X30Cr13 and X46Cr13. The nickel content is significantly lower compared to chromium. The alloy X12Cr13 with 0.33 wt.% and the alloy X30Cr13 with 0.38 wt.% exhibit values within the same level, whereas X46Cr13 shows a halved Ni content of 0.17 wt.% in comparison. The silicon content is similar for all alloys with approx. 0.5 wt.%. The molybdenum content, which has a positive influence on the hardenability, is very low for X12Cr13 with 0.06 wt.% and X46Cr13 with 0.01 wt.%, but is several times higher for X30Cr13 with 0.94 wt.%. The manganese content, which also improves the hardenability, is the lowest for X12Cr13 at 0.38 wt.%, increases to 0.42 wt.% for X30Cr13 and is highest with 0.63 wt.% for X46Cr13.
The mechanical properties of the test materials in their initial states were determined b tensile tests. For this purpose, the H&P Inspekt 150 universal testing machine was used. Test specimens showed 1.5 mm thickness and 12.5 mm width. Gauge length was 50 mm. All specimens were cut out in rolling direction. The results are given in Table 4. In initial state, X12Cr13 shows the highest yield strength (YS) and tensile strength (UTS) as well as the lowest fracture elongation in comparison to X30Cr13 and X46Cr13. X30Cr13 and X46Cr13 behave nearly similar, with X46Cr13 showing slightly higher YS and TS (higher by 10 MPa and 22 MPa, respectively). The highest YS and TS value deviation is observed for X12Cr13.

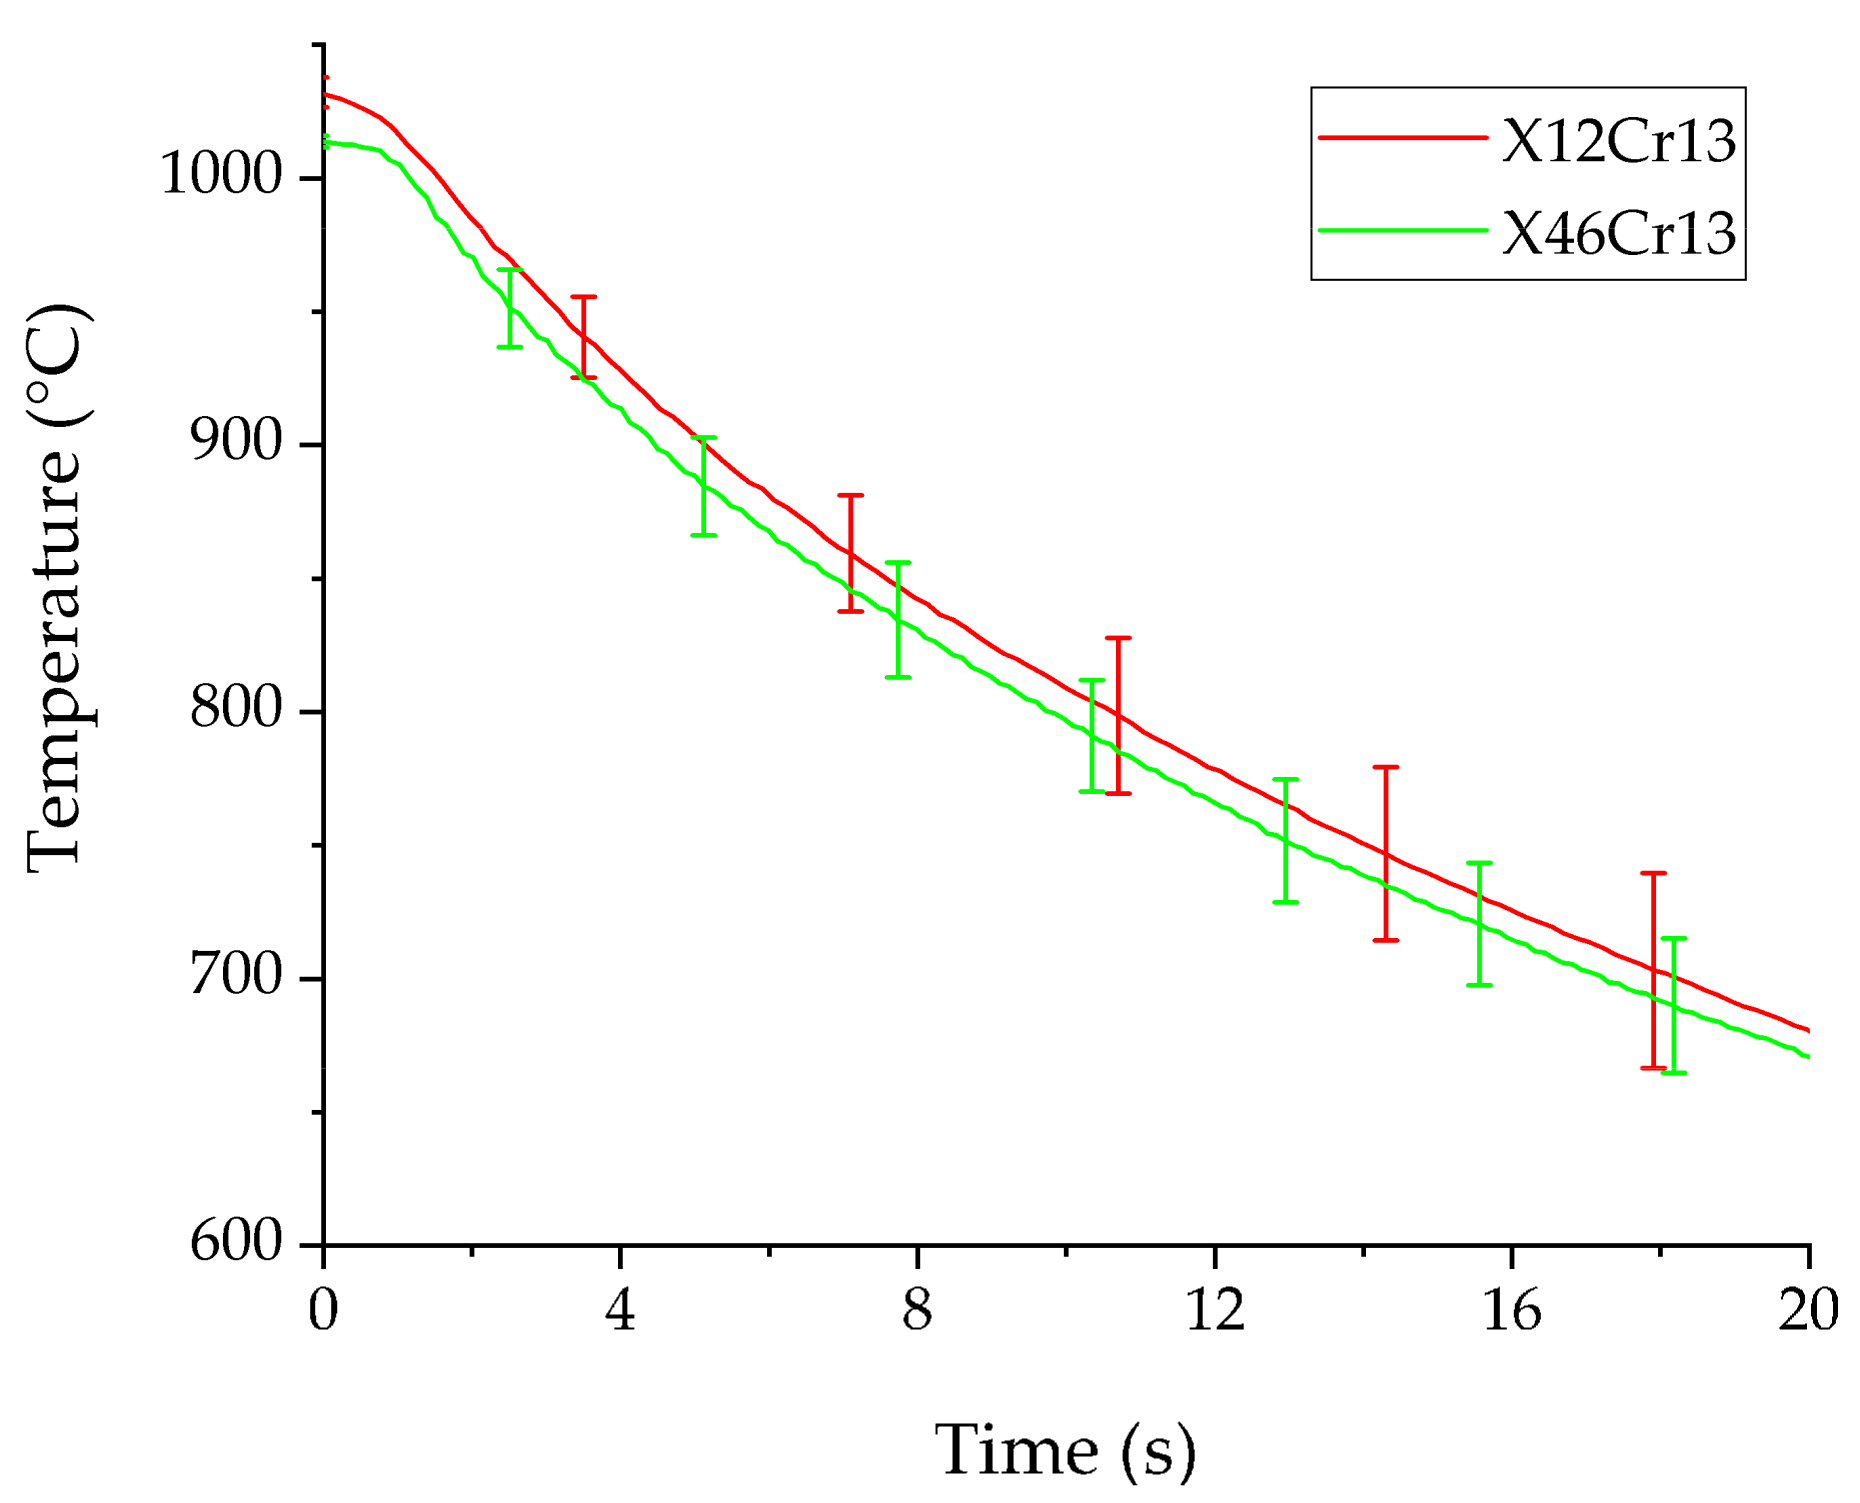
3.2. Cooling Behaviour of Austenized MSS

The different alloys behave nearly similar during cooling after the respective sheets are removed from the furnace. Figure 6 shows the exponential cooling curves of X12Cr13 and X46Cr13 during natural cooling in air, representing the investigated MSS with lowest and highest carbon content. Despite the different chemical composition, as described in Section 3.1, the curves’ progressions are identical and show but a small shift in the average temperature value of less than 10 K. The cooling curves are used to define the time intervals necessary to start a forming process at 900 °C, 800 °C or 700 °C. The HTC and the emissivity ε to the atmosphere are calculated from these experimentally determined cooling curves (see Section 4).

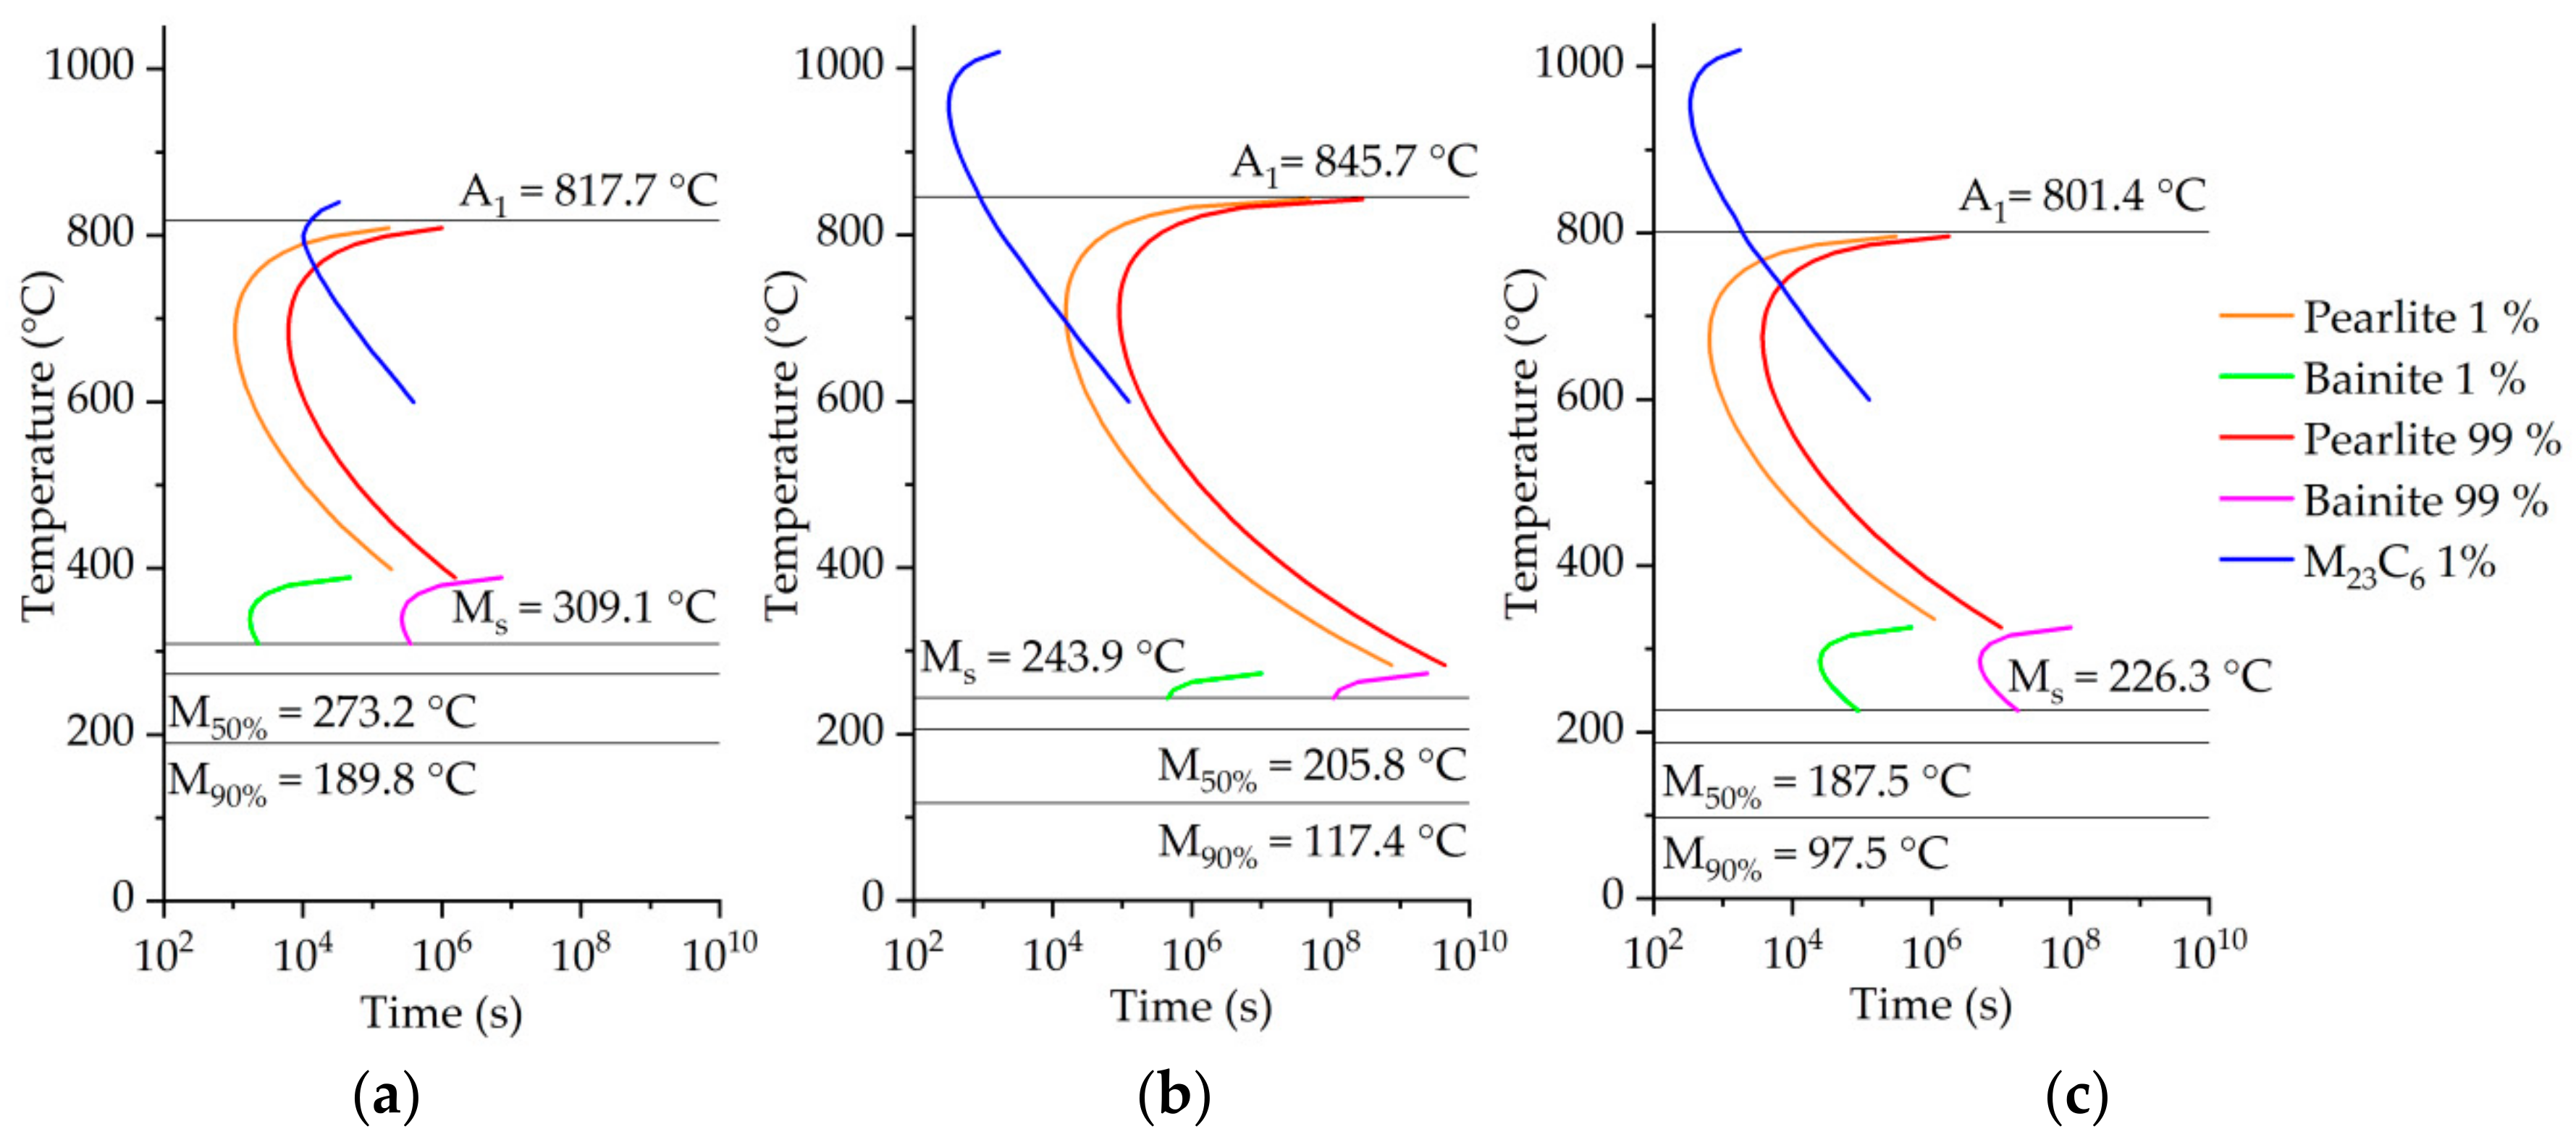
3.3. Phase Transformation by Thermophysical Calculations

The isothermal phase transformation behavior is used as a basis for the calculation of the phase transformation in the FE-simulation. The calculated TTT diagrams of the three MSS alloys, which are used in the material models of the FE simulation, show obvious differences, as illustrated in Figure 7. Next to the phase transformations, the precipitation start of M23C6 is also illustrated. X12Cr13, the alloy with the lowest contents of carbon and chromium, exhibits an A1 temperature at 817.7 °C (Figure 7a). Martensite transformation in X12Cr13 starts at the highest temperature for the three alloys with Ms = 309 °C and is completed at Mf = 190 °C. The pearlitic transformation in X12Cr13 is expected to start after 1050 s, the bainitic transformation after 1700 s. The beginning precipitation of M23C6 starts before the pearlitic phase transformation above 767 °C. Below that temperature, the pearlitic phase transformation starts first. In comparison, in X30Cr13 (Figure 7b), A1 already starts at a higher temperature at 845 °C. The pearlitic transformation begins after 15,000 s and the bainitic transformation after 450,000 s. At the same time, Ms drops significantly to 244 °C and Mf to117 °C. X46Cr13 (Figure 7c) shows a behavior similar to that of X30Cr13, with both Ms and Mf further decreasing to 226 °C and 97 °C. A1 starts at 801 °C. The pearlitic transformation of X46Cr13 occurs after 630 s and the bainitic transformation after 24,000 s.
According to the calculated TTT diagrams, the A1 temperature does not show a clear relation to the content of the alloying elements carbon, silicon and manganese. The Ms and Mf temperatures drop significantly at an increase of these elements. Since a phase transformation into pearlite or bainite is only to be expected after long holding times, martensite formation is expected in the regarding technological processes.

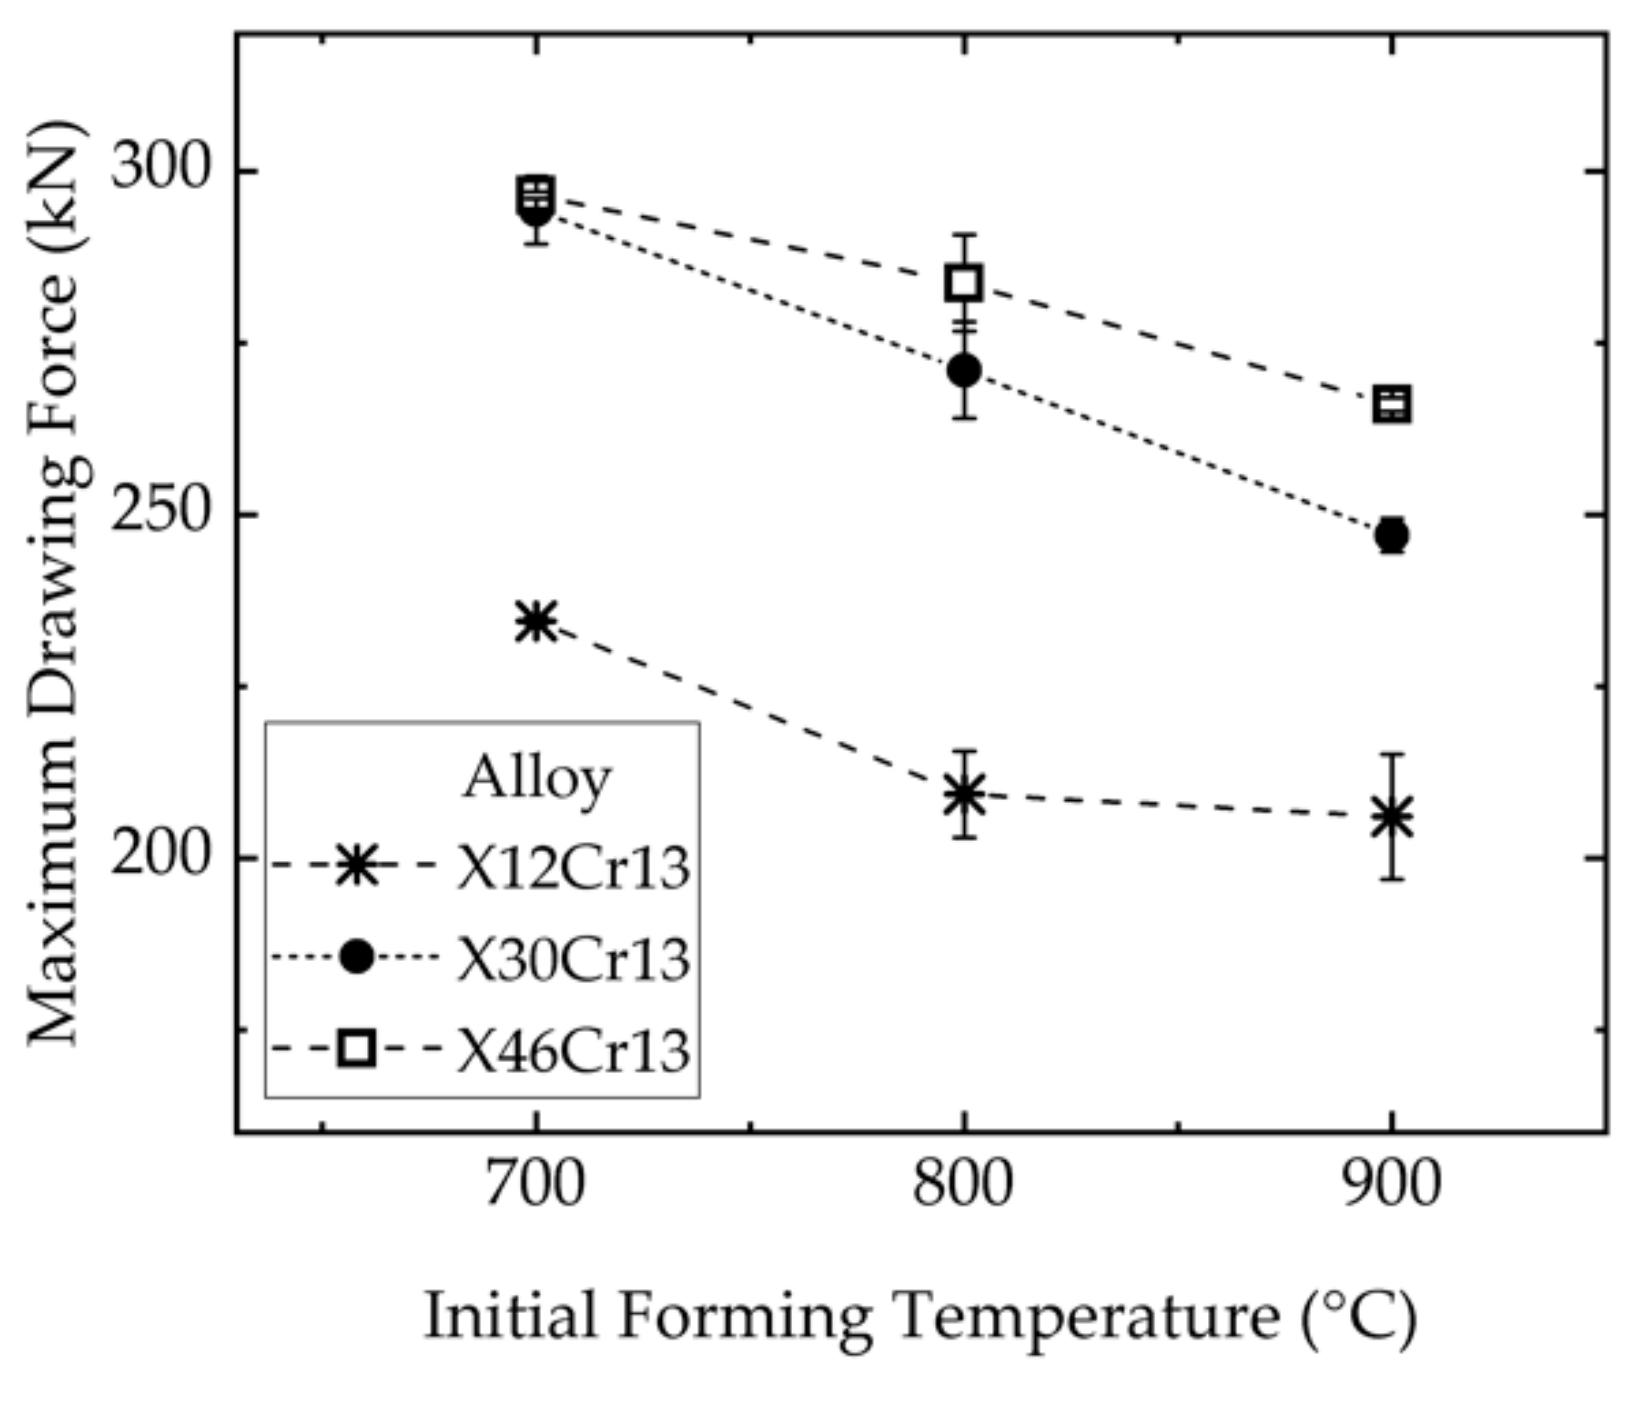
3.4. Influence of the Alloy Composition and the Forming Temperature on the Forming Forces

The forming forces on the active tools during the forming process were measured by integrated load cells in the presses ram. Figure 8 summarizes the resulting maximum drawing forces during depth drawing of sheets austenitized at 1050 °C for 300 s that achieve a depth of 40 mm. The analyses on the influence of alloy composition and forming temperature on the forming forces were proceeded on depth drawing processes in which a ram speed of 20 mm/s, a blank diameter of 170 mm and the use of an unheated tool were kept constant. In Figure 8, the resulting maximum forming forces for all investigated alloys in dependence of the initial forming temperature are illustrated. It is obvious that forming forces are strongly dependent on the alloy composition. X12Cr13, having the lowest contents of carbon, manganese and chromium, requires less forming force (maximum: 235 kN at 700 °C) than the other, high alloyed MSS (X30Cr13: 294 kN, X46Cr13: 297 kN at the same conditions). Furthermore, the difference of the measured forming forces at different forming temperatures is much lower between X30Cr13 and X46Cr13 than in comparison to these high alloyed MSS with X12Cr13. As expected, the maximum forming forces decrease considerably with increasing initial forming temperatures from 700 °C to 900 °C. The respective decreases are 28 kN for X12Cr13, 47 kN for X30Cr13 and 43 kN for X46Cr13. As is well known, the forming forces depend on dislocation glide within the material that is diffusion-controlled and thus temperature-dependent. Furthermore, in the lower temperature range, precipitations may already be present, which inhibit the movement of dislocations. This explains the drop of necessary forming forces with rising forming temperature.

3.5. Influence of the Blank Diameter on the Maximum Drawing Depth

Circular blanks with diameters of 170 mm, 180 mm, 190 mm, and 200 mm were hot-formed. For the analysis, the scope of the tests was reduced so that the initial austenitization took place at 1050 °C for 300 s and forming was conducted in direct succession. Forming started at 900 °C and was carried out with a constant flange gap of 2.5 mm, ensuring a high drawing depth according to preliminary investigations. With a punch diameter of 100 mm, drawing ratios between 1.7 and 2.0 were set. The drawing ratio β is calculated with the sheet diameter divided by the punch diameter. In Figure 9, the maximum drawing depth without cracking is illustrated for all three alloys. All alloys show a reduced maximum drawing depth with increased drawing ratio in the considered parameter range.
The maximum drawing depths of 34.0 mm and 34.7 mm are achieved for X12Cr13 and X30Cr13, respectively, at β = 1.7. X46Cr13, having the highest carbon content, which achieves a maximum drawing depth of 30.5 mm (β = 1.7). At β = 2, the maximum drawing ratio for all three alloys has almost converged. Maximum drawing depths between 22.4 mm and 22.9 mm are achieved for blank diameters of 200 mm. The influence of the alloy composition on the achievable maximum drawing depth is therefore considered as not significant. The achievable drawing depth is rather influenced by the initial diameter of the sheet blanks.

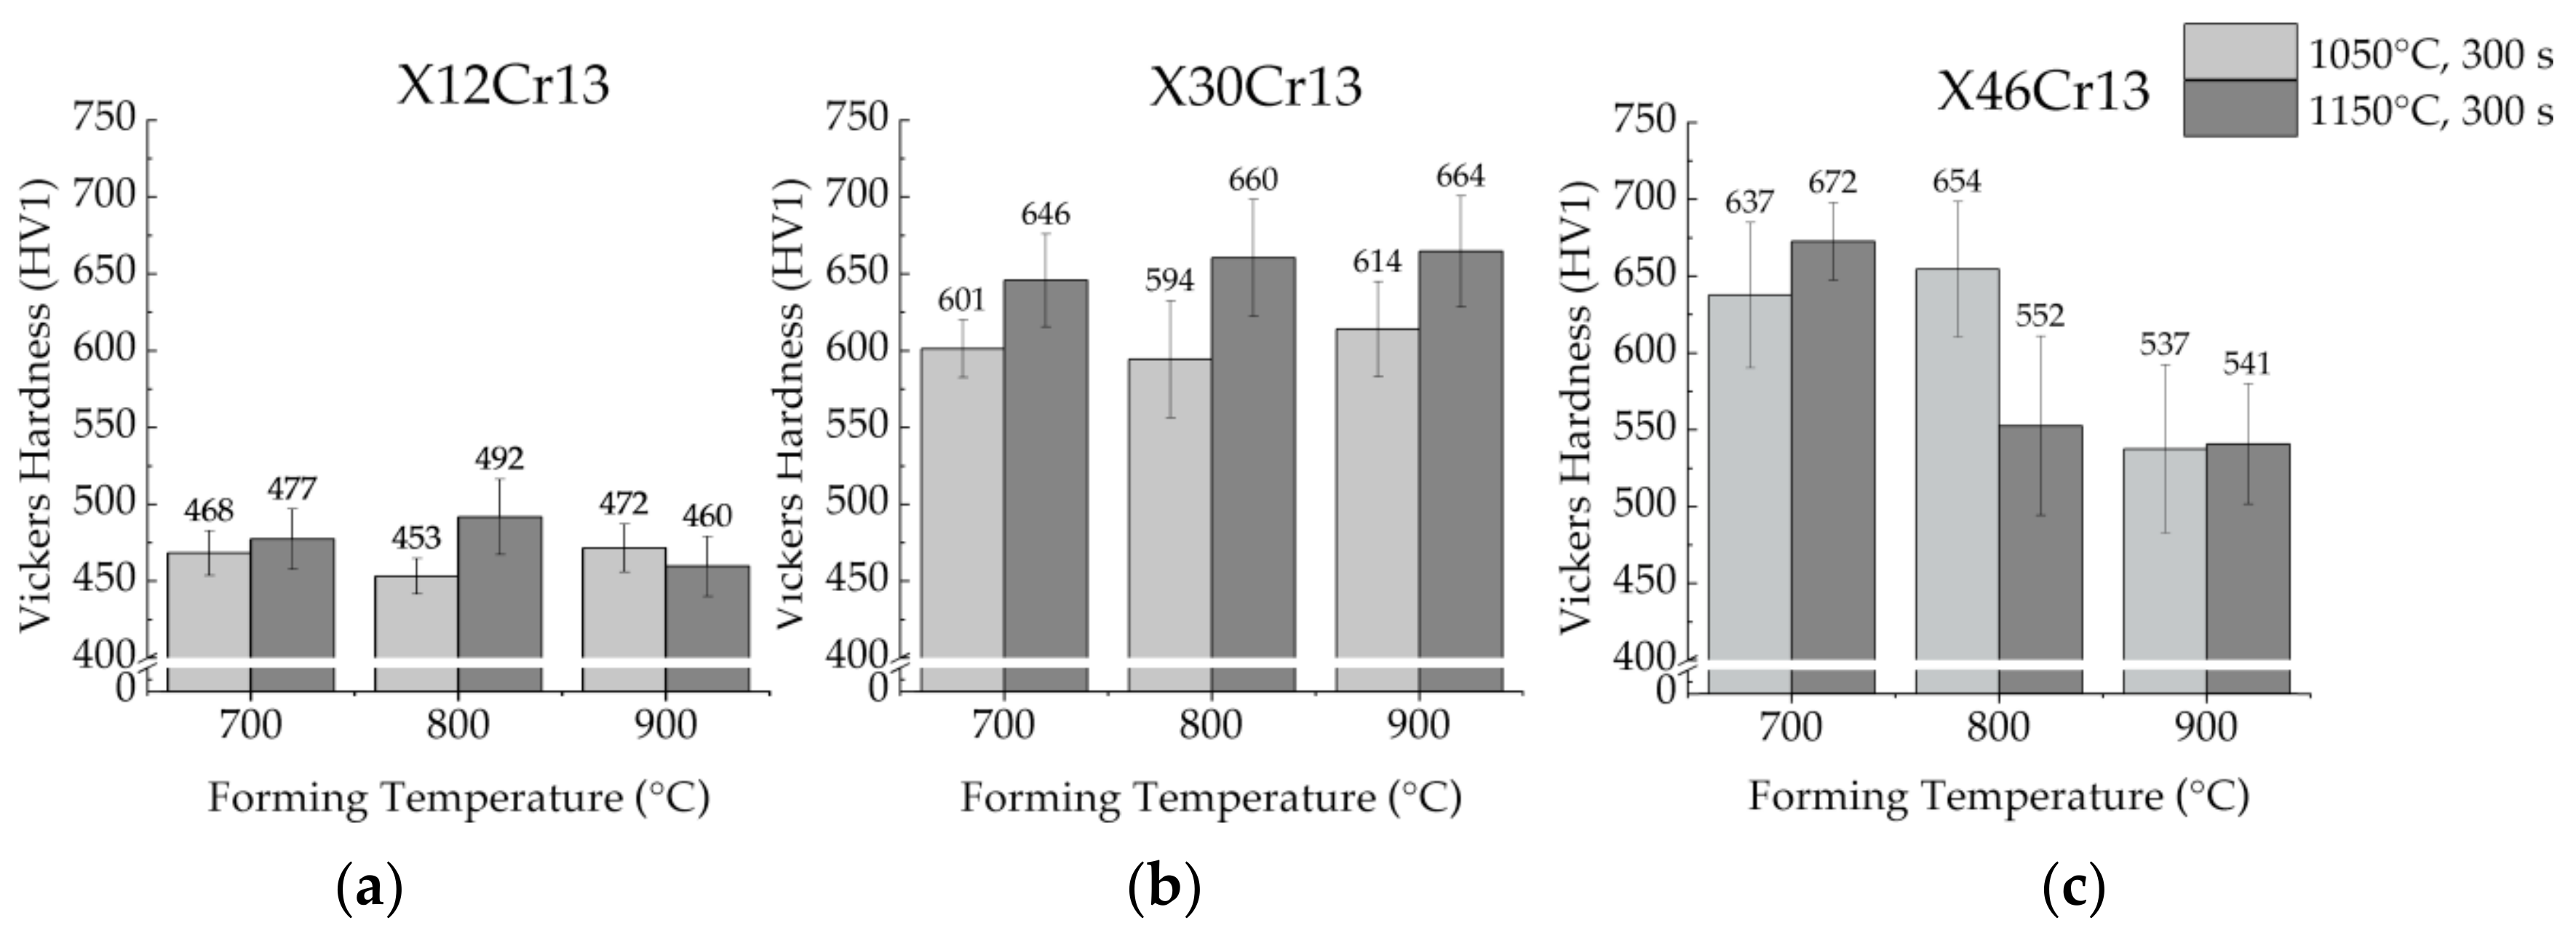
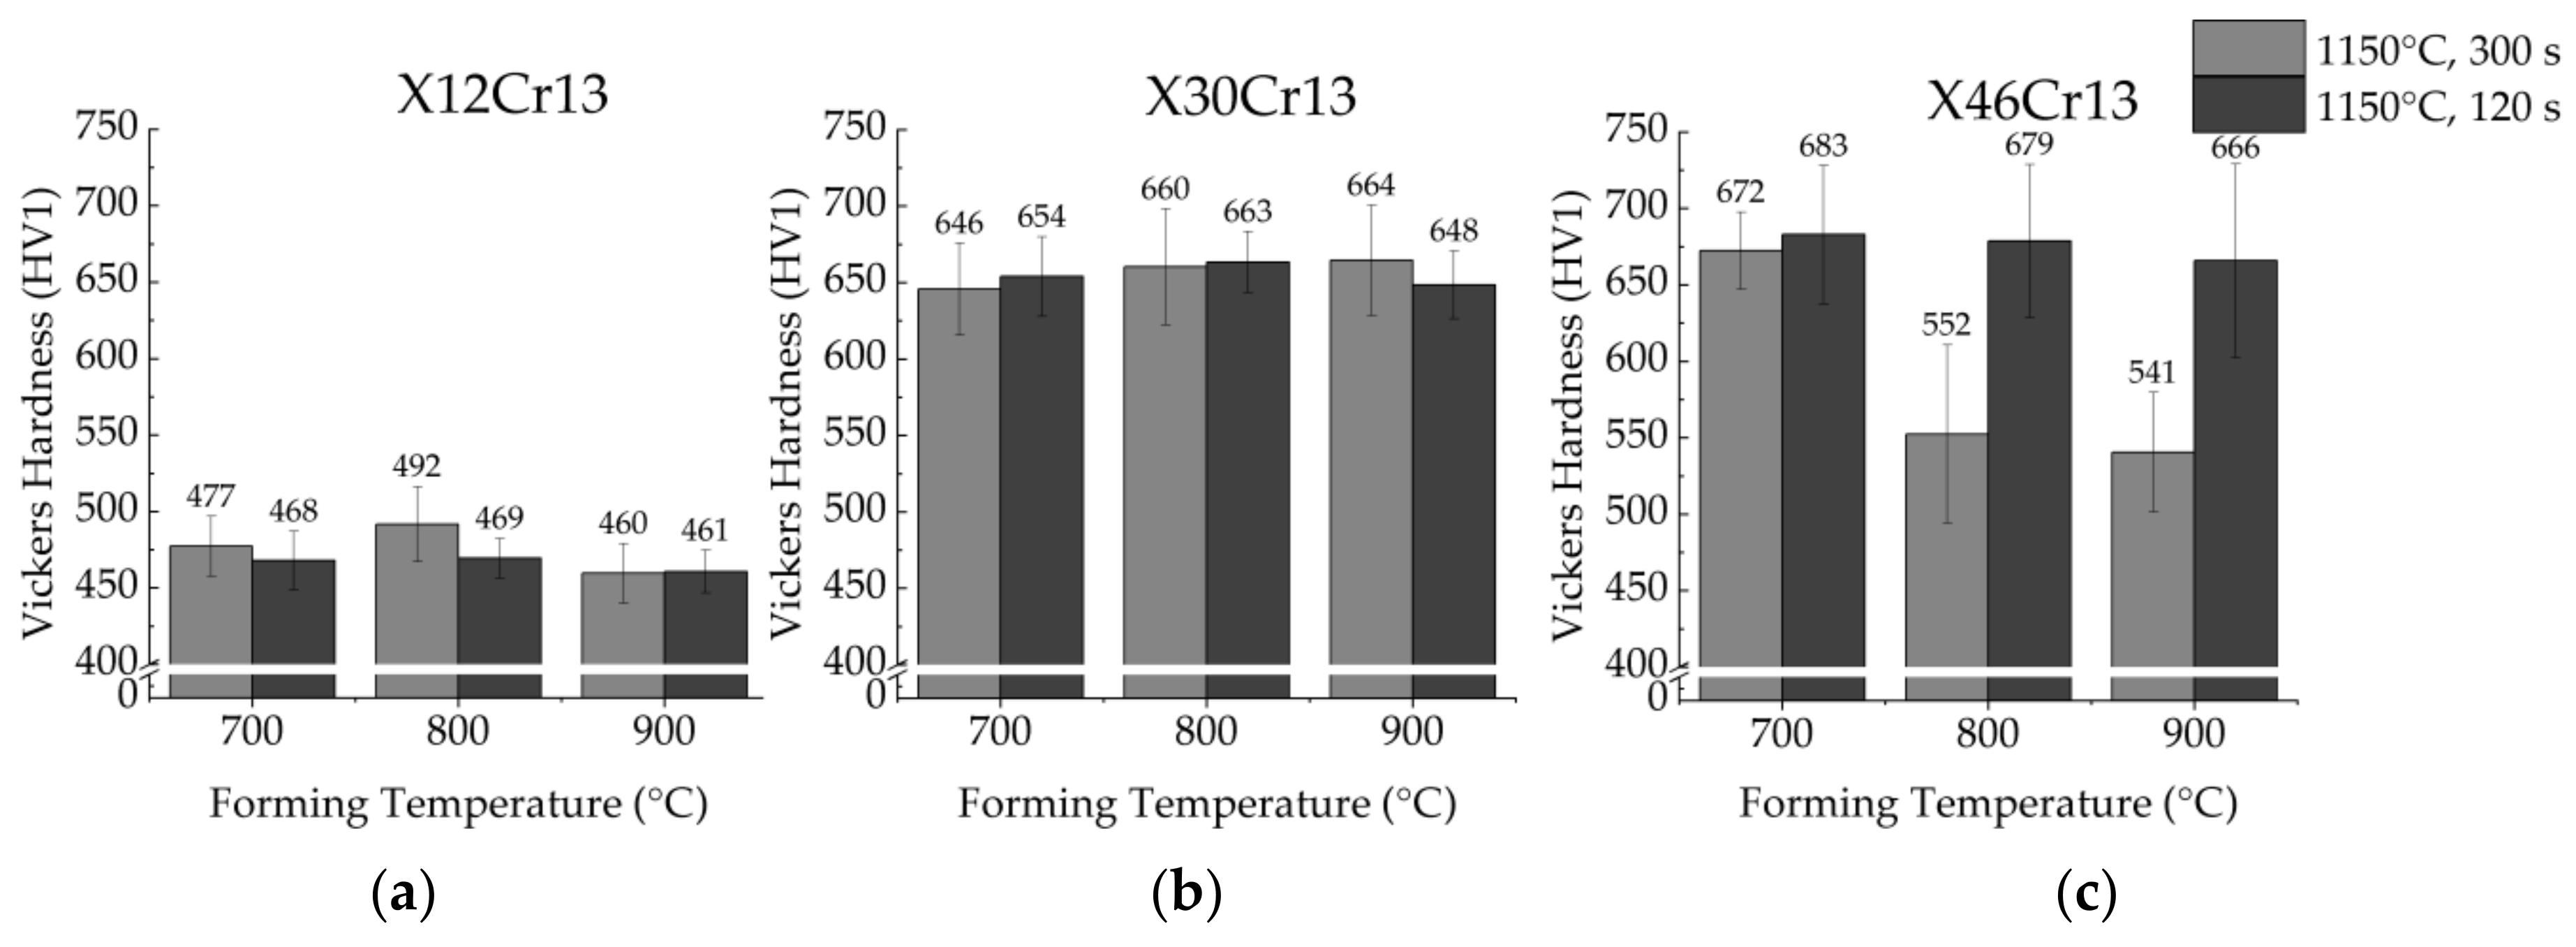
3.6. Influence of the Austenitzation Temperature and the Forming Temperature on the Hardness

The mean hardness value and standard deviation for each thermomechanical treatment are shown in Figure 10 (hardness evaluation according to Section 2.2.5). As illustrated, the hardness depends on the alloy composition, the austenitization temperature and the forming temperature. When comparing the hardness values of the MSS, it is obvious that the alloying elements have a high impact on them. With the exception of the hardness values for X46Cr13 after austenitization at 1150 °C for 300 s and forming at 800 °C and 900 °C as well as austenitization at 1050 °C for 300 s and forming at 900 °C, the hardness values for the three alloys exhibit a hardness increase with higher carbon, silicon and manganese content. In the considered process window, the highest achievable average hardness value for X46Cr13 is 672 HV1 and the highest for X12Cr13 is 492 HV1.
With regard to the influence of the forming temperature on the hardness, no consistent and uniform behavior can be detected for the three alloys. For X12Cr13, there is no clear tendency depending on the forming temperature, and the hardness values are quite similar. Also, for X30Cr13, there is no clear tendency for the influence of the forming temperature on the average hardness after austenitization at 1050 °C. After austenitization at 1150 °C, the average hardness of X30Cr13 increases with higher forming temperature, but only by 3 %. For X46Cr13, a more obvious tendency can be observed for austenitization at 1150 °C for 300 s, where the hardness decreases significantly with increasing forming temperature. After austenitizing at 1050 °C for 300 s, the hardness increases to a maximum at 800 °C, but drops as the forming temperature rises to 900 °C. If the forming temperature is changed from 700 °C to 900 °C, a decrease in hardness of 18% at 1050 °C and 24% at 1150 °C can be observed. The influence of the austenitization temperature shows a small increase for X12Cr13 due to the increase from 1050 °C to 1150 °C, whereas when forming at 900 °C, even a decrease in hardness can be observed. In contrast, X30Cr13 shows a clear increase in hardness between 7 and 11% when the austenitization temperature is increased. The influence of the austenitization temperature is much more differentiated for alloy X46Cr13. At the forming temperature 700 °C, a clear increase in hardness of 5% can be observed, whereas at 800 °C a clear decrease in hardness of 15% and at 900 °C no relevant change can be observed. The hardness seems to depend mainly on the chemical composition. A correlation between the hardness and the austenitizing temperature or the forming temperature therefore cannot be clearly determined.

3.7. Influence of the Austenitzation Time and the Forming Temperature on the Hardness

Figure 11 illustrates the influence of the forming temperature and the austenitization time at 1150 °C for all three alloys on the mean hardness value and the standard deviation (hardness evaluation according to Section 2.2.5). No significant influence of the austenitization time can be determined for the alloys X12Cr12 and X30Cr13. However, the hardness of alloy X46Cr13 at 800 °C and 900 °C forming temperature is strongly dependent on the austenitization time. While for an austenitization time of 120 s, the average hardness values at 700 °C are very similar to those of the austenitization time of 300 s; at 800 °C and 900 °C, an austenitization time of 300 s causes a significant decrease in hardness.
When comparing the dependence of the hardness on the forming temperature, it can be stated for the short heat treatment duration that no significant change of the average hardness can be observed. For each alloy, an approximately similar hardness value was measured at all three forming temperatures. The standard deviation for the alloy X46Cr13 is clearly higher than for the other two alloys. As already described in Section 3.5, the hardness is highly dependent on the chemical composition. Consequently, it can be assumed on the basis of the hardness value and its deviation that the phases that occur and the precipitation state after austenitization have a relevant influence (see Section 3.3).

4. FE-Simulation of the Thermomechanical Treatment for MSS

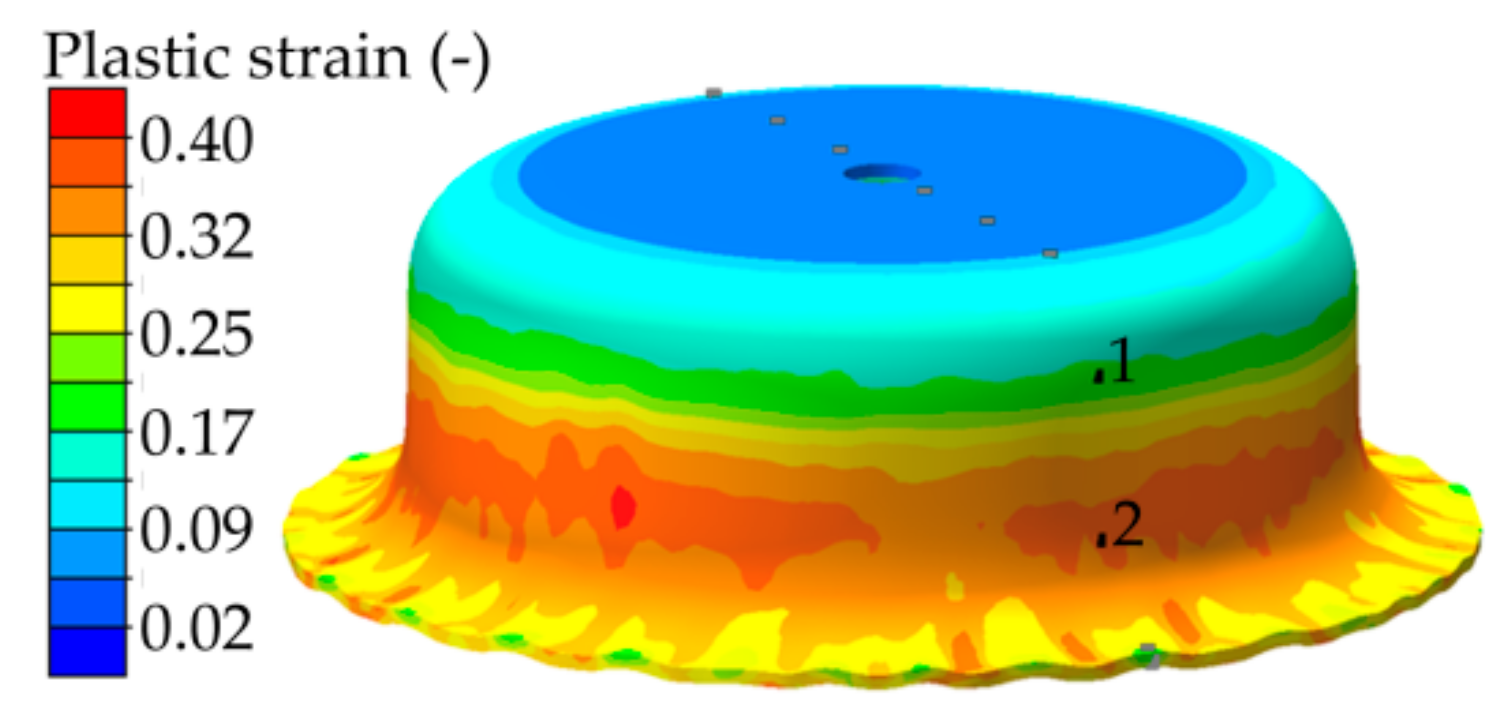
4.1. Distribution of the Plastic Strain in the Cup

With the help of FE simulation, the distribution of the plastic strain over the entire cup can be analyzed, as illustrated in Figure 12. It is obvious that the plastic strain is distributed concentrically in the cup. The bottom of the cup shows the smallest plastic strain below φ ≈ 0.1. In the radius from bottom to cup wall, the plastic strain increases to the maximum value of φ ≈ 0.4. From the cup wall to the neck with wrinkles, the plastic strain decreases again and is below φ < 0.3. For the closer examination of local areas, two nodes located near the surface at a distance of 15 mm from each other were selected. Position 1 (P1) is in the area of the radius between bottom and cup wall. Position 2 (P2) is in the middle height of the cup wall.

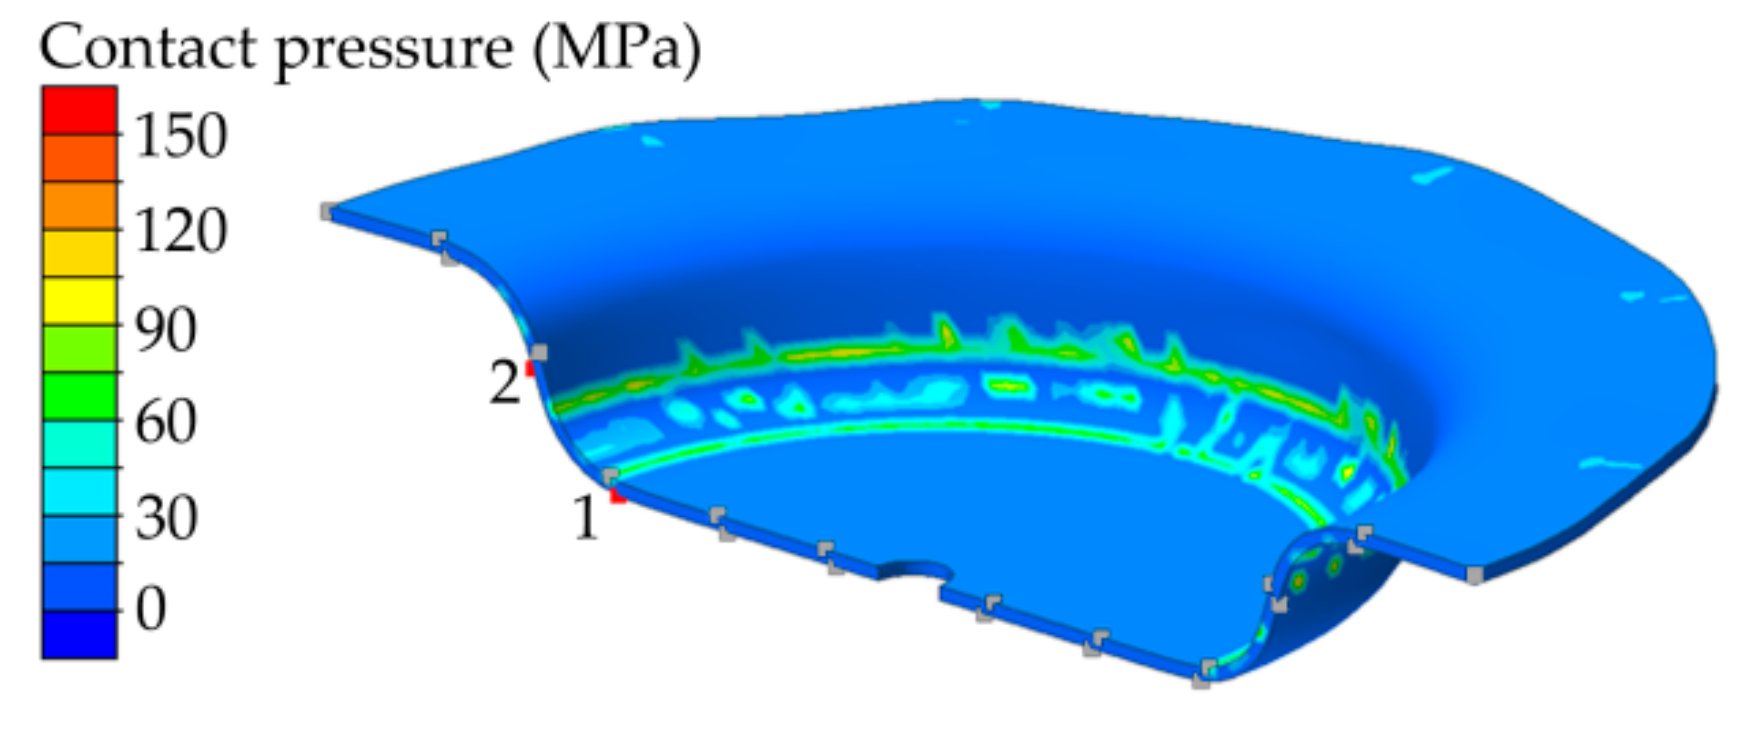
4.2. Distribution of the Contact Pressure between Workpiece and Tool during Forming

In order to evaluate the cooling rate during forming, the contact between the hot workpiece and the cold tool must be considered. It is well known that the HTC between workpiece and tool increases with increasing contact pressure, which means that the heat is transferred from the workpiece more quickly as the contact pressure increases. As shown in Figure 13 from the simulation results for the contact pressure occurring during forming, high-contact pressures are expected in the radii during deep drawing. In areas where the hot sheet and the punch get in contact with each other, as well as in the area where the hot sheet and the drawing die come together, high-contact pressures and cooling rates are expected. Figure 13 illustrates the local contact pressures that occur during the forming of X46Cr13 after austenitization at 1050 °C and subsequent forming at 900 °C. As can be seen, high pressure values occur near P1 at the sheet radius, where the punch is pressed against the workpiece. High cooling rates can be expected here. The rest of the sheet shows a homogeneous and, compared to sheet radius, low contact pressure, so that a particularly accelerated cooling cannot be assumed here. The cooling rate influences the predominant phases and precipitations in the material (as can be underlined by the TTT diagrams in Section 3.3) and consequently the mechanical properties after thermomechanical treatment. As an example, Figure 5b can be considered, where the highest hardness values correspond to the areas with the simulated highest contact pressure.

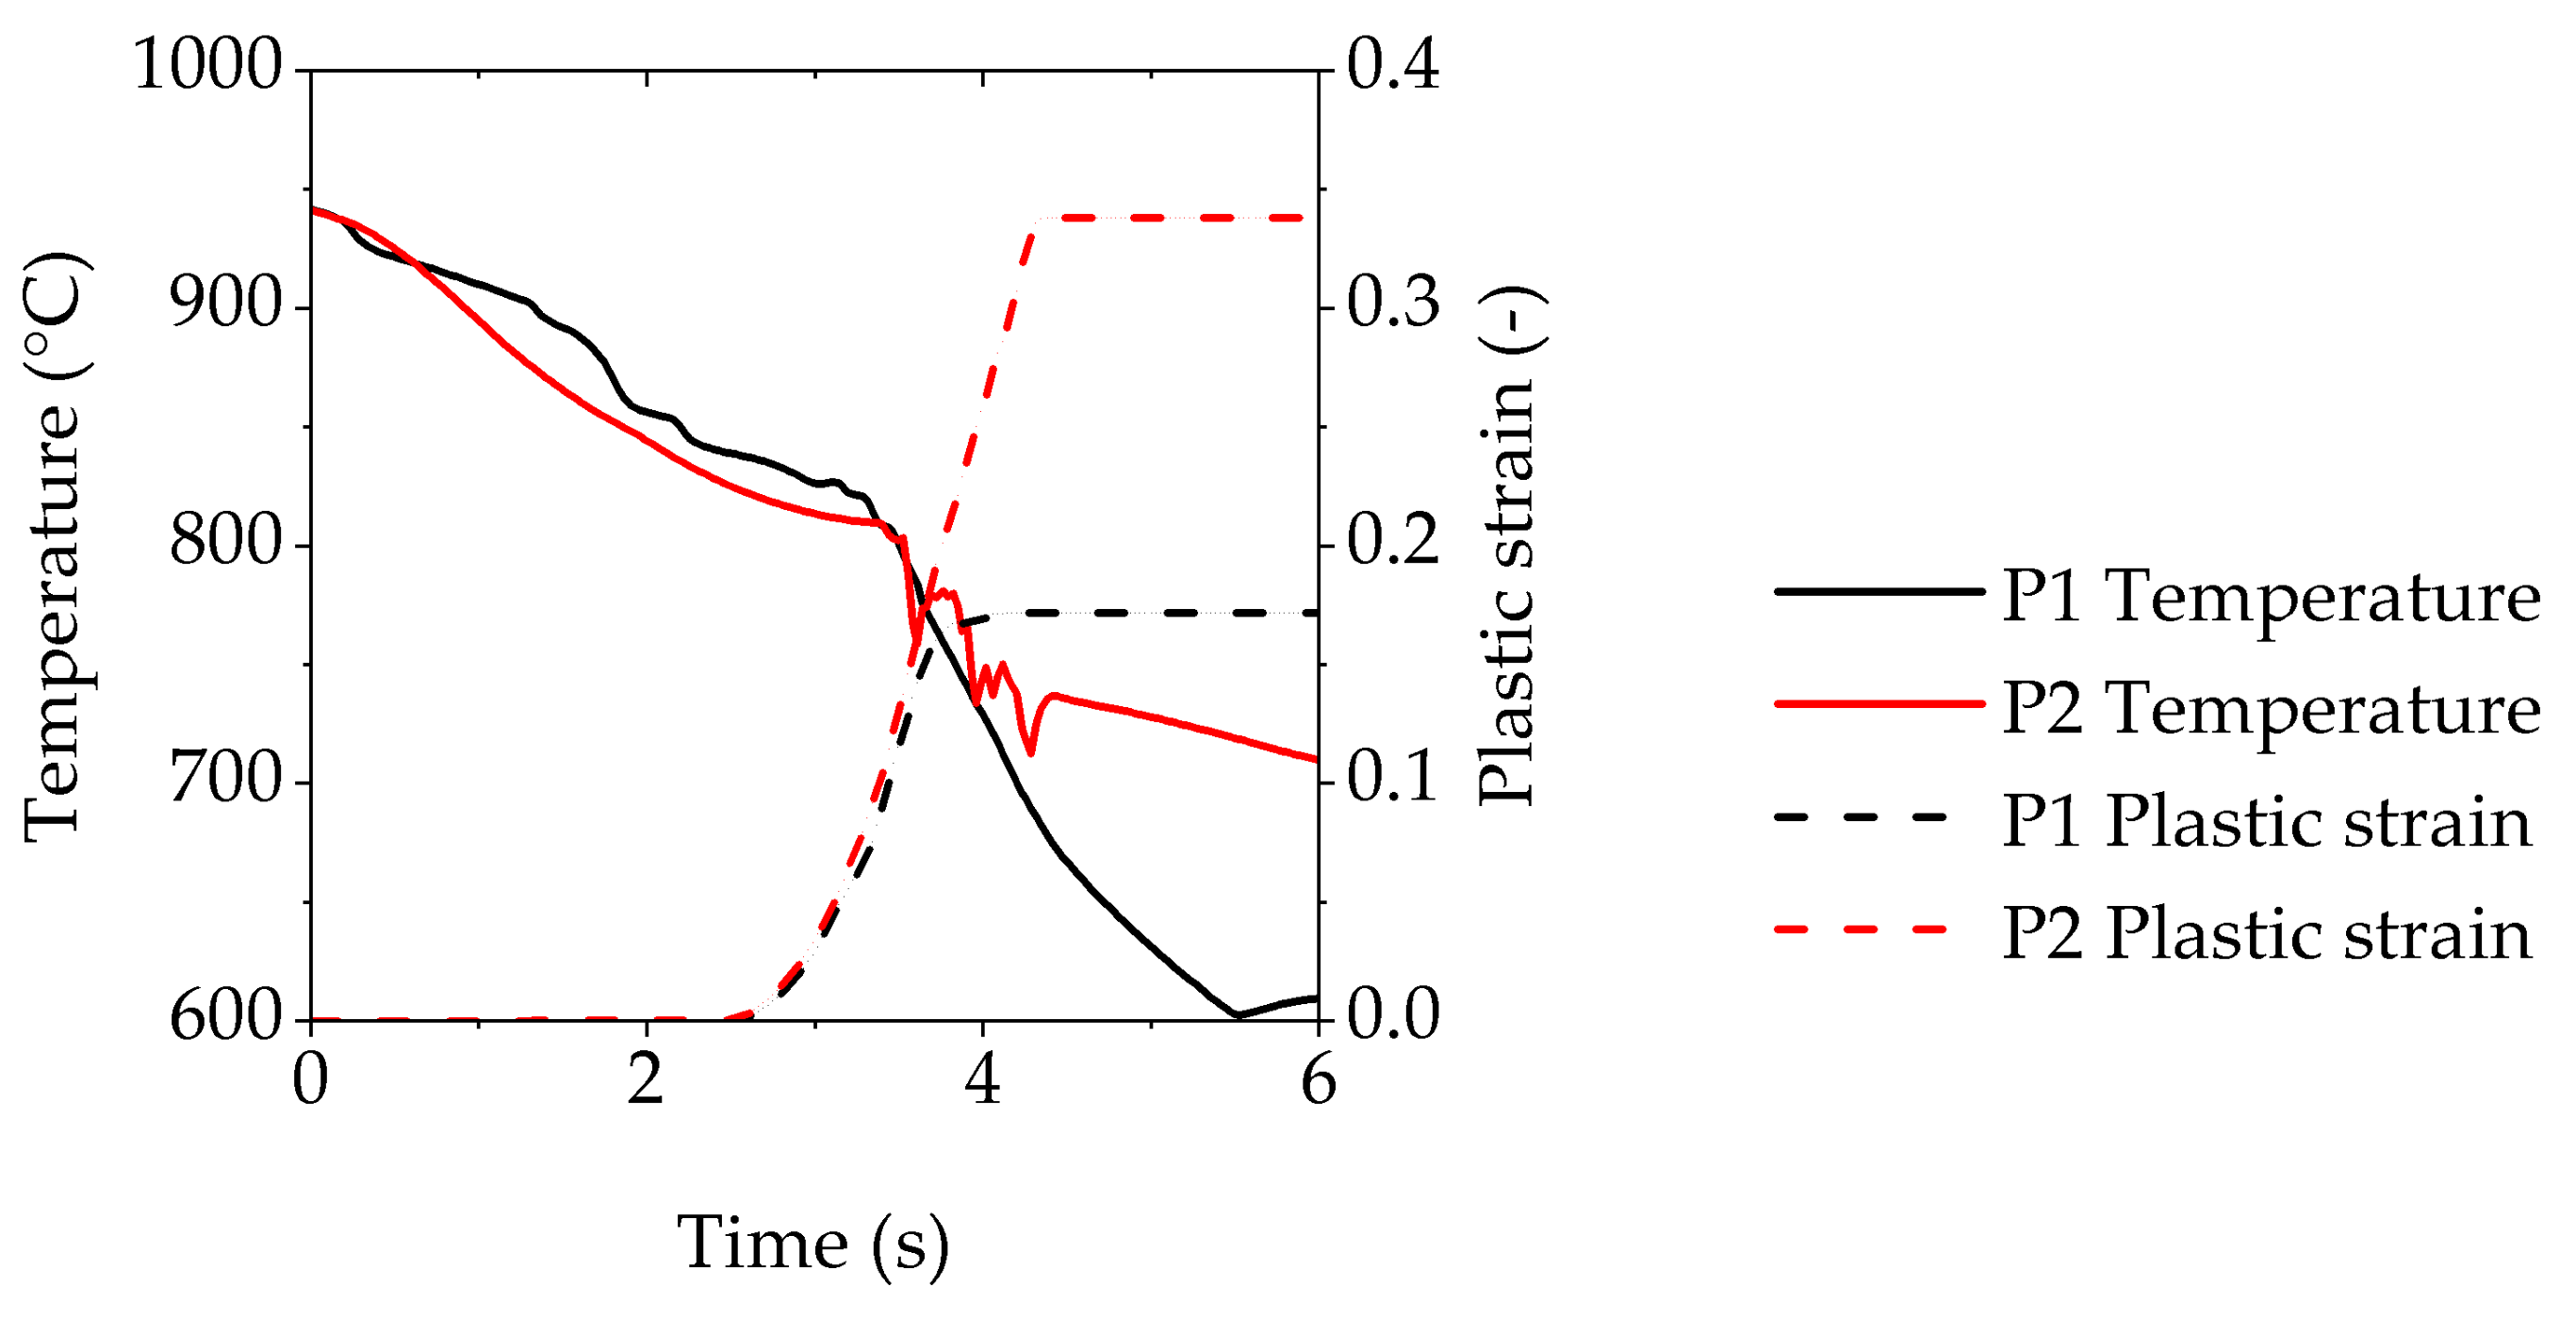
4.3. Simultaneous Cooling and Forming Behaviour during the Thermomechanical Treatment

During the thermomechanical treatment, different states of forming and temperature changes occur depending on the position in the sheet metal and on time. The previously introduced points P1 and P2, representing two specific areas with extreme contact conditions, can also be discussed here. P1 represents an area with medium degree of deformation but high contact pressures, and P2 stands for high degrees of deformation but medium contact pressures. During the forming process, both points undergo a different combination of forming and cooling. With the help of the simulation, it can be estimated which forming temperatures can be expected at this selected point of the workpiece (compare P1 and P2 in Figure 12). It is obvious that the forming temperature decreases during the 2 s of forming process due to contact of the heated sheet with the cold tool. The simulated temperatures can therefore only be used to estimate the real temperature window. The temperature gradient range for experiments carried out at an initial temperature of 700 °C varies in P1 and P2 between 750 °C and 660 °C. For experiments carried out at an initial forming temperature of 800 °C, this range varies in P1 and P2 between 780 °C and 680 °C. Finally, at an initial forming temperature of 900 °C, the forming temperature in the considered positions P1 and P2 is between 850 °C and 740 °C.
As shown in Figure 14, P1 and P2 show a similar cooling behavior with the beginning of the forming process by about 2.5 s. P1, however, cools down significantly faster, resulting from the local conditions in this area during the forming process. This is also the case after 4 s, when the forming process is completed and followed by the holding phase in the tool. One reason for the accelerated cooling is the high contact pressure between the workpiece and tool in the area of P1, which has already been discussed in Section 4.2. The temperature of P1 decreases to 600 °C after 5.5 s. P2 shows an accelerated cooling when the forming process starts, but after the end of the forming phase it cools down much more slowly in the holding phase than P1. The reason for this could be a reduced tool contact at the cup wall. It is obvious for P1 and P2 that the forming and cooling process in the tool is completed above 600 °C, which would be significantly above the Ms temperature (see Figure 7c). Consequently, the martensitic transformation occurs clearly after the forming process. The forming itself takes place in a material state of metastable and supercooled austenite.

5. Statistical Study—Analysis of Variance

The statistical analysis includes all measured hardness values and achieved maximum drawing depths as a function of all investigated input parameters, since not all correlations between input parameter and resulting hardness or drawing depth shall be shown individually. Reference is made to Table 1, where all influencing parameters and their tested values are shown. The ANOVA allows to determine the significant influencing parameters for Vickers hardness and maximum drawing depth and ensures the truth of the results.

5.1. Resulting Vickers Hardness

The results of the ANOVA analysis are shown in Table 5. The last column of the table shows the p-values of each factor on total variation, indicating the significance of the parameter. This p-value needs to be less than 0.05 to indicate significance. The second last column exhibits the F-value from the F-test. The higher the F-value (at least higher than 1), the more likely is the influence of this factor on the effect. In this case, the influence of the parameter “Alloy” on the resulting Vickers hardness can be called a “true” effect. As it can be seen in Table 5, the alloy grade that represents the chemical composition is the most significant factor inside the 95% confidence interval (α = 0.05 or p-value less than 0.05).
To ensure that the impact of the austenitization heat treatment is not underestimated, the austenitization temperature and dwell time were integrated in the analysis independently, instead of a combination in the input parameter “austenitization”. In this case, four inputs: alloy grades (3), austenitization temperature (2), austenitization time (2), and initial forming temperature (3), along with the interaction effects of alloy grade–austenitization temperature, alloy grade–dwell time, alloy grade–initial forming temperature, austenitization temperature–initial forming temperature, and dwell time–initial forming temperature, were considered. Thus, a new matrix with a total 3 × 2 × 2 × 3 = 36 different combinations of input conditions along with corresponding Vickers hardness as the process output were arranged. However, although this increases the number of values, there are nine empty spaces in the matrix, i.e., there are no experimental data available under some specific parameter combination. The influence of the missing measured values concerns only “Dwell Time”, so the results for this factor must be viewed critically. The results of the ANOVA analysis are shown in Table 6. As it can be seen, it has been reiterated that the alloy grade with a p-value less than 0.05 and a high F-value is the most significant factor affecting the resulting hardness. The combination of “alloy” and “dwell time” is almost in the range to be significant.

5.2. Resulting Maximum Drawing Depth

To perform this statistical analysis, experimental trials were selected where four parameters are kept constant. These are an austenitization temperature (Tγ) of 1050 °C, a dwell time (tdwell) of 300 s, a flange gap of 2.5 mm, and a blank diameter of 170 mm. In this case, three inputs: alloy grades (3), austenitization treatments (combined temperature and dwell time) (3), and initial forming temperatures (3), along with the interaction effects of alloy grade–austenitization treatment, alloy grade–initial forming temperature, and austenitization treatment–initial forming temperature, were evaluated. Thus, a total 3 × 3 × 3 = 27 different combinations of input conditions along with corresponding maximum drawing depth as the process output were available. For the matrix, there are no empty spaces, i.e., each of the values in the matrix is available. The results of the ANOVA analysis are summarized in Table 7. As it can be seen, under this configuration, the austenitization treatment with a p-value less than 0.05 was the most significant factor affecting the resulting maximum drawing depth (as highlighted in Table 7).

6. Discussion

6.1. Influence of the Alloy Composition and the Process Parameters on the Forming Forces

The forming forces show a strong dependence on the chemical composition. When considering the amount of alloying and by-elements in Table 3, it is obvious that especially the carbon, silicon and manganese contents change, which are therefore responsible for the different resulting forming forces. It is clear that the low carbon content of 0.11 wt.% for X12Cr13 shows a relevant difference in strength compared to 0.35 wt.% for X30Cr12 and 0.45 wt.% for X46Cr13, which are close to each other in the required forming forces. In the same way, the chromium content rises from 11.54 wt.% for X12Cr13 to 13.62 wt.% for X46Cr13. It is known that the dissolved atoms of the alloying and by-elements hinder the dislocation movement in the austenite. Consequently, an increased content has a rising effect on the yield strength and on the forming forces. From the JMatPro® calculations on phase transformation behavior, in this case the TTT diagrams in Figure 7, it can be concluded that at any time the forming takes place in the austenite. The influence of other phases on the forming forces can therefore be ignored. In addition to austenite, small amounts of carbides may be present depending on the alloy composition and the austenitizing temperature [15]. This would have to be proven by metallographic investigations and corresponding time-temperature precipitation diagrams (TTP). However, the number and size of the precipitations seem to have a relevant influence, since with higher carbon content no further significant increase in the forming forces from X30Cr13 to X46Cr13 occurs. It is therefore of interest how carbon is dissolved in the matrix. If the carbon is precipitated, the distribution and carbide size will have a relevant influence. Furthermore, the maximum forming forces decrease with increasing forming temperature. The correlation between forming temperature and maximum forming force is almost linear. This was expected, however, since the yield strength decreases with rising temperature [16].

6.2. Influence of the Process Parameters on the Maximum Drawing Depth

When cold-forming sheet metal blanks, it is possible to close blank holders and die tools to hold the blank and thus set a blank holder force. In this way, it is possible to determine the limits between wrinkling and cracking, i.e., the process window. It is not possible to use this method in hot sheet metal-forming processes, because a flange gap must always be set [3]. However, the relationship between drawing ratio and maximum drawing depth shown in Figure 9 makes it possible to outline a limit up to which the material can be plastically deformed without crack formation, at least under the specified parameter processes, which are kept constant. As expected, a smaller initial blank diameter results in a higher drawing depth. Consequently, for all alloys, the deep drawability decreases with increasing blank diameter. Again, the drawing depths are achieved for the alloy with the lowest carbon content X12Cr13, although the values for X30Cr13 and X46Cr13 are not significantly lower. At a drawing ratio of β = 2, the maximum drawing depths have approached about the same value. The dependence on the chemical composition seems to be reduced here. Consequently, the precipitation state does not seem to have a relevant influence on the deep drawing ability, as it has on the forming forces within the given parameter field (see Section 6.1). The statistical analysis made it possible to consider the relevance of many more influencing parameters than are shown in Figure 9. The results of the ANOVA indicate that the variation of the previous austenitization has a relevant influence on the maximum achievable drawing depth. The p-value is clearly within the confidence interval of 95%, and the F-value is also significantly higher than 1. Consequently, the influence of the parameter can be assumed to be significant.

6.3. Influence of the Process Parameters on the Mean Hardness

The hardness values show a significant dependence on the alloy composition. Similar to Figure 8 on forming forces, the achievable hardness for X12Cr13 is significantly lower than for X30Cr13 or X46Cr13. However, these two alloys show similar maximum achievable hardness values. As already described, the achievable hardness depends on the predominant alloying elements and therefore the occurring phases and precipitations. The carbon content has a strengthening effect with its increase due to the lattice distortion, and consequently, the hindering of the dislocation glide. Chromium, silicon and molybdenum reduce the critical cooling rate, which promotes martensitic transformation. Furthermore, depending on the prior austenitizing process and subsequent quenching, the amount of retained austenite that can be obtained due to the high alloying degree must also be taken into account. This would significantly reduce the hardness. Research on this effect is currently performed and not part of this publication. The austenitization time has only marginal influence on the X12Cr13 and X30Cr13 alloys. Even if the forming temperature is taken into account, no relevant influence of the austenitization time can be proven. The highest hardness of the high-alloyed steel X46Cr13 was achieved at Tγ = 1150 °C, but with a shorter tdwell = 120 s. Only for X46Cr13, the initial forming temperature has a significant influence on the hardness. If the initial forming temperature decreases, the hardenability of the steel also rises. The highest values are achieved at an initial forming temperature of 700 °C. An explanation for this must be given by metallographic investigations and TTP diagrams. The statistical analysis shows that only the chemical composition can be used as a significant factor to influence the hardness. This generally coincides with the experimental results.

7. Conclusions

In this work, the forming forces and hot deep drawing ability and the final hardness of the MSS alloys X12Cr13, X30Cr13 and X46Cr13 were investigated experimentally. Despite the extreme conditions of the drawing process, these alloys develop a remarkably hot drawability. Nevertheless, due to their chemical composition, hot drawability and the resulting hardness values are strongly dependent on technological parameters. The parameters considered for each of the investigated MSS alloys can be formulated as follows:
  • Deep drawability:
The deep drawing ability decreases with increasing alloying degree, especially carbon. Thus, the highest drawing depths could be determined for X12Cr13. The smaller the starting diameter, the higher is the expected drawing depth. Thus, the highest deep drawing ability was determined at the drawing ratio 1.7.
  • Forming forces:
The forming forces rise with increasing alloying degree. Thus, X12Cr13 shows by far the lowest forming forces. X30Cr13 and X46Cr13 behave similarly but show much higher forming forces than X12Cr13. Furthermore, the forming forces decrease linearly with increasing initial forming temperature. At 900 °C, the forces necessary to form X12Cr13 are 75% of those necessary for X46Cr13.
  • Hardenability:
The plastic strain and the occurring contact pressure were predicted by FE simulations. It was proven that the contact between the workpiece and the tool, as well as the resulting contact pressures have a significant influence on the cooling behavior and thus the resulting local hardness levels. Despite accelerated cooling, however, forming took place in supercooled austenite for each MSS alloy and at any time and place in the respective workpieces. The resulting hardness level, however, mainly depends on the chemical composition. In the case of the high-alloyed X46Cr13, the hardness is strongly influenced by the austenitizing time and the forming temperature.

Author Contributions

Conceptualization, P.B., P.L., T.G. and E.M.-G.; experimental trials, P.B. and E.M.-G.; JMatPro® Software calculations, P.L. and T.G.; formal analysis E.M.-G., P.B. and V.K.; resources, V.K. and T.L.; supervision, V.K., T.G. and T.L.; funding acquisition, E.M.-G., P.L., V.K., and T.L. All authors have read and agreed to the published version of the manuscript.

Funding

This work has been supported by the German Research Foundation (Deutsche Forschungsgemeinschaft–DFG) within the project “Thermomechanical Treatment of High-alloyed Martensitic Stainless Steels for Complex Parts” (Project number 334485458).

Acknowledgments

The authors gratefully acknowledge the support of the Deutsche Forschungsgemeinschaft (DFG) and Outokumpu for material supply.

Conflicts of Interest

The authors declare no conflict of interest.

References

  1. Gümpel, P. Rostfreie Stähle—Grundwissen, Konstruktion und Verarbeitungshinweise, Bd. 493; Expert Verlag: Renningen-Malmsheim, Germany, 1996. [Google Scholar]
  2. McGuire, M. Chapter 9 Martensitic stainless steels. In Stainless Steels for Design Engineers, 1st ed.; ASM International: Materials Park, OH, USA, 2008; pp. 133–135. [Google Scholar]
  3. Meza-García, E.; Rautenstrauch, A.; Kräusel, V.; Landgrebe, D. Tailoring of mechanical properties of a side sill part made of martensitic stainless steel by press hardening. In AIP Conference Proceedings, Proceedings of the 19th International ESAFORM Conference on Material Forming, Nantes, France, 27 April 2016; Chinesta, F., Cueto, E., Abisset-Chavanne, E., Eds.; AIP Publishing: Melville, NY, USA, 2016; Volume 1769, pp. 1300015-1–1300015-5. [Google Scholar]
  4. Meza-García, E.; Rautenstrauch, A.; Kräusel, V.; Landgrebe, D. Press hardening of a martensitic stainless steel sheet alloy for manufacturing a side sill demonstrator with tailored properties. In Proceedings of the 5th International Conference on Hot Sheet Metal Forming of High Performance Steel CHS2, Toronto, ON, Canada, 31 May–3 June 2015; Steinhoff, K., Oldenburg, M., Prakash, B., Eds.; Publisher: Verlag Wissenschaftliche Scripten, Auerbach, Germany, 2015; pp. 765–773. [Google Scholar]
  5. Karbasian, H.; Tekkaya, A.E. A review on hot stamping. J. Mater. Process. Technol. 2010, 210, 2103–2118. [Google Scholar] [CrossRef]
  6. Garcia, C.; Alvarez, L.F. Optimization of the properties obtained by quenching in martensitic stainless steels X30-40Cr13 and X40-60CrMoV14. J. Mater. Sci. 1993, 28, 1264–1268. [Google Scholar] [CrossRef]
  7. Alvarez, L.F.; Garcia, C.; Lopez, V. Continuous cooling transformation in martensitic stainless steel. ISIJ Int. 1994, 34, 516–521. [Google Scholar] [CrossRef]
  8. Saunders, N.; Guo, Z.; Li, X.; Miodownik, A.P.; Schillé, J.-P. Using JMatPro to model materials properties and behavior. JOM 2003, 55, 60–65. [Google Scholar] [CrossRef]
  9. Landgrebe, D.; Rautenstrauch, A.; Kunke, A.; Polster, S.; Kriechenbauer, S.; Mauermann, R. The effect of cushion-ram pulsation on hot stamping. AIP Conf. Proc. 2016, 1769, 070014. [Google Scholar] [CrossRef]
  10. Kusumi, K.; Nomura, N.; Yamamoto, S.; Nakata, M.; Abe, M.; Suehiro, M. Improvement of cylindrical deep drawability in hot stamping. Procedia Eng. 2014, 81, 1719–1724. [Google Scholar] [CrossRef] [Green Version]
  11. Kaufman, L.; Bernstein, H. Computer Calculation of Phase Diagrams with Special Reference to Refractory Metals; Academic Press Inc.: Cambridge, MA, USA, 1970; Volume 4, p. 344. [Google Scholar]
  12. Saunders, N.; Miodownik, A.P. CALPHAD (Calculation of Phase Diagrams): A Comprehensive Guide; Pergamon Materials Series; Elsevier: London, UK, 1998; Volume 1, p. 478. [Google Scholar]
  13. Diekmann, U. Calculation of steel data using JMatPro. In Proceedings of the 2nd International Conference on Recent Trends in Structural Materials (COMAT 2012), Plzeň, Czech Republic, 21–22 November 2012; Dzugan, J., Ed.; Thomas Reuters Database: Toronto, ON, Canada, 2012. [Google Scholar]
  14. Guo, Z.; Saunders, N.; Miodownik, P.; Schillé, J.P. Modelling phase transformations and material properties critical to the prediction of distortion during the heat treatment of steels. Int. J. Microstruct. Mater. Prop. 2009, 4, 187–195. [Google Scholar] [CrossRef]
  15. Meza-García, E.; Birnbaum, P.; Landgraf, P.; Grund, T.; Lampke, T.; Kräusel, V. Thermomechanical Treatment of Martensitic Stainless Steels Sheets and Its Effects on Their Deep Drawability and Resulting Hardness in Press Hardening. Metals 2020, 10, 1536. [Google Scholar] [CrossRef]
  16. Spittel, M.; Spittel, M. Steel symbol/number: Datasheet X12Cr13/1.4006;X46Cr13/1.4034. In Landolt-Börnstein—Group VIII Advanced Materials and Technologies; Warlimont, H., Ed.; Springer: Berlin/Heidelberg, Germany; New York, NY, USA, 2009; Volume 2C1. [Google Scholar]
Figure 1. Temperature-time curve of thermomechanical treatment for X12Cr13, X30Cr13 and X46Cr13.
Jmmp 04 00122 g001
Figure 2. Deep drawing tool mounted in press (a) and CAD design of the deep drawing tool (b).
Jmmp 04 00122 g002
Figure 3. Displacement by time and force by time during an exemplary deep drawing experimental trial.
Jmmp 04 00122 g003
Figure 4. Detail of the force drop indicating the exact position where the depth position of the punch is located. The point of intersection indicates the maximum drawing depth.
Jmmp 04 00122 g004
Figure 5. (a) Exemplary illustration of the area for hardness measurement on a cut cup, (b) Hardness curve HV1 of X46Cr13 after austenitization at 1150 °C for 120 s and subsequent forming at 900 °C.
Jmmp 04 00122 g005
Figure 6. Exemplary cooling behavior of X12Cr13 and X46Cr13 after austenitizing at 1050 °C for 300 s and subsequent cooling in still air.
Jmmp 04 00122 g006
Figure 7. Thermophysically calculated isothermal phase transformation diagrams (TTT) and M23C6 precipitations of the materials (a) X12Cr13, (b) X30Cr13 and (c) X46Cr13 after austenitization at 1050 °C and ASTM grain size = 9 using JMatPro®.
Jmmp 04 00122 g007
Figure 8. Maximum drawing force during forming of cups made of the alloy X12Cr13, X30Cr13, and X46Cr13 at initial forming temperatures of 700 °C, 800 °C and 900 °C; blank diameter 170 mm; drawing depth 40 mm; drawing speed 20 mm/s; and an initial austenitization at 1050 °C for 300 s.
Jmmp 04 00122 g008
Figure 9. Maximum achievable drawing depth for different drawing ratios after austenitization at 1050 °C for 300 and subsequent forming begin at 900 °C with a constant flange gap of 2.5 mm for the X12Cr13 (a), X30Cr13 (b) and X46Cr13 (c) alloys.
Jmmp 04 00122 g009
Figure 10. Mean hardness HV1 and standard deviation of the cup cross section for thermomechanical treatment after initial austenitization at 1050 °C/300 s or 1150 °C/300 s and forming at 700 °C, 800 °C and 900 °C for the X12Cr13 (a), X30Cr13 (b) and X46Cr13 (c) alloys.
Jmmp 04 00122 g010
Figure 11. Mean hardness HV1 and standard deviation of the cup cross section for thermomechanical treatment after initial austenitization at 1150 °C for 120 s or 300 s and forming at 700 °C, 800 °C and 900 °C for the X12Cr13 (a), X30Cr13 (b) and X46Cr13 (c) alloys.
Jmmp 04 00122 g011
Figure 12. FE-simulation for the distribution of the plastic strain in a thermomechanically treated cup of X46Cr13 after austenitization at 1050 °C for 300 s and subsequent start of forming at 900 °C.
Jmmp 04 00122 g012
Figure 13. FE-simulated distribution of the contact pressure between tool and workpiece during forming of the cup of X46Cr13 after austenitization at 1050 °C for 300 s and subsequent start of forming at 900 °C.
Jmmp 04 00122 g013
Figure 14. Temperature–plastic strain vs. Time diagram for X46Cr13 alloy after initial austenitization at 1050 °C and immediate transfer in the tool in P1 and P2 according to Figure 12 and Figure 13.
Jmmp 04 00122 g014
Table 1. Summarization of the thermomechanical process parameters used for the deep drawing tests of X12Cr13, X30Cr13 and X46Cr13.
Austenitization Temperature Tγ (°C)Austenitization Time
tdwell (s)
Initial Forming Temperature (°C)Blank Diameter (mm)Flange Gap (mm)Ram Speed (mm/s)
1050, 1150120, 300700, 800, 900170, 180,
190, 200
2.520
Table 2. Summarization of the thermomechanical process parameters used for the FE simulation of X12Cr13, X30Cr13 and X46Cr13.
Austenitization Temperature (Tγ) (°C)Austenitization Time
(tdwell) (s)
Initial Forming Temperature (°C)Blank Diameter (mm)Flange Gap (mm)Ram Speed (mm/s)
1050300700, 800, 900170 2.520
Table 3. Chemical composition of the investigated MSS alloys (wt.%, balance Fe) by optical emission spectrometer Bruker Tasman Q4.
AlloyCCrSiMoMnPSNiCu
X12Cr130.1111.540.500.060.380.021<0.0010.330.18
X30Cr130.3613.470.470.940.420.0210.0020.380.06
X46Cr130.4813.620.470.020.630.026<0.0010.170.23
Table 4. Mechanical properties of the investigated alloys in the initial state at room temperature by tensile test with universal testing machine H&P Inspekt 150.
AlloyConditionYield Strength (MPa)Ultimate Tensile Strength (MPa)Fracture Elongation A50mm (%)
X12Cr13Supply condition518 ± 19651 ± 1917 ± 0.1
X30Cr13Supply condition361 ± 6611 ± 526 ± 0.2
X46Cr13Supply condition371 ± 3633 ± 326 ± 0.1
Table 5. ANOVA results for the resulting Vickers hardness.
Input ParameterDegree of FreedomSum of SquaresMean SquareF-Valuep-Value
Alloy2159,651.0279,825.5178.745.46 × 10−6
Austenitization27344.173672.083.620.08
Forming temperature23406.551703.281.680.25
Alloy-Austenitization410,915.192728.802.690.11
Alloy-Forming temperature47230.371807.591.780.22
Austenitization-Forming temperature41323.33330.830.330.85
Error88110.441013.80
Total26197,981.07
Table 6. ANOVA results for the resulting Vickers hardness under consideration of the dwell time.
Input ParameterDegree of FreedomSum of SquaresMean SquareF-Valuep-Value
Alloy2159,651.0279,825.5178.745.46 × 10−6
Austenitization14485.714485.714.420.07
Dwell time12858.462858.462.820.13
Forming temp.23406.551703.281.680.25
Alloy-Austenitization22191.471095.731.080.38
Alloy-Dwell time28723.724361.864.300.05
Alloy-Forming temperature47230.371807.591.780.22
Austenitization-Forming temperature2227.48113.740.110.89
Dwell time-Forming temp.21095.85547.920.540.60
Error88110.441013.80
Total26197,981.07
Table 7. ANOVA results for the resulting maximum drawing depth without the input parameter flange gap.
Input ParameterDegree of FreedomSum of SquaresMean SquareF-Valuep-Value
Alloy217.368.680.780.49
Austenitization2147.4873.746.590.02
Forming temperature283.5241.763.730.07
Alloy-Austenitization427.396.850.610.67
Alloy-Forming temperature489.8622.462.010.19
Austenitization-Forming temperature469.9017.471.560.27
Error889.5411.19
Total26525.05
Publisher’s Note: MDPI stays neutral with regard to jurisdictional claims in published maps and institutional affiliations.

