1. Introduction
Glass materials have been widely used in our daily life due to their superior properties, but machining these materials has always been a challenge due to their hard and brittle nature. There are various machining techniques such as turning, milling, drilling, grinding, and laser machining. However, it is very difficult to study the complex process of crack initiation and propagation through experimental observation and theoretical analysis. In order to understand the dynamics of random crack initiation and propagation in the glass cutting process, discrete element method is adopted to model and simulate the cutting process [
1].
The discrete element method (DEM) is a numerical technique which models solid structures as bonded particles. These particles can deform and displace from one another and interact through contacts or interfaces between them. Unlike the finite element method (FEM), the discrete element method has the advantage of modeling brittle fracture. It can describe nonlinear behavior of brittle materials and handle the complex particle contact physical process with coupled shear and bulk deformation effects. Since the DEM was first introduced by Cundall [
2], it has been widely applied in various areas such as simulating crushable soil [
3], granular flow [
4], and even behavior of the earthquakes [
5]. In recent years, the DEM also has been used in simulating the cutting process of various materials such as rock, ceramics, and carbon fiber reinforced polymer [
6,
7,
8].
Nowadays, hybrid machining has become more and more popular compared to traditional machining methods. It combines different machining actions on the material that need to be removed and makes use of the combined advantages to avoid or reduce some adverse effects [
9]. For example, vibration-assisted machining combines machining with small-amplitude tool vibrations. During this process, the cutting tool loses contact with the chips on a specified amplitude, resulting in decreased machining forces and improved tool life and surface finish [
10]. Chemical-assisted micromachining combines micromachining and chemical reaction of the workpiece. For silicon, the bonding forces between Si particles on the surfaces can be weakened by the hydrofluoric acid. A low concentration of hydrofluoric acid added to the abrasive slurry in ultrasonic machining can increase the material removal rate and surface quality [
11]. Laser-induced crack-assisted machining combines laser micromachining and traditional orthogonal cutting. Before orthogonal cutting is carried out, the workpiece is treated by a femtosecond laser to induce seed cracks on the workpiece. This process is able to reduce cutting force, subsurface damage, and tool wear [
12]. Due to the hard and brittle nature, it is very difficult to study the complex process of crack initiation and propagation through experimental observations and theoretical analysis. It also brings big challenges to researchers when developing new machining processes. Therefore, the DEM simulation is used in this study to help us understand the dynamics of random crack initiation and propagation during the cutting process.
In this paper, the discrete element method is used to simulate the orthogonal cutting of soda-lime glass with different seed cracks. The purpose is to predict the effects of different seed cracks on the cutting process. The first step is to create a synthetic material that behaves like soda-lime glass. Then, the macro-properties are calibrated by adjusting the micro-parameters of the DEM model to match the mechanical properties of the real soda-lime glass. Orthogonal cutting experiments are conducted in order to validate the cutting forces, subsurface cracks, and chips. Finally, the cutting simulations with four different types of seed cracks are conducted in order to optimize the cutting force, random cracks, and surface roughness. Through this study, the effects of different types of seed cracks during the orthogonal cutting is predicted.
2. Model Creation and Validation
Particle flow code in two dimensions (PFC2D), a program based on DEM, is used to model soda-lime glass and random distributions of circular particles are adopted to achieve an isotropic material. The particle contact behaviors of the model are expressed by flat-joint bonds, which is detailed in the authors’ previous work [
1]. The interactions and movements of the circular particles can be simulated by PFC2D. It allows finite displacement and rotations of discrete bodies, including complete detachment, and recognizes new contacts automatically as the calculation progresses.
2.1. Creation of the Specimen of Bonded Particles
In order to create the specimen that behaves like the real material, the same procedure as introduced in the authors’ previous work follows [
1].
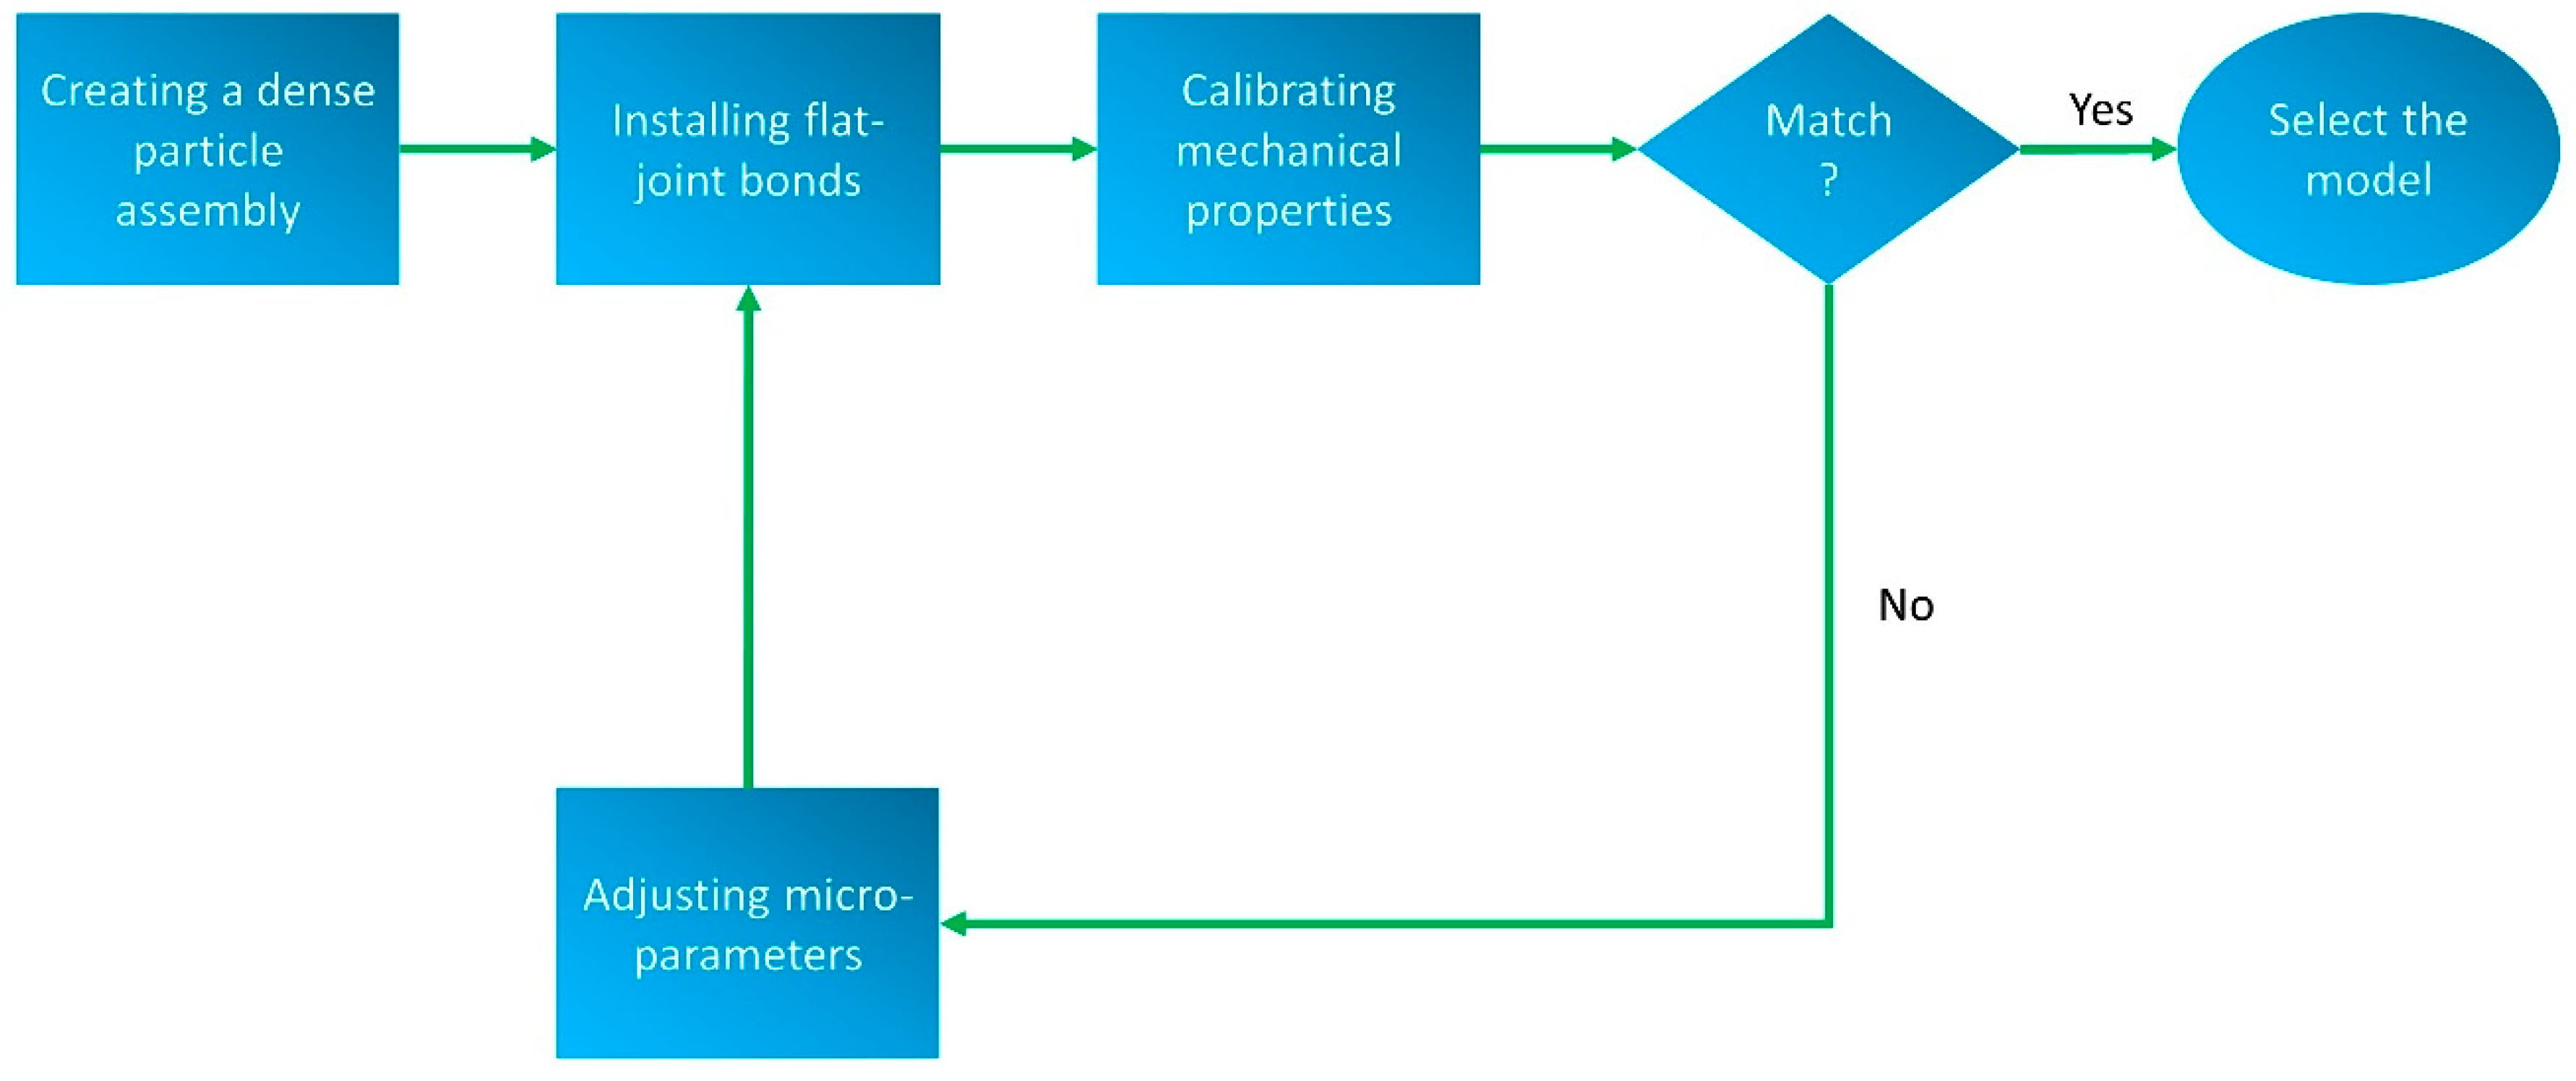
Figure 1 shows the flow chart which indicates how this procedure works.
The first step is to create a dense particle assembly. In this step, macro-parameters including the specimen density, sample dimensions, and particle radii are defined. Then, the particles are bonded based on the flat-joint contact model. The micro-parameters are defined in this step which contain the particle contact stiffness, particle stiffness ratio, particle friction coefficient, particle damping coefficient, bond shear strength, bond normal strength, and friction angle. The macro-parameters and micro-parameters used in this study are shown in
Table 1. The third step is to match the mechanical properties of the specimen. Uniaxial tensile and compressive tests are simulated; four mechanical properties are matched in this step which contains elastic modulus, tensile strength, compressive strength, and poisson’s ratio. More details of the simulation procedure are provided elsewhere [
1]. Through a series of adjustments, the DEM model is calibrated to match the soda-lime glass properties as listed in
Table 2.
2.2. Model Validation
After the material model is calibrated, orthogonal cutting of the same synthetic material is simulated.
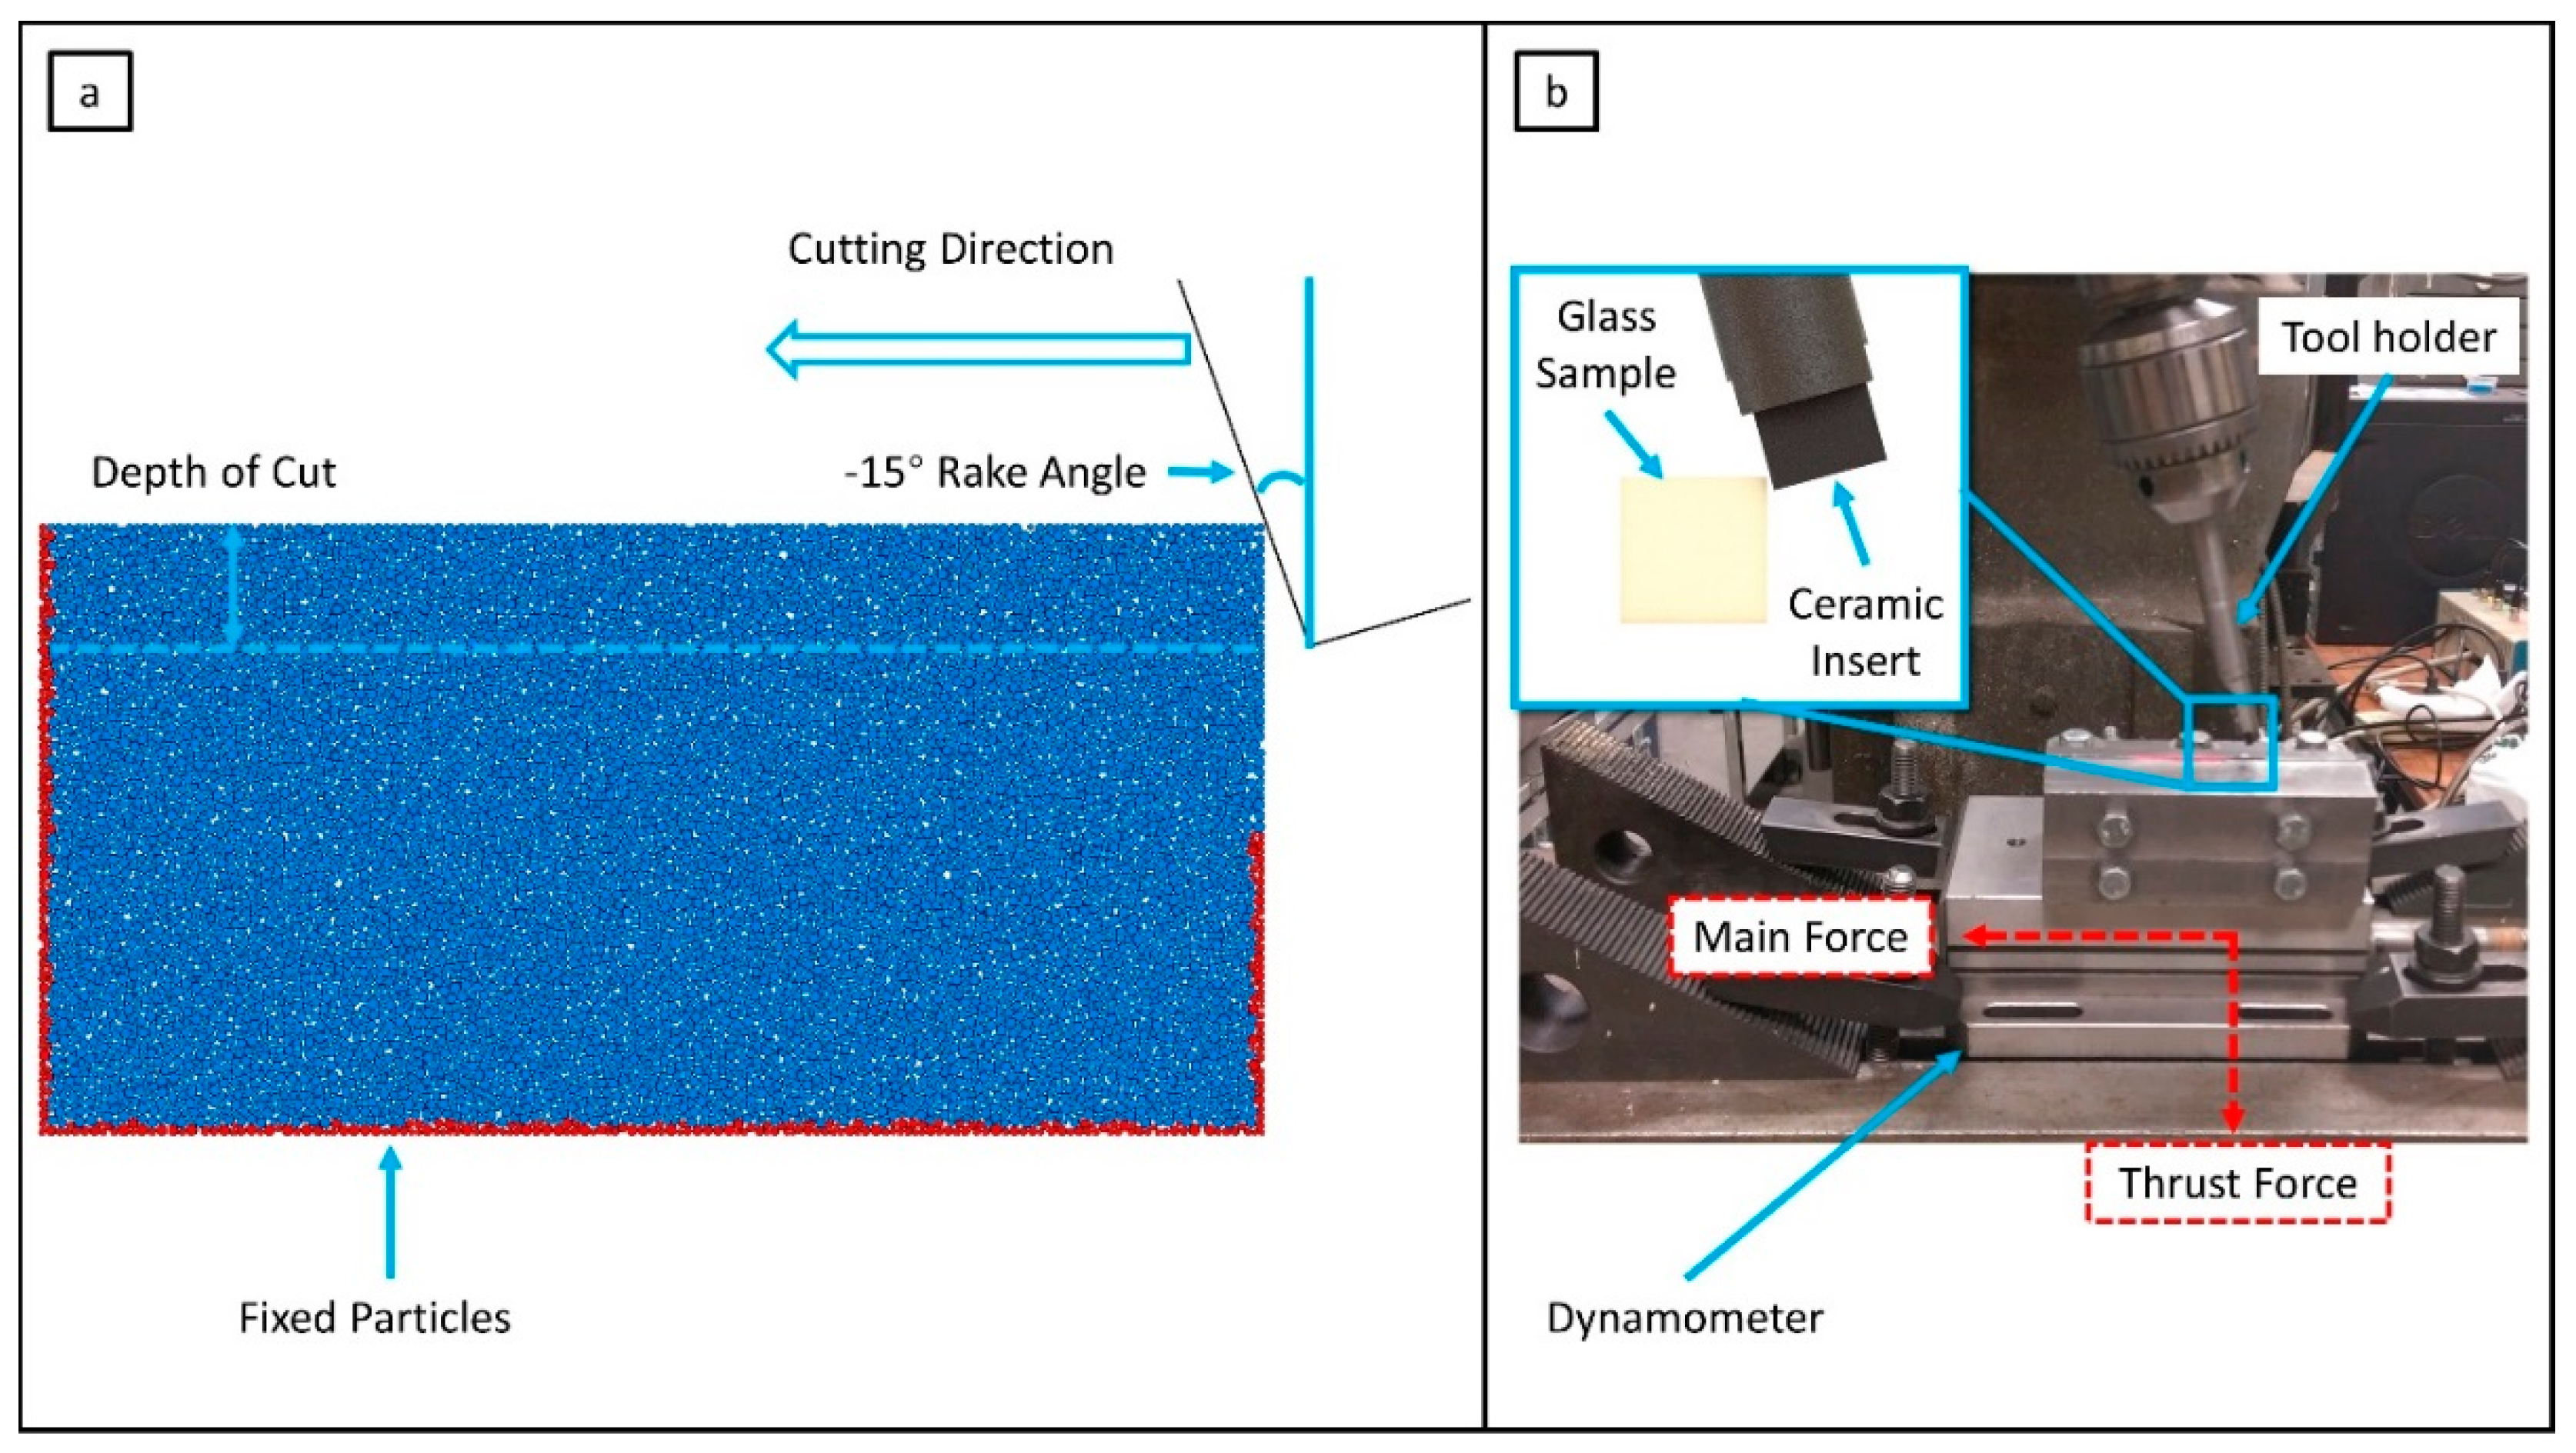
Figure 2a shows the model geometry and boundary conditions. The workpiece is 2 mm in length and 1 mm in height, which contains a total of 9885 particles. The particles marked as red are fixed to simulate the boundary conditions. The cutting tool is modeled as a rigid body which has a rake angle of −15° and clearance angle of 15°. The depth of cut is 0.1 mm and the cutting speed is 4 mm/s.
The orthogonal machining experimental setup is constructed in order to validate the simulation model. As shown in
Figure 2b, a vertical Bridgeport milling machine with a cutting tool fixed on the locked vertical spindle column is used to cut the sample. The soda-lime glass sample is fixed on the horizontal carriage which is mounted on the Kistler three-component dynamometer (Kistler Instrument Corp, Novi, MI, USA). A Kistler dual-mode charge amplifier amplifies the cutting force signals, which are measured by the dynamometer with the sampling rate of 200 Hz. LabView (National Instrument, Austin, TX, USA) is used to control the computer data acquisition system. The workpiece, fixture, and dynamometer are clamped on the movable carriage of the milling machine, and the carriage feeds the workpiece to the cutting tool. The cutting tool is a 16 × 16 × 6 mm
3 square ceramic insert made of alumina and is mounted on the tool holder tilted to attain a negative 15° rake angle. The cutting conditions for both the simulation and experiments are given in
Table 3.
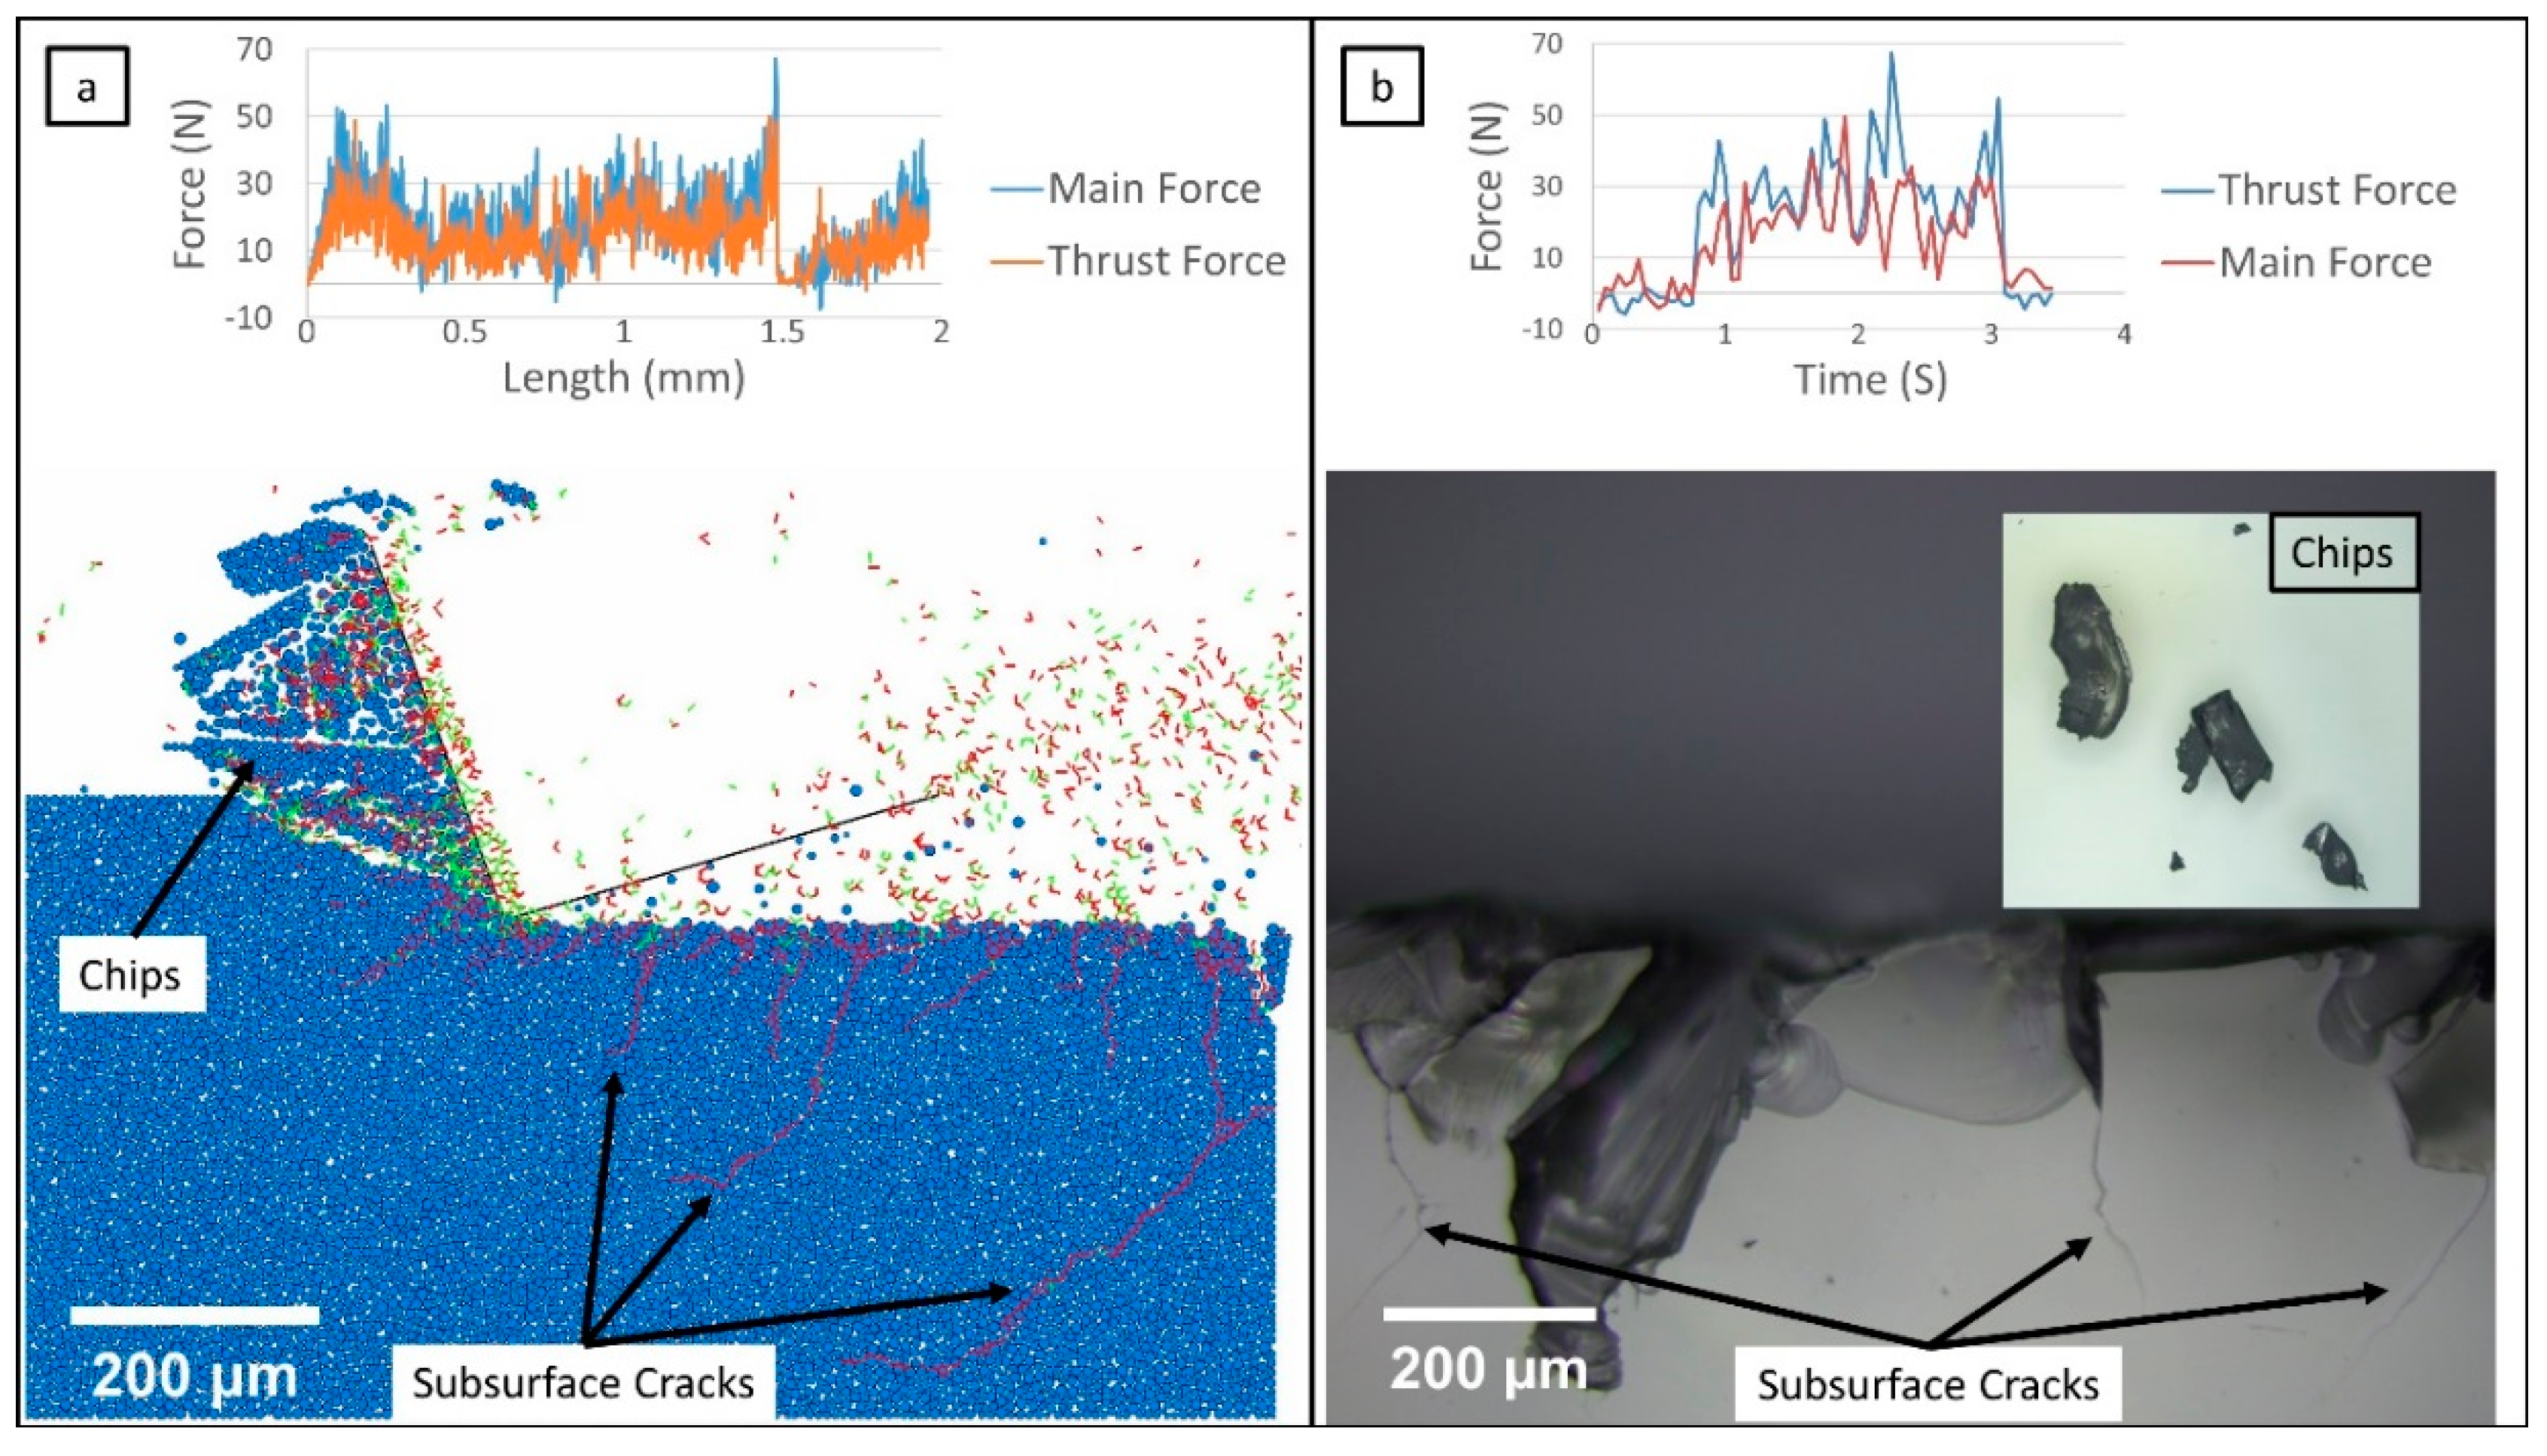
In the chip formation image as shown in
Figure 3a, the green, short lines denote broken bonds between the particles which are caused by shear failure; the red, short lines are also broken bonds, but they are caused by tensile failure. Broken bonds are considered as random cracks. It can be seen that many broken bonds are connected to each other and continue propagating to a deeper region, which is the formation of subsurface cracks. Some of the subsurface cracks can even propagate a few hundred micrometers in distance. Compared to the optical images in
Figure 3b, similar subsurface cracks can be clearly observed in the cutting experiments.
In addition, the chips are recorded for both the cutting simulation and experiments. In the simulation, the chips are formed due to random propagation of broken bonds. The bonded particles are separated by broken bonds into smaller segments with different shapes. The chips from the cutting experiments are also collected and examined. It can be seen clearly that the shapes and dimension of those chips are very similar to those from the simulation.
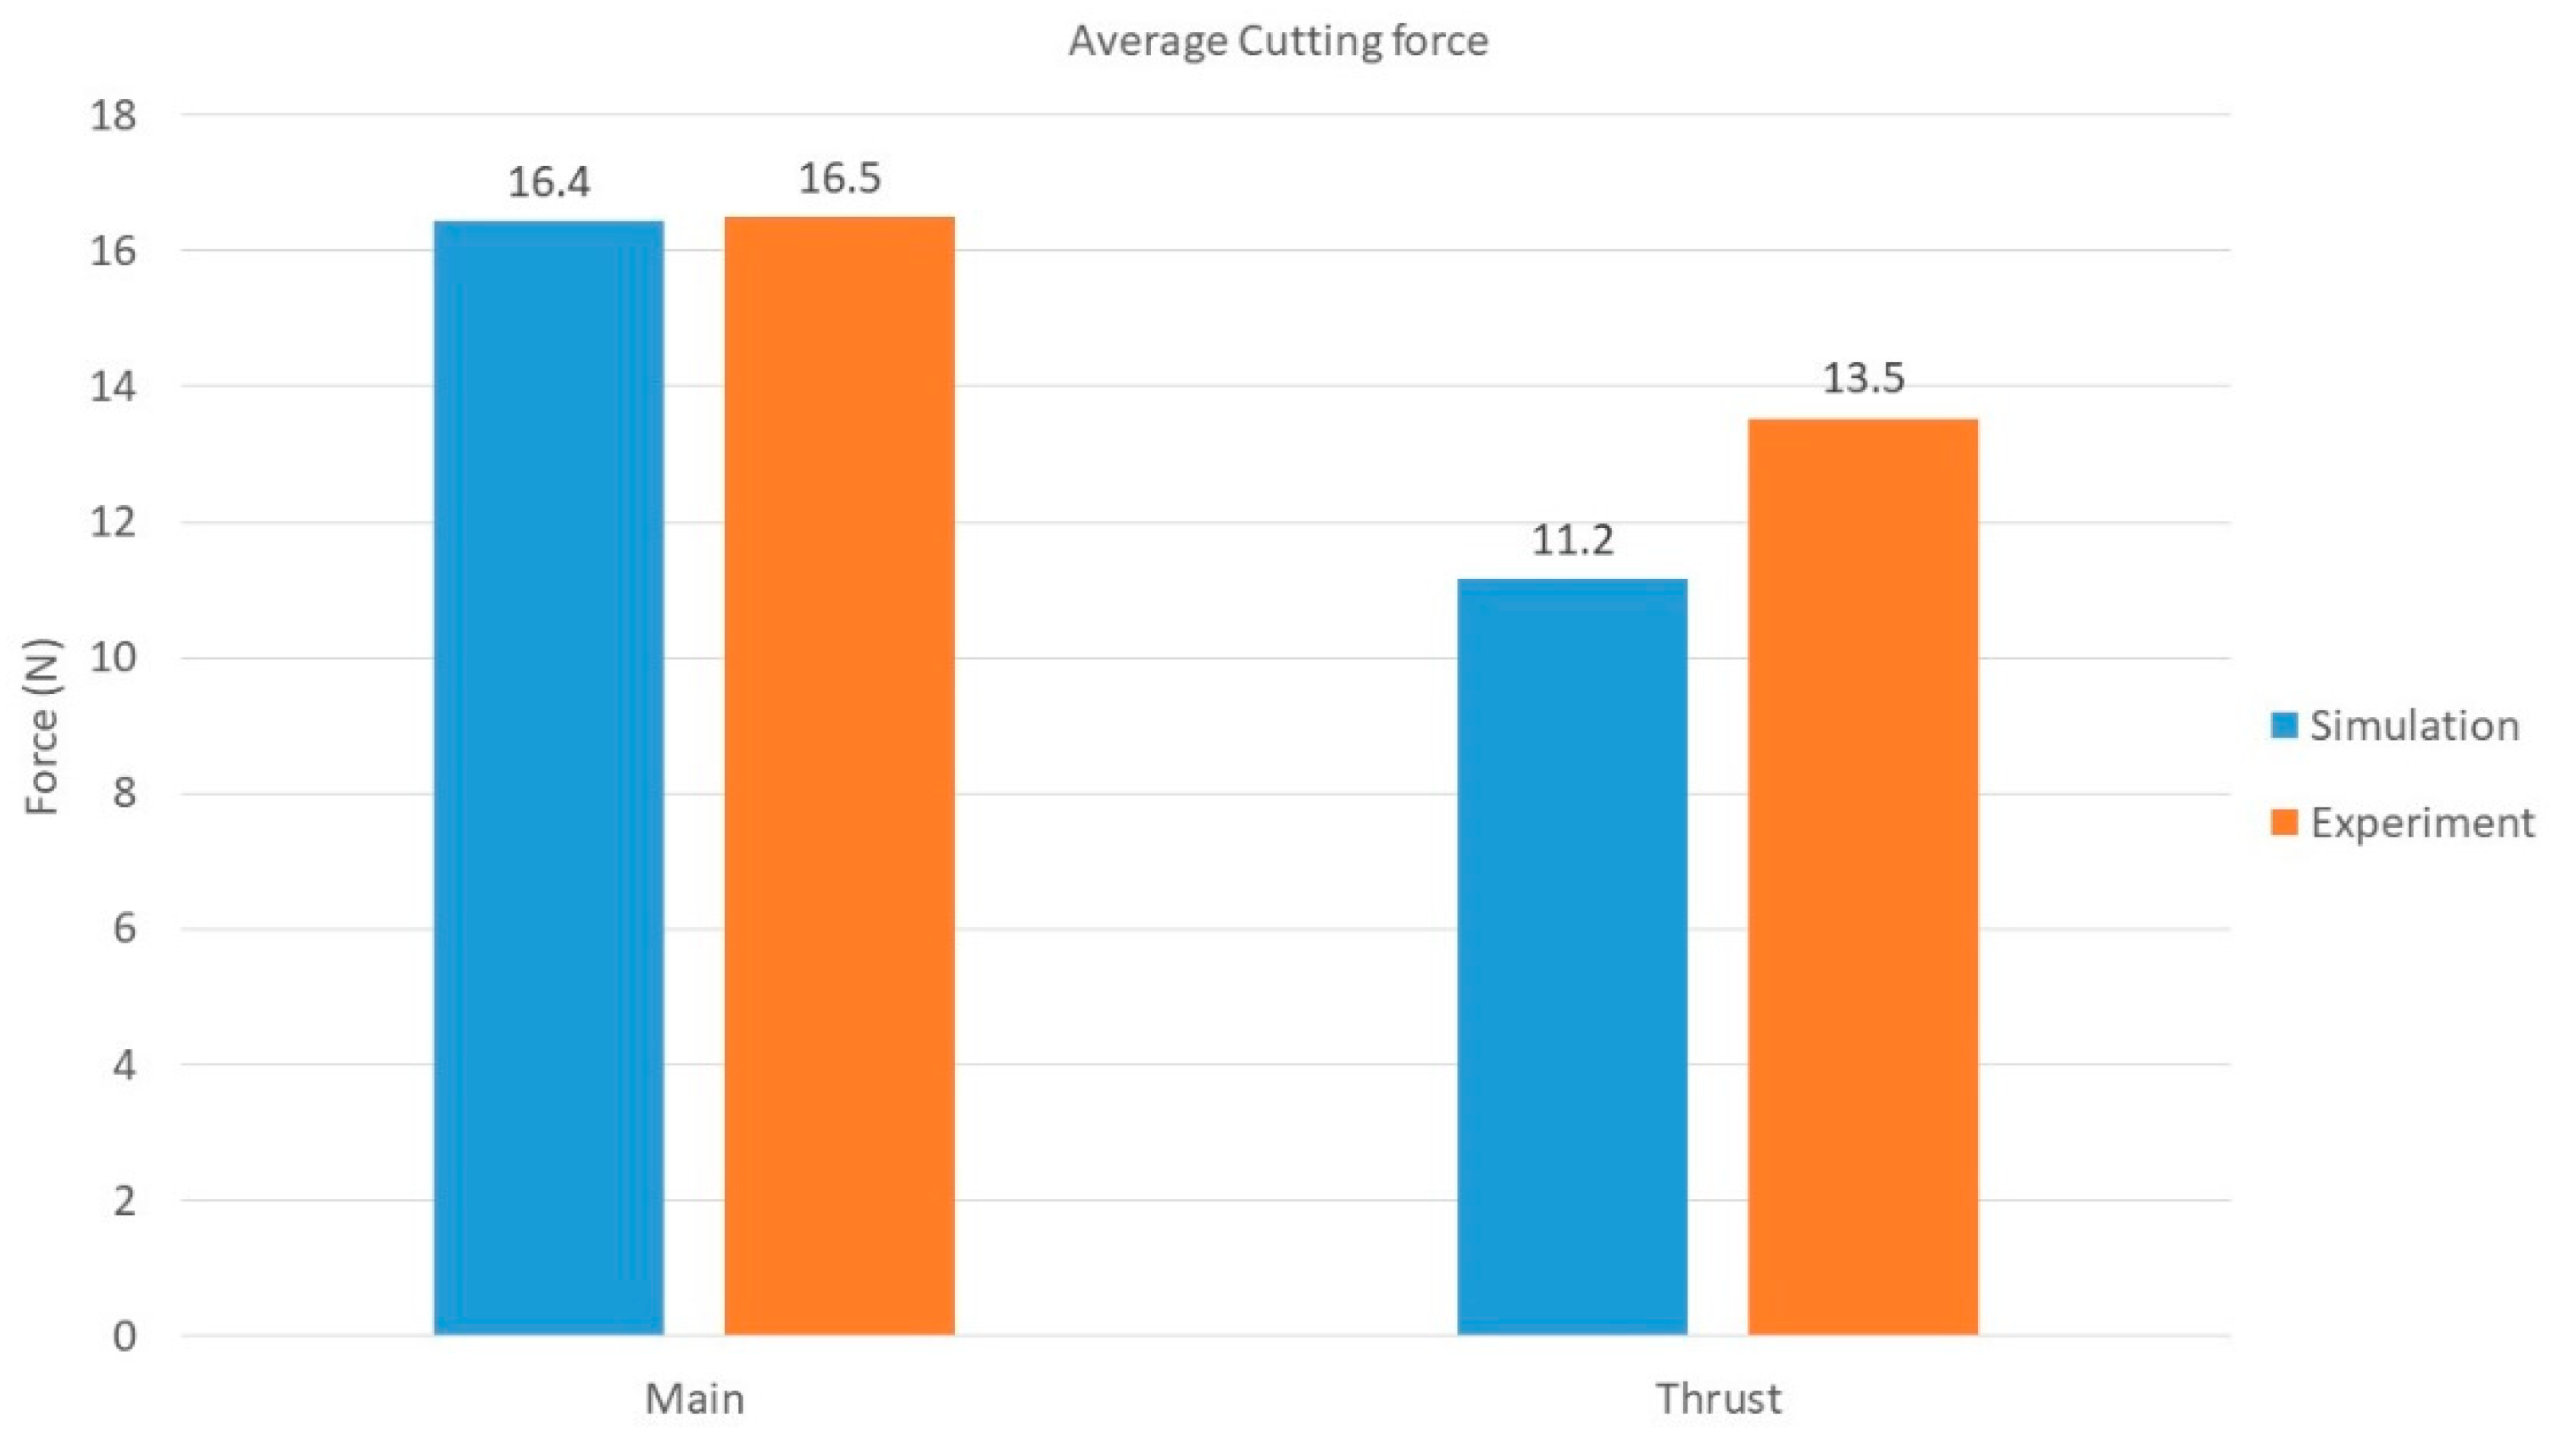
The cutting forces in both the horizontal (main) and vertical (thrust) directions are recorded during the simulation and experiments. It can be seen that numerous force peaks exist for both the simulation and experimental workpieces, which are caused by the initiation and propagation of cracks due to bond breakage between particles. This behavior is typical for brittle material removal processes, characterized by random peaks and valleys which correspond to force build-up followed by sudden fracture occurrence. It is found that the force magnitude for the simulation workpiece is quite similar to the experimental one. In order to reduce the influence of particle arrangement during the simulation, the specimens are generated with different random particle arrangements. Both simulation and experiments are repeated three times, the average cutting forces for each replication are listed in
Table 4.
In order to compare the simulation and experimental results, the average forces for the three replications are taken and plotted in
Figure 4. The main forces for both the simulation and experiments are almost the same, but the thrust force from the simulation is 17% less than that from the experiment results. Due to the brittle feature of glass material, this difference is considered acceptable. Hence, the DEM model is validated through this process.
3. Surface Roughness Prediction
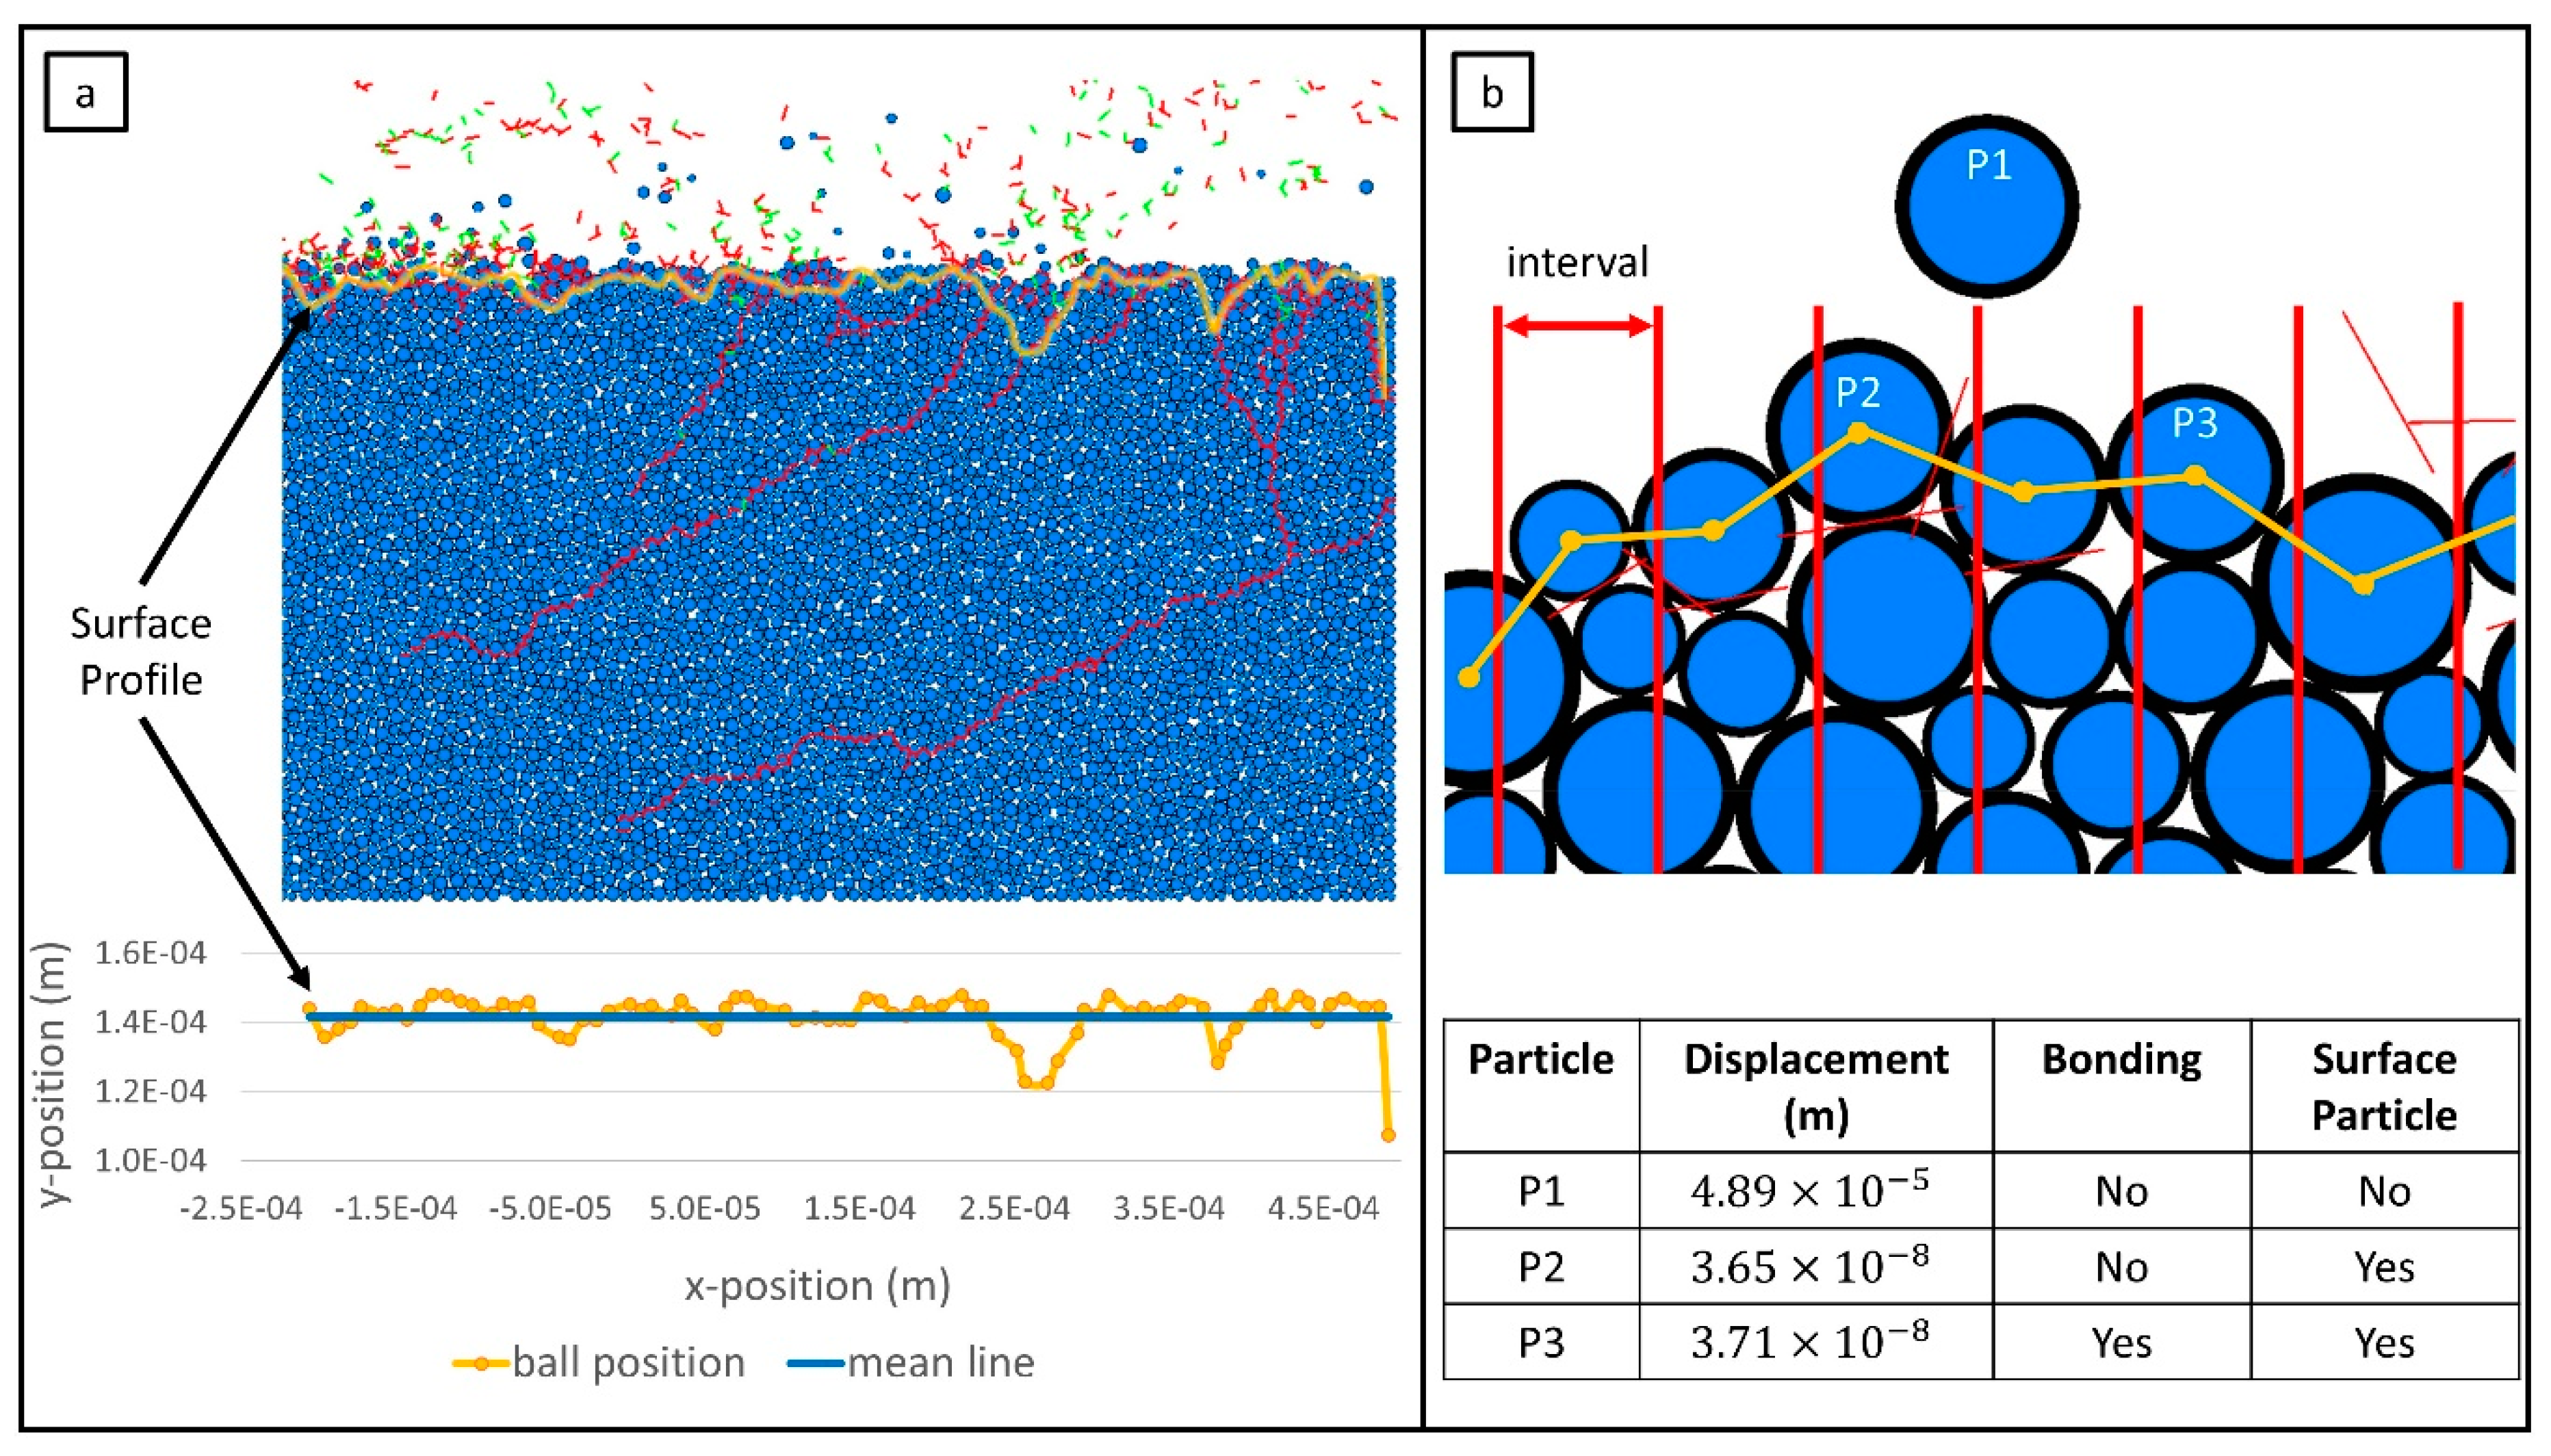
Surface roughness plays an important role in determining product quality and in most cases is a technical requirement for mechanical products. The functional behavior of a part is highly dependent on the desired surface quality. Machining simulations are well studied through the years, however, predicting surface roughness is much more difficult than predicting cutting forces due to modeling complexities. Since the discrete element method models the workpiece as bonded particles, the position of each particle can be tracked through the whole simulation process. Based on this idea, an algorithm has been developed to simulate the surface roughness of the machined workpiece.
The first step is to identify the particles which are not separated from the main workpiece. As can be seen from
Figure 5a, there are numerous broken bonds generated after the cutting is done. Some of the particles are ejected from the main workpiece due to broken bonds, and some of them are still attached to the main workpiece but are not bonded to it anymore. Under this circumstance, the particles which are separated from the main workpiece need to be filtered out. A critical displacement of 10
−7 m is used as a criterion to decide whether a particle remains on the surface. As shown in
Figure 5b, the total displacement of particle P1 is larger than the critical value, so it is not considered as part of the main workpiece. Although particle P2 is not bonded to the workpiece, the total displacement of P2 is within the critical value, so it is still considered as part of the main workpiece. Since P2 is located at the top surface, P2 belongs to the surface particles.
After filtering out the particles which belong to the main workpiece, those that form the top surface of the machined part are identified. This is done by first dividing the cutting distance into finite intervals, as shown in
Figure 5b. Then, the highest particle within each interval is selected as the surface particle. Care should be taken to select the length of these intervals. If it is too large, some surface particles will be missing; if it is too small, unwanted particles will be generated and interfere with the actual surface profile.
The common measure for surface roughness is known as
Ra [
13], which is the arithmetical mean deviation of the surface profile governed by:
where
n is the number or total particles,
yi is the y-position of the particle,
m is the mean value of the
y-positions for all the surface particles which is expressed as:
The
Ra value of the surface profile as shown in
Figure 5a is found to be 4.25 µm.
4. Effects of Seed Crack Types on Cutting Performance
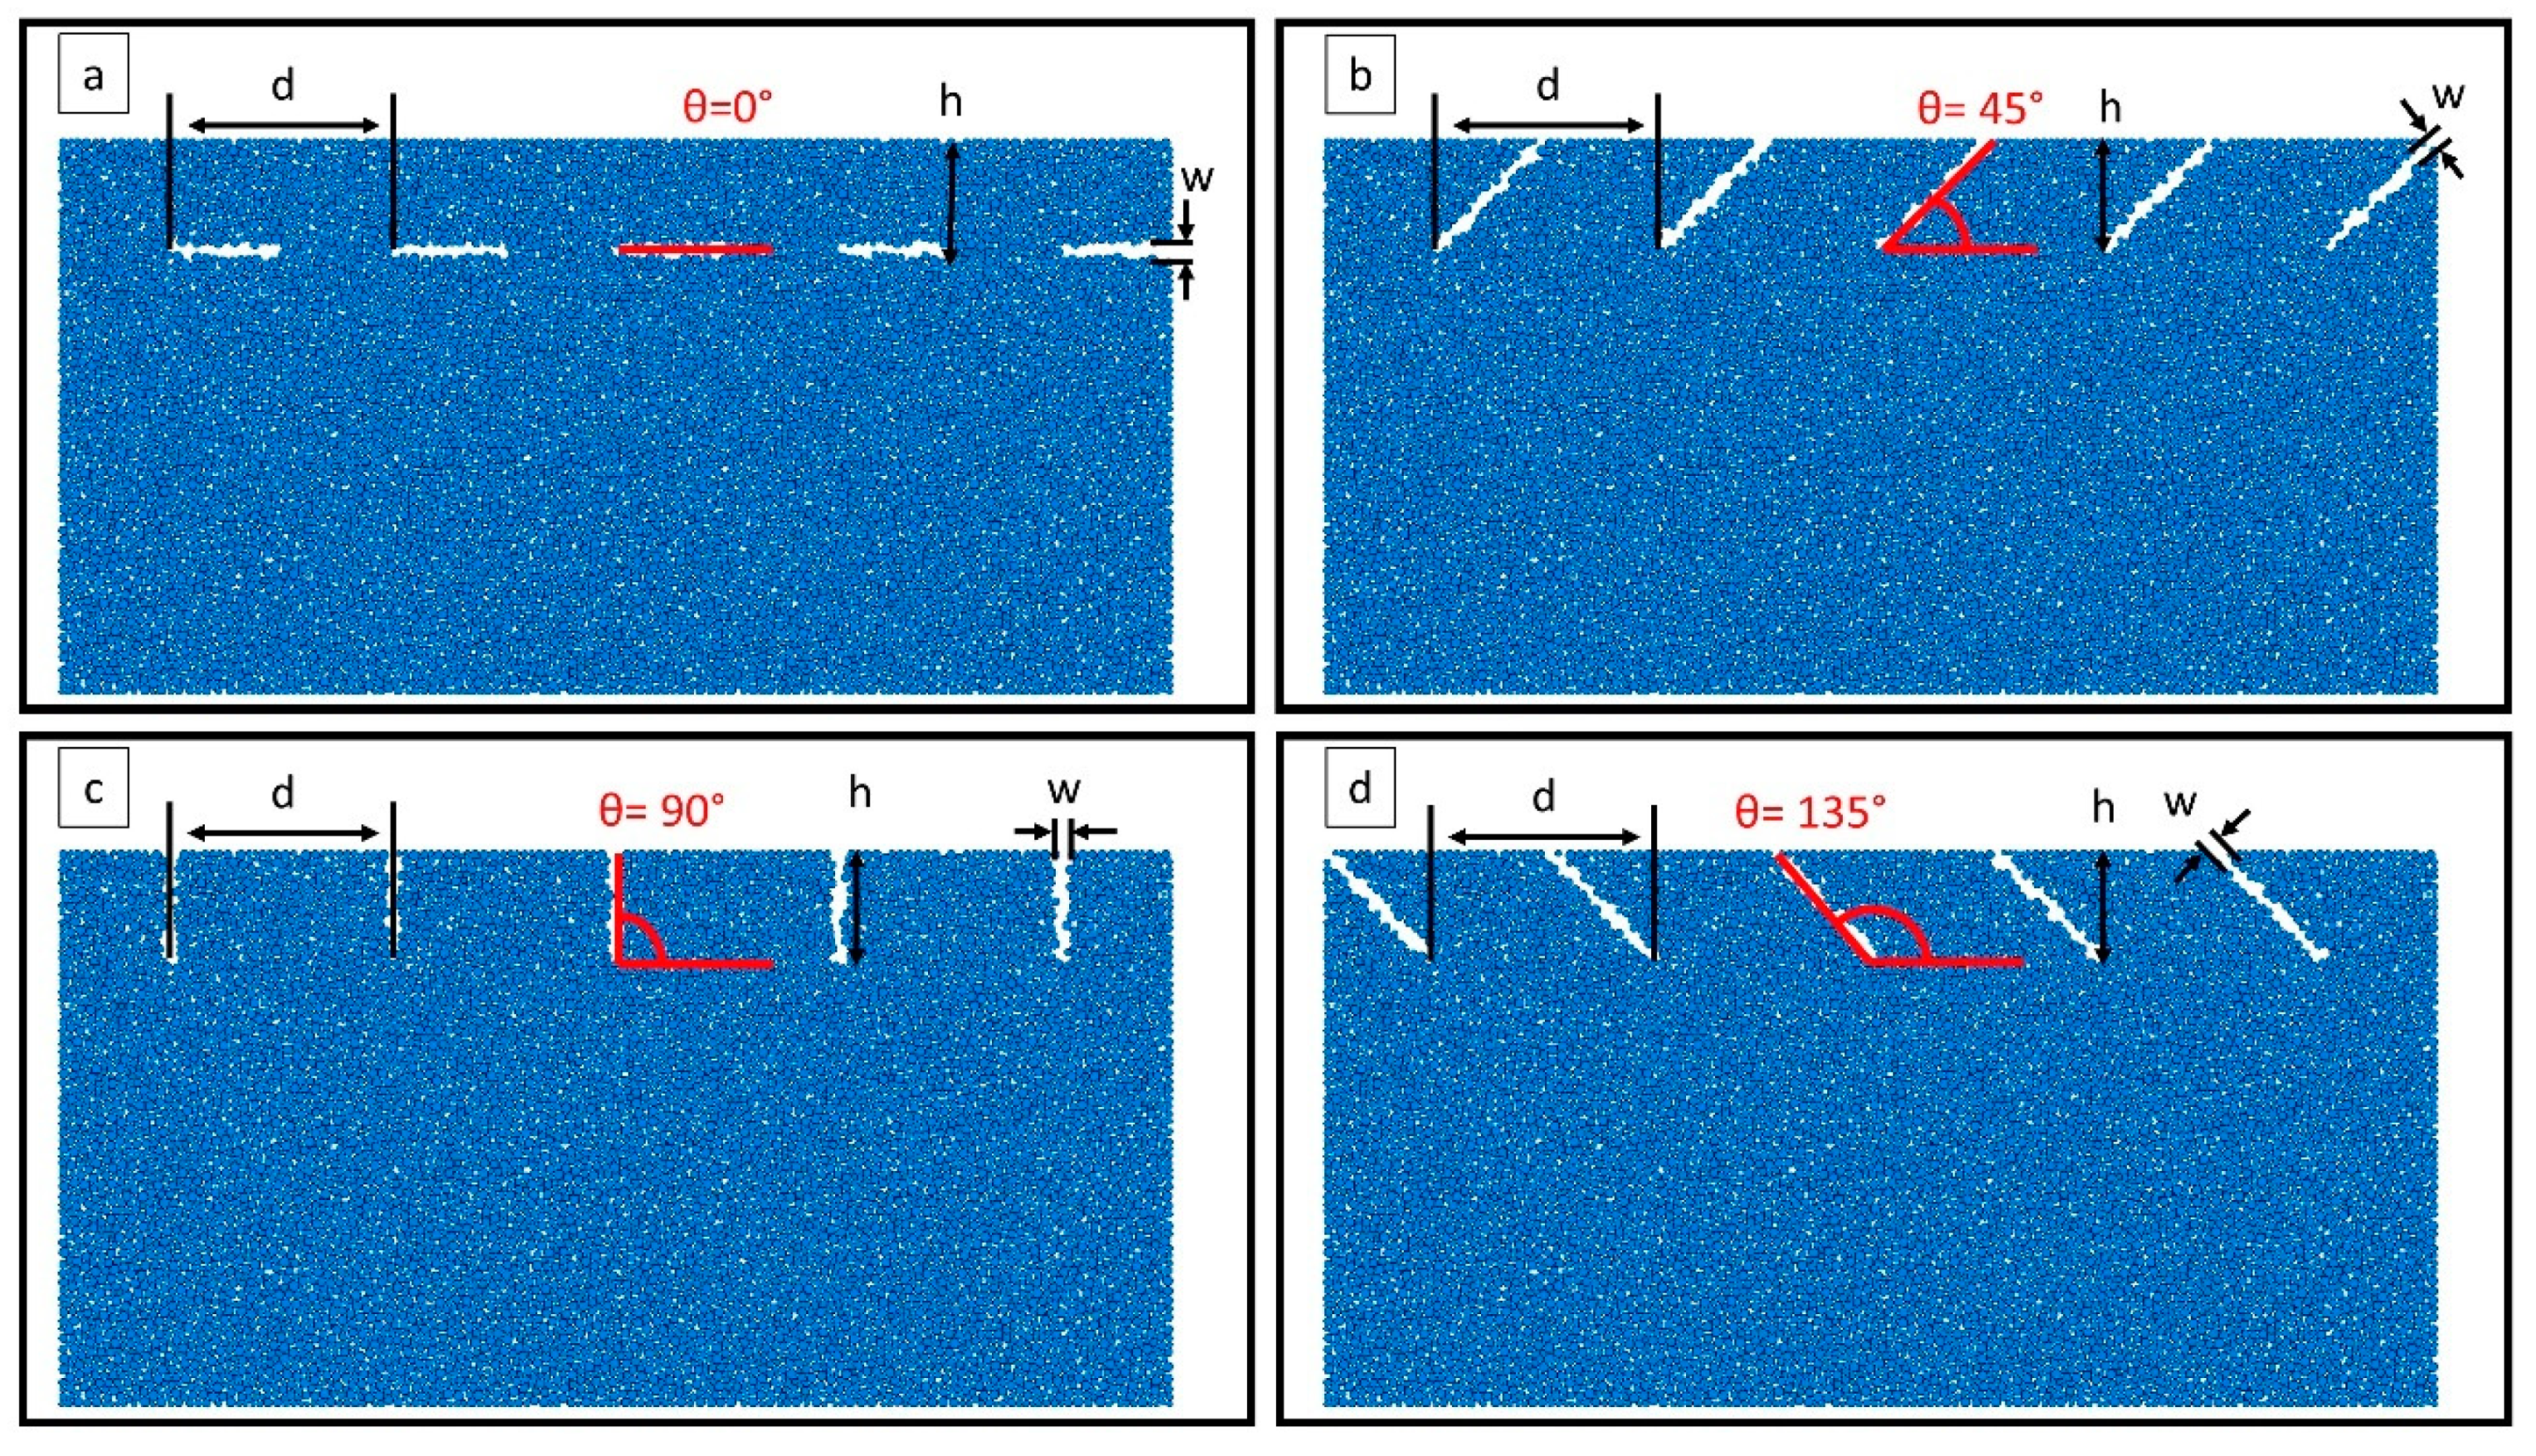
The orthogonal cutting with different seed cracks is simulated and each simulation is repeated three times using specimens generated with different random particle arrangements to reduce the influence of particle arrangement. Four different types of seed crack oriented at the angle (θ) 0°, 45°, 90°, and 135° with the horizontal direction are shown in
Figure 6a–d. The height of the seed cracks (h) is 100 µm under the surface, the width of each seed crack (w) is around 10 µm, and the distance between adjacent seed cracks (d) is 200 µm. The cutting conditions are shown in
Table 5. The cutting speed is set at 1 m/s, the depth of cut is 0.1 mm, the rake angle is −15°, and the width of cut is 2 mm.
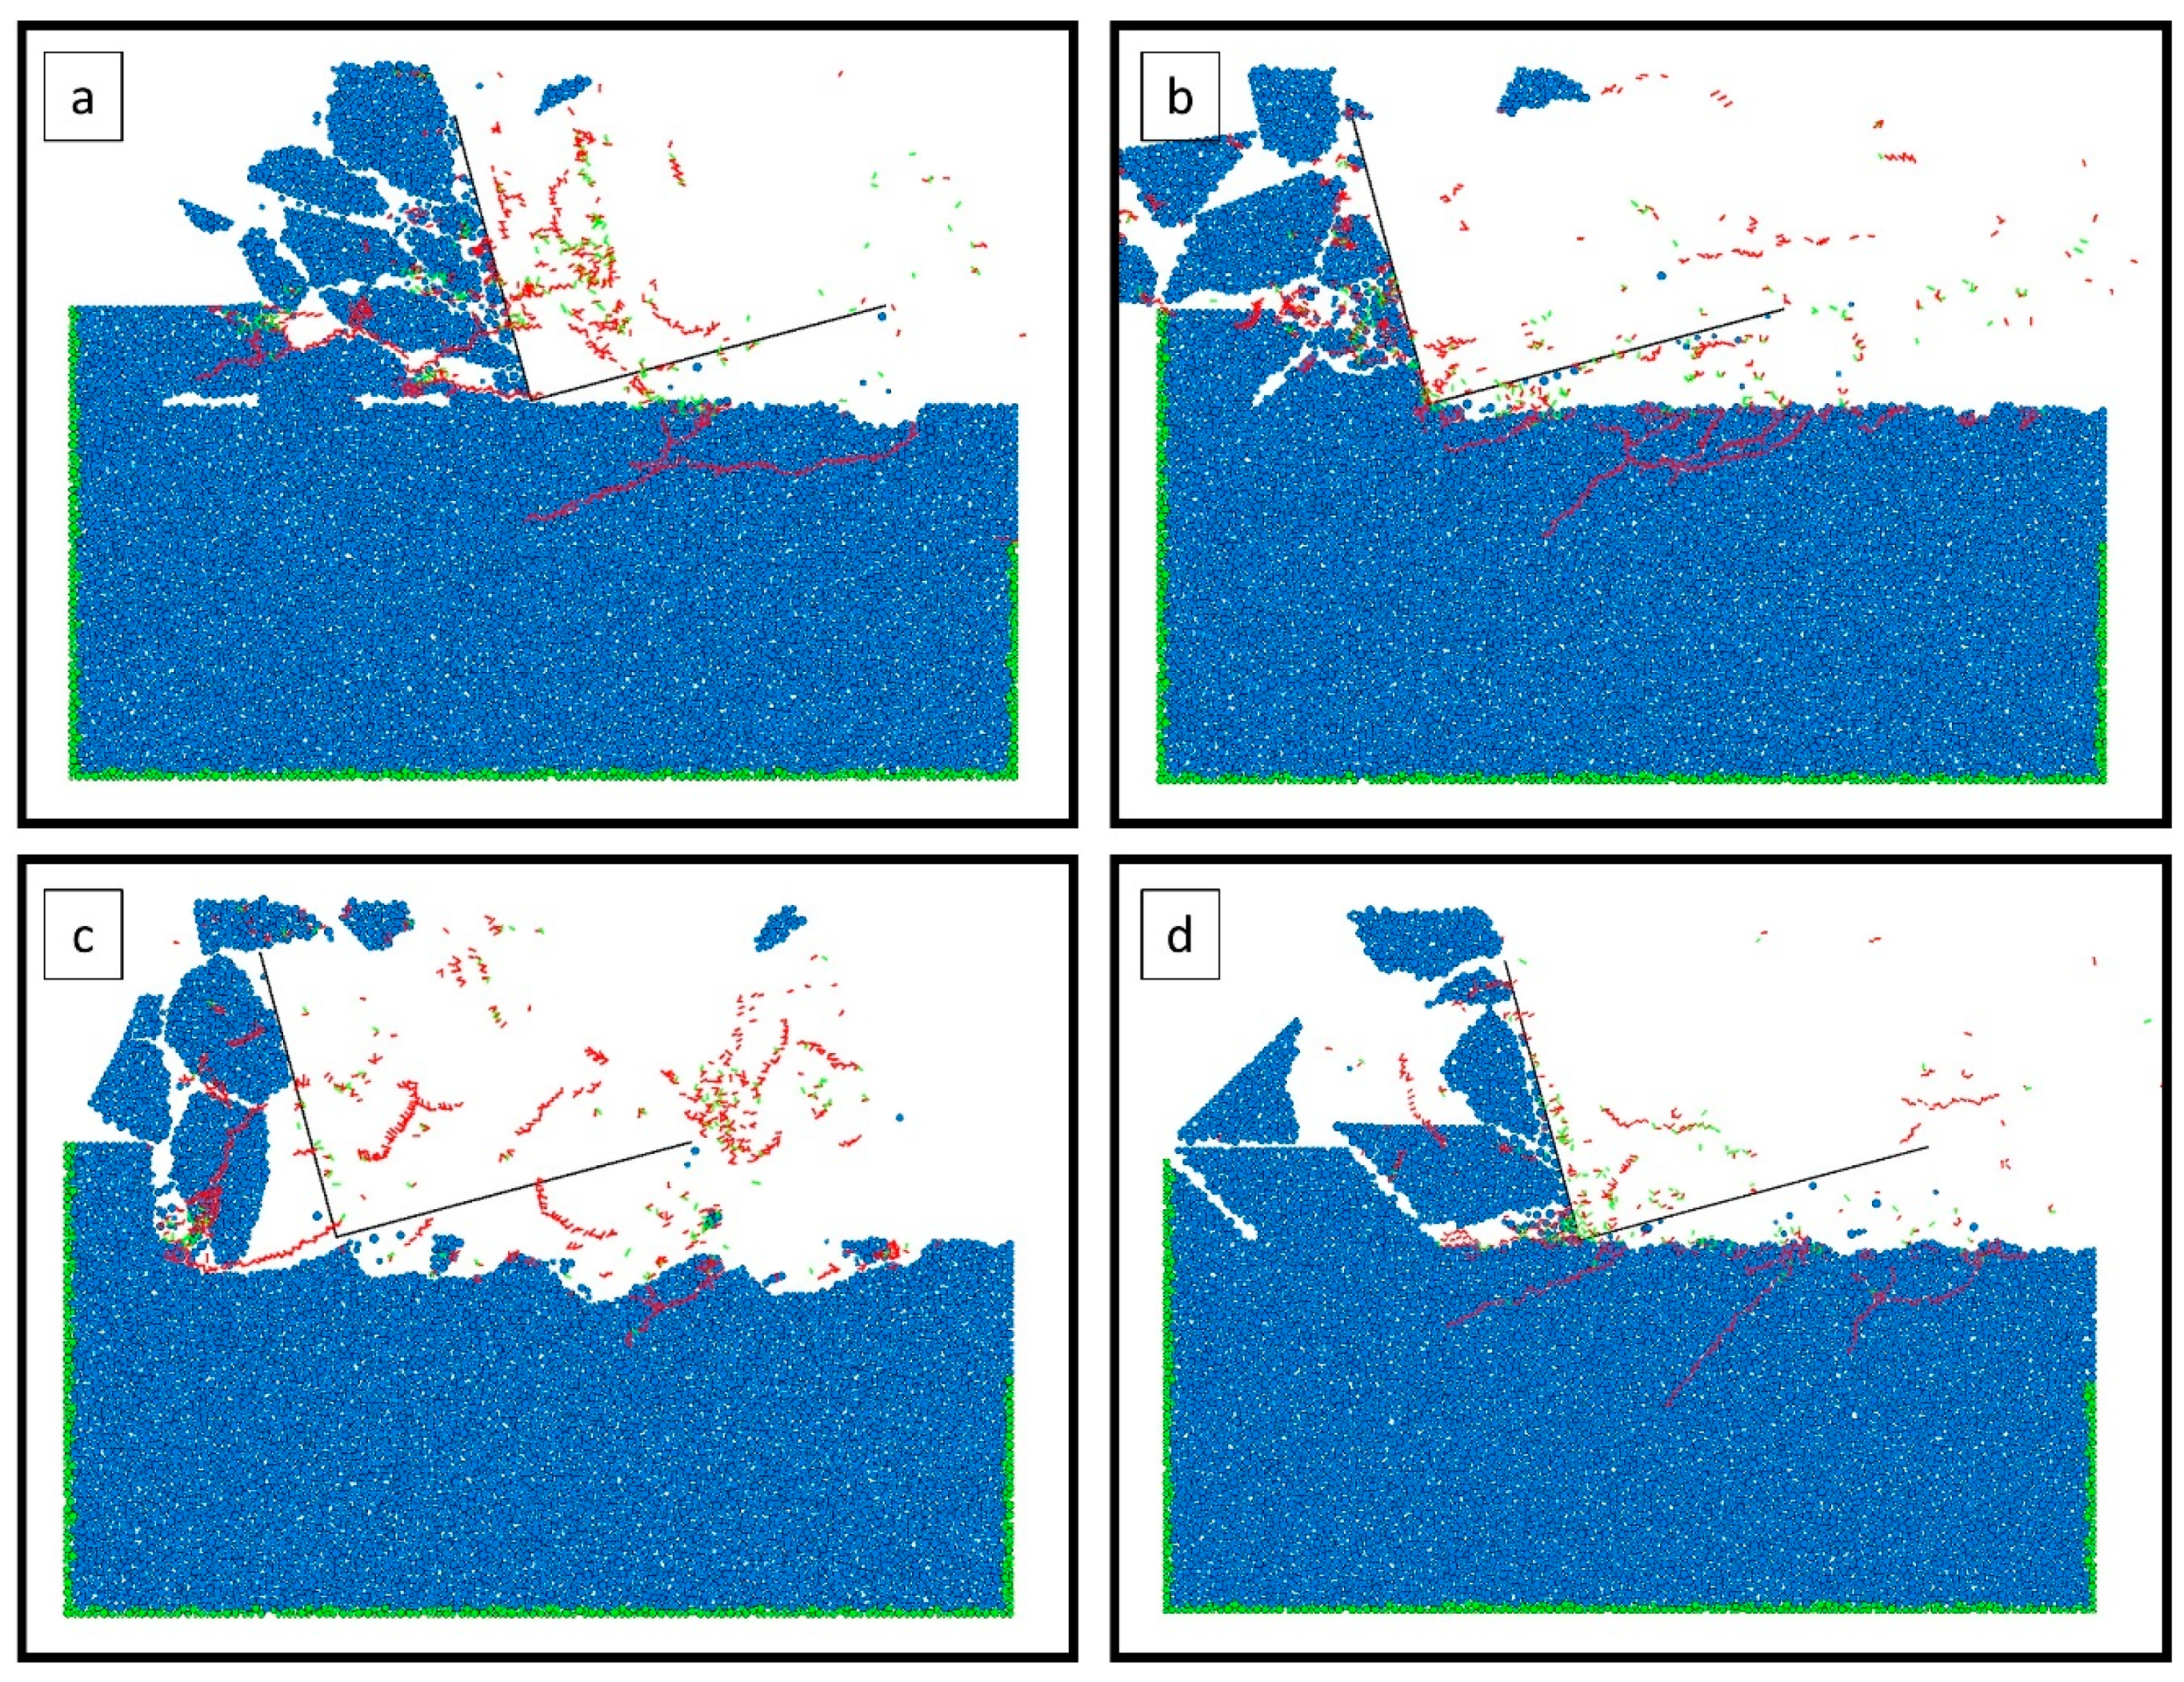
Figure 7a–d shows images for different conditions taken during the cutting simulation. The green particles indicate the fixed boundaries. During the simulation, the main (horizontal direction) and thrust (vertical direction) cutting forces are recorded; random crack numbers and the Ra values of surface roughness are recorded as well.
Table 6 shows the results for each cutting condition.
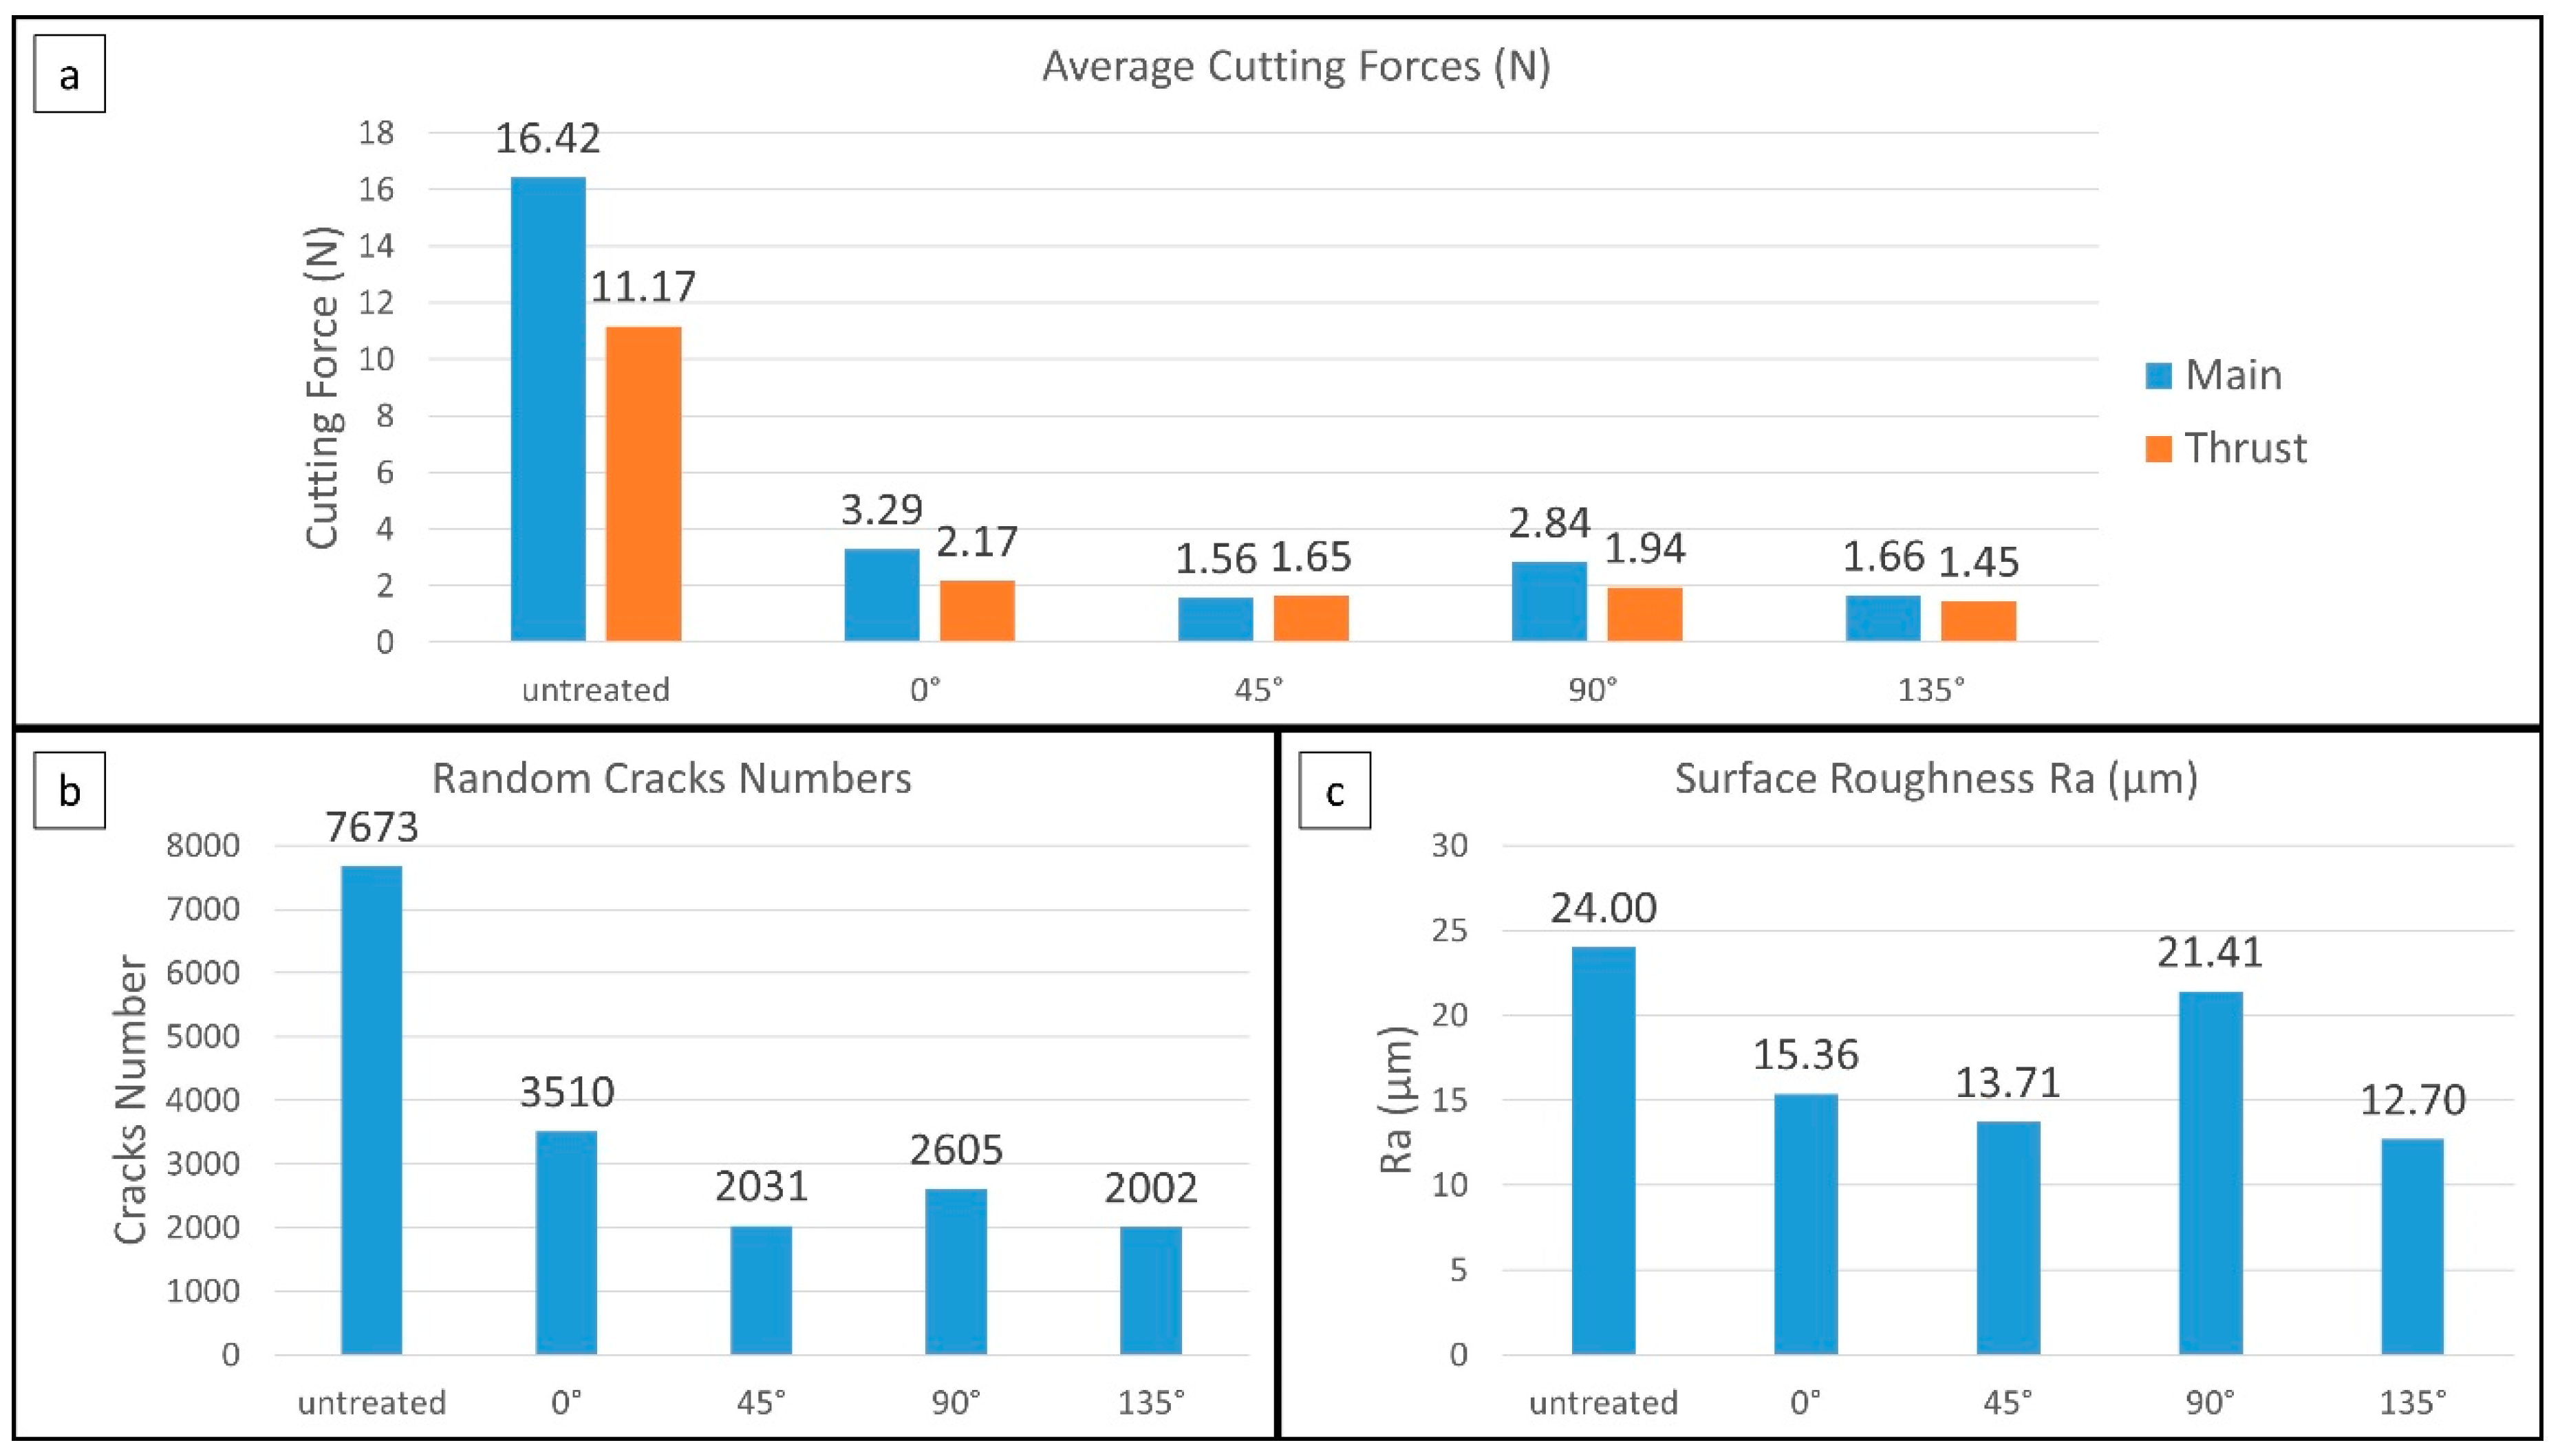
In order to compare the simulation results for each condition, the average values for the cutting force, random cracks, and surface roughness over the three replications are taken and plotted in
Figure 8a–c. In general, compared to the untreated samples, cutting the treated samples with seed cracks can greatly reduce the cutting force, random cracks, and surface roughness. As can be seen, the cutting forces are reduced by 80%–90%, the random cracks are reduced by 54%–74%, and the surface roughness is reduced by 10%–47%.
Comparing these four different seed cracks, the 45° and 135° conditions are better than the 0° and 90° conditions in general. Based on the results for cutting forces, random cracks, and surface roughness, the 45° and 135° conditions give the better performance than the 0° and 90° conditions. Between the 45 and 135° conditions, the cutting simulations predict that the overall performance under the 135° seed crack condition is better.
5. Conclusions
In this paper, the effects of seed cracks are studied and predicted through the orthogonal cutting simulation with PFC2D based on the discrete element method. The results of cutting forces, random cracks, and surface roughness are analyzed. The following conclusions are obtained from this study:
The simulation results show that the cutting forces can be greatly reduced by cutting workpieces with seed cracks.
When the seed cracks are orientated at 45° and 135°, the cutting forces can be minimized.
When the seed cracks are orientated at 135°, the random cracks and surface roughness are able to be minimized.
Author Contributions
G.Y. and S.L. conceived and conducted the simulation; H.A. and G.Y. performed the experiments; G.Y. analyzed the data; and G.Y. and S.L. wrote the paper. All authors have read and agreed to the published version of the manuscript.
Funding
This research was funded by the National Science Foundation under grant no. CMMI-1537846.
Conflicts of Interest
The authors declare no conflict of interest. The founding sponsors had no role in the design of the study; in the collection, analyses, or interpretation of data; in the writing of the manuscript; or in the decision to publish the results.
References
- Yang, G.; Alkotami, H.; Lei, S. Discrete Element Simulation of Orthogonal Machining of Soda-Lime Glass. J. Manuf. Mater. Process. 2018, 2, 10. [Google Scholar]
- Cundall, P.A.; Strack, O.D.L. A discrete numerical model for granular assemblies. Geotechnique 1979, 29, 47–65. [Google Scholar] [CrossRef]
- Cheng, Y.; Nakata, Y.; Bolton, M.J.G. Discrete element simulation of crushable soil. Geotechnique 2003, 53, 633–641. [Google Scholar] [CrossRef]
- Langston, P.A.; Tüzün, U.; Heyes, D.M. Discrete element simulation of granular flow in 2D and 3D hoppers: Dependence of discharge rate and wall stress on particle interactions. Chem. Eng. Sci. 1995, 50, 967–987. [Google Scholar] [CrossRef]
- Tang, C.-L.; Hu, J.-C.; Lin, M.-L.; Angelier, J.; Lu, C.-Y.; Chan, Y.-C.; Chu, H.-T. The Tsaoling landslide triggered by the Chi-Chi earthquake, Taiwan: Insights from a discrete element simulation. Eng. Geol. 2009, 106, 1–19. [Google Scholar] [CrossRef]
- Huang, H.-Y.; Lecampion, B.; Detournay, E. Discrete element modeling of tool-rock interaction I: Rock cutting. Int. J. Numer. Anal. Methods Geomech. 2013, 37, 1913–1929. [Google Scholar] [CrossRef]
- Shen, X.; Lei, S. Distinct Element Simulation of Laser Assisted Machining of Silicon Nitride Ceramics: Surface/Subsurface Cracks and Damage. In Proceedings of the ASME 2005 International Mechanical Engineering Congress and Exposition, Orlando, FL, USA, 5–11 November 2005; pp. 1267–1274. [Google Scholar]
- Iliescu, D.; Gehin, D.; Iordanoff, I.; Girot, F.; Gutiérrez, M.E. A discrete element method for the simulation of CFRP cutting. Compos. Sci. Technol. 2010, 70, 73–80. [Google Scholar] [CrossRef]
- El-Hofy, H.A.-G. Advanced Machining Processes: Nontraditional and Hybrid Machining Processes; McGraw Hill Professional: Two Penn Plaza, NY, USA, 2005. [Google Scholar]
- Brehl, D.E.; Dow, T. Review of vibration-Assisted machining. Precis. Eng. 2008, 32, 153–172. [Google Scholar] [CrossRef]
- Choi, J.; Jeon, B.; Kim, B.H. Chemical-Assisted ultrasonic machining of glass. J. Mater. Process. Technol. 2007, 191, 153–156. [Google Scholar] [CrossRef]
- Shanmugam, N.; Yu, X.; Alkotami, H.; Devin, G.; Lei, S. Machining of Transparent Brittle Material Assisted by Laser-Induced Seed Cracks. In Proceedings of the ASME 2016 11th International Manufacturing Science and Engineering Conference, Blacksburg, VA, USA, 27 June–1 July 2016; p. V001T002A019. [Google Scholar]
- Black, J.T.; Kohser, R.A.; DeGarmo, E.P. Degarmos Materials and Processes in Manufacturing; John Wiley & Sons, Inc.: Hoboken, NJ, USA, 2018. [Google Scholar]
Figure 1.
Flow chart of the specimen creation procedure.
Figure 1.
Flow chart of the specimen creation procedure.
Figure 2.
(a) DEM model of the cutting simulation, (b) experimental setup of the orthogonal machining test.
Figure 2.
(a) DEM model of the cutting simulation, (b) experimental setup of the orthogonal machining test.
Figure 3.
(a) DEM model of the cutting simulation and recorded forces, (b) optical images of the machined area of the soda-lime glass sample and recorded forces.
Figure 3.
(a) DEM model of the cutting simulation and recorded forces, (b) optical images of the machined area of the soda-lime glass sample and recorded forces.
Figure 4.
Cutting force comparison for the simulation and experimental results.
Figure 4.
Cutting force comparison for the simulation and experimental results.
Figure 5.
(a) Surface profile of a machined sample by DEM simulation, (b) surface particles.
Figure 5.
(a) Surface profile of a machined sample by DEM simulation, (b) surface particles.
Figure 6.
Synthetic workpieces with seed cracks of different angles: (a) 0°, (b) 45°, (c) 90°, and (d) 135°.
Figure 6.
Synthetic workpieces with seed cracks of different angles: (a) 0°, (b) 45°, (c) 90°, and (d) 135°.
Figure 7.
Simulation images of machined workpiece with seed cracks of different angles: (a) 0°, (b) 45°, (c) 90°, and (d) 135°.
Figure 7.
Simulation images of machined workpiece with seed cracks of different angles: (a) 0°, (b) 45°, (c) 90°, and (d) 135°.
Figure 8.
The simulation results for four different conditions: (a) Average cutting forces, (b) average random cracks, and (c) average surface roughness.
Figure 8.
The simulation results for four different conditions: (a) Average cutting forces, (b) average random cracks, and (c) average surface roughness.
Table 1.
Macro- and micro-parameters of the synthetic specimen.
Table 1.
Macro- and micro-parameters of the synthetic specimen.
| Micro-Parameters | Description | Value |
| ρ | Ball density (kg/m3) | 2.4 × 10³ |
| H | Sample height (m) | 1.0 × 10⁻³ |
| W | Sample width (m) | 2.0 × 10⁻³ |
| Rmin | Minimum ball radius (m) | 2.5 × 10⁻⁶ |
| Rmax | Maximum ball radius (m) | 5.0 × 10⁻⁶ |
| Micro-Parameters | Description | Value |
| Ball–ball contact modulus (Pa) | 8.1 × 10¹⁰ |
| Ball stiffness ratio | 4.3 |
| Flat-joint bond modulus (Pa) | 8.1 × 10¹⁰ |
| Flat-joint bond stiffness ratio | 4.3 |
| Ball friction coefficient | 0.577 |
| Flat-joint normal strength (Pa) | 1.69 × 10⁸ |
| Flat-joint shear strength (Pa) | 1.85 × 10⁸ |
| Friction angle (degree) | 25.0 |
Table 2.
Comparison of properties between the discrete element method (DEM) model and soda-lime glass.
Table 2.
Comparison of properties between the discrete element method (DEM) model and soda-lime glass.
| Mechanical Property | Elastic Modulus
E (GPa) | Tensile Strength
σt (MPa) | Compressive Strength
σc (MPa) | Poisson’s Ratio
ν |
|---|
| Soda-lime glass | 71 | 41 | 330 | 0.23 |
| DEM Model | 71.1 | 42.6 | 332 | 0.228 |
Table 3.
Cutting conditions for the experiments.
Table 3.
Cutting conditions for the experiments.
| Parameter | Description | Simulation | Experiment |
|---|
| V (mm/s) | Cutting speed | 4 | 4 |
| t (mm) | Depth of cut | 0.1 | 0.1 |
| α (degree) | Rake angle | −15 | −15 |
| L (mm) | Length of cut | 2 | 25.4 |
Table 4.
Average cutting forces for each experiment.
Table 4.
Average cutting forces for each experiment.
| Depth of Cut (mm) | Replications | Average Cutting Force (N) |
|---|
| Experimental Workpiece | Simulation Workpiece |
|---|
| Main | Thrust | Main | Thrust |
|---|
| 0.1 | 1 | 17.8 | 14.1 | 15.4 | 10.1 |
| 2 | 15.0 | 12.5 | 16.4 | 11.6 |
| 3 | 16.7 | 14.0 | 17.5 | 11.8 |
Table 5.
Cutting conditions for the simulation.
Table 5.
Cutting conditions for the simulation.
| Parameter | Description | Value |
|---|
| V (m/s) | Cutting speed | 1 |
| t (mm) | Depth of cut | 0.1 |
| α (degree) | Rake angle | −15 |
| L (mm) | Length of cut | 2 |
Table 6.
Simulation results for each condition.
Table 6.
Simulation results for each condition.
| Angle of Seed Cracks | Replications | Average Cutting Force (N) | Random Cracks | Surface Roughness
Ra (µm) |
|---|
| Main | Thrust |
|---|
| 0° | 1 | 2.58 | 2.14 | 2893 | 29.71 |
| 2 | 3.59 | 2.33 | 3424 | 6.70 |
| 3 | 3.72 | 2.05 | 4212 | 9.38 |
| 45° | 1 | 1.80 | 1.75 | 2268 | 9.01 |
| 2 | 1.43 | 1.46 | 2010 | 10.21 |
| 3 | 1.46 | 1.73 | 1814 | 21.90 |
| 90° | 1 | 2.48 | 1.86 | 2735 | 28.30 |
| 2 | 3.48 | 1.95 | 1577 | 15.52 |
| 3 | 2.54 | 2.00 | 3504 | 20.41 |
| 135° | 1 | 1.79 | 1.11 | 2110 | 8.29 |
| 2 | 1.98 | 1.71 | 1674 | 20.28 |
| 3 | 1.21 | 1.53 | 2223 | 9.52 |
© 2020 by the authors. Licensee MDPI, Basel, Switzerland. This article is an open access article distributed under the terms and conditions of the Creative Commons Attribution (CC BY) license (http://creativecommons.org/licenses/by/4.0/).


