The Average Grain Size and Grain Aspect Ratio in Metal Laser Powder Bed Fusion: Modeling and Experiment


Abstract
:1. Introduction
2. Methodology
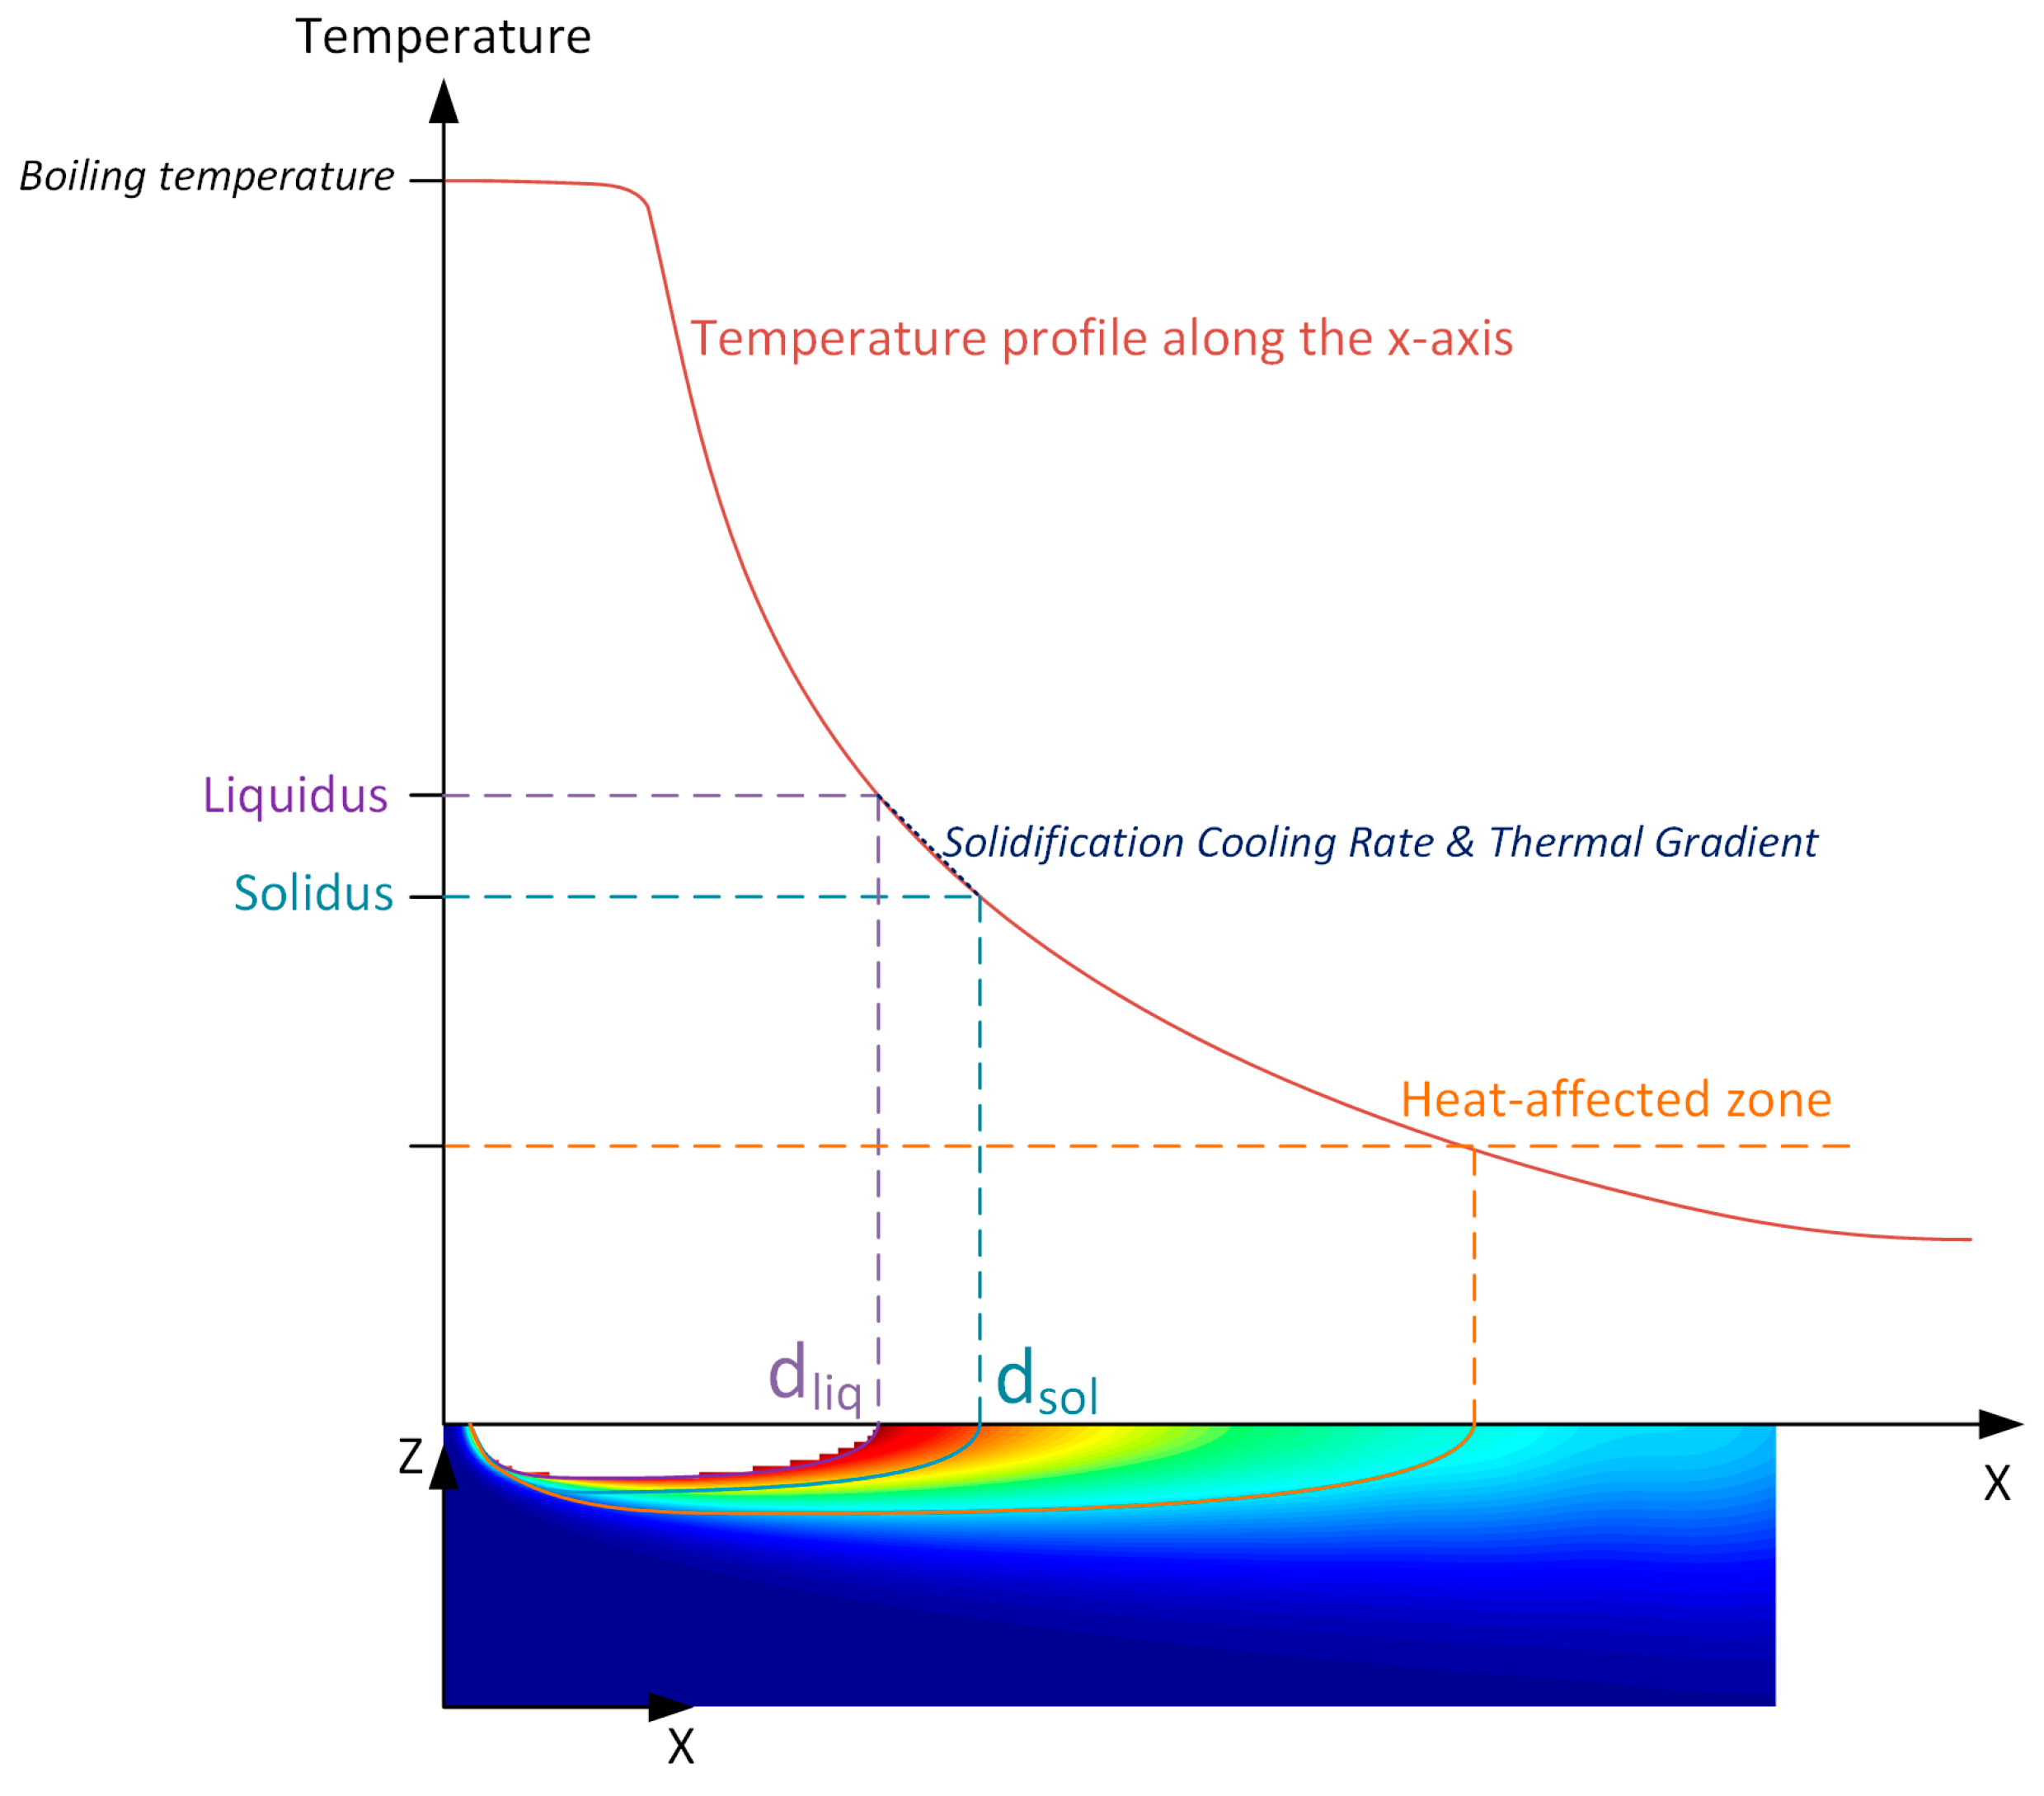
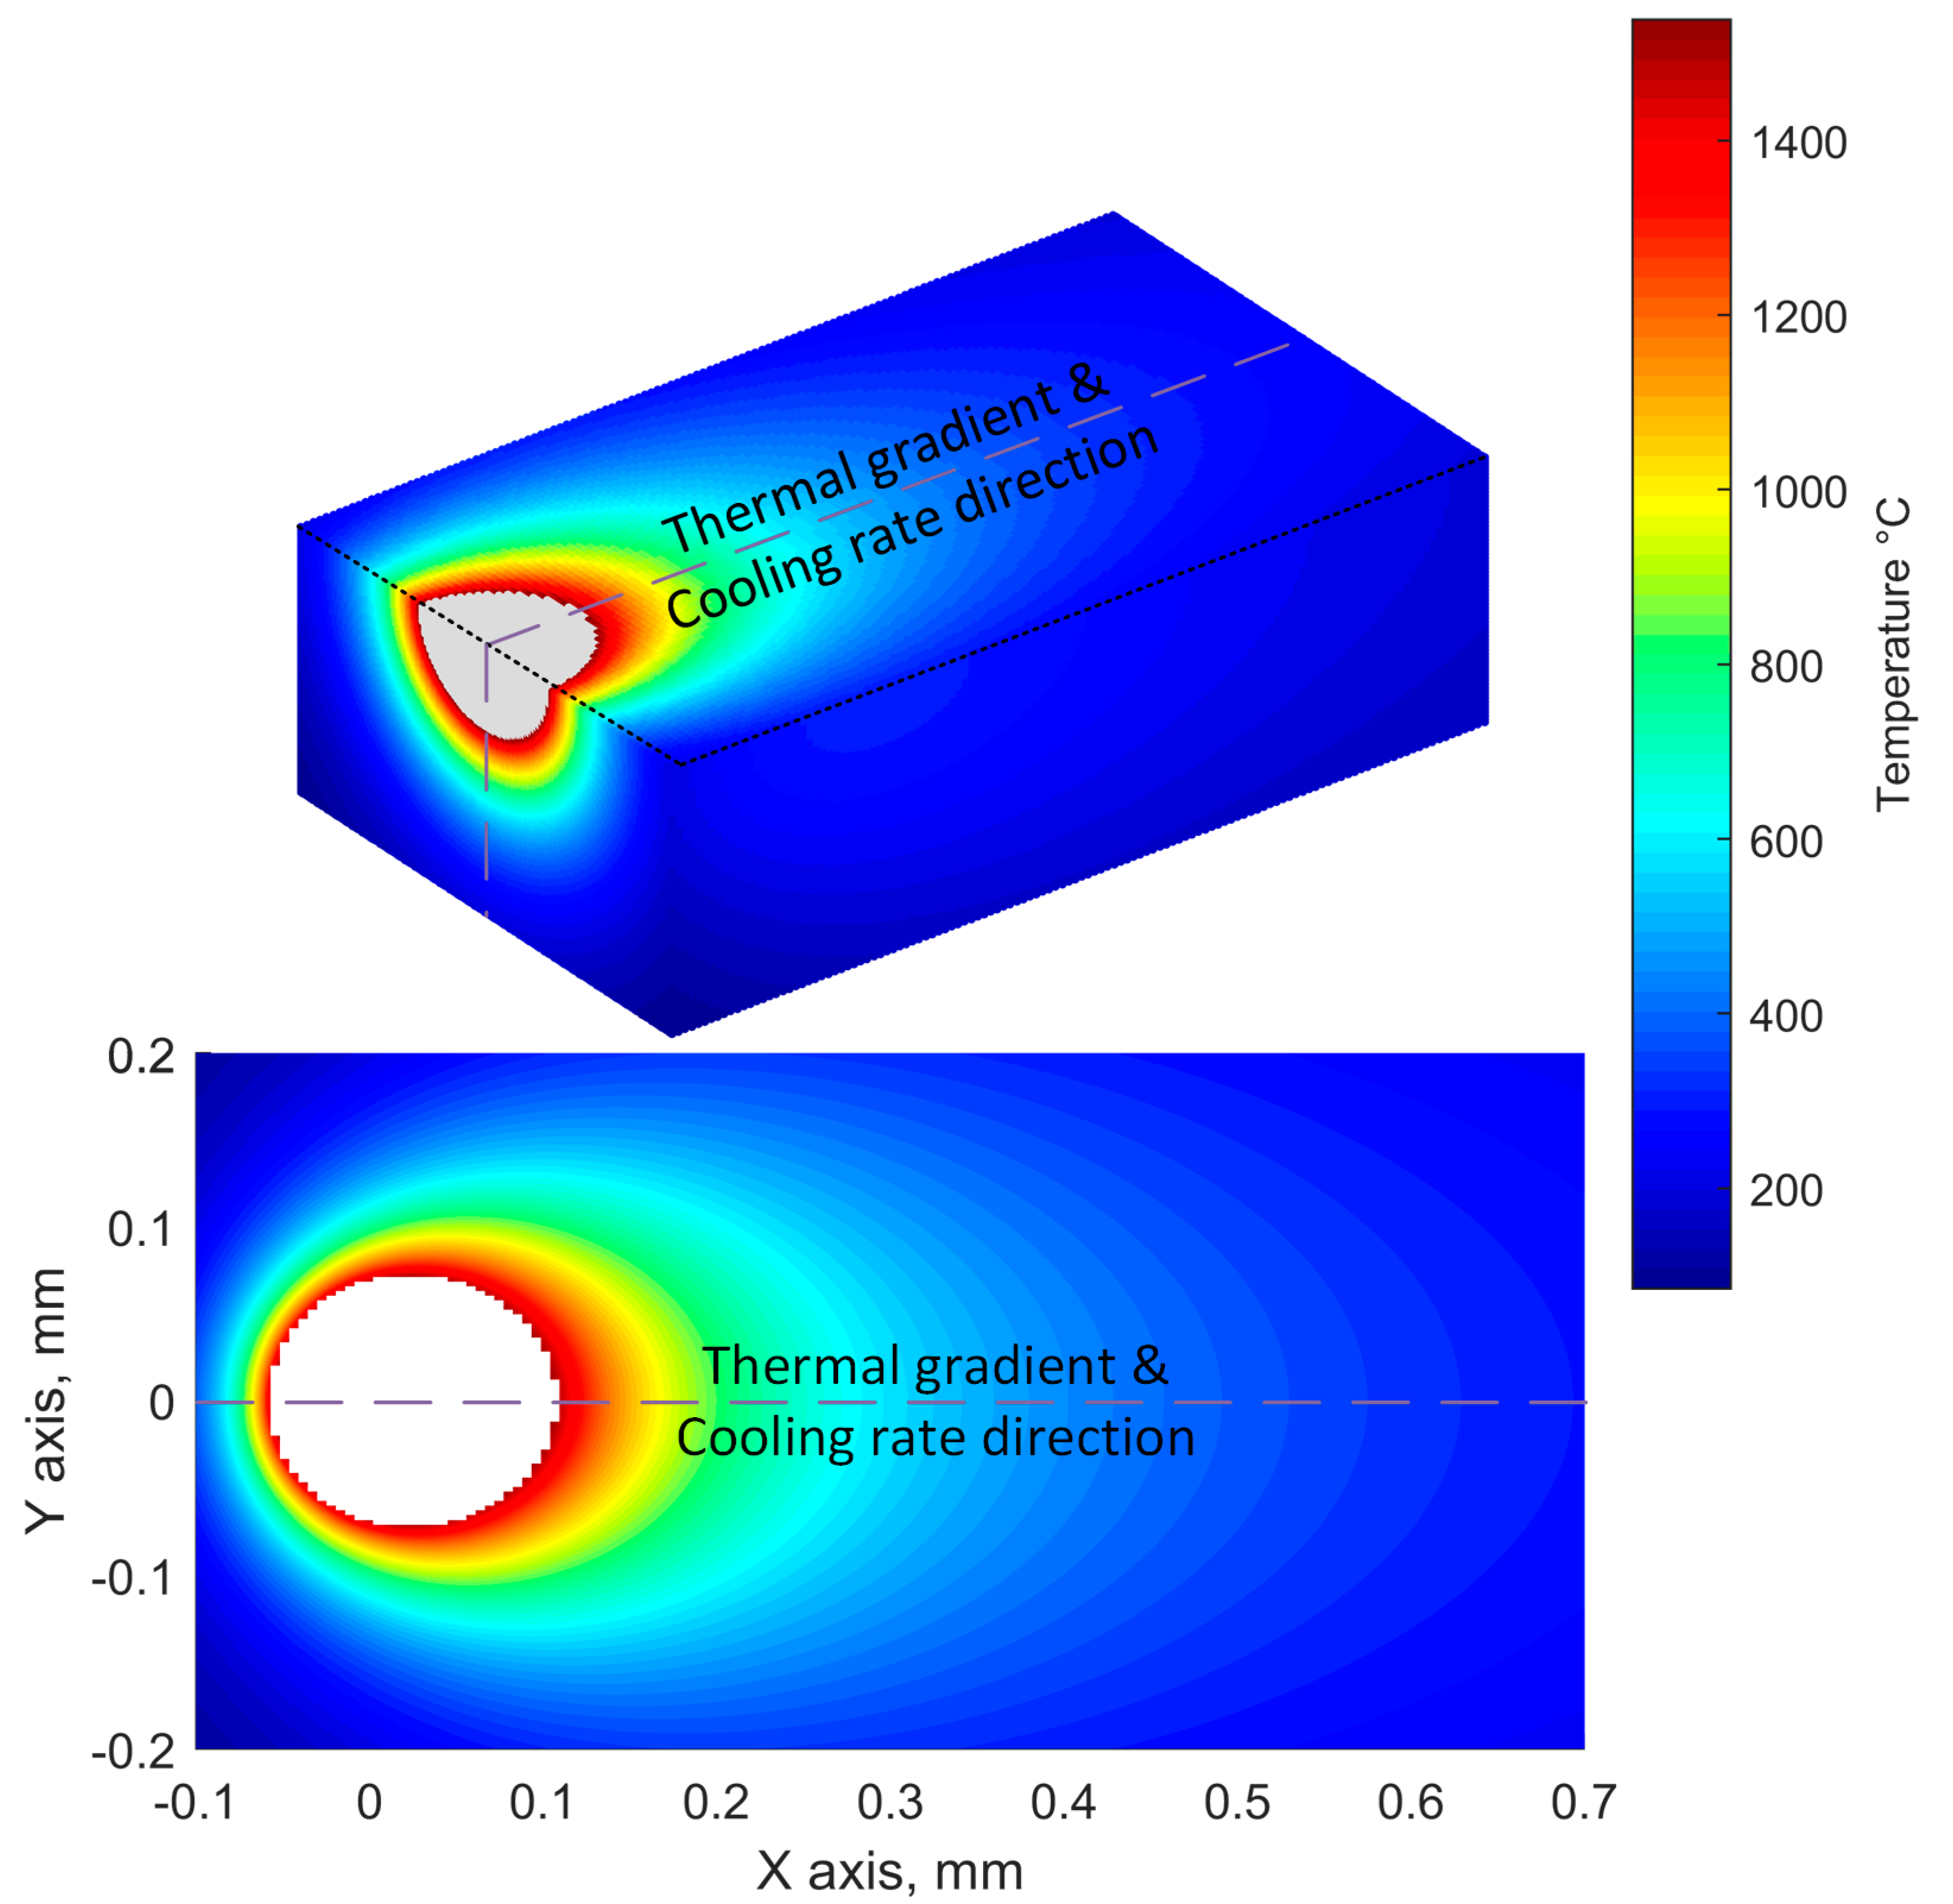
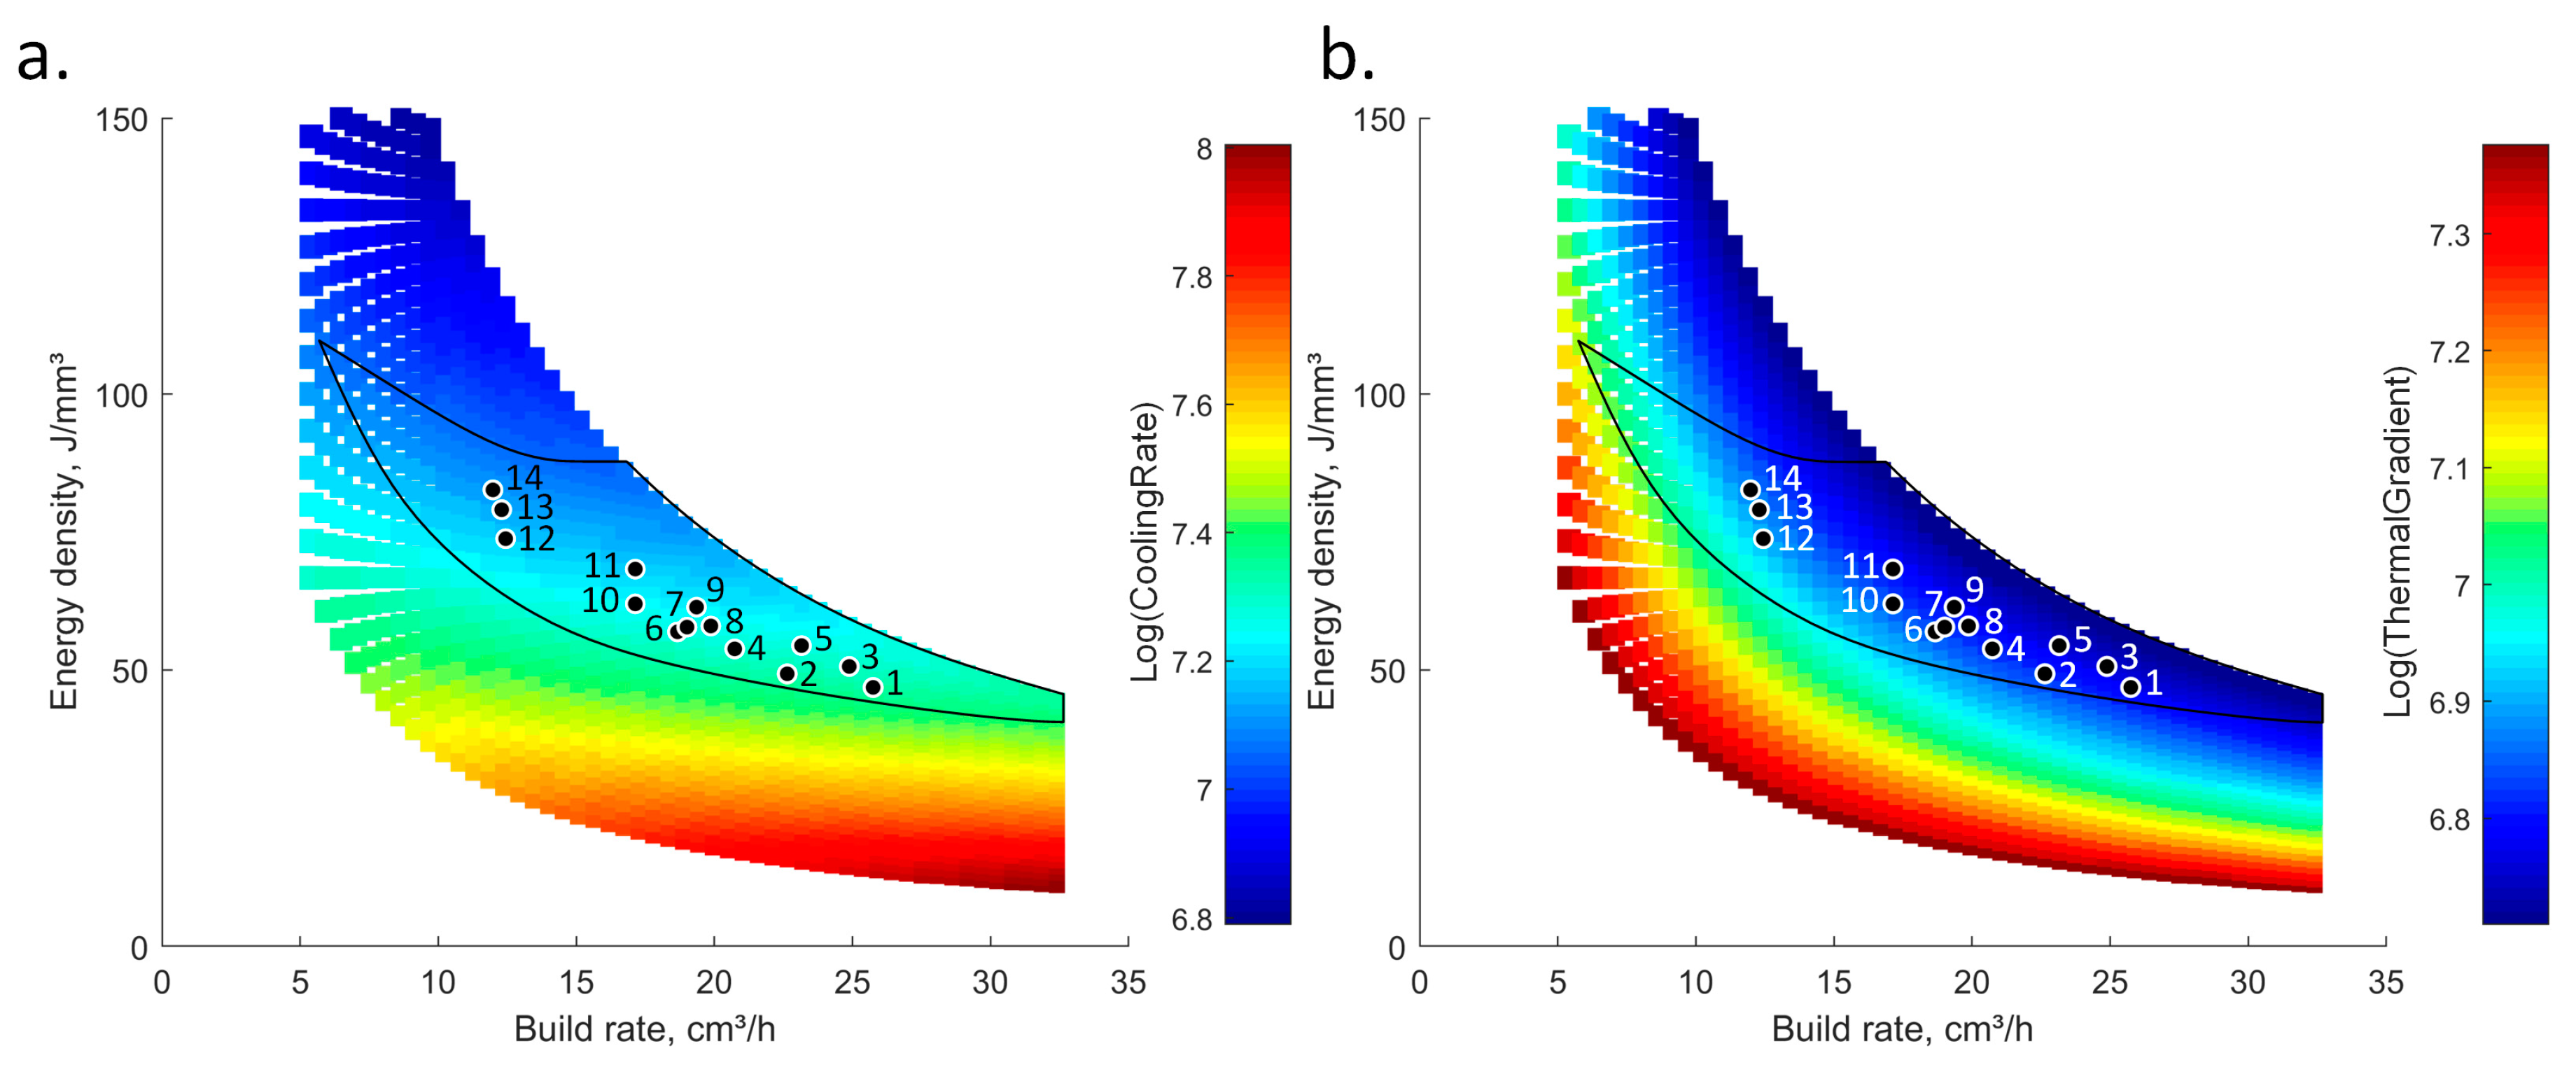
2.1. Cooling Rate (CR) and Thermal Gradient (TG) Calculations
2.2. Experimental Calibration of the Melt Pool Model
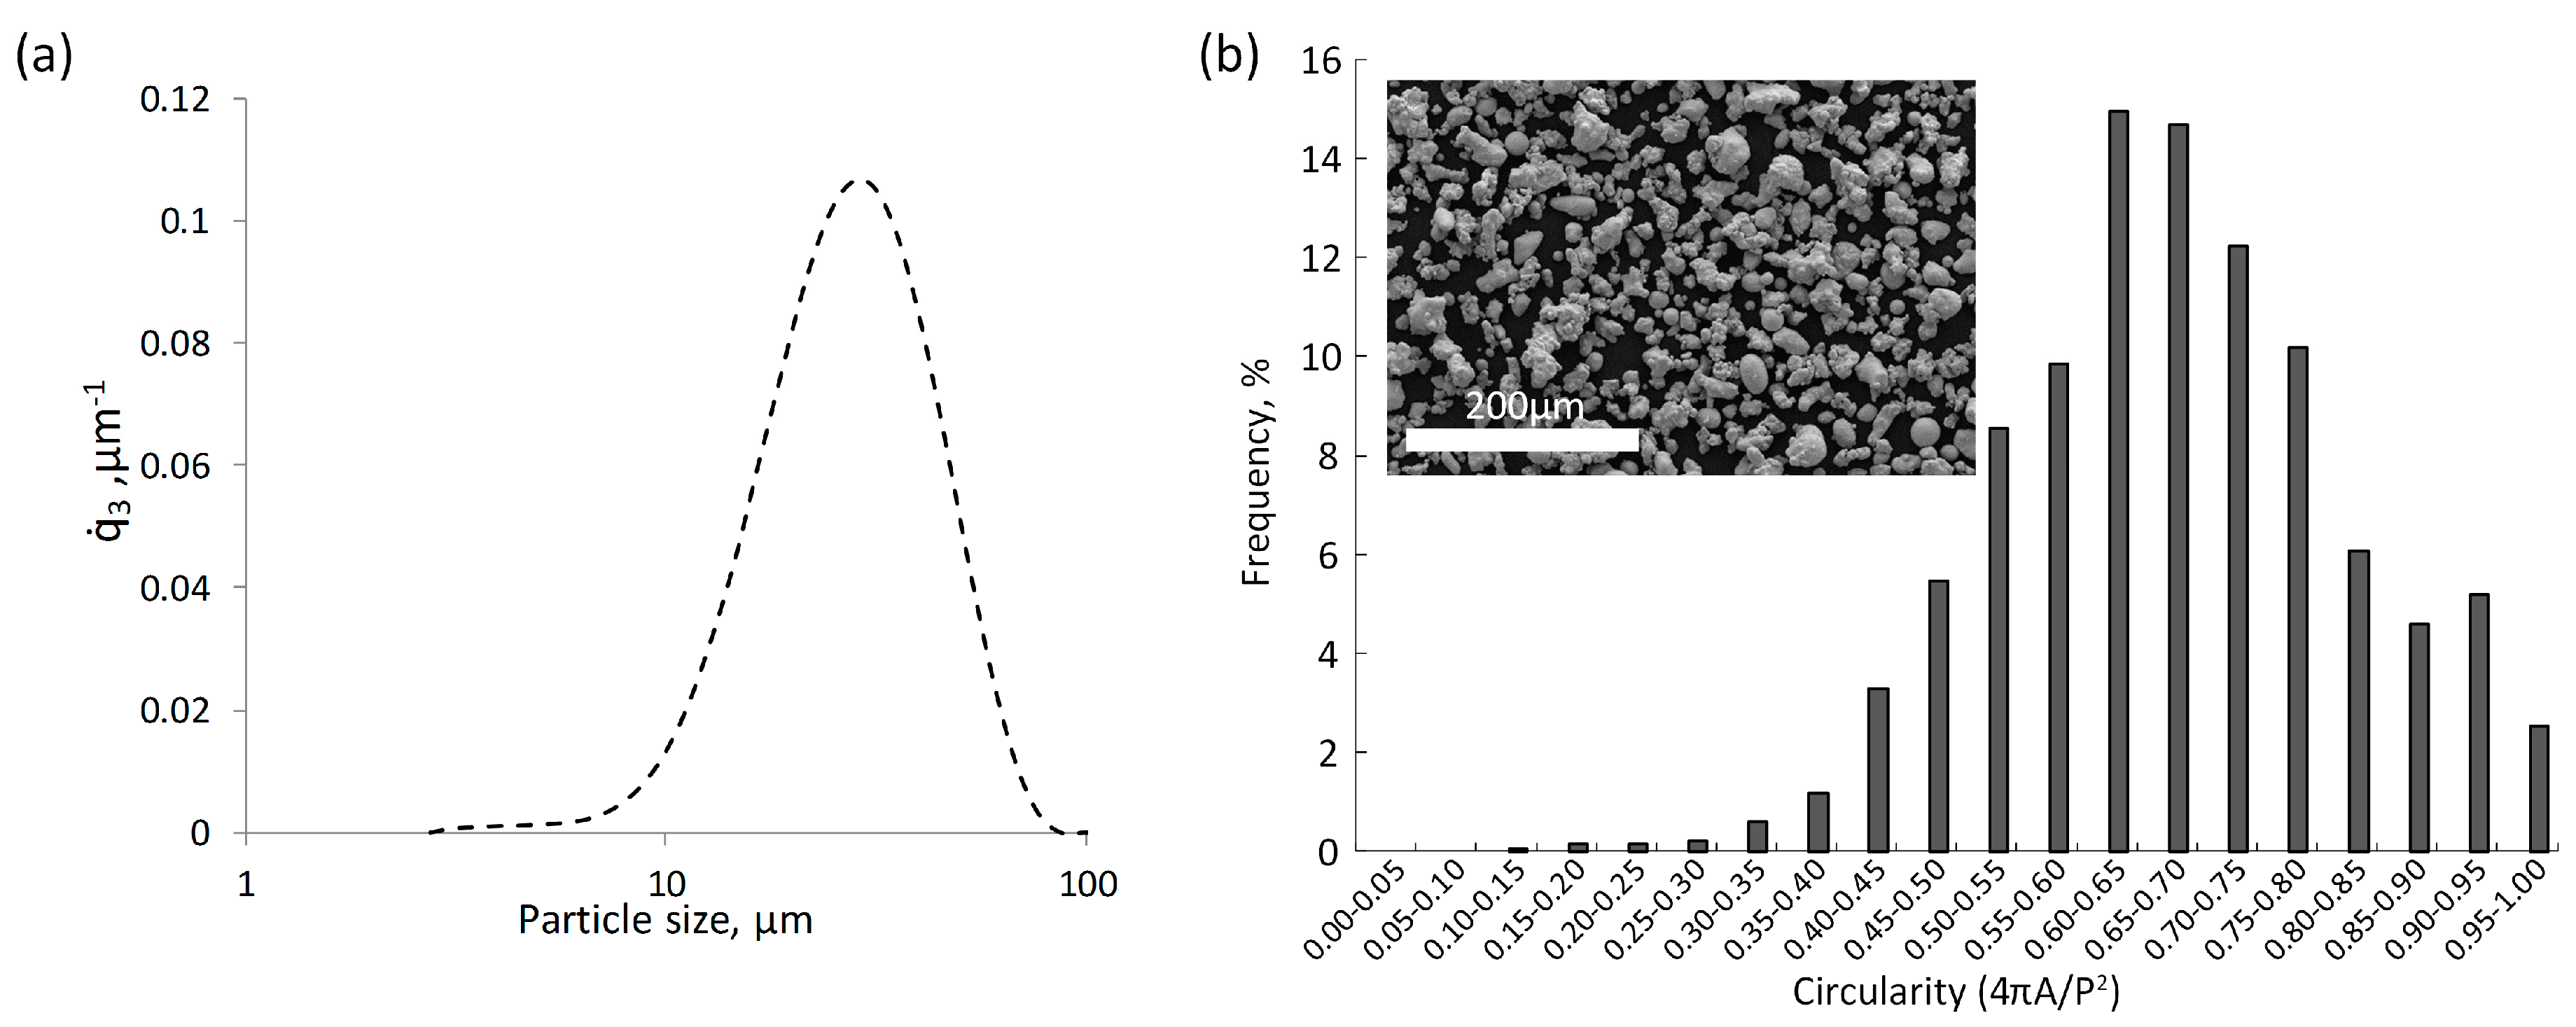
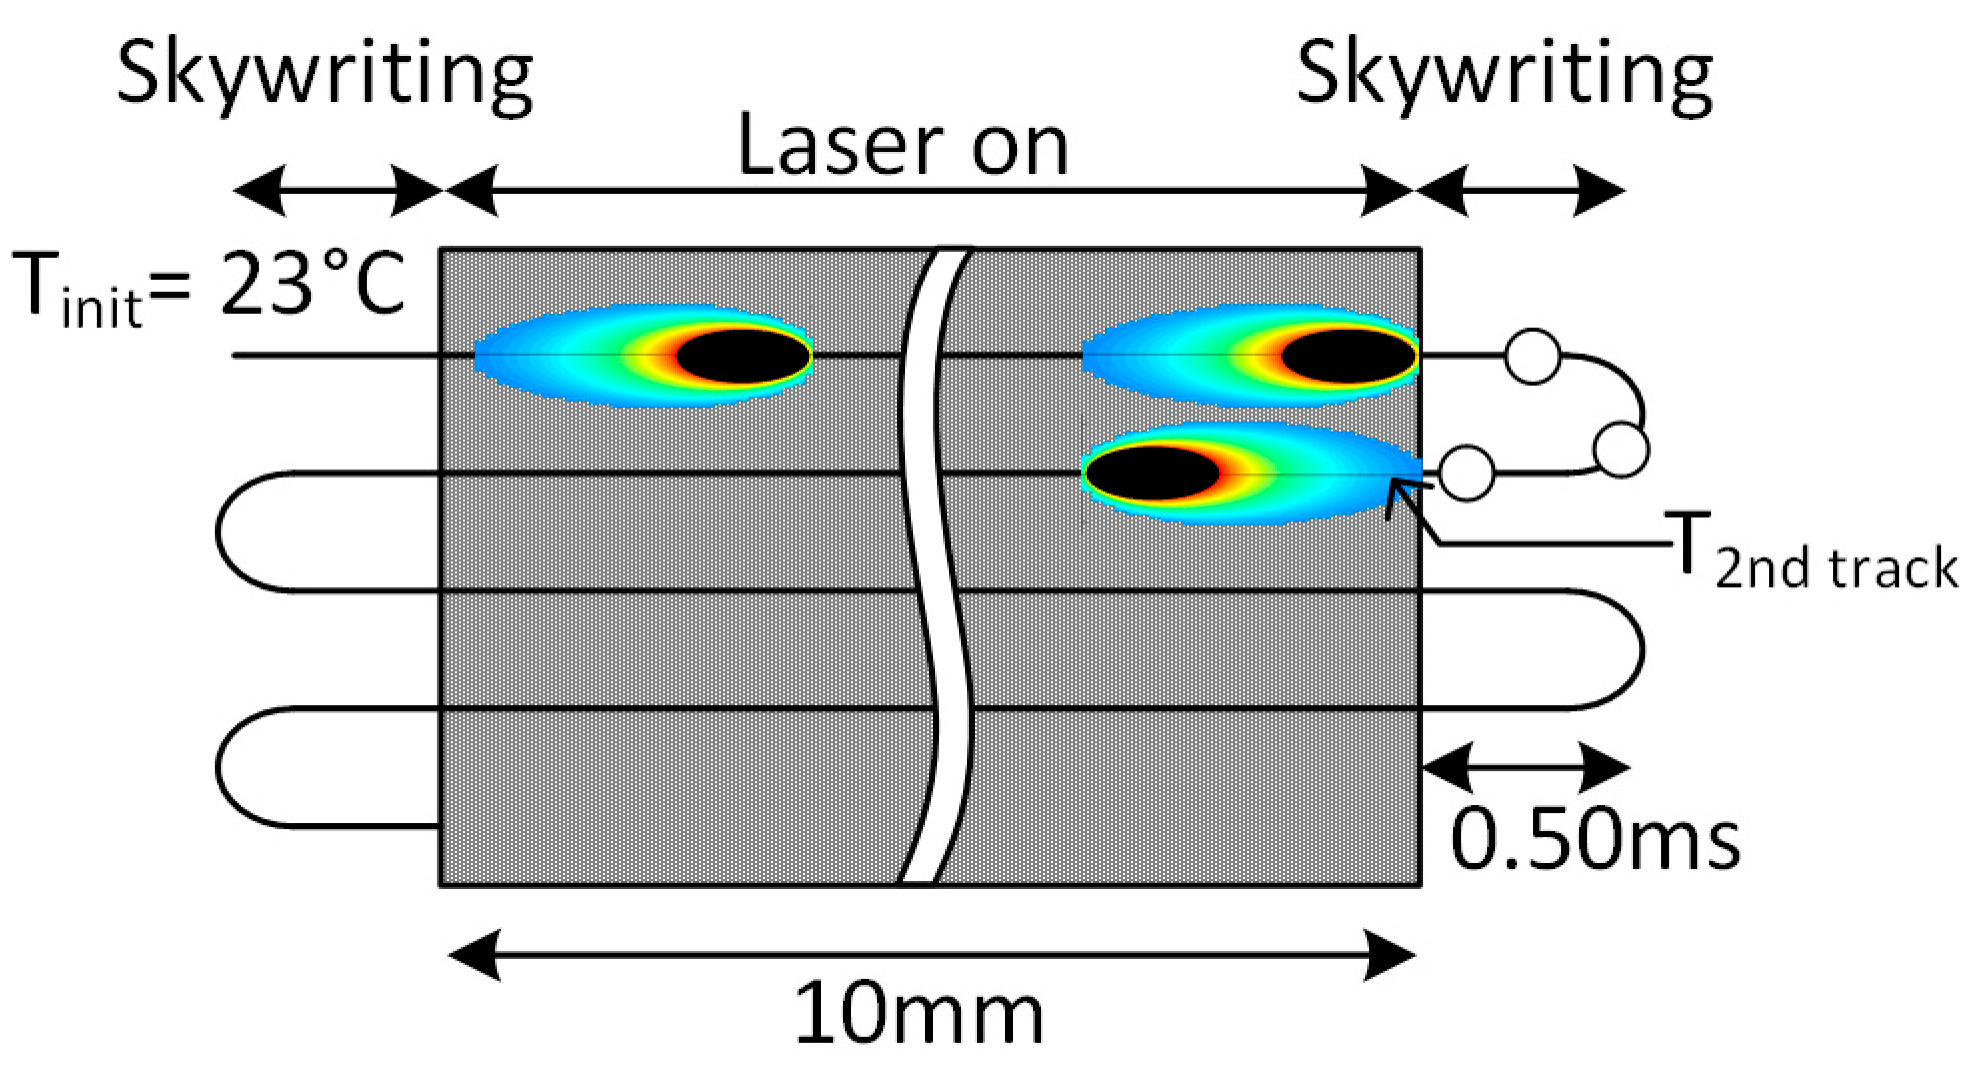
2.2.1. Materials, Equipment and Plan of Experiment
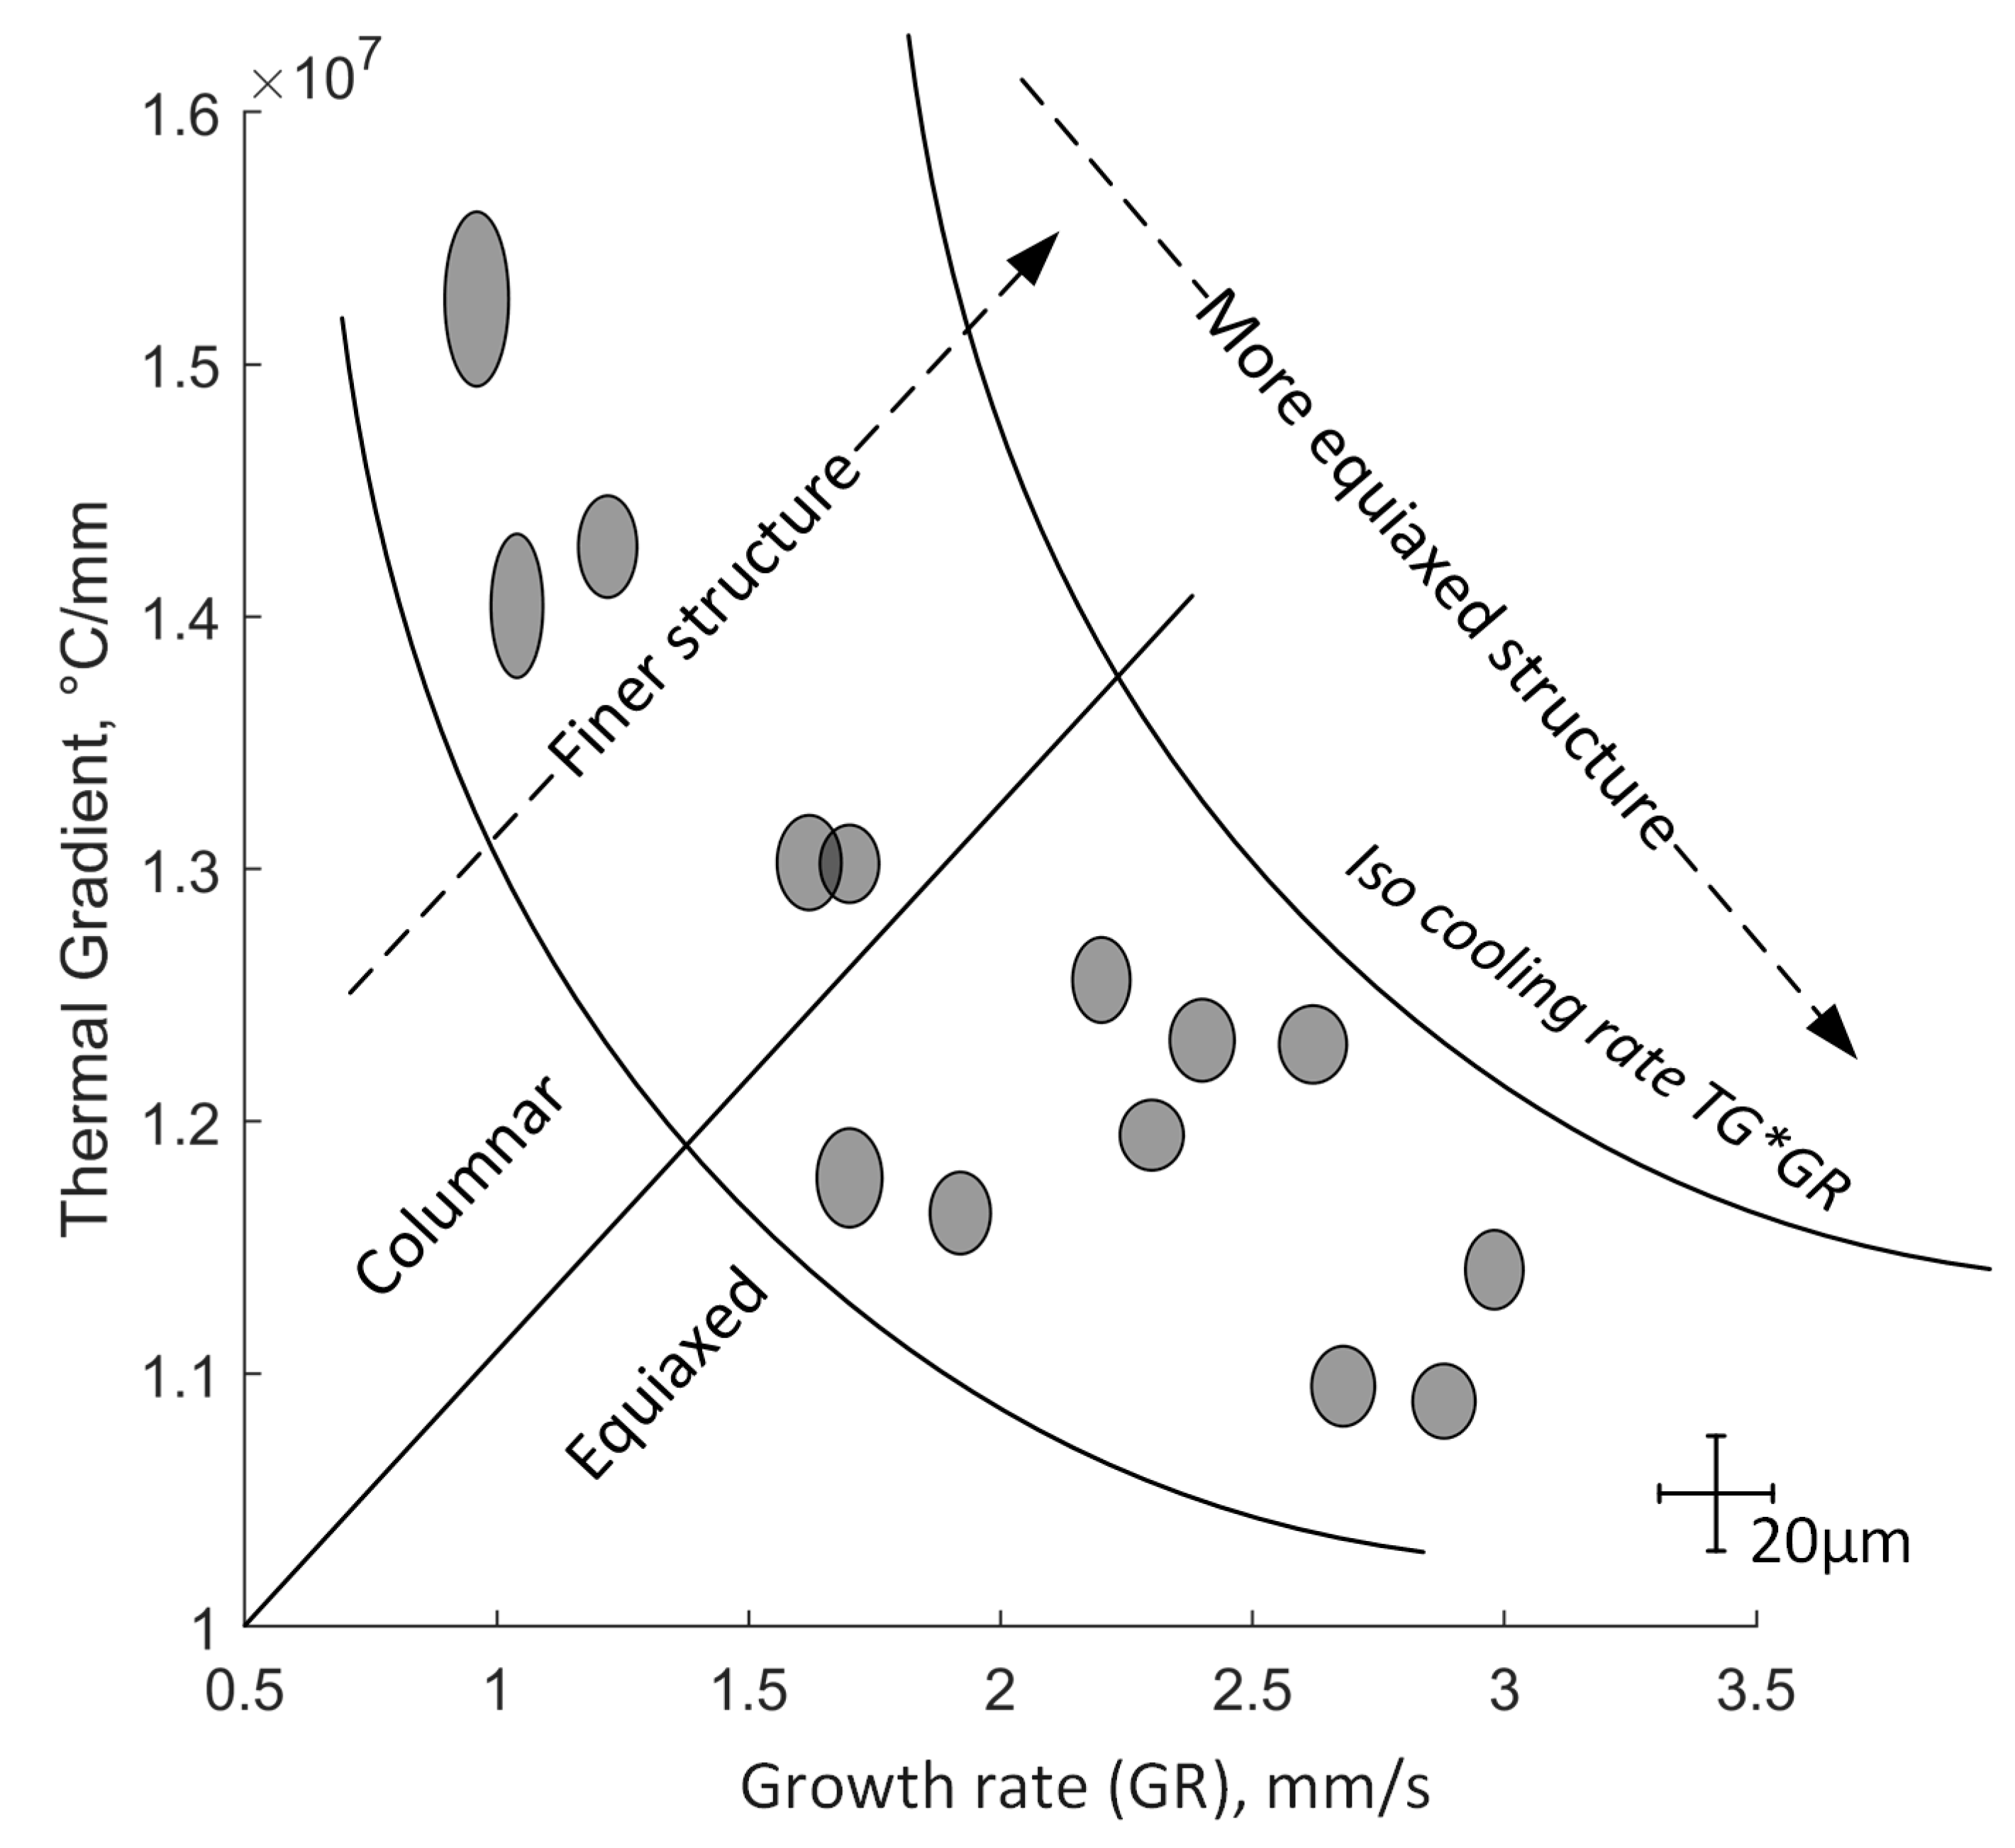
2.2.2. Solidification Cooling Rate and Thermal Gradient—Microstructure Relationship
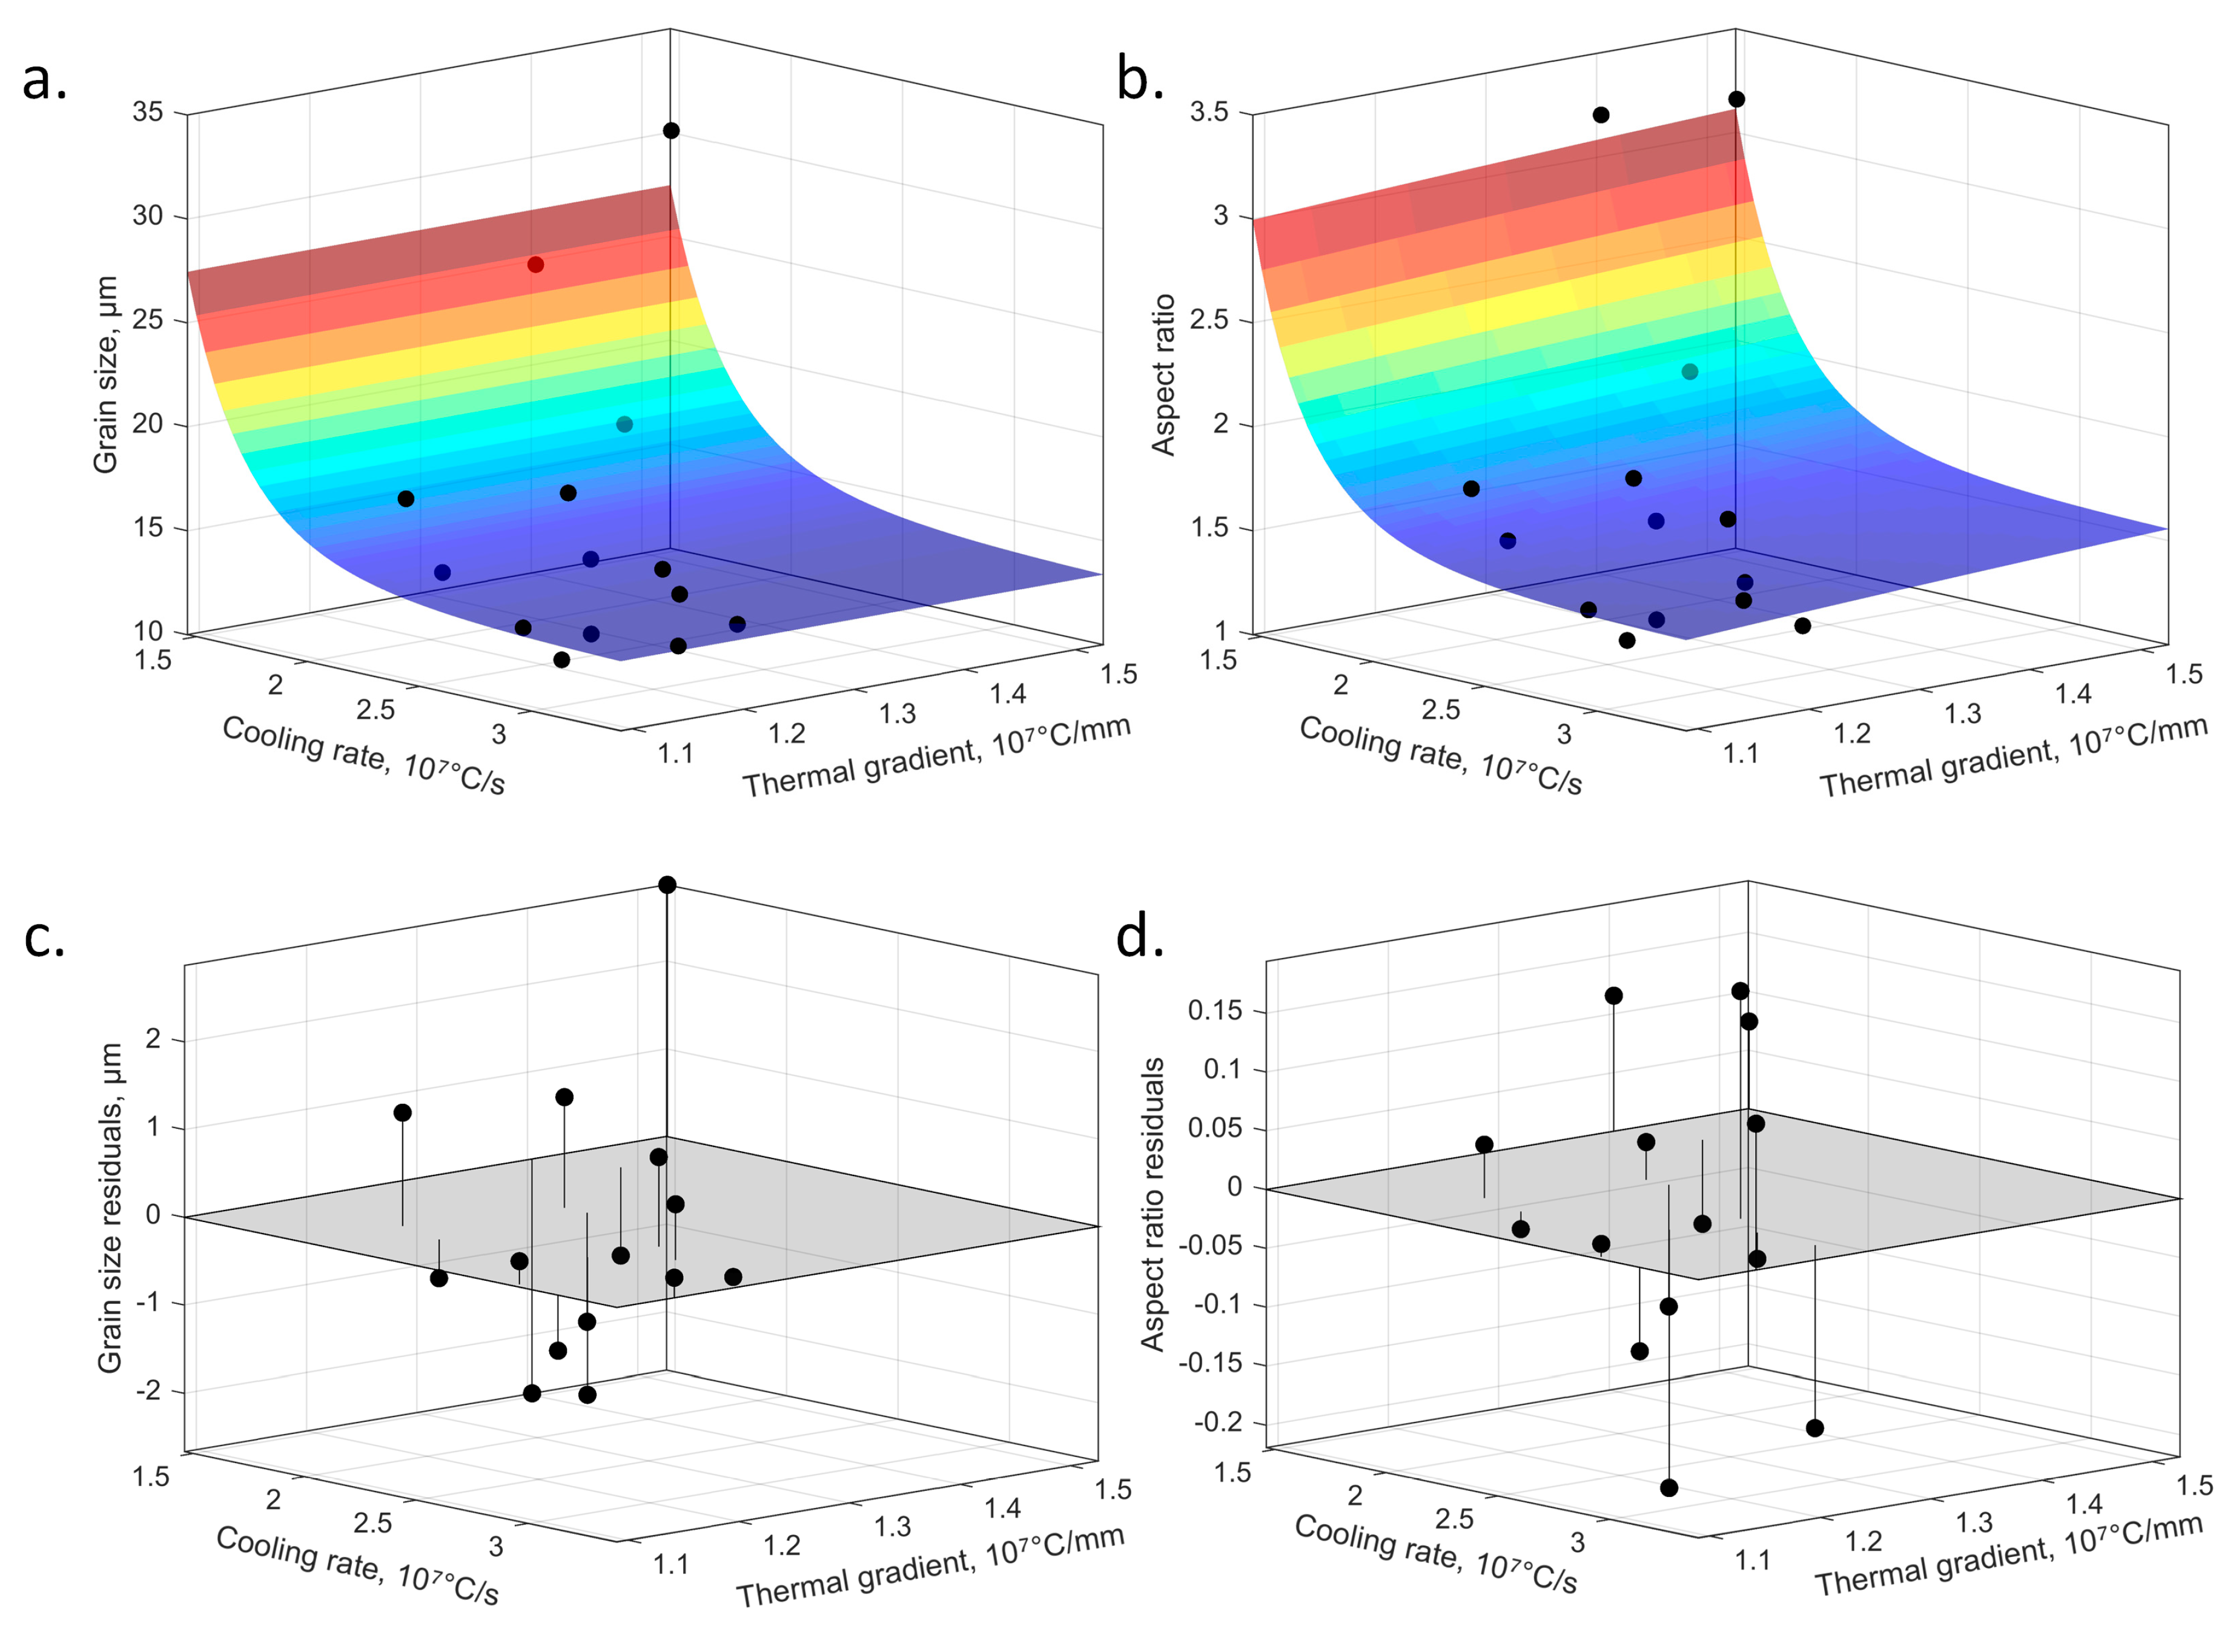
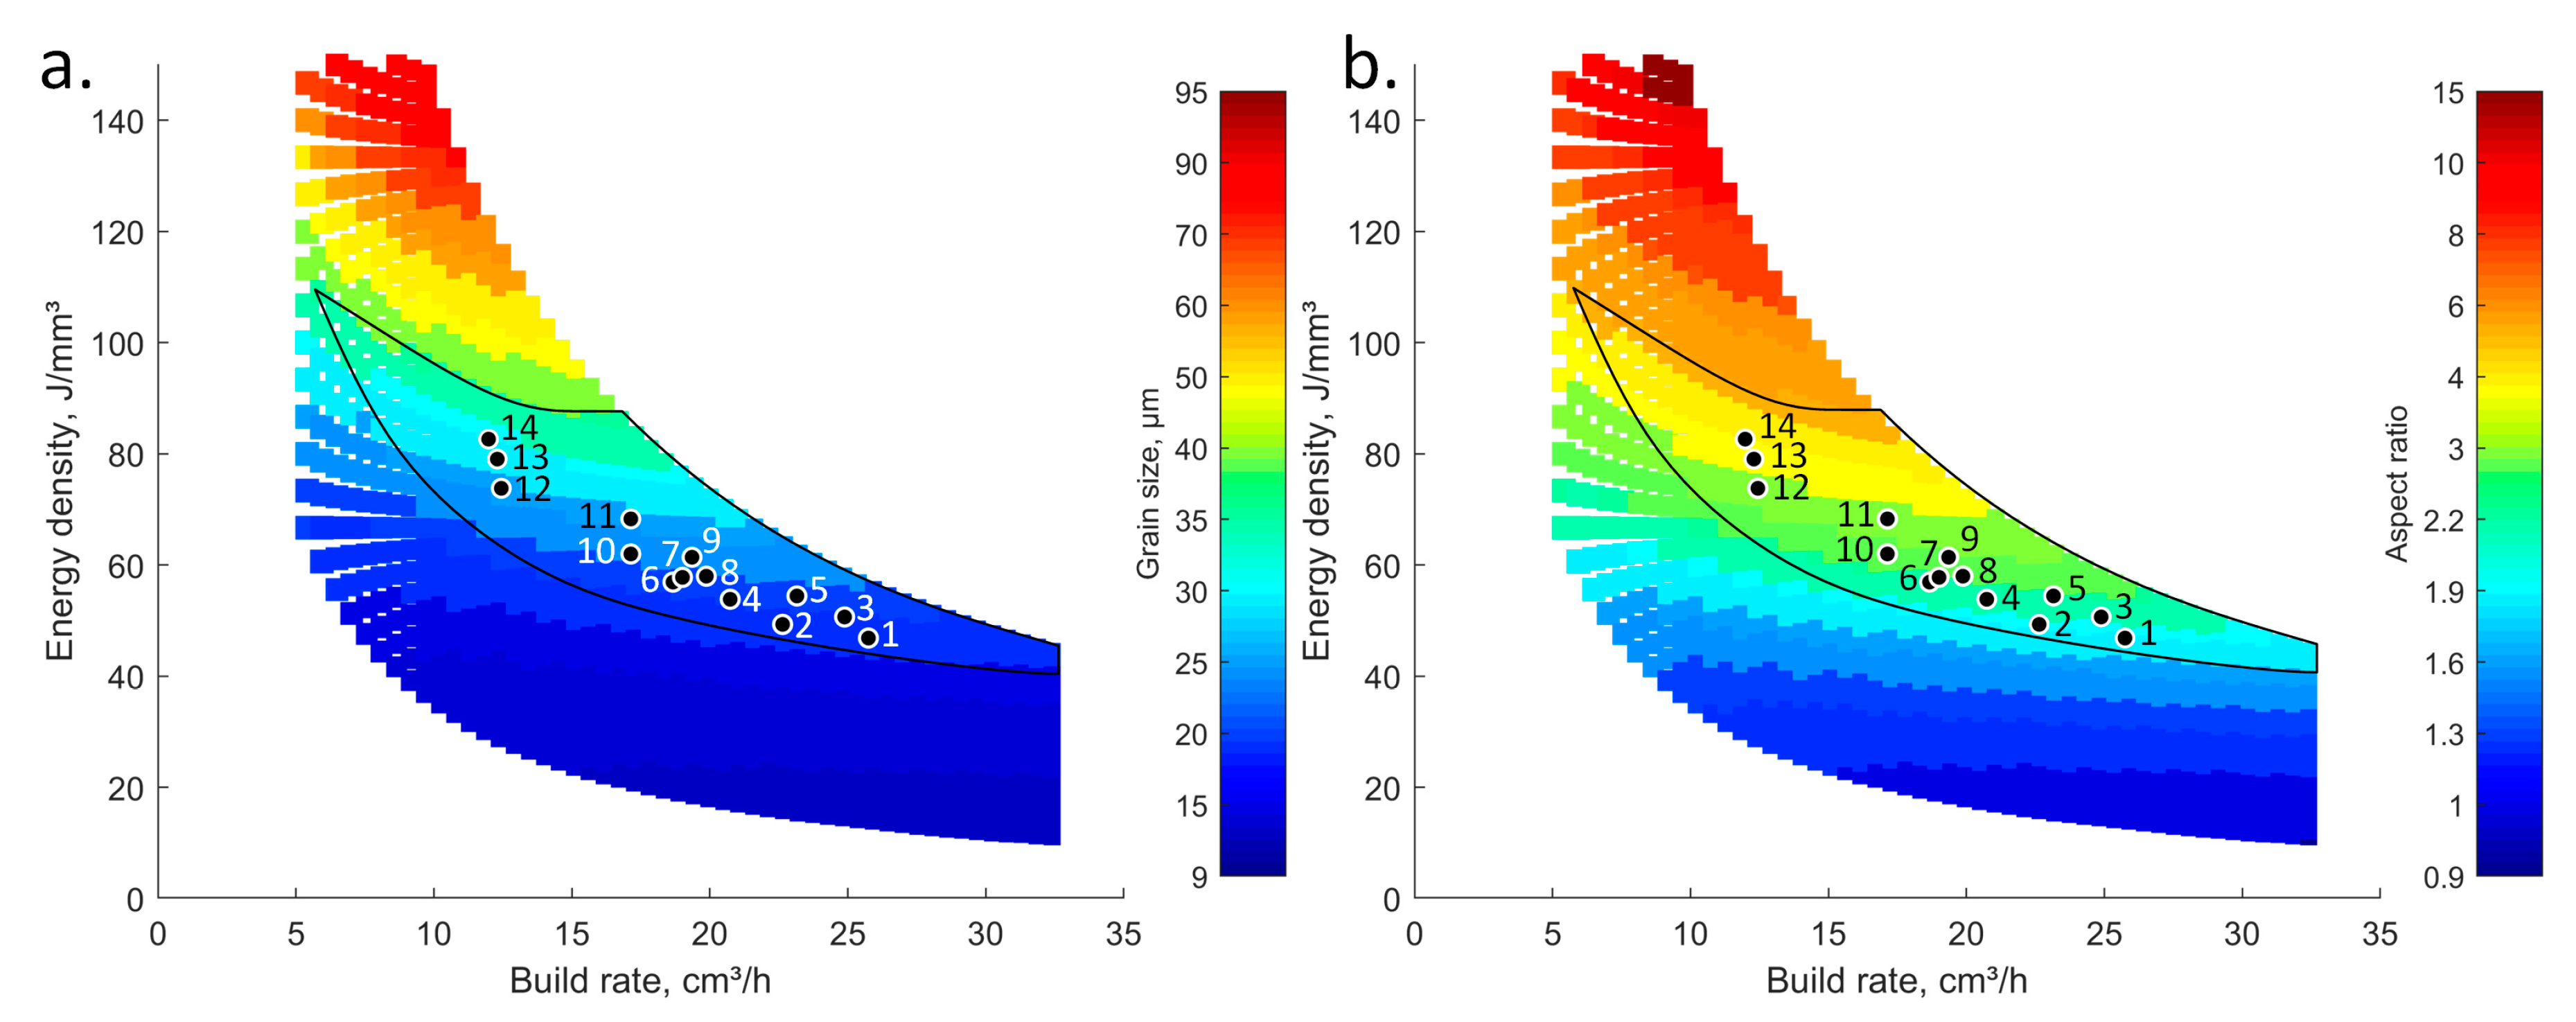
2.3. Grain Size (dxz) and Grain Aspect Ratio (GAR) Processing Maps
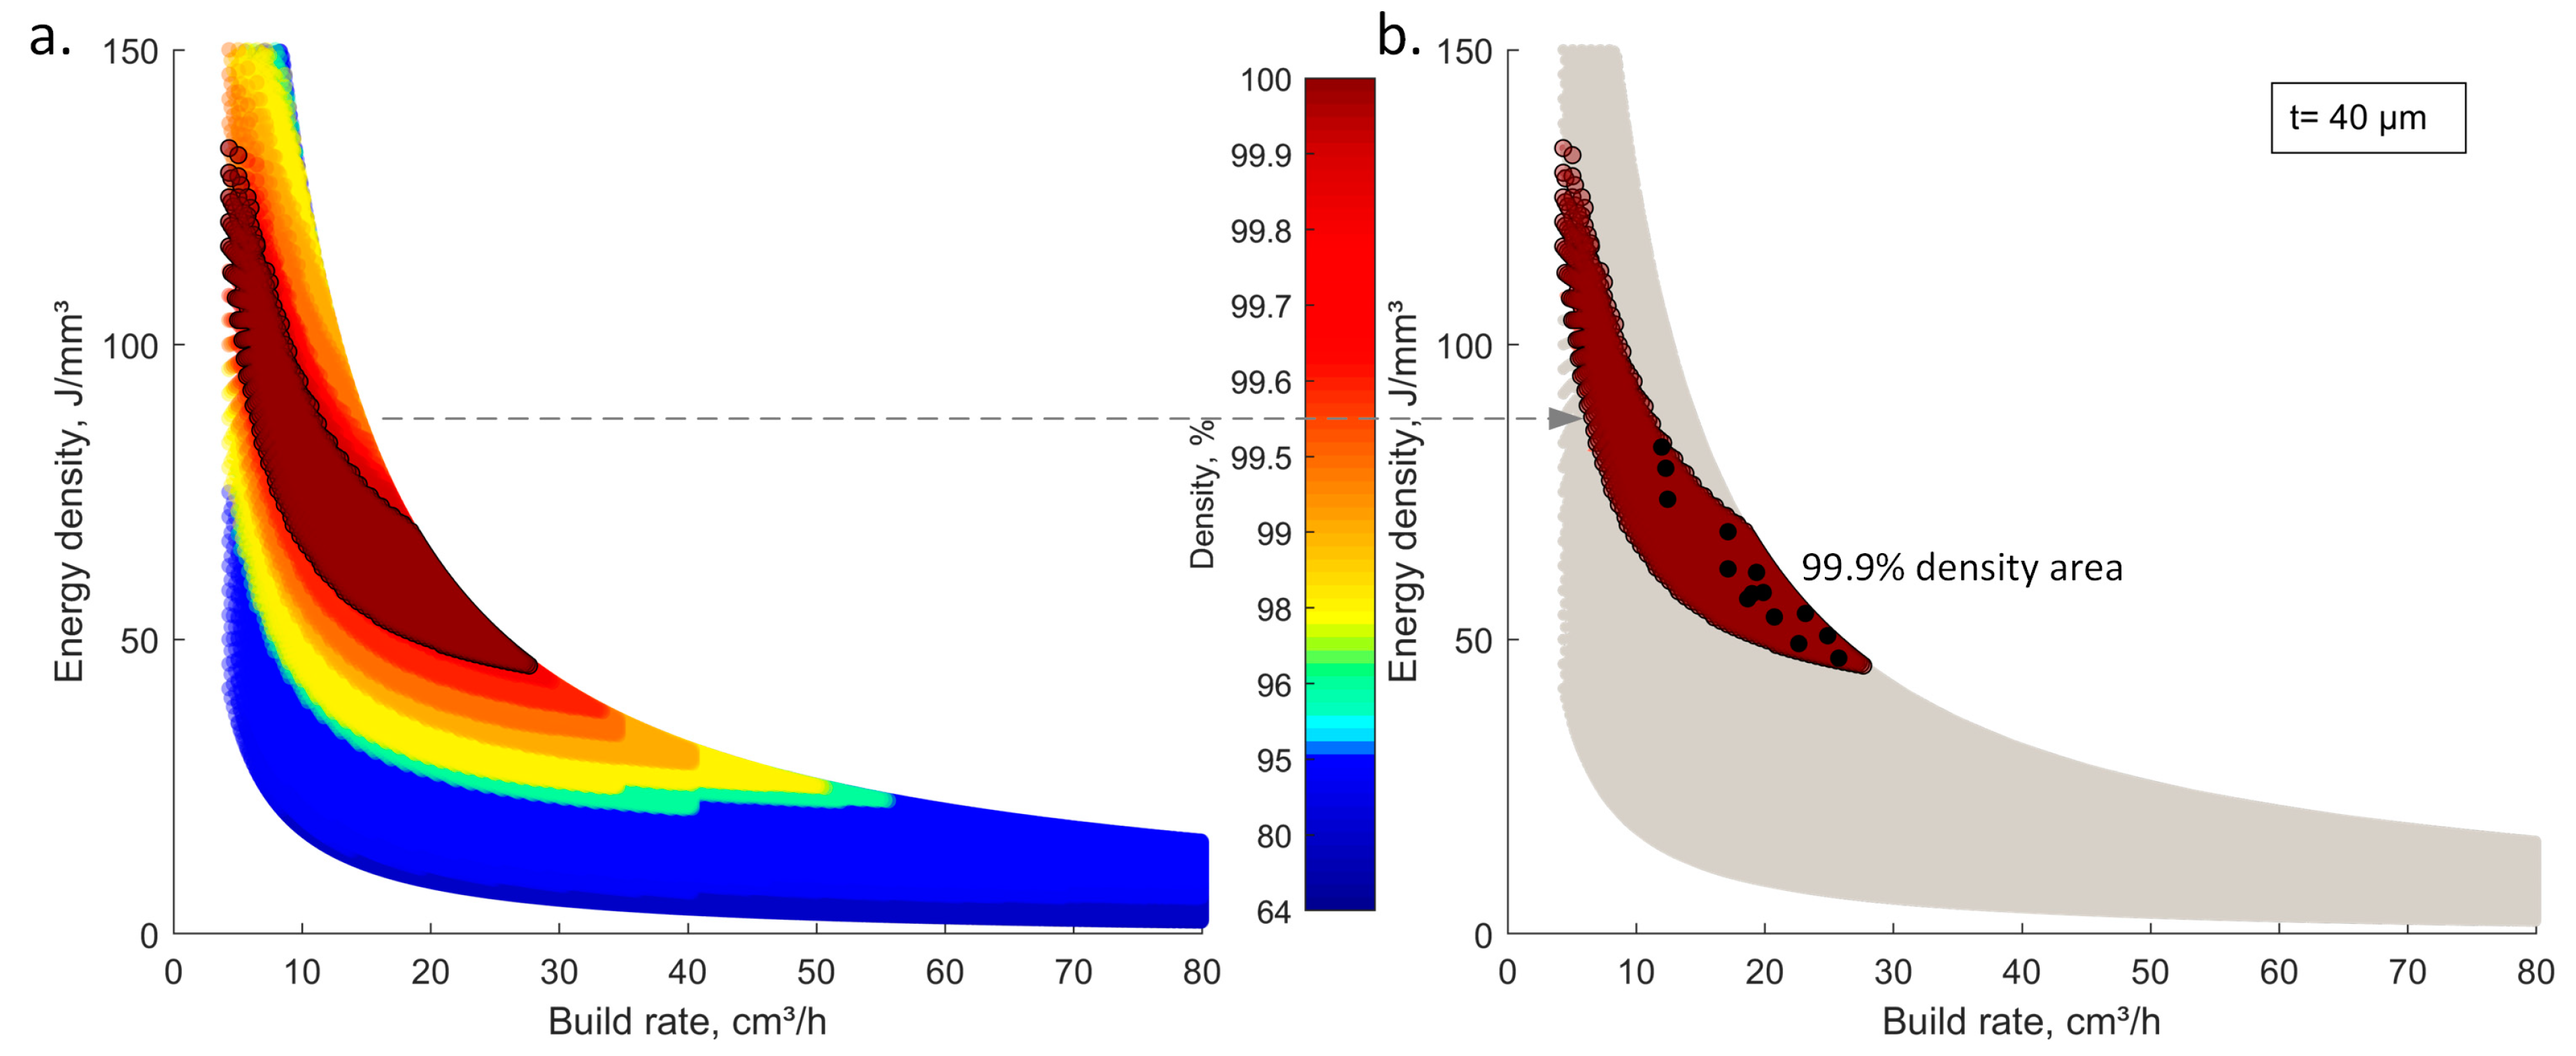
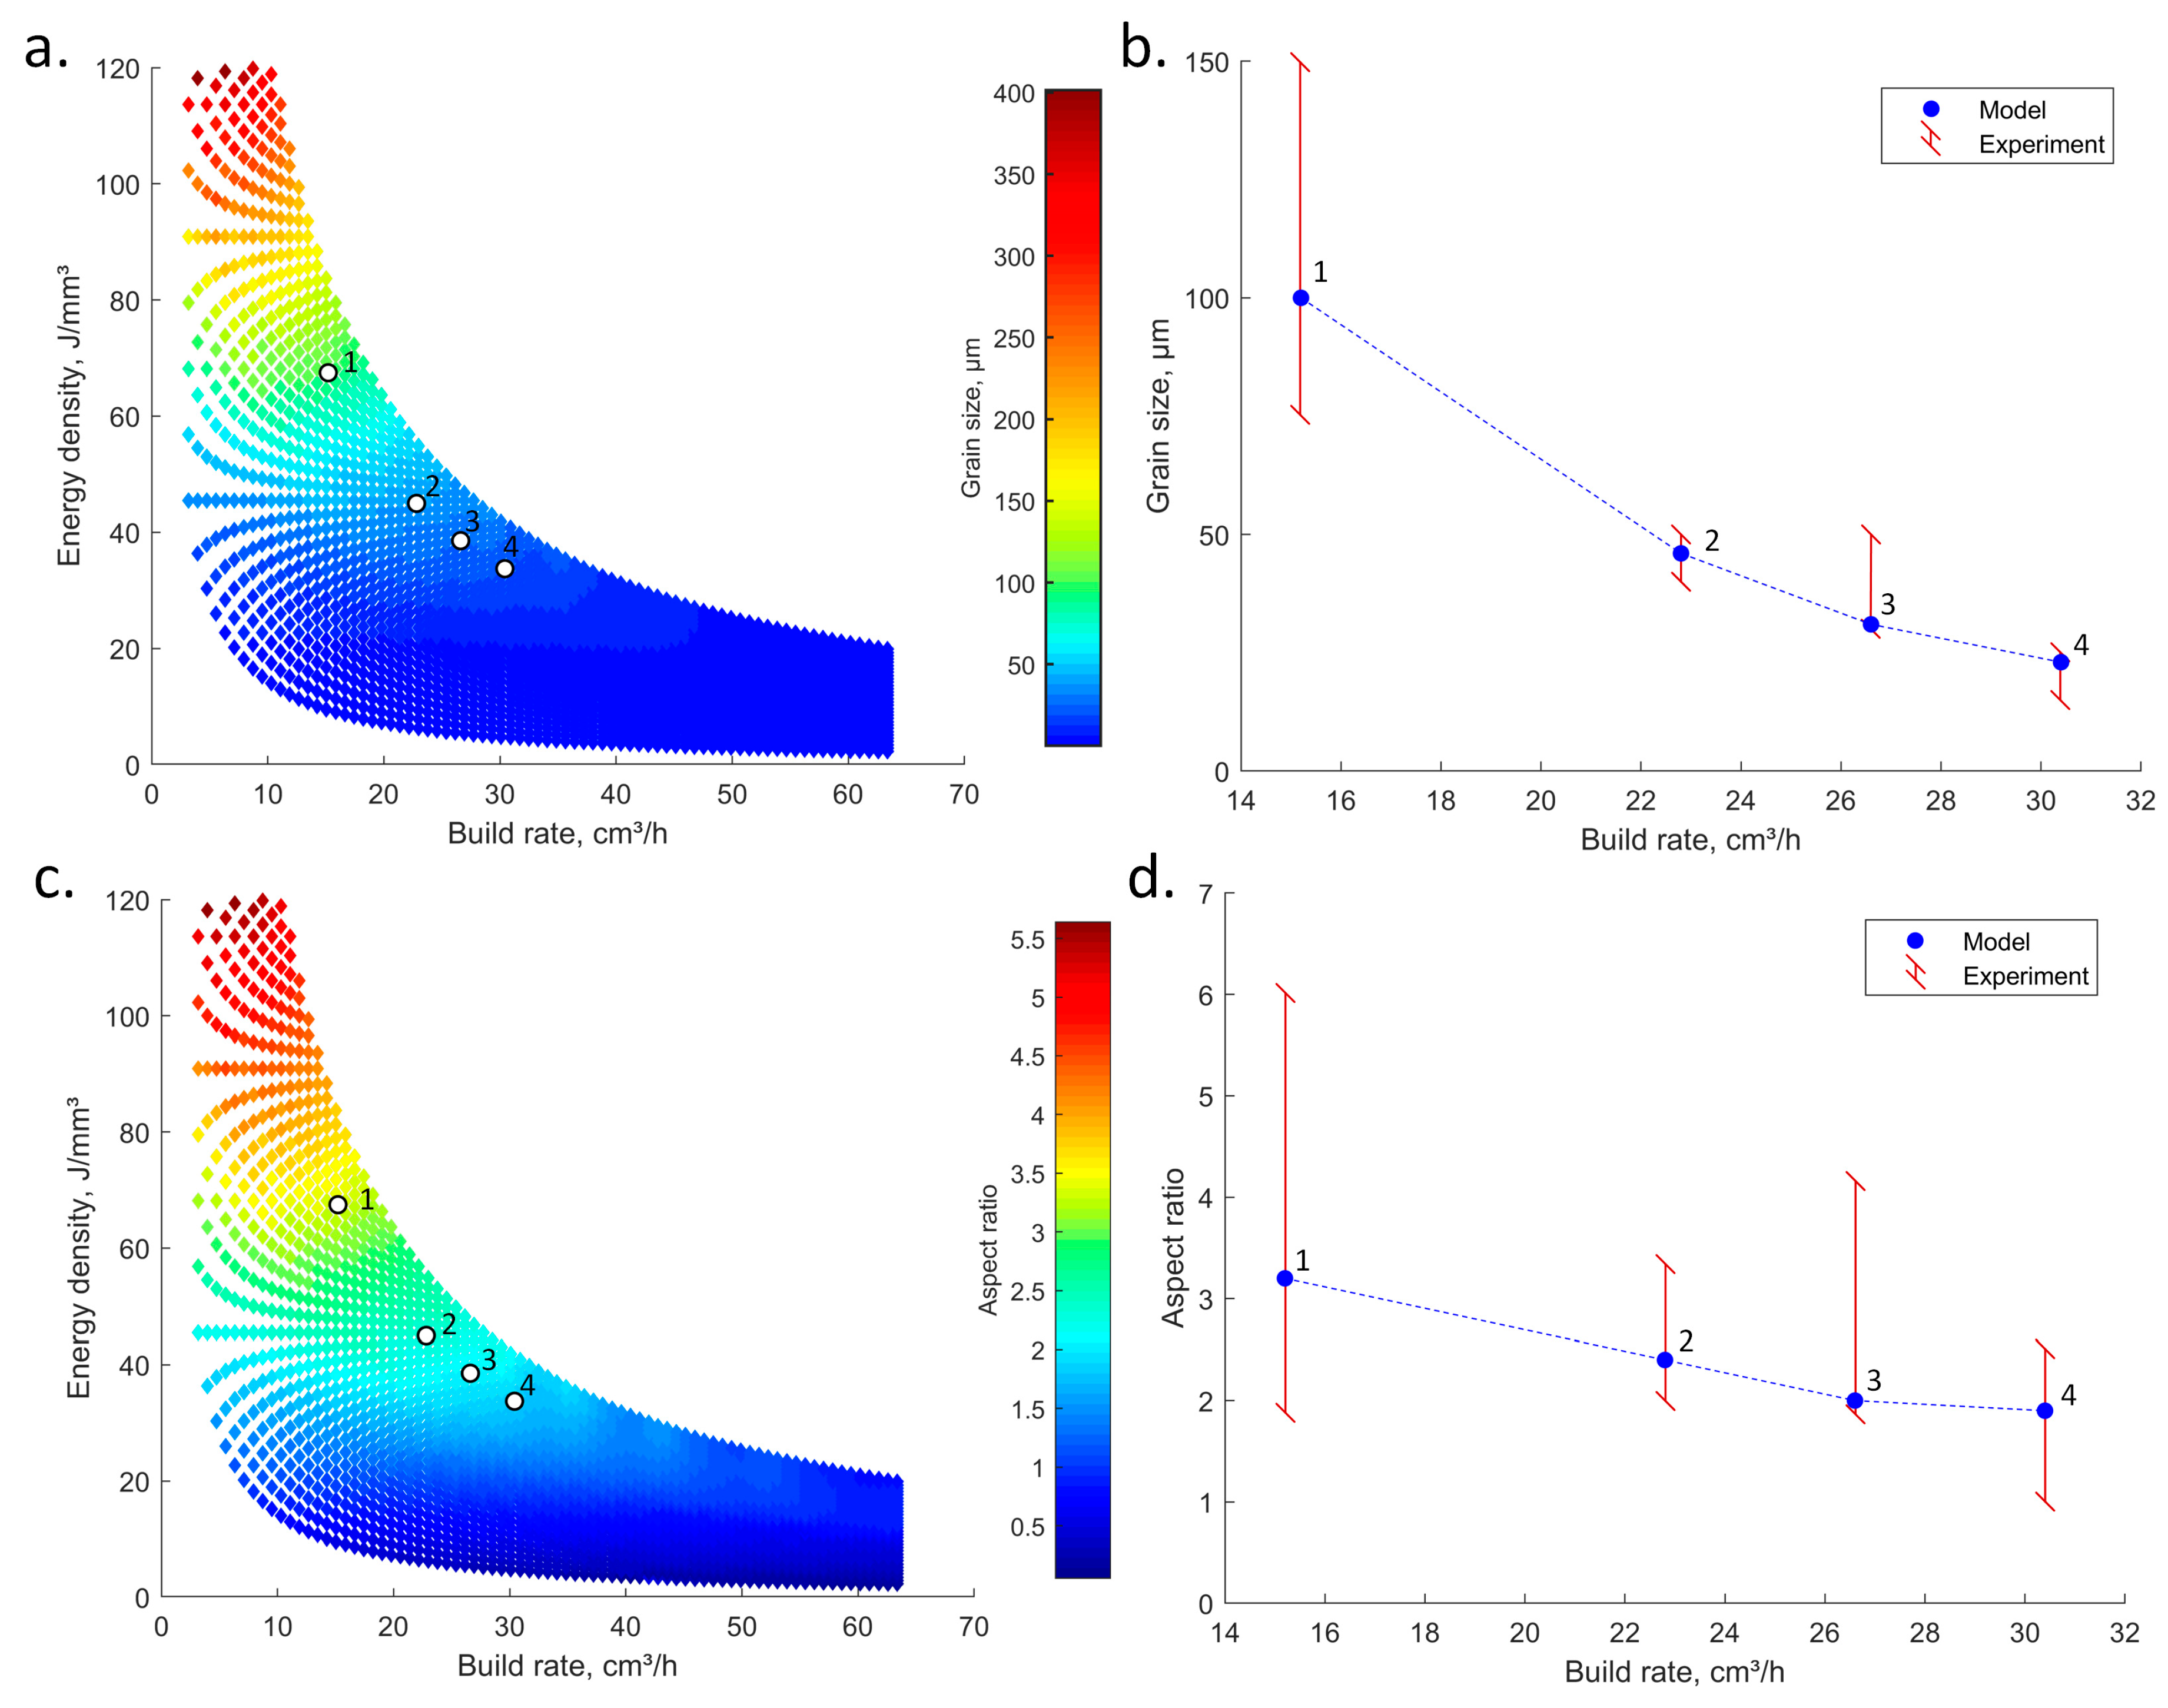
2.4. Validation Strategy and Results
3. Validation
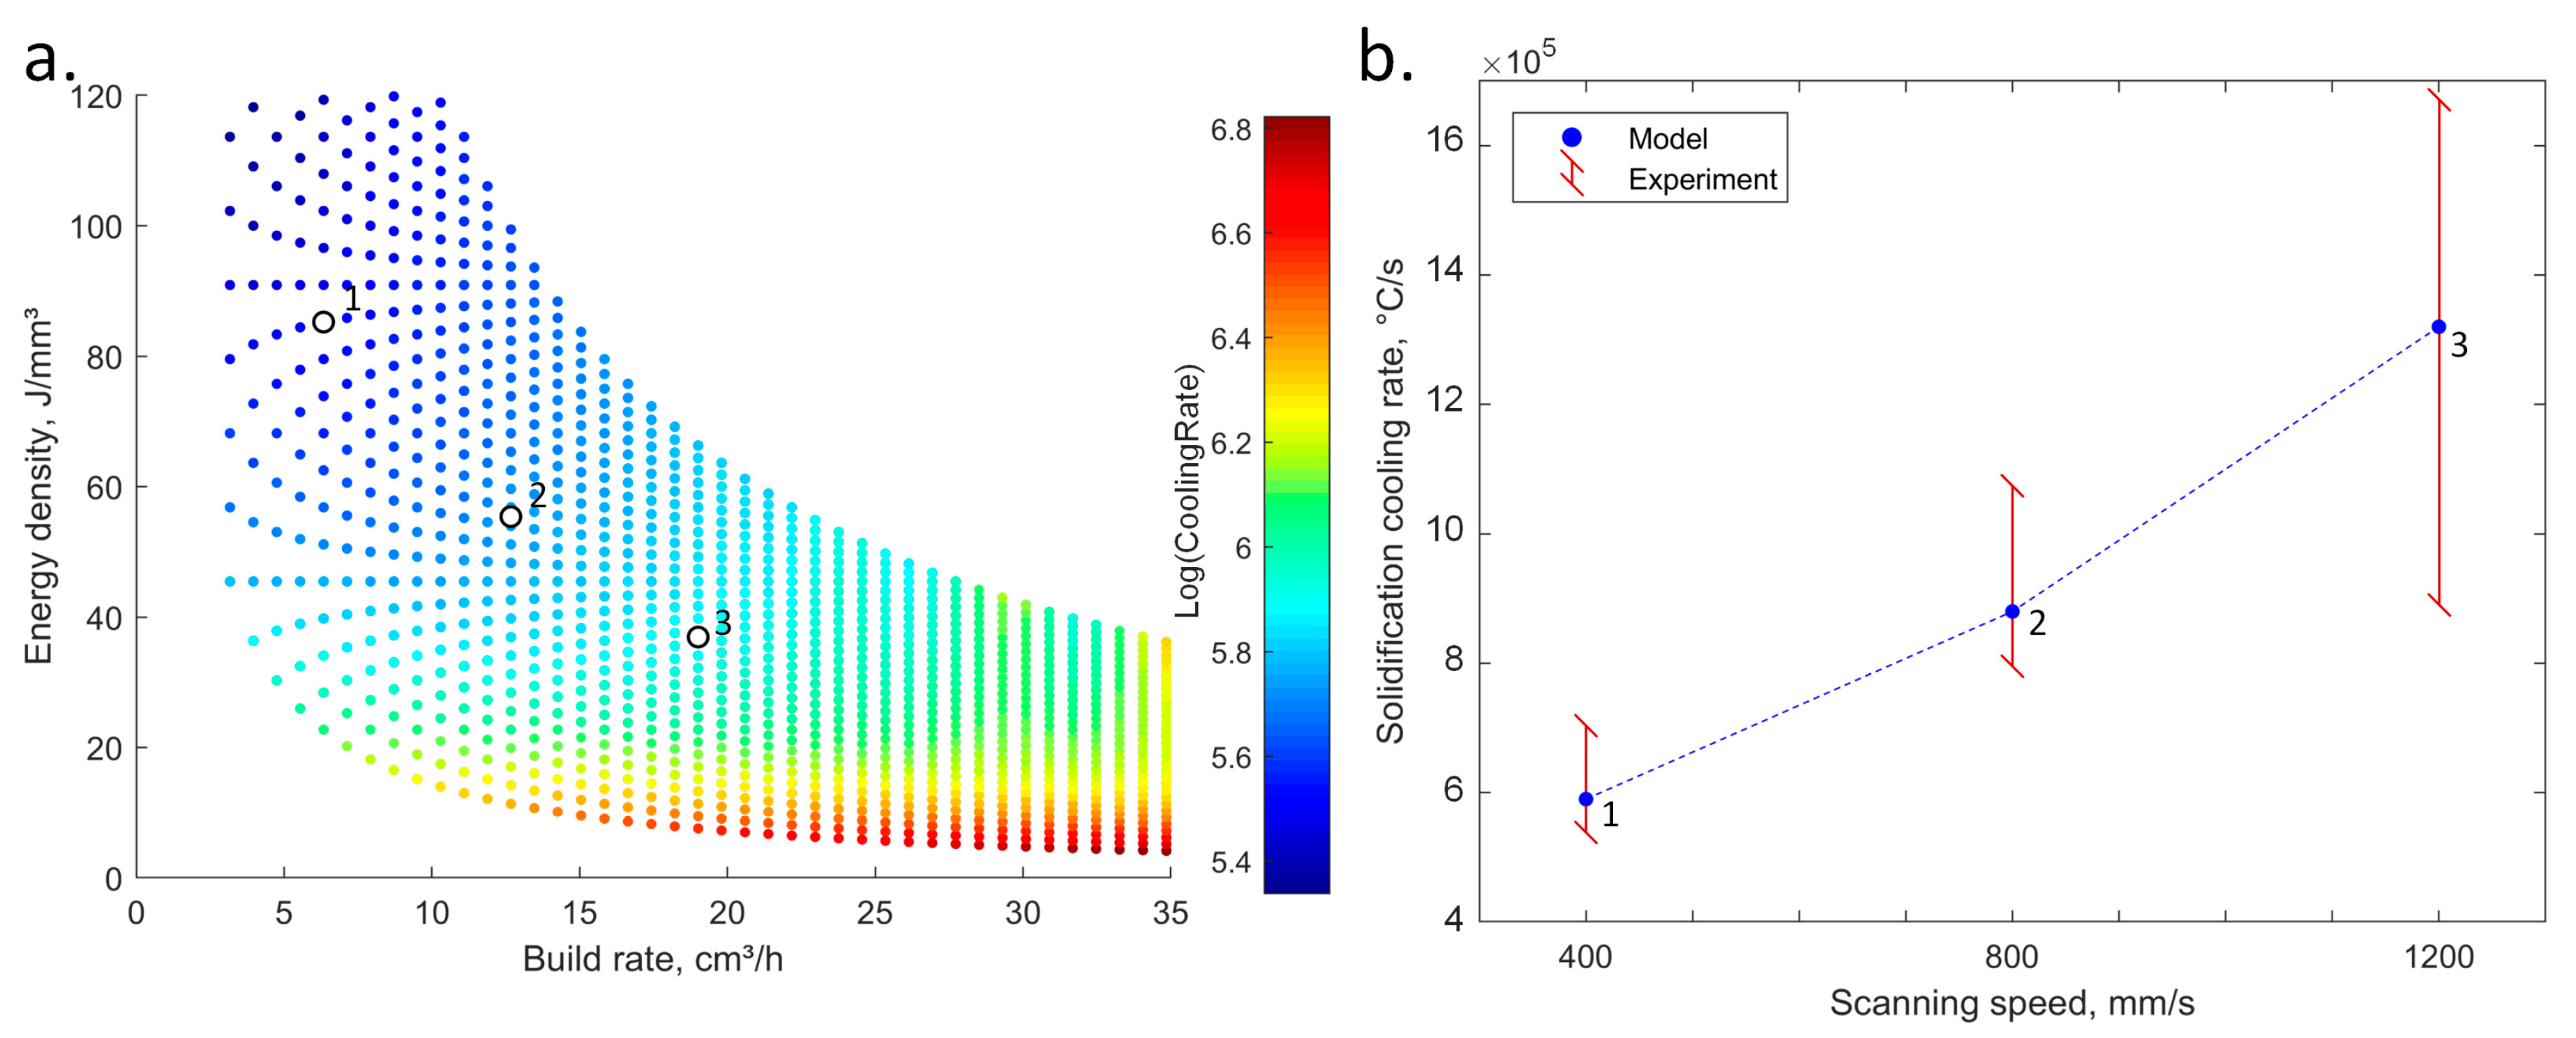
3.1. Cooling Rate Validation
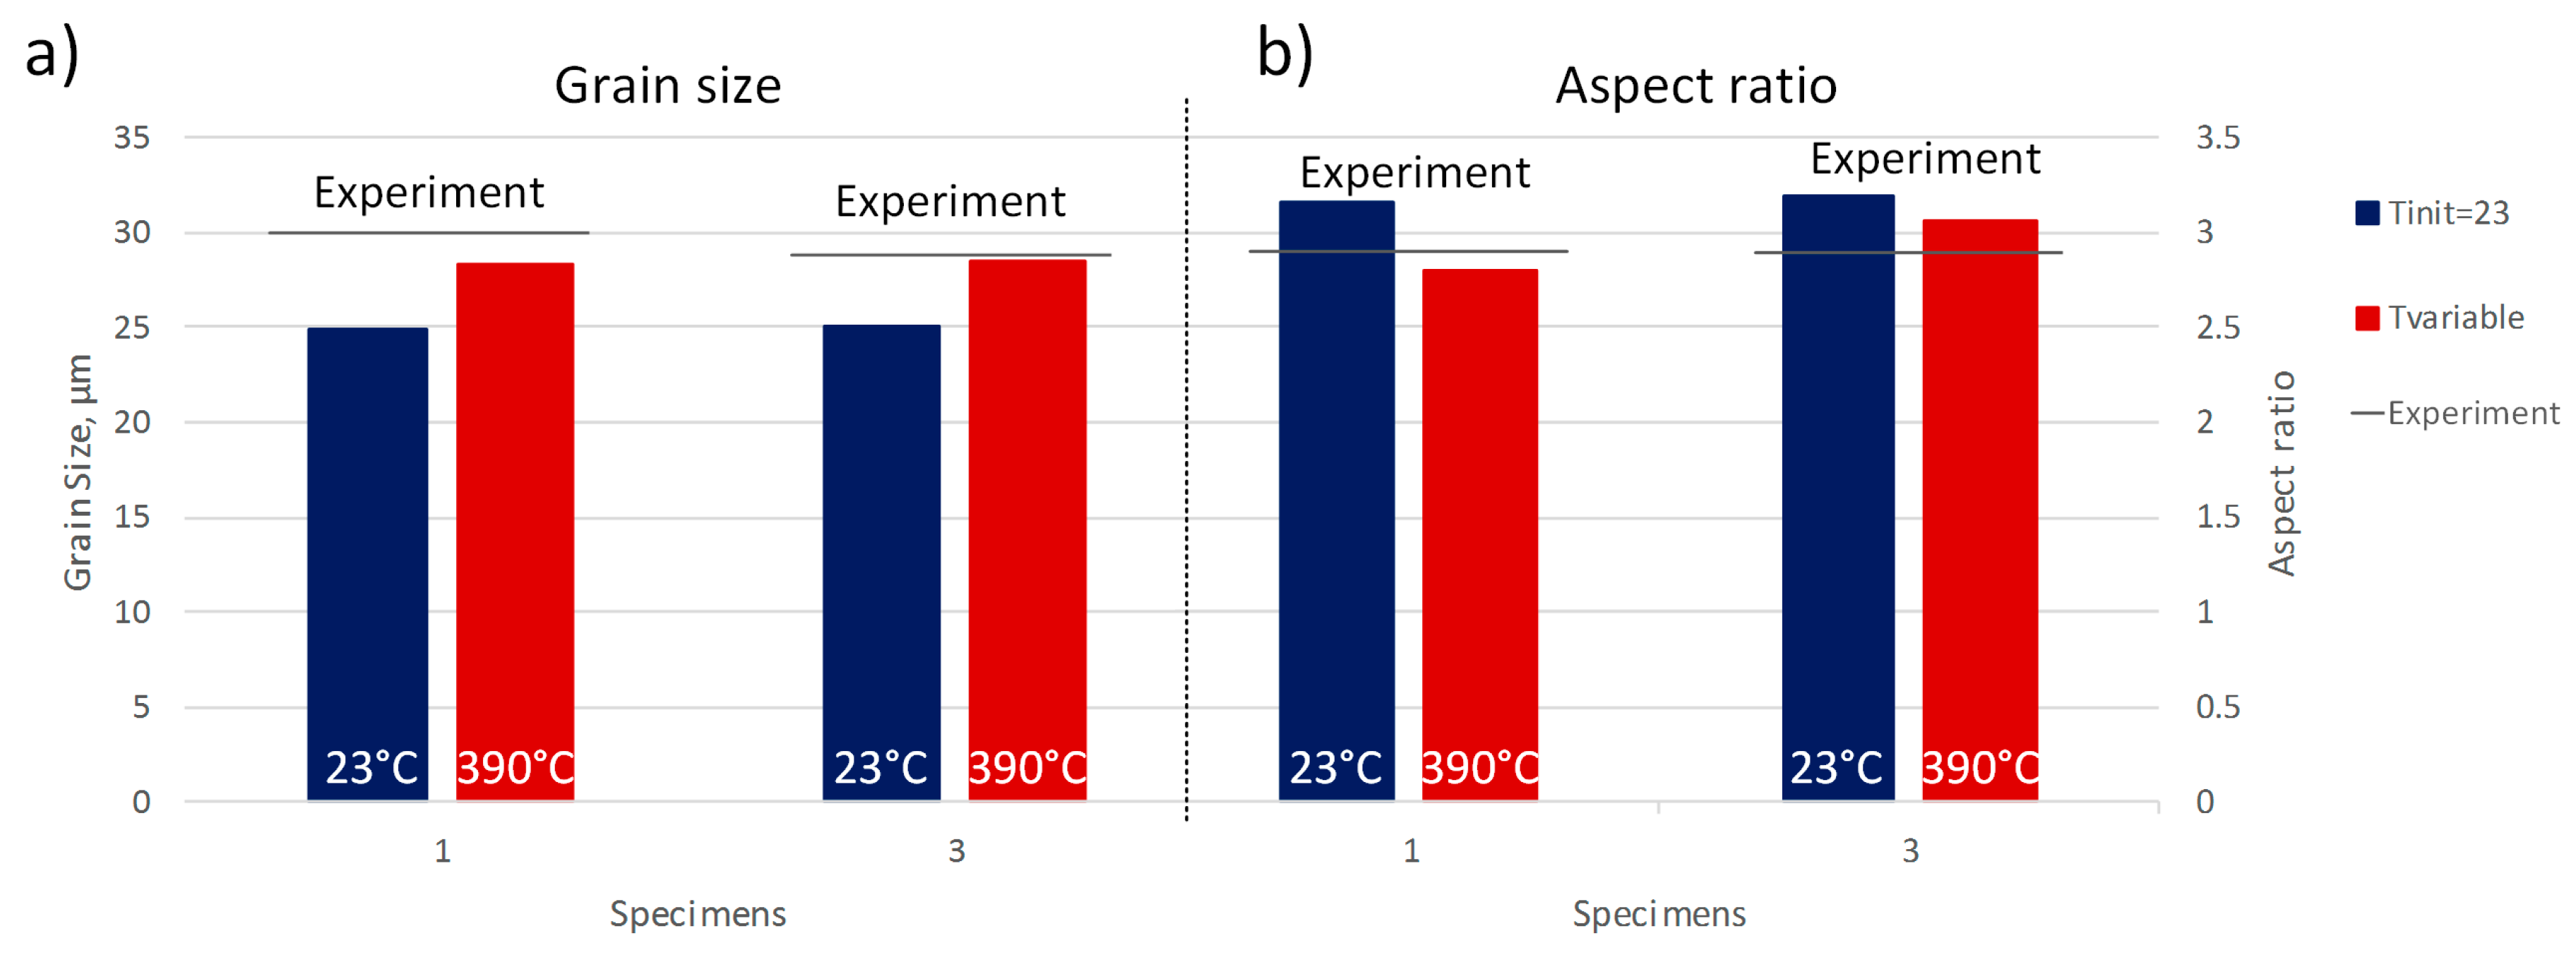
3.2. Grain size and Grain Aspect Ratio Validation
4. Discussion
- (a)
- This model allows the simulation of thousands of printing parameter sets in a time-efficient way.
- (b)
- It allows easy variations of the major LPBF input parameters.
- (c)
Additional Note
5. Conclusions
Author Contributions
Funding
Acknowledgments
Conflicts of Interest
References
- ASTM International. Standard Terminology for Additive Manufacturing Technologies; ASTM International: Geauga County, OH, USA, 2012. [Google Scholar]
- Sames, W.J.; List, F.A.; Pannala, S.; Dehoff, R.R.; Babu, S.S. The metallurgy and processing science of metal additive manufacturing. Int. Mater. Rev. 2016, 61, 315–360. [Google Scholar] [CrossRef]
- Francois, M.M.; Sun, A.; King, W.E.; Henson, N.J.; Tourret, D.; Bronkhorst, C.A.; Carlson, N.N.; Newman, C.K.; Haut, T.S.; Bakosi, J.; et al. Modeling of additive mafnufacturing processes for metals: Challenges and opportunities. Curr. Opin. Solid State Mater. Sci. 2017, 21. [Google Scholar] [CrossRef]
- Acharya, R.; Sharon, J.A.; Staroselsky, A. Prediction of microstructure in laser powder bed fusion process. Acta Mater. 2017, 124, 360–371. [Google Scholar] [CrossRef]
- Price Waterhouse Coopers. 3D Printing and the New Shape of Industrial Manufacturing; Pricewaterhouse Coopers LLP: London, UK, 2014. [Google Scholar]
- Ghosh, S. Predictive modeling of solidification during laser additive manufacturing of nickel superalloys: Recent developments, future directions. Mater. Res. Express 2018, 5, 012001. [Google Scholar] [CrossRef] [Green Version]
- Yadroitsau, I. Direct manufacturing of 3D objects by selective laser melting of metal powders. Ph.D. Thesis, ENISE, Saint-Etienne, France, 2008. [Google Scholar]
- Khairallah, S.A.; Anderson, A.T.; Rubenchik, A.; King, W.E. Laser powder-bed fusion additive manufacturing: Physics of complex melt flow and formation mechanisms of pores, spatter, and denudation zones. Acta Mater. 2016, 108, 36–45. [Google Scholar] [CrossRef] [Green Version]
- King, W.E.; Barth, H.D.; Castillo, V.M.; Gallegos, G.F.; Gibbs, J.W.; Hahn, D.E.; Rubenchik, A.M. Observation of keyhole-mode laser melting in laser powder-bed fusion additive manufacturing. J. Mater. Process. Technol. 2014, 214, 2915–2925. [Google Scholar] [CrossRef]
- King, W.E.; Barth, H.D.; Castillo, V.M.; Gallegos, G.F.; Gibbs, J.W.; Hahn, D.E.; Kamath, C.; Rubenchike, A.M. Laser powder bed fusion additive manufacturing of metals; physics, computational, and materials challenges. Appl. Phys. Rev. 2015, 2, 041304. [Google Scholar] [CrossRef]
- Farzadi, A.; Do-Quang, M.; Kokabi, A.H.; Serajzadeh, S. Phase-field simulation of weld solidification microstructure in an Al–Cu alloy. Model. Simul. Mater. Sci. Eng. 2008, 16, 065005. [Google Scholar] [CrossRef]
- Johnson, L.; Mahmoudi, M.; Zhang, B.; Seede, R.; Huang, X.; Maier, J.T.; Maier, H.J.; Karaman, I.; Elwany, A.; Arróyave, R. Assessing printability maps in additive manufacturing of metal alloys. Acta Mater. 2019, 176, 199–210. [Google Scholar] [CrossRef]
- Boettinger, W.J.; Warren, J.A.; Beckermann, C.; Karma, A. Phase-field simulation of solidification. Annu. Rev. Mater. Res. 2002, 32, 163–194. [Google Scholar] [CrossRef]
- Chen, L.-Q. Phase-field models for microstructure evolution. Annu. Rev. Mater. Res. 2002, 32, 113–140. [Google Scholar] [CrossRef] [Green Version]
- Steinbach, I. Phase-field models in materials science. Model. Simul. Mater. Sci. Eng. 2009, 17, 073001. [Google Scholar] [CrossRef]
- Kundin, J.; Mushongera, L.; Emmerich, H. Phase-field modeling of microstructure formation during rapid solidification in Inconel 718 superalloy. Acta Mater. 2015, 95, 343–356. [Google Scholar] [CrossRef]
- Rodgers, T.M.; Madison, J.D.; Tikare, V. Simulation of metal additive manufacturing microstructures using kinetic Monte Carlo. Comput. Mater. Sci. 2017, 135, 78–89. [Google Scholar] [CrossRef]
- Poulin, J.-R.; Kreitcberg, A.; Terriault, P.; Brailovski, V. Long fatigue crack propagation behavior of laser powder bed-fused inconel 625 with intentionally-seeded porosity. Int. J. Fatigue 2019, 127, 144–156. [Google Scholar] [CrossRef]
- Bhutto, A.; Wahab, M.S.; Raus, A.A.; Kamarudin, K. Effects of Selective Laser Melting Parameters on Relative Density of AlSi10Mg. Int. J. Eng. Technol. 2016, 8, 2552–2557. [Google Scholar]
- Krishnan, M.; Atzeni, E.; Canali, R.; Calignano, F.; Ambrosio, E.P.; Iuliano, L. On the effect of process parameters on properties of AlSi10Mg parts produced by DMLS. Rapid Prototyp. J. 2014, 20, 449–458. [Google Scholar] [CrossRef]
- Ghosh, S.; Ma, L.; Ofori-Opoku, N.; Guyer, J.E. On the primary spacing and microsegregation of cellular dendrites in laser deposited Ni–Nb alloys. Model. Simul. Mater. Sci. Eng. 2017, 25, 065002. [Google Scholar] [CrossRef]
- Panwisawas, C.; Qiu, C.; Anderson, M.J.; Sovani, Y.; Turner, R.P.; Attallah, M.M.; Basoalto, H.C. Mesoscale modelling of selective laser melting: Thermal fluid dynamics and microstructural evolution. Comput. Mater. Sci. 2017, 126, 479–490. [Google Scholar] [CrossRef]
- Lee, Y.; Zhang, W. Modeling of heat transfer, fluid flow and solidification microstructure of nickel-base superalloy fabricated by laser powder bed fusion. Addit. Manuf. 2016, 12, 178–188. [Google Scholar] [CrossRef] [Green Version]
- Gan, Z.; Lian, Y.; Lin, S.E.; Jones, K.K.; Kam Liu, W.; Wagner, G.J. Benchmark Study of Thermal Behavior, Surface Topography, and Dendritic Microstructure in Selective Laser Melting of Inconel 625. Integr. Mater. Manuf. Innov. 2019, 8, 178–193. [Google Scholar] [CrossRef]
- Letenneur, M.; Brailovski, V.; Kreitcberg, A.; Paserin, V.; Bailon-Poujol, I. Laser powder bed fusion of water-atomized iron-based powders: Process optimization. J. Manuf. Mater. Process. 2017, 1, 23. [Google Scholar] [CrossRef] [Green Version]
- Kreitcberg, A.; Brailovski, V.; Prokoshkin, S. New biocompatible near-beta Ti-Zr-Nb alloy processed by laser powder bed fusion: Process. optimization. J. Mater. Process. Technol. 2018, 252, 821–829. [Google Scholar] [CrossRef]
- Letenneur, M.; Brailovski, V.; Kreitcberg, A. Optimization of Laser Powder Bed Fusion Processing Using a Combination of Melt Pool Modeling and Design of Experiment Approaches: Density Control. J. Manuf. Mater. Process. 2019, 3, 21. [Google Scholar] [CrossRef] [Green Version]
- Nie, P.; Ojo, O.; Li, Z. Numerical modeling of microstructure evolution during laser additive manufacturing of a nickel-based superalloy. Acta Mater. 2014, 77, 85–95. [Google Scholar] [CrossRef]
- Schuöcker, D. Handbook of the Eurolaser Academy; Springer Science & Business Media: Berlin, Germany, 1998; Volume 2. [Google Scholar]
- Hagen, E.; Rubens, H. Über Beziehungen des Reflexions-und Emissionsvermögens der Metalle zu ihrem elektrischen Leitvermögen. Annalen der Physik 1903, 316, 873–901. [Google Scholar] [CrossRef] [Green Version]
- Liepa, T. AMB2018-02 Description. 2018. Available online: https://www.nist.gov/ambench/amb2018-02-description (accessed on 13 September 2019).
- Bala, K.; Pradhan, P.R.; Saxena, N.S.; Saksena, M.P. Effective thermal conductivity of copper powders. J. Phys. D: Appl. Phys. 1989, 22, 1068. [Google Scholar] [CrossRef]
- Liu, P.; Fu, C.; Li, T. Calculation formula for apparent electrical resistivity of high porosity metal materials. Sci. China Ser. E Technol. Sci. 1999, 42, 294–301. [Google Scholar] [CrossRef]
- Jacob, G.; Donmez, A.; Slotwinski, J.; Moylan, S. Measurement of powder bed density in powder bed fusion additive manufacturing processes. Meas. Sci. Technol. 2016, 27, 115601. [Google Scholar] [CrossRef] [Green Version]
- Valencia, J.J.; Quested, P.N. Thermophysical Properties. In Casting; Viswanathan, S., Ed.; ASM International: Geauga County, OH, USA, 2008. [Google Scholar]
- Powell, R.; Ho, C.Y.; Liley, P.E. Thermal Conductivity of Selected Materials; National Bureau of Standards Washington, US Department of Commerce: Gaithersburg, MD, USA, 1966; Volume 8. [Google Scholar]
- ASTM International. E112-13 Standard Test Methods for Determining Average Grain Size; ASTM International: West Conshohocken, PA, USA, 2013. [Google Scholar]
- Mankins, W.L.; Lamb, S. Nickel and Nickel Alloys. In Properties and Selection: Nonferrous Alloys and Special-Purpose Materials; ASM International: Geauga County, OH, USA, 1990. [Google Scholar]
- Kou, S. Welding Metallurgy; John Wiley & Sons, Inc.: Hoboken, NJ, USA, 2003; pp. 431–446. [Google Scholar]
- Cool, T.; Bartol, A.; Kasenga, M.; Modi, K.; García, R.E. Gibbs: Phase equilibria and symbolic computation of thermodynamic properties. Calphad 2010, 34, 393–404. [Google Scholar] [CrossRef]
- Sufiiarov, V.S.; Popovich, A.A.; Borisov, E.V.; Polozov, I.A.; Masaylo, D.V.; Orlov, A.V. The effect of layer thickness at selective laser melting. Procedia Eng. 2017, 174, 126–134. [Google Scholar] [CrossRef]
- Liverani, E.; Toschi, S.; Ceschini, L.; Fortunato, A. Effect of selective laser melting (SLM) process parameters on microstructure and mechanical properties of 316L austenitic stainless steel. J. Mater. Process. Technol. 2017, 249, 255–263. [Google Scholar] [CrossRef]
- Kreitcberg, A.; Brailovski, V.; Sheremetyev, V.; Prokoshkin, S. Effect of laser powder bed fusion parameters on the microstructure and texture development in superelastic Ti–18Zr–14Nb alloy. Shape Mem. Superelasticity 2017, 3, 361–372. [Google Scholar] [CrossRef]


| Properties | Bulk | Powder (φ = 40%) |
|---|---|---|
| Liquidus temperature, °C | 1535 | 1535 |
| Solidus temperature, °C | 1494 | 1494 |
| Density, kg/m3 | 7860 | 3144 |
| Thermal conductivity, W/m × K | 81 | 25 |
| Specific heat capacity, J/kg × K | 469 | 469 |
| Electrical resistivity, 10−8 Ω × m | 8.9 | 62 |
| # | P, W | v, m/s | h, mm | BR, cm3/h | E, J/mm3 | Printed Density, % | CR, 107 °C/s | TG, 107 °C/mm |
|---|---|---|---|---|---|---|---|---|
| 1 | 255 | 0.96 | 0.09 | 12.4 | 73.8 | 100 | 1.46 | 1.53 |
| 2 | 270 | 1.22 | 0.07 | 12.3 | 79.0 | 99.9 | 1.74 | 1.43 |
| 3 | 275 | 1.04 | 0.08 | 12.0 | 82.6 | 99.9 | 1.46 | 1.40 |
| 4 | 295 | 1.62 | 0.08 | 18.7 | 56.9 | 99.9 | 2.11 | 1.30 |
| 5 | 295 | 1.7 | 0.07 | 17.1 | 62.0 | 100 | 2.21 | 1.30 |
| 6 | 305 | 2.2 | 0.06 | 19.0 | 57.8 | 99.9 | 2.76 | 1.26 |
| 7 | 310 | 2.62 | 0.06 | 22.6 | 49.3 | 99.9 | 3.22 | 1.23 |
| 8 | 310 | 2.4 | 0.06 | 20.7 | 53.8 | 99.9 | 2.96 | 1.23 |
| 9 | 320 | 2.3 | 0.06 | 19.9 | 58.0 | 99.9 | 2.75 | 1.19 |
| 10 | 325 | 1.7 | 0.07 | 17.1 | 68.3 | 99.9 | 2.00 | 1.18 |
| 11 | 330 | 1.92 | 0.07 | 19.4 | 61.4 | 100 | 2.23 | 1.16 |
| 12 | 335 | 2.98 | 0.06 | 25.7 | 46.8 | 99.9 | 3.40 | 1.14 |
| 13 | 350 | 2.88 | 0.06 | 24.9 | 50.6 | 99.9 | 3.14 | 1.09 |
| 14 | 350 | 2.68 | 0.06 | 23.2 | 54.4 | 99.9 | 2.93 | 1.10 |
| # | CR, 107 °C/s | TG, 107 °C/mm | Grain Size (dxz) | Grain Aspect Ratio (GAR) | ||||
|---|---|---|---|---|---|---|---|---|
| Model, µm | Exp., µm | Dev., % | Model | Exp. | Dev., % | |||
| 1 | 1.46 | 1.53 | 24.9 | 30.1 ± 0.9 | 17.3 | 2.9 | 3.2 ± 0.01 | 8.2 |
| 2 | 1.74 | 1.43 | 20.4 | 17.6 ± 1.0 | 13.7 | 2.3 | 2.0 ± 0.09 | 12.6 |
| 3 | 1.46 | 1.40 | 25 | 28.8 ± 1.4 | 0.8 | 2.9 | 3.2 ± 0.13 | 9.4 |
| 4 | 2.11 | 1.30 | 16.9 | 16.3 ± 1.1 | 3.6 | 1.9 | 1.7 ± 0.06 | 10.5 |
| 5 | 2.21 | 1.30 | 16.2 | 13.4 ± 1.1 | 17.3 | 1.8 | 1.5 ± 0.09 | 15.6 |
| 6 | 2.76 | 1.26 | 13.7 | 14.7 ± 1.5 | 6.8 | 1.4 | 1.7 ± 0.08 | 18.1 |
| 7 | 3.22 | 1.23 | 13.1 | 13.4 ± 2.8 | 2.2 | 1.4 | 1.3 ± 0.03 | 5.0 |
| 8 | 2.96 | 1.23 | 12.5 | 14.2 ± 2.3 | 12.0 | 1.3 | 1.5 ± 0.15 | 11.6 |
| 9 | 2.75 | 1.19 | 13.8 | 12.1 ± 0.6 | 12.3 | 1.4 | 1.3 ± 0.03 | 8.6 |
| 10 | 2.00 | 1.18 | 17.7 | 17.0 ± 2.5 | 4.0 | 2.0 | 1.8 ± 0.04 | 12.5 |
| 11 | 2.23 | 1.16 | 16.1 | 14.1 ± 1.0 | 12.4 | 1.8 | 1.6 ± 0.04 | 12.8 |
| 12 | 3.40 | 1.14 | 12.2 | 13.6 ± 2.0 | 10.3 | 1.2 | 1.6 ± 0.02 | 24.1 |
| 13 | 3.14 | 1.09 | 13.2 | 12.8 ± 1.8 | 3.0 | 1.4 | 1.4 ± 0.08 | 2.1 |
| 14 | 2.93 | 1.10 | 12.7 | 13.8 ± 0.8 | 8.0 | 1.3 | 1.5 ± 0.04 | 11.6 |
| IN625 | ||
|---|---|---|
| Bulk | Powder (t = 40 μm; φ = 60%) | |
| Liquidus temperature, °C | 1350 | 1350 |
| Solidus temperature, °C | 1290 | 1290 |
| Density, kg/m3 | 8440 | 5064 |
| Thermal conductivity, W/m × K | 25.2 | 12.6 |
| Specific heat capacity, J/kg × K | 670 | 670 |
| Electrical resistivity, 10−8 Ω × m | 134 | 622 |
| Cooling Rate, 105 K/s | |||||
|---|---|---|---|---|---|
| Case | Power, W | Speed, mm/s | Model | Experiment [24] | Deviation, % |
| 1 | 150 | 400 | 5.97 | 6.20 ± 0.8 | 3.7 |
| 2 | 195 | 800 | 8.89 | 9.35 ± 1.4 | 4.9 |
| 3 | 195 | 1200 | 12.3 | 12.8 ± 3.9 | 3.9 |
| N° | P, W | V, mm/s | E, J/mm3 | BR, cm3/h | Grain Size (dxz), μm | Aspect Ratio (AR) | ||||
|---|---|---|---|---|---|---|---|---|---|---|
| Model, µm | Experim., µm | Dev., % | Model, µm | Experim., µm | Dev., % | |||||
| 1 | 285 | 960 | 67.5 | 15.2 | 100 | 0 | 3.2 | 5 | ||
| 2 | 285 | 1440 | 45.0 | 22.8 | 46 | 2 | 2.4 | 5 | ||
| 3 | 285 | 1680 | 38.5 | 26.6 | 31 | 13 | 2.0 | 19 | ||
| 4 | 285 | 1920 | 33.8 | 30.4 | 23 | 27 | 1.9 | 27 | ||
© 2020 by the authors. Licensee MDPI, Basel, Switzerland. This article is an open access article distributed under the terms and conditions of the Creative Commons Attribution (CC BY) license (http://creativecommons.org/licenses/by/4.0/).
Share and Cite
Letenneur, M.; Kreitcberg, A.; Brailovski, V. The Average Grain Size and Grain Aspect Ratio in Metal Laser Powder Bed Fusion: Modeling and Experiment. J. Manuf. Mater. Process. 2020, 4, 25. https://doi.org/10.3390/jmmp4010025
Letenneur M, Kreitcberg A, Brailovski V. The Average Grain Size and Grain Aspect Ratio in Metal Laser Powder Bed Fusion: Modeling and Experiment. Journal of Manufacturing and Materials Processing. 2020; 4(1):25. https://doi.org/10.3390/jmmp4010025
Chicago/Turabian StyleLetenneur, Morgan, Alena Kreitcberg, and Vladimir Brailovski. 2020. "The Average Grain Size and Grain Aspect Ratio in Metal Laser Powder Bed Fusion: Modeling and Experiment" Journal of Manufacturing and Materials Processing 4, no. 1: 25. https://doi.org/10.3390/jmmp4010025
APA StyleLetenneur, M., Kreitcberg, A., & Brailovski, V. (2020). The Average Grain Size and Grain Aspect Ratio in Metal Laser Powder Bed Fusion: Modeling and Experiment. Journal of Manufacturing and Materials Processing, 4(1), 25. https://doi.org/10.3390/jmmp4010025