Article

Influence of the Wire Feeding on the Wetting Process during Laser Brazing of Aluminum Alloys with Aluminum-Based Braze Material

BIAS—Bremer Institut für Angewandte Strahltechnik GmbH, Klagenfurter Straße 5, 28359 Bremen, Germany
*
Author to whom correspondence should be addressed.
J. Manuf. Mater. Process. 2019, 3(4), 83; https://doi.org/10.3390/jmmp3040083
Submission received: 28 June 2019 / Revised: 19 September 2019 / Accepted: 23 September 2019 / Published: 29 September 2019
(This article belongs to the Special Issue Laser-Based Manufacturing)

Abstract

:
The wetting behavior in laser brazing can be designated as inconstant, caused largely by external process discontinuities such as the wire feeding. To reveal periodic melt pool propagation effects that occur during laser brazing of aluminum and for a better understanding of those effects in laser brazing in general, this paper analyzes high-speed recordings of the brazing process with aluminum alloy. It is demonstrated that two main effects of periodic melt pool behavior in different frequency scales occur during the process, related directly to the wire feeding.

1. Introduction

Laser brazing is suitable for a fast joining process with low heat input and thus minor distortion, compared to laser welding. A current industrial application is the joining of zinc-coated steel parts in car body. Besides the structural abilities, here, a high optical quality is required, because the seam is in the visible range of the customer. In this application, defects in the form of edge notches on the seam occur, caused by an inconstant wetting of the substrate [1]. A periodic melting of the zinc layer is assumed to be the explanation for that [2]. The wetting frequency is in relation with the process parameter such as processing speed [3]. Furthermore, it could be shown that the wetting frequency can be influenced by the oscillation of the laser beam in the process direction and thus the quality of the solder seam can be improved [4].
In addition to the beam modulation mentioned above, beam shaping can influence process dynamics and thus wetting. When parameterizing the soldering process, the intensity profile of the laser on the workpiece has a decisive influence on the formation of the seam surface. Compared to a defocused laser beam, a top hat intensity profile can, for example, significantly reduce the frequency of edge notches [5].
However, laser brazing, and therefore its benefits, is not yet utilized for aluminum alloys. The reasons for this are the presence of an oxide layer, which has to be removed in an additional step before brazing, the high thermal conductivity, and primarily, the low melting point [6].
Aluminum brazing can be achieved with aluminum-based filler material due to a good corrosion resistance and high joint strength. However, in this case the temperature interval between liquidus temperature of the filler material and the solidus temperature of the base material is critical [7].
A process window for joining pure aluminum (melting temperature 660 °C) with AlSi12 filler material (melting temperature 575 to 585 °C) exists but is small and thus sensitive to temperature instabilities. An alternative solution is the usage of filler materials with lower melting points by the alloying with copper and zinc, but there are disadvantages in terms of the ductility and formability [8].
Since melt pool oscillation is a known phenomenon in laser brazing, inconstant wetting behavior could cause a periodic partial melting of the base material in aluminum brazing.
Previous research used high-speed cameras as well as thermal 2D and 1D pyrometer sensors to investigate the wetting behavior of molten braze material. Grimm et al. published a possibility for online process monitoring by analyzing various regions of interest (ROIs) in recorded images. They also described the melt pool propagation as periodic. Depending on the misalignment of the wire or the brazing speed, the frequencies are in the range of 15 to 40 Hz [1]. By observing the area of laser interaction with a single spot pyrometer, it also seems that specific frequencies are present in the process. The pyrometer signal frequencies increase with higher brazing speed, but become equal to the scanning frequencies when the laser is scanned superposed to the feed in a longitudinal direction. Heitmanek et al. relate this to the thereby modified temperature field in the fusion zone. Based on simulations, the melt pool elongates due to increased laser deflection [4]. These melt pool propagation instabilities are related to the evaporating zinc coating of the steel and the inconsistent wire feeding. Furthermore, using manual high-speed image analysis of the wetting front, Heuberger et al. identified an unsteady spreading of the melt pool front related to seam defects [9]. Reimann showed the relationship between an inconstant wire feeding and the melt pool frequency by comparing a pyrometer signal with the wire feed rate. He discovered that a stepwise spreading of the melt pool front, caused by external influences such as the system technology, results in V-shaped flakes on the seam surface [10].

2. Materials and Methods

2.1. Materials

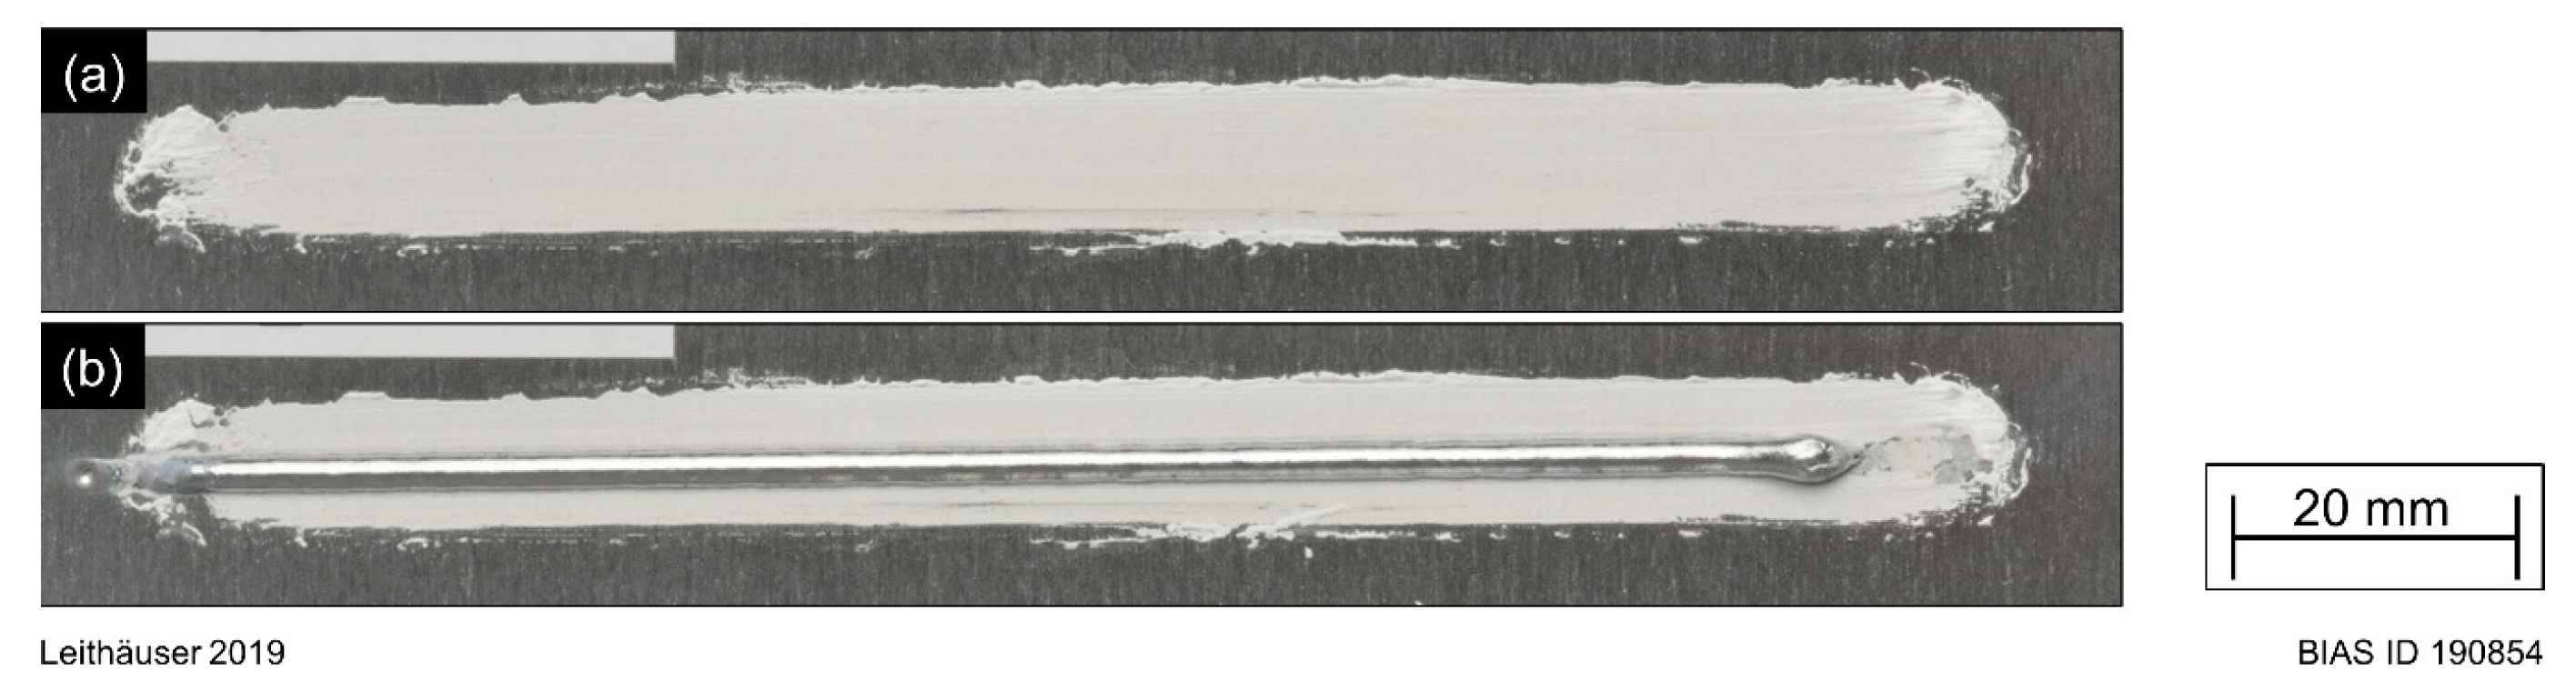
The materials used in this study were pure aluminum EN AW-1050 in H24 condition with a 2 mm thickness as the base material and aluminum–silicon eutectic alloy AlSi12 with a 1.2 mm diameter as the filler wire. The specimens were cut to sheets of 150 × 50 mm, whereby the length was oriented 90° to the rolling direction. Fontargen F 400 NH brazing flux was applied with a brush after forming an emulsion with purified water. Figure 1 shows the sheet after the flux application and subsequent brazing.

2.2. Laser Processing

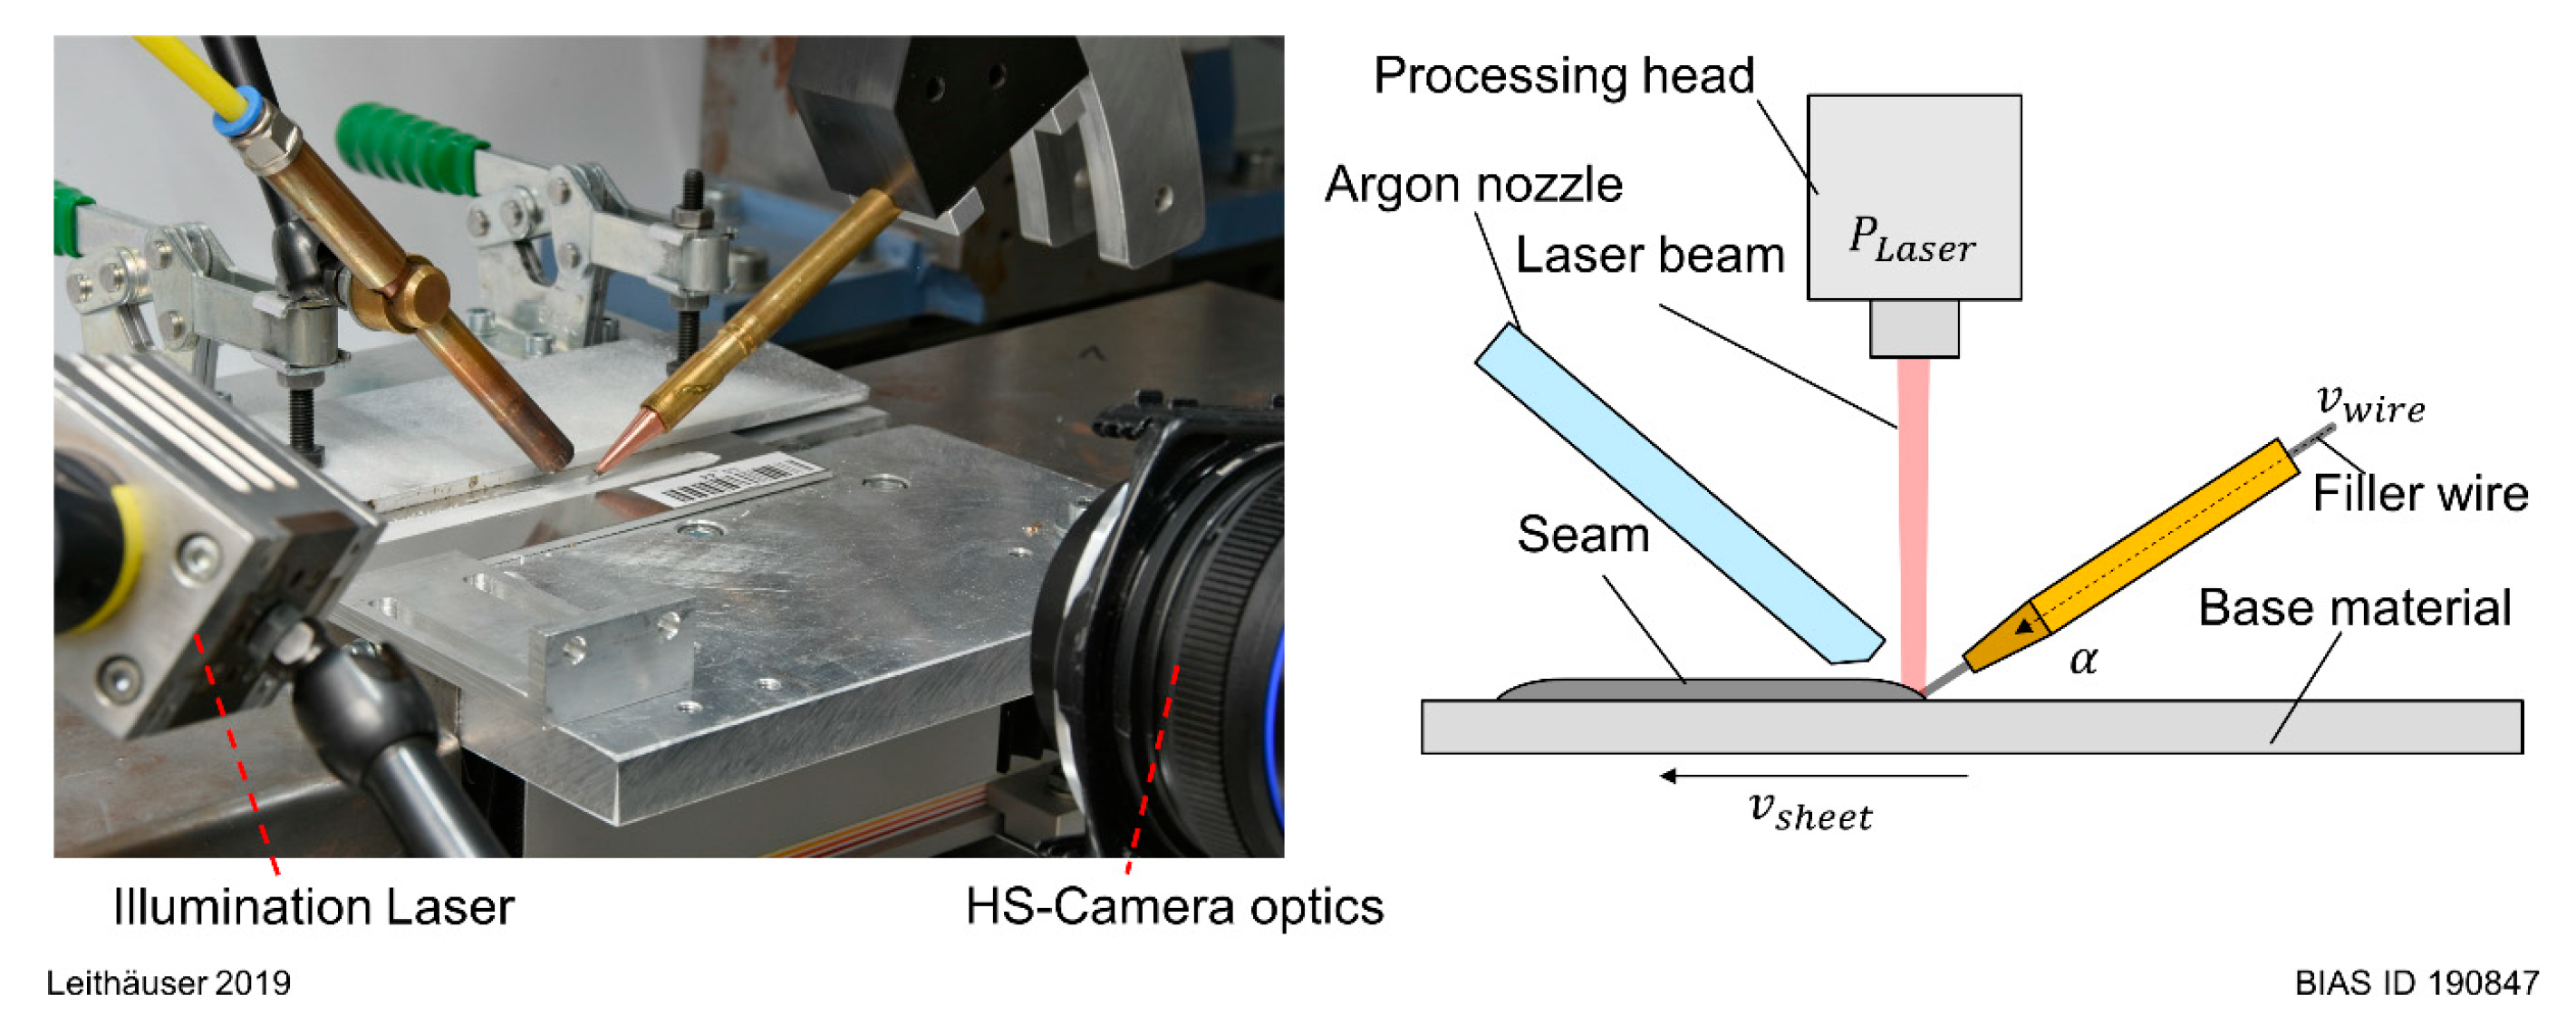
The braze was done in a bead-on-plate configuration on a custom Power Automation CNC table with a moving specimen holder. An Nd:YAG laser (Trumpf HL 4006D, TRUMPF GmbH + Co. KG, Ditzingen, Germany) was used as the laser source, emitting at a wavelength of 1064 nm. The beam, guided with a 600 µm optical fiber, was focused perpendicular to the base plate. A Trumpf BEO D70 optics was used, with a 56 mm collimator lens and a 280 mm focus lens, creating a spot of 3 mm in diameter. The filler wire was supplied laterally through a wire rope and a copper tip to the workpiece by a Dinse LK 60 E drive unit. Argon was used to shield the braze from the counter orientation, regulated by an Omega FMA6526ST digital mass flow controller to 12 L/min. The laser power was 3 kW, the brazing speed was 2 m/min, and the wire angle was 30°. The wire feed rate was modified from 2.5 m/min to 3.5 m/min in 0.25 m/min increments. The setup is visible in Figure 2. The created seam has a length of 100 mm.

2.3. Process Observation and Post-Processing

The process was recorded with a Phantom VEO 410L high-speed camera, recording 768 × 312 px images at 18 kfps. The camera was angled 4° to the horizontal plane. A CAVILUX HF (Cavitar Ltd, Tampere, Finland) illumination laser, emitting at 810 nm, was used as a light source for the recording, combined with an 810 ± 10 nm bandpass filter in front of the optics. This provided a controlled illumination of the process without disturbances from the surroundings.
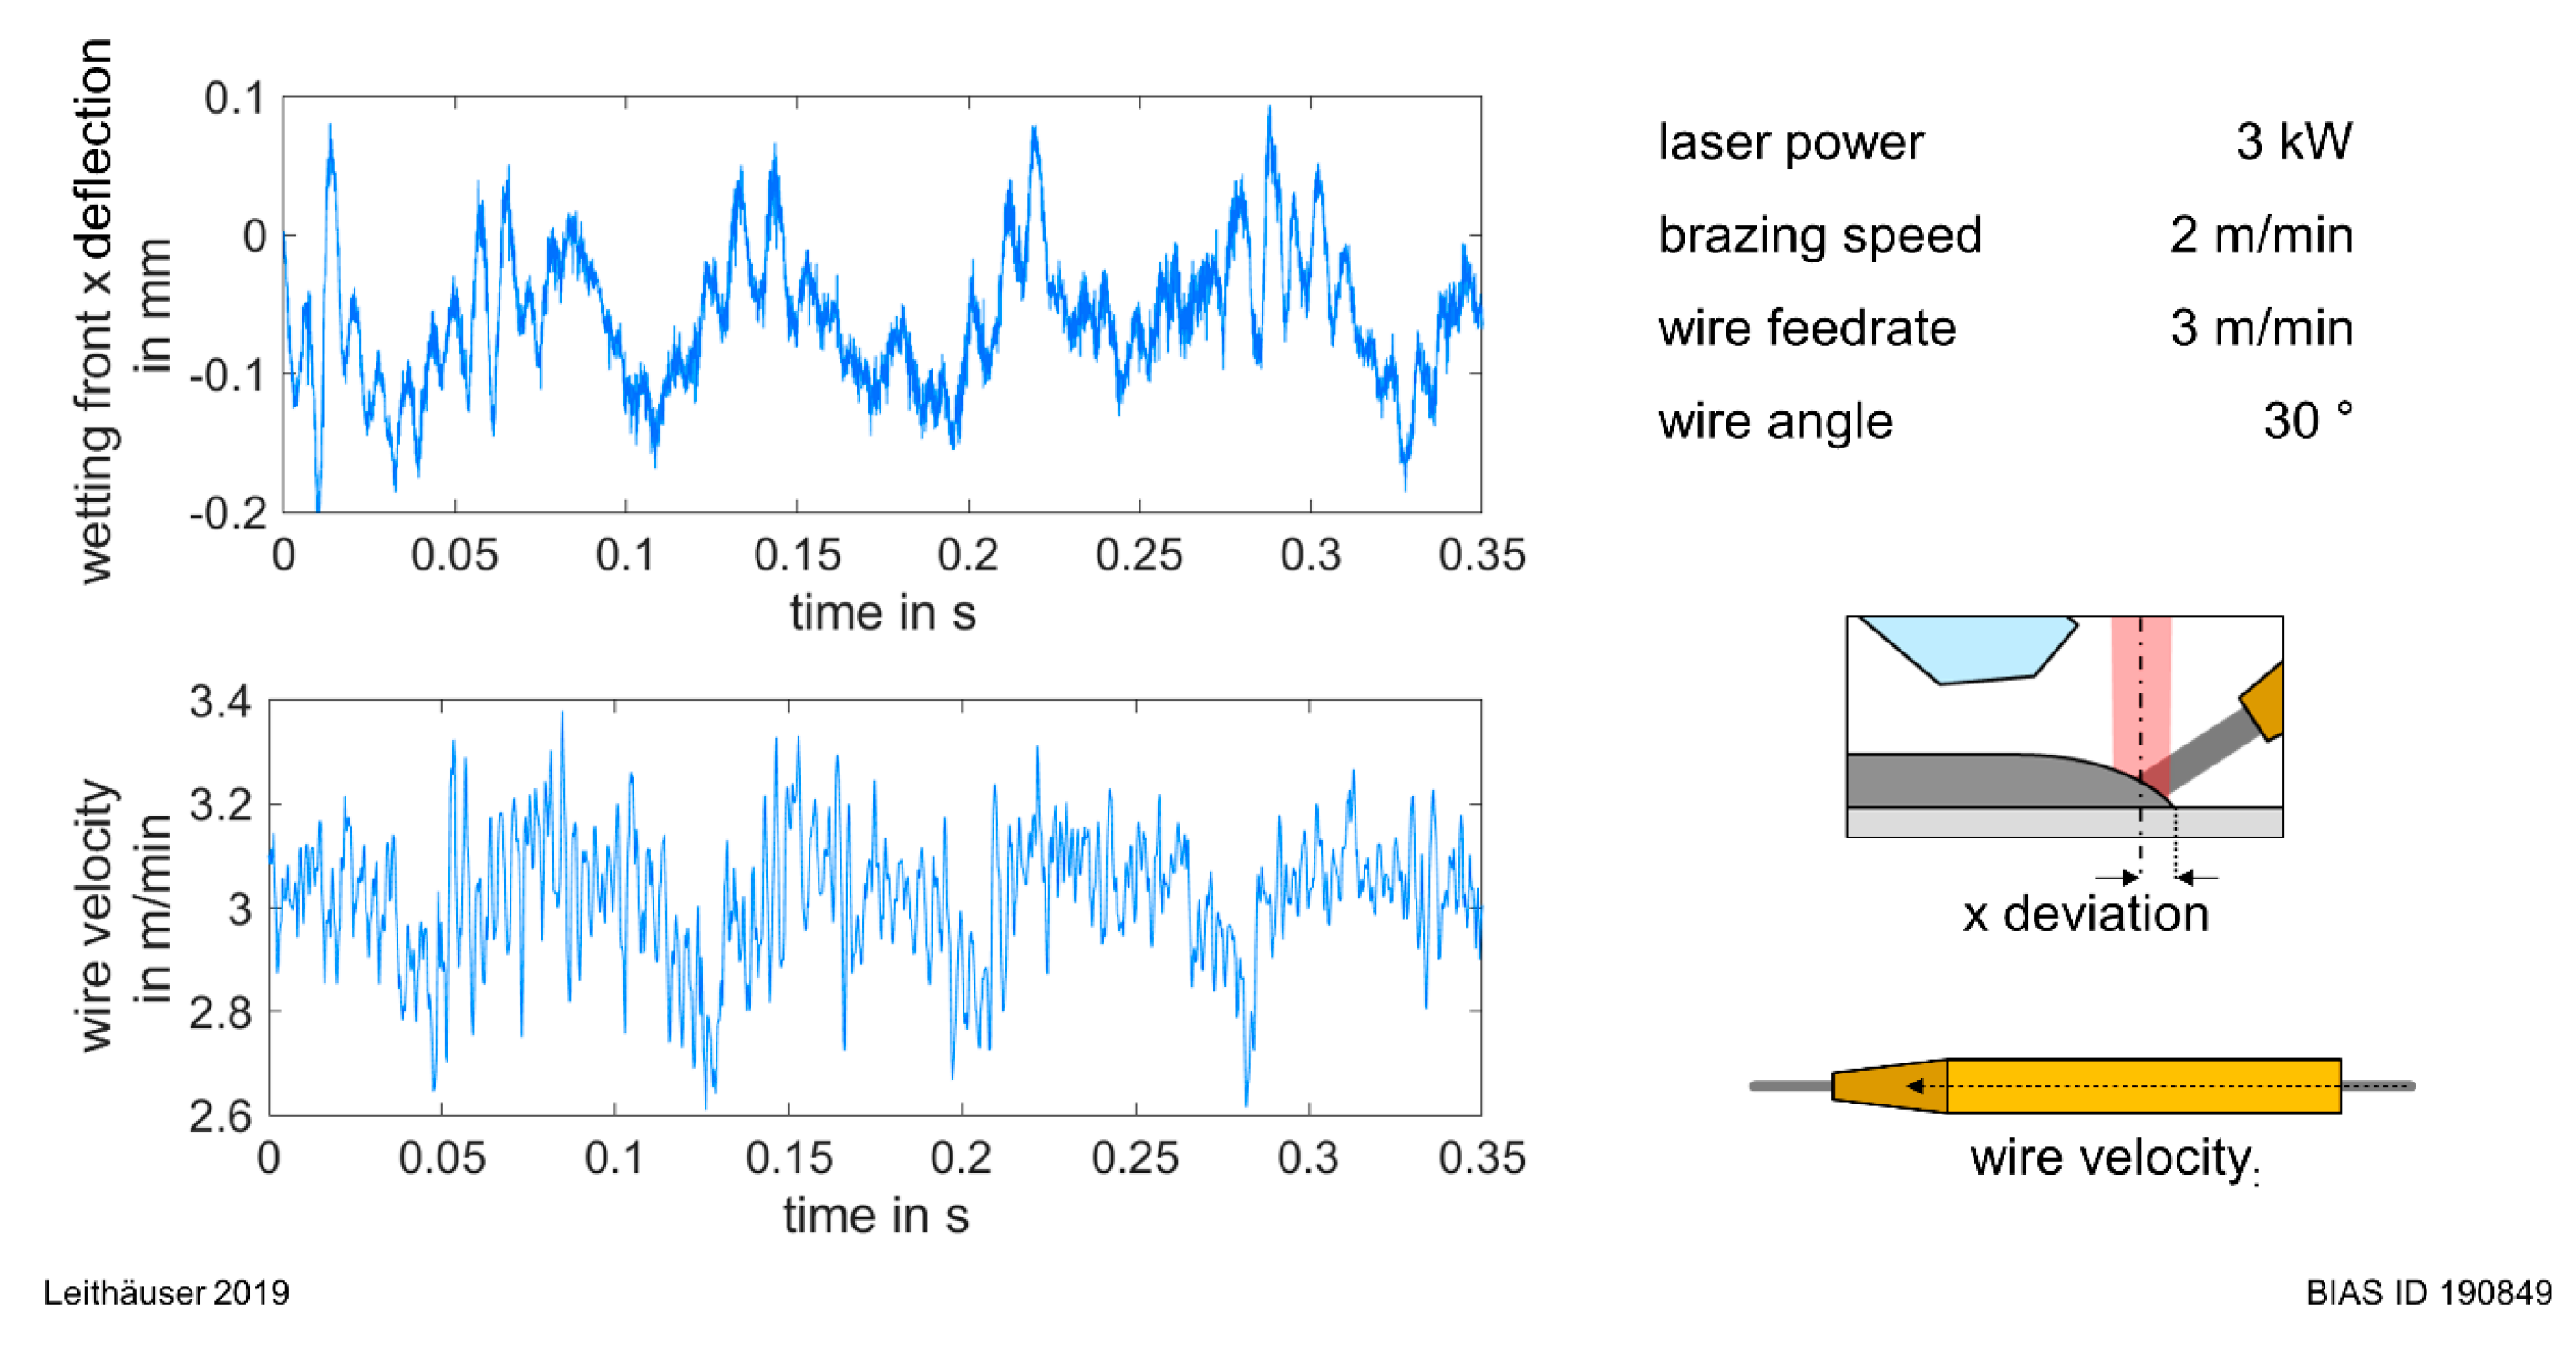
The tracking of the wetting front, as well as the capturing of process parameters such as the wire feed rate and wire angle, was achieved with image processing in MATLAB. In Figure 3, a circular object is noticeable at the front of the wetting melt pool. This can be recognized as the reflection of the wire nozzle. The fact that the melt pool is forming a spherical geometry at the wetting front brings the reflection to the camera. This circular shape was used for tracking the wetting front with a circle detection algorithm that uses a circular Hough transform. The outputs are the center point coordinates and the approximated radius of the circular reflection. The front deviation in the x (horizontal) direction of this circle represents the wetting front.
An appropriate stability for the front detection was achieved through the dynamic adaption of the adjustment parameter, the binarization threshold, and by using a smoothing filter for the cropped ROI.
To determine the wire feed rate, the Kanade–Lucas–Tomasi (KLT) algorithm was used to track the multiple eigen features of the wire. The quantity was between 60 and 100 features per tracking cycle. With the coordinates, the x- and y-velocities were calculated for each feature by polynomial curve fitting and then totalized. The mean value of all feature velocities was used as the wire speed. A tracking cycle of five frames was used in this study as it has a good statistical accuracy as well as high sampling rates.

2.4. Signal Processing

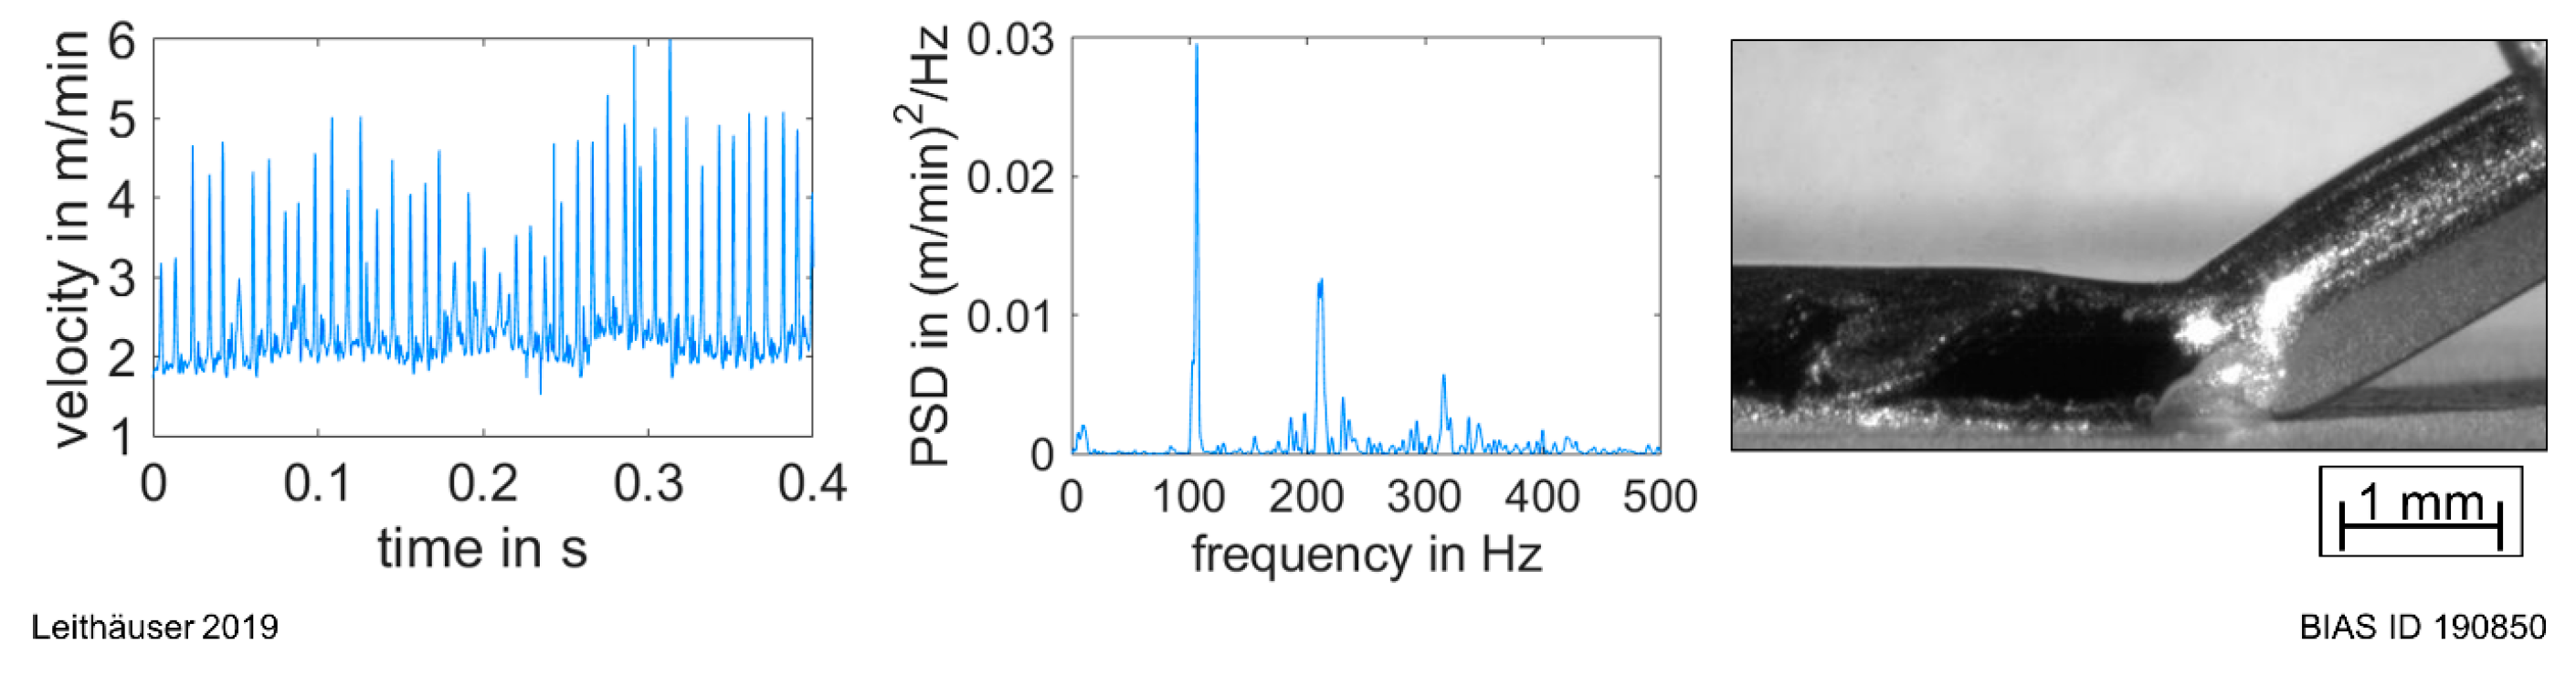
For a frequency analysis of the signal, the power spectral density (PSD) was calculated as the Fourier transform of the biased estimate of the autocorrelation. This is suitable for stationary random processes. Therefore, the “periodogram” function in MATLAB was used, applying filtering with a hamming window. Prior to this, the signal was detrended by subtracting a best-fit line from the raw data. The mean and standard deviation of the PSD were generated by calculating the mean and standard deviation values for each frequency increment. Finally, the seam height over time was generated by detecting the top edge of the seam in the high-speed video, where the melt was already solidified.

3. Results

3.1. Wire Feeding Conditions during the Brazing

Figure 4 demonstrates a representative sample of the wetting front deviation and the wire velocity signal. In the wetting front deviation, two periodicities are visible: one at 144 ± 3 Hz with an amplitude of 0.05 ± 0.01 mm, and superimposed a frequency of 13 ± 1 Hz with an amplitude of 0.12 ± 0.01 mm.
Considering the measured wire velocity, shown in Figure 5, Figure 6 and Figure 7, it becomes clear that there are different feed conditions during the experiments, although the process parameters are constant. The reason becomes visible in the high-speed images, illustrated by a snapshot on the right side of the figures. In Figure 5, periodic spikes of high velocity, around twice the preset feed rate, are caused by a retained force that evolves when the wire is not sufficiently melted and hits the base material. Due to a higher unmolten bottom edge of the wire in relation to the base material sheet, as shown in Figure 6, the load is smaller, resulting in a rather oscillating velocity signal. Finally, in Figure 7, the signal flattens when the bottom edge no longer touches the base material.
Based on the PSD of the feed rate velocity, each condition has a distinct amount of periodicity. During a strong interaction between the wire and the base material (Figure 5), the foremost frequency is at 106 Hz, accompanied by harmonics at 212 and 318 Hz. In the second phenomenon (Figure 6), where there is less force between the wire and the sheet, there is no single dominating frequency but rather a range between 150 and 400 Hz. When there is a sufficient melting of the wire, and thereby no interaction in the wetting area, no frequencies are noted, as in the PSD in Figure 7. It is feasible to classify the samples in those with dominant frequencies in the wire velocity as “noisy”, while those with a comparatively constant feed over the observed sequence can be termed “smooth”.

3.2. Relation between Wire Velocity and Wetting

In Figure 8, all samples of one category, respectively with and without notable periodicity between 160 and 400 Hz, preferentially named noisy and smooth, are used to calculate the mean and standard deviation of all PSDs of the wire velocity.
In Figure 9, the mean PSD of the horizontal position of the wetting front is shown for the samples of each category. There are dominant frequencies apparent between 80 and 200 Hz, which is just half of the frequency range concerning the wire velocity—considering the samples with smooth wire velocity, no dominant frequencies are present in this spectrum.
At the frequencies below 50 Hz, peaks at 14 ± 2 Hz and 29 ± 3 Hz in the velocity signal occur regardless of the spectral density of the previously mentioned spectra. Moreover, in the wetting front signal, frequencies up to 40 Hz evolve.
Before taking a closer look at these minor frequencies, it should be noted that in Figure 10, the PSD of the wetting front is plotted with half the scale alongside the wire velocity frequency for a representative sample. Prominent peaks in the PSDs of both signals overlap, which means that the velocity frequencies are double the rates that are present in the wetting front movement in the case of all noisy brazes.

3.3. Influence of the Wire Feed Rate on Process Frequencies

In Figure 11, the signals are separated by the feed rate process parameter, regardless of whether they are noisy or smooth. The mean values of all wire velocity PSDs are plotted in Figure 11. At 2500 mm/min, there is a frequency at 11 Hz. By increasing the feed rate in 250 mm/min increments, this distinct frequency increases by about 1 Hz, while additionally, the peak significance grows. In some signals, a second significant peak is visible at around 30 Hz.
Figure 12 shows similar diagrams for the wetting front. The PSDs expose more frequencies than with the wire velocity signals but have significant peaks at the same frequencies.
In Figure 13, the PSDs of the seam height, as measured in the high-speed images, are plotted. There are some peaks visible at lower frequencies in the 4 to 6 Hz range, especially for the higher feed rates.

4. Discussion

With the introduced method, it is possible to capture the wetting front of the melt pool over a long time, generating statistically verified data and proving periodicity in melt pool propagation. It can be shown that, as already known from the state of the art for steel brazing, the wire feeding has a direct influence on the melt pool oscillation in aluminum brazing.
It is demonstrated that the wire feeding is not constant during the laser brazing process due to the nonuniform melting of the wire. This effect occurs randomly and does not depend on the tested wire feed rates. Therefore, another inhomogeneity must be present, such as a misalignment and an unequal laser absorption, which was mentioned by Reimann [
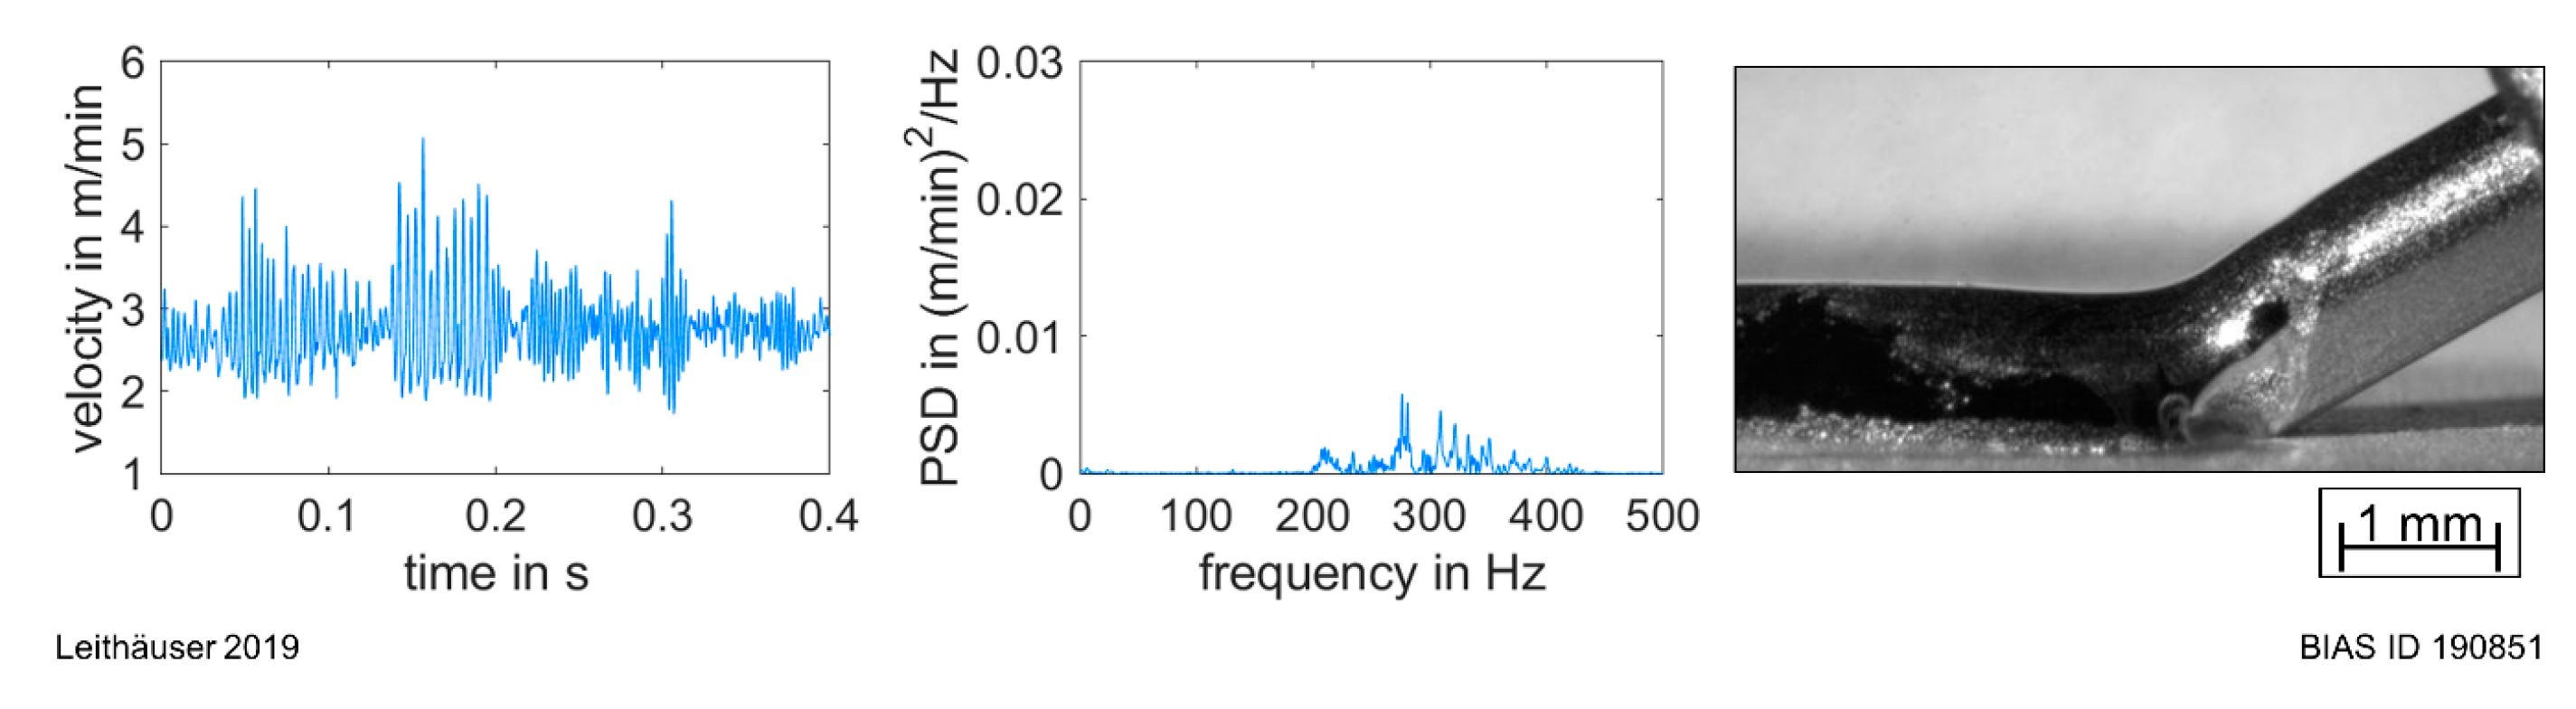
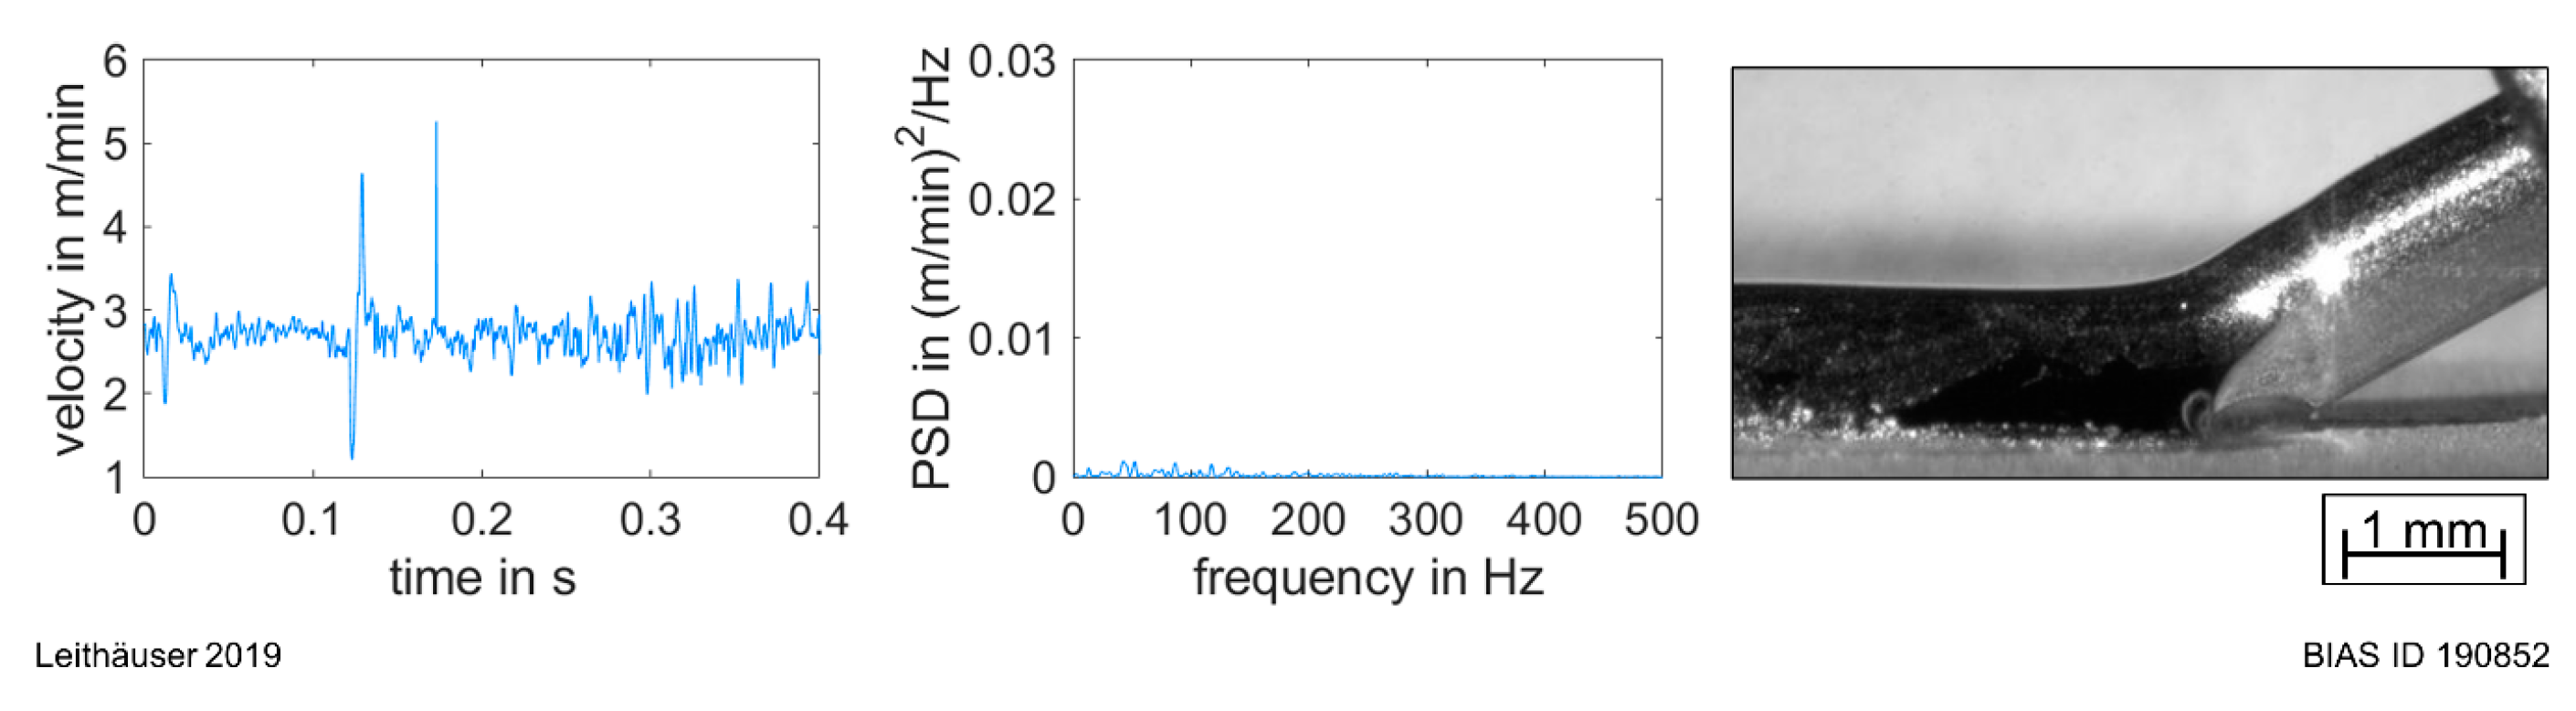
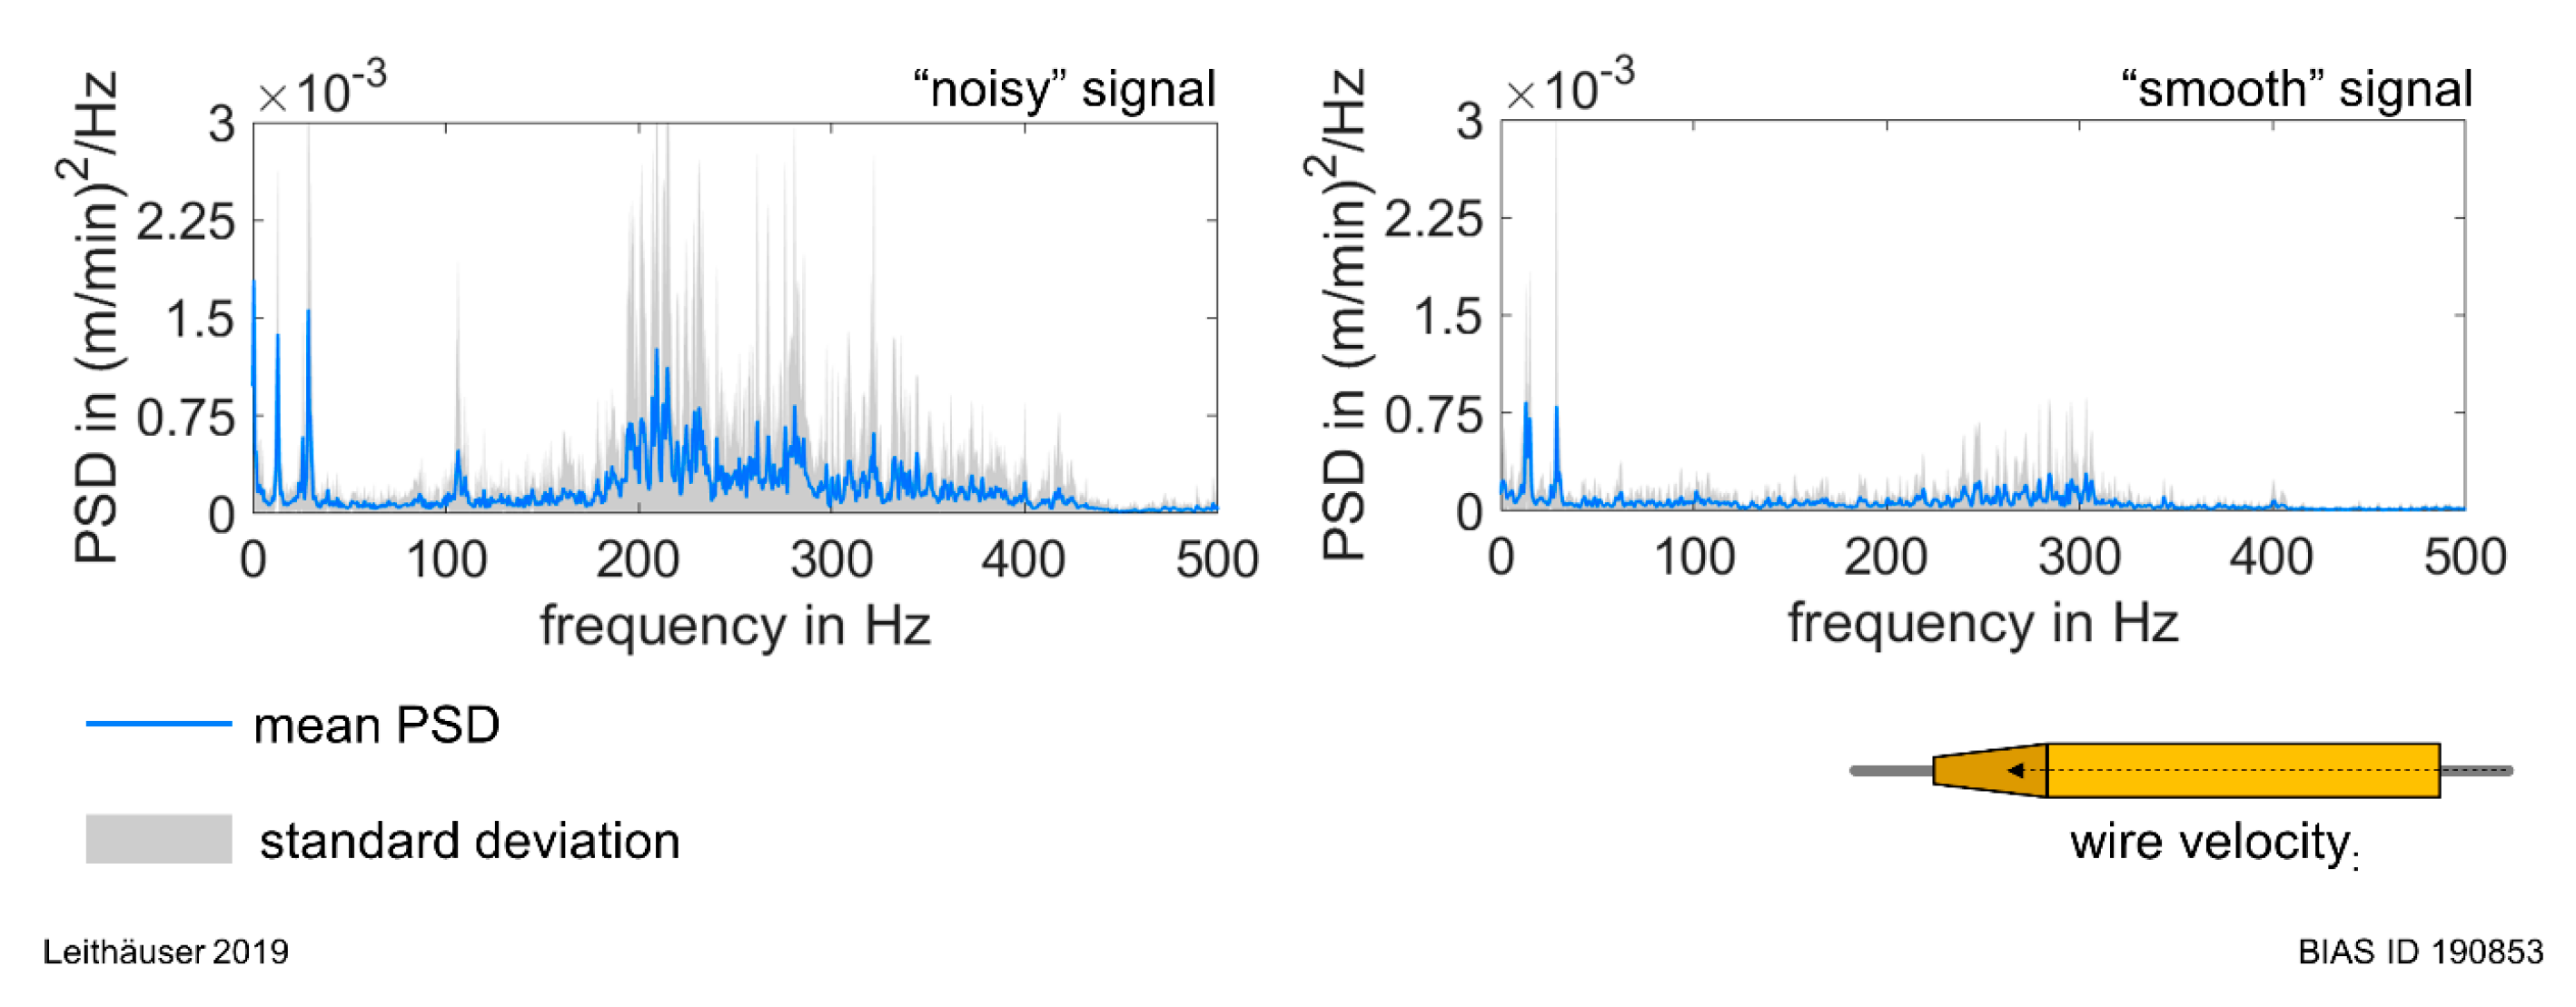
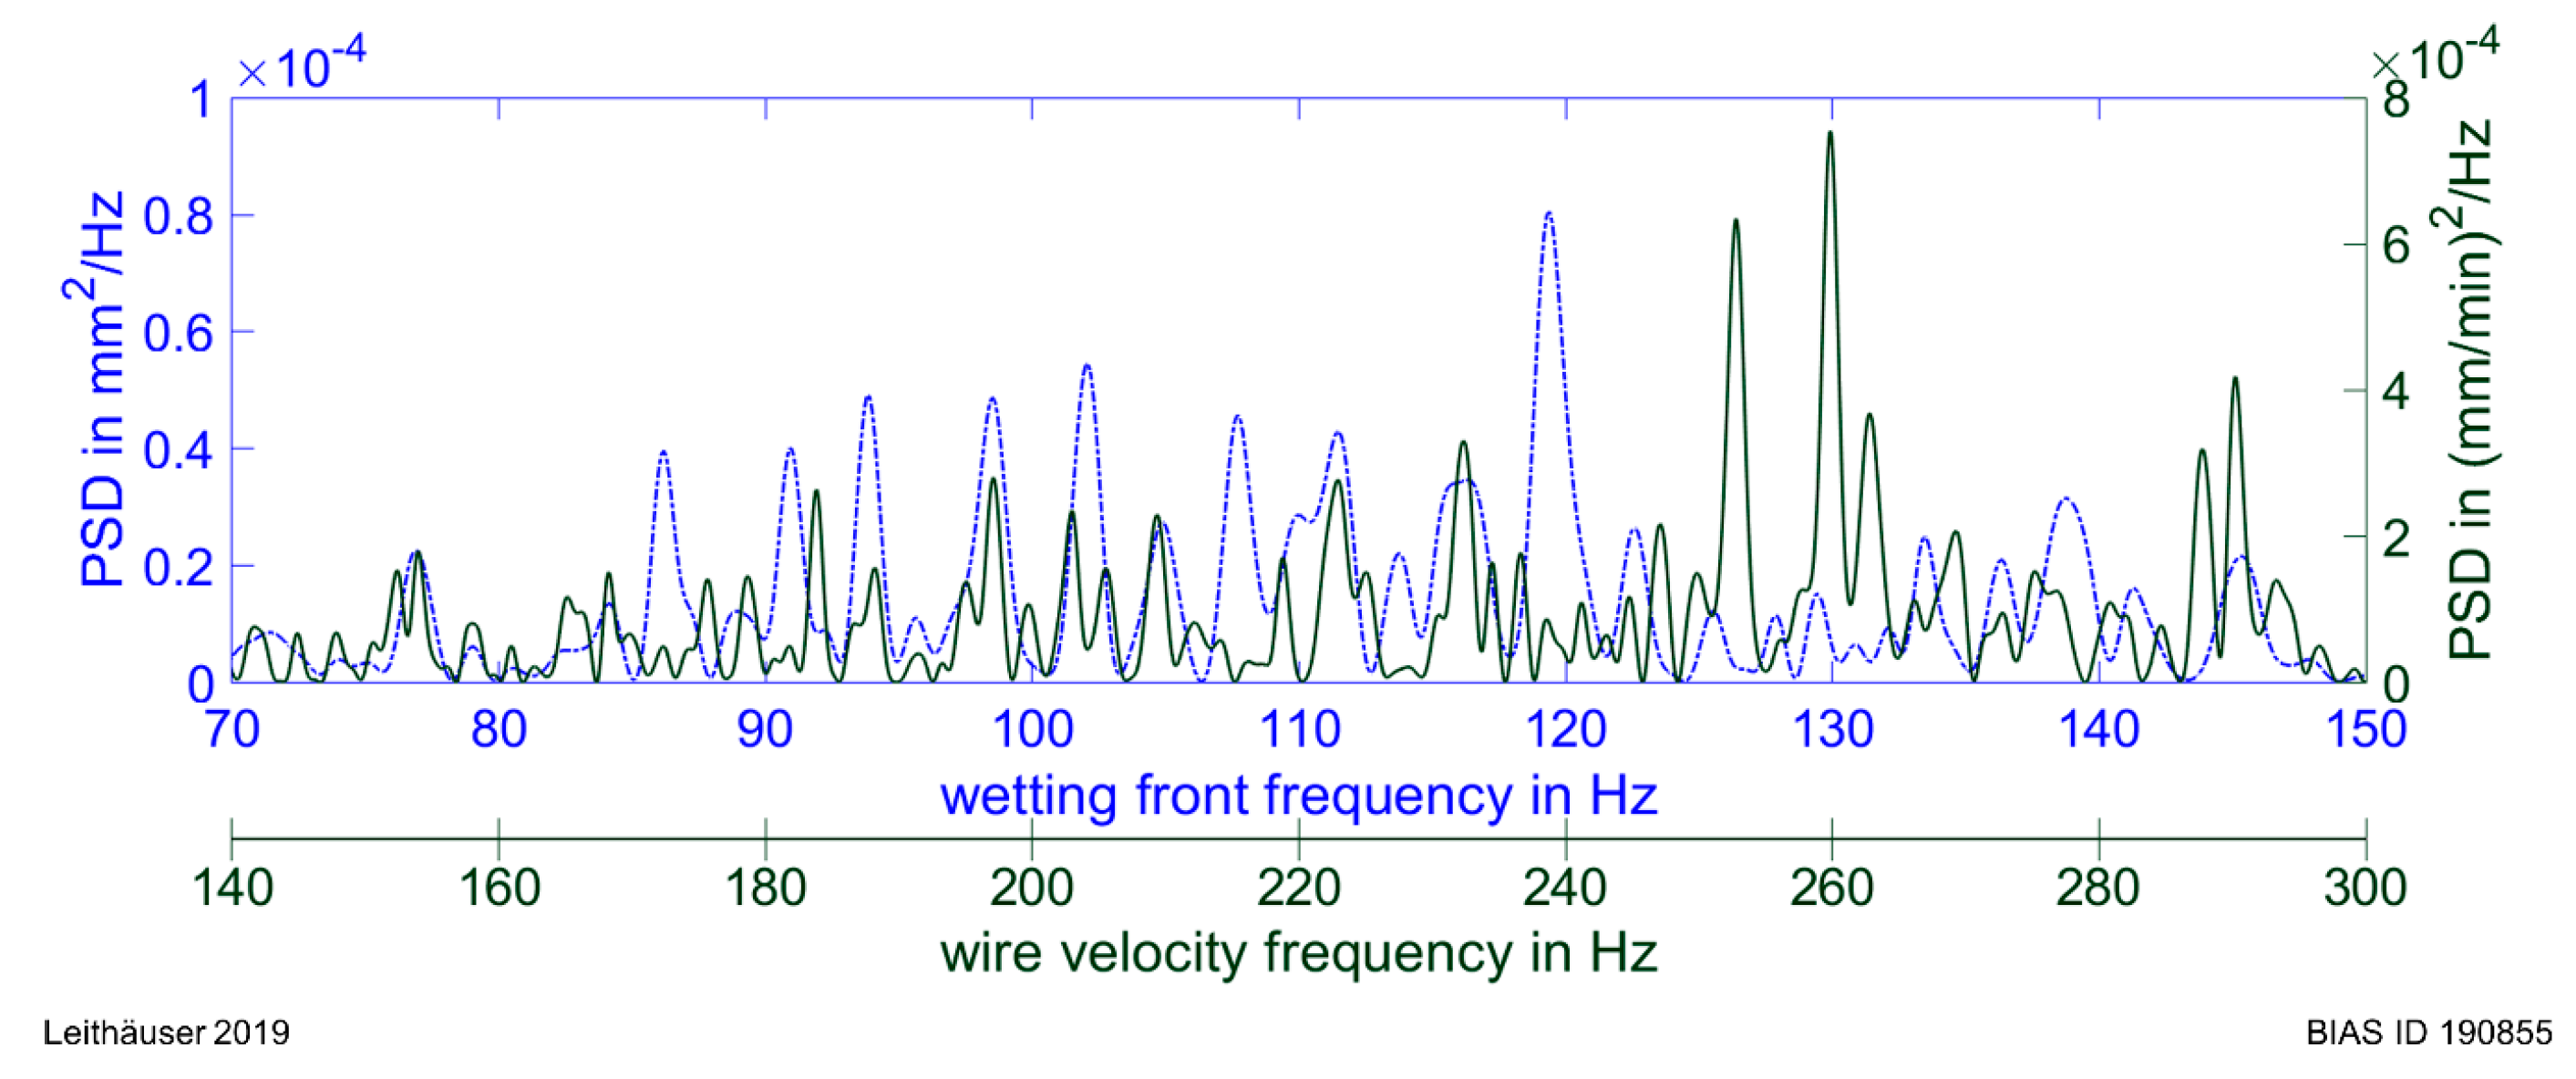
10] as a cause for inhomogeneities in the melt pool. The wire feeding is mostly affected when the unmolten wire stabs into the base material. In this case, the feeding has periodic characteristics with frequencies between 160 and 400 Hz. The vibrational frequencies are rather changing in time, thus leading to a broad spectrum. When the wire collides with the base material, the resulting vibrations are transferred to the melt pool at half the frequency. These disturbances are nonexistent when the wire is sufficiently melted prior to touching the base material.
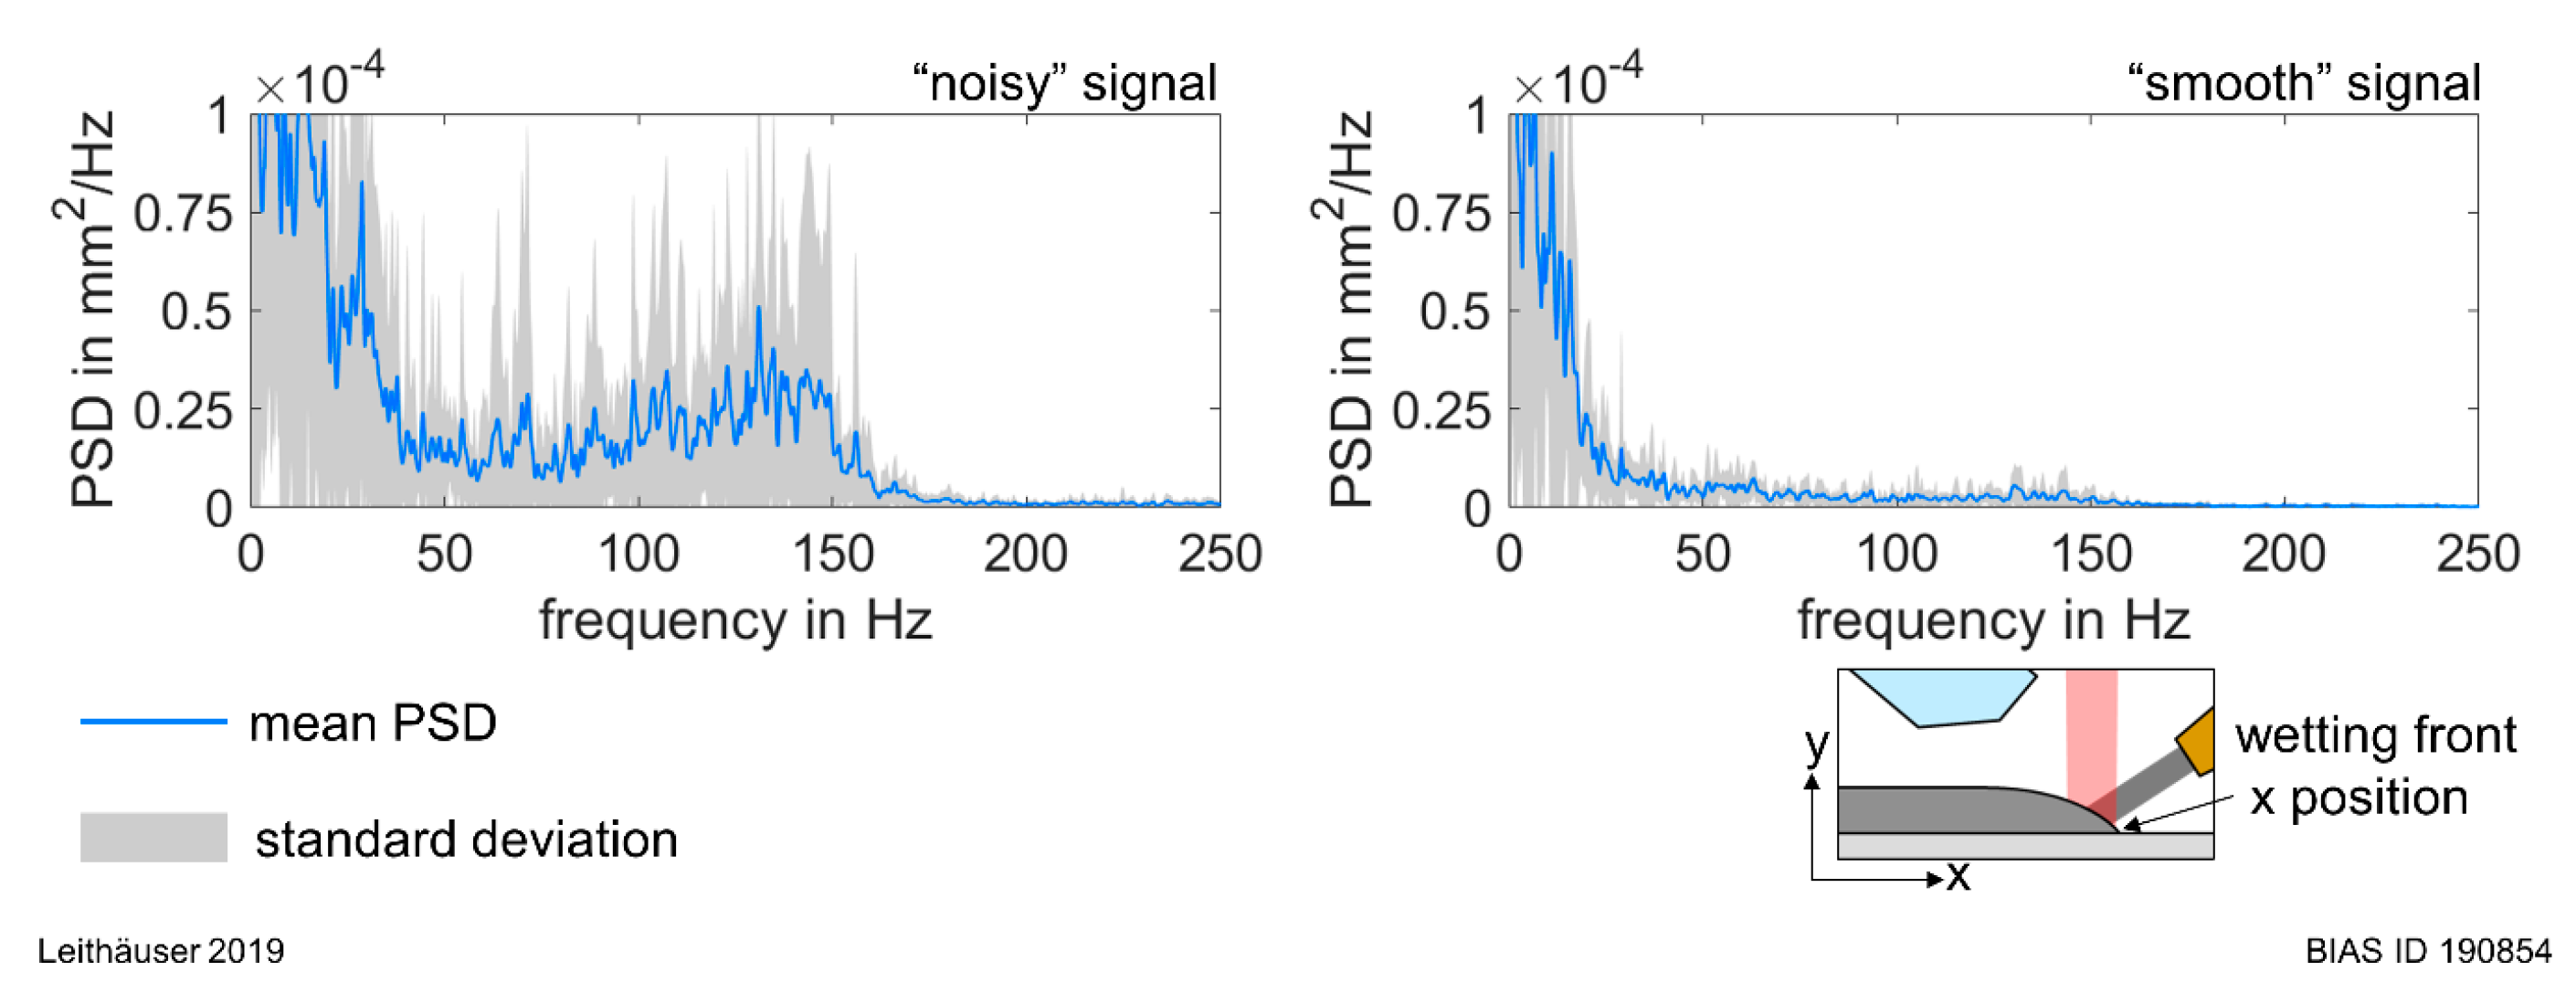
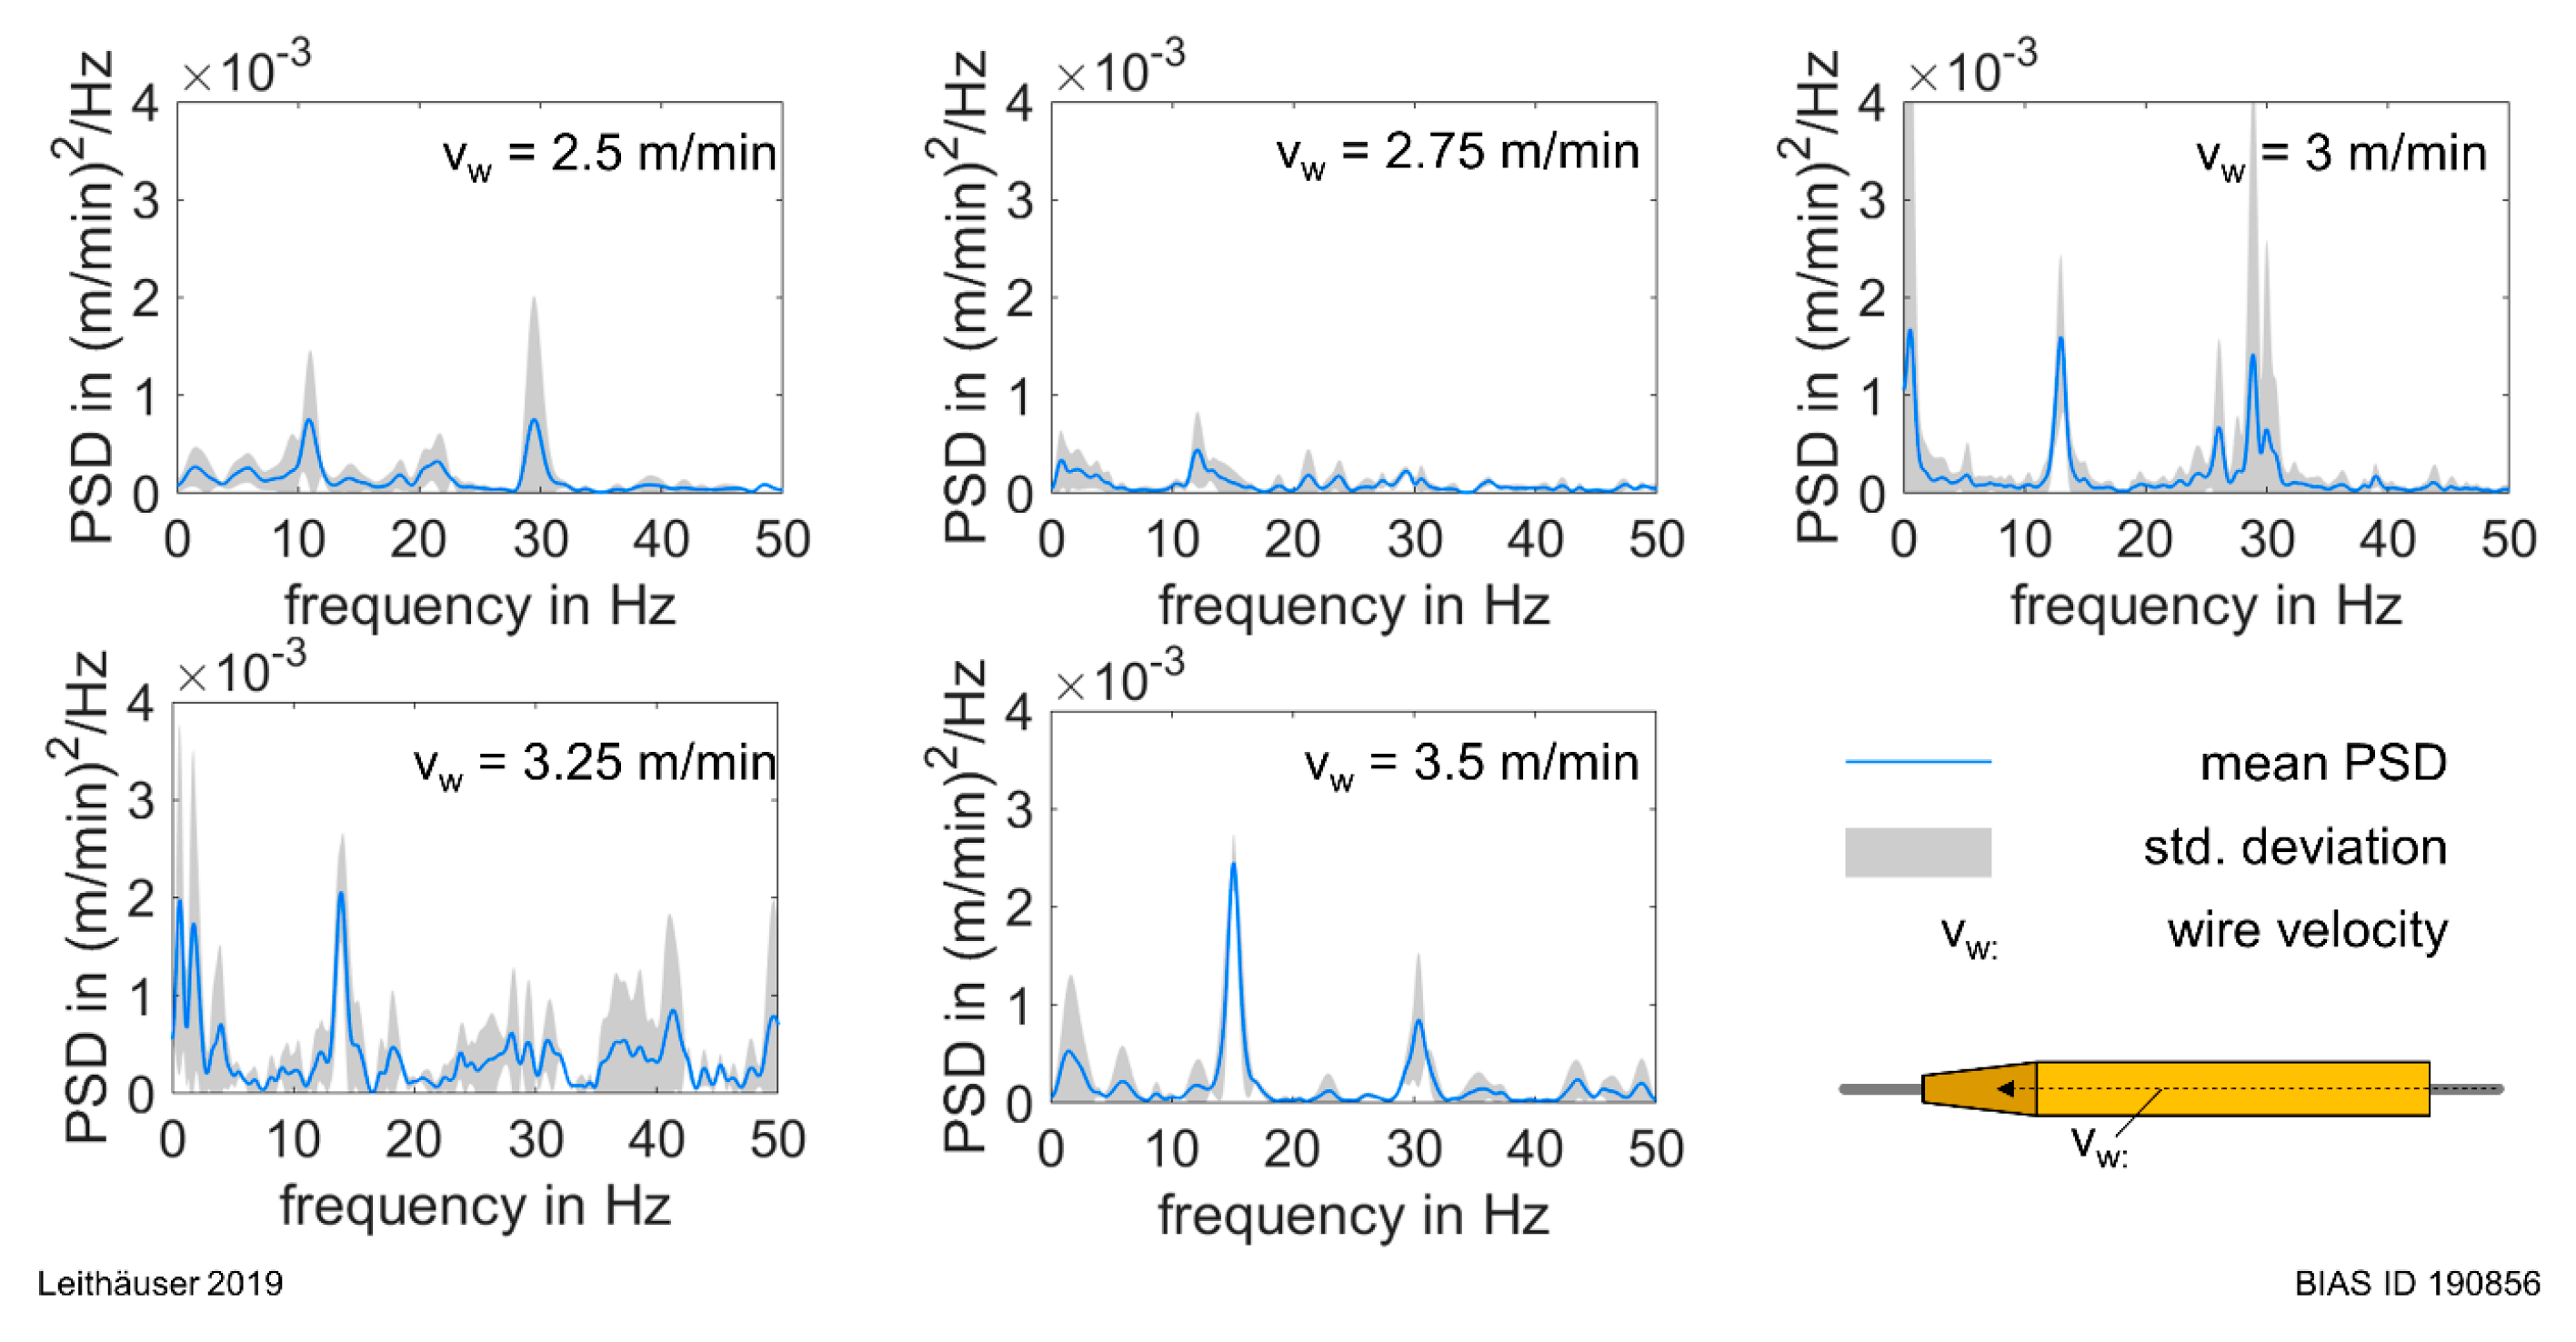
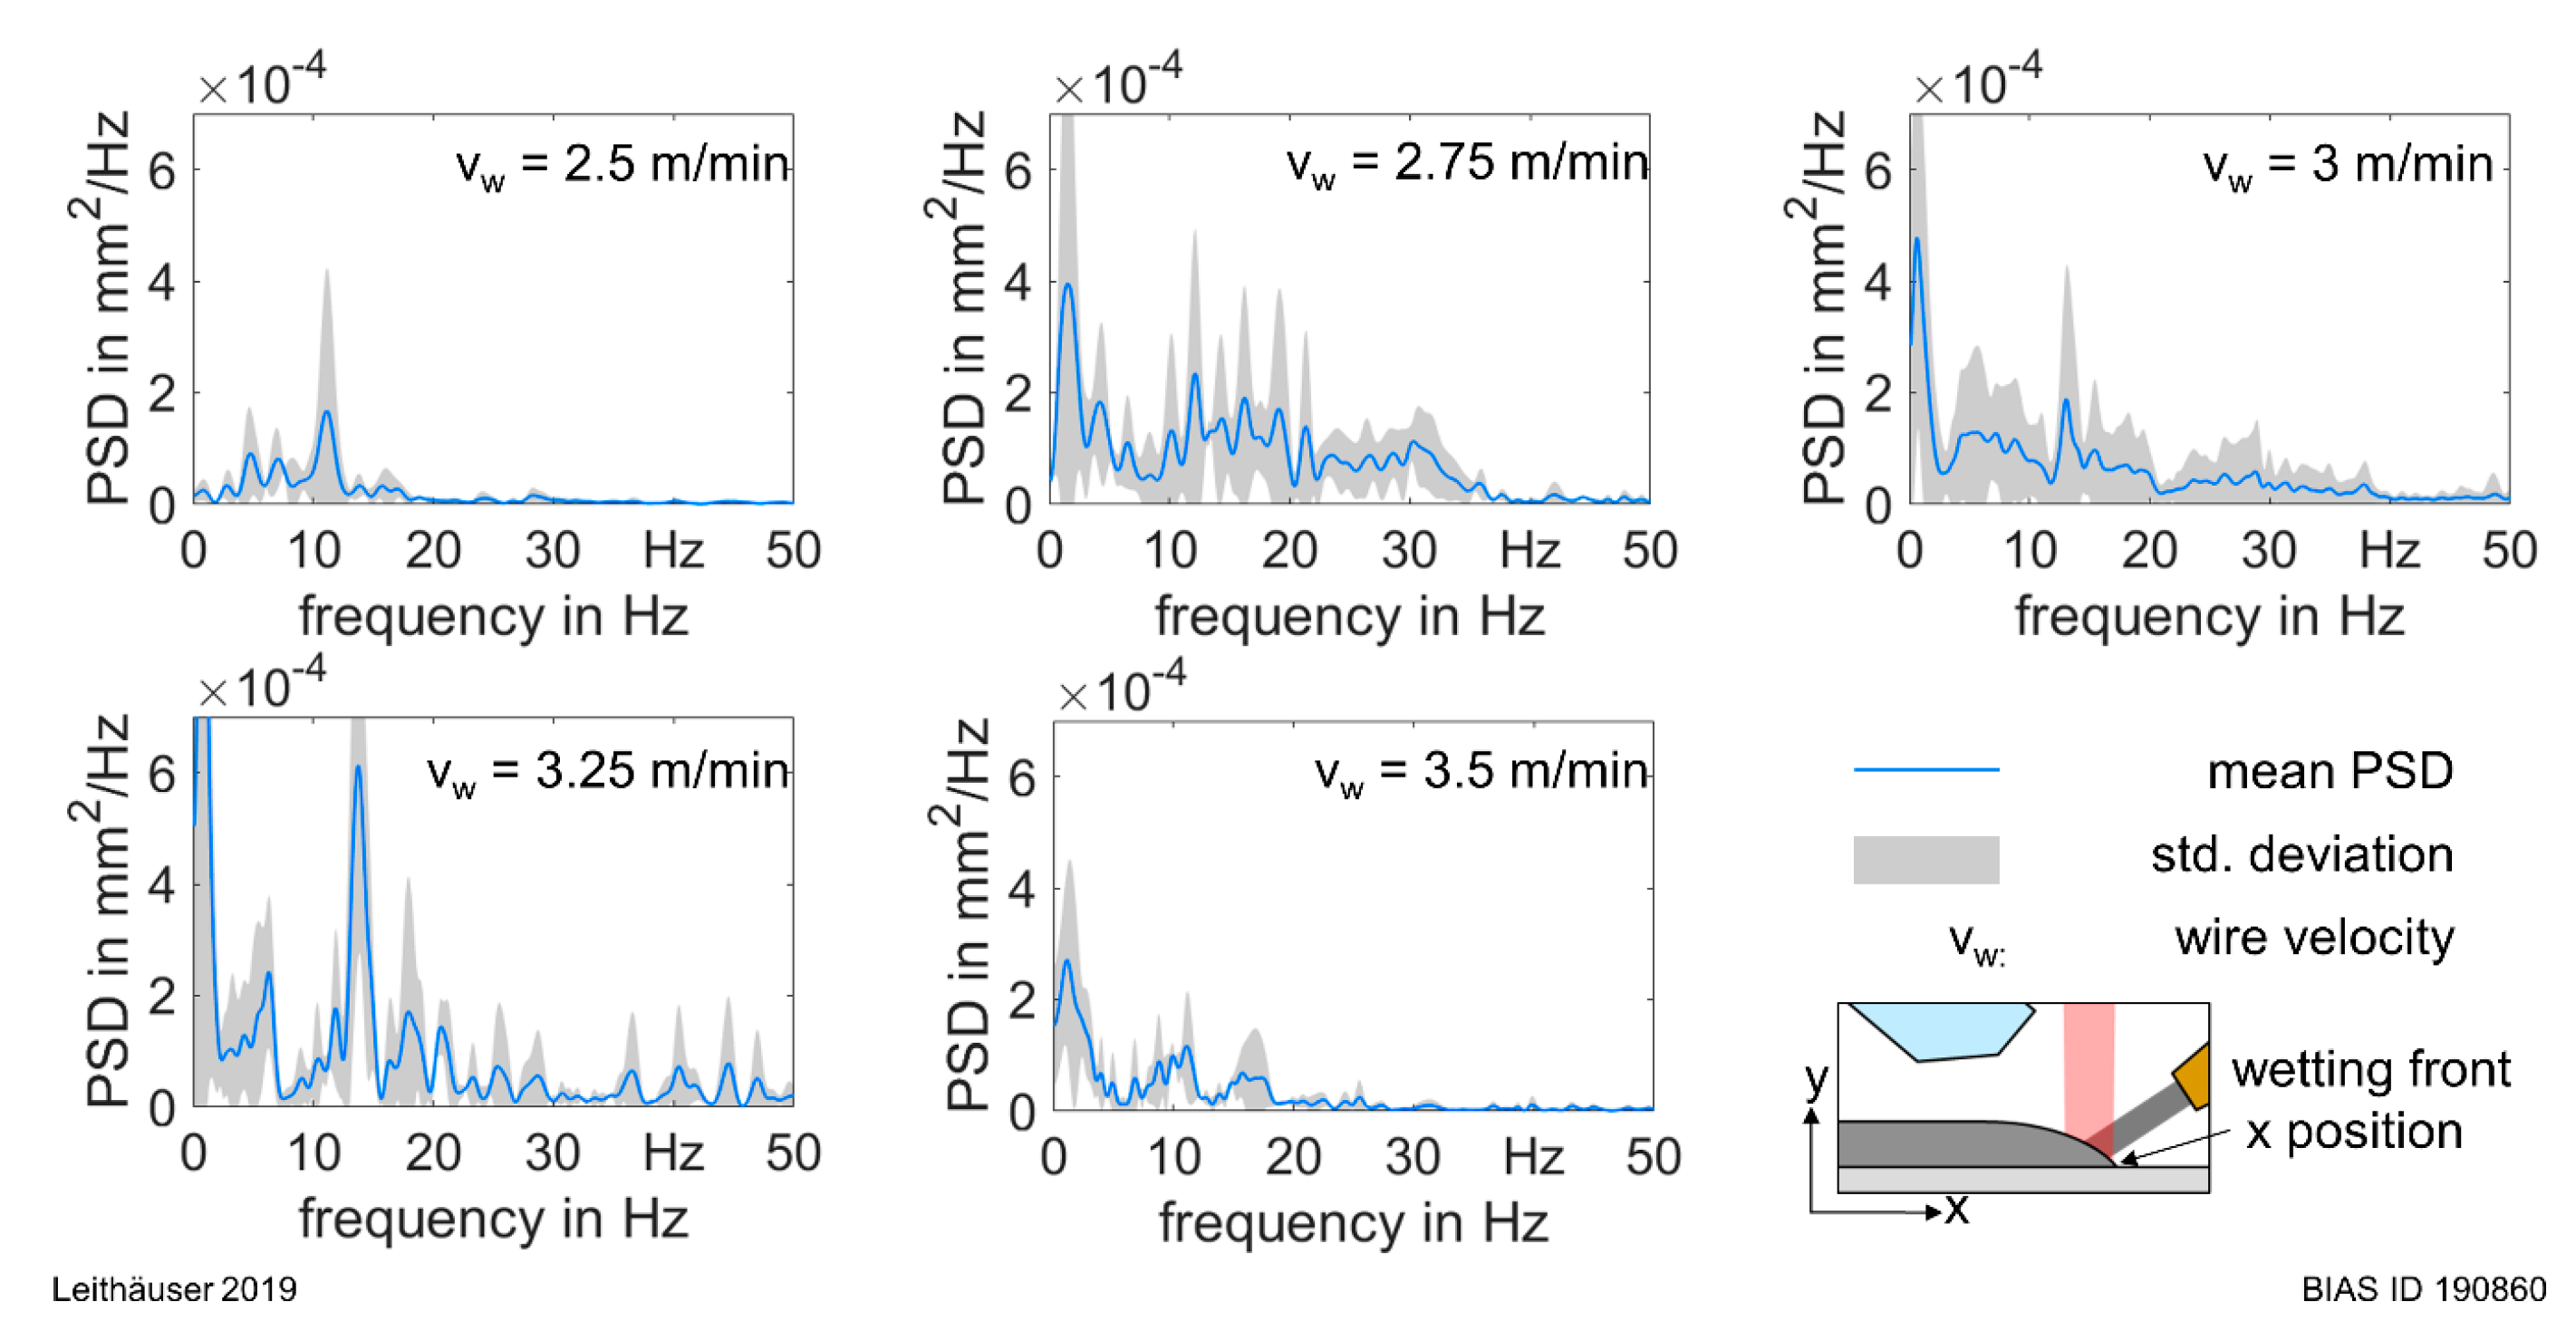
Independently from the previously discussed oscillations, in the setup, some periodicity appeared in the wire feeding, which might have been caused by the wire feeder itself because it is directly related to the feed rate. The frequencies are lower at 11 to 15 Hz and are transferred to the wetting front in phase. This oscillation has an amplitude which is in the range of 2.5 times greater than the higher frequencies.
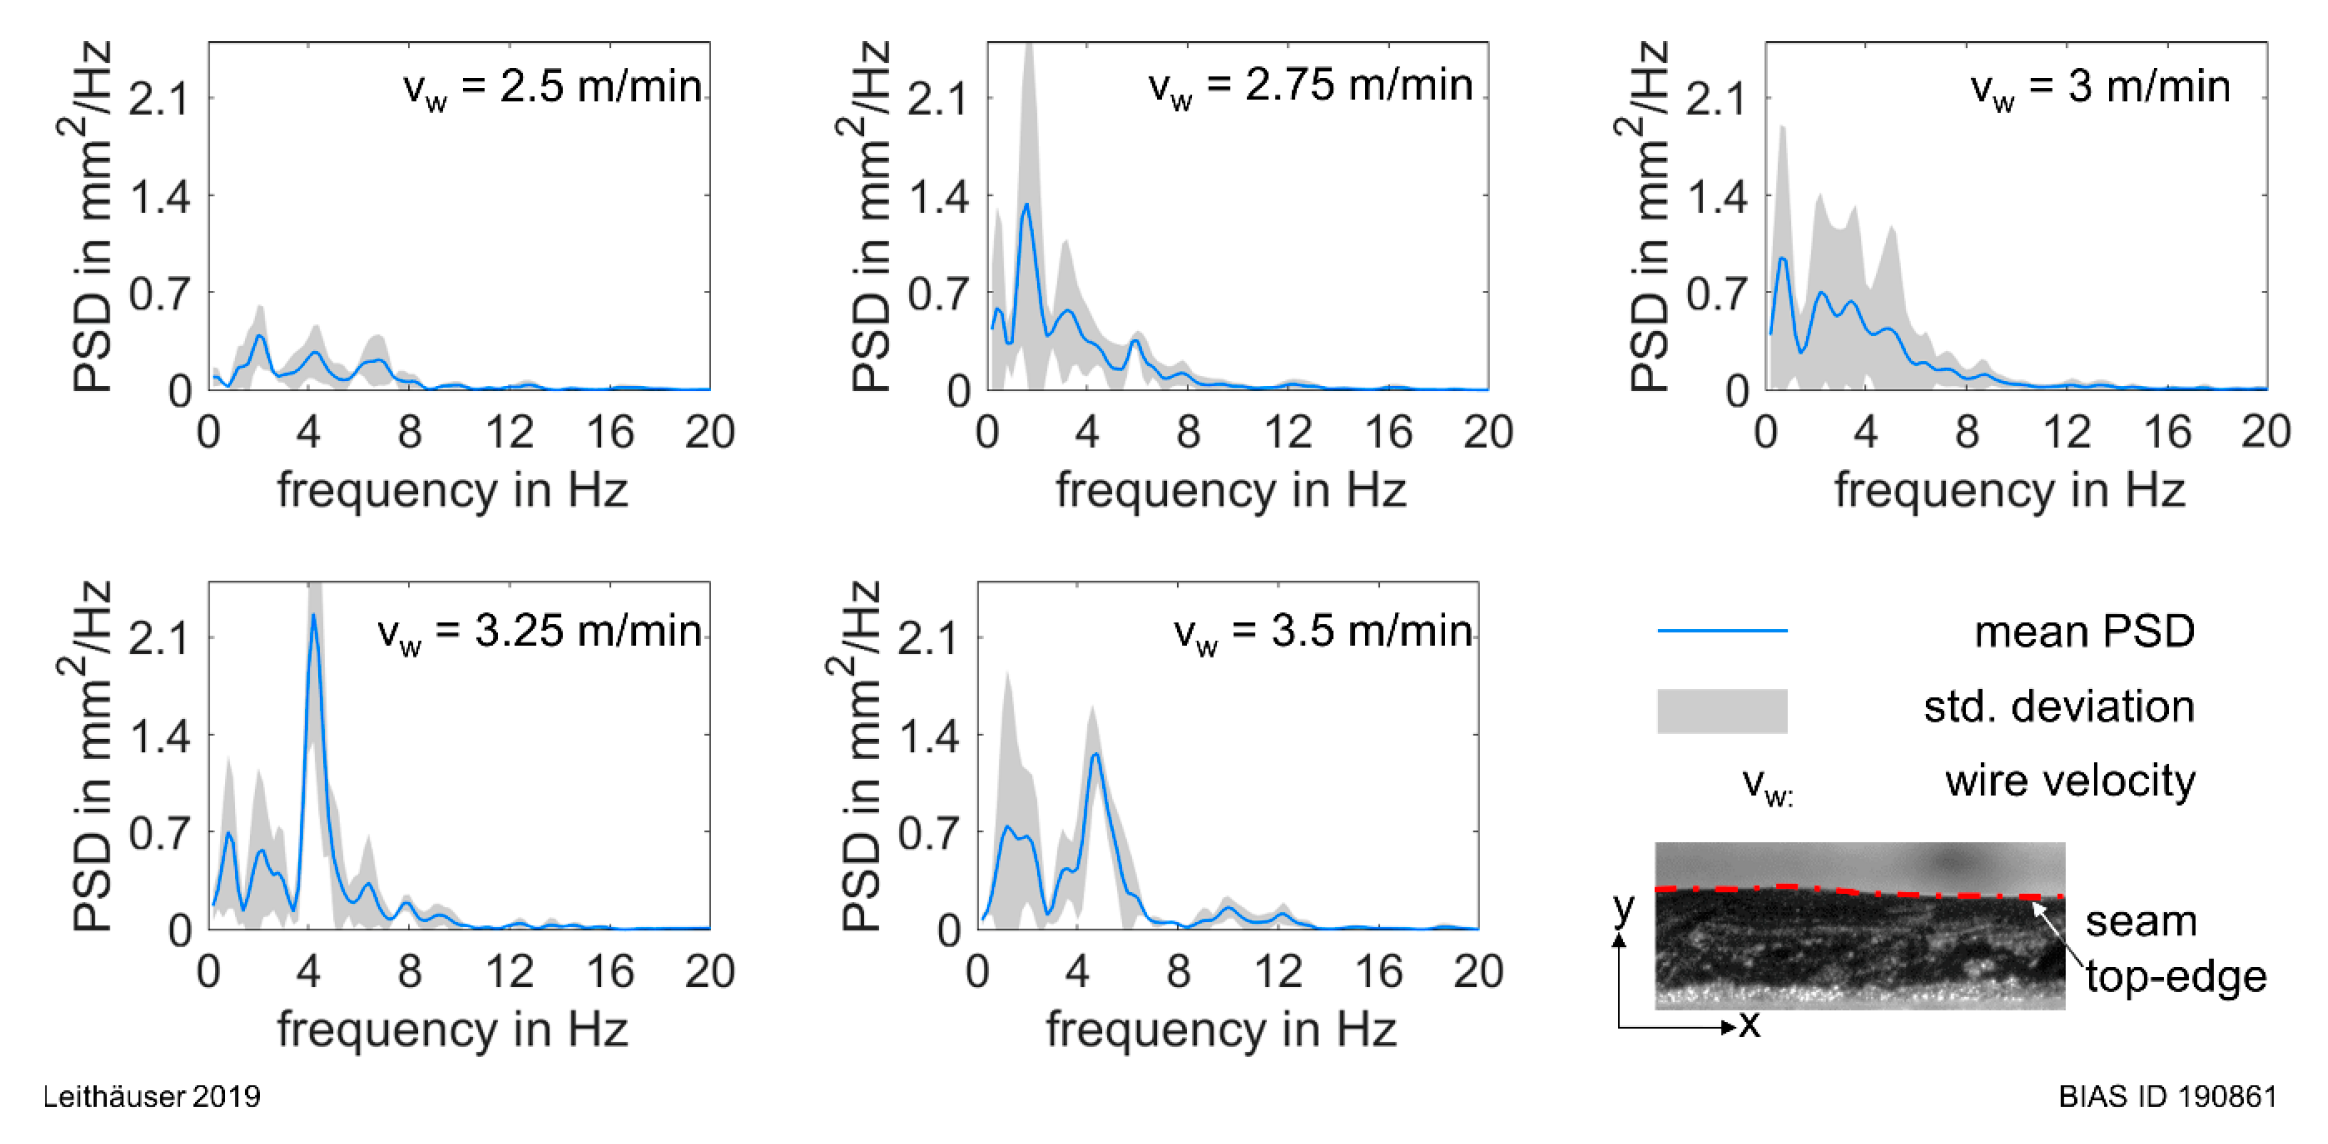
An irregular surface height of the seam can be identified with a periodic characteristic in the frequency of 4 to 6 Hz; this becomes more distinct when the wire is fed with a higher velocity, but no direct correlation can be made to the appearing wetting frequencies as the period length is from 6 to 8 mm at brazing speeds of 2 m/min, which is significantly higher than the oscillating length of the wetting front.

5. Conclusions

The following conclusions can be drawn based on these studies:
  • Interactions between the unmolten wire and the base material cause oscillations in the wire feeding speed in the range of 160 to 400 Hz, being transferred to the wetting front movement with half of the frequency.
  • The oscillations of the wire velocity in the frequency range of 11 to 15 Hz, caused by the wire feeder, affect the wetting front propagation with the same frequency.

Author Contributions

Conceptualization, P.W. and T.L.; methodology, T.L. and P.W.; data analysis, T.L.; investigation, T.L.; writing—original draft preparation, T.L.; writing—review and editing, P.W.; visualization, T.L.; supervision, P.W.; project administration, P.W.; funding acquisition, P.W.

Funding

This work was accomplished within the Center of Competence for Welding of Aluminum Alloys Centr-Al. Funding by the Deutsche Forschungsgemeinschaft (DFG, German Research Foundation, project number 376511346) is gratefully acknowledged.

Conflicts of Interest

The authors declare no conflict of interest.

References

  1. Grimm, A.; Schmidt, M. Possibilities for Online Process Monitoring at Laser Brazing Based on Two Dimensional Detector Systems. In Proceedings of the 28th International Congress on Applications of Laser & Electro Optics, Orlando, FL, USA, 2–5 November 2009. [Google Scholar]
  2. Grimm, A. Process Analysis and Monitoring of Laser Beam Brazing Using Optical Sensors; Meisenbach Verlag: Bamberg, Germany, 2012. [Google Scholar]
  3. Heitmanek, M. Reduction of Seam Imperfections During Laser Beam Brazing; Imprint Dresden: Dresden, Germany, 2014. [Google Scholar]
  4. Heitmanek, M.; Dobler, M.; Graudenz, M.; Perret, W.; Göbel, G.; Schmidt, M.; Beyer, E. Laser Brazing with Beam Scanning: Experimental and Simulative Analysis. Phys. Procedia 2014, 56, 689–698. [Google Scholar] [CrossRef] [Green Version]
  5. Engelbrecht, L. Effects on Laser Brazing of Roof Seam Using Diodelasers with Adapted Beam Characteristics; Proc. of EALA: Bad Nauheim, Germany, 2009. [Google Scholar]
  6. Klocke, F.; Castell-Codesal, A.; Donst, D. Process Characteristics of Laser Brazing Aluminium Alloys. AMR 2005, 6–8, 135–142. [Google Scholar] [CrossRef]
  7. Klocke, F.; Senster, P.; Castell-Codesal, A. Laser brazing of aluminum: Current issues and solutions. WT Werkstattstech. Online 2003, 93, 447–451. [Google Scholar]
  8. Cui, C.; Schulz, A.; Achelis, L.; Uhlenwinkel, V.; Leopold, H.; Piwek, V.; Tang, Z.; Seefeld, T. Development of low-melting-point filler materials for laser beam brazing of aluminum alloys. Mater. Werkst. 2014, 45, 717–726. [Google Scholar] [CrossRef]
  9. Heuberger, E.; Schmid, D.; Weberpals, J.-P.; Tenner, F.; Schmidt, M. Influence of the brazing speed on the seam characteristics in laser beam brazing of zinc coated steel. J. Laser Appl. 2019, 31, 022407. [Google Scholar] [CrossRef]
  10. Reimann, W. Development of a Laser Beam Soldering Process for Hot-Dip Coated Car Body Components; Shaker Verlag: Aachen, Germany, 2018. [Google Scholar]
Figure 1. Picture of a sample with flux applied (a) before and (b) after the laser brazing.
Jmmp 03 00083 g001
Figure 2. Test setting for the bead-on-plate brazes with high-speed camera observation.
Jmmp 03 00083 g002
Figure 3. Representative images from the high-speed recording and the regions of interest (ROIs) for the wetting front and wire velocity detection.
Jmmp 03 00083 g003
Figure 4. Section of the wetting front and the wire feed rate of a representative sample.
Jmmp 03 00083 g004
Figure 5. (Left) Wire velocity over time, when the wire hits the sheet and the retained force is released periodically. (Middle) Power spectral density (PSD) of the time signal. (Right) Snapshot of the high-speed recording during these events.
Jmmp 03 00083 g005
Figure 6. (Left) Wire velocity over time, when the wire feeding is hindered by the sheet. (Middle) PSD of the time signal. (Right) Snapshot of the high-speed recording during these events.
Jmmp 03 00083 g006
Figure 7. (Left) Wire velocity over time, when the wire feeding is uninfluenced by an interaction between the solid (unmolten) wire and the sheet. (Middle) PSD of the time signal. (Right) Snapshot of the high-speed recording during these events.
Jmmp 03 00083 g007
Figure 8. Mean PSD and standard deviation of the wire velocity, including all samples with (left) and without (right) dominant frequencies between 160 and 400 Hz.
Jmmp 03 00083 g008
Figure 9. Mean PSD and standard deviation of the wetting front, including all samples with (left) and without (right) dominant frequencies between 160 and 400 Hz.
Jmmp 03 00083 g009
Figure 10. PSD of the wire velocity and, at half scale, the wetting front of one representative sample.
Jmmp 03 00083 g010
Figure 11. Mean PSDs and standard deviations of the wire velocity for wire feed rates between 2.5 and 3.5 m/min.
Jmmp 03 00083 g011
Figure 12. Mean PSDs and standard deviations of the wetting front for wire feed rates between 2.5 and 3.5 m/min.
Jmmp 03 00083 g012
Figure 13. Mean PSDs and standard deviations of the seam height for wire feed rates between 2.5 and 3.5 m/min.
Jmmp 03 00083 g013

