Scale, Material Concentration, Stress Relief and Part Removal Effects on the Dimensional Behaviour of Selected AlSi10Mg Components Manufactured by Laser Powder Bed Fusion


Abstract
:1. Introduction
2. Methodology
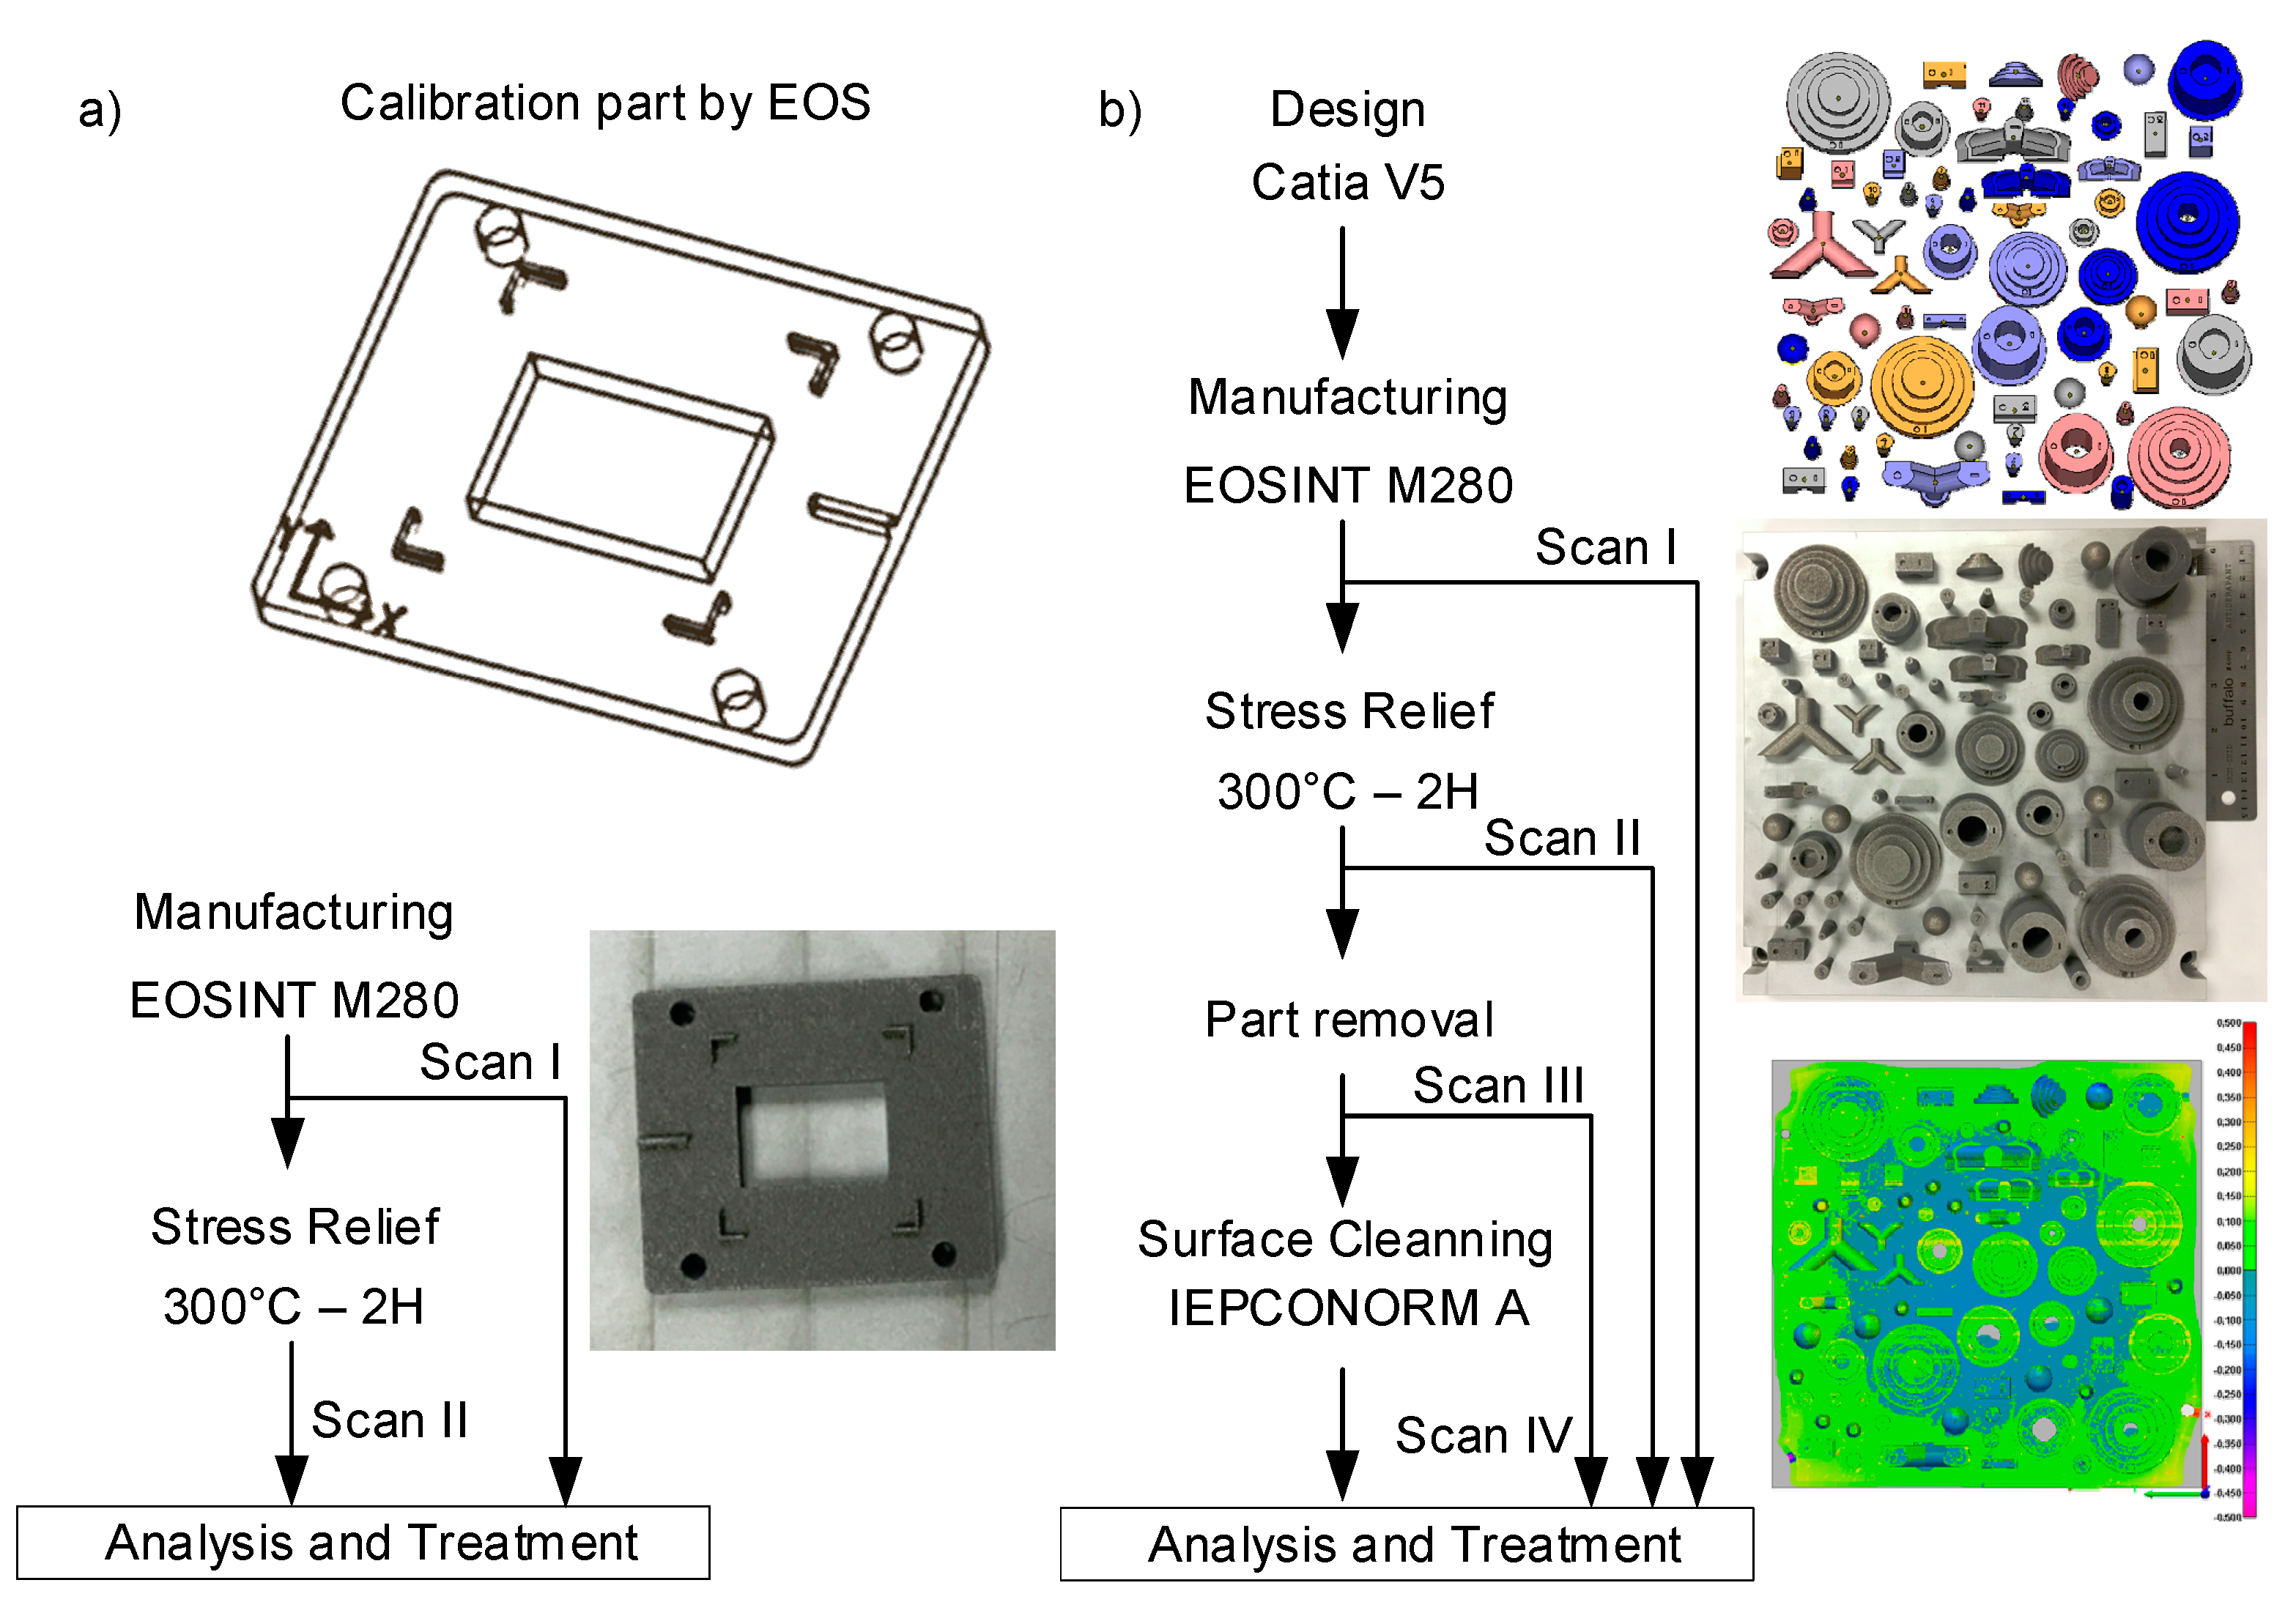
2.1. Analysis A—Calibration Part
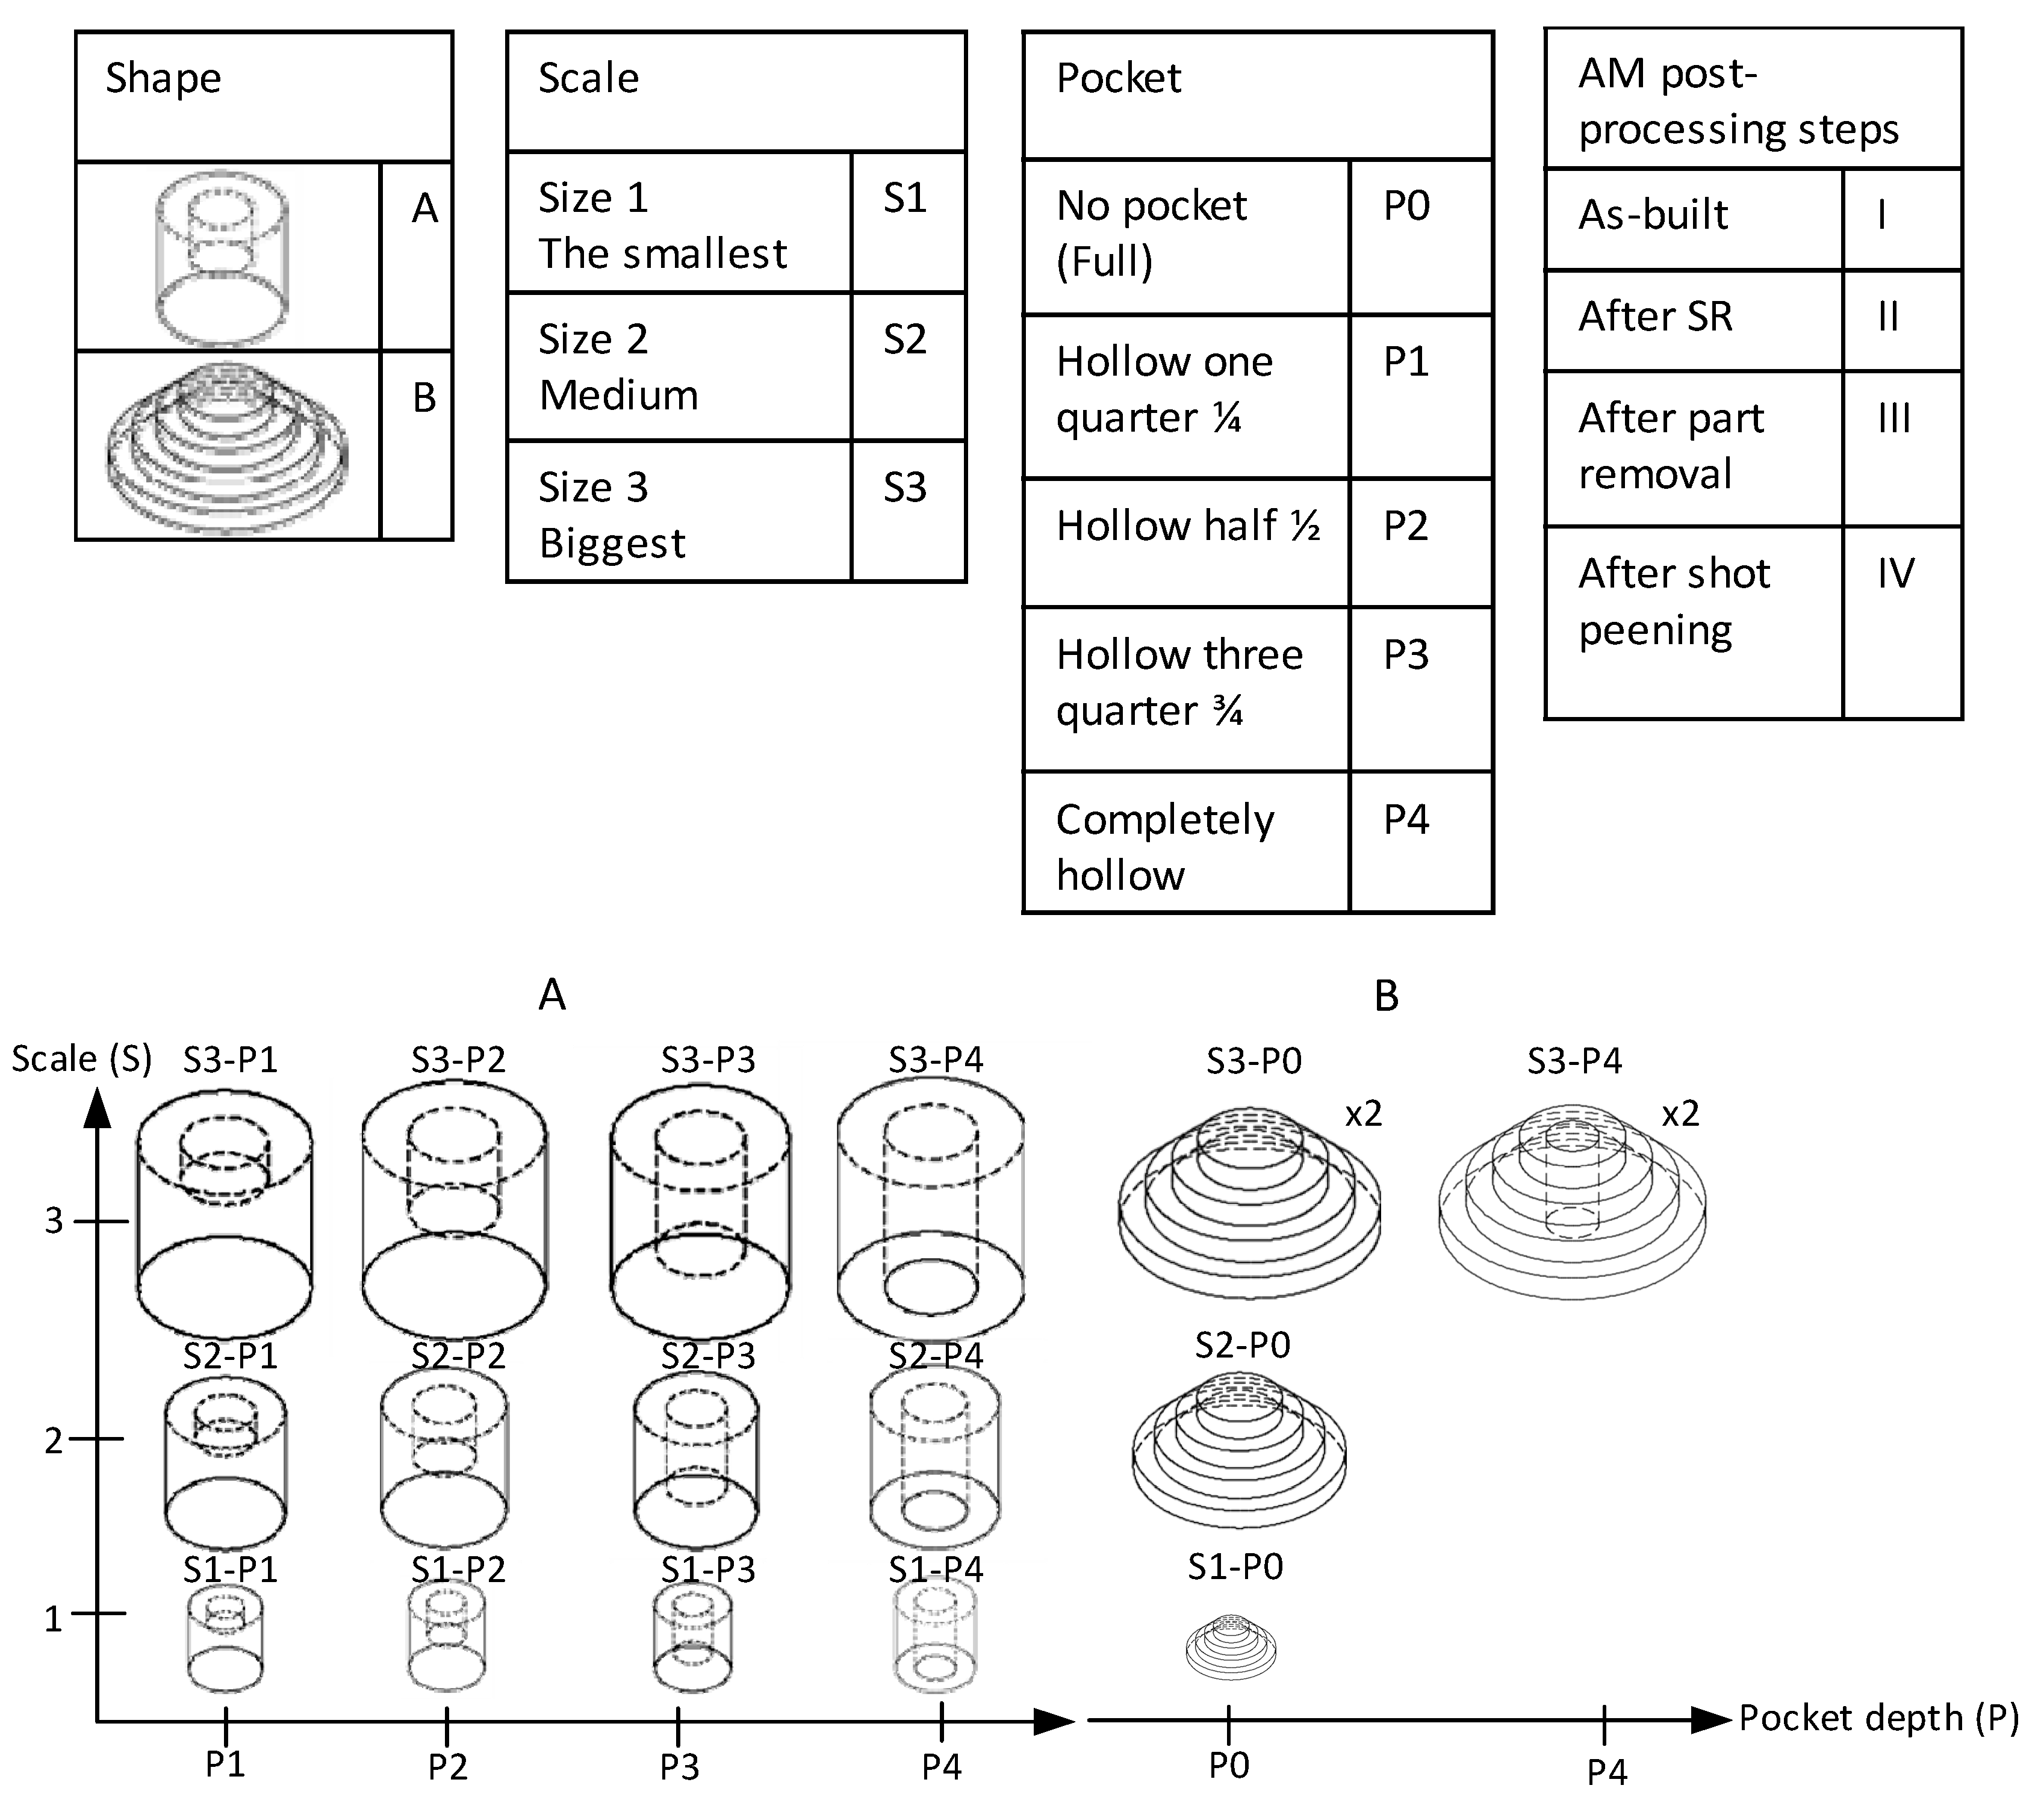
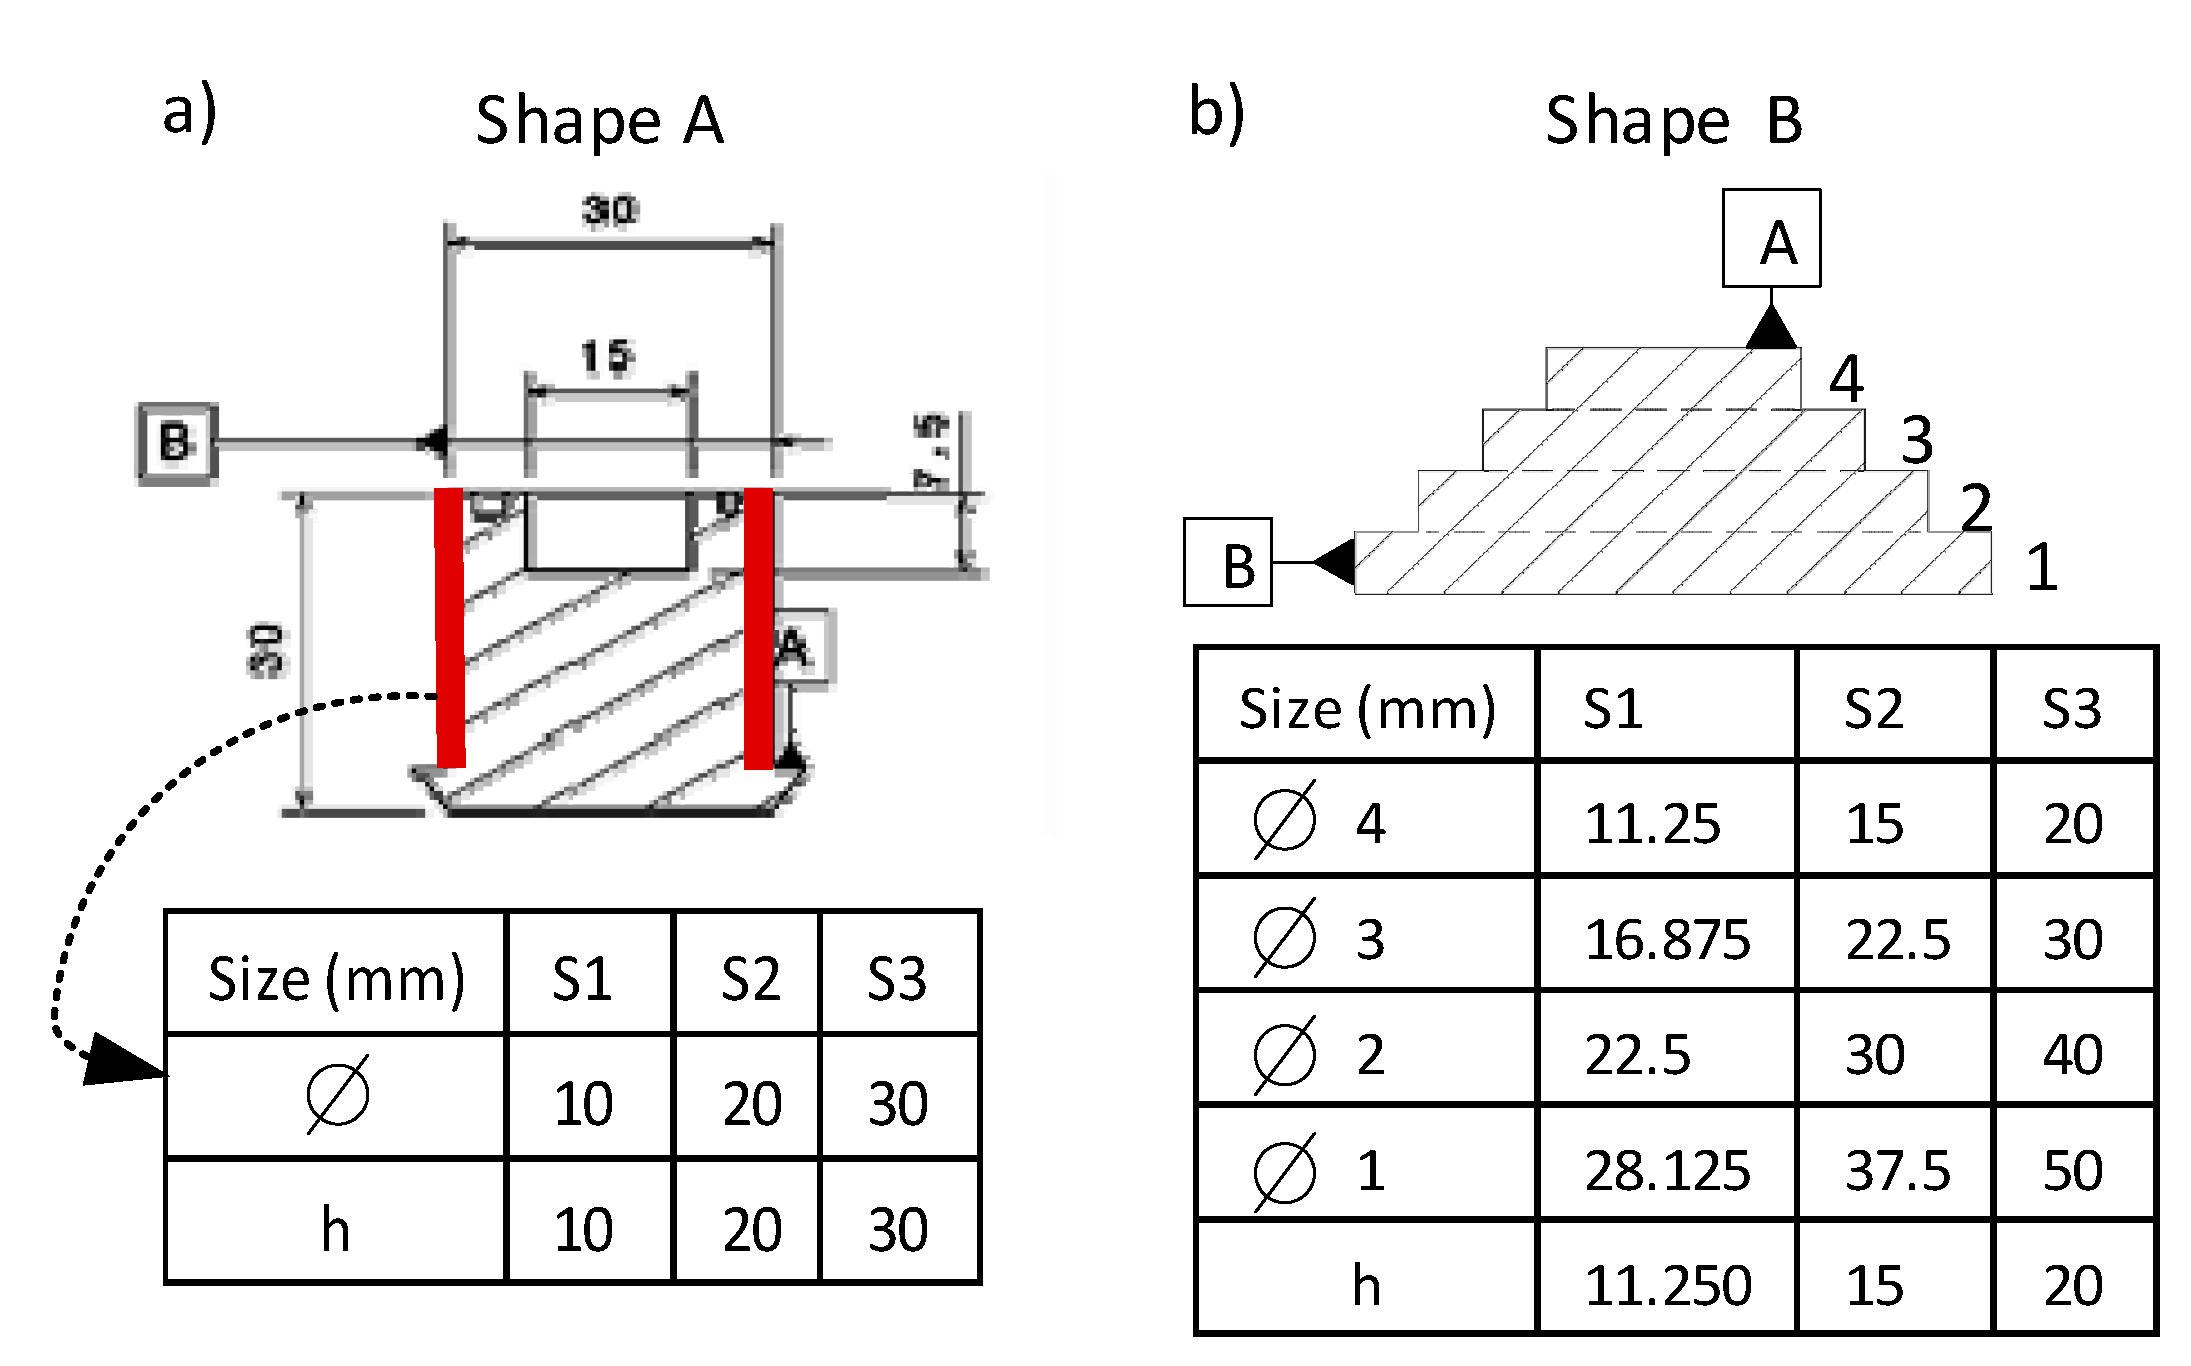
2.2. Analysis B—Scale Effect
2.3. Analysis C—Material Concentration Effect
2.4. Analysis D—Post-Processing Effect
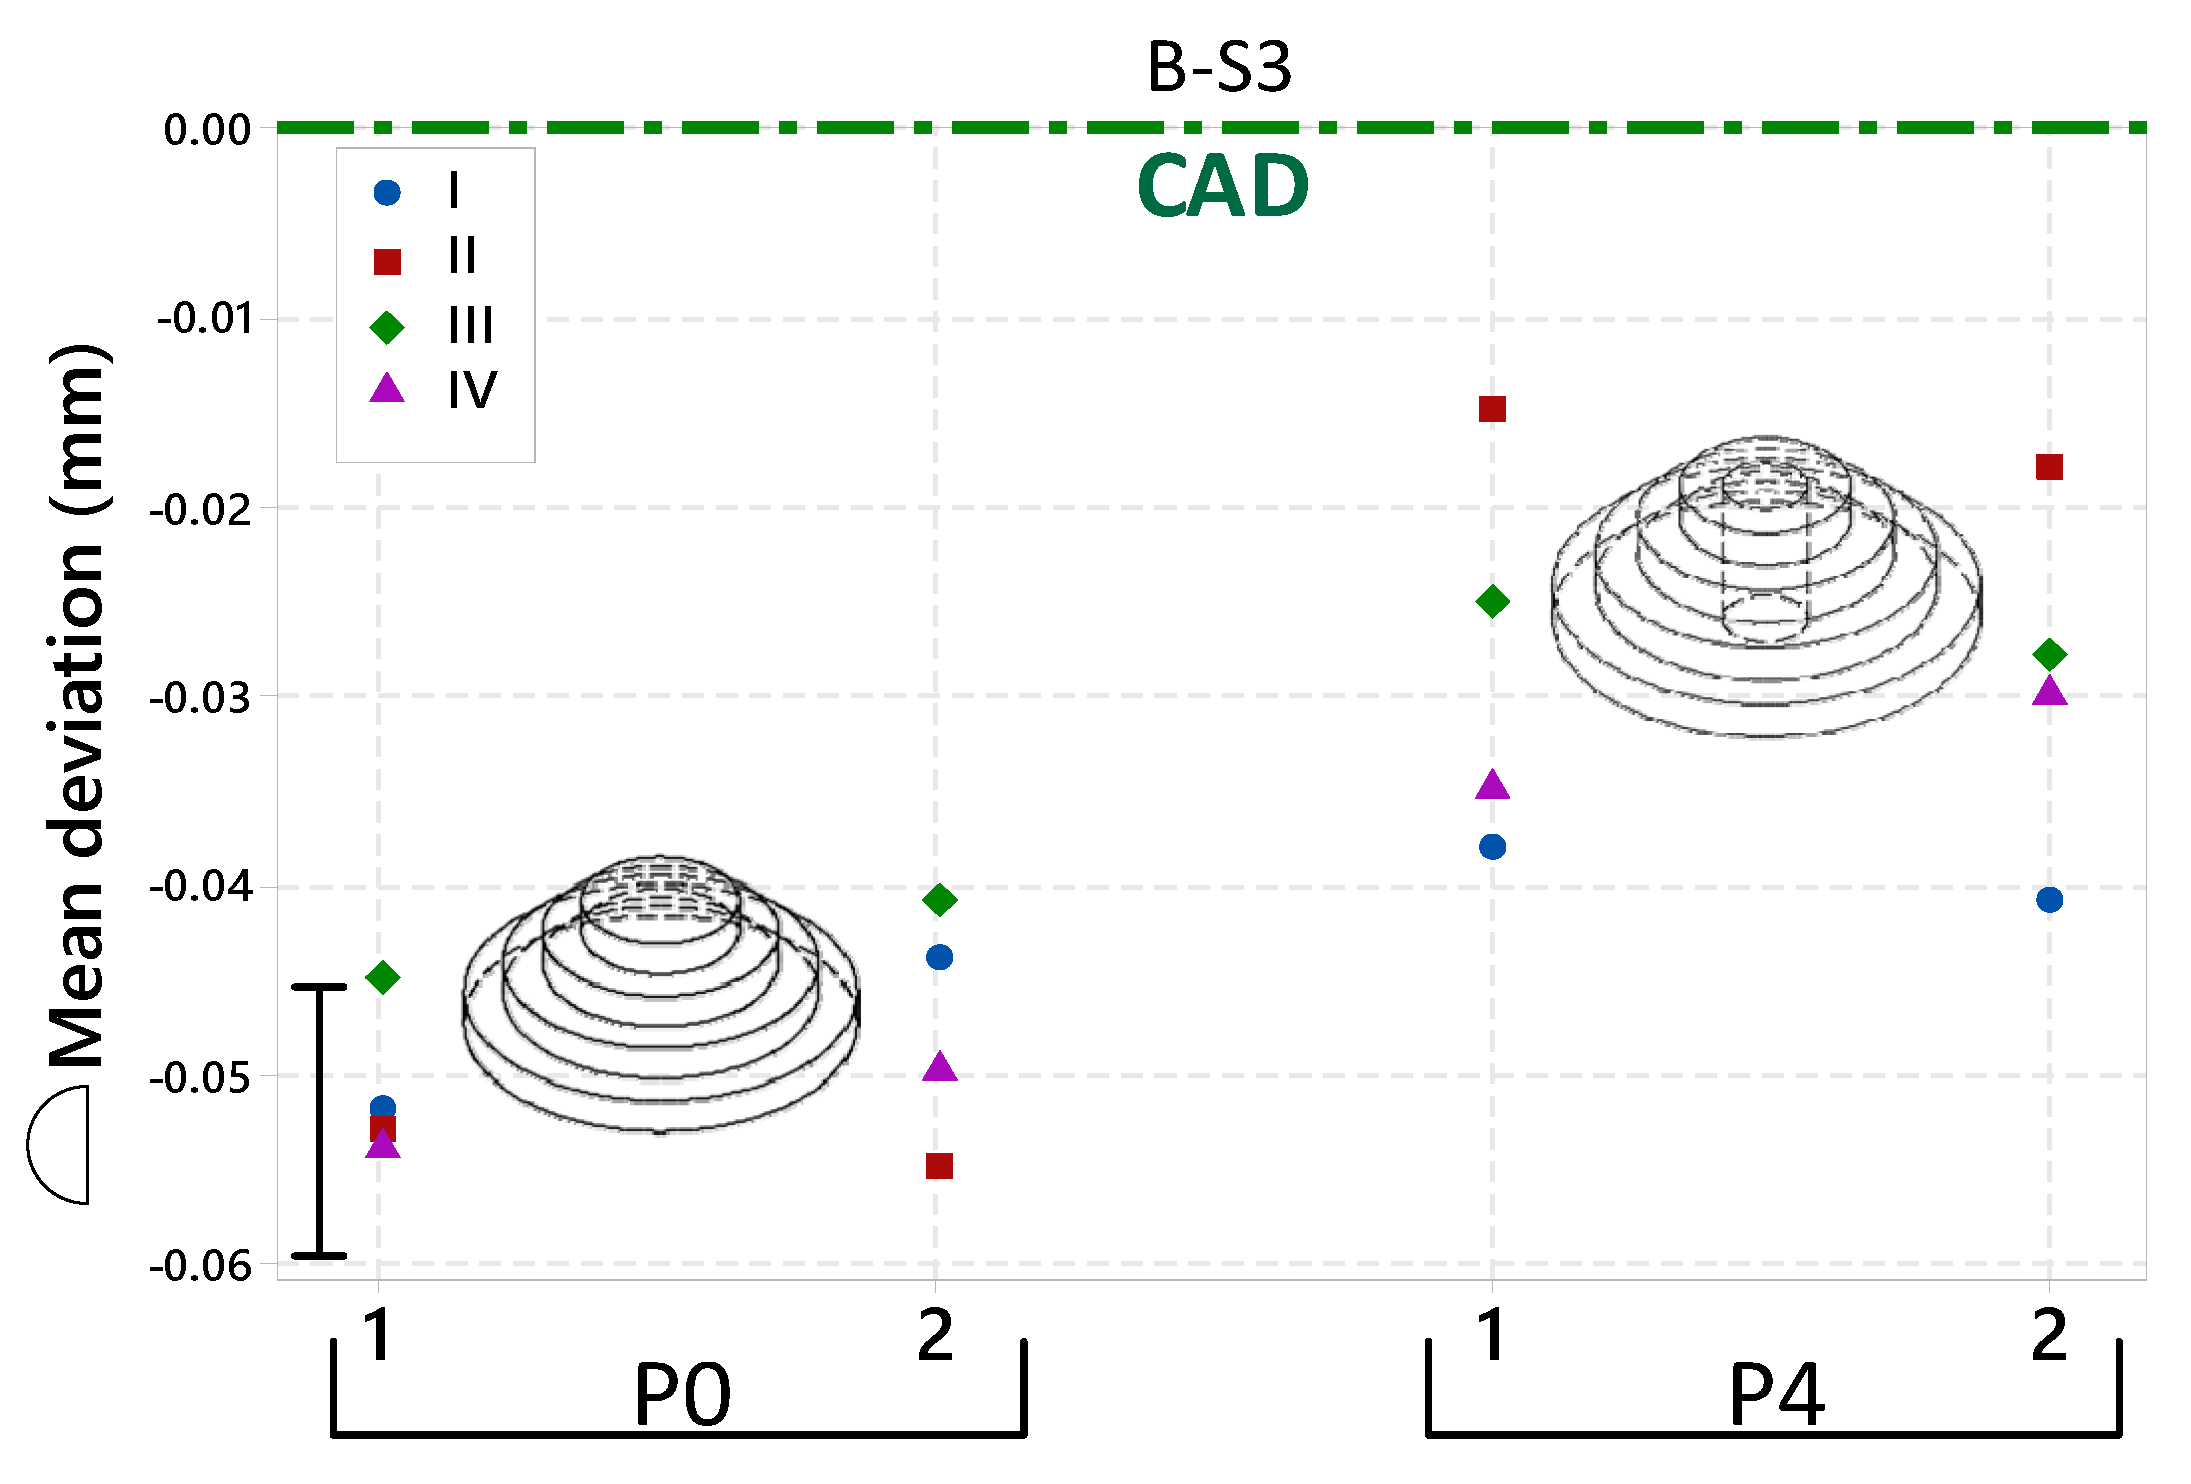
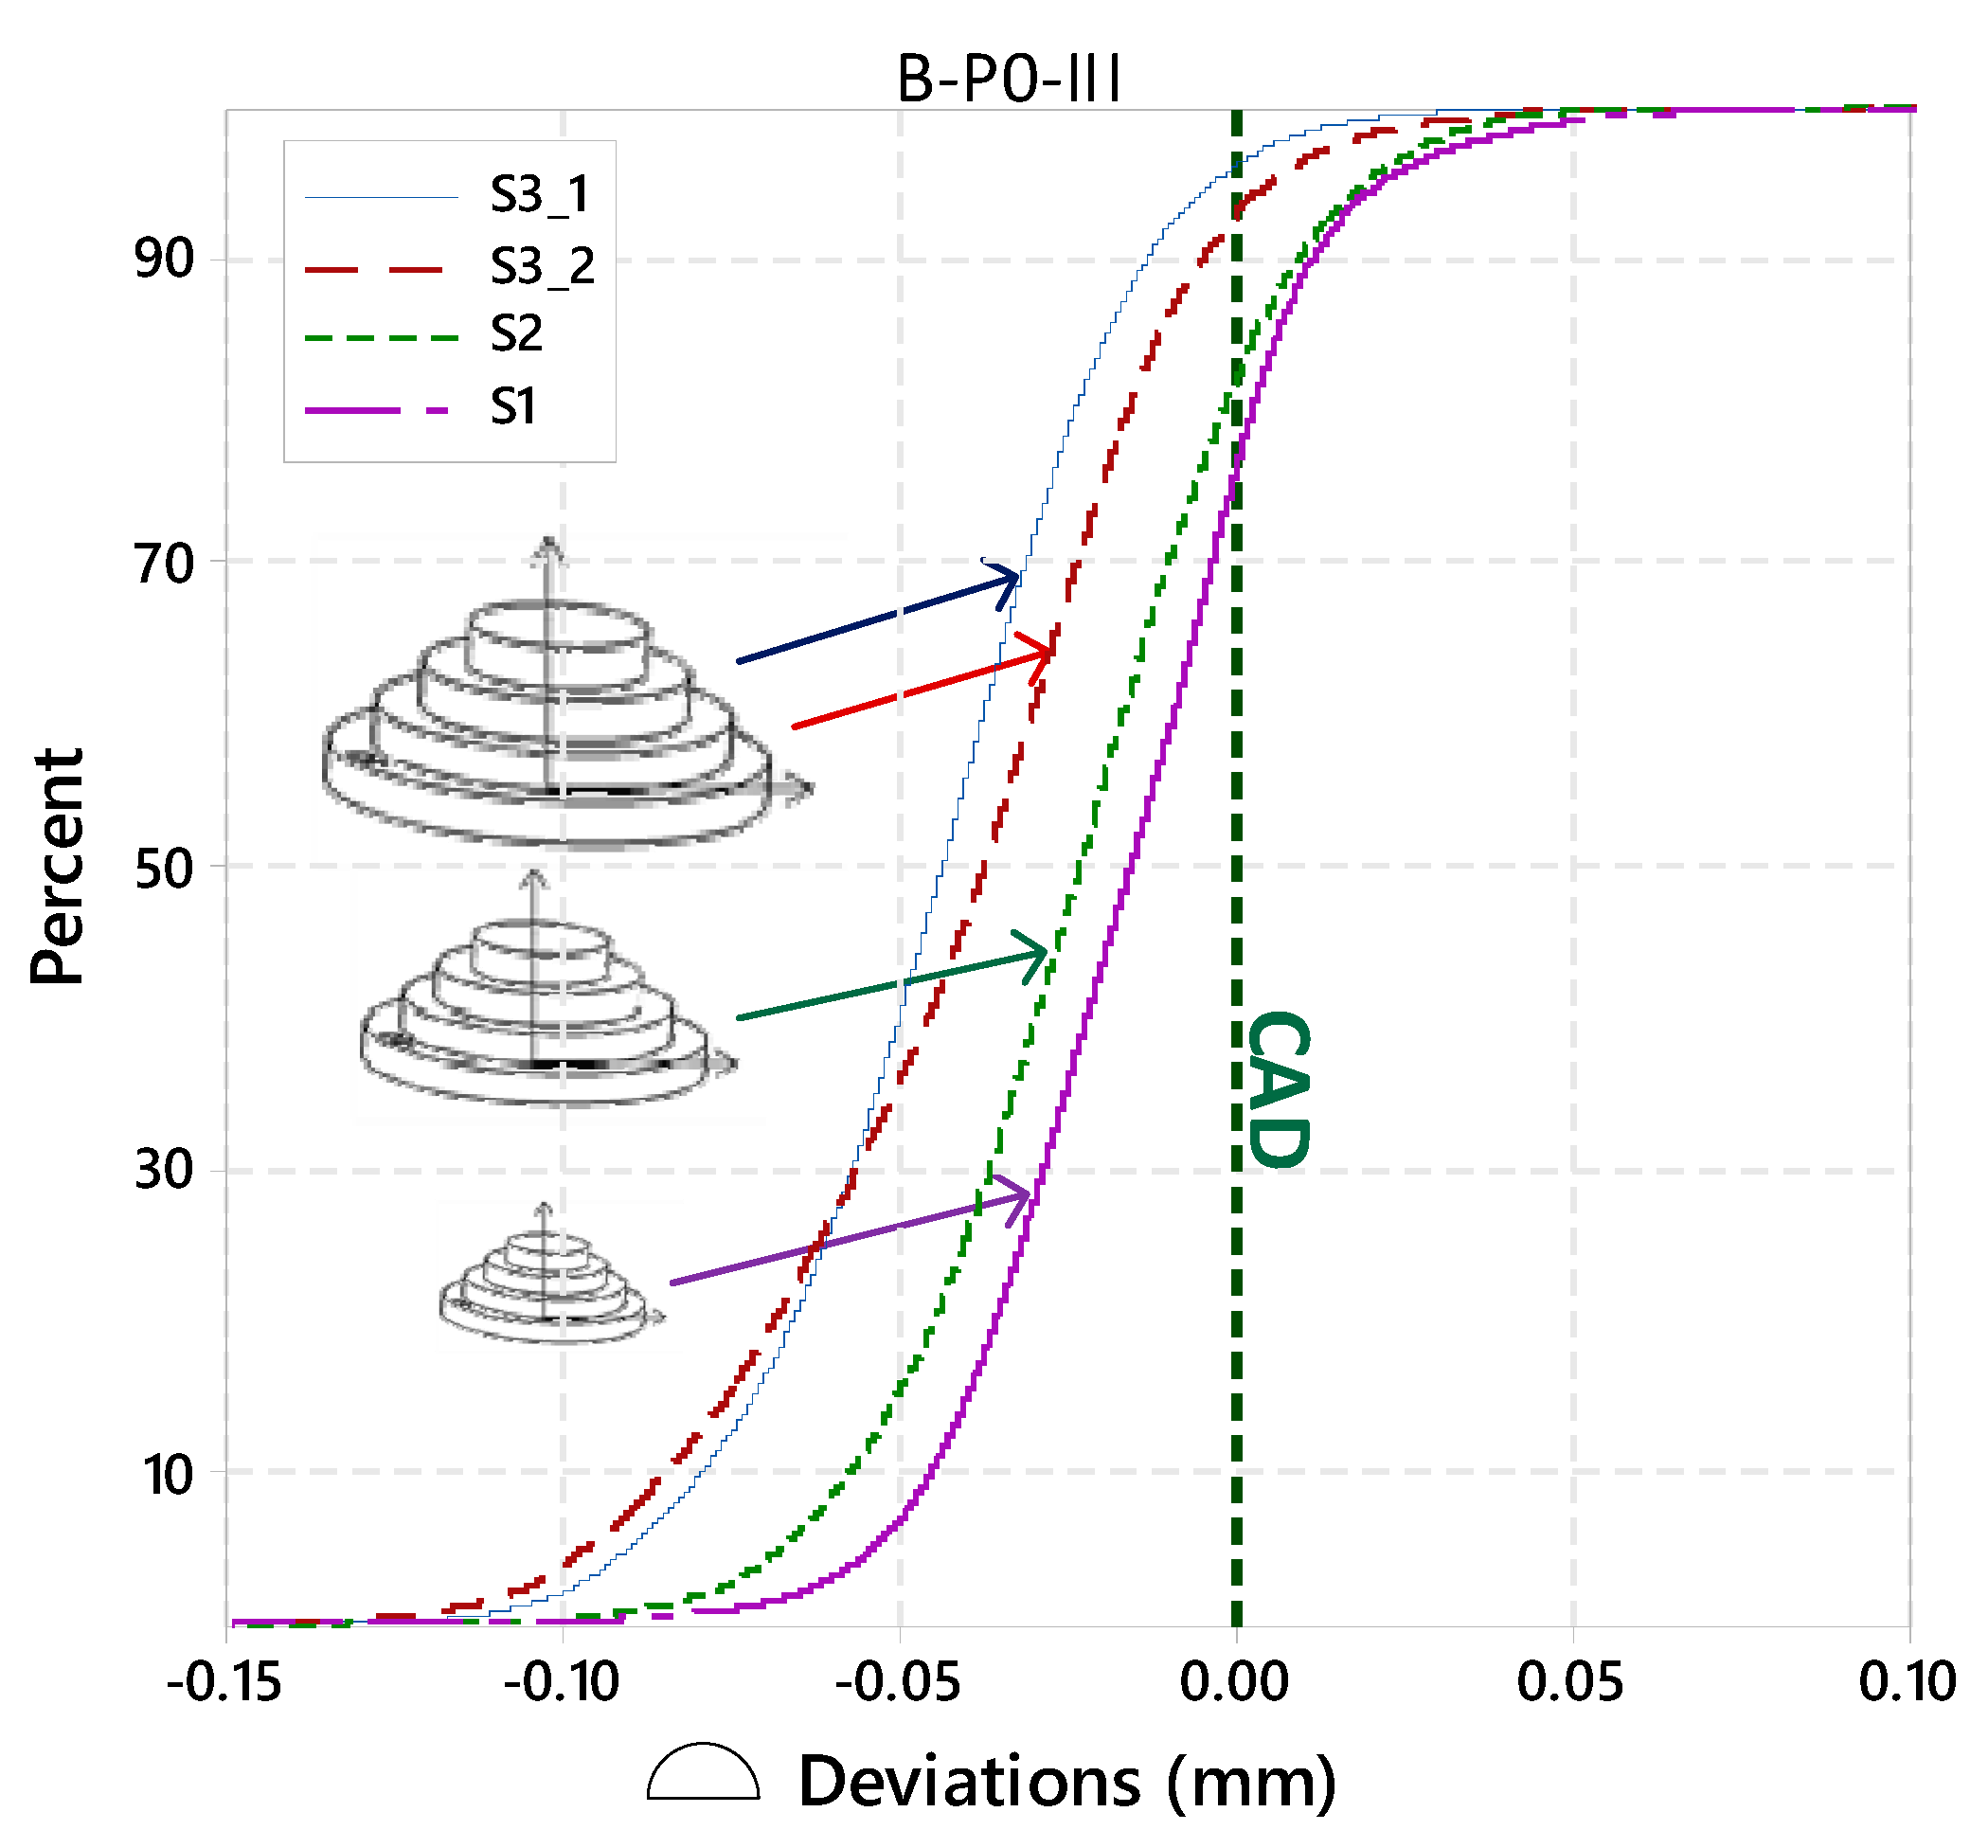
General note: By definition, the deviation is the difference between the nominal value (as defined in the CAD file) and the experimental value extracted from the measurements. Positive deviation means that the measured value is greater than the nominal in the Maximum Material Condition (MMC) direction. Negative deviation means that the measured value is smaller than the nominal in the Least Material Condition (LMC) direction, as in ASME Y14.5.1 [23]. The interval bars presented on the graphics are the measurement system uncertainty at a 95% confidence level.
3. Results and Discussions
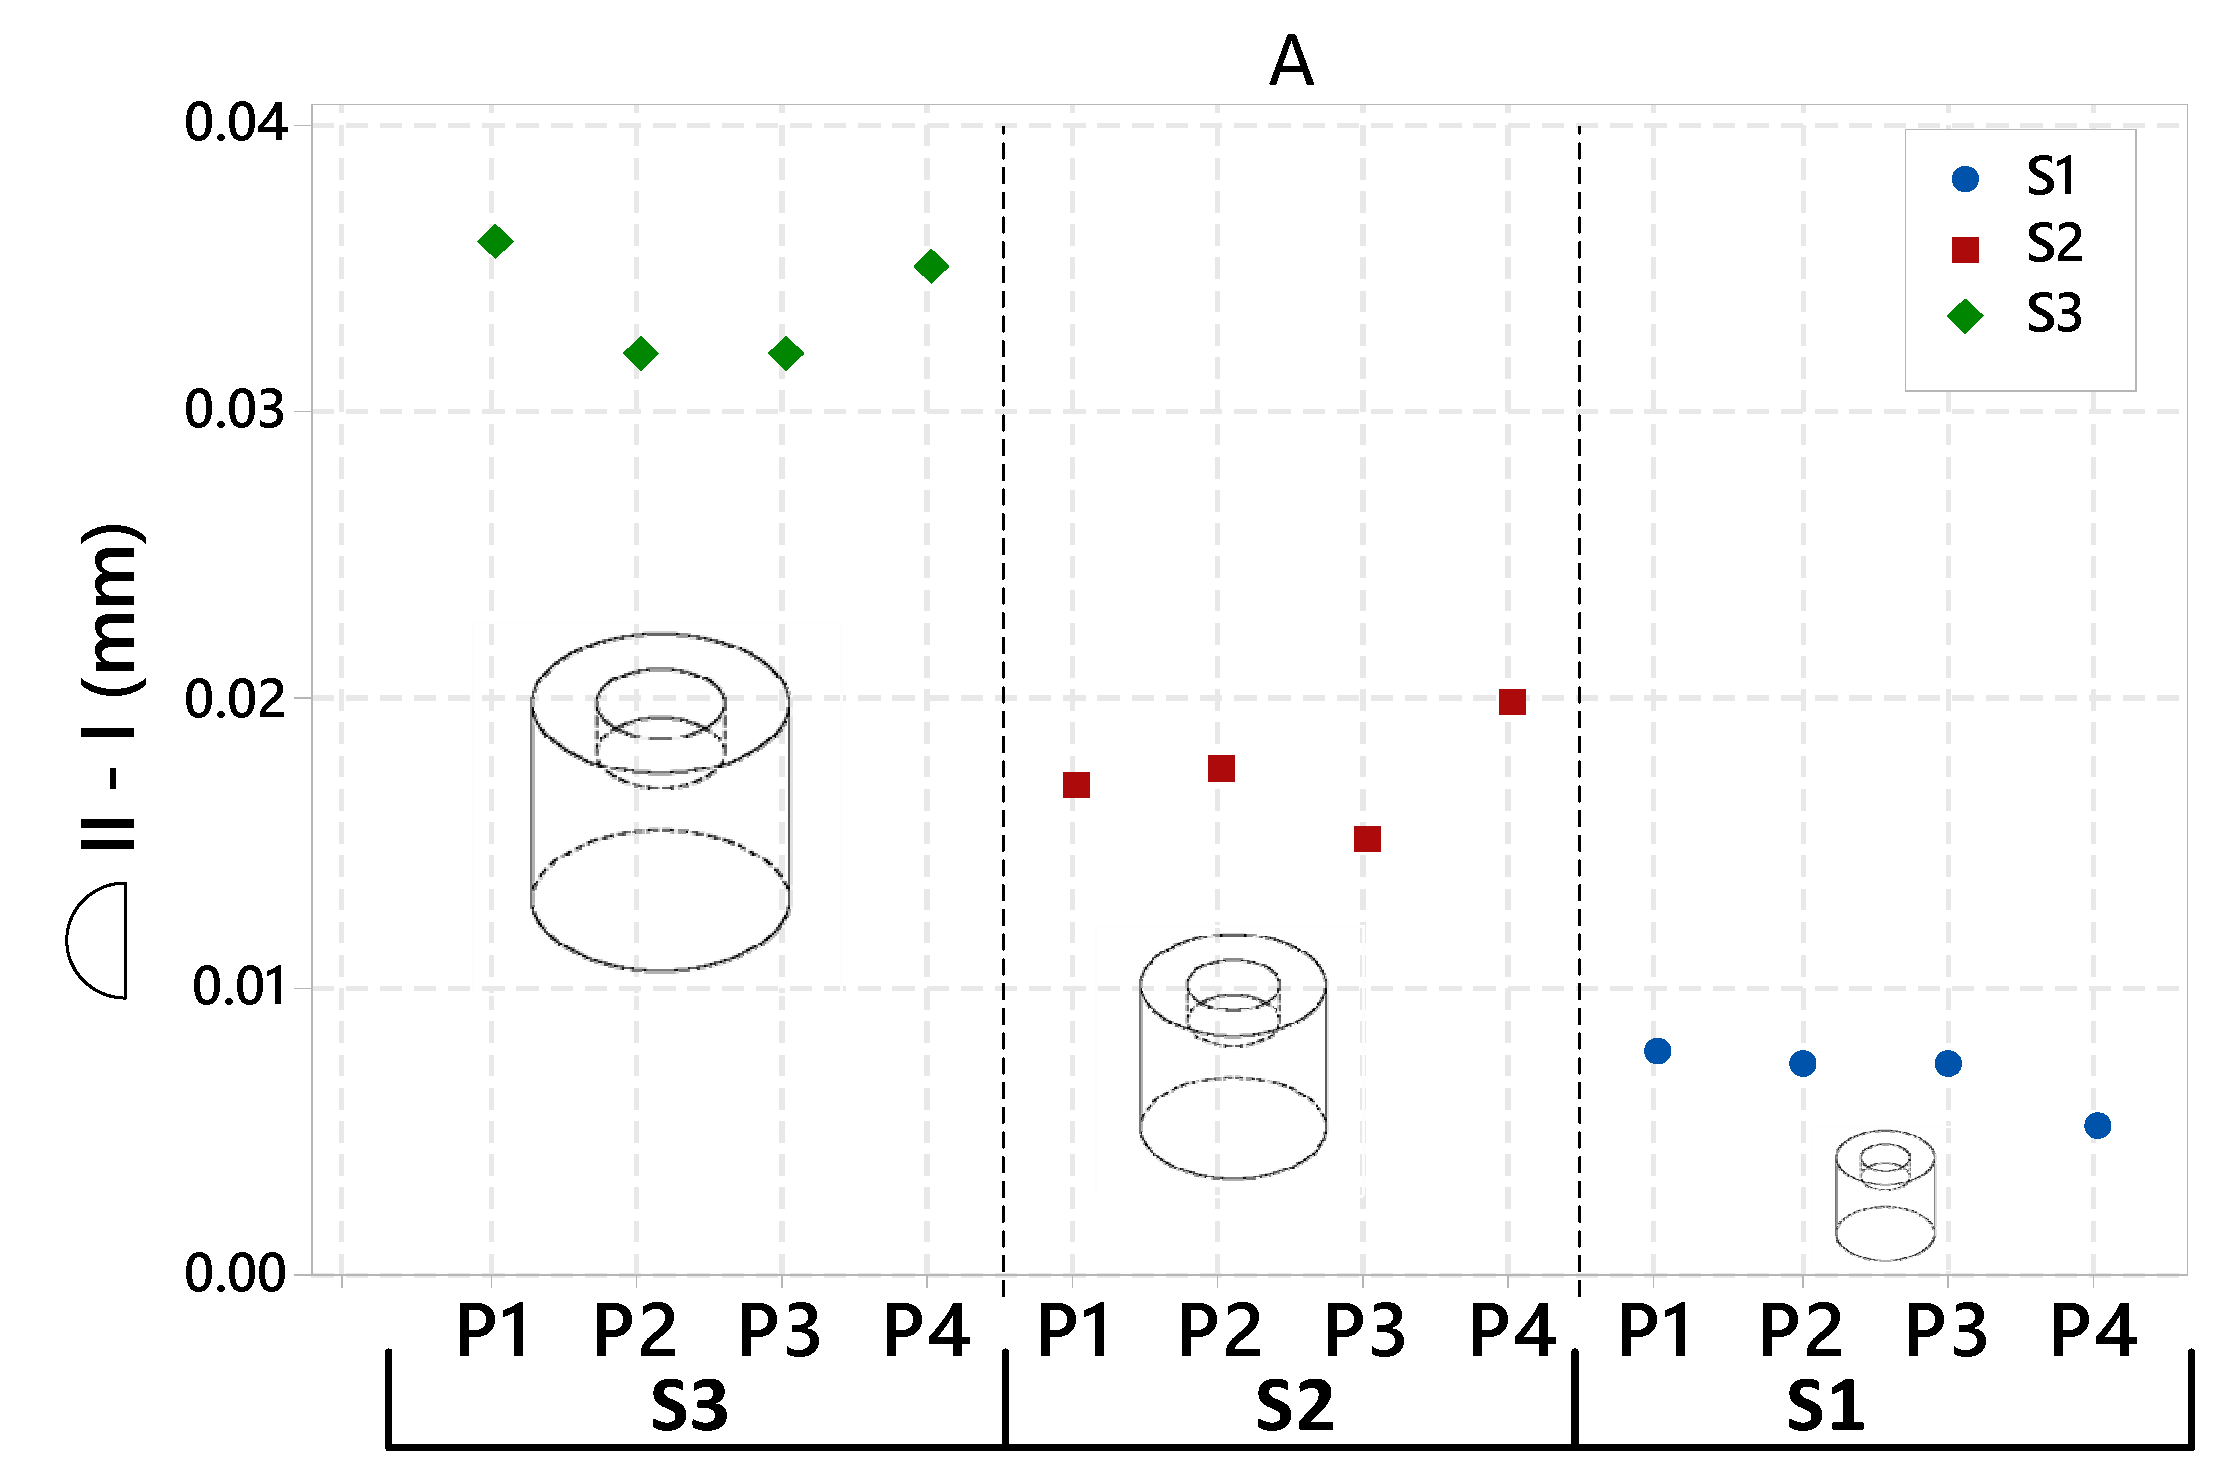
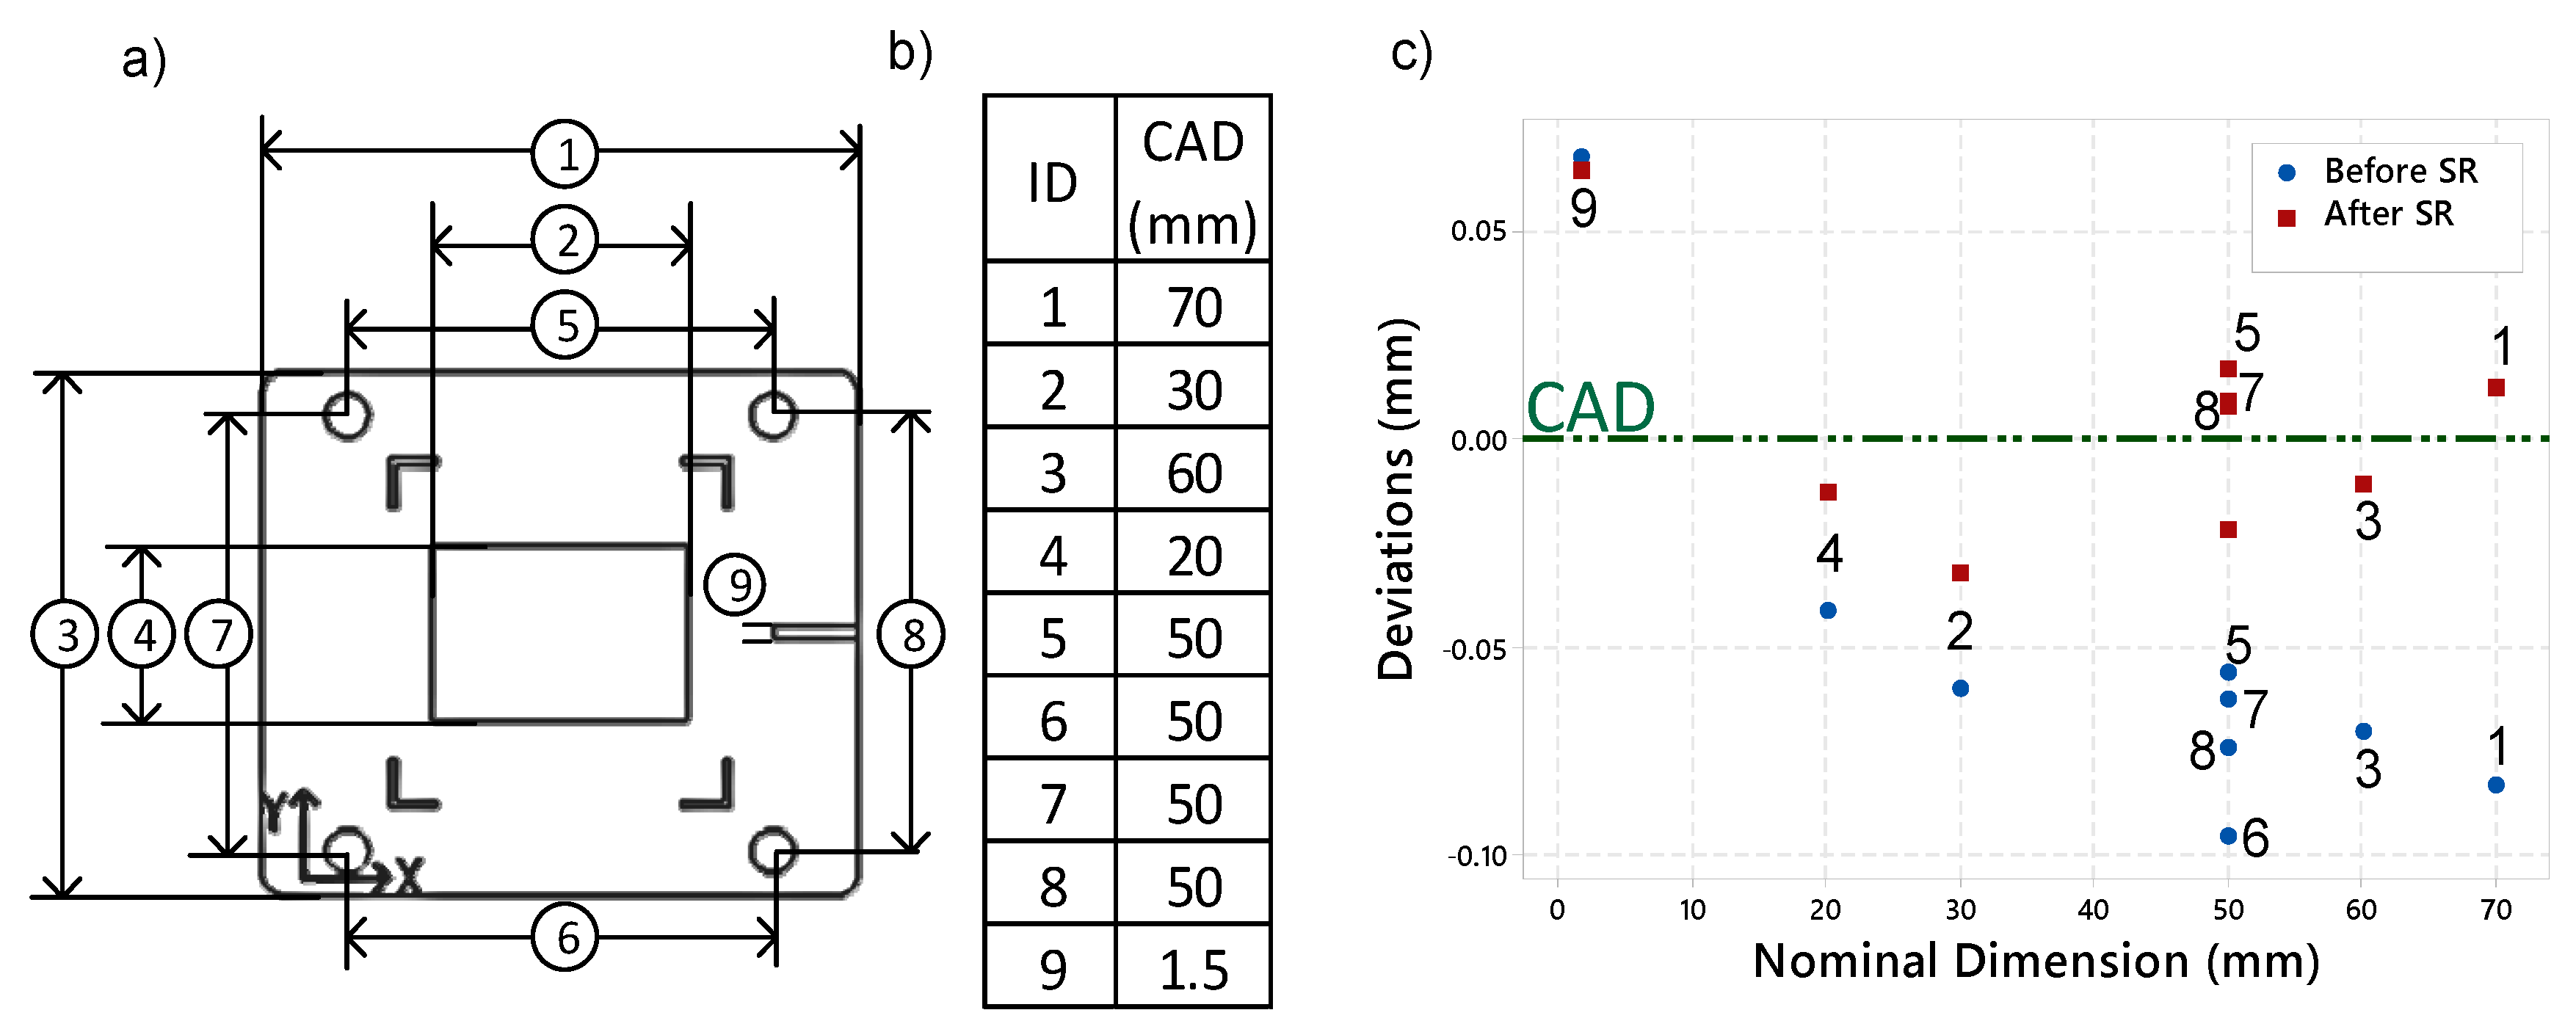
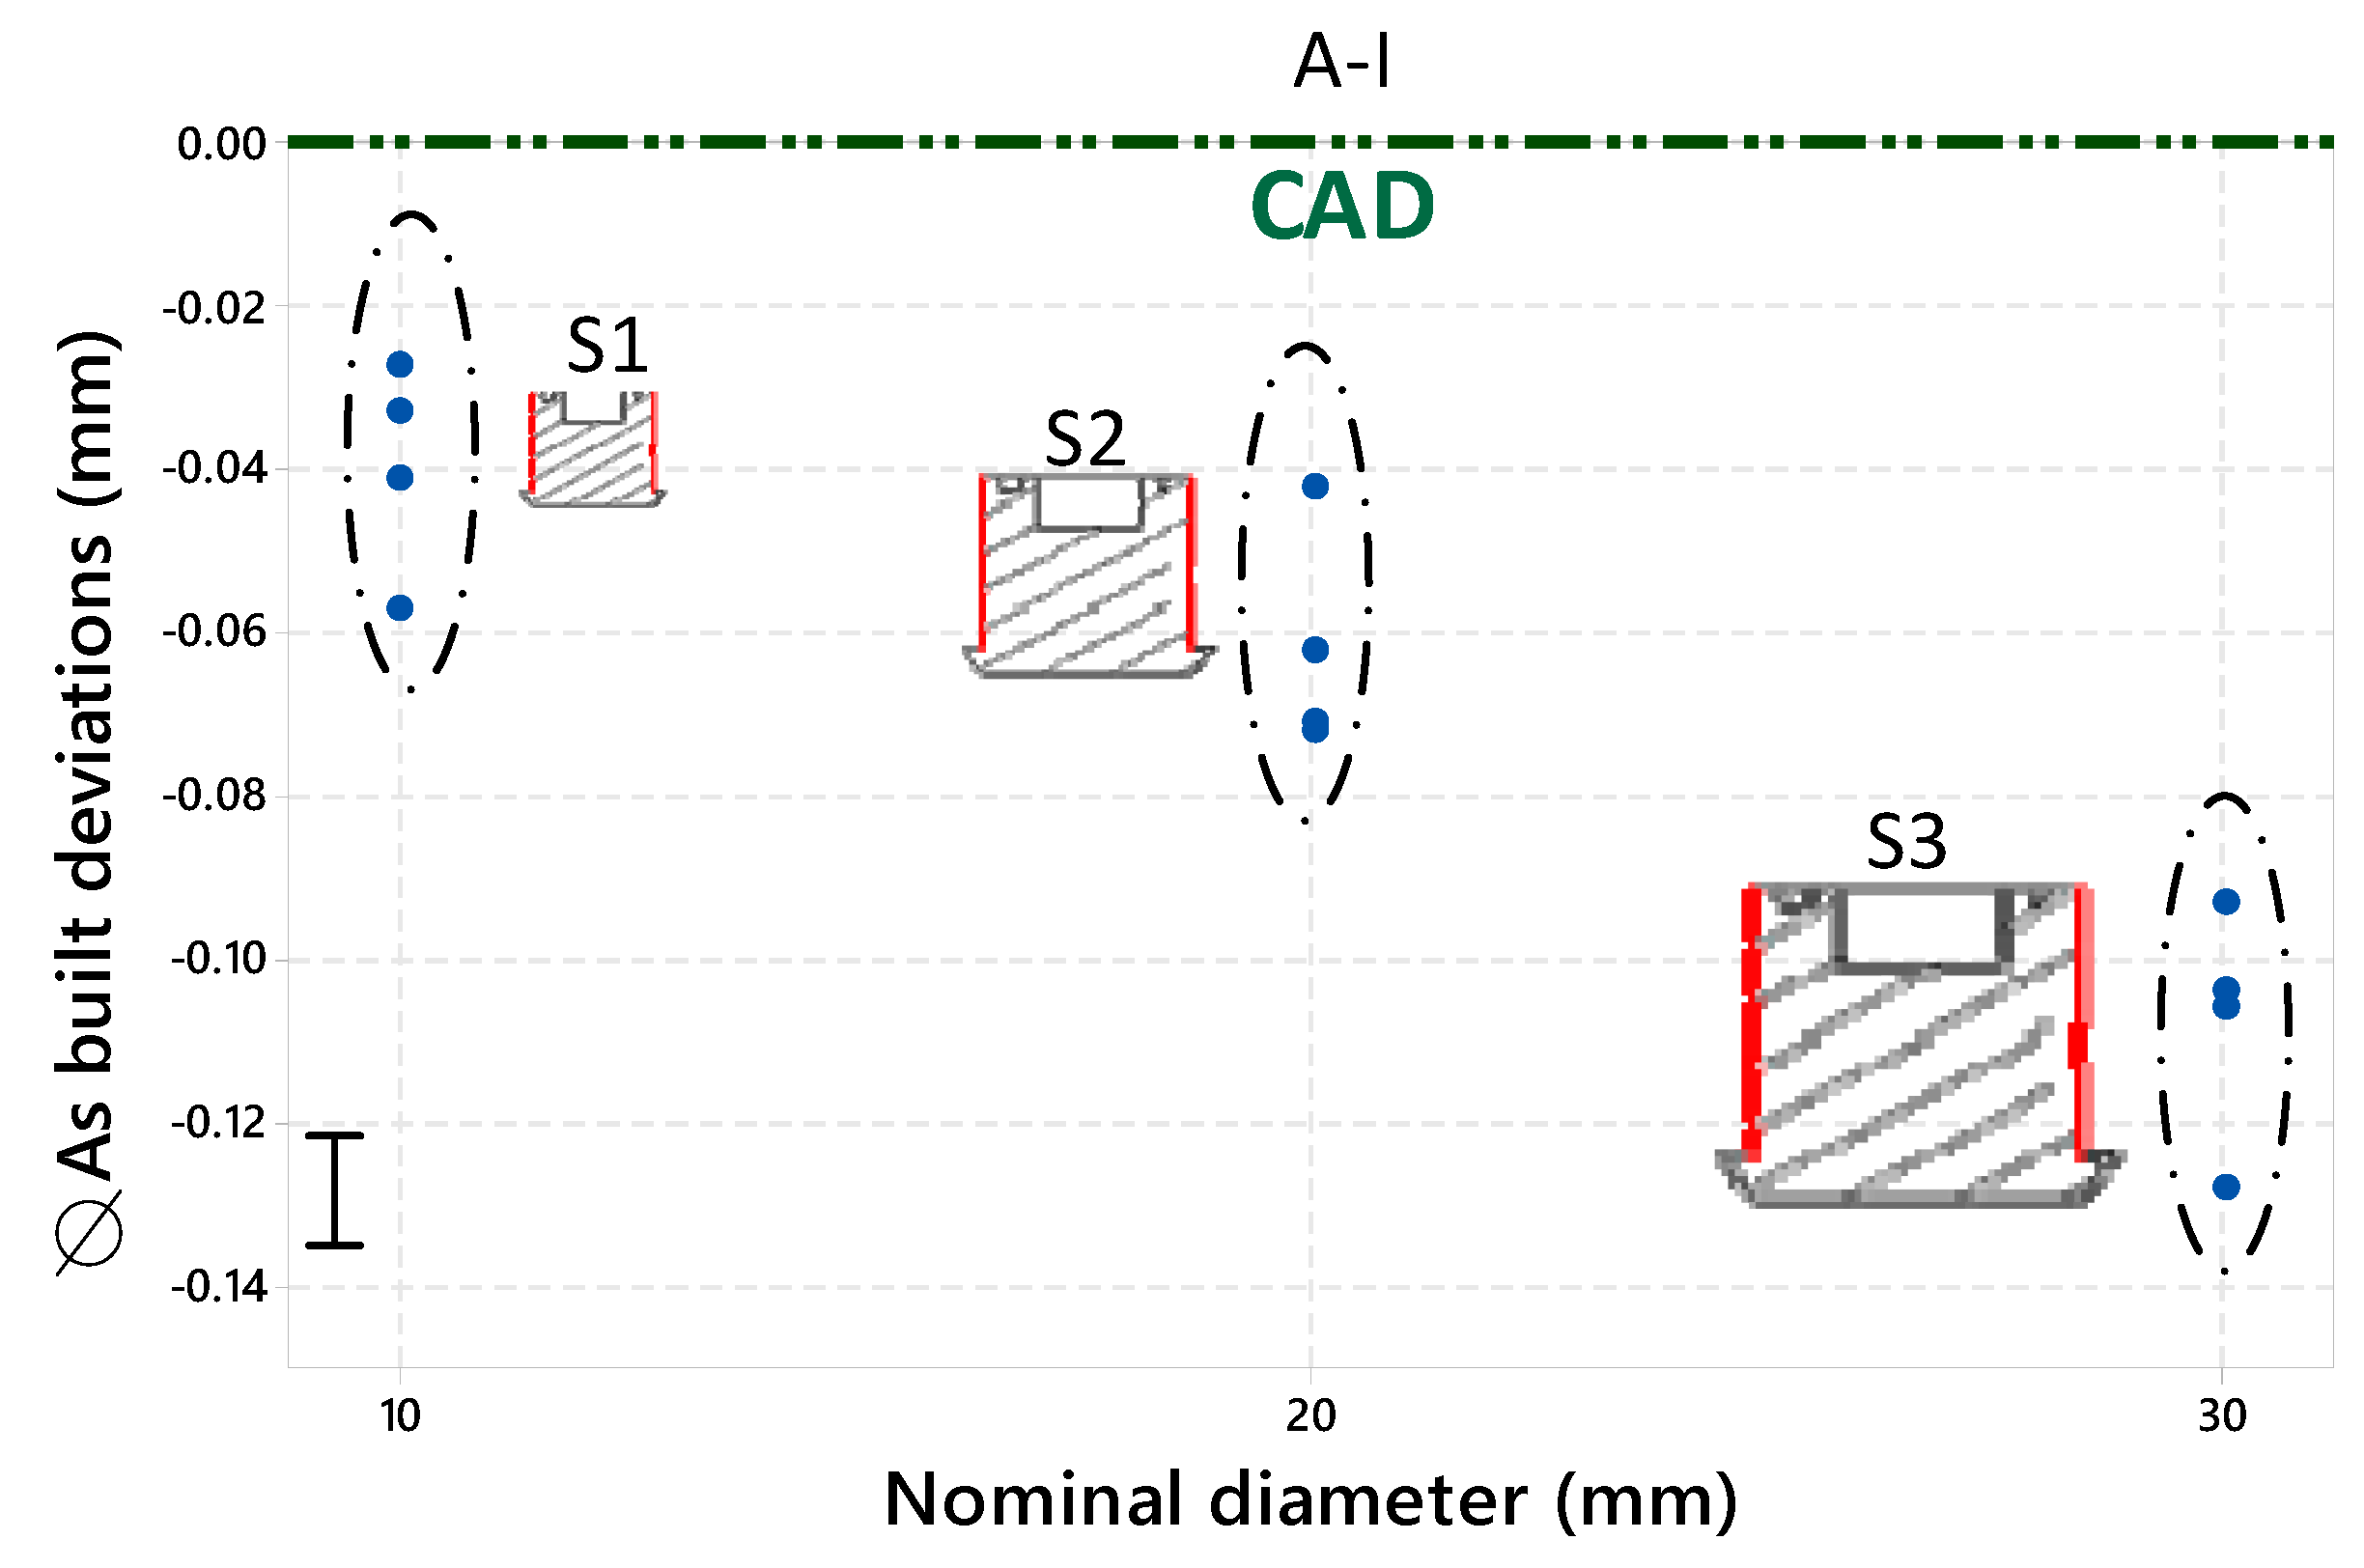
3.1. Analysis A—Calibration Part Inspection
3.2. Analysis B_1—Intra-Part Scale Effect
Shape B Artifact
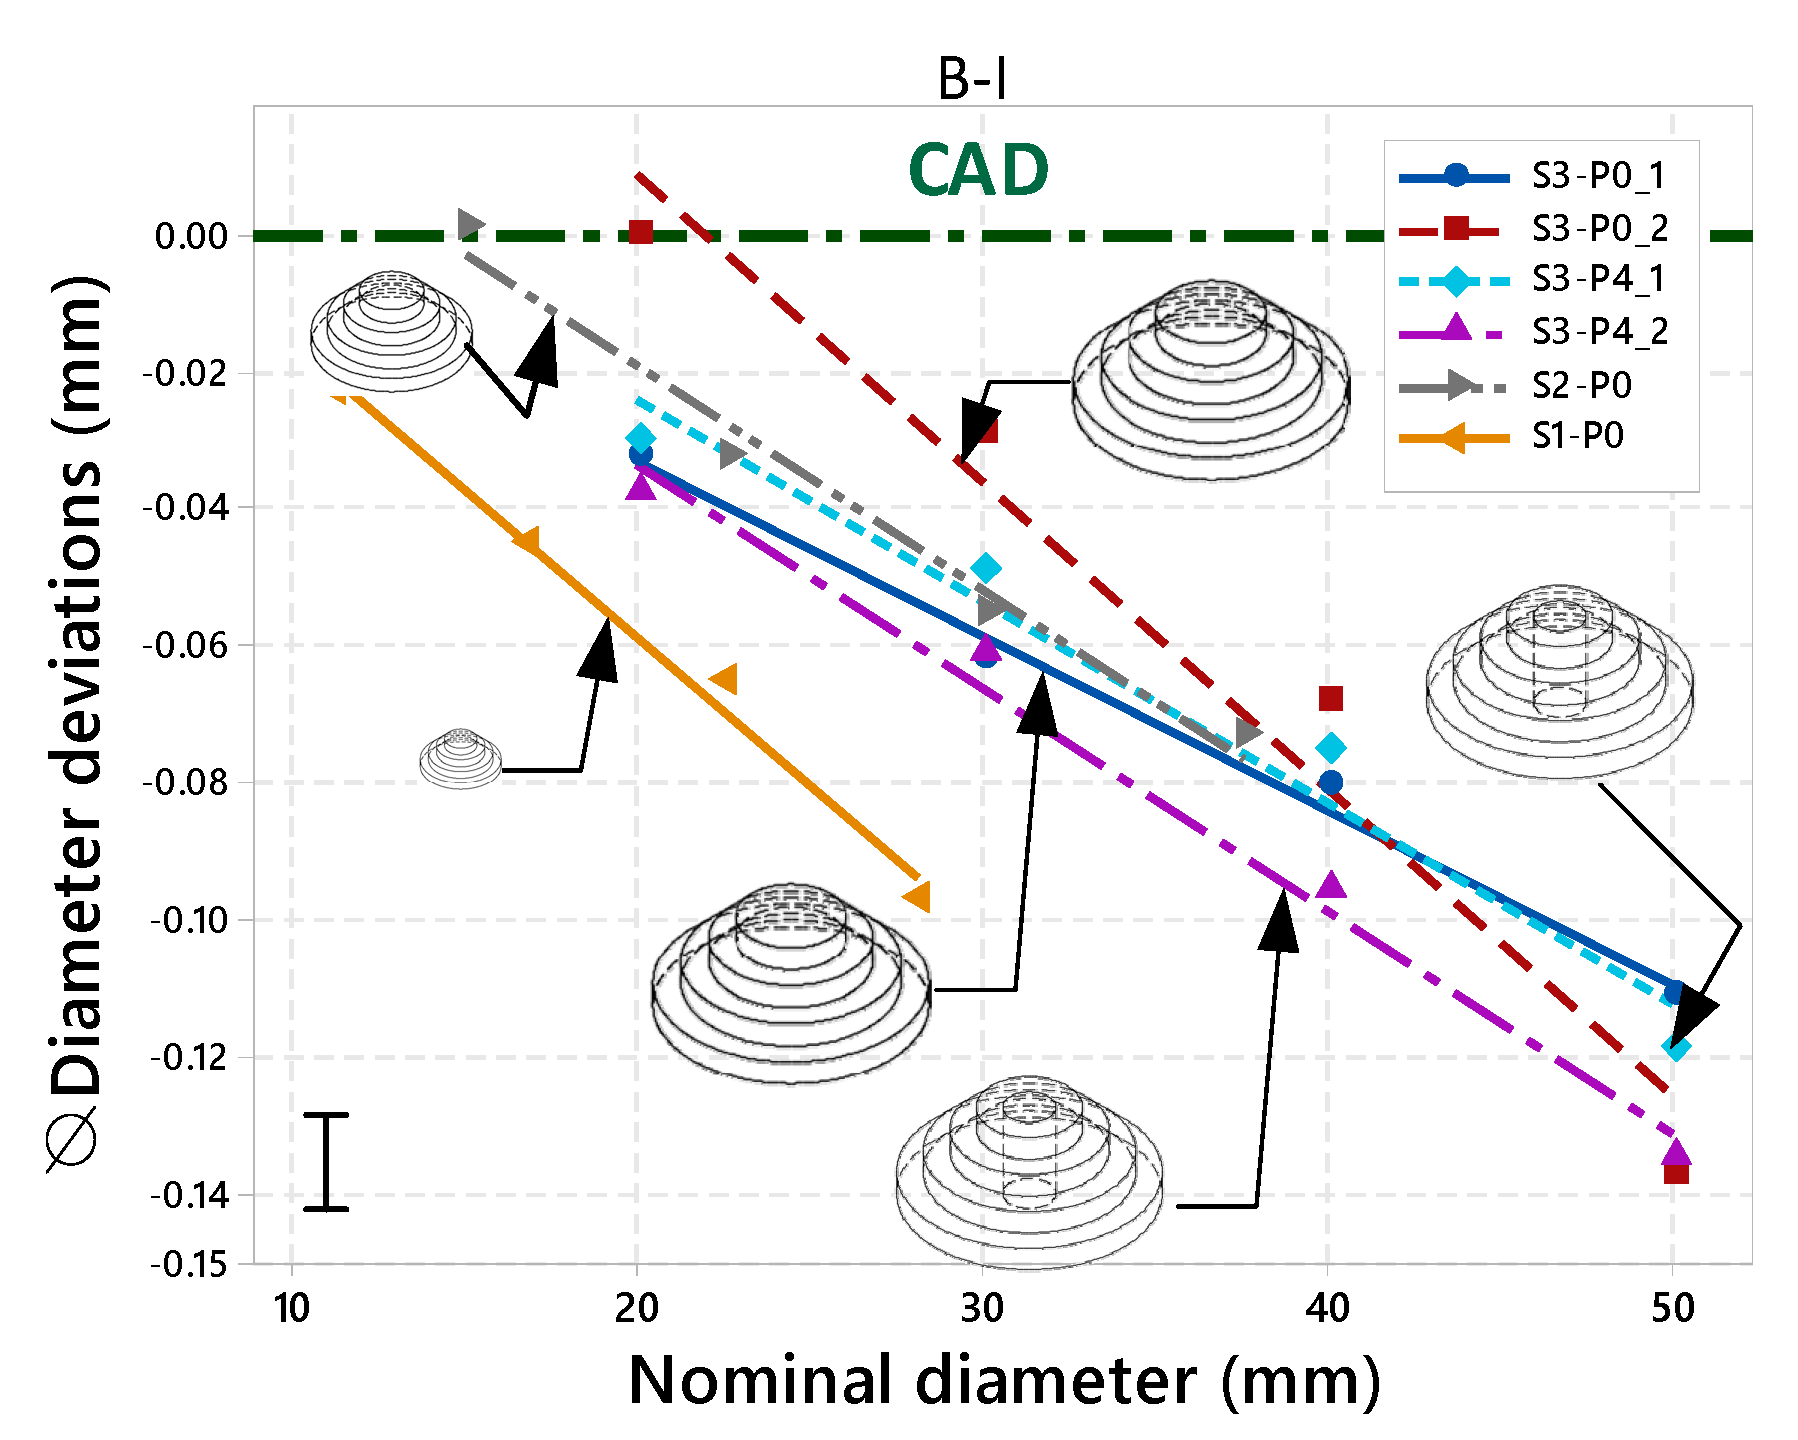
3.3. Analysis B_2—Inter-Part Scale Effect
3.3.1. Shape A Artifact
3.3.2. Shape B Artifact
3.4. Analysis C—Part Material Concentration Effect
Shape A Artifact
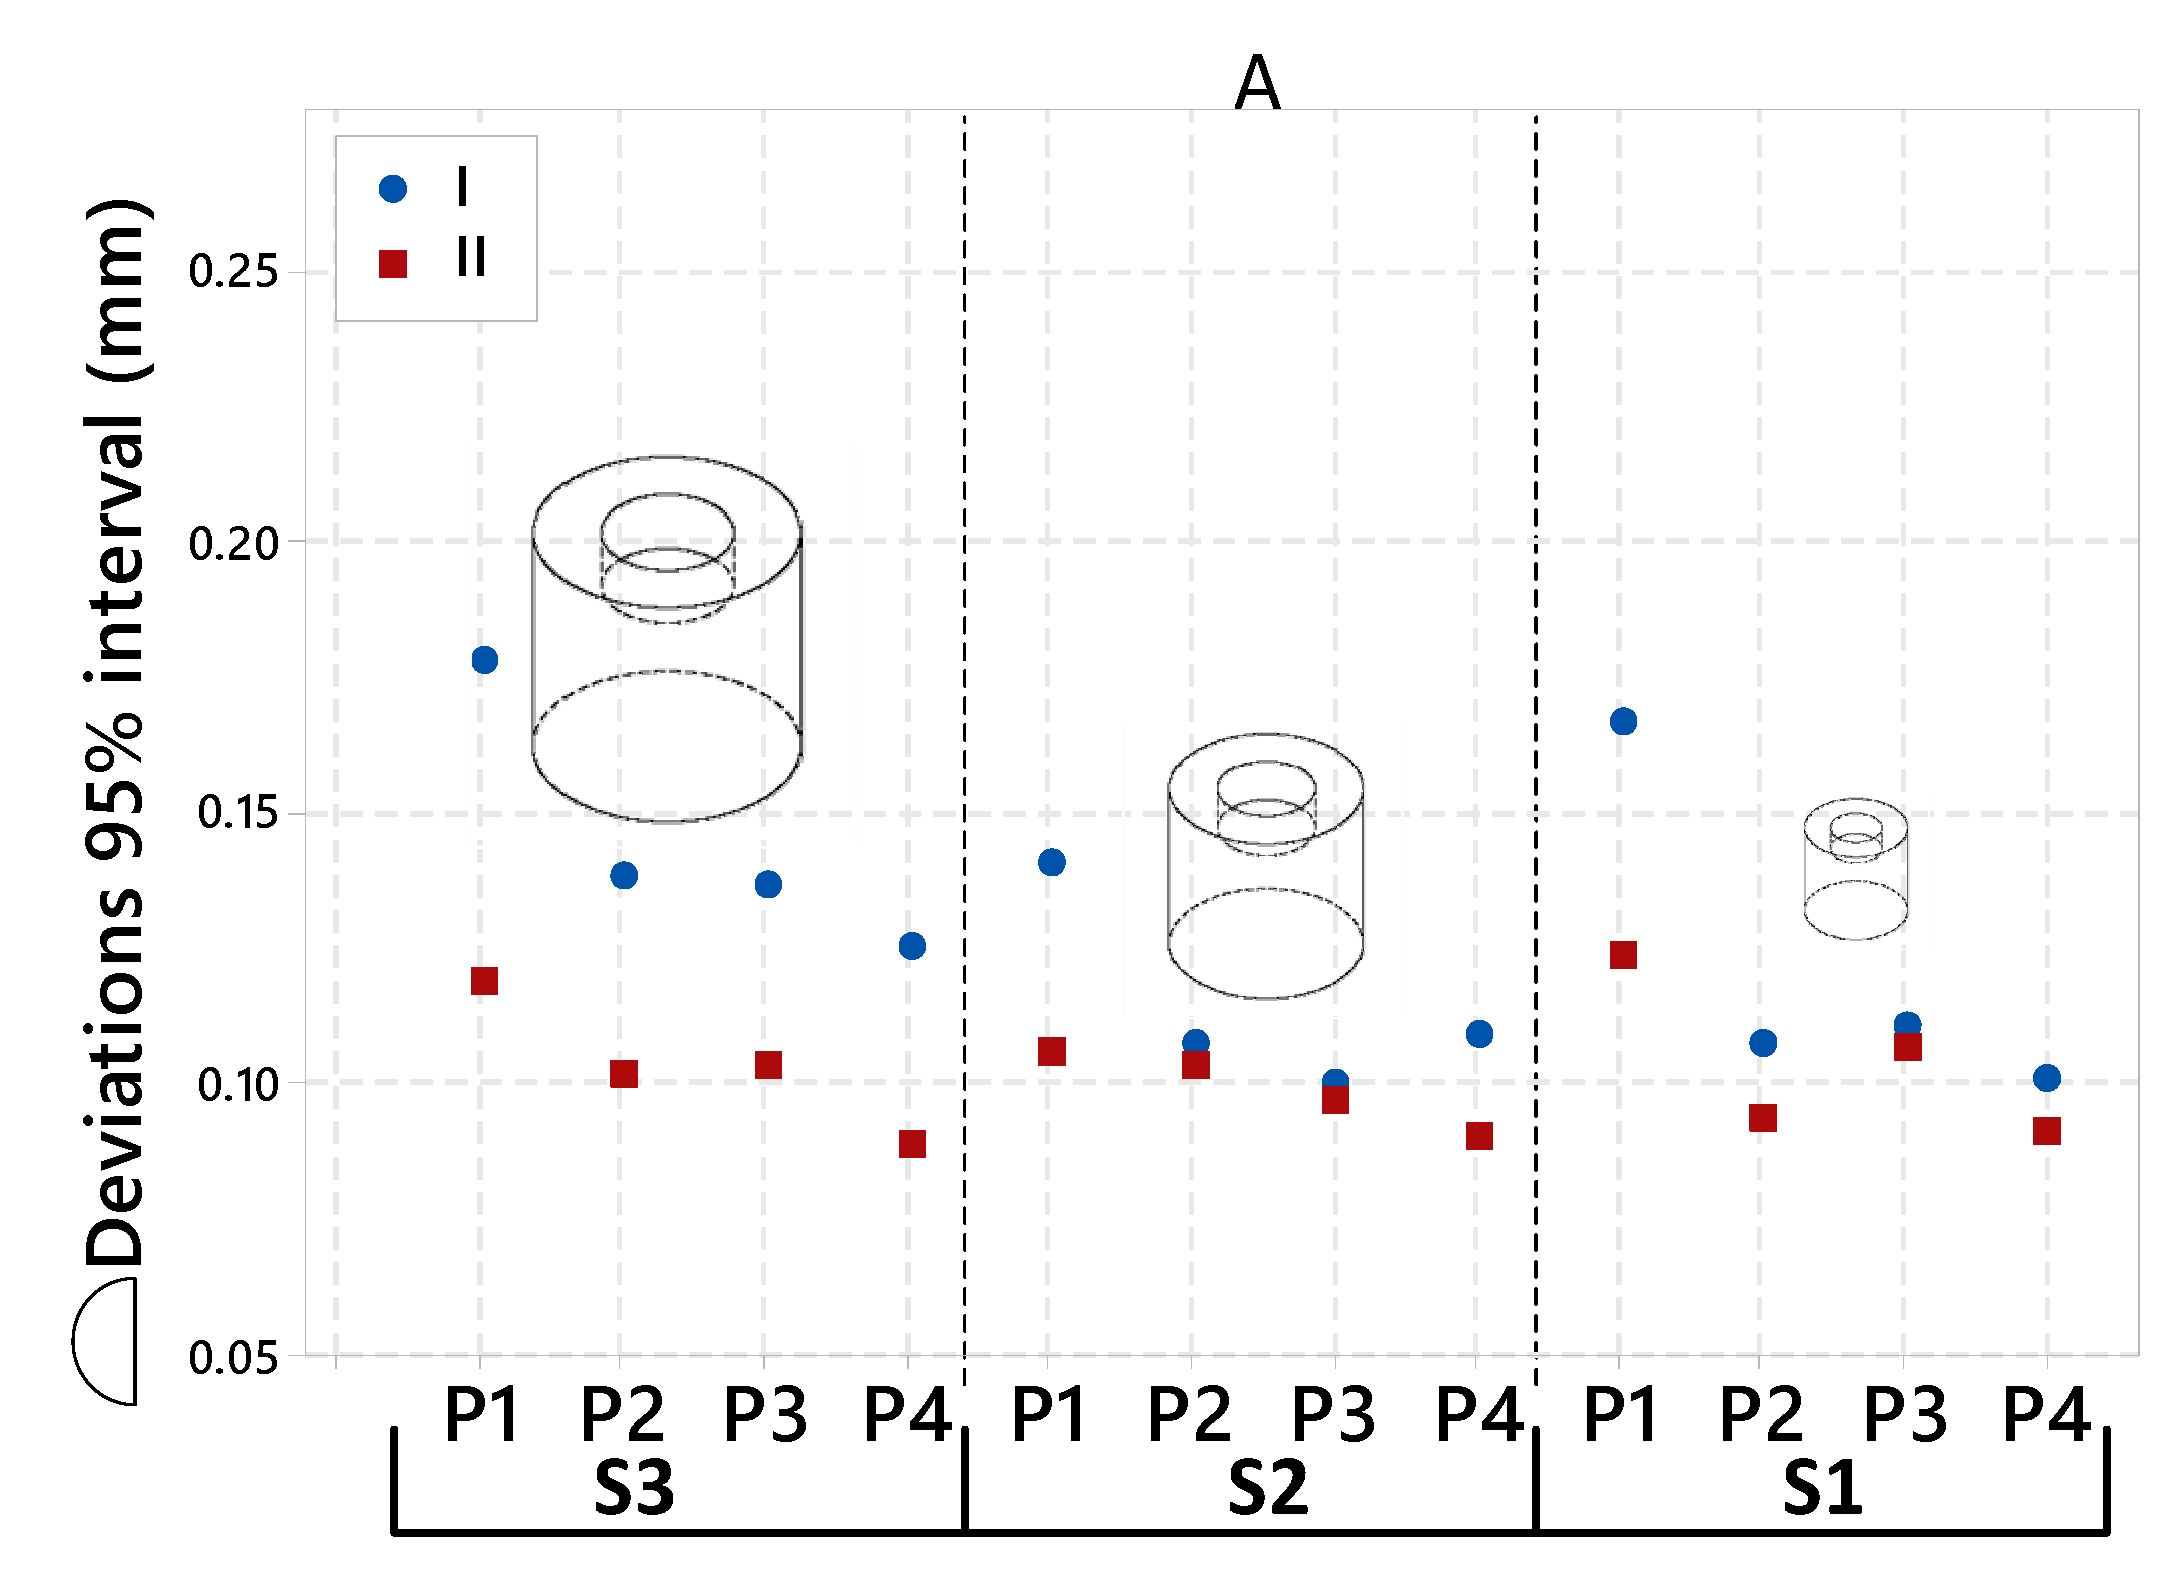
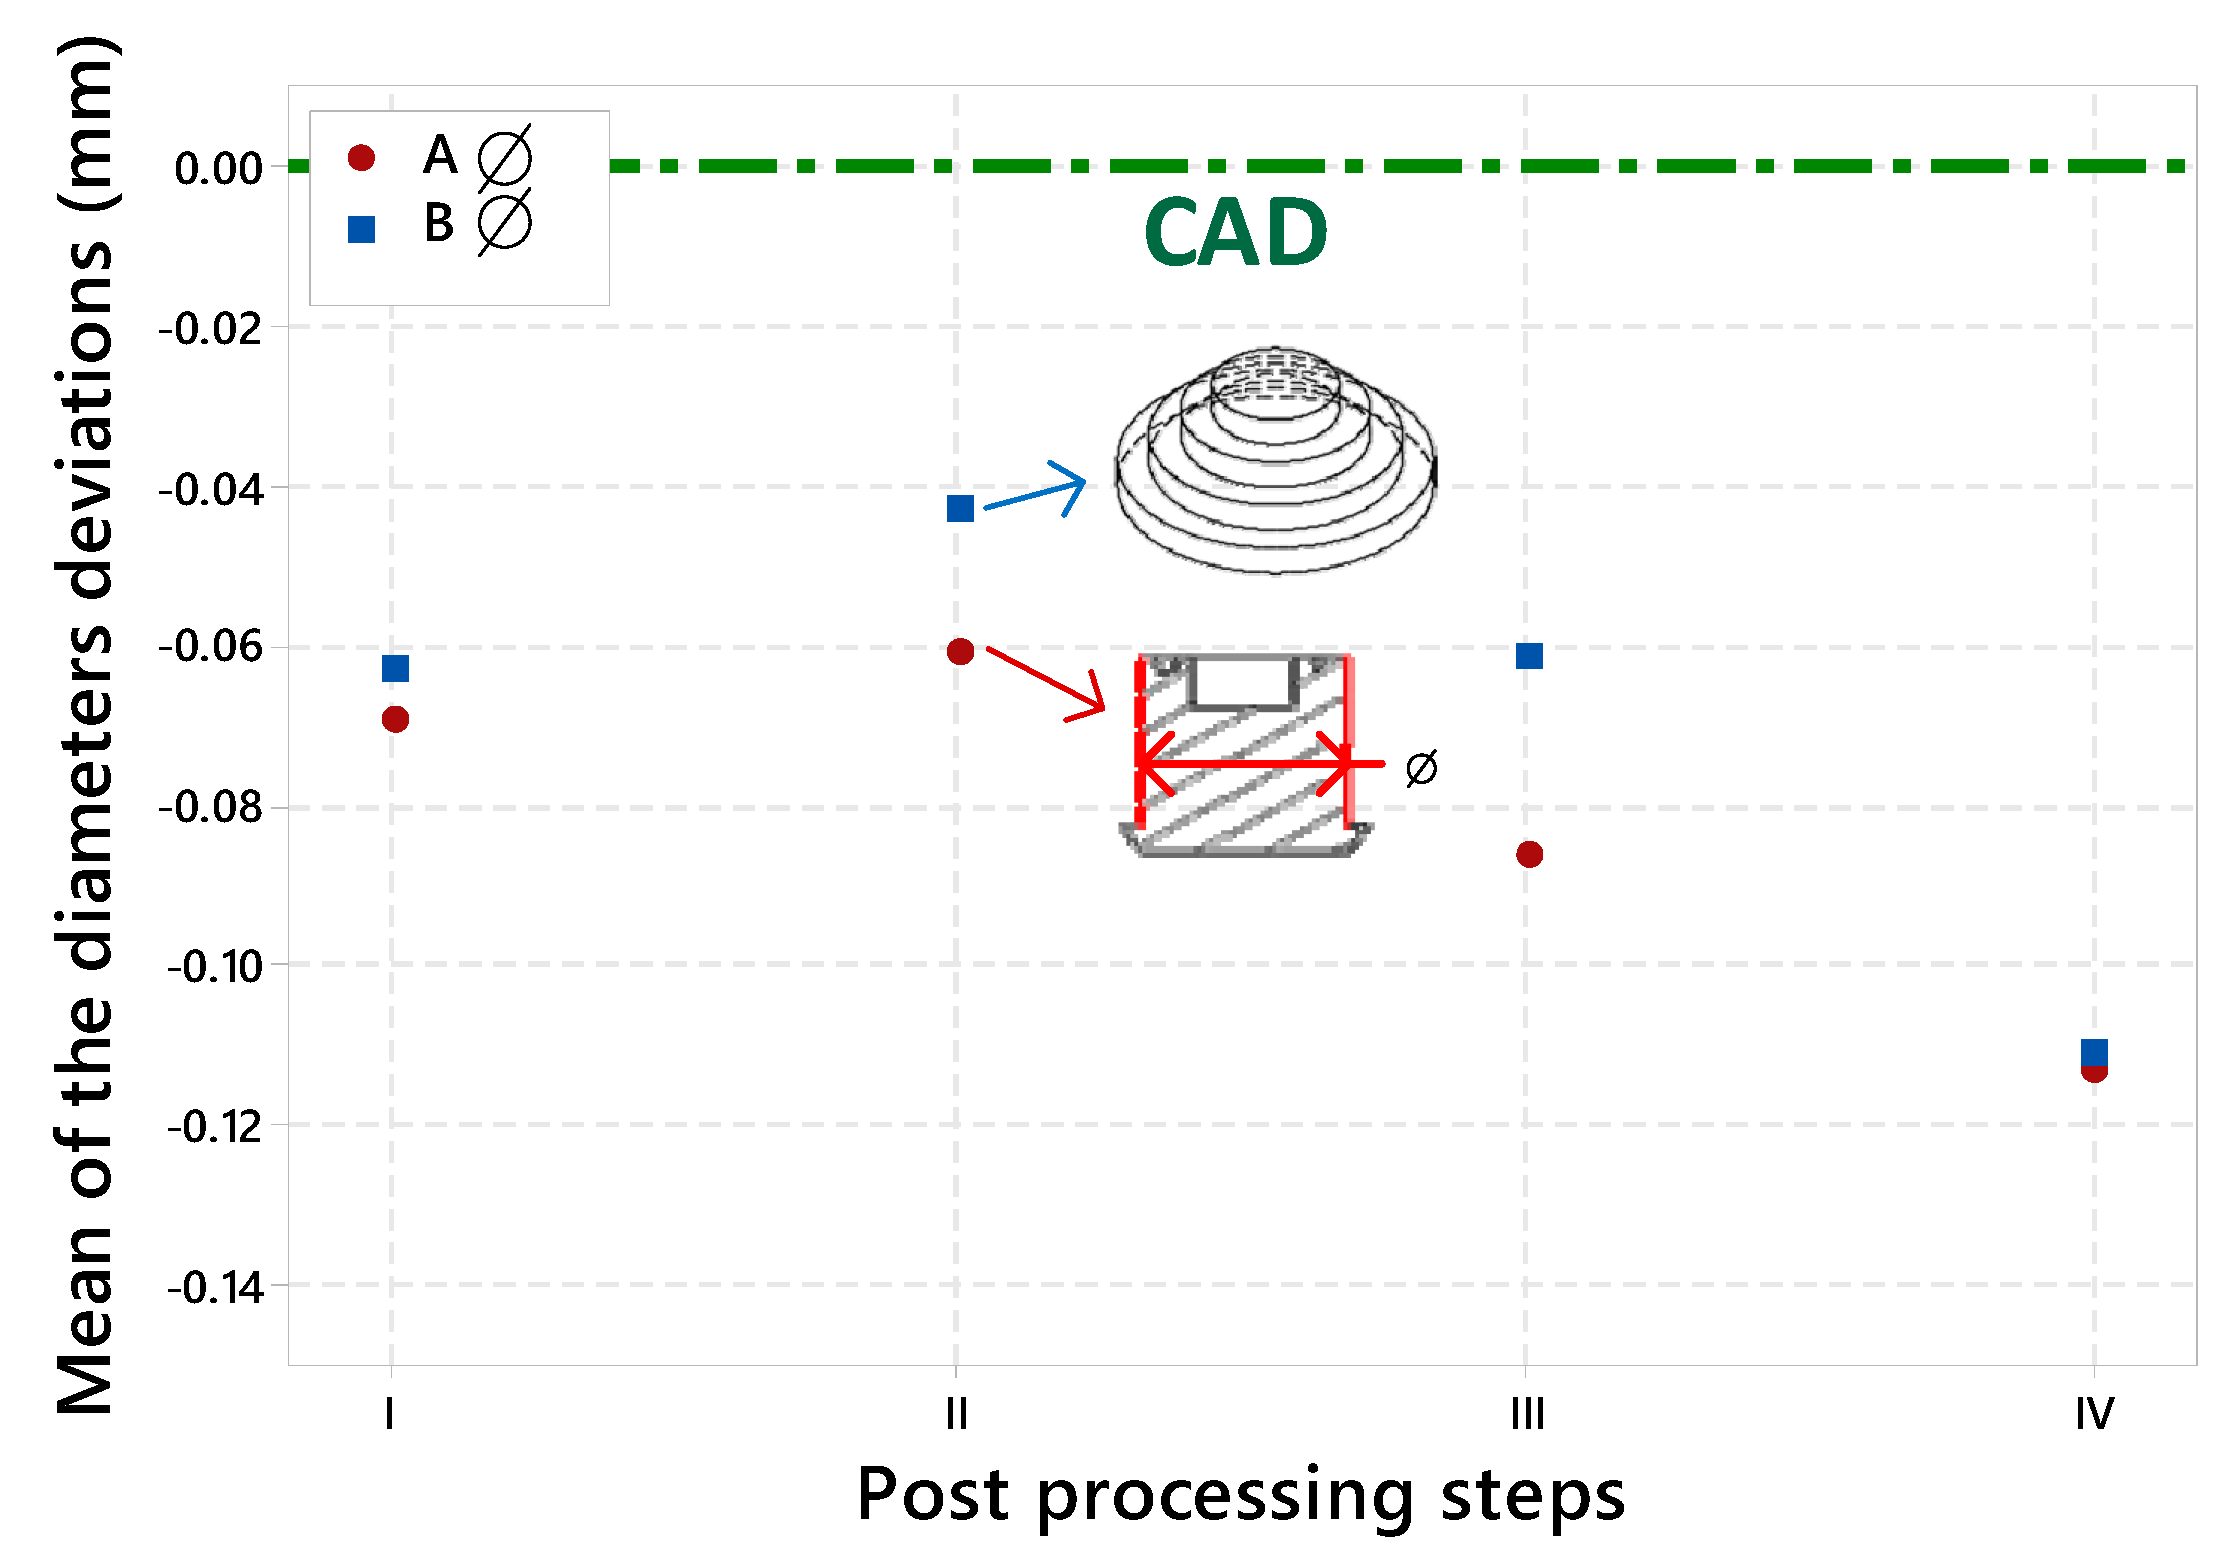
3.5. Analysis D—Post-Processing Effects
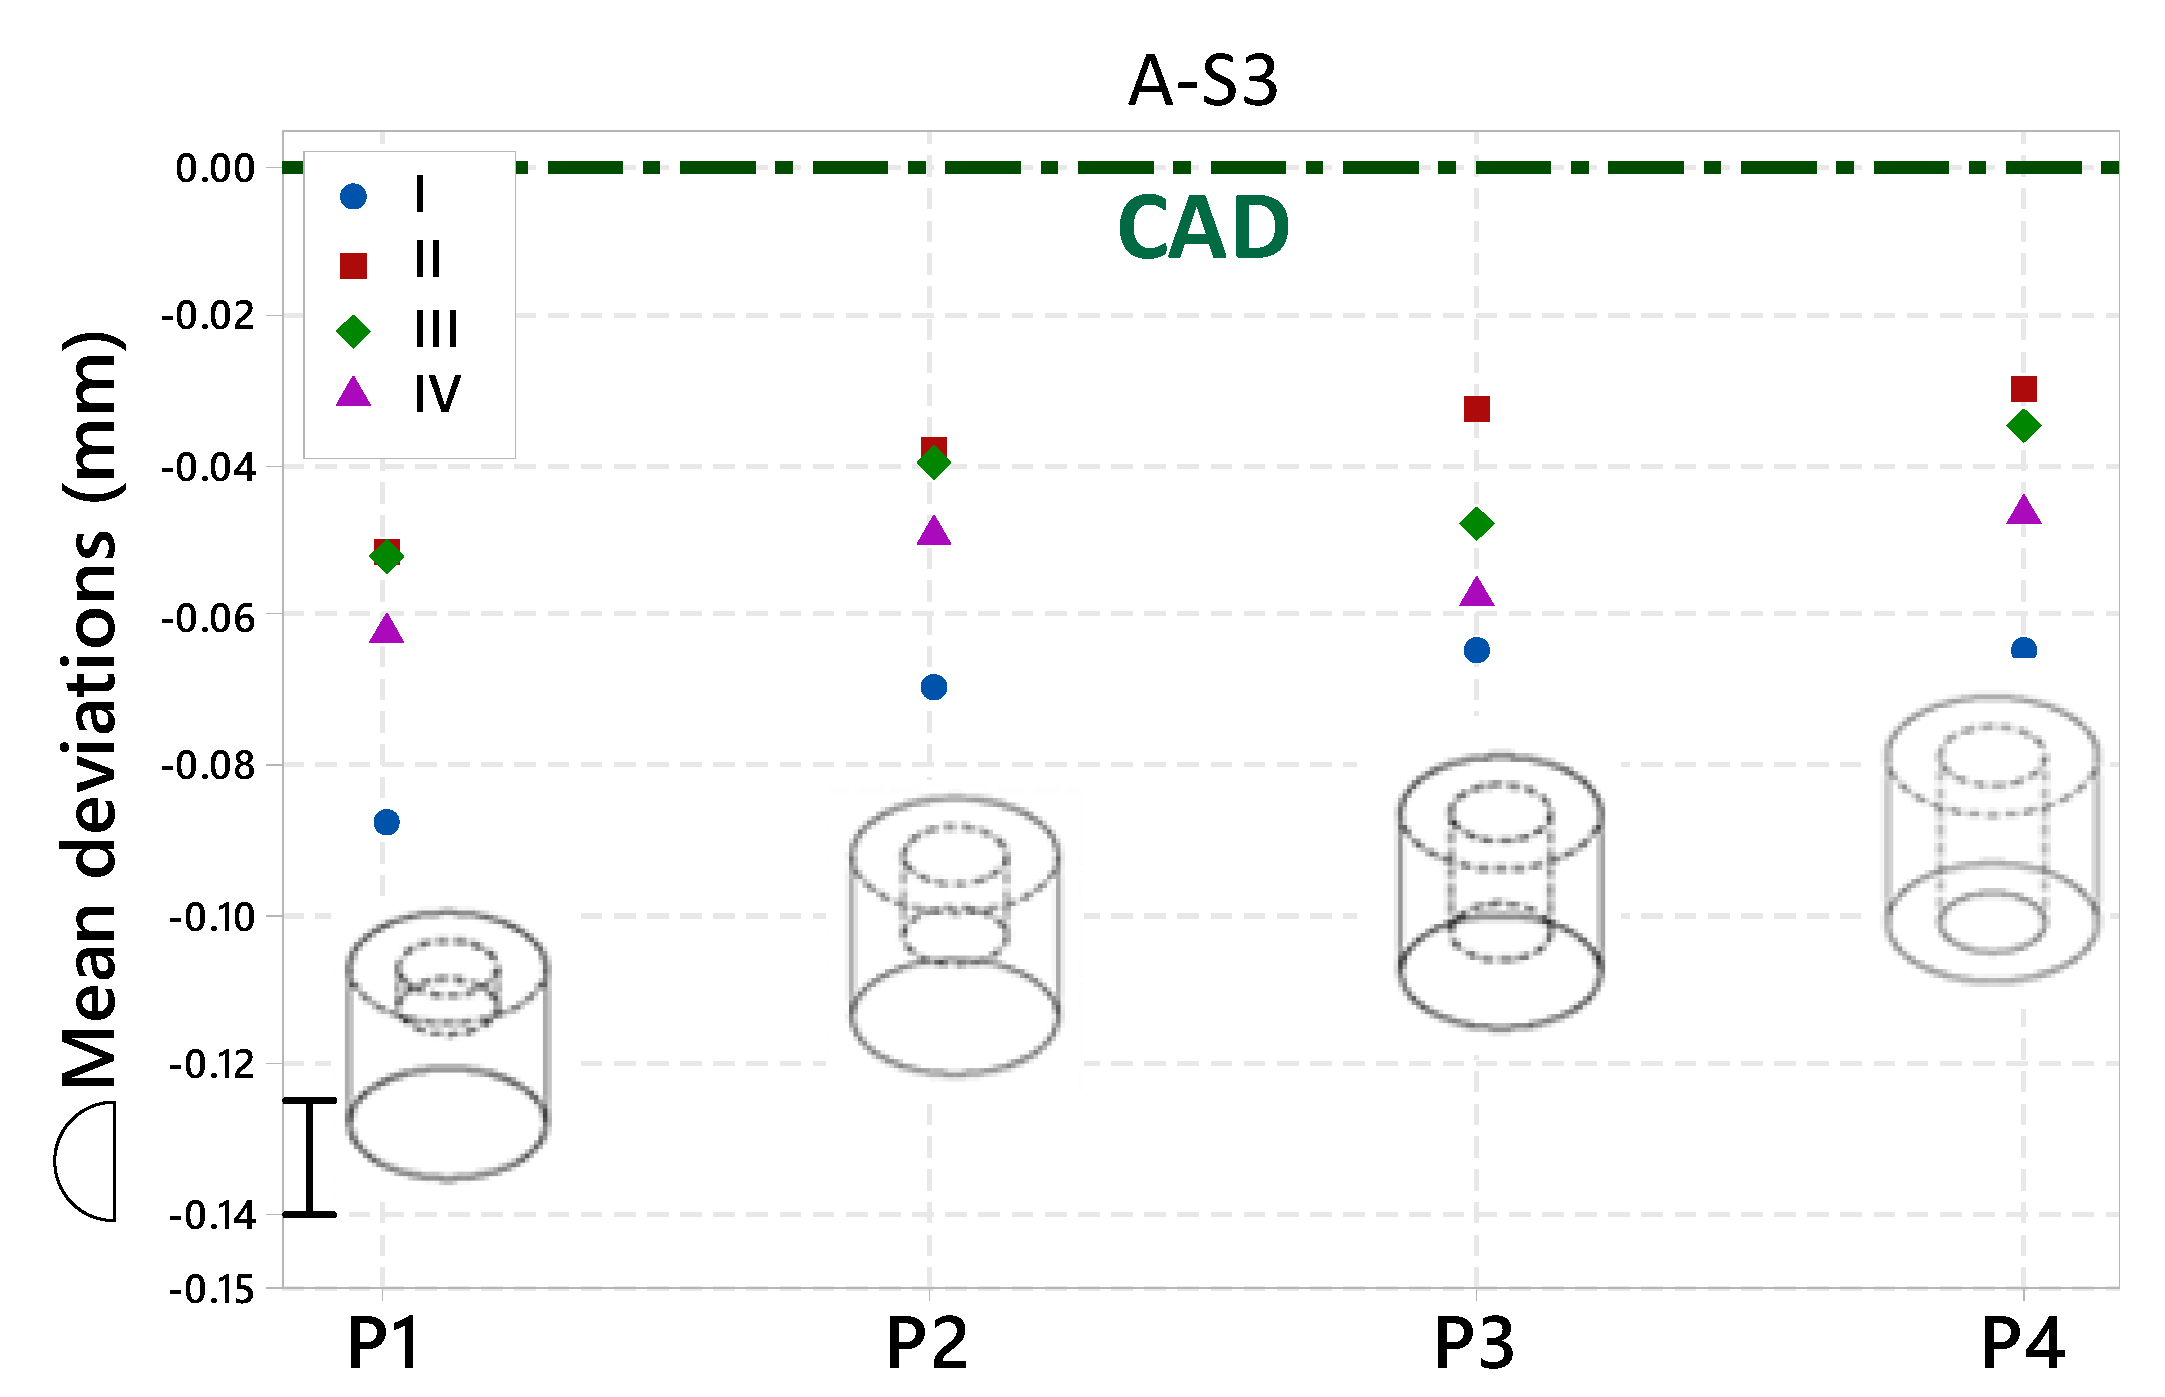
3.5.1. Shape A Artifact
3.5.2. Shape B Artifact
4. Conclusions
- (1)
- There exists an intra-part scale effect; different features of the same part having different nominal sizes manifest different deviations.
- (2)
- For the parts of the same size, the lower the material concentration, the lower the number of observed deviations.
- (3)
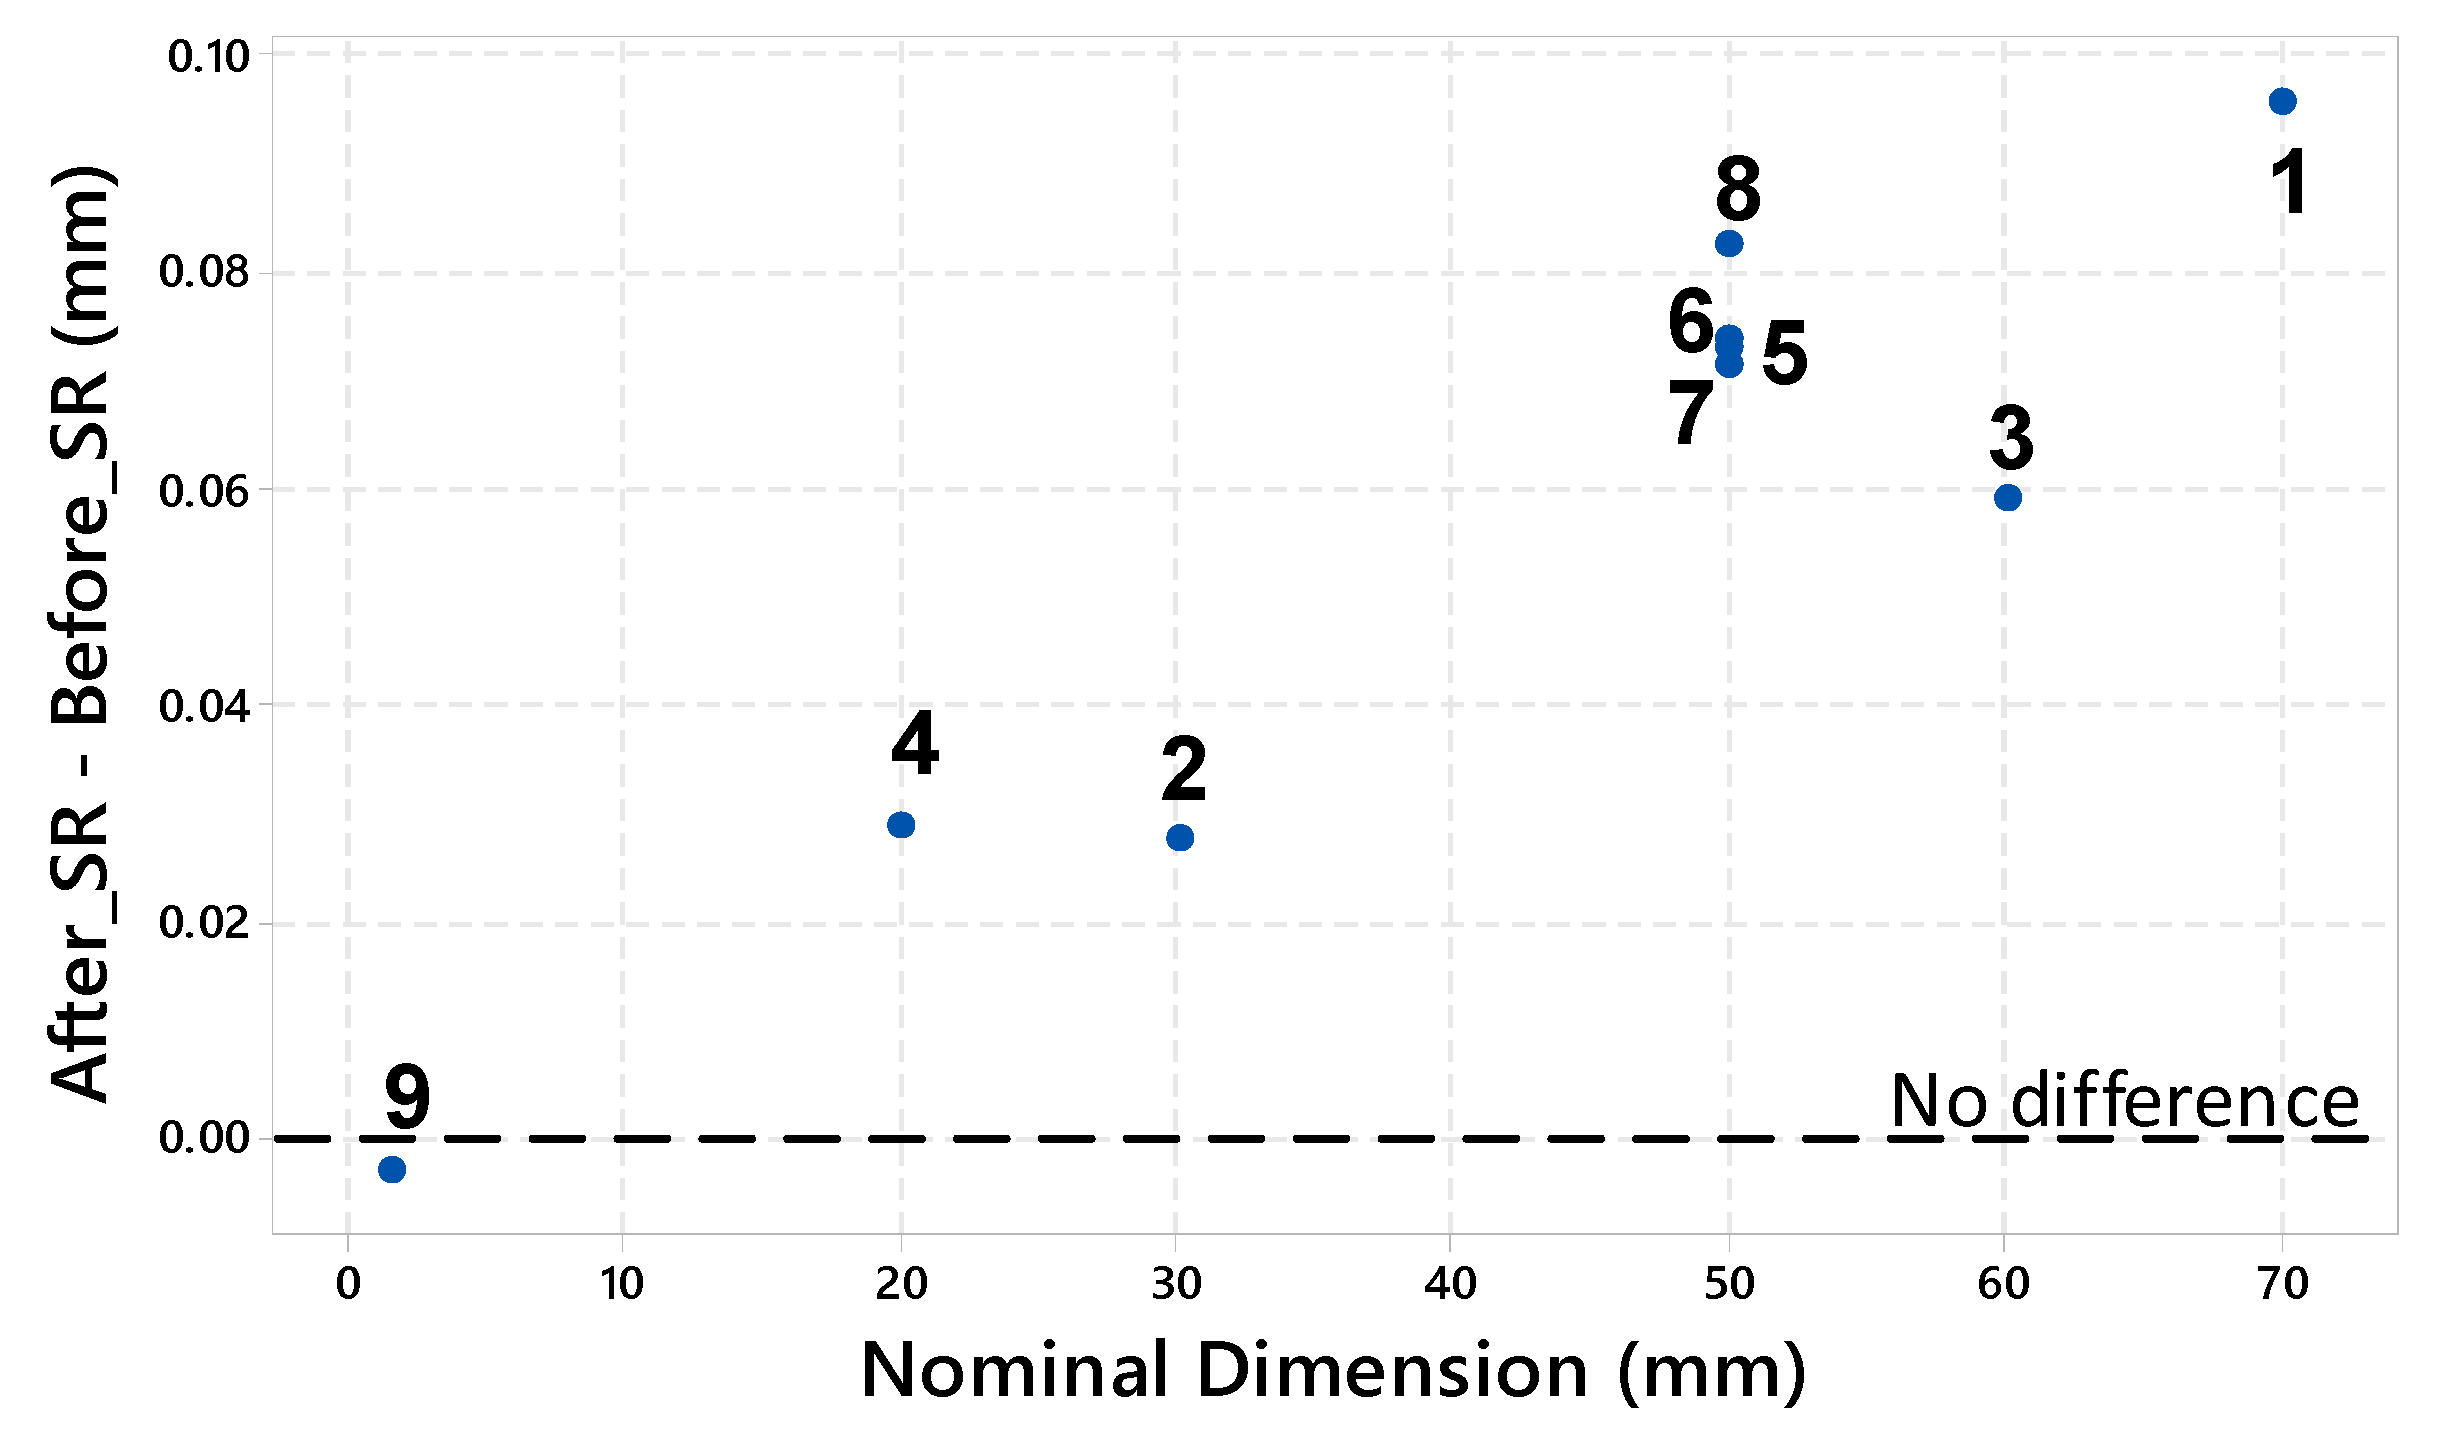
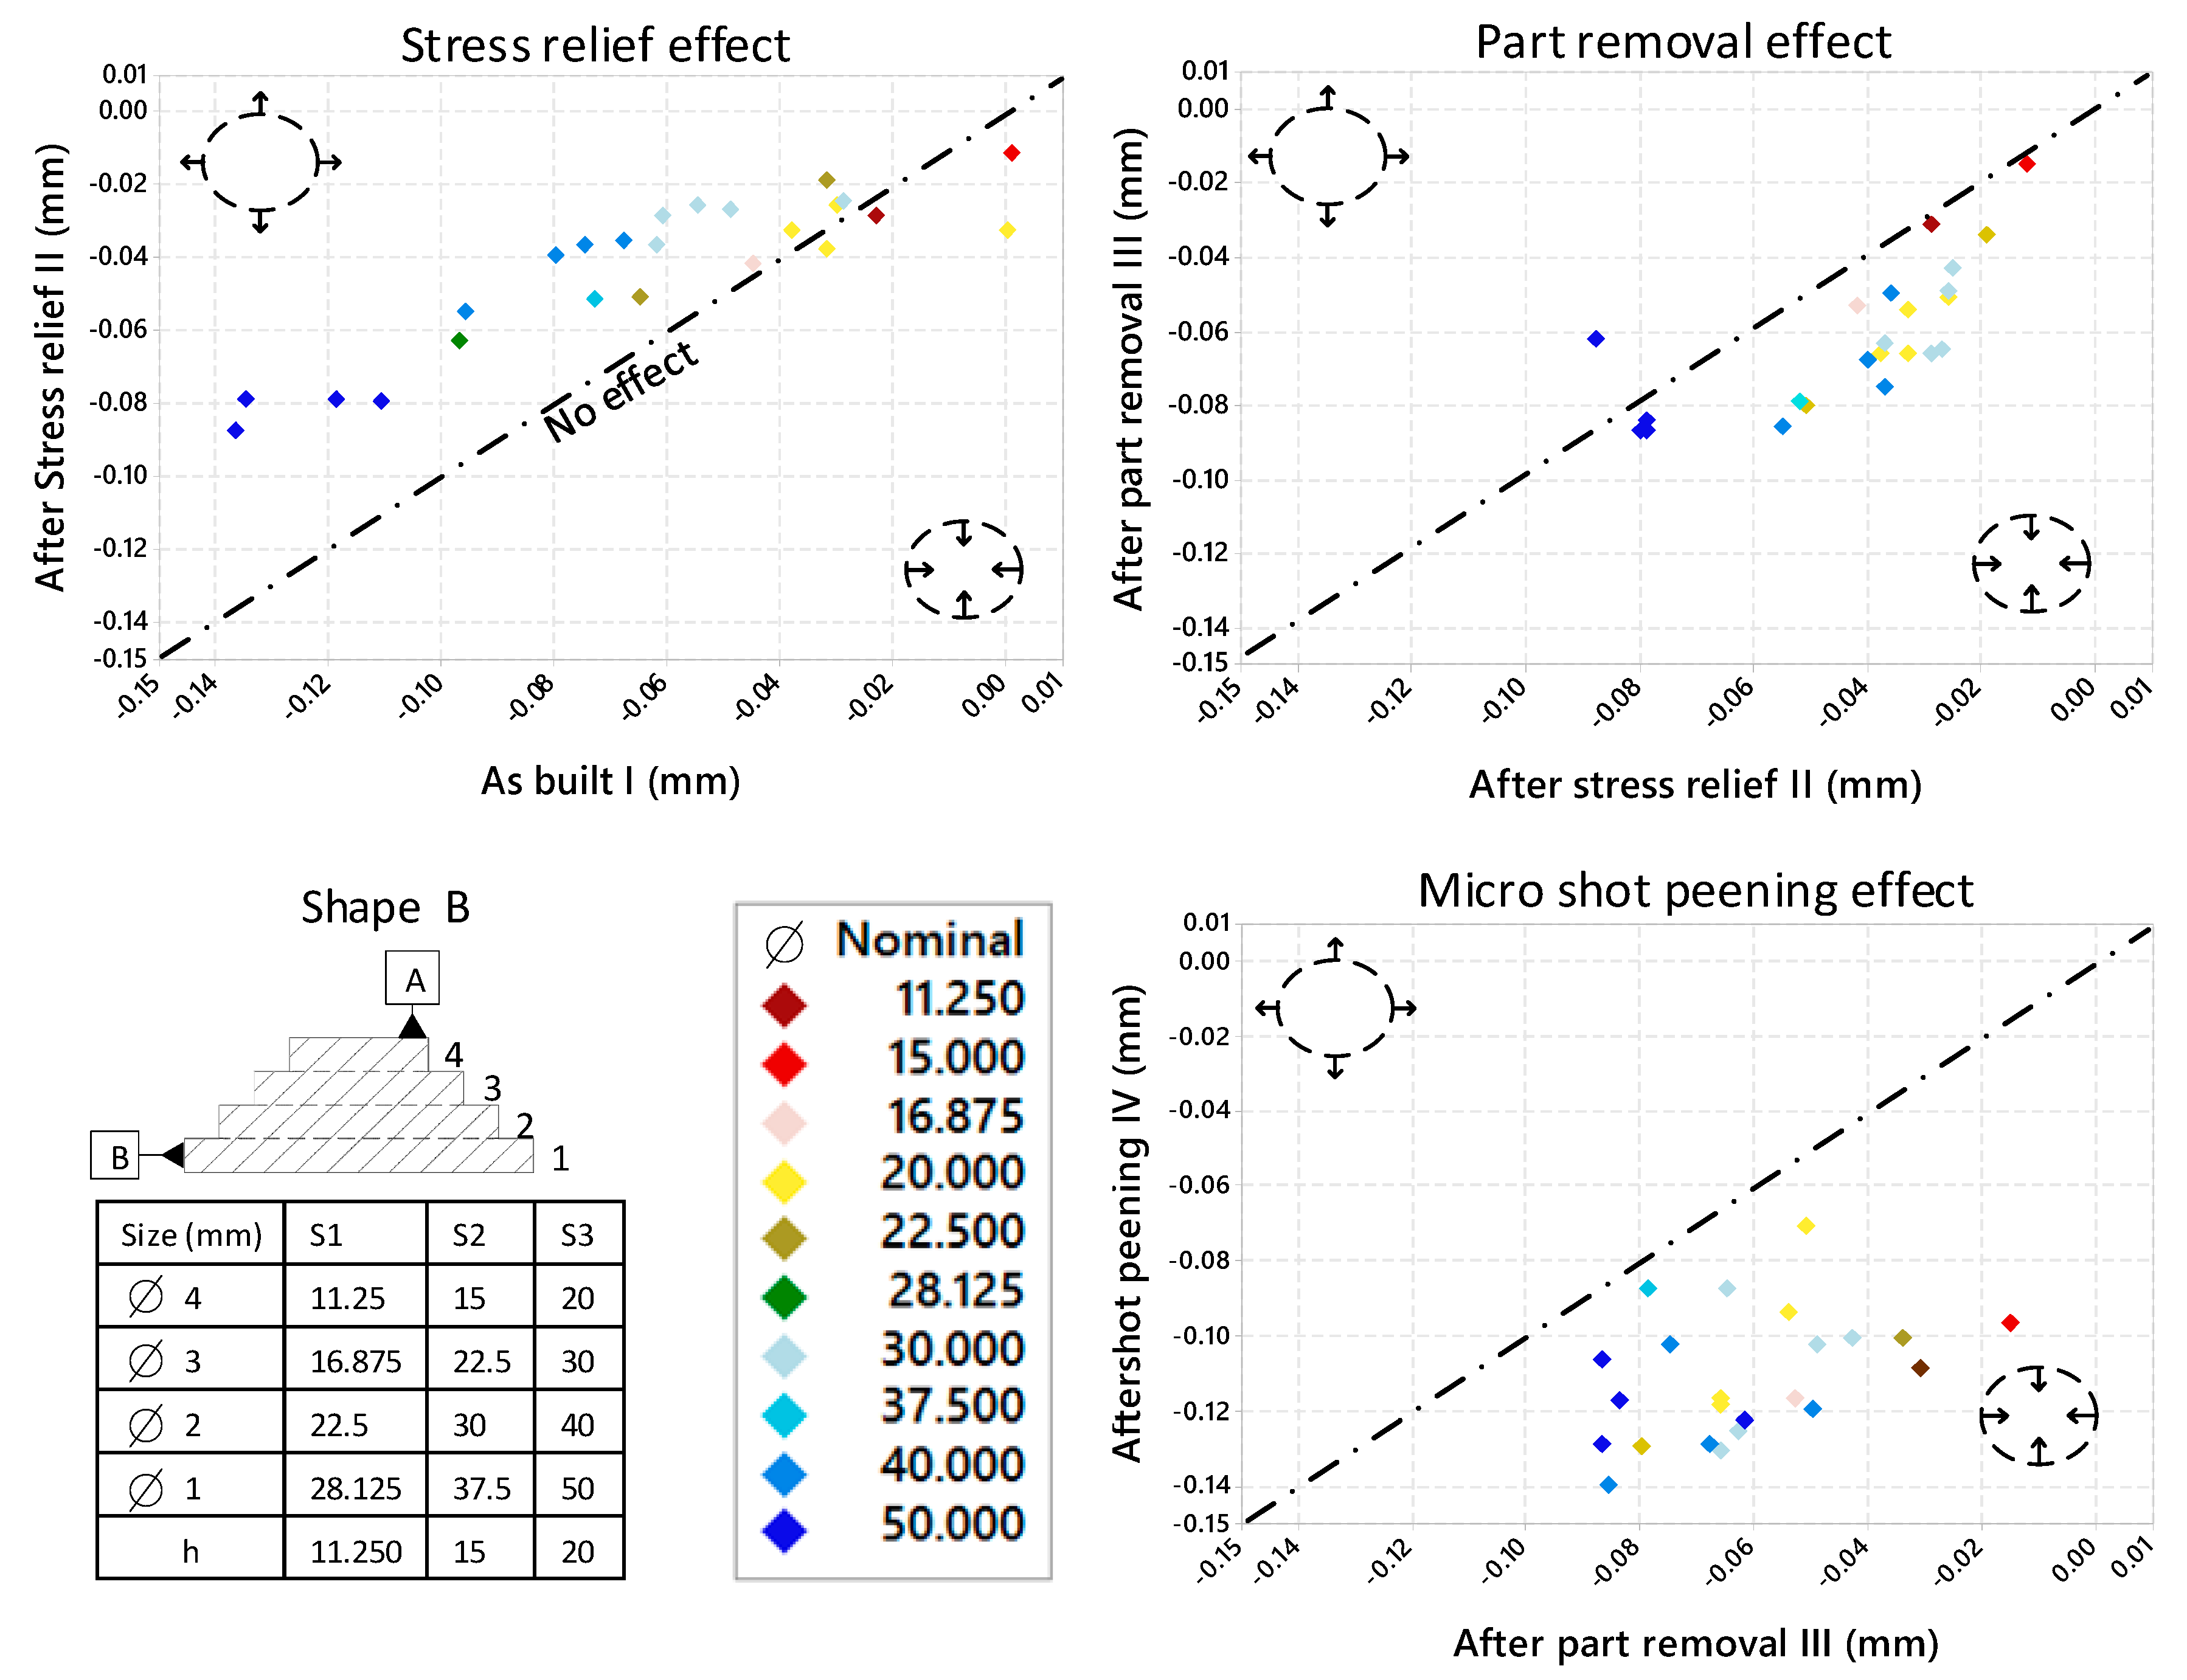
- Stress relief heat treatment reduces the intra- and inter-part scale effects by expanding (MMC) the larger features more than the smaller features.
- (4)
- The parts removal operation globally increases the parts deviations.
- (5)
- Micro shot peening has a positive effect on the surface roughness, but systematically reduces the parts size.
Author Contributions
Funding
Acknowledgments
Conflicts of Interest
Appendix A
Appendix B

| CAD (mm) | ID | I | II | II-I | |||
|---|---|---|---|---|---|---|---|
| (mm) | % | (mm) | % | (mm) | % | ||
| 70 | 1 | −0.084 | −0.12% | 0.012 | 0.02% | 0.096 | 0.14% |
| 30 | 2 | −0.06 | −0.20% | −0.033 | −0.11% | 0.028 | 0.09% |
| 60 | 3 | −0.071 | −0.12% | −0.011 | −0.02% | 0.059 | 0.10% |
| 20 | 4 | −0.042 | −0.21% | −0.013 | −0.07% | 0.029 | 0.15% |
| 50 | 5 | −0.057 | −0.11% | 0.016 | 0.03% | 0.073 | 0.15% |
| 50 | 6 | −0.096 | −0.19% | −0.022 | −0.04% | 0.074 | 0.15% |
| 50 | 7 | −0.063 | −0.13% | 0.009 | 0.02% | 0.072 | 0.14% |
| 50 | 8 | −0.075 | −0.15% | 0.008 | 0.02% | 0.083 | 0.17% |
| 1.5 | 9 | 0.067 | 4.47% | 0.064 | 4.27% | −0.003 | −0.20% |
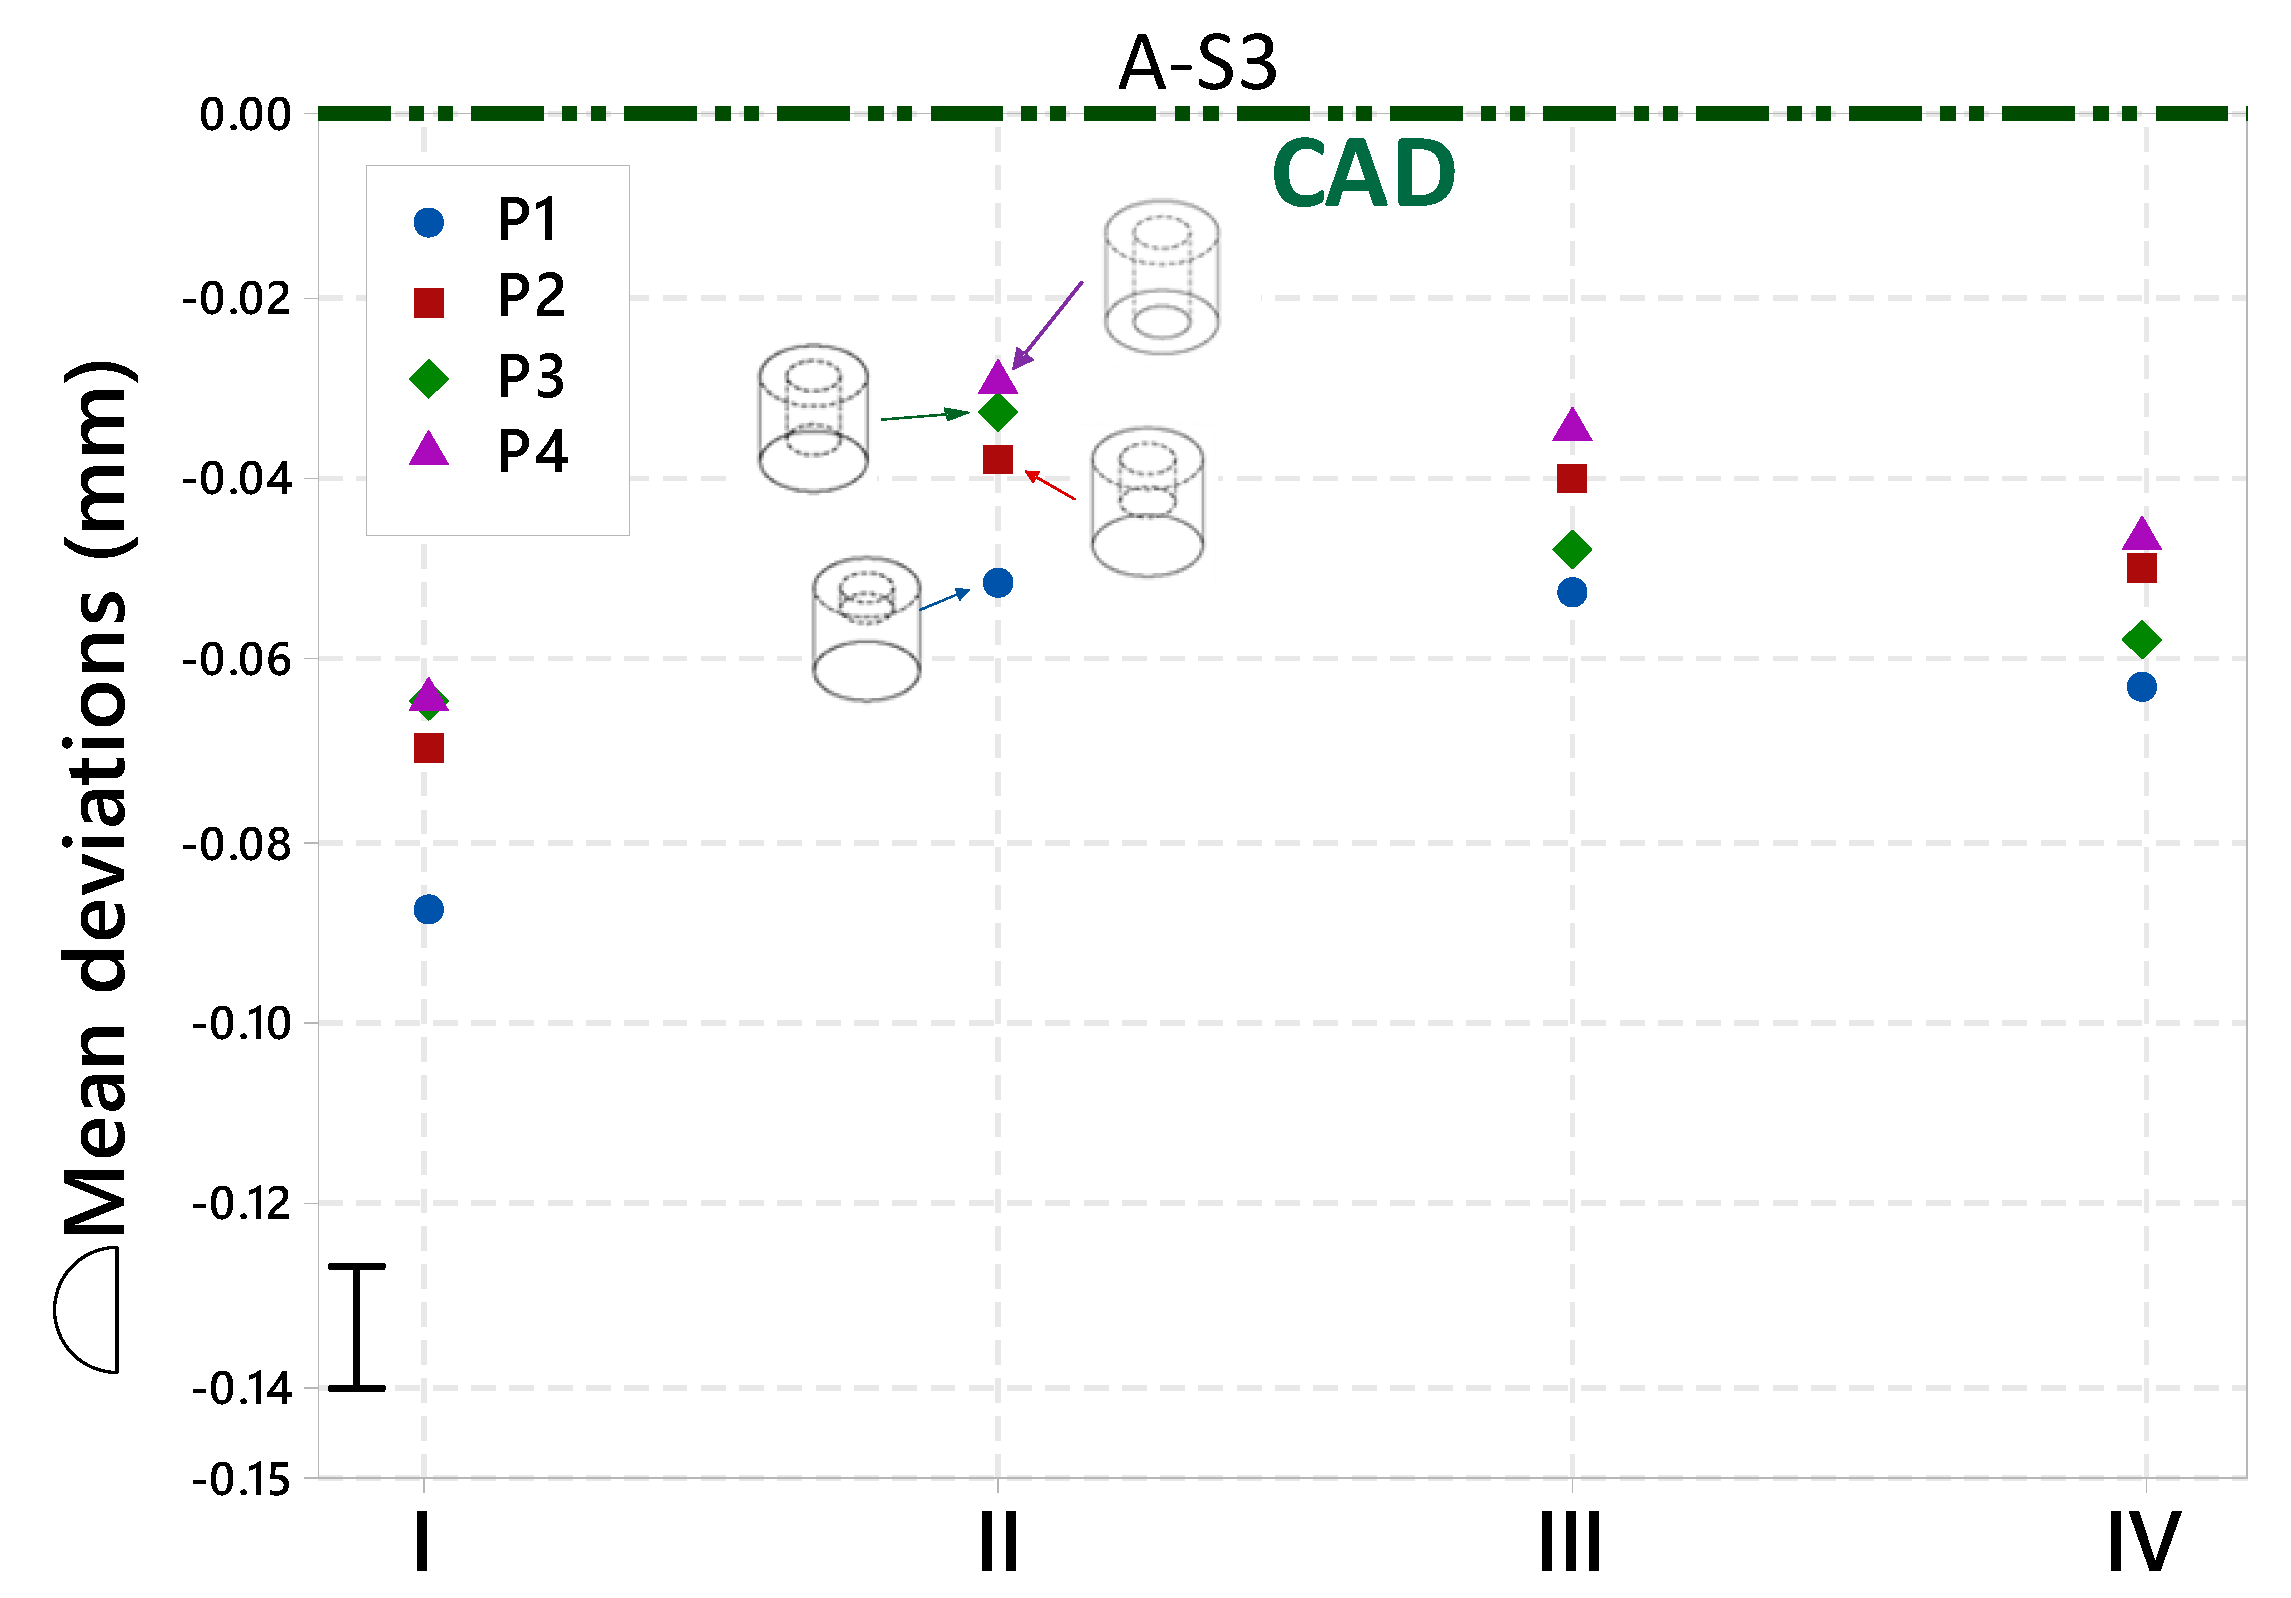
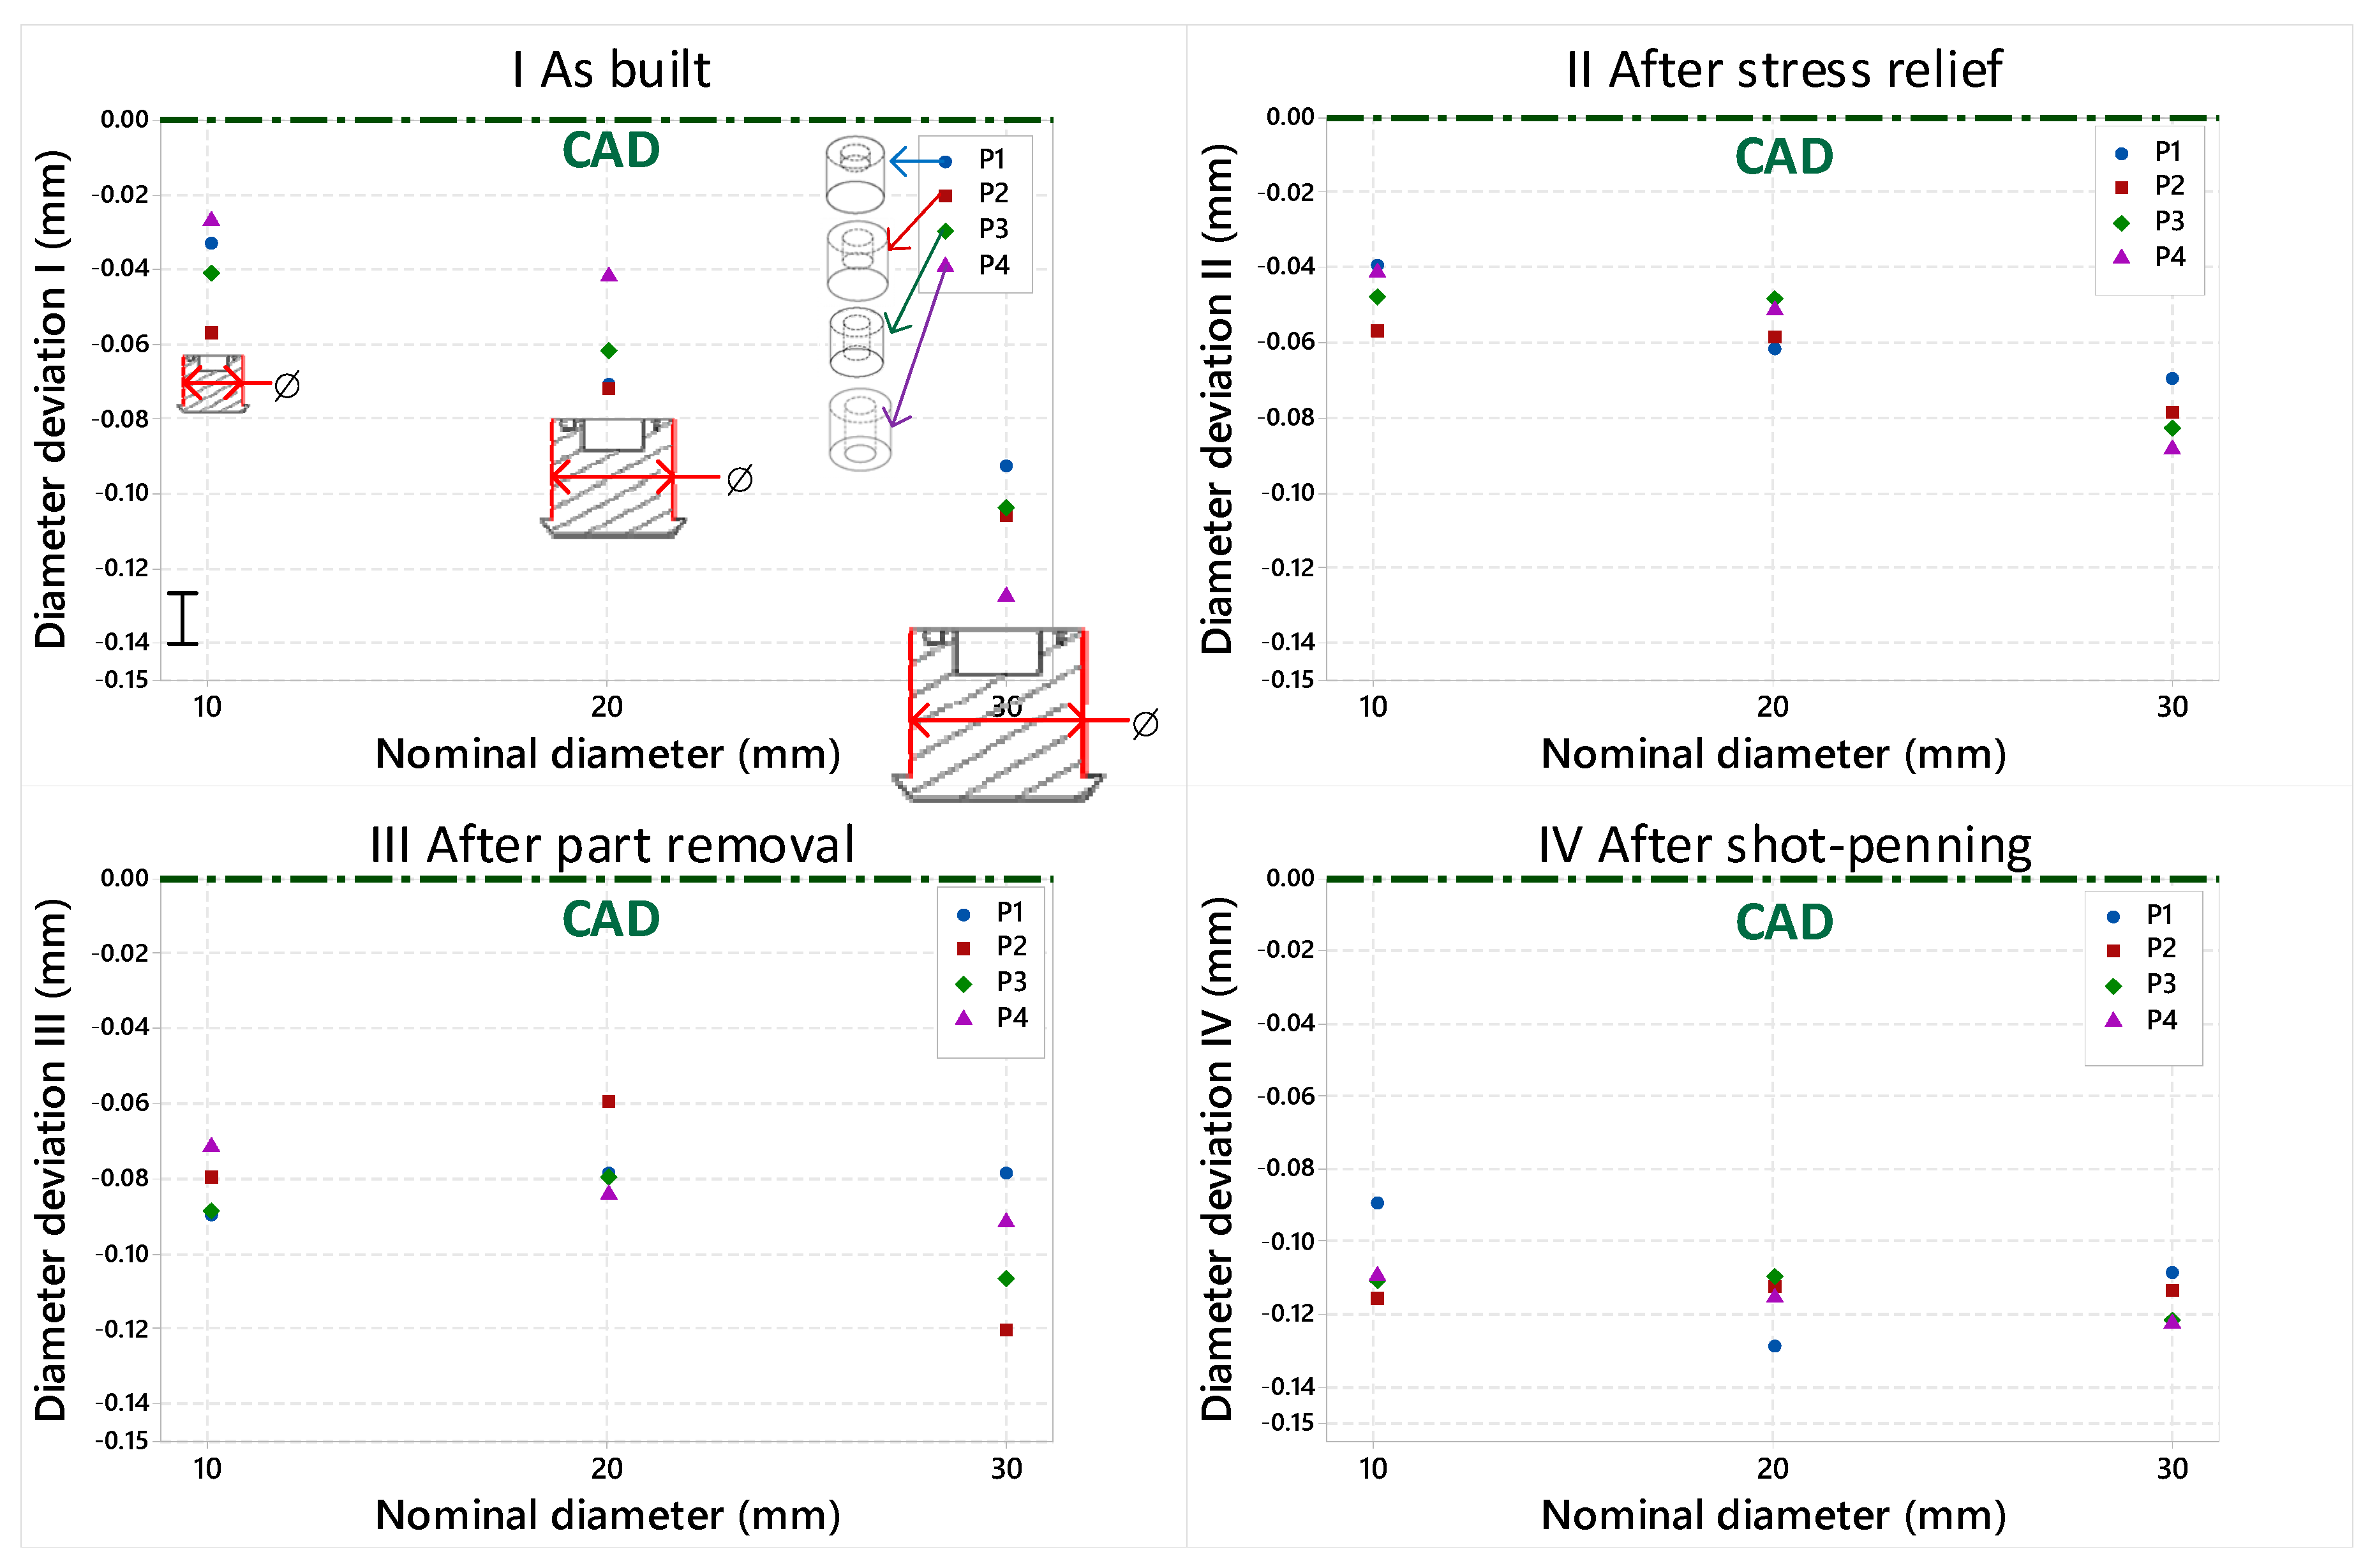
 ) mean deviations () of Shape A artifacts at each post-processing step (as-built I, after stress relief II, after part removal III and after micro shot peening IV).
) mean deviations () of Shape A artifacts at each post-processing step (as-built I, after stress relief II, after part removal III and after micro shot peening IV).
) mean deviations () of Shape A artifacts at each post-processing step (as-built I, after stress relief II, after part removal III and after micro shot peening IV).| (mm) | S3 | PPS | P1 | P2 | P3 | P4 |
| I | −0.088 | −0.07 | −0.065 | −0.065 | ||
| II | −0.052 | −0.038 | −0.033 | −0.03 | ||
| III | −0.0527 | −0.04 | −0.048 | −0.035 | ||
| IV | −0.063 | −0.05 | −0.058 | −0.047 | ||
| S2 | PPS | P1 | P2 | P3 | P4 | |
| I | −0.045 | −0.0355 | −0.0411 | −0.0459 | ||
| II | −0.028 | −0.018 | −0.0261 | −0.0261 | ||
| III | −0.047 | −0.0311 | −0.0337 | −0.0409 | ||
| IV | −0.05 | −0.0399 | −0.0415 | −0.0462 | ||
| S1 | PPS | P1 | P2 | P3 | P4 | |
| I | −0.0471 | −0.043 | −0.0476 | −0.03 | ||
| II | −0.0394 | −0.0357 | −0.0403 | −0.025 | ||
| III | −0.0535 | −0.0372 | −0.049 | −0.0358 | ||
| IV | −0.0568 | −0.0508 | −0.0558 | −0.0375 |
| (mm) | S3 | PPS | P1 | P2 | P3 | P4 | ||||
| (mm) | % | (mm) | % | (mm) | % | (mm) | % | |||
| I | −0.128 | −0.43% | −0.104 | −0.35% | −0.106 | −0.35% | −0.093 | −0.31% | ||
| II | −0.089 | −0.30% | −0.083 | −0.28% | −0.079 | −0.26% | −0.07 | −0.23% | ||
| III | −0.092 | −0.31% | −0.107 | −0.36% | −0.121 | −0.40% | −0.079 | −0.26% | ||
| IV | −0.123 | −0.41% | −0.122 | −0.41% | −0.114 | −0.38% | −0.109 | −0.36% | ||
| S2 | PPS | P1 | P2 | P3 | P4 | |||||
| (mm) | % | (mm) | % | (mm) | % | (mm) | % | |||
| I | −0.042 | −0.21% | −0.062 | −0.31% | −0.07 | −0.36% | −0.071 | −0.36% | ||
| II | −0.052 | −0.26% | −0.049 | −0.25% | −0.06 | −0.30% | −0.062 | −0.31% | ||
| III | −0.085 | −0.43% | −0.08 | −0.40% | −0.06 | −0.30% | −0.079 | −0.40% | ||
| IV | −0.116 | −0.58% | −0.11 | −0.55% | −0.11 | −0.57% | −0.129 | −0.65% | ||
| S1 | PPS | P1 | P2 | P3 | P4 | |||||
| (mm) | % | (mm) | % | (mm) | % | (mm) | % | |||
| I | −0.027 | −0.27% | −0.041 | −0.41% | −0.057 | −0.57% | −0.033 | −0.33% | ||
| II | −0.042 | −0.42% | −0.048 | −0.48% | −0.057 | −0.57% | −0.04 | −0.40% | ||
| III | −0.072 | −0.72% | −0.089 | −0.89% | −0.08 | −0.80% | −0.09 | −0.90% | ||
| IV | −0.11 | −1.10% | −0.111 | −1.11% | −0.116 | −1.16% | −0.09 | −0.90% | ||
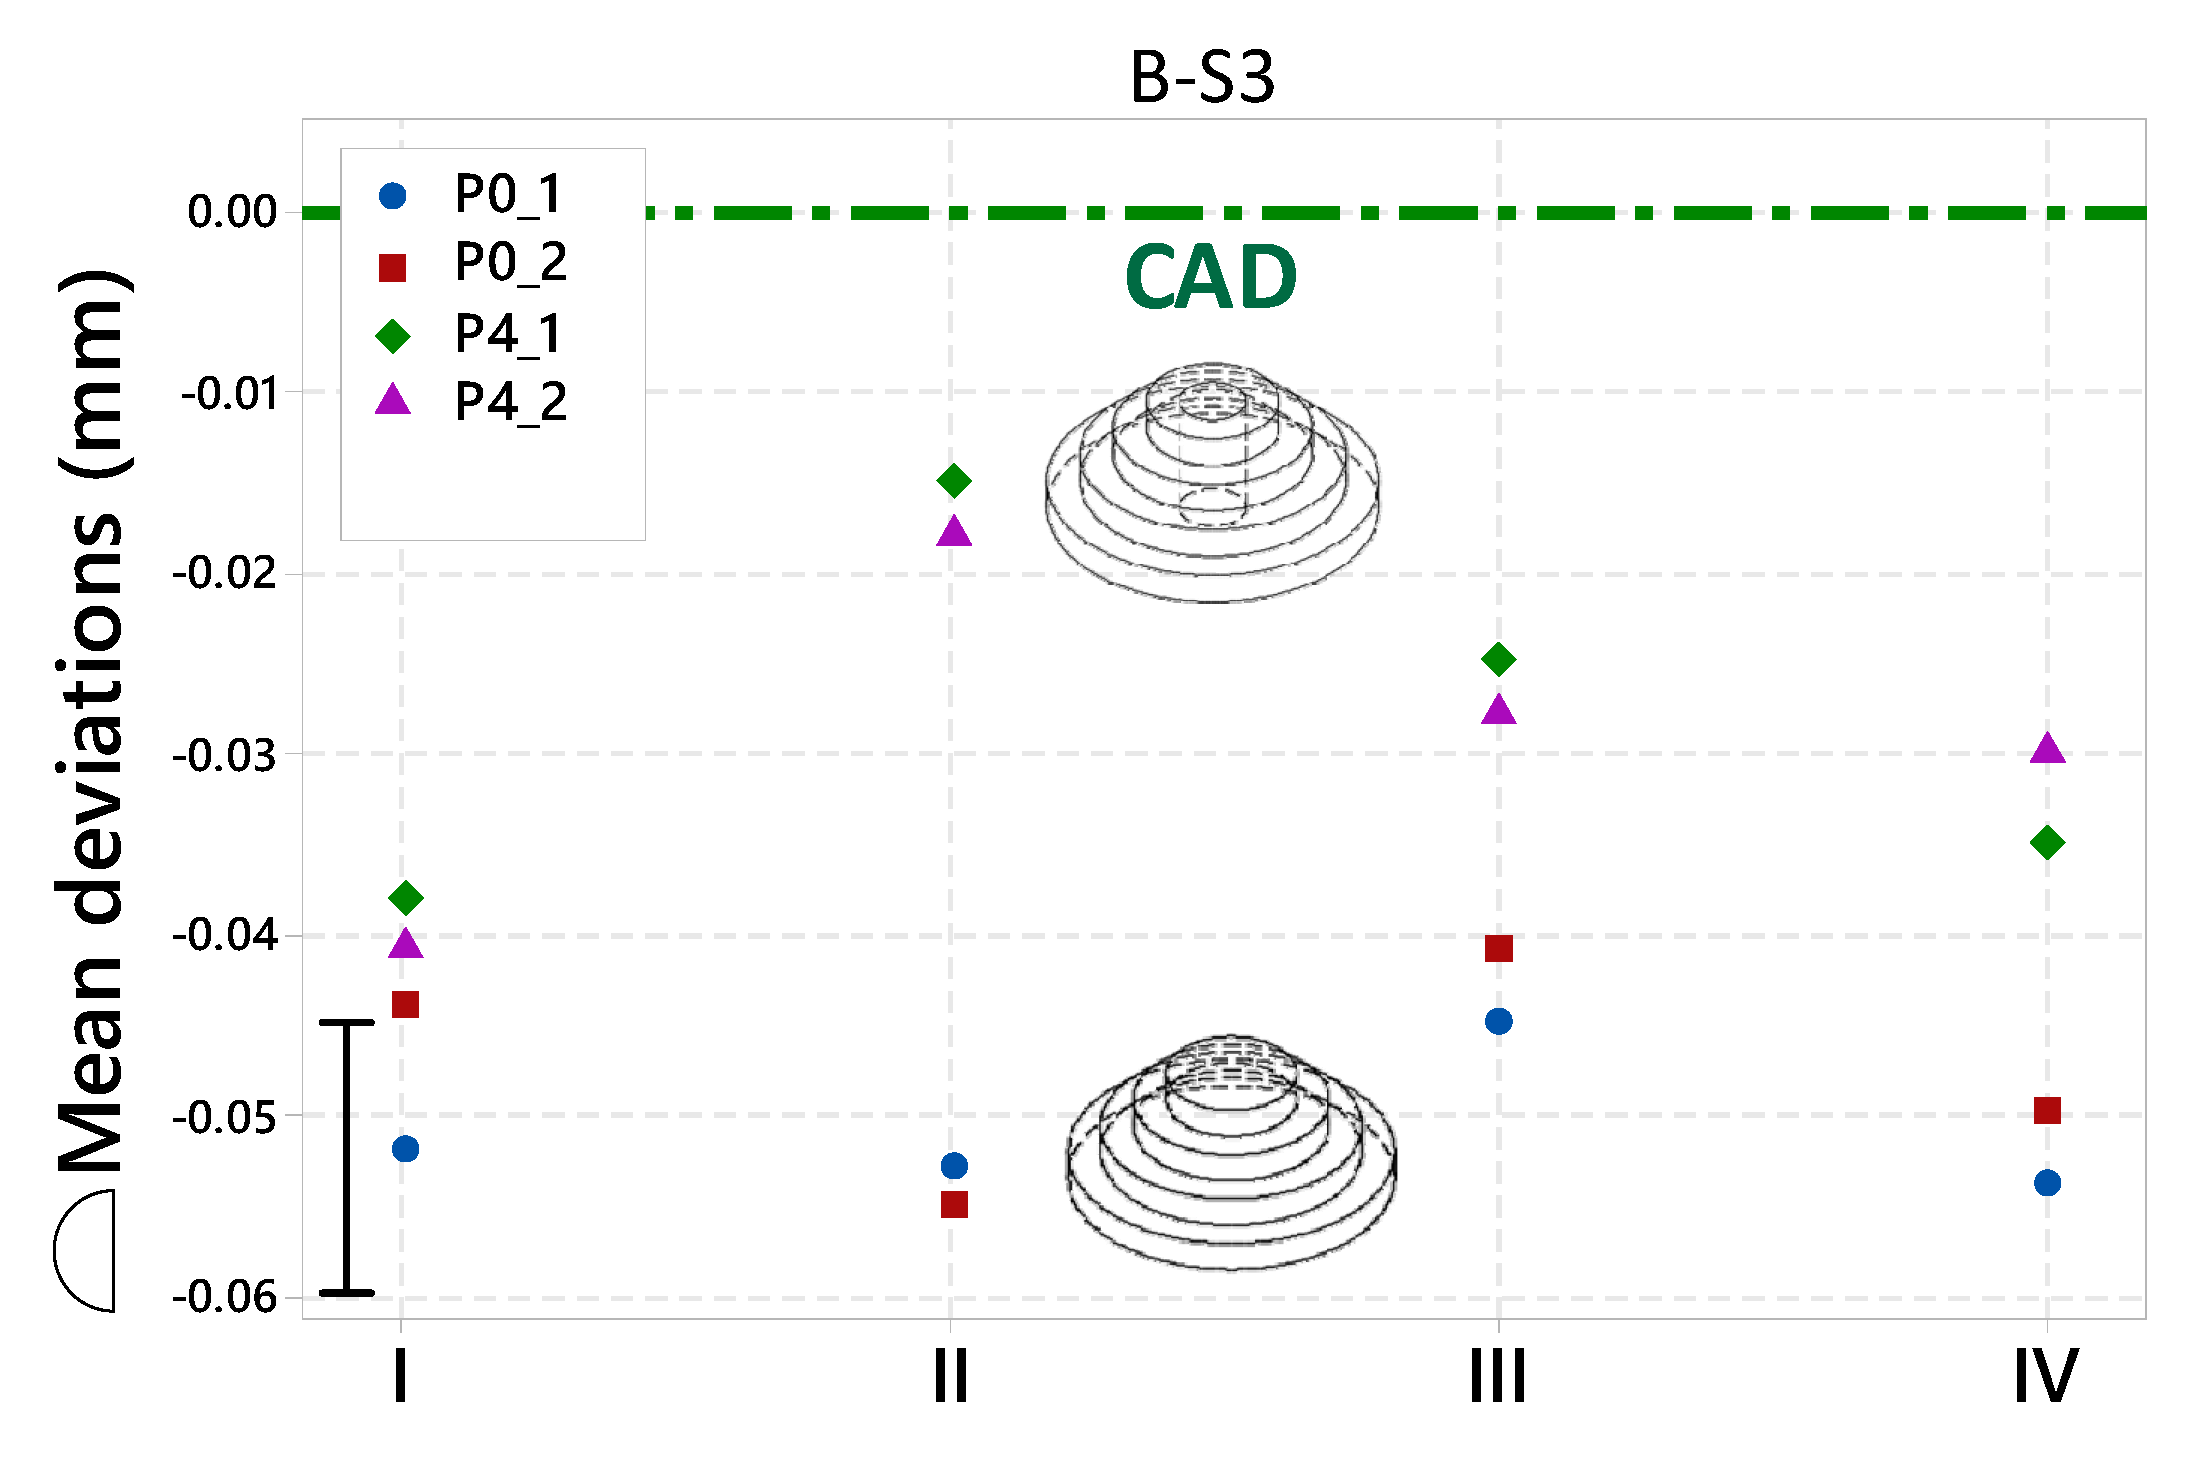
) mean deviations () of Shape B artifacts at each post-processing step (as-built I, after stress relief II, after part removal III and after micro shot peening IV).
) mean deviations () of Shape B artifacts at each post-processing step (as-built I, after stress relief II, after part removal III and after micro shot peening IV).| (mm) | S3 | PPS | P0-1 | P0-2 | P4-1 | P4-2 |
| I | −0.052 | −0.044 | −0.038 | −0.041 | ||
| II | −0.053 | −0.055 | −0.015 | −0.018 | ||
| III | −0.045 | −0.041 | −0.025 | −0.028 | ||
| IV | −0.054 | −0.05 | −0.035 | −0.03 | ||
| S2 | PPS | P4 | ||||
| I | −0.026 | |||||
| II | −0.002 | |||||
| III | −0.024 | |||||
| IV | −0.027 | |||||
| S1 | PPS | P4 | ||||
| I | −0.039 | |||||
| II | −0.021 | |||||
| III | −0.016 | |||||
| IV | −0.032 |
References
- Standard, A. ISO/ASTM 52900: 2015 Additive Manufacturing-General Principles-Terminology; ASTM F2792-10e1; ASTM: West Conshohocken, PA, USA, 2012. [Google Scholar]
- DIN, E. ISO/ASTM 52900: 2017-06 Additive Manufacturing—General Principles—Terminology (ISO/ASTM 52900: 2015); German Version EN ISO/ASTM; ASTM: West Conshohocken, PA, USA, 2017. [Google Scholar]
- Moylan, S.; Slotwinski, J.; Cooke, A.; Jurrens, K.; Donmez, M.A. Proposal for a standardized test artifact for additive manufacturing machines and processes. In Proceedings of the 2012 Annual International Solid Freeform Fabrication Symposium, Austin, TX, USA, 6–9 August 2012. [Google Scholar]
- Richter, J.; Jacobs, P. Rapid Prototyping & Manufacturing. Soc. Manuf. Eng. 1992, 12, 287–315. [Google Scholar]
- Byun, H.-S.; Lee, K.H. Design of a new test part for benchmarking the accuracy and surface finish of rapid prototyping processes. In Proceedings of the International Conference on Computational Science and Its Applications—ICCSA 2003, Montreal, QC, Canada, 18–21 May 2003; pp. 731–740. [Google Scholar]
- Kruth, J.P.; Vandenbroucke, B.; Van Vaerenbergh, J.; Mercelis, P. Benchmarking of different SLS/SLM processes as rapid manufacturing techniques. In Proceedings of the International Conference on Polymers and Moulds Innovations (PMI), Gent, Belgium, 20–23 April 2005. [Google Scholar]
- Loose, K.; Nakagawa, T. Benchmarking various methods of layer manufacturing systems in Rapid Prototyping. In Proceedings of the 15th Rapid Prototyping Symposium, Japan Society of Die and Mould Technology (JSDMT), Tokyo, Japan, November 1998. [Google Scholar]
- Zhou, J.G.; Herscovici, D.; Chen, C.C. Parametric process optimization to improve the accuracy of rapid prototyped stereolithography parts. Int. J. Mach. Tools Manuf. 2000, 40, 363–379. [Google Scholar] [CrossRef]
- Bakar, N.S.A.; Alkahari, M.R.; Boejang, H. Analysis on fused deposition modelling performance. J. Zhejiang Univ. Sci. A 2010, 11, 972–977. [Google Scholar] [CrossRef]
- Fahad, M.; Hopkinson, N. A new benchmarking part for evaluating the accuracy and repeatability of Additive Manufacturing (AM) processes. In Proceedings of the 2nd International Conference on Mechanical, Production and Automobile Engineering (ICMPAE 2012), Singapore, 28–29 April 2012. [Google Scholar]
- Thompson, M.K.; Mischkot, M. Design of test parts to characterize micro additive manufacturing processes. Procedia CIRP 2015, 34, 223–228. [Google Scholar] [CrossRef]
- Aubin, R.F. A World Wide Assessment of Rapid Prototyping Technologies; United Technologies Research Center Report; United Technologies Research Center: East Hartford, CT, USA, 1994. [Google Scholar]
- Fernandez-Vicente, M.; Canyada, M.; Conejero, A. Identifying limitations for design for manufacturing with desktop FFF 3D printers. Int. J. Rapid Manuf. 2015, 5, 116–128. [Google Scholar] [CrossRef]
- Lanzotti, A.; Del Giudice, D.M.; Lepore, A.; Staiano, G.; Martorelli, M. On the geometric accuracy of RepRap open-source three-dimensional printer. J. Mech. Des. 2015, 137, 101703. [Google Scholar] [CrossRef]
- Meisel, N.; Williams, C. An investigation of key design for additive manufacturing constraints in multimaterial three-dimensional printing. J. Mech. Des. 2015, 137, 111406. [Google Scholar] [CrossRef]
- Islam, M.N.; Sacks, S. An experimental investigation into the dimensional error of powder-binder three-dimensional printing. Int. J. Adv. Manuf. Technol. 2016, 82, 1371–1380. [Google Scholar] [CrossRef]
- Kniepkamp, M.; Fischer, J.; Abele, E. Dimensional accuracy of small parts manufactured by micro selective laser melting. In Proceedings of the 27th Annual International Solid Freeform Fabrication Symposium, Austin, TX, USA, 8–10 August 2016. [Google Scholar]
- Singh, S.; Sharma, V.S.; Sachdeva, A. Optimization and analysis of shrinkage in selective laser sintered polyamide parts. Mater. Manuf. Process. 2012, 27, 707–714. [Google Scholar] [CrossRef]
- Huang, Q.; Nouri, H.; Xu, K.; Chen, Y.; Sosina, S.; Dasgupta, T. Statistical predictive modeling and compensation of geometric deviations of three-dimensional printed products. J. Manuf. Sci. Eng. 2014, 136, 061008. [Google Scholar] [CrossRef]
- Zongo, F.; Tahan, A.; Aidibe, A.; Brailovski, V. Intra-and inter-repeatability of profile deviations of an AlSi10Mg tooling component manufactured by laser powder bed fusion. J. Manuf. Mater. Process. 2018, 2, 56. [Google Scholar] [CrossRef]
- Calignano, F.; Lorusso, M.; Pakkanen, J.; Trevisan, F.; Ambrosio, E.P.; Manfredi, D.; Fino, P. Investigation of accuracy and dimensional limits of part produced in aluminum alloy by selective laser melting. Int. J. Adv. Manuf. Technol. 2017, 88, 451–458. [Google Scholar] [CrossRef]
- Van Bael, S.; Kerckhofs, G.; Moesen, M.; Pyka, G.; Schrooten, J.; Kruth, J. Micro-CT-based improvement of geometrical and mechanical controllability of selective laser melted Ti6Al4V porous structures. Mater. Sci. Eng. A 2011, 528, 7423–7431. [Google Scholar] [CrossRef]
- Li, C.; Sun, S.; Liu, C.; Lu, Q.; Ma, P.; Wang, Y. Microstructure and mechanical properties of TiC/AlSi10Mg alloy fabricated by laser additive manufacturing under high-frequency micro-vibration. J. Alloys Compd. 2019, 794, 236–246. [Google Scholar] [CrossRef]
- Liu, B.; Kuai, Z.; Li, Z.; Tong, J.; Bai, P.; Li, B.; Nie, Y. Performance Consistency of AlSi10Mg Alloy Manufactured by Simulating Multi Laser Beam Selective Laser Melting (SLM): Microstructures and Mechanical Properties. Materials 2018, 11, 2354. [Google Scholar] [CrossRef] [PubMed]
- Del Re, F.; Contaldi, V.; Astarita, A.; Palumbo, B.; Squillace, A.; Corrado, P.; Di Petta, P. Statistical approach for assessing the effect of powder reuse on the final quality of AlSi10Mg parts produced by laser powder bed fusion additive manufacturing. Int. J. Adv. Manuf. Technol. 2018, 97, 2231–2240. [Google Scholar] [CrossRef]
- Panda, B.K.; Sahoo, S. Thermo-mechanical modeling and validation of stress field during laser powder bed fusion of AlSi10Mg built part. Results Phys. 2019, 12, 1372–1381. [Google Scholar] [CrossRef]
- Aidibe, A.; Tahan, A.; Brailovski, V. A Novel Industrial Test Artifact for the Evaluation of Dimensional Capabilities of Metallic Additive Manufacturing Systems. In Proceedings of the European Powder Metallurgy Association (EPMA)—Euro PM2018, Bilbao, Spain, 14–18 October 2018; p. 6. [Google Scholar]

© 2019 by the authors. Licensee MDPI, Basel, Switzerland. This article is an open access article distributed under the terms and conditions of the Creative Commons Attribution (CC BY) license (http://creativecommons.org/licenses/by/4.0/).
Share and Cite
Zongo, F.; Tahan, A.; Brailovski, V. Scale, Material Concentration, Stress Relief and Part Removal Effects on the Dimensional Behaviour of Selected AlSi10Mg Components Manufactured by Laser Powder Bed Fusion. J. Manuf. Mater. Process. 2019, 3, 49. https://doi.org/10.3390/jmmp3020049
Zongo F, Tahan A, Brailovski V. Scale, Material Concentration, Stress Relief and Part Removal Effects on the Dimensional Behaviour of Selected AlSi10Mg Components Manufactured by Laser Powder Bed Fusion. Journal of Manufacturing and Materials Processing. 2019; 3(2):49. https://doi.org/10.3390/jmmp3020049
Chicago/Turabian StyleZongo, Floriane, Antoine Tahan, and Vladimir Brailovski. 2019. "Scale, Material Concentration, Stress Relief and Part Removal Effects on the Dimensional Behaviour of Selected AlSi10Mg Components Manufactured by Laser Powder Bed Fusion" Journal of Manufacturing and Materials Processing 3, no. 2: 49. https://doi.org/10.3390/jmmp3020049
APA StyleZongo, F., Tahan, A., & Brailovski, V. (2019). Scale, Material Concentration, Stress Relief and Part Removal Effects on the Dimensional Behaviour of Selected AlSi10Mg Components Manufactured by Laser Powder Bed Fusion. Journal of Manufacturing and Materials Processing, 3(2), 49. https://doi.org/10.3390/jmmp3020049