Article

Environmental Emissions from Chemical Etching Synthesis of Silicon Nanotube for Lithium Ion Battery Applications

1
Department of Mechanical Engineering, University of Wisconsin-Milwaukee, Milwaukee, WI 53211, USA
2
Department of Mechanical and Aerospace Engineering, Case Western Reserve University, Cleveland, OH 44106, USA
*
Author to whom correspondence should be addressed.
J. Manuf. Mater. Process. 2018, 2(1), 11; https://doi.org/10.3390/jmmp2010011
Submission received: 10 December 2017 / Revised: 13 January 2018 / Accepted: 17 January 2018 / Published: 1 February 2018

Abstract

:
Silicon nanotubes (SiNTs) have been researched as a promising anode material to replace graphite in next-generation lithium ion batteries. Chemical etching synthesis of SiNTs is a simple, controllable and scalable process for SiNT fabrication, but the environmental emissions are of grave concern. In this paper, the process emissions from chemical etching synthesis of SiNTs as anode for lithium ion batteries is studied through experimental techniques, considering the categories of aqueous wastes, gaseous emissions, aqueous nano-particle emissions, and gaseous aerosol emissions. The synthesized SiNTs are measured at 10 μm length and 1–2.2 μm diameter, and can maintain a specific capacity of over 800 mAh/g after 100 cycles in battery testing. In aqueous waste, the chemical compositions of all elements participating in the chemical etching are experimentally determined, with AgNO3 and Co(NO3)2 identified as the major pollutants. The only gaseous emission generated from the chemical etching synthesis process is H2, with 0.0088 ± 0.0002 mol H2 generated to produce 1.0 mg SiNTs. The aqueous nanoparticle sizes are found to be between 250 nm and 1540 nm. A large number of aerosol nanoparticle emissions of up to 2.96 × 10⁷ particles/cm3 are detected through in situ experimental measurement.

1. Introduction

Advanced energy storage systems are under rapid development as next-generation power systems for electric vehicles (EV), portable devices, and stationary energy resources [1,2]. Currently, lithium-ion batteries (LIBs) are the primary power sources for these applications, due to their relatively high energy density and long cycle time compared with other battery technologies [2,3]. However, the energy storage capacity of LIBs is still not high enough, and can only power the EVs and portable electronics for a limited distance and time. In recent years, high-capacity batteries have attracted enormous research interest, especially with regard to novel battery material development, with the aim of producing advanced energy storage systems for a wide range of applications.
Current LIBs use graphite as anode, with a specific capacity of 372 mAh/g [4]. In comparison, silicon has a high specific capacity of 4200 mAh/g, which is 11 times that of the graphite anode currently used in LIBs [5]. Additionally, silicon also has advantages such as being a low-cost and non-toxic material. As a result, silicon is widely recognized as an ideal anode material for next-generation lithium ion battery technologies. However, the application of bulk silicon in lithium ion material suffers from large volume expansion (300~400%) during the lithiation/delithiation processes, which causes electrode cracking, electrical contact loss, voltage cutoff and rapid capacity fading [1,6,7]. To minimize the negative influences of volume expansion, various types of nano-structured Si materials, including silicon nanotubes [8,9], silicon nanowires [10,11], and silicon nano-porous particles [12,13], have been developed.
Among the various nano-structured silicon materials, silicon nanotubes have demonstrated promising performance for use in next-generation lithium ion batteries. It has been reported in the literature that silicon nanotube in LIB has obtained a high specific capacity of 1132 mAh/g, with a long cycling life of 400 charging/discharging cycles. There are a number of processing methods for fabricating silicon nanotubes in the literature, including chemical vapor deposition (CVD) [1,9], chemical etching [14], and liquid-synthetic reactions [15,16]. Among these, chemical etching is a simpler, more controllable and scalable process that can produce silicon nanotubes with a relative high yield. Chemical etching has a high potential for future large-scale production of silicon nanotubes for next-generation LIB applications.
As a nano-scale synthesis process for silicon nanotubes, chemical etching produces a large volume of waste and emissions, including novel nano-particle waste and emissions. The chemical material—e.g., hydrofluoric acid (HF)—used in the etching process, is highly toxic [17,18]. Additionally, nanoparticles are found with more toxic effects than their bulk counterparts, and may have adverse impacts on human health and the environment.
The purpose of this study is to quantify the type and amount of environmental emissions from the chemical etching process for silicon nanotube synthesis, which could help to understand the potential environmental impacts of the technology during this early research and development stage, and to support its sustainable development in future for actual application in lithium ion batteries. The structure of this paper is organized as follows: the materials and methods section describes the materials used and the experimental methods employed to fabricate the SiNT and test the emissions. Subsequently, the results and discussion section presents the measured results of the environmental emissions and the related discussion. Finally, the conclusions of this study are presented.

2. Materials and Methods

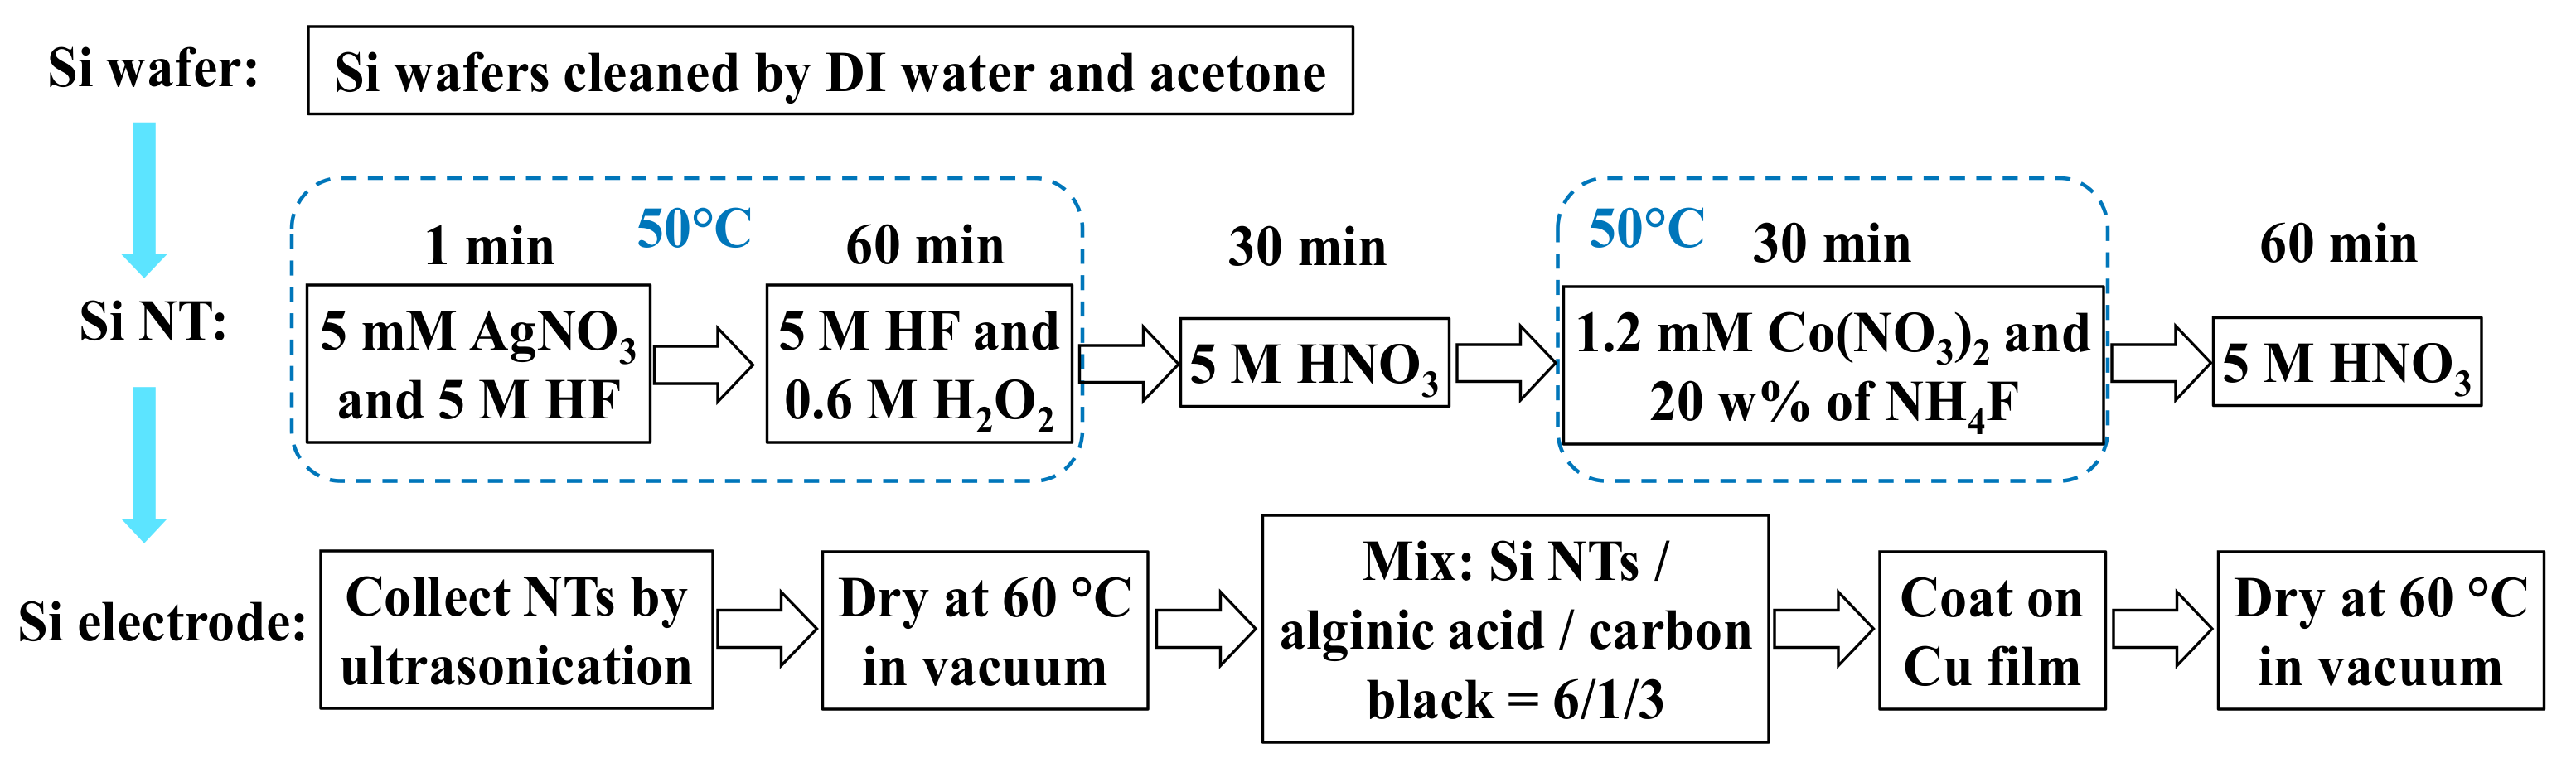
2.1. Synthesis of Silicon Nanotubes

The chemical etching process for the synthesis of the silicon nanotubes is shown in Figure 1. After cleaning by DI water and acetone, Si wafers (100) are first dipped into 5 mM AgNO3 (silver nitrate, Sigma-Aldrich, St. Louis, MO, USA) and 5 M HF (hydrofluoric acid, Sigma-Aldrich) for 60 s to deposit Ag on the surface. Secondly, the Ag-deposited wafers are etched in 5 M HF mixed with 0.6 M H2O2 (hydrogen peroxide, Sigma-Aldrich) for 60 min. After washing the remaining Ag away with 5 M HNO3 (nitric acid, Sigma-Aldrich) in the third step, Si wafers are then dropped into 1.2 mM Co(NO3)2 (cobalt(II) nitrate hexahydrate, Sigma-Aldrich) and 20 wt % NH4F (ammonium fluoride, Sigma-Aldrich) for 30 min. Finally, the Si wafers are cleaned in 5 M HNO3 again to remove all the chemical residues on the surface. The processes are kept in a 50 °C water bath constantly except the two steps using HNO3. Si NTs are collected by ultrasonication in DI water and dried at 60 °C in vacuum heater.

2.2. Silicon Nanotube Battery Fabrication

In this study, CR2032 coin cells with the SiNTs anode are fabricated. The SiNT anode contains 60 wt % Si nanotubes, 10 wt % alginic acid (2 wt % water solution) and 30 wt % carbon black. The mixture of the anode materials is blended, ground, and coated on copper films and dried at 60 °C in vacuum heater. In total, 0.152 mg Si are loaded on each piece of film. 1.0 M LiPF6 with EC/DEC (ethylene carbonate/diethylene carbonate, 50/50 V/V), 10% FEC and 2% VC is used as electrolyte. Pure Li metal is used as the counter electrode. Because Li and electrolyte are sensitive to air and moisture, the battery fabrication is accomplished in glove box. The fabricated batteries are tested on a LANHE battery tester.

2.3. Emission Analyses

The environmental emissions and wastes from the SiNT synthesis processes are categorized into the following four groups: aqueous wastes, gaseous emissions, aqueous particles emissions, and gaseous aerosol emissions. Based on the process characteristics, the five major steps generating environmental emissions and wastes, including AgNO3 + HF, H2O2 + HF, the first wash of HNO3, Co(NO3)2 + NH4F, and the final wash of HNO3 are named step #1, #2, #3, #4 and #5, respectively, in this study. Meanwhile, 5 samples are collected and measured for each category of emissions and wastes.

2.3.1. Aqueous Waste

Based on the chemical reactions, the major pollutants in aqueous waste are the two highly toxic chemicals Ag and Co Sampled as S#1, S#2, S#3, S#4 and S#5, concentrations of Ag and Co are analyzed by ICP-AES, an emission spectroscopy designed for trace metals. Metals are determined based on the spectral characteristics of elements. Further analysis of light intensity, which is proportional to concentration, is used to determine the real quantity of each metal. Because S#1, S#2 and S#4 contain significant amounts of HF, they cannot be injected into ICP-AES directly without pretreatment. Since Ca2+ in Ca(NO3)2 (calcium nitrate tetrahydrate) reacts easily with F to form insoluble precipitation, CaF2, Ca(NO3)2 is used here to remove F. After filtering CaF2, the solutions are stored away from light for ICP-AES measurement.

2.3.2. Gaseous Emissions

To systematically study the gaseous emissions and eliminate other distractions as much as possible, the whole etching process is executed in a sealed system, where ambient air is measured as the background gaseous component. Five gaseous samples, named G#1, G#2, G#3, G#4 and G#5, are collected, filtered (HEPA Zero Filter, TSI), and saved in a sealed container for residual gas analyzer (RGA), which is a small mass spectrometer measuring the partial pressure of each gas. RGA is composed of an electron ionization (EI) source, a quadrupole system for detection and a turbo pump to provide the propulsive force of gases. It can accurately determine the compositions and concentrations of gases simultaneously by measuring their partial pressure. According to the general gas equation and Avogadro’s law, partial pressures of gases are proportional to their concentrations.

2.3.3. Aqueous Nanoparticle Emissions

The aqueous nanoparticle emissions are analyzed by SEM (scanning electron microscope, Hitachi S-4800) and EDS (QUANTAX EDS, Bruker Corp., Madison, WI, USA) to obtain their morphologies and chemical compositions. The particle sizes and size distributions are measured using a Zetapals potential analyzer (Brookhaven Instruments Corp., Holtsville, NY, USA). Zetapals measures light-scattering of nanoparticles, converts the results into the electrophoretic mobility of charged particles, and finally determines their size distributions.

2.3.4. Gaseous Aerosol Emissions

The morphologies of gaseous aerosol emissions are photographed using SEM. In situ measurement of the particle size and concentration is accomplished using a UCPC (ultrafine condensation particle counter, TSI 3776), which can perform in situ measurement of concentrations up to 300,000 particles/cm3 (R2 > 0.998) [19,20]. To avoid exceeding the maximum input in this measurement, gas flow is diluted with filtered air (HEPA Zero Filter, 50/50 V/V) by a 3-way adapter before it enters the UCPC.

3. Results and Discussion

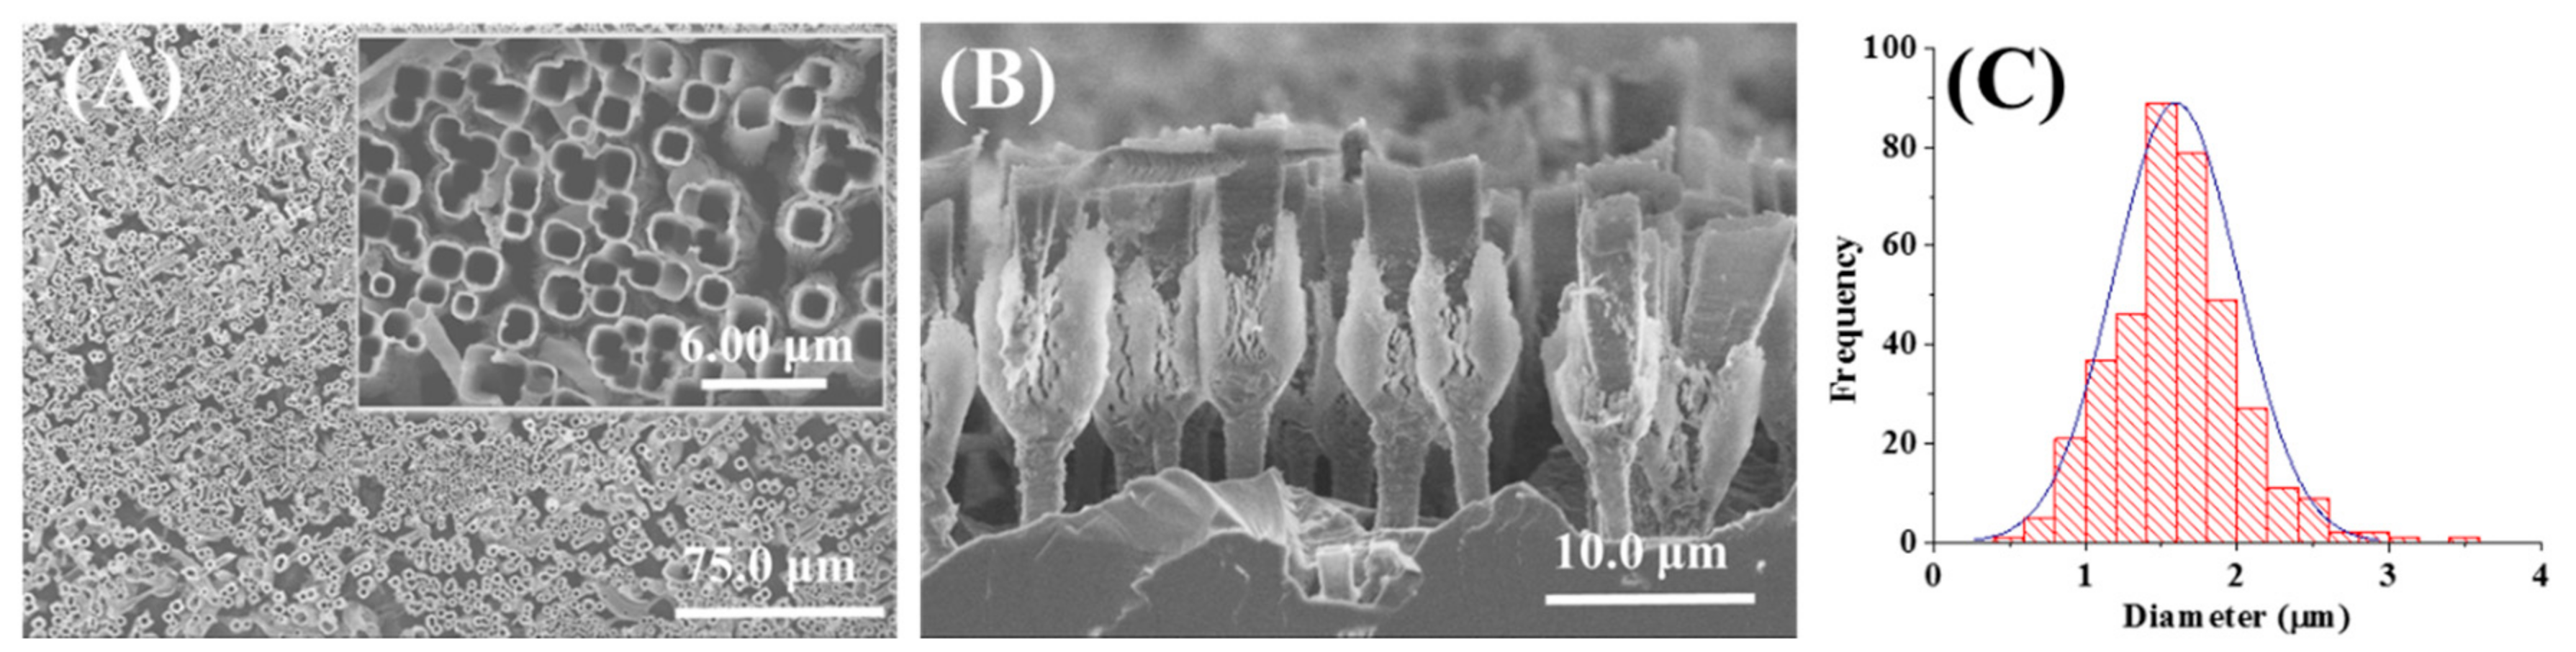
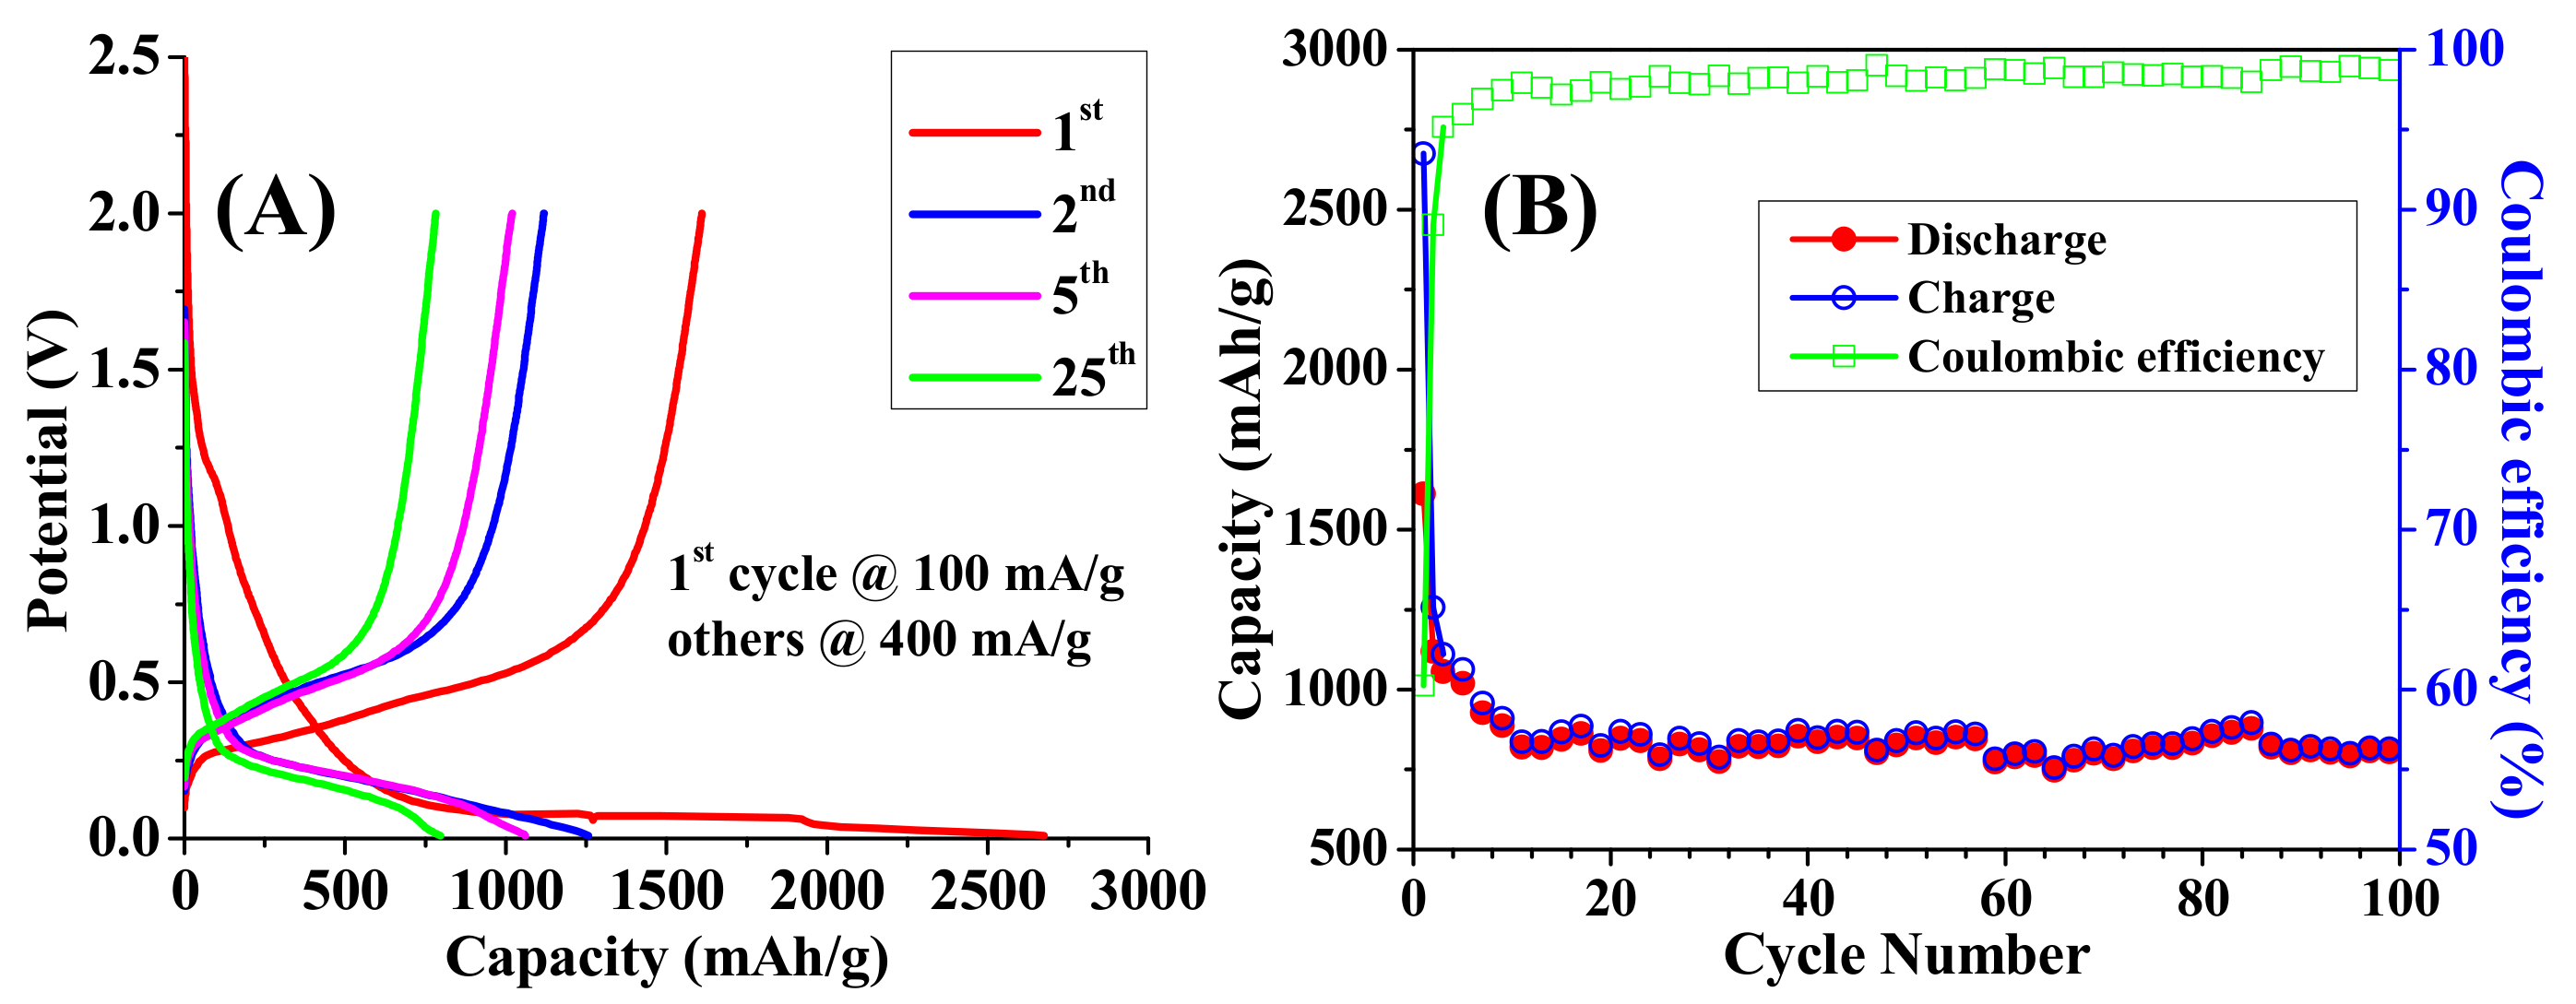
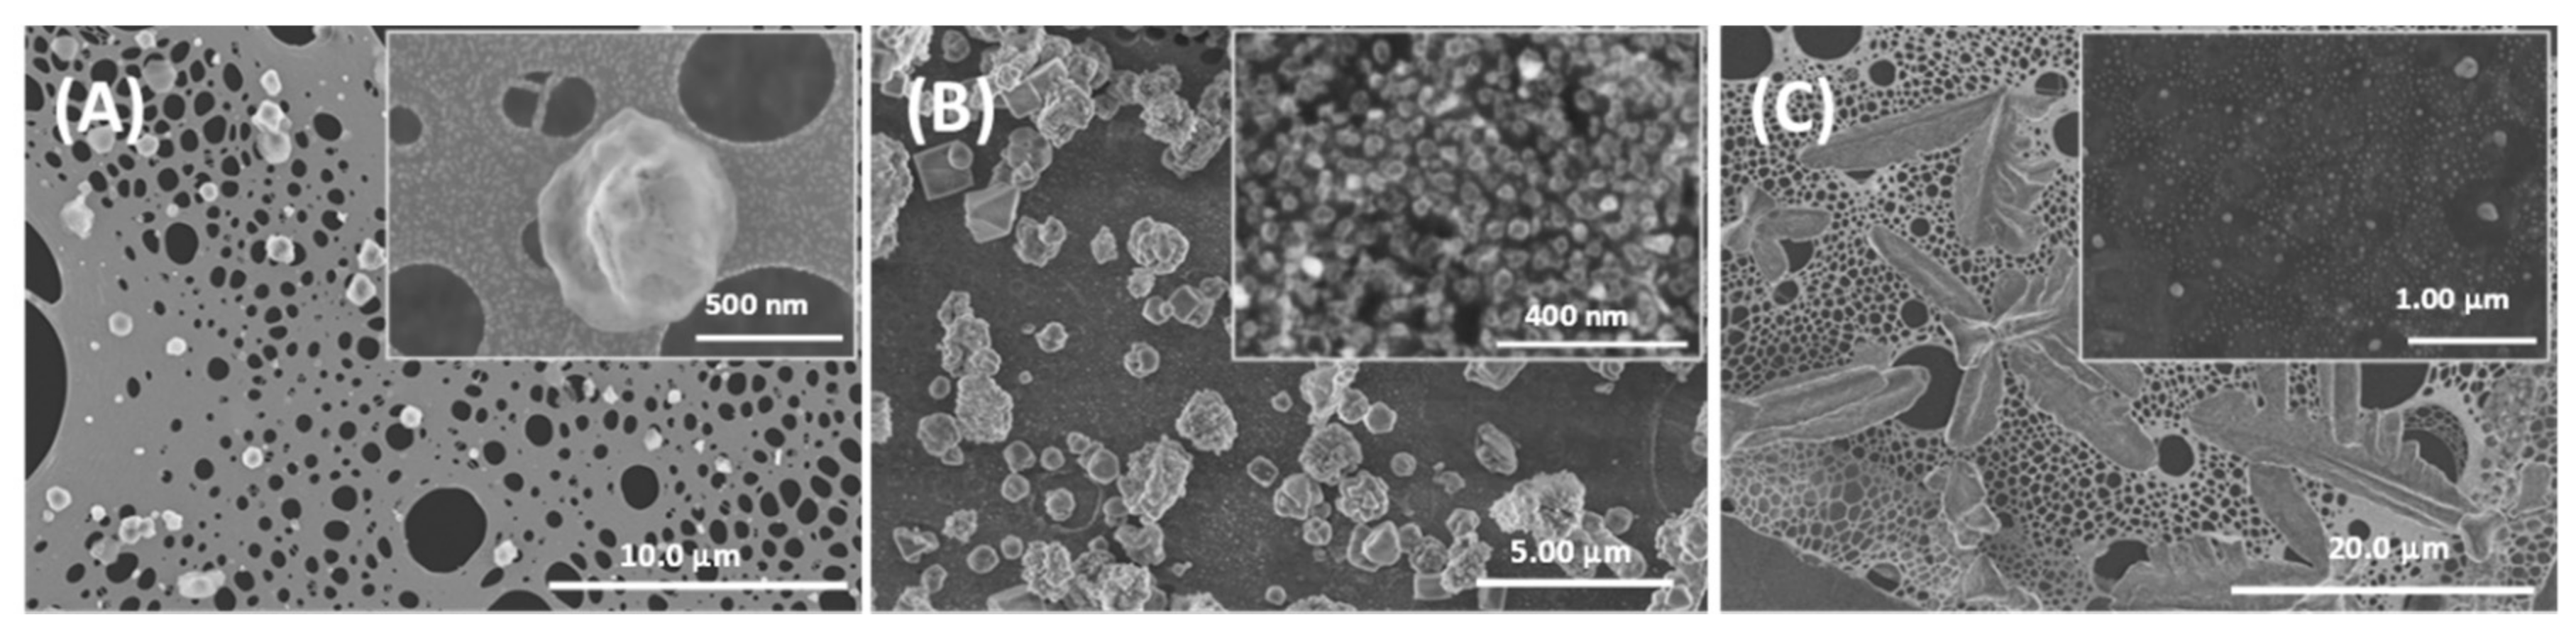
3.1. Morphology and Electrical Performance of SiNTs

The top and lateral views of the synthesized SiNTs and their diameter distributions are shown in Figure 2. From the SEM images, the etching process can successfully form SiNT structure on silicon wafer. The SiNTs are perpendicular to the Si wafers in the shape of goblet. For the sizes of the synthesized SiNTs, most of the SiNTs are of a size around 10 μm long and 1–2.2 μm wide. During the experiment, ultrasonication is applied to break the narrower conjunctions of the SiNT with the Si wafer for sample collection.
The collected SiNTs are then fabricated into the anode for a CR2032 lithium ion battery, as described in the experimental section above. The fabricated batteries (CR2032 coin cells) are then tested for their charging/discharging cycling performance. The charging/discharging performance of the first, second, fifth and twenty-fifth cycles and the Galvanostatic charge–discharge profiles of 1–100 cycles are shown in Figure 3A,B, respectively. Except the first cycle, which is tested at 100 mA/g rate, the rest of the cycles are tested at 400 mA/g. The first charge and discharge capacities are determined at 1610 and 2675 mAh/g, resulting in a 60.2% Coulombic efficiency. After a significant loss of 46.5% (1110 mAh/g) at the second cycle, the capacity drops gradually, reaching a relatively stable value from the 12th cycle, and still maintaining over 800 mAh/g after 100 cycles. The fading of capacity is attributed to the formation of a SEI (solid electrolyte interface) layer and the structural evolution during the initial charging/discharging cycles of silicon nanomaterials. In the literature, specific capacities of LIBs made of SiNTs are usually found in a range between 600 mAh/g and 1400 mAh/g depending on different process methods and morphologies [1,14,21]. Taking into account the simple etching process adopted in this study, the results of these SiNT LIBs are reasonable and acceptable.

3.2. Aqueous Waste

From a total of 627.1 mg Si wafer, 322.9 Si materials are collected after the 5 chemical etching steps as described above. 1.0 mg SiNTs is finally obtained after ultrasonication, indicating a large portion of the silicon is being left in the aqueous waste. In the chemical etching process, 9.896 mg Ag and 2.704 mg Co are added as reagents. In the aqueous waste from the five steps, concentrations of the Ag, Co and Si are measured by ICP-AES and are listed in Table 1.
The highest concentrations of Ag and Co are detected when they are first added: S#1 and S#4, respectively. The remaining portion of the two metals is attached to the Si wafers and washed out in the subsequent steps. Though the purpose of the first HNO3 wash is to remove Ag, only 1.130 ± 0.005 mg Ag is found in S#3. 0.825 ± 0.008 mg Ag is detected in S#4 and S#5, illustrating that 0.5 h time for washing is not long enough. Co participates in the fourth step, and thus undergoes one wash. To thoroughly clean Si wafers, 2 h of HNO3 washing is applied in the last step.
From Table 1, Si waste is found in all the samples. As the Si wafers are dipped in 5 M HF and 0.6 M H2O2 for 1 h, this etching step prepares 205.787 ± 1.043 mg Si into S#2. Though HF is not directly used in the fourth step, the hydrolysis of NH4F (Equation (1)) is able to generate a certain amount of corrosive HF.
NH4F + H2O ↔ HF + NH3·H2O,
HF etches Si and SiO2, resulting in SiF4, H2, and H2O (Equations (2) and (3)).
Si + 4HF → SiF4 + 2H2,
SiO2 + 4HF → SiF4 + 2H2O,
As S#1, S#2 and S#4 contain a certain amount of HF, these three solutions cannot be measured by ICP-AES directly. Shown by Equation (4), Ca(NO3)2 is used to react with HF to form insoluble CaF2.
2HF + Ca(NO3)2 → CaF2 (solid) + 2HNO3,
CaF2 is removed in the next step, where the solution is filtered and washed with 1 M HNO3. From the data collected, compared with the input, the overall amounts of Ag, Co and Si measured by ICP-AES follow the mass conservation principles, indicating that the addition of Ca(NO3)2 does not influence the measurement. The results also show that almost all the harmful heavy metals are discharged in the aqueous waste.

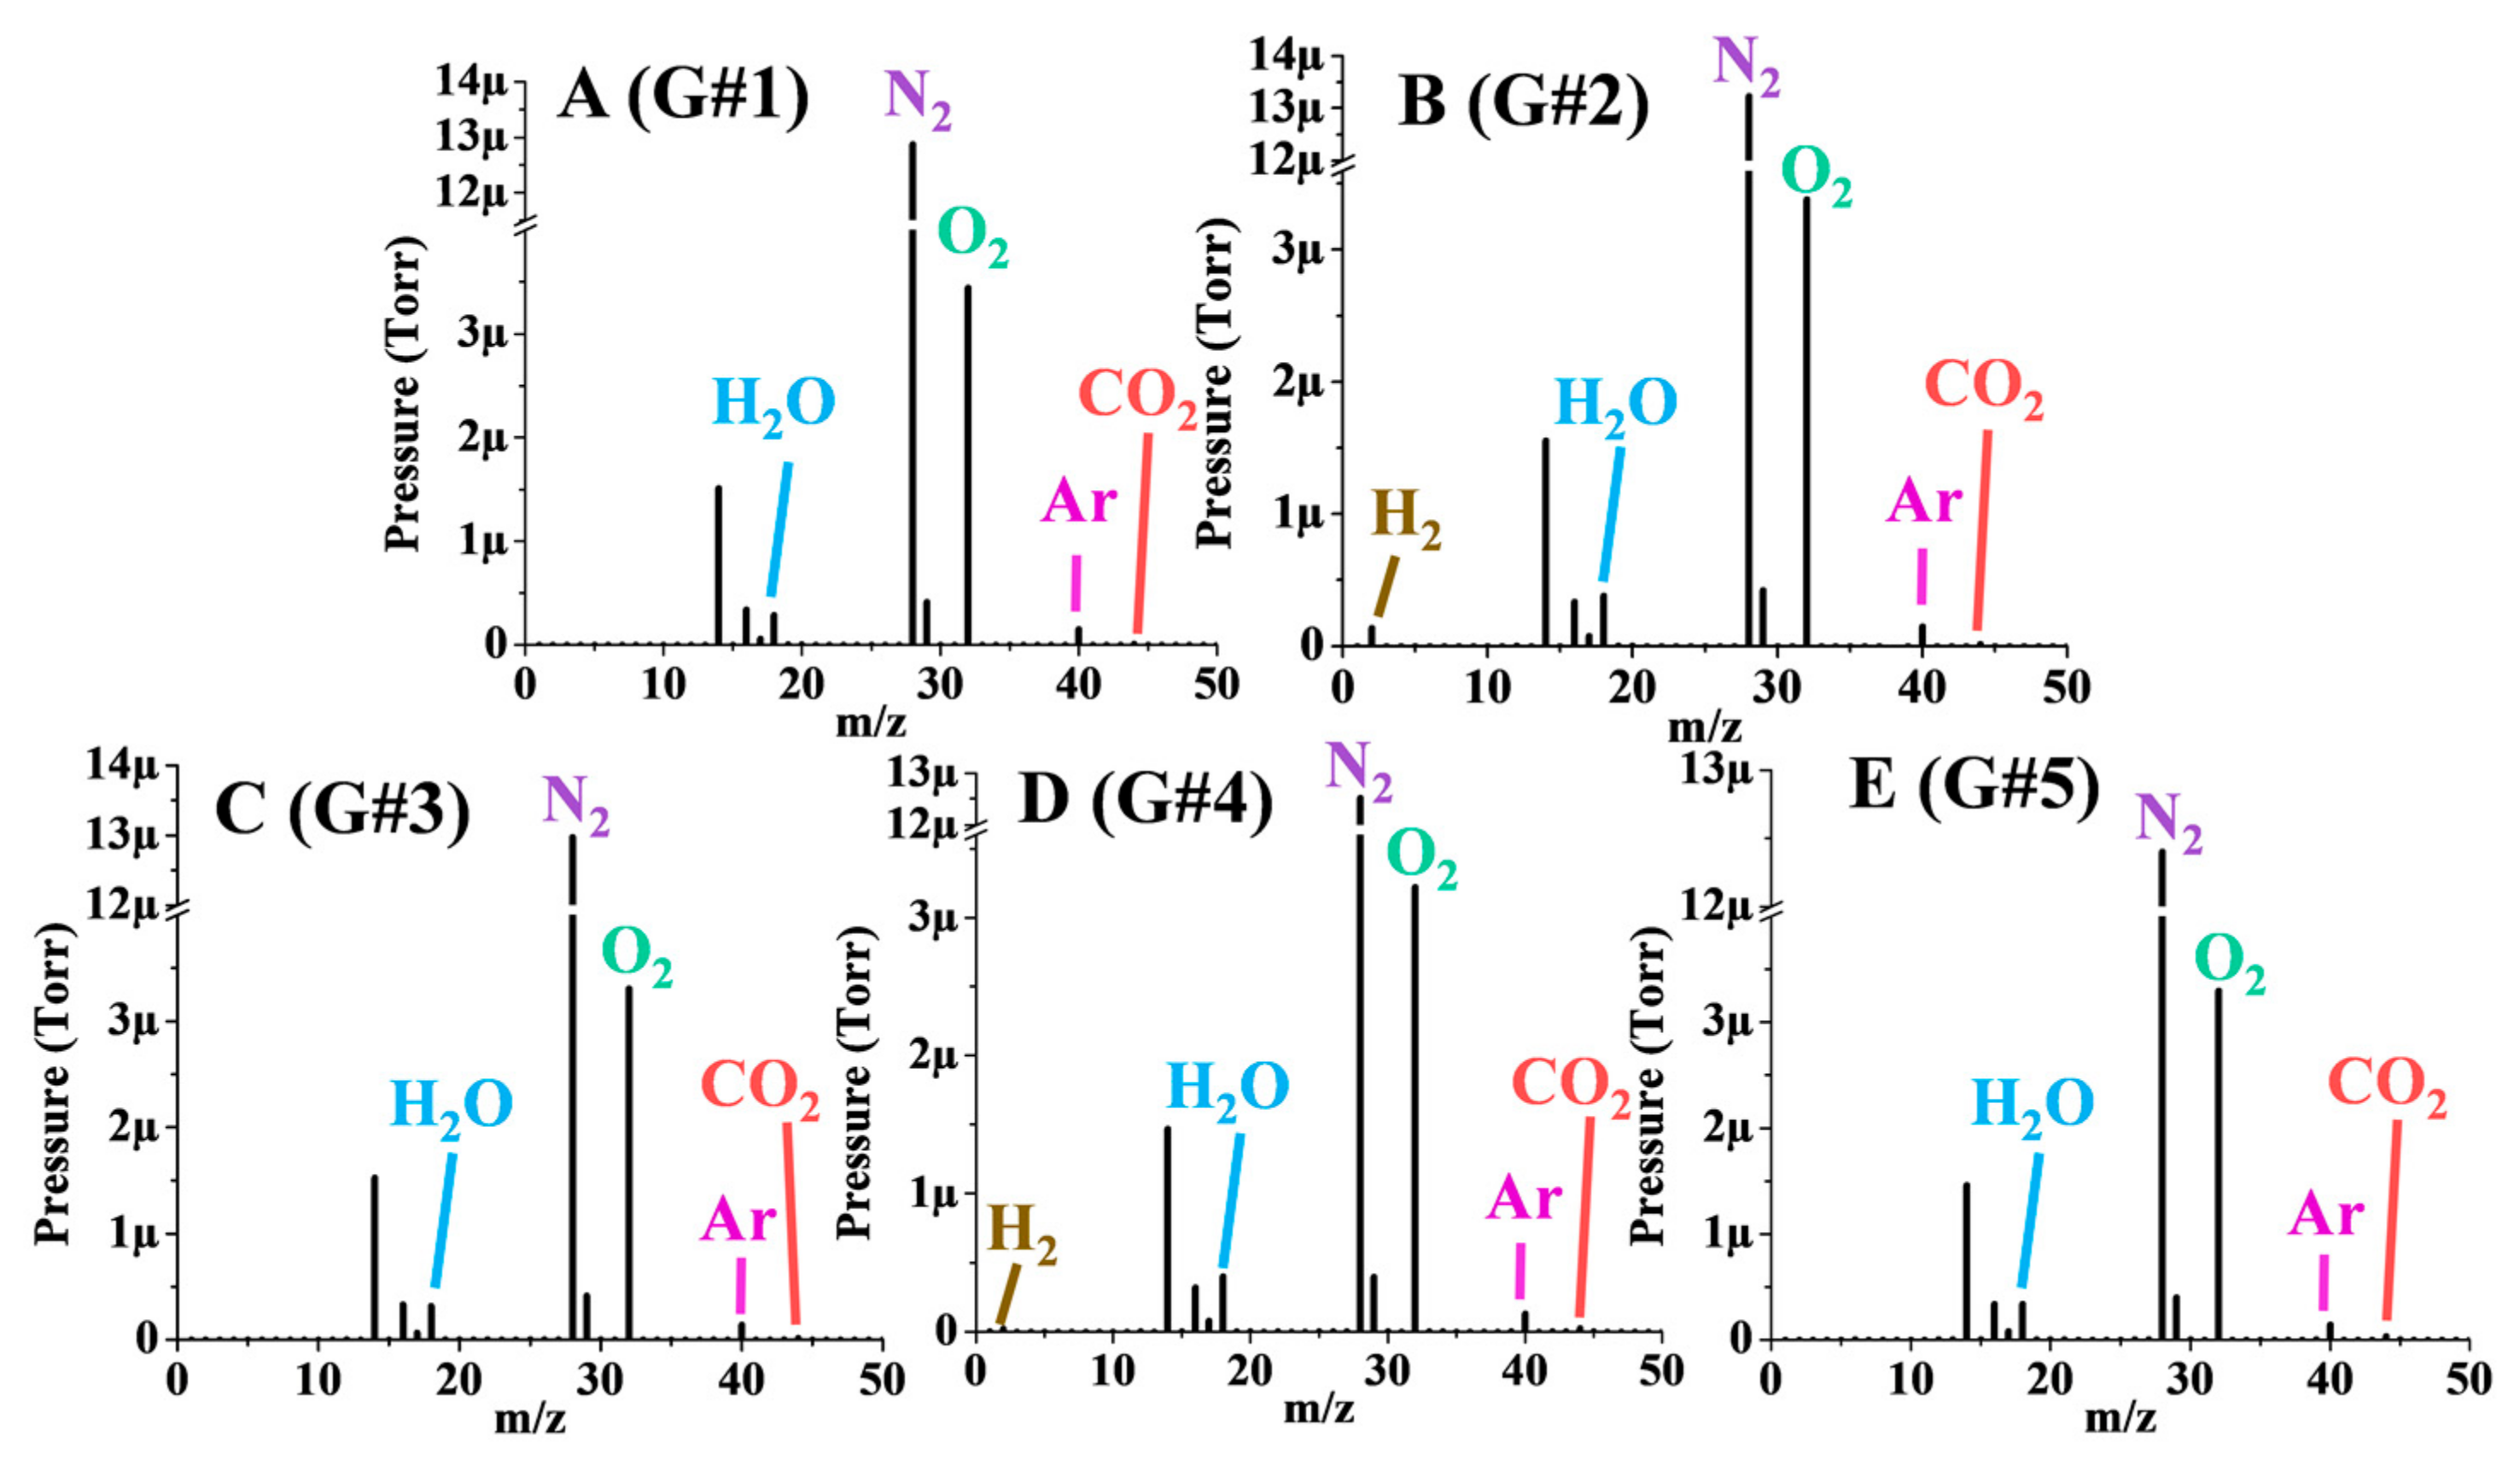
3.3. Gaseous Emissions

Five gaseous samples are collected from the five etching steps and measured by RGA for the gaseous emissions, as shown in Figure 4 below. Because the whole process is accomplished in a sealed system with ambient atmosphere, the original components—H2O, N2, O2, Ar and CO2—are detected in all five samples, which stay relatively stable.
HF + SiF4 → H2SiF6,
Si + 6HF + 2H2O2 → H2SiF6 + 4H2O ,
As illustrated in Figure 4, apart from the original components, H2 is only found in G#2 (HF + H2O2, 1.0 h) and G#4 (Co(NO3)2 + NH4F, 30 min). According to Equations (2) and (3), as a typical Si-etching chemical, HF removes the SiO2 from the surface of the Si wafer and continues to react with the Si beneath the SiO2 surface layer. H2O2 is added as a catalyst in the second step to accelerate the etching [22]. The reaction of HF and Si results in two gases, H2 and SiF4, while SiF4 is dissolved in HF to form H2SiF6 (Equation (5)), leaving only H2 gaseous emission from the etching system. According to Equation (1), the addition of NH4F in G#4 is also able to form HF, etching Si and emitting H2. The generation of H2 is due to the etching by HF, but no H2 is found in G#1 (AgNO3 + HF, 60 s). The etching of G#1 only takes 60 s. As a consequence, even if H2 is generated in the first step, it is not concentrated enough to transcend the lower detection limit of RGA.
Table 2 shows the generation of H2 during the synthesis of 1.0 mg SiNTs. The amounts of H2 gases are calculated based on the ideal gas law (Equation (7)), where p, V, T represent pressure (101,325 Pa), volume (0.285 m3), temperature (323.15 K), and R (8.314472 m3·Pa·mol−1·K−1), respectively. Based on the calculations, 0.0076 ± 0.0002 mol and 0.0012 ± 0.0000 mol H2 are generated in the second and fourth steps. Since the synthesis is accomplished in ambient atmosphere, N2, O2 Ar, CO2 and H2O always exist in the collected gaseous samples and remain in relatively stable concentrations.
n = pV/(RT),

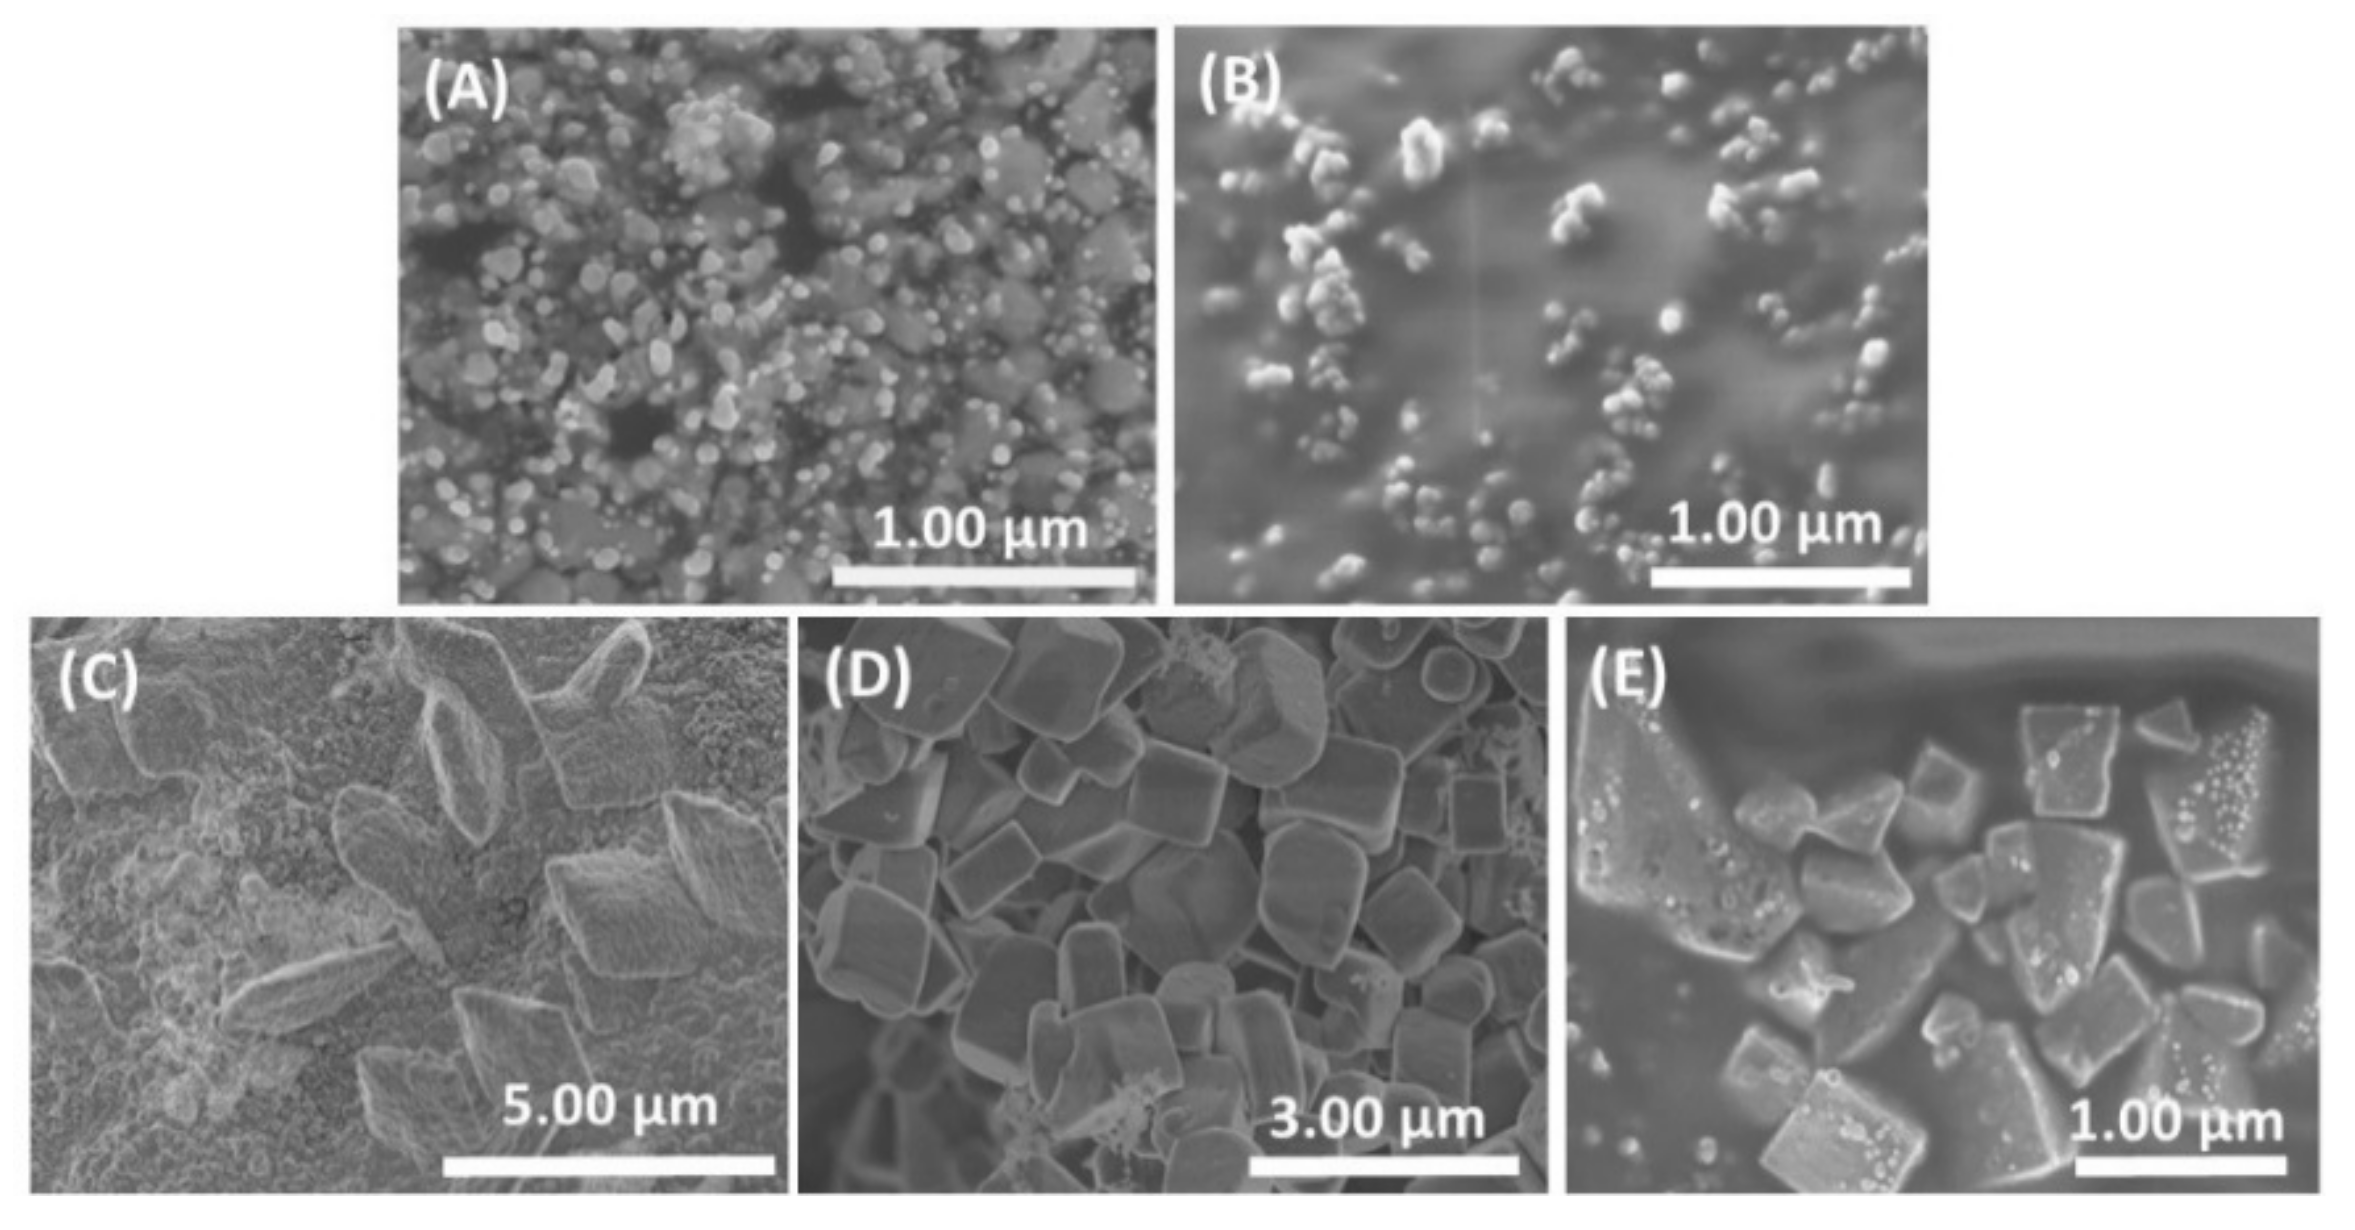
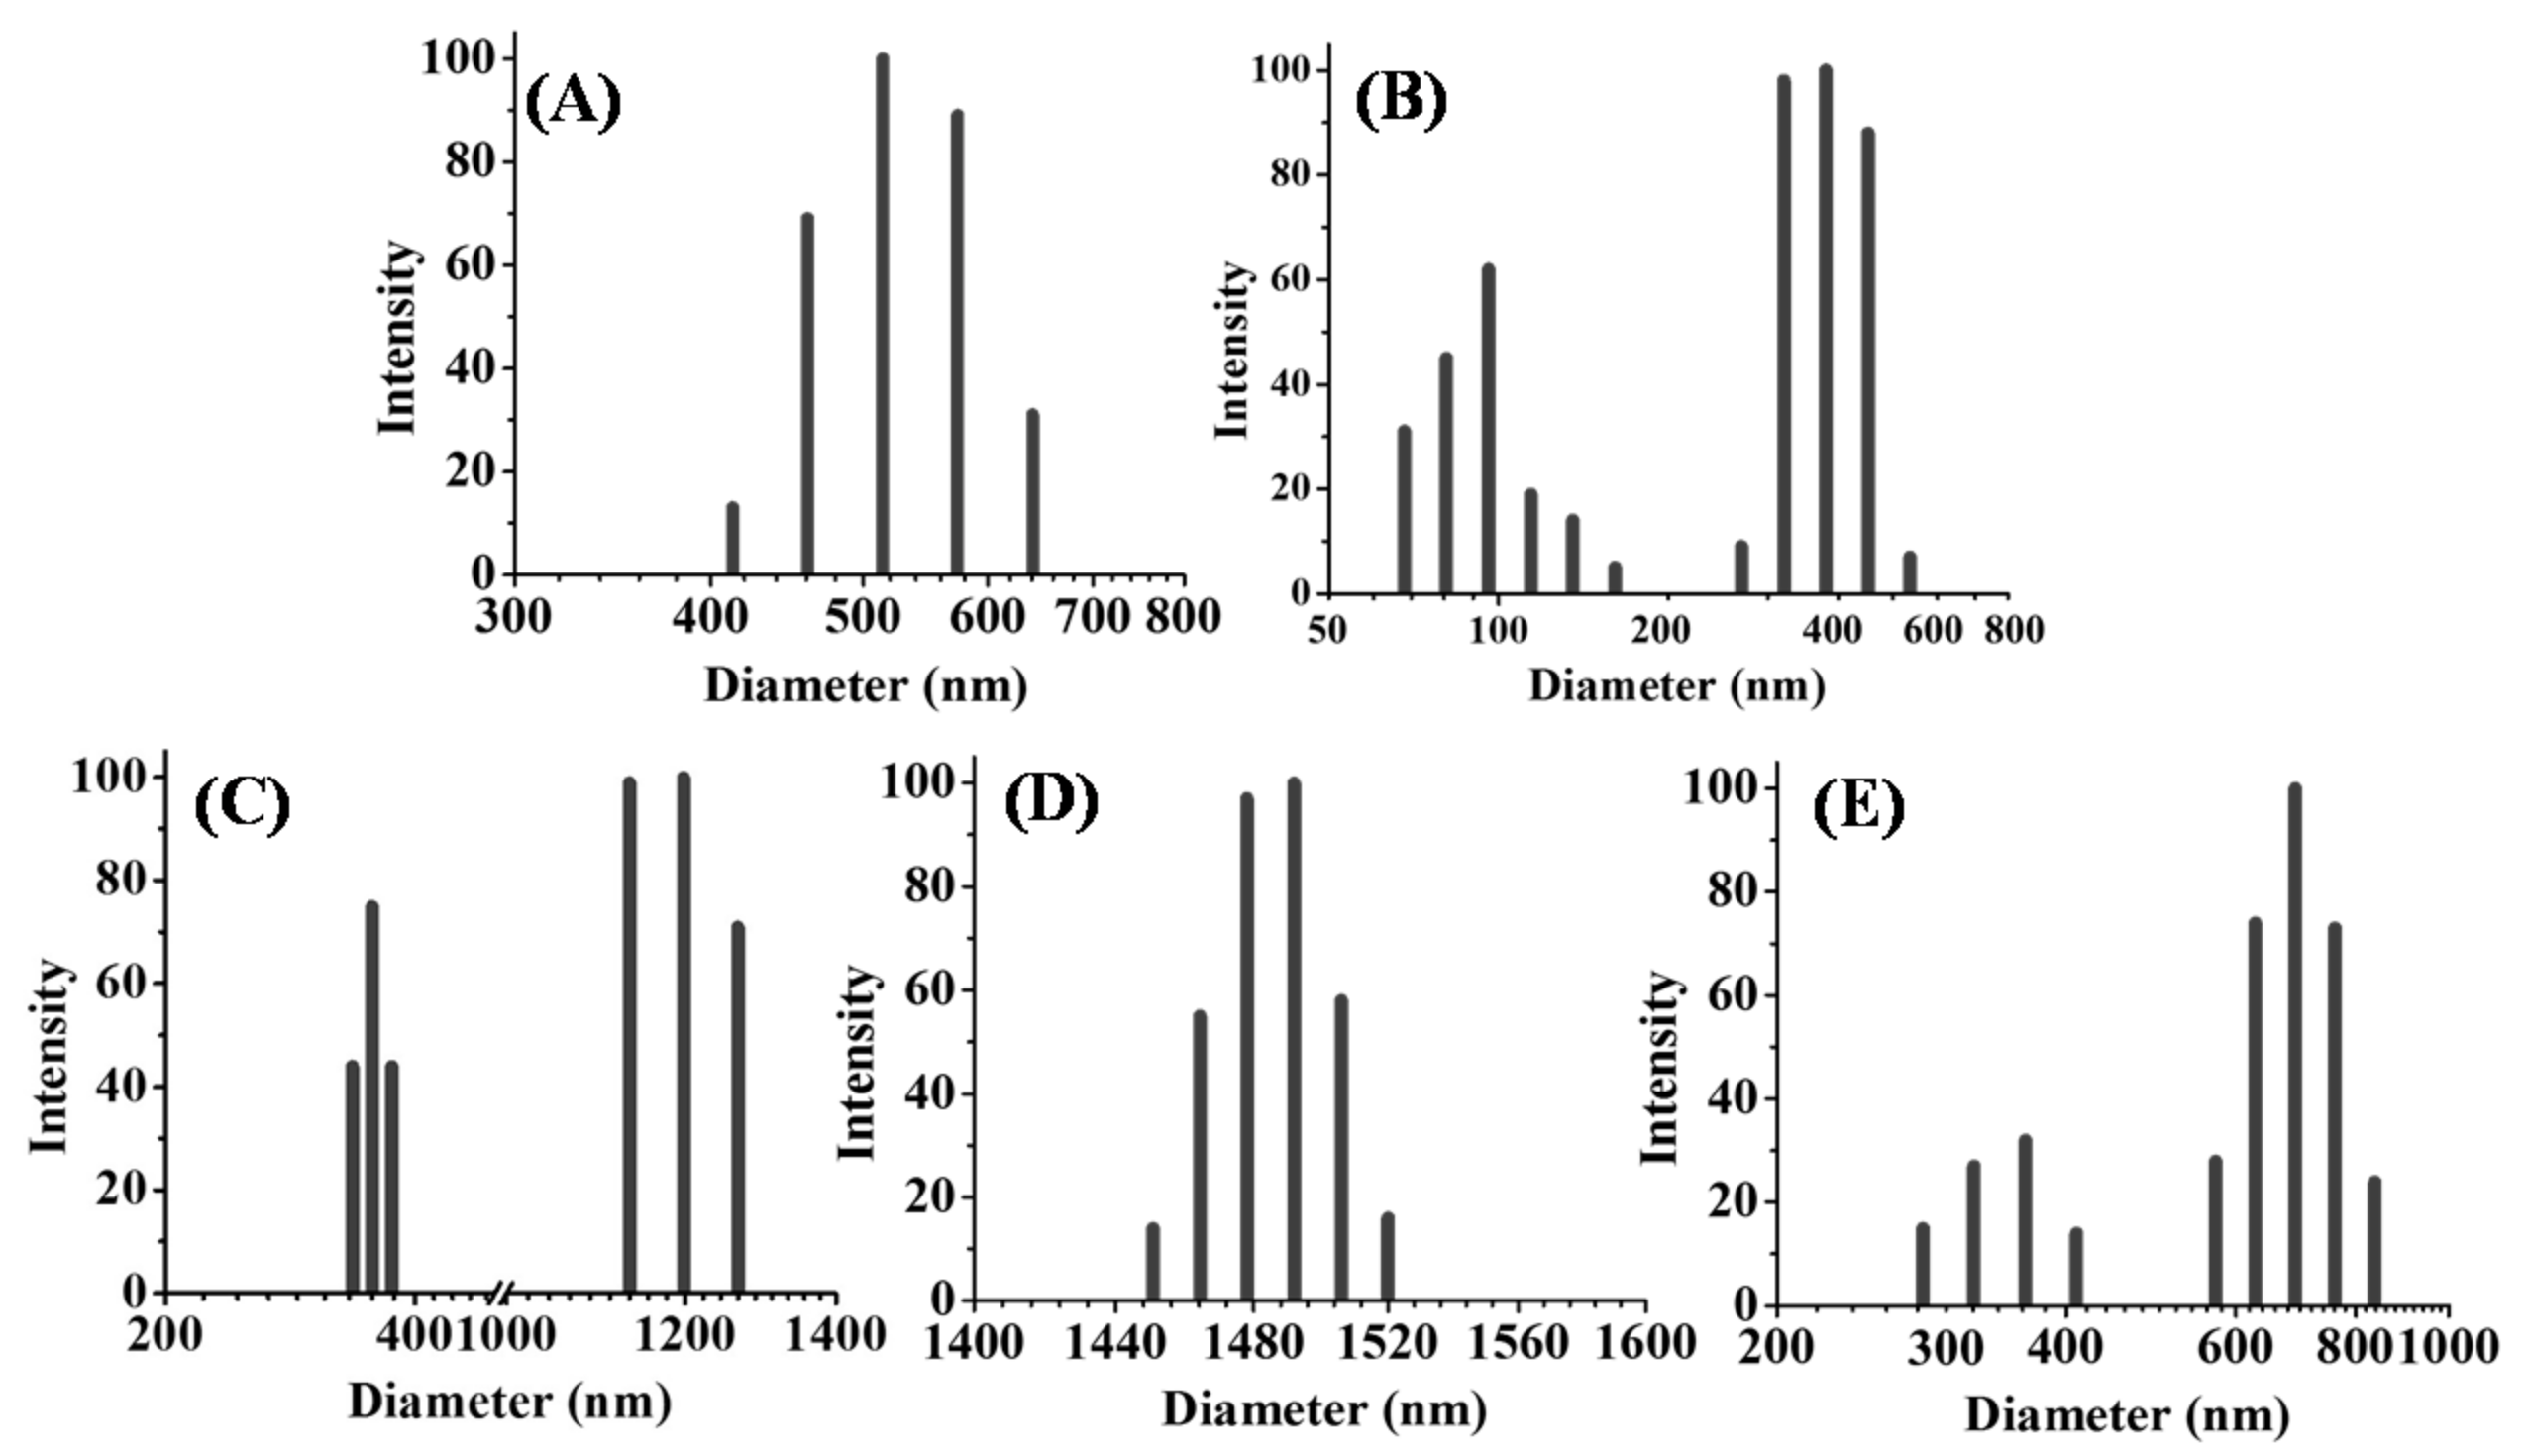
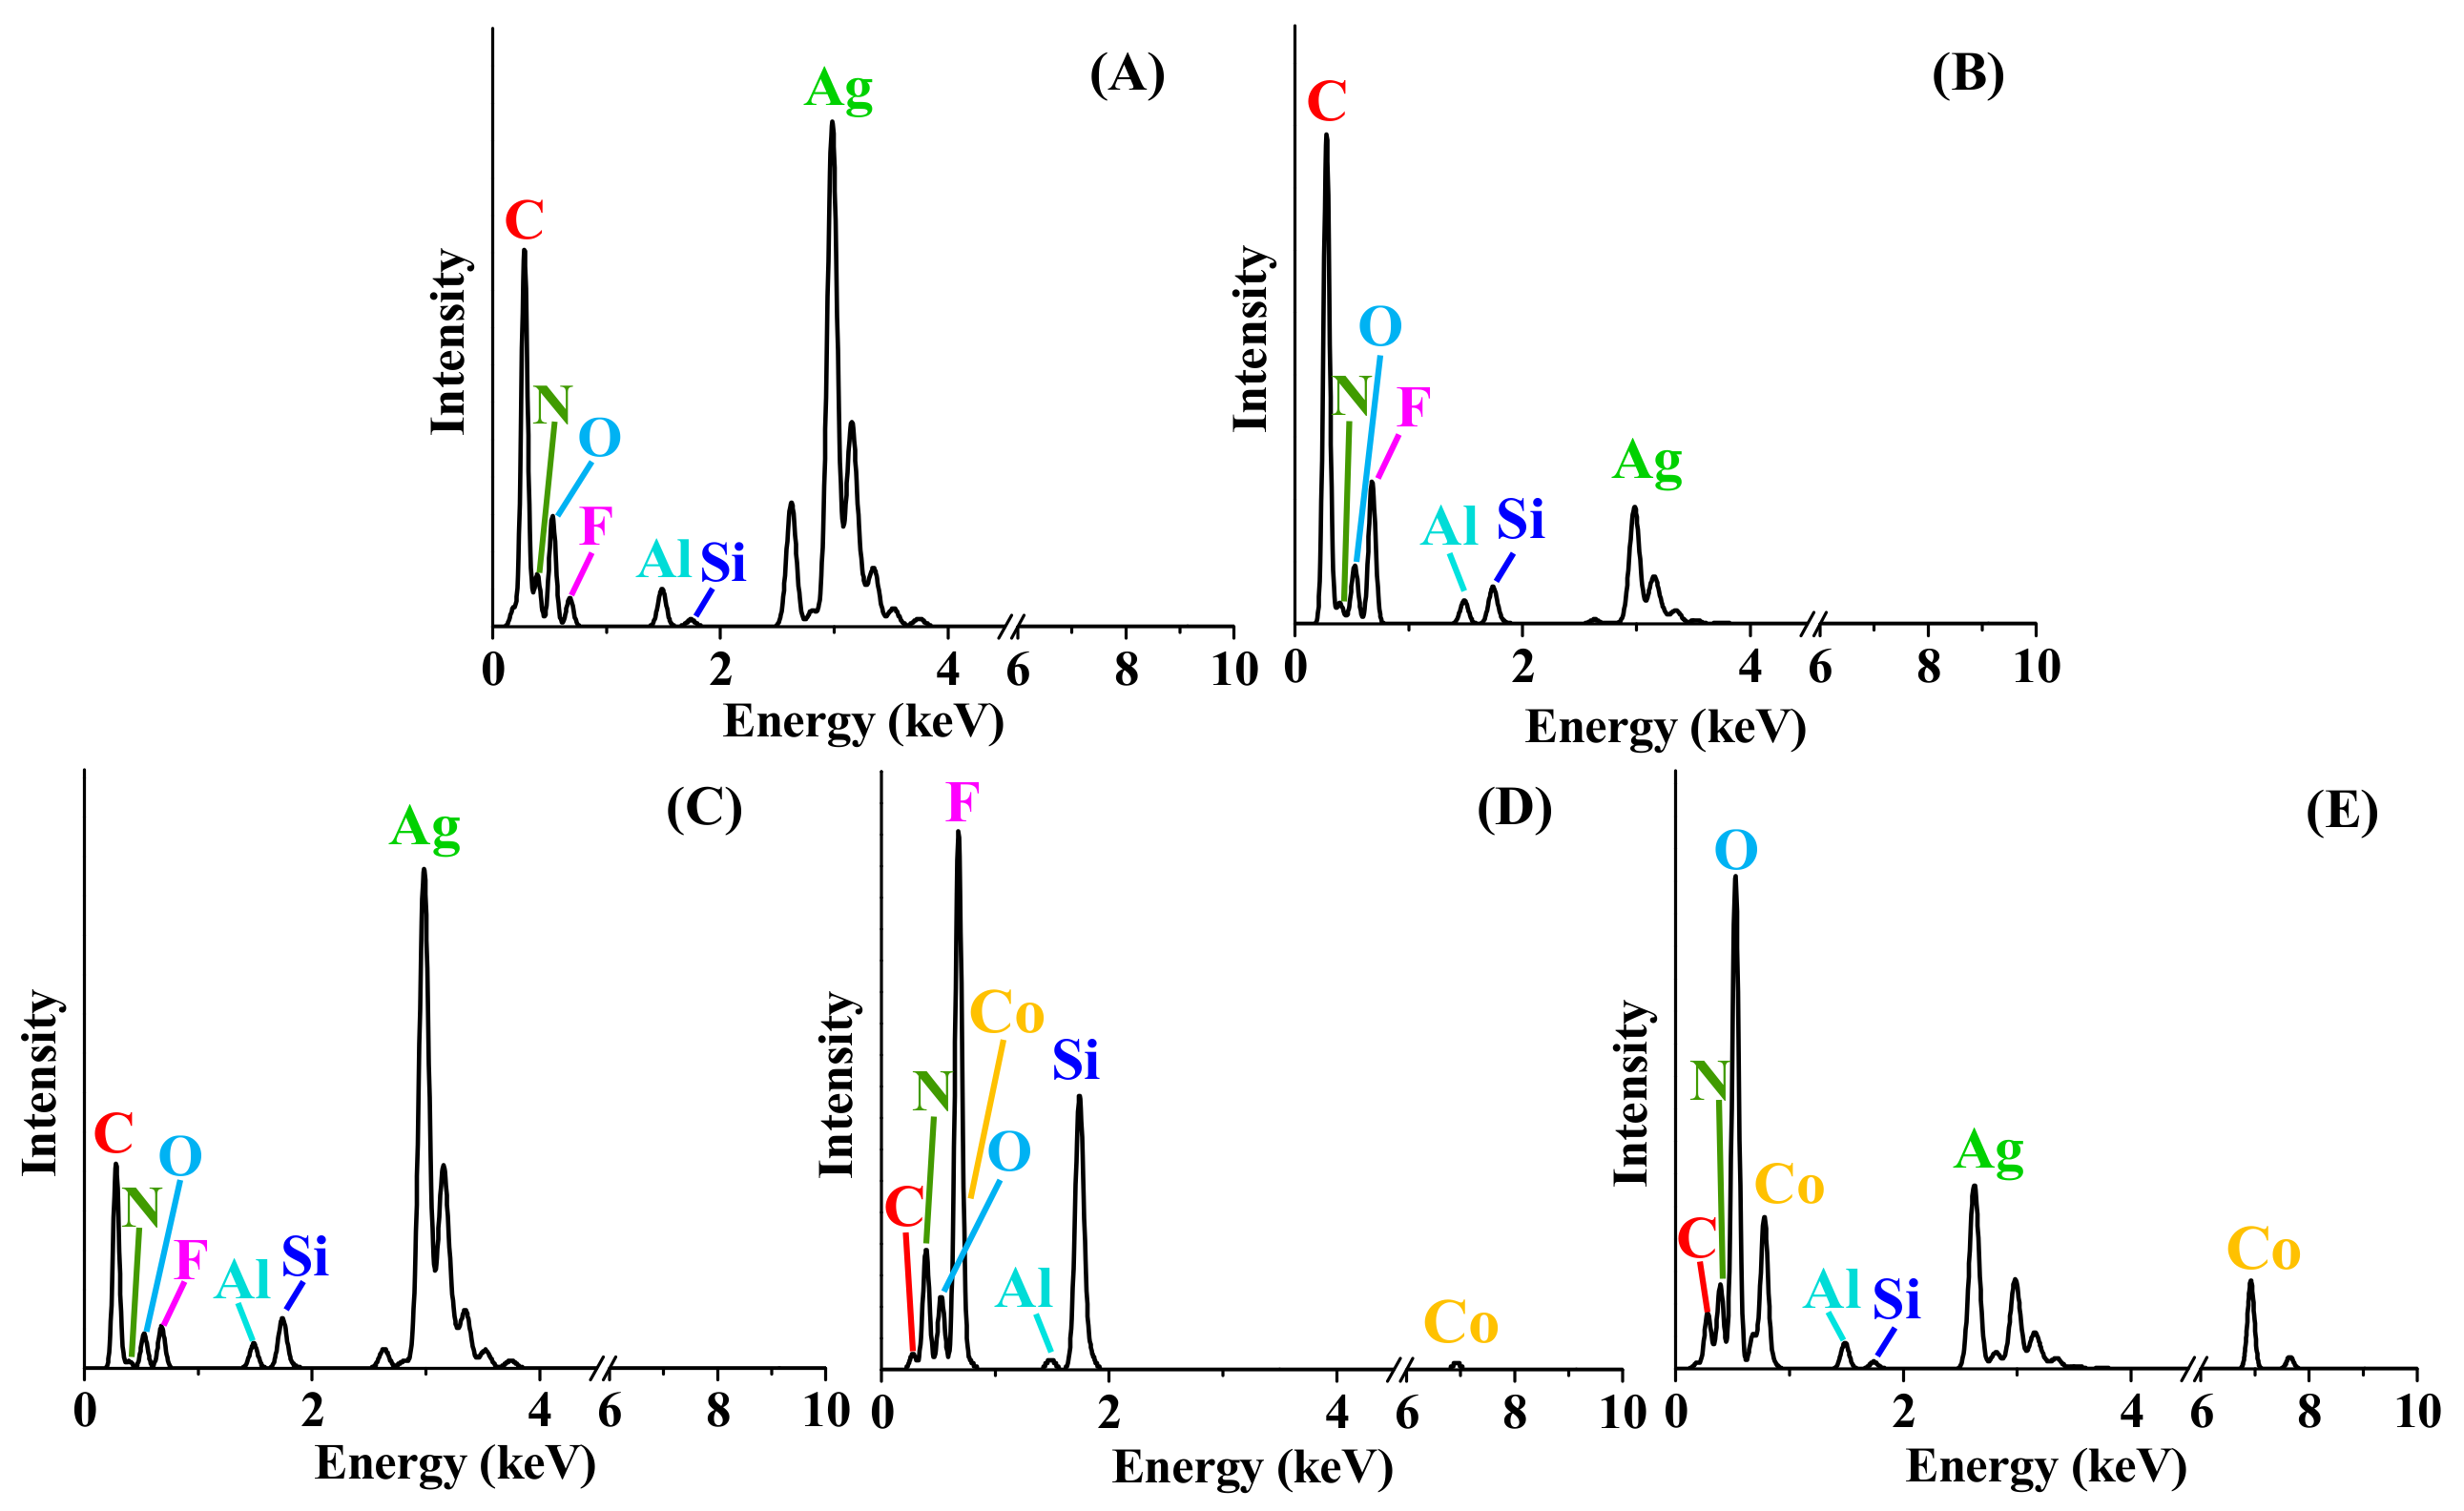
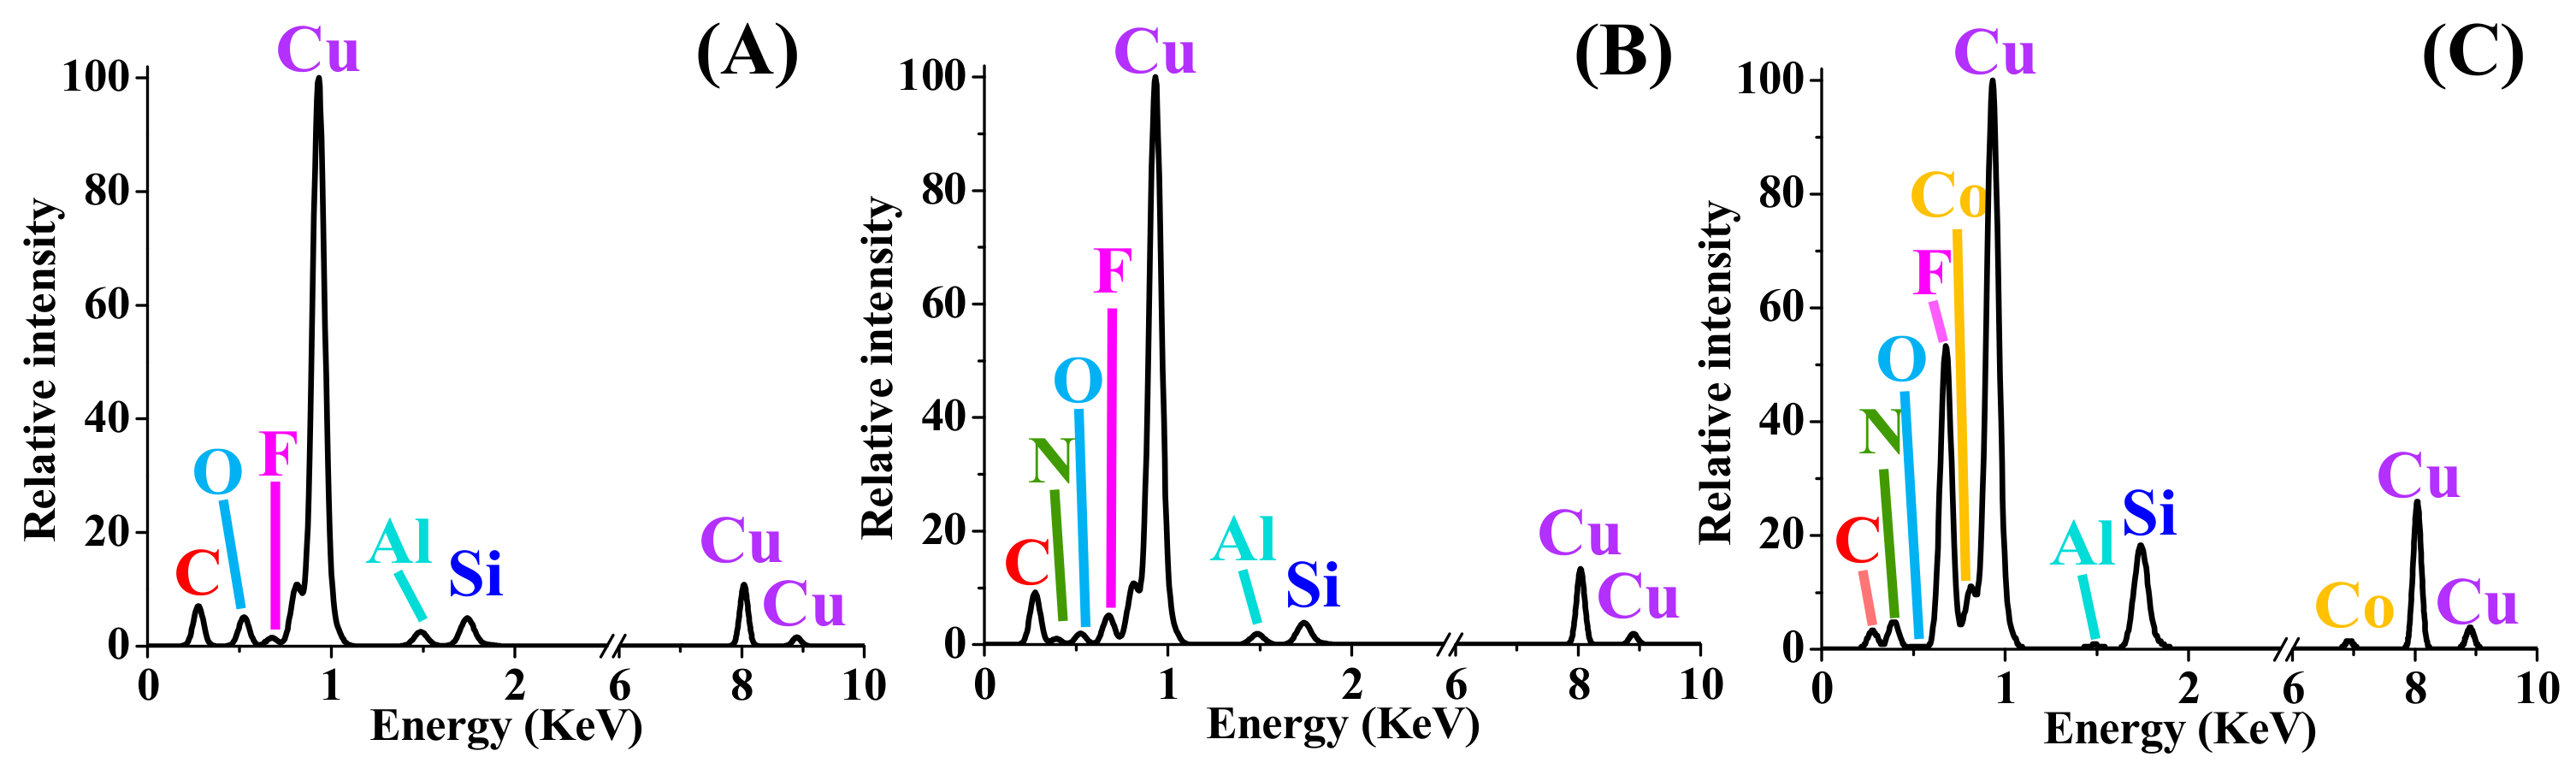
3.4. Aqueous Nanoparticle Emissions

In the aqueous waste, a large number of nano-particles are generated as potential environmental emissions. The particle morphology, size distribution and chemical compositions of the nanoparticles in the aqueous wastes are measured using SEM, Zeta-Pals, and EDS, with results illustrated in Figure 5, Figure 6 and Figure 7, respectively. As shown in Figure 5 and Figure 6, particles in S#1 are found as small spheres attached to larger ones, while those in S#2 are detected in the form of small spheres aggregated together. In S#3, there are two types of particles: large rhombuses covered by small spheres, where the large rhombuses have sizes between 1100 and 1300 nm, and small spheres of between 300 and 400 nm. The most uniform particles are found in S#4 as cubes in a size range between 1440 and 1540 nm. Particles with irregular shapes and non-uniform sizes are detected in S#5: cuboids, cubes, tetrahedrons, octahedron and other shapes of particles, falling approximately in two size ranges of 250–420 nm and 550–900 nm.
The chemical composition of the nanoparticles in the aqueous waste as measured by EDS is shown in Table 3. Al, C, N, O and Si are found in all the samples. Al comes from the background signal of the Al sheets used as carrier for the liquid waste. Ag, which is introduced at the beginning of the synthesis, is gradually washed out in the following steps. The highest concentration of Ag nanoparticles is found in S#3.
Similar to Ag, 205.787 ± 1.043 g Si is found in S#2 by ICP-AES, but only 0.73 ± 0.1% is found by EDS. Different from ICP-AES, which measures liquids, EDS analyzes particles. The high concentration of compounds in liquid means that they mainly exist in the liquids instead of suspending as particles. Instead, they may be dissolved and dissociated in the aqueous solutions. Ag and Co both appear in S#5. Though the percentage concentration of Co is about 5 times higher than that of Ag in Table 3, the percentage concentration of Co is only 1.7 times higher than that of Ag in Table 1 (aqueous waste measured by ICP-AES), indicating that quite a large portion of Ag is dissolved in the liquid.
The different morphologies of particles are related to the chemical reactants. The purpose of step #1 is to deposit Ag nanoparticles on the Si wafers [23]. An SEM image showing the deposition is displayed in Figure S1 in the supporting information. The similar shape of the particles in Figure S1 and Figure 5A indicates that extra amount of Ag nanoparticles generated in step #1 is an important source of the particles in Figure 5A. A significant decrease in the amount of Ag is detected by EDS in step #2, resulting in irregularly shaped particles in Figure 5B. Ag is washed away in step #3 and #5 with HNO3 and form AgNO3. Shapes of the particles in Figure 5C,E are different from Figure 5A because the appearance of AgNO3 will change the configuration of Ag nanoparticles from near cubic to aeolotropic crystals [24]. Co is found in Figure 5D and the concentration of Ag falls below the detection limit in the same sample. Therefore, the uniform cube-structured particles are the result of Co [25,26].

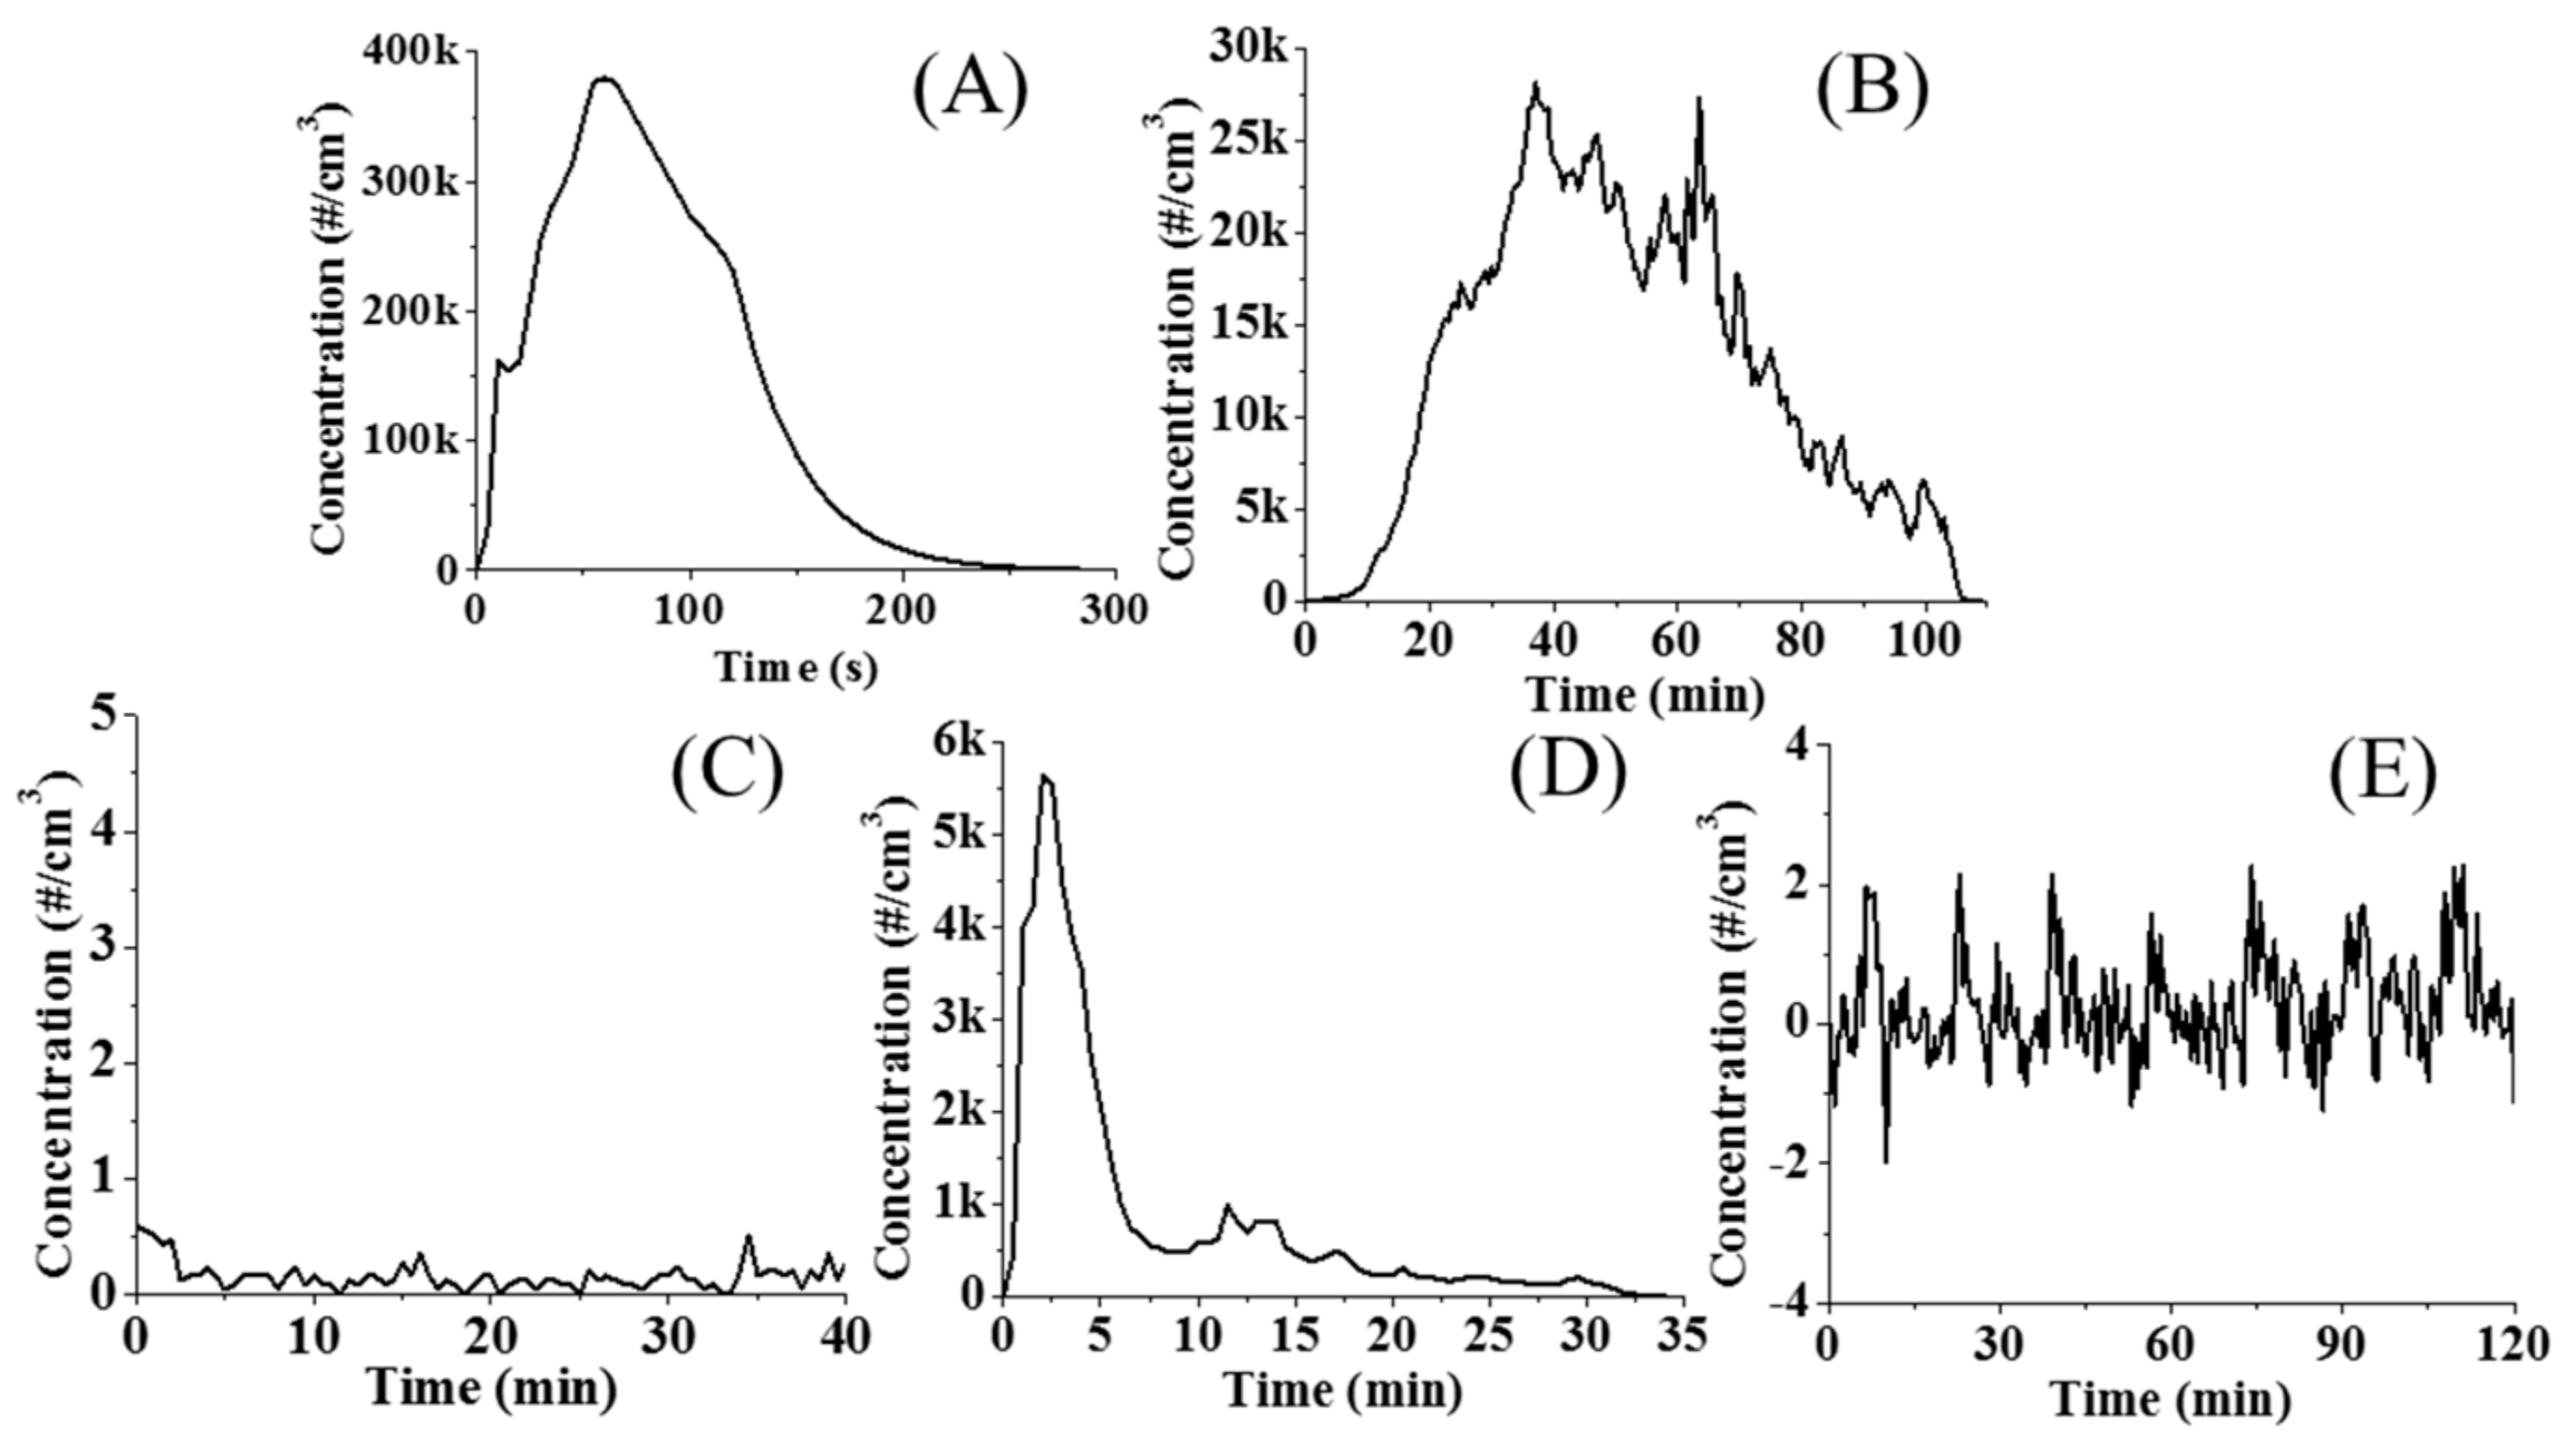
3.5. Gaseous Aerosol Emissions

The aerosol particle emissions measured in situ are shown in Figure 8 for the five steps of the chemical etching process. During the chemical etching of the 1.0 mg Si NTs, the process with the greatest generation of particles is step #1, which generates 2.96 × 10⁷ particles/cm3 in total, with the highest peak emission of 3.80 × 10⁵ particles/cm3. Step #2 takes a longer time, but emits fewer particles than step #1, with 1.35 × 10⁶ particles/cm3 in total, with a peak emission of 2.81 × 10⁴ particles/cm3. Step #4 generates the smallest number of particles, only 2.89 × 10⁴ particles/cm3, with a peak of 5.64 × 10³ particles/cm3. Considering the background particles present in the measurement, we can say there are no particle emissions from step #3 and step #5 in the chemical etching process.
The morphologies and chemical compositions of the aerosol particles generated from G#1 (step 1), G#2 (step 2) and G#4 (step 4) are collected, analyzed and shown in Figure 9 and Figure 10, and in Table 4. As observed in Figure 9A–C, larger particles are surrounded by small spheres with particle sizes of less than 50 nm, especially in G#1, where the particle are smaller than 25 nm. Despite the irregular shapes in G#1 and G#2, the particles all exist as independent granules. G#4 covers a much larger diameter range than G#1 and G#2 and the biggest particles are found as flat sticks.
In Figure 10, because the Cu TEM grids are coated with a thin layer of C, a certain amount of Cu and C is displayed in the spectrum as background signals in the EDS measurement. The signal of Al is from the Al holder. The particles in G#2 are more regular in shape than those of G#1. Although G#1 and G#2 have similar chemical compositions, the concentration of each element varies. G#2 has more F (6.89 ± 0.6 at. %) and N (7.15 ± 0.7 at. %) and less O (3.11 ± 0.3 at. %) and Si (3.38 ± 0.1 at. %) than G#1 (F: 2.78 ± 0.4 at. %, N: N/A, O: 13.23 ± 0.8 at. %, Si: 5.31 ± 0.2 at. %). A sudden change of morphology is found in G#4. The reason for this sudden change may be related to the participation of Co and the significant increase of F.

4. Conclusions

The process emissions from chemical etching synthesis of SiNTs are studied in terms of aqueous waste, gaseous emissions, aqueous nanoparticle emissions, and gaseous aerosol emissions. The synthesized SiNTs are about 10 μm long, 1–2.2 μm wide in diameter and in CR2032 battery testing maintain a stable capacity of over 800 mAh/g after 100 cycles. When producing 1.0 mg SiNTs, this process generates 0.0088 ± 0.0002 mol H2 emission. The AgNO3 and Co(NO3)2 involved in the chemical etching are the major pollutants in the aqueous waste. From ICP-AES measurement, 9.885 ± 0.110 mg Ag, 2.726 ± 0.045 mg Co are determined for etching 303.028 ± 1.609 mg Si. A large number of aerosol particles, 2.96 × 10⁷, 1.35 × 10⁶, and 2.89 × 10⁴ particles/cm3 are generated from the #1, #2 and #4 steps, respectively. Due to the different concentrations of F, Ag and Co involved in the chemical reaction steps, the morphologies of these particles are largely different, with sizes ranging from less than 25 nm to more than 5 μm. These results could be used as inventory data in environmental impact assessments and life cycle assessment of the SiNT synthesis process in future.

Supplementary Materials

The following are available online at https://www.mdpi.com/2504-4494/2/1/11/s1, Figure S1: SEM image of deposited Ag after step #1.

Acknowledgment

The financial support from National Science Foundation (CBET-1351602) is acknowledged.

Author Contributions

Lulu Ma and Chris Yuan conceived and designed the experiments; Lulu Ma and Fenfen Wang performed the experiments; Lulu Ma and Dongsheng Guan analyzed the data; Lulu Ma and Chris Yuan wrote the paper.

Conflicts of Interest

The authors declare no conflict of interest.

References

  1. Tesfaye, A.T.; Gonzalez, R.; Coffer, J.L.; Djenizian, T. Porous silicon nanotube arrays as anode material for li-ion batteries. ACS Appl. Mater. Interfaces 2015, 7, 20495–20498. [Google Scholar] [CrossRef] [PubMed]
  2. Chen, H.S.; Cong, T.N.; Yang, W.; Tan, C.Q.; Li, Y.L.; Ding, Y.L. Progress in electrical energy storage system: A critical review. Prog. Nat. Sci. 2009, 195, 2419–2430. [Google Scholar] [CrossRef]
  3. Su, X.; Wu, Q.L.; Li, J.C.; Xiao, X.C.; Lott, A.; Lu, W.Q.; Sheldon, B.W.; Wu, J. Silicon-based nanomaterials for lithium-ion batteries: A review. Adv. Energy Mater. 2014, 4, 375–379. [Google Scholar] [CrossRef]
  4. Scrosati, B.; Garche, J. Lithium batteries: Status, prospects and future. J. Power Sources 2010, 195, 2419–2430. [Google Scholar] [CrossRef]
  5. Hayner, C.M.; Zhao, X.; Kung, H.H. Materials for rechargeable lithium-ion batteries. Annu. Rev. Chem. Biomol. Eng. 2012, 3, 445–471. [Google Scholar] [CrossRef] [PubMed]
  6. Kasavajjula, U.; Wang, C.S.; Appleby, A.J. Nano-and bulk-silicon-based insertion anodes for lithium-ion secondary cells. J. Power Sources 2007, 163, 1003–1039. [Google Scholar] [CrossRef]
  7. Wu, H.; Cui, Y. Designing nanostructured Si anodes for high energy lithium ion batteries. Nano Today 2012, 7, 414–429. [Google Scholar] [CrossRef]
  8. Tesfaye, A.T.; Gonzalez-Rodriguez, R.; Coffer, J.L.; Djenizian, T. Self-Supported Silicon Nanotube Arrays as an Anode Electrode for Li-Ion Batteries. ECS Trans. 2017, 77, 349–350. [Google Scholar] [CrossRef]
  9. Epur, R.; Hanumantha, P.J.; Datta, M.K.; Hong, D.; Gattu, B.; Kumta, P.N. A simple and scalable approach to hollow silicon nanotube (h-SiNT) anode architectures of superior electrochemical stability and reversible capacity. J. Mater. Chem. A 2015, 3, 11117–11129. [Google Scholar] [CrossRef]
  10. Chen, Y.; Liu, L.; Xiong, J.; Yang, T.; Qin, Y.; Yan, C. Porous Si nanowires from cheap metallurgical silicon stabilized by a surface oxide layer for lithium ion batteries. Adv. Funct. Mater. 2016, 25, 6701–6709. [Google Scholar] [CrossRef]
  11. Wang, F.; Gao, X.; Ma, L.; Li, T.; Yuan, C. Sustainability analysis of silicon nanowire fabrication for high performance lithium ion battery anode. Procedia Manuf. 2017, 7, 151–156. [Google Scholar] [CrossRef]
  12. Gao, X.; Li, J.; Xie, Y.; Guan, D.; Yuan, C. A multilayered silicon-reduced graphene oxide electrode for high performance lithium-ion batteries. ACS Appl. Mater. Interfaces 2015, 7, 7855–7862. [Google Scholar] [CrossRef] [PubMed]
  13. Roiban, L.; Koneti, S.; Wada, T.; Kato, H.; Aires, F.J.C.S.; Curelea, S.; Epicier, T.; Maire, E. Three dimensional analysis of nanoporous silicon particles for li-ion batteries. Mater. Charact. 2017, 124, 165–170. [Google Scholar] [CrossRef]
  14. Zhang, C.C.; Cheng, H.M.; Liu, X. A convenient way of manufacturing silicon nanotubes on a silicon substrate. Mater. Chem. Phys. 2016, 177, 479–484. [Google Scholar] [CrossRef]
  15. Park, M.; Kim, M.G.; Joo, J.; Kim, K.; Kim, J.; Ahn, S.; Cui, Y.; Cho, J. Silicon nanotube battery anodes. Nano Lett. 2009, 11, 3844–3847. [Google Scholar] [CrossRef] [PubMed]
  16. Gao, C.B.; Lu, Z.D.; Yin, Y.D. Gram-scale synthesis of silica nanotubes with controlled aspect ratios by templating of nickel-hydrazine complex nanorods. Langmuir 2011, 27, 12201–12208. [Google Scholar] [CrossRef] [PubMed]
  17. Wang, X.G.; Zhang, Y.H.; Ni, L.F.; You, C.G.; Ye, C.J.; Jiang, R.M.; Liu, L.P.; Liu, J.; Han, C.M. A review of treatment strategies for hydrofluoric acid burns: Current status and future prospects. Burns 2014, 40, 1447–1457. [Google Scholar] [CrossRef] [PubMed]
  18. Wing, J.S.; Brender, J.D.; Sanderson, L.M.; Perrotta, D.M.; Beauchamp, R.A. Acute health effects in a community after a release of hydrofluoric acid. Arch. Environ. Health 1991, 46, 155–160. [Google Scholar] [CrossRef] [PubMed]
  19. Kupc, A.; Bischof, O.; Tritscher, T.; Beeston, M.; Krinke, T.; Wagner, P.E. Laboratory Characterization of a New Nano-Water-Based CPC 3788 and Performance Comparison to an Ultrafine Butanol-Based CPC 3776. Aerosol Sci. Technol. 2013, 47, 183–191. [Google Scholar] [CrossRef]
  20. Mordas, G.; Manninen, H.E.; Petäjä, T.; Aalto, P.P.; Hämeri, K.; Kulmala, M. On Operation of the Ultra-Fine Water-Based CPC TSI3786 and Comparison with Other TSI Models (TSI 3776, TSI 3772, TSI 3025, TSI 3010, TSI 3007. Aerosol Sci. Technol. 2008, 42, 152–158. [Google Scholar] [CrossRef]
  21. Yoo, J.K.; Kim, J.; Jung, Y.S.; Kang, K. Scalable fabrication of silicon nanotubes and their application to energy storage. Adv. Mater. 2012, 24, 5452–5456. [Google Scholar] [CrossRef] [PubMed]
  22. Gondek, C.; Lippold, M.; Röver, I.; Bohmhammel, K.; Kroke, E. Etching Silicon with HF-H2O2-Based Mixtures: Reactivity Studies and Surface Investigations. J. Phys. Chem. 2014, 118, 2044–2051. [Google Scholar] [CrossRef]
  23. Feng, T.; Xu, Y.; Zhang, Z.; Mao, S. Fluorinion transfer in silver-assisted chemical etching for silicon nanowires arrays. Appl. Surf. Sci. 2015, 347, 421–427. [Google Scholar] [CrossRef]
  24. Li, Z.; Li, J. Recent progress in engineering and application of surface plasmon resonance in metal nanostructures. Chin. Sci. Bull. 2011, 56, 2631–2661. [Google Scholar] [CrossRef]
  25. Wang, Y.; Guo, J.; Wang, T.; Shao, J.; Wang, D.; Yang, Y.W. Mesoporous transition metal oxides for supercapacitors. Nanomaterials 2015, 5, 1667–1689. [Google Scholar] [CrossRef] [PubMed]
  26. He, M.; Yao, J.; Liu, Q.; Zhong, Z.; Wang, H. Toluene-assisted synthesis of RHO-type zeolitic imidazolate frameworks: Synthesis and formation mechanism of ZIF-11 and ZIF-12. Dalton Trans. 2013, 42, 16608–16613. [Google Scholar] [CrossRef] [PubMed]
Figure 1. Synthesis of SiNT and battery electrode.
Jmmp 02 00011 g001
Figure 2. SEM images of Si NTs: (A) top view, (B) lateral view, (C) size distribution.
Jmmp 02 00011 g002
Figure 3. SiNT battery performance: (A) galvanostatic discharge–charge profiles; (B) cycling performance.
Jmmp 02 00011 g003
Figure 4. RGA-measured gaseous emissions from the five etching steps.
Jmmp 02 00011 g004
Figure 5. SEM images of the particles suspended in the aqueous wastes, where (A), (B), (C), (D) and (E) represent S#1, S#2, S#3, S#4 and S#5, respectively.
Jmmp 02 00011 g005
Figure 6. Size distribution of the particles suspended in the aqueous wastes, where (A), (B), (C), (D) and (E) represent S#1, S#2, S#3, S#4 and S#5, respectively.
Jmmp 02 00011 g006
Figure 7. EDS spectrum of the particles in aqueous wastes, where (A), (B), (C), (D) and (E) represent S#1, S#2, S#3, S#4 and S#5, respectively.
Jmmp 02 00011 g007
Figure 8. Concentrations of aerosol particles emitted from the synthesis of making 1 mg Si NTs, where (A), (B), (C), (D) and (E) represent steps #1, #2, #3, #4 and #5, respectively.
Jmmp 02 00011 g008
Figure 9. SEM images of the particles in gas emissions, where (A), (B) and (C) are G#1, G#2, and G#4.
Jmmp 02 00011 g009
Figure 10. EDS spectra of the particles in gas emissions, where (A), (B) and (C) represent G#1, G#2, and G#4, respectively.
Jmmp 02 00011 g010
Table 1. Concentrations of Ag, Co and Si in the aqueous waste measured by ICP-AES.
Ag (mg)Si (mg)Co (mg)
S#17.861 ± 0.09441.521 ± 0.214-
S#20.068 ± 0.003205.787 ± 1.043-
S#31.130 ± 0.0053.157 ± 0.028-
S#40.319 ± 0.00339.729 ± 0.2831.884 ± 0.027
S#50.506 ± 0.00613.108 ± 0.0400.841 ± 0.017
Total9.885 ± 0.110303.028 ± 1.6092.726 ± 0.045
Table 2. Concentration of gases measured by RGA in the gaseous samples.
N2 (%)O2 (%)Ar (%)CO2 (%)H2O (%)H2 (%)
G#176.92 ± 0.9120.59 ± 0.460.89 ± 0.010.03 ± 0.231.56 ± 0.300.000 ± 0.000
G#277.30 ± 2.0519.76 ± 0.340.84 ± 0.040.03 ± 0.111.99 ± 0.480.070 ± 0.002
G#377.69 ± 1.2019.83 ± 0.250.83 ± 0.050.04 ± 0.081.61 ± 0.310.000 ± 0.000
G#477.07 ± 0.3419.88 ± 0.110.82 ± 0.010.04 ± 0.022.18 ± 0.390.011 ± 0.000
G#576.91 ± 0.7220.51 ± 0.440.85 ± 0.030.04 ± 0.061.69 ± 0.270.000 ± 0.000
Table 3. Chemical compositions of particles in the aqueous waste measured by EDS.
ElementAtom. C (at. %)
S#1S#2S#3S#4S#5
Al0.76 ± 0.10.48 ± 0.11.44 ± 0.10.35 ± 0.10.69 ± 0.1
C14.85 ± 1.936.93 ± 9.315.74 ± 1.21.25 ± 1.23.01 ± 0.8
Co---0.99 ± 3.110.52 ± 1.0
F13.08 ± 3.737.14 ± 15.130.22 ± 5.448.46 ± 56.4-
N33.01 ± 5.810.86 ± 16.713.38 ± 3.633.22 ± 10.624.65 ± 3.3
O26.63 ± 4.212.55 ± 21.715.06 ± 2.57.00 ± 3.354.61 ± 5.6
Si0.14 ± 0.00.73 ± 0.12.73 ± 0.28.73 ± 0.70.18 ± 0.1
Ag11.53 ± 2.51.31 ± 0.321.43 ± 2.4-2.00 ± 0.4
Table 4. Chemical composition of particles in the gas emissions.
ElementAtom. C (at. %)
G#1G#2G#4
Al3.12 ± 0.11.9 ± 0.10.33 ± 0.1
C16.44 ± 0.915.48 ± 0.82.28 ± 0.4
Co--1.47 ± 0.2
Cu62.12 ± 3.162.09 ± 3.146.5 ± 3.1
F2.78 ± 0.46.89 ± 0.629.17 ± 16.1
N-7.15 ± 0.713.01 ± 2.0
O13.23 ± 0.83.11 ± 0.30.47 ± 0.2
Si5.31 ± 0.23.38 ± 0.16.76 ± 0.3

