Article

Scan-Strategy Dependent Microstructural Modulation in L-PBF Ti-6Al-4V Components Through Selective Rescanning


by
Kalyan Nandigama
1,
Bharath Bhushan Ravichander
1,2,
Yash Parikh
3 and
Golden Kumar
1,*
1
Department of Mechanical Engineering, The University of Texas at Dallas, Richardson, TX 75080, USA
2
ArcelorMittal Global R&D, East Chicago, IN 46312, USA
3
EOS of North America, Inc., Pflugerville, TX 78660, USA
*
Author to whom correspondence should be addressed.
J. Manuf. Mater. Process. 2026, 10(3), 88; https://doi.org/10.3390/jmmp10030088
Submission received: 26 January 2026 / Revised: 21 February 2026 / Accepted: 25 February 2026 / Published: 2 March 2026

Abstract

Laser Powder Bed Fusion (L-PBF) can enable in situ microstructural tailoring of metallic components by precisely controlling the layer-wise processing parameters. Layer rescanning is one such strategy used to induce localized microstructural modification. In this study, we investigated the effect of a lattice-based selective rescanning approach applied to different base scan strategies for Ti-6Al-4V samples. The lattice regions were selectively rescanned at 50% reduced laser power relative to the initial scan along the same laser path. Relative density, porosity, martensitic α′ morphology, phase fraction, and Vickers microhardness were compared with those of non-rescanned reference counterparts. Different scan strategies, including unidirectional, stripes, and chess, exhibited distinct responses to selective rescanning, resulting in localized variations in martensitic phase formation and hardness values. The extent of localized microstructural modification and hardness enhancement was strongly governed by the underlying scan strategy. Selective rescanning using the stripes strategy yielded the largest contrast between non-rescanned and rescanned regions. The unidirectional strategy showed strong effects of rescanning, but the heat-affected zones extended to the non-rescanned regions. In contrast, the chess strategy exhibited comparatively moderate changes owing to its inherent thermal-management characteristics. These findings demonstrate that selective rescanning can provide an effective, localized approach for tailoring microstructure and hardness enhancement in L-PBF Ti-6Al-4V, with its effectiveness strongly dependent on the underlying scan strategy.

1. Introduction

Laser powder bed fusion (L-PBF) uses a high-power laser source to selectively melt and fuse metal powder particles in a layer-by-layer manner to fabricate a three-dimensional component [1,2]. The layer-wise building scheme enables in situ control of microstructures during the fabrication of near-net-shaped components [3,4,5,6,7,8,9]. Processing parameters can be varied at specific locations to alter the local solidification conditions based on established L-PBF processing maps. Numerous studies have demonstrated site-specific tailoring of grain size and morphology [10], texture [11], dislocation density [12], and phase selection [13] through the layer-wise L-PBF parameter modulation.
Among these parameters, the scan strategy plays a crucial role in governing microstructural evolution. The scan strategy specifies the scan vector length, rotation, hatch spacing, and overlap, collectively influencing local heat accumulation, thermal gradients, and melt pool stability [14]. Especially in Ti-6Al-4V, the relatively low thermal conductivity amplifies thermal field overlap between adjacent scan tracks and layers, making microstructural evolution particularly sensitive to the scan strategy and repeated thermal exposure. For instance, Ali et al. [15] reported reduced residual stress in Ti-6Al-4V using a 90° scan rotation angle during L-PBF. Liu et al. [16] reported pronounced variations in the microstructure, energy distribution, and texture development as a function of the scan pattern in L-PBF Ti-6Al-4V parts. Strantza et al. [17] investigated continuous and island-based scan strategies and observed distinct residual stress distributions in additively manufactured Ti-6Al-4V.
Carter et al. [18] investigated ‘island’ and ‘back-and-forth’ scan strategies for the L-PBF CM247LC superalloy. The island scan strategy resulted in a bimodal microstructure with relatively weak texture in the as-built samples. Shi et al. [19] employed a laser beam shaping strategy to induce a columnar to equiaxed grain transition in 316L stainless steel. Sofinowski et al. [2] used the laser scanning angle as a control parameter to manipulate the texture of 316L stainless steel. Nadammal et al. [20] demonstrated a controllable texture evolution in IN718 by adjusting the layer-wise L-PBF scan strategy. Despite these advances, the ability of scan strategies to tailor microstructure remains constrained by the thermal history imposed during primary layer exposure, thereby limiting effectiveness and spatial resolution. To overcome these limitations, rescanning has emerged as an effective approach for modifying thermal history without altering the base scan strategy. Rescanning in L-PBF is used to remelt the solidified layer, reducing porosity and residual stress while improving surface quality and interlayer bonding [21,22,23]. Recent studies have shown the potential of rescanning in controlling the local microstructure by varying the parameters, volume fraction, and laser path during rescanning [24,25].
Gao et al. [12] varied hatch spacing and the number of laser exposures to modify the dislocation density at specific locations in 316L stainless steel. The rescanning acted as a controlled in situ heat treatment, resulting in “programmable” recrystallization. Xiao et al. [22] examined the effect of rescanning parameters in Ti-6Al-4V and reported that supplying excessive rescanning energy adversely affected the residual stress and surface roughness. Karimi et al. [25] observed an increased martensitic α′ width and fraction with increasing number of rescans in Ti-6Al-4V L-PBF parts. Miao et al. [26] applied rescanning to L-PBF parts fabricated with different base scanning strategies and reported a reduction in residual stresses in rescanned samples. Xu et al. [27] varied the laser beam focus to tailor the size of heat-affected zones to transform acicular martensite phase into a fine α + β lamellar structure in the underlying layers of Ti-6Al-4V. In Ti-6Al-4V, the variations in cooling rate strongly influence the β→α′ transformation, where rapid cooling promotes acicular martensite formation, while prolonged thermal exposure leads to martensitic α′ coarsening [28,29].
While the influence of rescanning parameters on L-PBF microstructure is well documented, the interaction between selective rescanning and base scan strategy remains insufficiently understood. Our prior work has shown that selectively rescanning of localized regions can provide benefits comparable to full-layer rescanning [24]. By employing lattice-based selective rescanning, the thermal modification can be confined to three-dimensionally interconnected regions, enabling spatially resolved control over the microstructure and phase evolution. This study elucidates the synergetic relationship between the effect of selective rescanning on scan strategies to deliver targeted microstructural improvements for L-PBF Ti-6Al-4V components. To probe the effect of selective rescanning, we systematically employ different scan strategies, such as unidirectional, stripe, and chess, to analyze their influence on the density, microstructure, and microhardness against the non-rescanned reference sample fabricated under optimal L-PBF conditions.

2. Materials and Methodology

2.1. Sample Fabrication

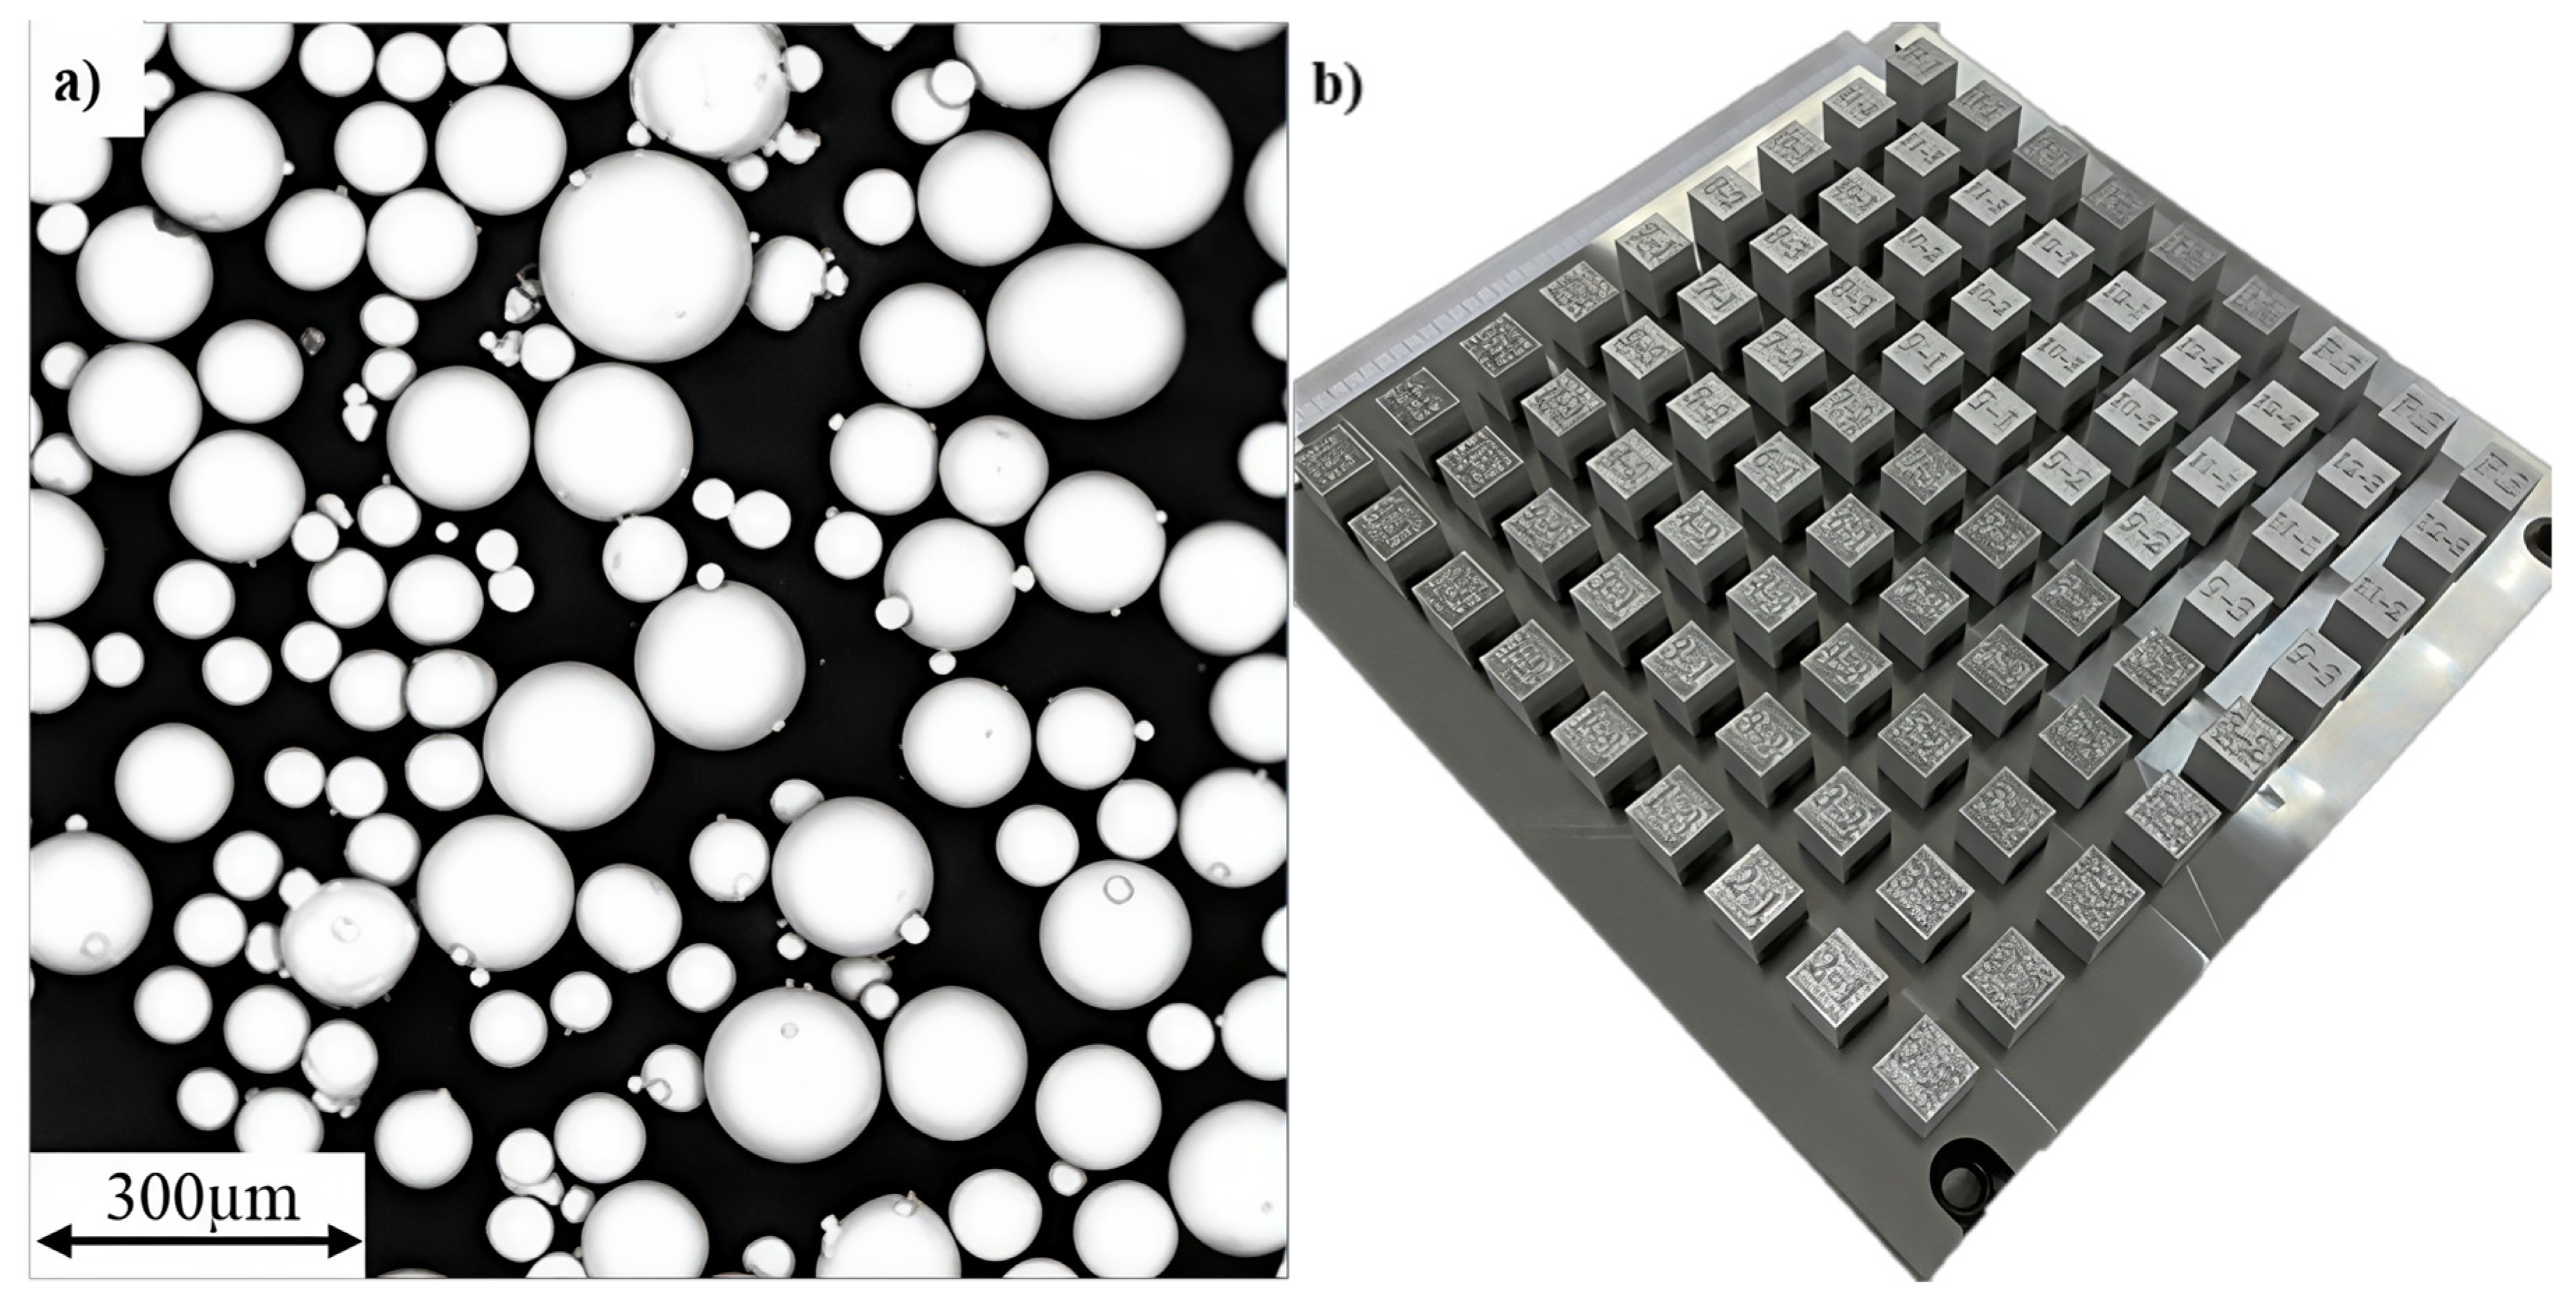
Solid cuboid and face-centered lattice (relative density of 15%, cell size of 5 mm × 5 mm × 5 mm, and 1.25 mm strut thickness) CAD designs were generated in SolidWorks (version 2021). For rescanning, the lattice designs were superimposed on the cubes using Materialize Magics 25.2 software, and specific process parameters for the respective regions were assigned using EOS Print (version 3.0) software [24]. Gas-atomized Ti-6Al-4V powder supplied by EOS of North America, Inc. (Pflugerville, TX, USA), was used to fabricate cuboidal samples (15 × 15 × 17 mm) in an Argon atmosphere with O2 < 1000 ppm, using an EOS M290 L-PBF printer (EOS GmbH, Krailling, Germany) equipped with a 400 W Yb-fiber laser and 80 μm spot diameter. The powder is primarily composed of spherical particles as shown in Figure 1a, with a size distribution of D10 = 19.40 μm, D50 = 32.30 μm, and D90 = 46.70 μm. The fabricated specimens are displayed in Figure 1b. The chemical composition of the Ti-6Al-4V powder is listed in Table 1.
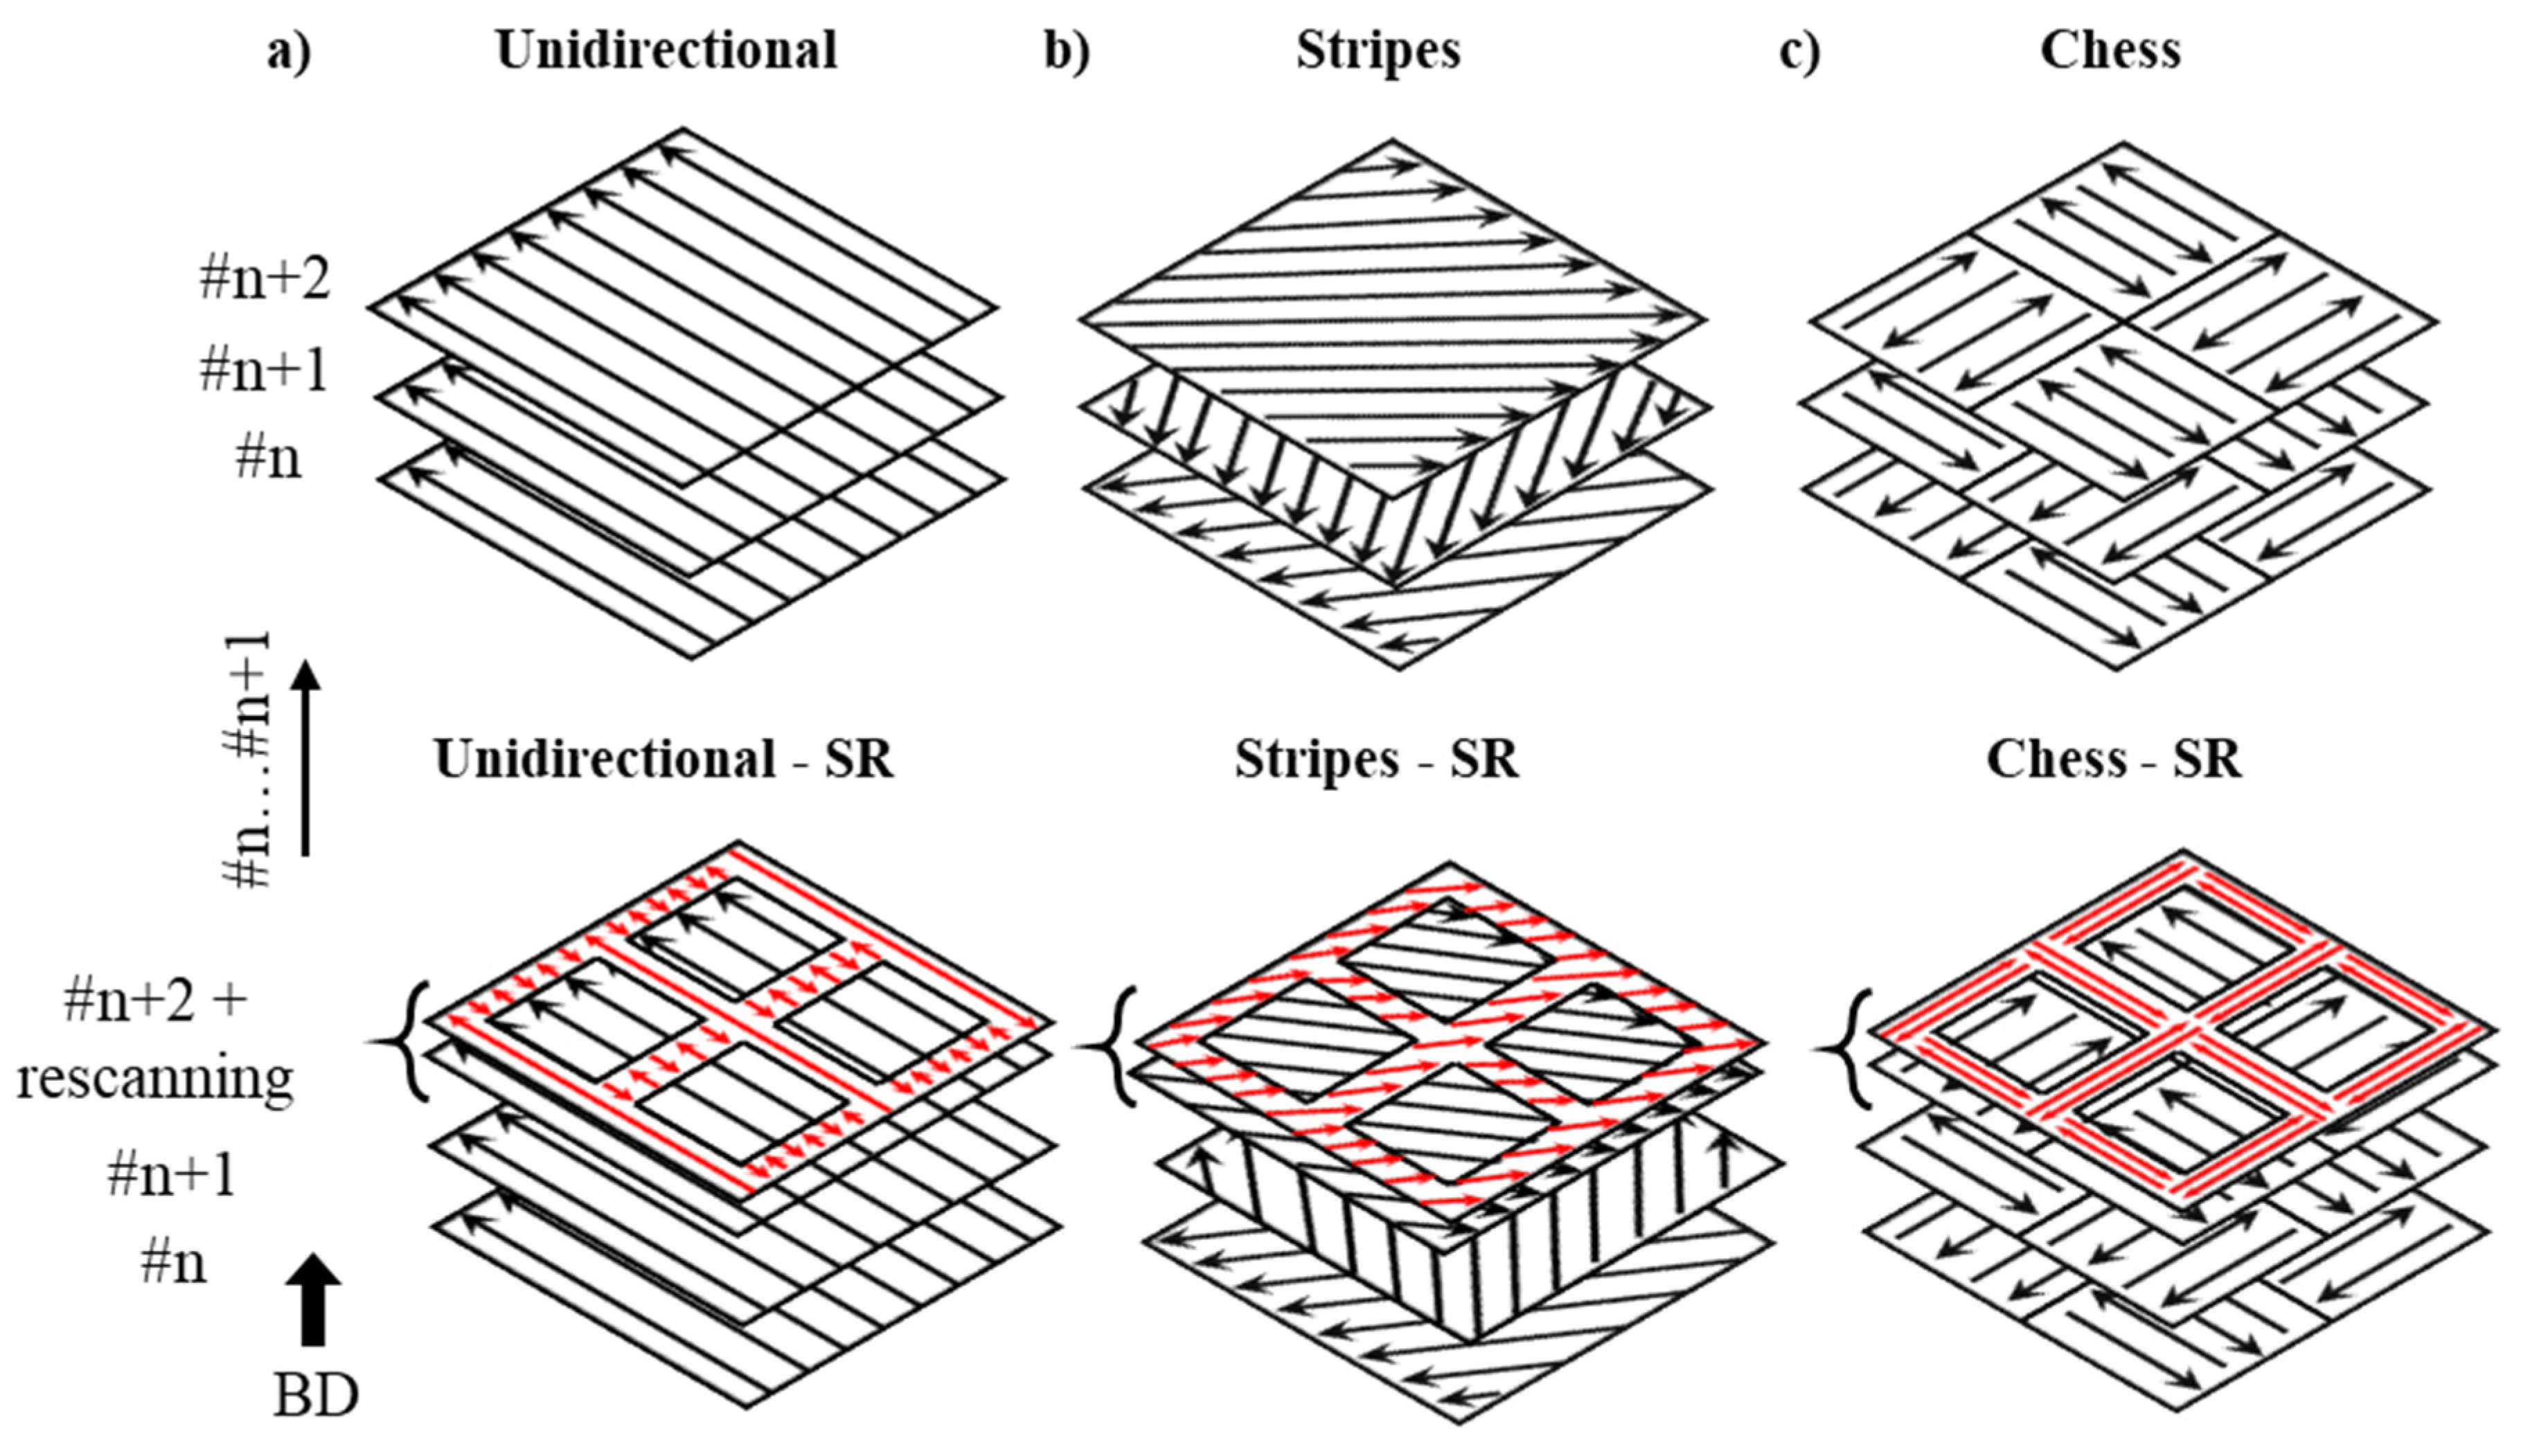
A total of six different (three reference and three rescanned) samples were fabricated. The three reference samples were fabricated with optimal processing parameters as suggested by EOS, but with varying scan strategies: unidirectional, stripe, and chess. Selectively rescanned specimens consisted of two regions: the non-rescanned region and the rescanned region. The non-rescanned region was scanned with the same parameters as those used in the reference samples, and the rescanned regions were rescanned with half the laser power (LP) compared to that of the reference specimens (Figure 2). To amplify the effect of rescanning, the selective rescanning was applied to the lattice region on every third layer [24]. The selectively rescanned region (regions with red arrows) refers to a portion of the layer that was scanned twice, whereas the non-rescanned region was scanned only once (Figure 2). The scan strategy and the laser path were the same for rescanned and non-rescanned regions. The selectively rescanned sample employing a unidirectional scan strategy is referred to as unidirectional-SR. Similarly, the rescanned samples printed with stripes and chess patterns are hereinafter referred to as stripes-SR and chess-SR, respectively. The processing parameters and scan strategies used to fabricate the samples are summarized in Table 2. The scan speed (SS), layer thickness (LT), and hatch distance (HD) were kept constant across all samples. These parameters have been optimized to yield dense Ti-6Al-4V parts despite different scan strategies. The energy density (Ed) was calculated using the formula [30]:
E d = L P S S × H D × L T

2.2. Microstructural Characterization

L-PBF Ti-6Al-4V specimens were separated from the titanium build plate using wire electric discharge machining (W-EDM) and sonicated in isopropyl alcohol for 30 min to remove any residual powder particles and lubricant residues from the cutting process. The density was measured using Archimedes’ principle, and an average of 5 readings was reported. The density values were used to confirm the formation of dense parts under optimal conditions. The surface parallel to the build direction was polished using a semi-automatic polisher (E-prep 4) from Allied High Tech (Cerritos, California, USA) for performing the Vickers microhardness and microstructural characterization. The surface was progressively ground from 180 grit to 4000 grit using SiC abrasive paper and water as a lubricant. The final polishing step was performed with a DiaMat polishing cloth and 0.05 μm Silica colloidal solution as the lubricant. The polished surfaces were characterized by the Keyence VHX-970FN digital optical microscope (Itasca, IL, USA) for porosity and surface defects. The brightness and contrast of the obtained OM micrographs were adjusted to enhance the visibility of defects.
The polished surfaces were then etched using Kroll’s reagent (92 mL distilled water, 6 mL HNO3, and 2 mL HF) to reveal the microstructural features. A Zeiss Sigma 500 VP scanning electron microscope (Oberkochen, Germany) in the secondary electron mode was used to characterize the etched surfaces. Several Scanning Electron Microscopy (SEM) images were obtained from reference, rescanned, and non-rescanned regions of the Ti-6Al-4V samples and analyzed using ImageJ (version 1.54g) software to quantify the martensitic α′ phase fraction and thickness, as reported in prior studies [31,32]. To ensure consistency across samples, the primary, secondary, and tertiary morphologies discernible in the SEM images were included to calculate the phase fraction, whereas only the primary and secondary martensitic α′ morphologies were used to quantify the thickness.

2.3. Vickers Microhardness

Vickers microhardness tests were conducted on the polished surfaces before etching to minimize the influence of surface roughness, using an MHT-1000Z Alpha hardness tester equipped with a Vickers diamond indenter from Pace technologies (Tucson, AZ, USA). 1 kgf was applied to both the reference and selectively rescanned samples, for a dwell time of 10 s, as per ASTM Standard E384. An average value of 10 readings were reported. The indentations were performed in both rescanned and non-rescanned regions to study the extent of the heat-affected zone.

3. Results and Discussion

3.1. Part Quality

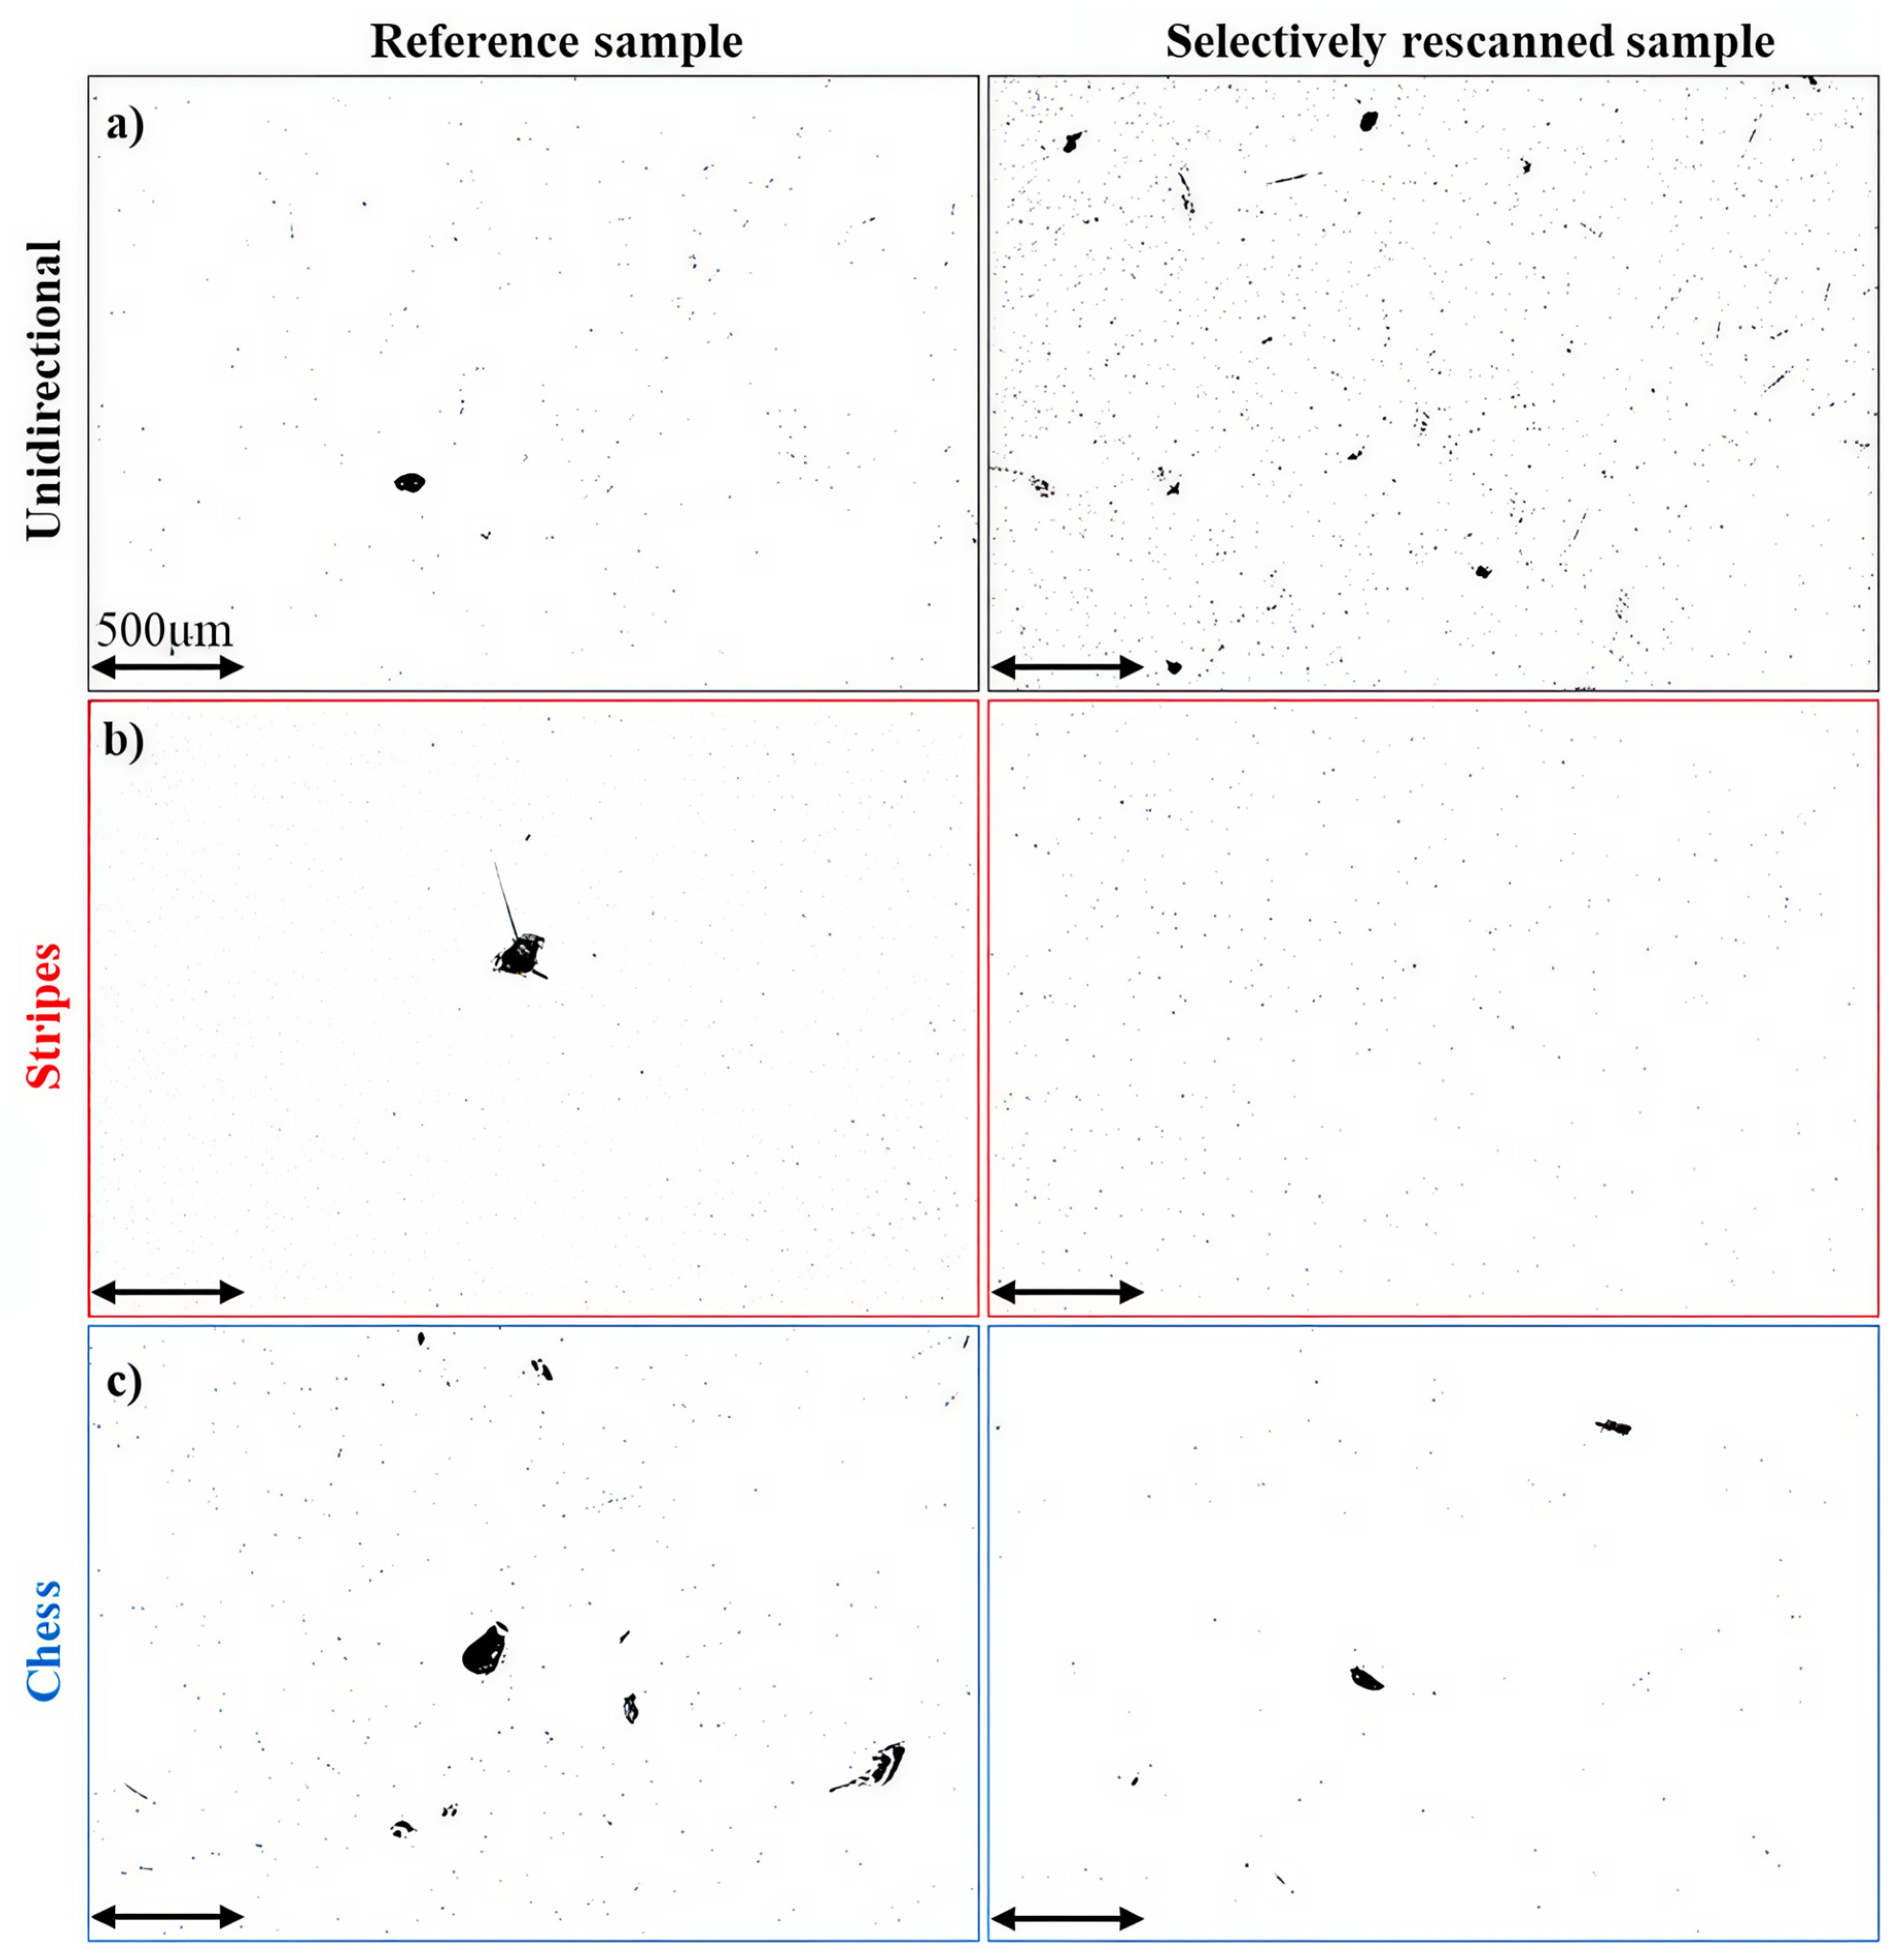
The porosity characteristics of the fabricated Ti-6Al-4V samples are examined using optical micrographs acquired from ten randomly selected regions of each sample. Figure 3 compares representative images of the reference and selectively rescanned regions fabricated using different scan strategies. Overall, selective rescanning influences both the distribution and morphology of pores; however, its effectiveness is strongly dependent on the underlying scan strategy and the associated thermal history. While rescanning generally promotes additional remelting, the extent to which remelting reduces porosity varies with scan vector length, rotation, and overlap.
In the unidirectional scan strategy, both the reference and selectively rescanned samples exhibit predominantly spherical micropores due to gas-related porosity (Figure 3a). The rescanned sample displays a higher density of larger pores. The unidirectional strategy employs long, non-rotating scan vectors that repeatedly overlap along the build direction and promote cumulative heat accumulation. While such overlap can facilitate complete melting during initial exposure, rescanning introduces additional melting and cooling cycles. These repeated thermal cycles can elevate peak melt pool temperatures and extend melt pool lifetimes, increasing the likelihood of metal vaporization and subsequent gas entrapment. As a result, rather than mitigating porosity, selective rescanning under a unidirectional strategy increases the probability of gas pore formation. This trend is reflected in the measured relative density (Table 3), though the overall changes are small.
The samples fabricated with the stripes scan strategy are represented in Figure 3b. The reference stripes sample exhibits isolated lack-of-fusion defects, arising from insufficient overlap and prolonged cooling intervals associated with long scan vectors. In contrast, the selectively rescanned stripes sample shows a noticeable reduction in visible porosity. The additional remelting promotes improved melt pool continuity and facilitates the consolidation of partially melted regions and residual powder particles from the prior exposure. Consequently, the relative density increases from 99.58% for the reference sample to 99.73% for the rescanned sample, indicating that selective rescanning is effective when combined with scan strategies that limit excessive heat accumulation via interlayer rotation.
The chess scan strategy exhibits a distinct porosity response. As shown in Figure 3c, both the reference and rescanned samples contain a combination of spherical gas pores and irregular lack-of-fusion defects. In this strategy, each layer is divided into small, discrete islands, resulting in short scan vectors and frequent interruptions in laser exposure. While this approach limits large-scale heat accumulation, it also restricts melt pool continuity and introduces localized thermal gradients within individual islands and at island boundaries [33]. As a result, incomplete fusion is more likely to occur in both the reference and rescanned conditions. Selective rescanning reduces the size and severity of lack-of-fusion defects by promoting additional remelting within the islands and improving bonding at island interfaces, but it does not eliminate porosity. This behavior is reflected in the marginal increase in relative density from 99.48% (reference sample) to 99.55% (selectively rescanned sample), suggesting that rescanning primarily refines defect morphology rather than substantially increasing densification for the chess scan strategy.
The above results demonstrate that the effect of selective rescanning on porosity is strongly governed by the baseline scan strategy and its associated thermal characteristics. Rescanning is most effective when it complements scan strategies that promote thermal homogenization and controlled heat accumulation, such as stripes scanning with interlayer rotation. In contrast, for scan strategies susceptible to excessive heat buildup, such as unidirectional scanning, rescanning can exacerbate vaporization-driven gas porosity. These findings underscore the necessity of tailoring selective rescanning protocols to the underlying scan strategy to achieve high-density L-PBF Ti-6Al-4V components and are consistent with prior reports highlighting the scan-strategy-dependent nature of defect mitigation in the L-PBF processes [34,35,36].

3.2. Microstructural Analysis

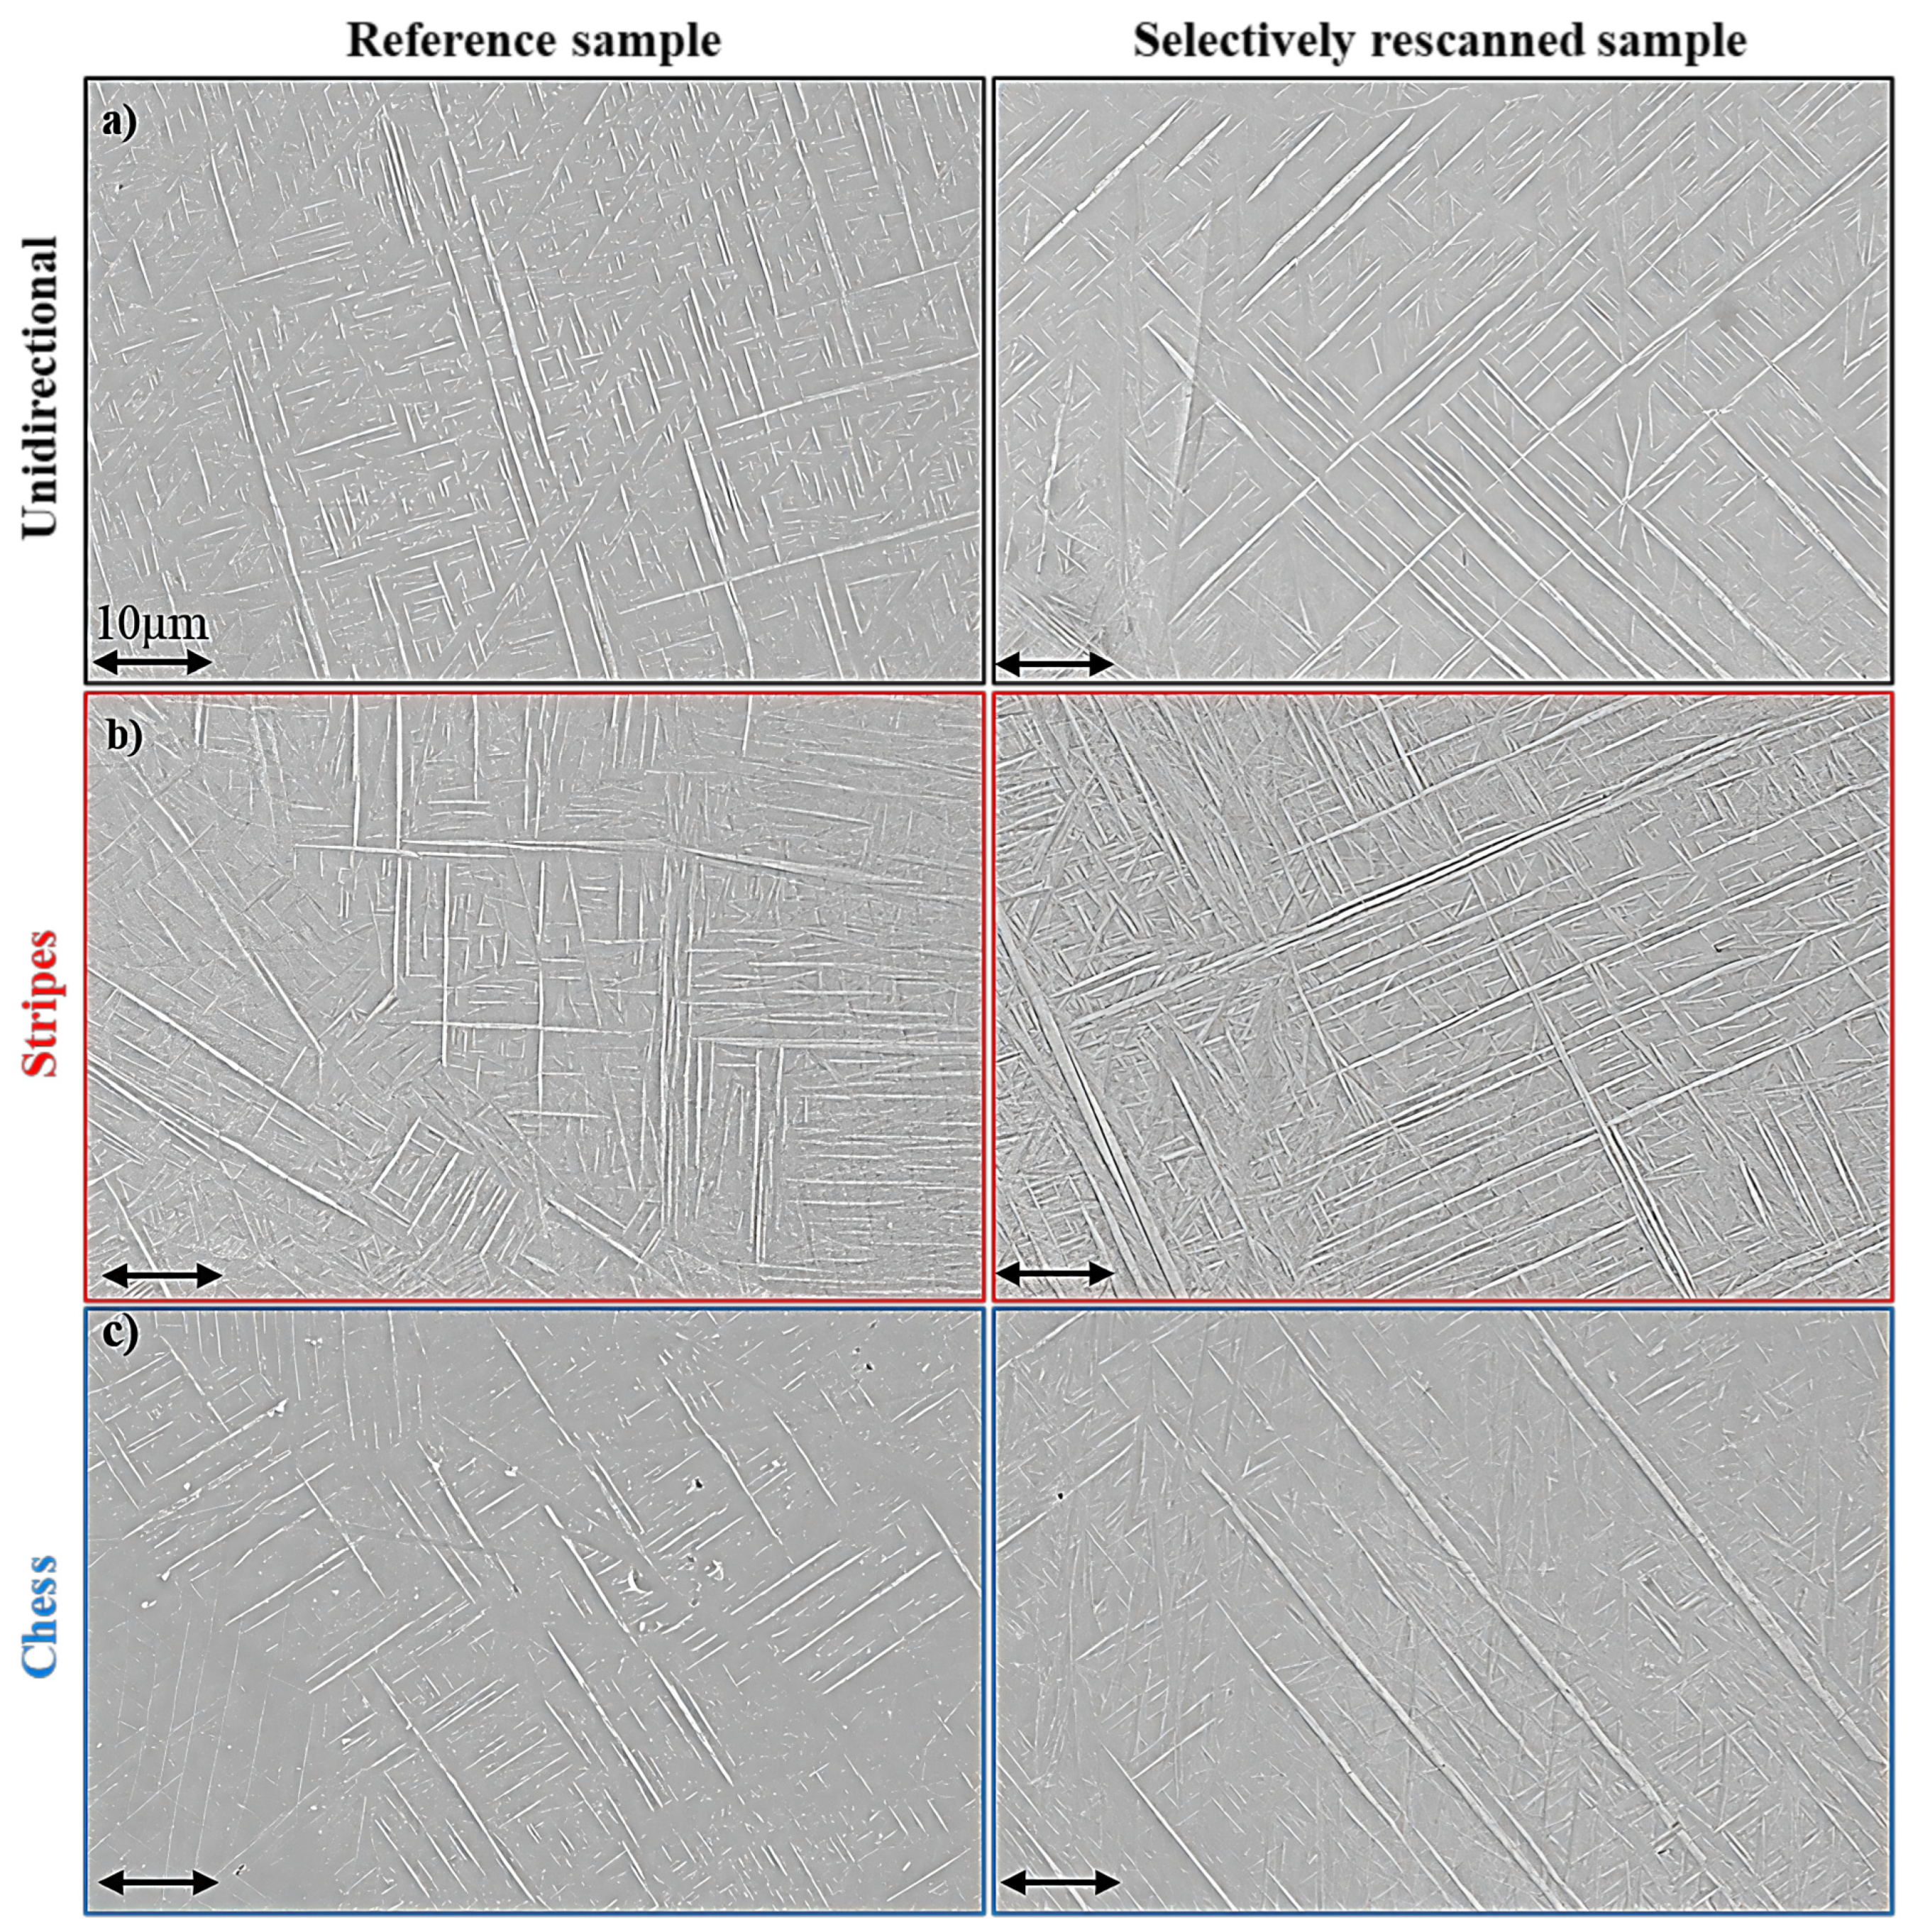
Across all scan strategies, the microstructure predominantly contains acicular martensitic α′ substructures (Figure 4), which is a characteristic of L-PBF-processed Ti-6Al-4V samples [15,21,22]. The selectively rescanned regions in all specimens exhibit a higher fraction of martensitic α′ with a coarser morphology than the corresponding reference samples. SEM images of the non-rescanned regions (not presented here) show only a marginal increase in the α′ fraction compared to the respective reference samples. Quantitative measurements of the martensitic α′ fraction and thickness in the reference, non-rescanned, and rescanned regions are summarized in Table 4. The chess strategy results in smallest increase in martensitic α′ fraction relative to its reference counterpart, increasing from 29 ± 2.1% to 33 ± 2.0%. In contrast, the samples with the stripes scan strategy show a substantial increase in martensitic α′ fraction from 34 ± 2.5% in the reference sample to 43 ± 1.7% after selective rescanning. The largest relative increase was observed in the unidirectional strategy, where the martensitic α′ fraction increased from 22 ± 1.5% to 36 ± 1.2%. By comparison, the martensitic α′ fraction in the non-rescanned regions exhibits only minor variations (~5%) relative to their reference samples for all scan strategies. Therefore, the dominant microstructural changes are induced locally by the selective rescanning rather than by inherent differences in the baseline scan strategies.
A similar dependence on scan strategy was observed in the evolution of the martensitic α′ thickness. In general, the rescanned regions exhibit a greater martensitic α′ thickness than the corresponding reference samples and the non-rescanned regions. The most pronounced increase in martensitic α′ thickness is observed in the stripes scan strategy, where the thickness increases from 0.46 ± 0.09 μm in the reference sample to 0.67 ± 0.11 μm in the rescanned region. For the chess strategy, the α′ thickness increases marginally from 0.64 ± 0.13 μm to 0.71 ± 0.15 μm. In contrast, the unidirectionally scanned sample does not show a significant change in martensitic α′ thickness in the rescanned region. However, the non-rescanned regions in the unidirectional and chess strategies show a notable reduction in martensitic α′ thickness relative to their reference counterparts, decreasing from 0.66 ± 0.11 μm to 0.52 ± 0.08 μm and from 0.64 ± 0.13 μm to 0.53 ± 0.11 μm, respectively.
The observed hierarchical morphology aligns with the martensitic evolution mechanism proposed by Yang et al. [32]. During rapid cooling, solidification proceeds through liquid to β phase transformation, followed by martensitic transformation to α′ when the cooling rate exceeds ~410 °C/s [37]. The effect of selective rescanning on the microstructure of Ti-6Al-4V samples processed with different scan strategies can be understood based on the peak temperature and the cooling rate attained during repeated thermal cycles. During rescanning, the previously solidified layer is selectively remelted, eliminating pre-existing microstructure. The remelted region experiences higher cooling rates because the surrounding solid material has greater thermal conductivity than the powder bed. The increased cooling rate promotes martensitic transformation, resulting in a higher α′ fraction measured in rescanned regions (Table 4). Slight coarsening of α′ in the rescanned regions also suggests that the deposition of subsequent layers does not completely remelt the underlying layer. Coarsening of α′ in L-PBF Ti-6Al-4V during repeated thermal cycles has been reported if the peak temperature remains below β transus temperature [38].
The variation in the martensitic α′ fraction and thickness across differently scanned samples can be attributed to differences in thermal history and heat accumulation pattern associated with each scan strategy. The scan vector length and thermal cycling behavior strongly influence the morphology of martensitic α′ [26,38]. In the unidirectional scan strategy, the absence of scan rotation, combined with extensive overlap of continuous melt tracks between successive layers, promotes localized heat accumulation and sustained thermal gradients along the build direction [15]. The resulting reduction in the cooling rate accounts for the lowest martensitic α′ volume fraction (22 ± 1.5%) and the largest α′ thickness (0.66 ± 0.11 μm) observed in the unidirectionally scanned reference sample. Selective rescanning partially remelts the layer that solidifies at an elevated cooling rate, resulting in a higher martensitic α′ phase fraction of 36 ± 1.2%. However, because the scan vector orientation remains unchanged, thermal energy accumulation along the build direction is largely preserved. As a result, no statistically significant change in martensitic α′ thickness is observed in the rescanned region (Table 4). In contrast, the non-rescanned region of the unidirectional-SR sample exhibits a reduction in martensitic α′ thickness to 0.52 ± 0.08 μm. This refinement is attributed to the longer intervals between successive thermal cycles experienced by the non-scanned regions, which enables cooling to lower temperatures and prevents α′ coarsening. Increase in dislocation density due to thermal stress can also contribute to the refined α′ because the dislocations act as nucleation sites for α′ [38].
The stripes scan strategy incorporates a 67° interlayer scan rotation, reducing the effective scan vector length and disrupting the continuous overlap of melt tracks. This approach enhances heat redistribution between layers and mitigates thermal buildup [14,15,16,17,18]. As a result, the reference stripes sample exhibits a higher martensitic α′ fraction of 34 ± 2.5% and a reduced martensitic α′ thickness of 0.46 ± 0.09 μm compared to the unidirectional counterpart. However, the rescanned material solidifies at a higher cooling rate, resulting in an increased fraction of martensitic α′ to 43 ± 1.7%. An increase in the α′ lath thickness to 0.67 ± 0.11 μm is also observed, which is attributed to coarsening during subsequent thermal cycles. In contrast, both the martensitic α′ fraction and thickness in the non-rescanned regions remain unchanged relative to the corresponding reference sample (Table 4). This indicates that the non-rescanned regions are minimally affected by selective rescanning in the stripe’s strategy, likely due to effective thermal management. Therefore, microstructural programming through selective rescanning is more effective for stripes scan strategy.
In the chess scan strategy, the division of each layer into small islands produces short scan vectors that limit heat accumulation within individual layers and introduce longer intervals between successive heating cycles. This scanning approach maintains steep local thermal gradients while reducing cumulative heat accumulation, resulting in a relatively high cooling rate. Accordingly, the reference chess sample exhibits an intermediate martensitic α′ fraction of 29 ± 2.1% and a martensitic α′ thickness of 0.64 ± 0.13 μm. Selective rescanning has a similar effect of increasing the fraction and thickness of martensitic α′ like other scan strategies. The non-rescanned regions in the chess sample experience thermal exposure from neighboring rescanned areas, leading to a slight increase in martensitic α′ fraction (31 ± 0.9%) but a reduction in martensitic α′ thickness to 0.53 ± 0.11 μm due to prolonged heating intervals.
Overall, the results demonstrate that while selective rescanning increases martensitic α′ content and promotes coarsening of martensitic features through the introduction of an additional thermal cycle, the magnitude and nature of this microstructural evolution are strongly governed by the scan strategy. Scan strategies characterized by longer scan vectors and greater heat accumulation, such as unidirectional scanning, exhibit more pronounced sensitivity to rescanning-induced thermal effects, whereas strategies employing shorter scan vectors or interlayer rotation display more conservative microstructural responses. The effect of rescanning is more localized in stripes compared to unidirectional and chess scan strategies.

3.3. Vickers’ Microhardness

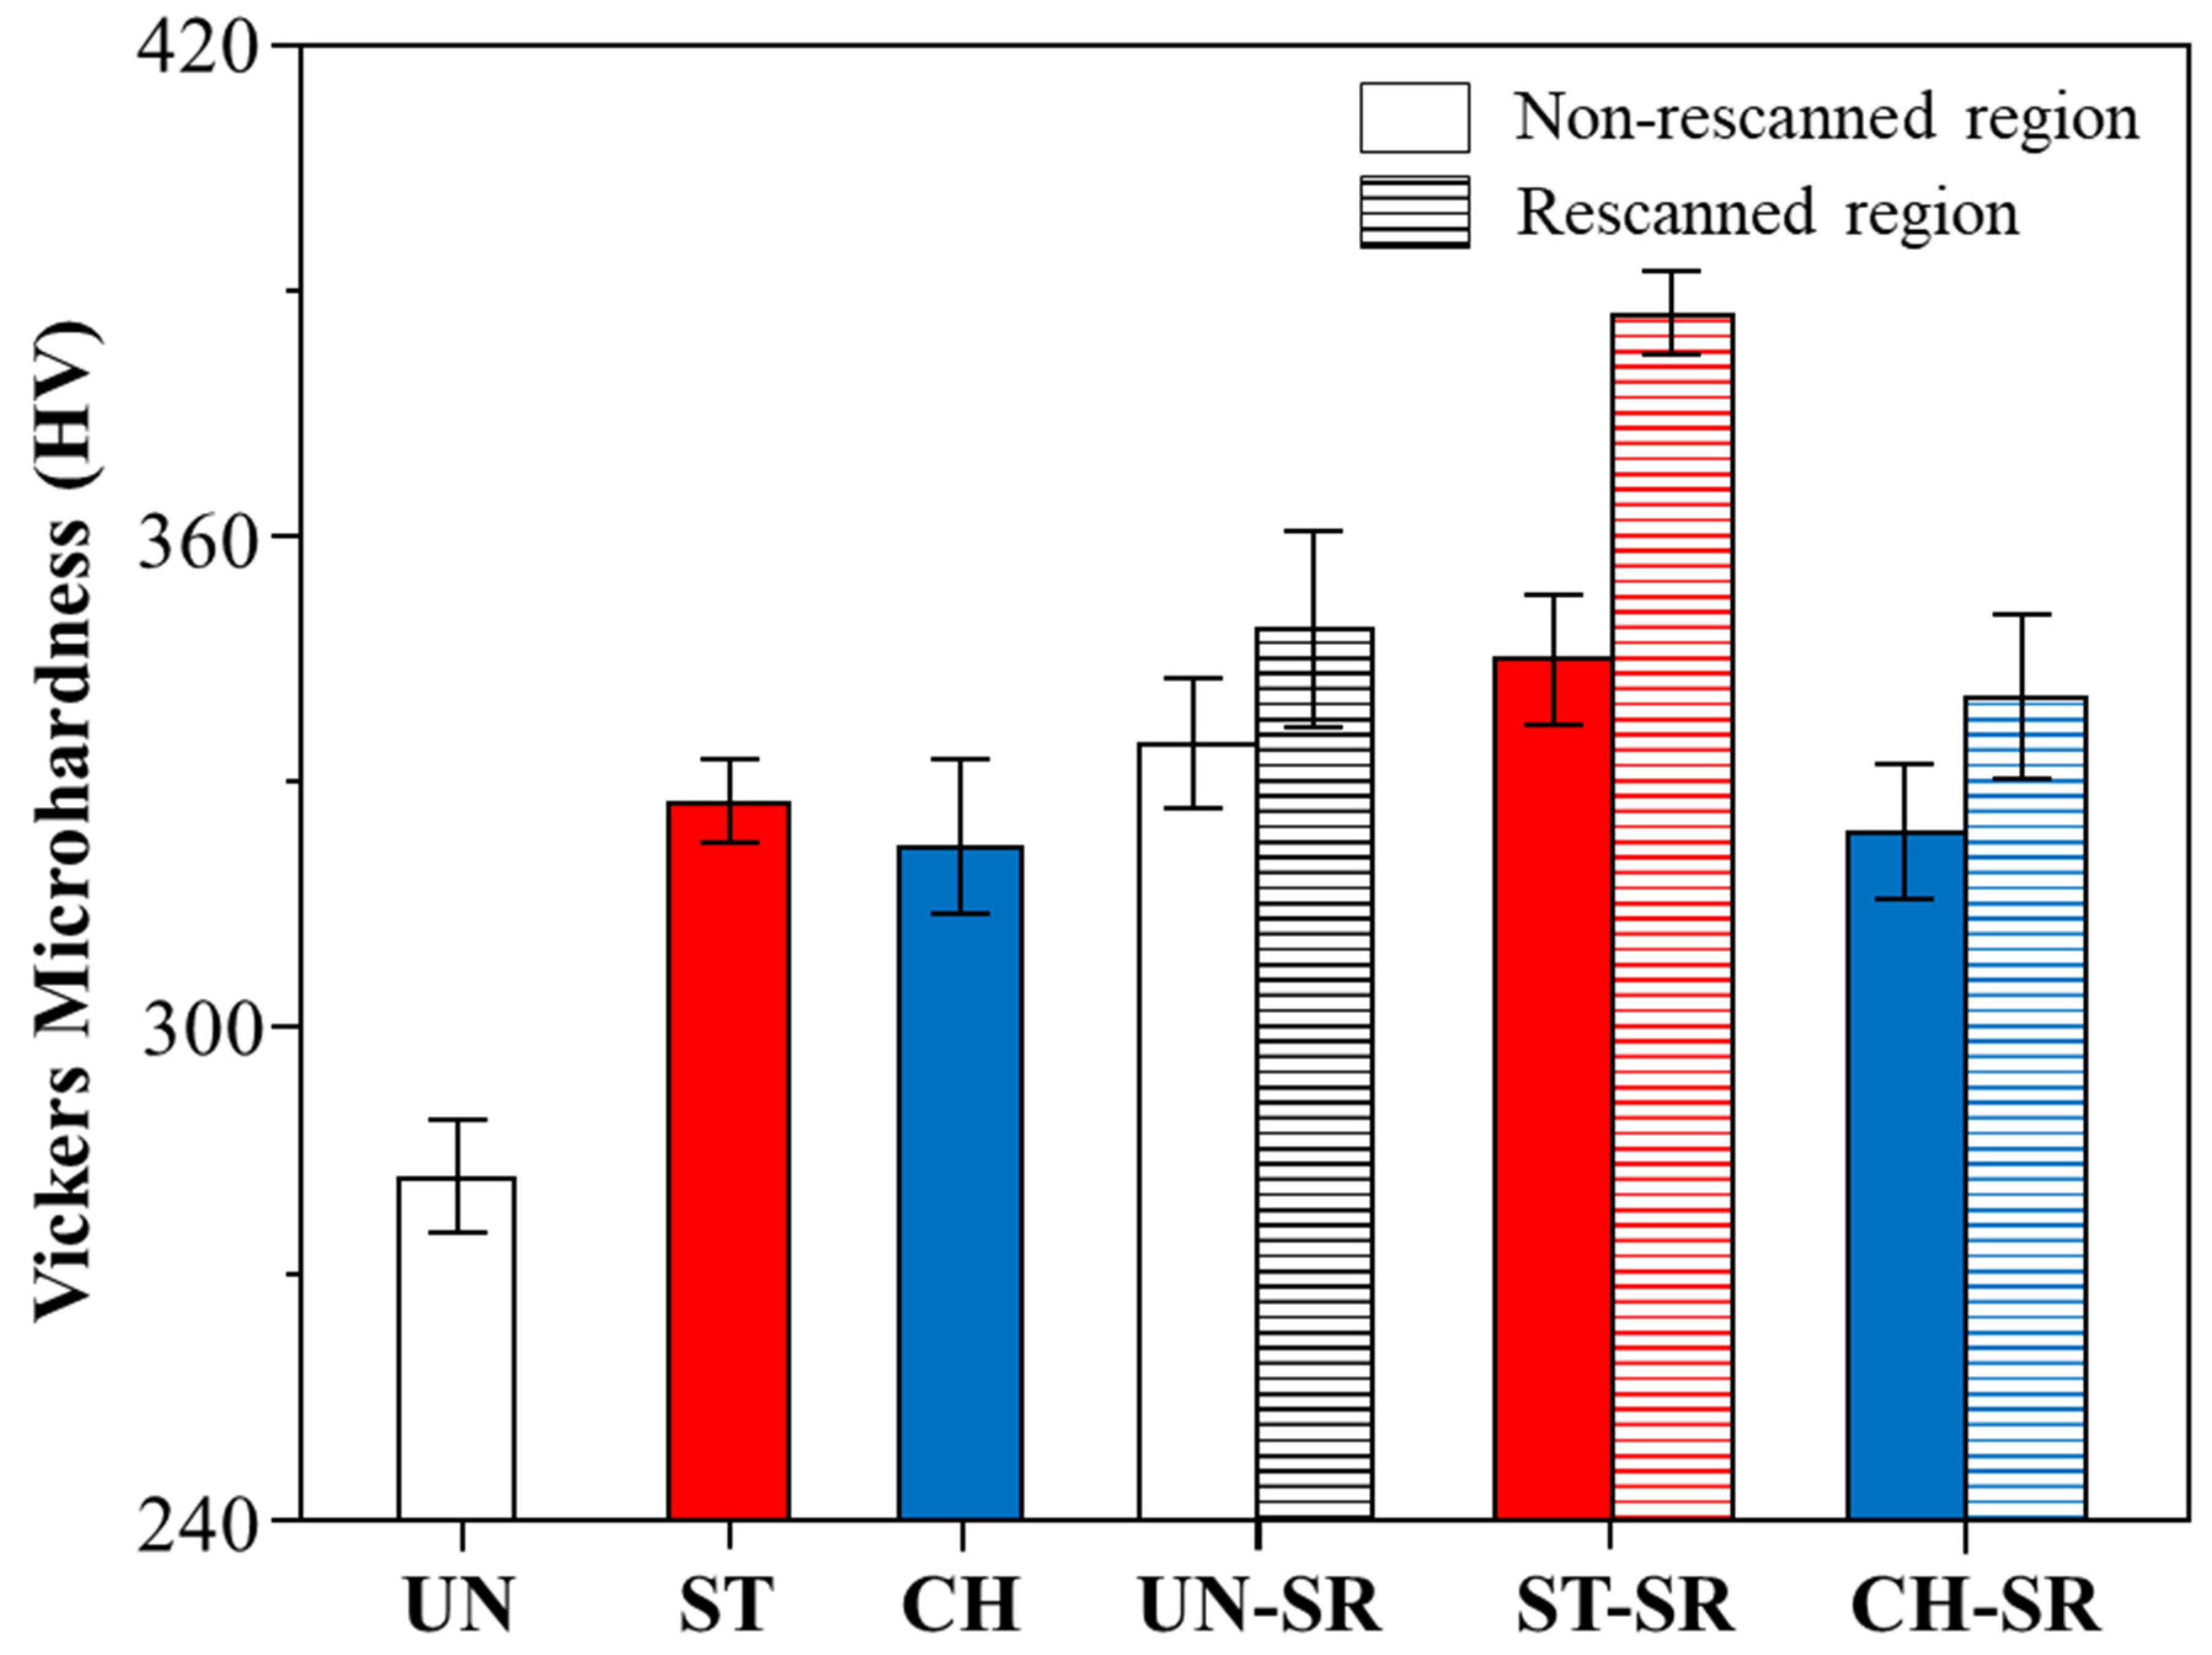
Figure 5 presents the average Vickers microhardness values measured in reference, non-rescanned, and rescanned regions of Ti-6Al-4V samples fabricated with different scan strategies. Among the reference samples, the stripes and chess samples exhibit high hardness values of 327 ± 5 HV and 322 ± 5 HV, respectively. In contrast, the unidirectional reference sample shows the lowest hardness (282 ± 6 HV). These values are consistent with the fractions of martensitic α′ phase. The residual stress in Ti-6Al-4V alloys is also strongly dependent on the scan strategy that can further contribute to the observed variation in microhardness values.
The selectively rescanned regions for all scan strategies show higher microhardness compared to the non-scanned regions and the corresponding reference samples. The highest microhardness in the rescanned regions was recorded for the stripes-SR sample (387 ± 5 HV), followed by the unidirectional-SR sample (349 ± 12 HV) and the chess-SR sample (340 ± 10 HV). This trend closely follows the changes in the fraction and size of α′ phase discussed in the preceding section. The martensitic α′ phase is inherently harder due to high internal stresses and formation of twins and dislocations during martensitic transformation [39,40].
Microhardness in the non-rescanned regions also changes compared to the reference state due to extended heat-affected zones generated by the selective rescanning. The unidirectional scan strategy results in the largest change from 282 ± 6 HV to 334 ± 8 HV, followed by the stripes strategy from 327 ± 5 HV to 345 ± 8 HV (Figure 5). In contrast, the chess scan strategy generates a marginal change in microhardness in the non-rescanned regions compared to the reference sample. These variations are directly related to different heat-affected zones associated with each scan strategy. The heat-affected zones are small in a chess scan strategy because the division of the layer into islands limits heat accumulation and reduces thermal diffusion length. Therefore, the effect of selective rescanning in chess strategy is more localized and non-rescanned regions remain largely unaffected. In a unidirectional scan strategy, the heat-affected zones become wider because long scan vectors promote heat accumulation, allowing thermal energy to diffuse over larger distances. Consequently, the α′ fraction and microhardness in non-rescanned regions of unidirectional-SR samples are significantly higher compared to the reference sample. The moderate change in microhardness of non-rescanned regions in stripes-SR is consistent with more uniform heat-affected zones as the heat buildup is reduced by the rotating scan direction.
The microhardness results indicate that the effect of selective rescanning is more localized in chess and stripes scan strategies due to the smaller heat-affected zones. However, the overall change in microhardness (322–340 HV) is small in chess samples due to limited variation in α′ phase fraction (~29–33%). Consequently, the difference between non-rescanned and rescanned regions is unremarkable for the chess strategy. For unidirectional scan strategy, the large heat-affected zones reduce the contrast in microhardness (332–349 HV) between non-rescanned and rescanned regions. The stripes scan strategy generates and retains significant differences in microhardness (345–387 HV) between non-rescanned and rescanned regions. Therefore, the stripes scan strategy is more effective than the chess and unidirectional strategies for site-specific control of the microstructure and properties in Ti-6Al-4V by selective rescanning.

4. Conclusions

In this study, the microstructural and mechanical properties of lattice-based selectively rescanned Ti-6Al-4V specimens fabricated with different L-PBF scan strategies were compared with reference samples without rescanning. The key findings are as follows:
  • Selective rescanning significantly modulates the local microstructure, including the fraction and thickness of martensitic α′ phase and pore distribution. Despite same rescanning parameters, the extent of change in the microstructure is affected by the scan strategy.
  • A higher fraction of α′ martensitic phase was observed in the selectively rescanned samples across all scan strategies. The increased α′ phase fraction stems from the higher cooling rate of selectively rescanned regions during resolidification. A slight coarsening of α′ was also observed due to repeated thermal cycles.
  • Selective rescanning enhances microhardness, which correlates well with the microstructural changes. The highest hardness of 387 ± 5 HV was measured in the rescanned regions of samples scanned with the stripes scan strategy.
  • Non-rescanned regions in selectively rescanned samples also showed an increase in α′ phase and microhardness depending on the scan strategy. The effects were weaker in the stripes and chess samples compared to the unidirectional samples due to different heat-affected zones.
  • The stripes scan strategy was found to be the most effective for tailoring the local microstructure and properties of Ti-6Al-4V specimens through selective rescanning.

Author Contributions

K.N.—Conceptualization, Data curation, Formal analysis, Writing—first draft. B.B.R.—Conceptualization, Supervision, Formal analysis, Writing—review and editing. Y.P.—Supervision, Writing—review and editing. G.K.—Supervision, Writing—review, editing, and Funding acquisition. All authors have read and agreed to the published version of the manuscript.

Funding

This work was supported by the STARs award from the University of Texas System.

Data Availability Statement

The data supporting the conclusions of this article will be made available by the authors on request.

Acknowledgments

The authors gratefully acknowledge support in part by a summer internship at the EOS of North America, Inc. Technology Development Center (TDC) in Pflugerville, Texas.

Conflicts of Interest

Author Bharath Bhushan Ravichander was employed by the company, ArcelorMittal Global R&D. Author Yash Parikh was employed by the company, EOS of North America, Inc. The remaining authors declare that the research was conducted in the absence of any commercial or financial relationships that could be construed as a potential conflict of interest.

References

  1. Todaro, C.J.; Easton, M.A.; Qiu, D.; Zhang, D.; Bermingham, M.J.; Lui, E.W.; Brandt, M.; StJohn, D.H.; Qian, M. Grain structure control during metal 3D printing by high-intensity ultrasound. Nat. Commun. 2020, 11, 142. [Google Scholar] [CrossRef]
  2. Sofinowski, K.A.; Raman, S.; Wang, X.; Gaskey, B.; Seita, M. Layer-wise engineering of grain orientation (LEGO) in laser powder bed fusion of stainless steel 316L. Addit. Manuf. 2021, 38, 101809. [Google Scholar] [CrossRef]
  3. Marattukalam, J.J.; Karlsson, D.; Pacheco, V.; Beran, P.; Wiklund, U.; Jansson, U.; Hjörvarsson, B.; Sahlberg, M. The effect of laser scanning strategies on texture, mechanical properties, and site-specific grain orientation in selective laser melted 316L SS. Mater. Des. 2020, 193, 108852. [Google Scholar] [CrossRef]
  4. Popovich, A.A.; Sufiiarov, V.S.; Borisov, E.V.; Polozov, I.A.; Masaylo, D.V. Design and manufacturing of tailored microstructure with selective laser melting. Mater. Phys. Mech. 2018, 38, 1–10. [Google Scholar]
  5. Sofras, C.; Čapek, J.; Li, X.; Roth, C.C.; Leinenbach, C.; Logé, R.E.; Strobl, M.; Polatidis, E. Site-specifically tailored microstructures with enhanced strength and hardening through laser powder bed fusion. Mater. Des. 2024, 237, 112539. [Google Scholar] [CrossRef]
  6. Sun, S.-H.; Ishimoto, T.; Hagihara, K.; Tsutsumi, Y.; Hanawa, T.; Nakano, T. Excellent mechanical and corrosion properties of austenitic stainless steel with a unique crystallographic lamellar microstructure via selective laser melting. Scr. Mater. 2019, 159, 89–93. [Google Scholar] [CrossRef]
  7. Gokcekaya, O.; Ishimoto, T.; Hibino, S.; Yasutomi, J.; Narushima, T.; Nakano, T. Unique crystallographic texture formation in Inconel 718 by laser powder bed fusion and its effect on mechanical anisotropy. Acta Mater. 2021, 212, 116876. [Google Scholar] [CrossRef]
  8. Popovich, V.A.; Borisov, E.V.; Popovich, A.A.; Sufiiarov, V.S.; Masaylo, D.V.; Alzina, L. Functionally graded Inconel 718 processed by additive manufacturing: Crystallographic texture, anisotropy of microstructure and mechanical properties. Mater. Des. 2017, 114, 441–449. [Google Scholar] [CrossRef]
  9. Ravichander, B.B.; Jagdale, S.H.; Jabed, A.; Kumar, G. Mechanical and corrosion behavior of sheet-based 316L TPMS structures. Int. J. Mech. Sci. 2023, 254, 108439. [Google Scholar] [CrossRef]
  10. Jeong, S.G.; Karthik, G.M.; Kim, E.S.; Zargaran, A.; Ahn, S.Y.; Sagong, M.J.; Kang, S.H.; Cho, J.-W.; Kim, H.S. Architectured heterogeneous alloys with selective laser melting. Scr. Mater. 2022, 208, 114332. [Google Scholar] [CrossRef]
  11. Sofinowski, K.; Wittwer, M.; Seita, M. Encoding data into metal alloys using laser powder bed fusion. Addit. Manuf. 2022, 52, 102683. [Google Scholar] [CrossRef]
  12. Gao, S.; Li, Z.; Van Petegem, S.; Ge, J.; Goel, S.; Vas, J.V.; Luzin, V.; Hu, Z.; Seet, H.L.; Sanchez, D.F.; et al. Additive manufacturing of alloys with programmable microstructure and properties. Nat. Commun. 2023, 14, 6752. [Google Scholar] [CrossRef] [PubMed]
  13. Davidson, K.P.; Le, T.P.; Nguyen, L.L.; Fronda, J.E.P.; Liu, R.; Meng, T.L.; Tay, Y.Y.; Seita, M. Localised control of phase formation in a high-carbon low alloy steel by laser powder bed fusion. npj Adv. Manuf. 2025, 2, 11. [Google Scholar] [CrossRef]
  14. Ravichander, B.B.; Mamidi, K.; Rajendran, V.; Farhang, B.; Ganesh-Ram, A.; Hanumantha, M.; Moghaddam, N.S.; Amerinatanzi, A. Experimental investigation of laser scan strategy on the microstructure and properties of Inconel 718 parts fabricated by laser powder bed fusion. Mater. Charact. 2022, 186, 111765. [Google Scholar] [CrossRef]
  15. Ali, H.; Ghadbeigi, H.; Mumtaz, K. Effect of scanning strategies on residual stress and mechanical properties of Selective Laser Melted Ti6Al4V. Mater. Sci. Eng. A 2018, 712, 175–187. [Google Scholar] [CrossRef]
  16. Liu, J.; Li, G.; Sun, Q.; Li, H.; Sun, J.; Wang, X. Understanding the effect of scanning strategies on the microstructure and crystallographic texture of Ti-6Al-4V alloy manufactured by laser powder bed fusion. J. Mater. Process. Technol. 2022, 299, 117366. [Google Scholar] [CrossRef]
  17. Strantza, M.; Ganeriwala, R.K.; Clausen, B.; Phan, T.Q.; Levine, L.E.; Pagan, D.C.; Ruff, J.P.C.; King, W.E.; Johnson, N.S.; Martinez, R.M.; et al. Effect of the scanning strategy on the formation of residual stresses in additively manufactured Ti-6Al-4V. Addit. Manuf. 2021, 45, 102003. [Google Scholar] [CrossRef]
  18. Carter, L.N.; Martin, C.; Withers, P.J.; Attallah, M.M. The influence of the laser scan strategy on grain structure and cracking behaviour in SLM powder-bed fabricated nickel superalloy. J. Alloys Compd. 2014, 615, 338–347. [Google Scholar] [CrossRef]
  19. Shi, R.; Khairallah, S.A.; Roehling, T.T.; Heo, T.W.; McKeown, J.T.; Matthews, M.J. Microstructural control in metal laser powder bed fusion additive manufacturing using laser beam shaping strategy. Acta Mater. 2020, 184, 284–305. [Google Scholar] [CrossRef]
  20. Nadammal, N.; Mishurova, T.; Fritsch, T.; Serrano-Munoz, I.; Kromm, A.; Haberland, C.; Portella, P.D.; Bruno, G. Critical role of scan strategies on the development of microstructure, texture, and residual stresses during laser powder bed fusion additive manufacturing. Addit. Manuf. 2021, 38, 101792. [Google Scholar] [CrossRef]
  21. Xiao, Z.; Chen, C.; Hu, Z.; Zhu, H.; Zeng, X. Effect of rescanning cycles on the characteristics of selective laser melting of Ti6Al4V. Opt. Laser Technol. 2020, 122, 105890. [Google Scholar] [CrossRef]
  22. Xiao, Z.; Lei, Y.; Hu, Z.; Chen, C.; Chen, B.; Zhu, H. Influence of rescanning parameters on selective laser melting of Ti6Al4V. J. Manuf. Process. 2022, 82, 530–542. [Google Scholar] [CrossRef]
  23. Shao, W.; He, B.; Qiu, C.; Li, Z. Effect of hatch spacing and laser remelting on the formation of unique crystallographic texture of IN718 superalloy fabricated via laser powder bed fusion. Opt. Laser Technol. 2022, 156, 108609. [Google Scholar] [CrossRef]
  24. Ravichander, B.B.; Jagdale, S.H.; Kumar, G. Interpenetrating microstructure in laser powder-bed fusion parts using selective rescanning. Addit. Manuf. Lett. 2024, 10, 100221. [Google Scholar] [CrossRef]
  25. Karimi, J.; Suryanarayana, C.; Okulov, I.; Prashanth, K.G. Selective laser melting of Ti6Al4V: Effect of laser re-melting. Mater. Sci. Eng. A 2021, 805, 140558. [Google Scholar] [CrossRef]
  26. Miao, X.; Wu, M.; Han, J.; Li, H.; Ye, X. Effect of Laser Rescanning on the Characteristics and Residual Stress of Selective Laser Melted Titanium Ti6Al4V Alloy. Materials 2020, 13, 3940. [Google Scholar] [CrossRef] [PubMed]
  27. Xu, W.; Brandt, M.; Sun, S.; Elambasseril, J.; Liu, Q.; Latham, K.; Xia, K.; Qian, M. Additive manufacturing of strong and ductile Ti–6Al–4V by selective laser melting via in situ martensite decomposition. Acta Mater. 2015, 85, 74–84. [Google Scholar] [CrossRef]
  28. Bartolomeu, F.; Gasik, M.; Silva, F.S.; Miranda, G. Mechanical Properties of Ti6Al4V Fabricated by Laser Powder Bed Fusion: A Review Focused on the Processing and Microstructural Parameters Influence on the Final Properties. Metals 2022, 12, 986. [Google Scholar] [CrossRef]
  29. Baghi, A.D.; Nafisi, S.; Ebendorff-Heidepriem, H.; Ghomashchi, R. Microstructural Development of Ti-6Al-4V Alloy via Powder Metallurgy and Laser Powder Bed Fusion. Metals 2022, 12, 1462. [Google Scholar] [CrossRef]
  30. Akbar, N.I.; Nandigama, K.; Sati, I.; Ravichander, B.B.; Kumar, G. Effect of Laser Power on the Microstructure and Fracture of Notched IN718 Specimens Fabricated by Laser Powder Bed Fusion. Metals 2025, 15, 639. [Google Scholar] [CrossRef]
  31. Li, H.; Ji, Z.; Yang, H. Quantitative characterization of lamellar and equiaxed alpha phases of (α + β) titanium alloy using a robust approach for touching features splitting. Mater. Charact. 2013, 76, 6–20. [Google Scholar] [CrossRef]
  32. Yang, J.; Yu, H.; Yin, J.; Gao, M.; Wang, Z.; Zeng, X. Formation and control of martensite in Ti-6Al-4V alloy produced by selective laser melting. Mater. Des. 2016, 108, 308–318. [Google Scholar] [CrossRef]
  33. Dai, K.; He, X.; Zhang, W.; Kong, D.; Guo, R.; Hu, M.; He, K.; Dong, C. Tailoring the microstructure and mechanical properties for Hastelloy X alloy by laser powder bed fusion via scanning strategy. Mater. Des. 2023, 235, 112386. [Google Scholar] [CrossRef]
  34. Qian, M.; Xu, W.; Brandt, M.; Tang, H.P. Additive manufacturing and postprocessing of Ti-6Al-4V for superior mechanical properties. MRS Bull. 2016, 41, 775–784. [Google Scholar] [CrossRef]
  35. Chen, Z.; Wan, J.; Li, J.; Li, J.; Wang, J. Uncovering the different roles of lack-of-fusion and keyhole defects on the tensile behavior of additively manufactured Ti-6Al-4V alloy. Addit. Manuf. 2025, 110, 104944. [Google Scholar]
  36. Tiwari, A.; Mishra, A.K.; Kumar, A. Influence of scan strategies on wear and tribological performance of Ti-6Al-4V alloy processed by laser powder bed additive manufacturing process. Wear 2025, 562–563, 205654. [Google Scholar]
  37. Ahmed, T.; Rack, H. Phase transformations during cooling in α + β titanium alloys. Mater. Sci. Eng. A 1998, 243, 206–211. [Google Scholar] [CrossRef]
  38. Javidrad, H.R.; Ghanbari, M.; Javidrad, F. Effect of scanning pattern and volumetric energy density on the properties of selective laser melting Ti-6Al-4V specimens. J. Mater. Res. Technol. 2021, 12, 989–998. [Google Scholar] [CrossRef]
  39. Vrancken, B.; Thijs, L.; Kruth, J.-P.; Van Humbeeck, J. Heat treatment of Ti6Al4V produced by Selective Laser Melting: Microstructure and mechanical properties. J. Alloys Compd. 2012, 541, 177–185. [Google Scholar] [CrossRef]
  40. He, J.; Li, D.; Jiang, W.; Ke, L.; Qin, G.; Ye, Y.; Qin, Q.; Qiu, D. The martensitic transformation and mechanical properties of Ti6Al4V prepared via selective laser melting. Materials 2019, 12, 321. [Google Scholar] [CrossRef]
Figure 1. (a) SEM micrograph of the Ti-6Al-4V powder used for L-PBF, and (b) as-fabricated samples on the titanium build plate.
Jmmp 10 00088 g001
Figure 2. Schematic representation of layer configuration in reference and selectively rescanned samples for (a) unidirectional, (b) stripes, and (c) chess scan strategies.
Jmmp 10 00088 g002
Figure 3. Porosity of reference and selectively rescanned Ti-6Al-4V samples fabricated with different scan strategies: (a) unidirectional, (b) stripes, and (c) chess.
Jmmp 10 00088 g003
Figure 4. SEM images of the reference and the rescanned regions of the selectively rescanned Ti-6Al-4V specimens fabricated with different scan strategies: (a) unidirectional, (b) stripes, and (c) chess.
Jmmp 10 00088 g004
Figure 5. Average Vickers microhardness values in reference, rescanned, and non-rescanned regions of L-PBF Ti-6Al-4V samples.
Jmmp 10 00088 g005
Table 1. The chemical composition of gas-atomized Ti-6Al-4V powder.
ElementTiAlVONCHFeY
Mass fraction (%)Bal.5.50–6.753.50–4.500.20.050.080.0150.300.005
Table 2. Processing parameters used for the reference and the selectively rescanned Ti-6Al-4V samples.
SampleLP (W)SS
(mm/s)
HD (µm)LT
(µm)
EV
(J/mm3)
Scan
Rotation
Selective Rescanning
Unidirectional34012501206038×
Stripes3401250120603867°×
Chess3401250120603867°×
Unidirectional-SR17012501206019
Stripes-SR1701250120601967°
Chess-SR1701250120601967°
Table 3. Average relative density values for the L-PBF-processed Ti-6Al-4V samples.
SampleRelative Density (%)Selective Rescanning
Unidirectional99.57 ± 0.07×
Stripes99.58 ± 0.10×
Chess99.48 ± 0.13×
Unidirectional-SR99.43 ± 0.10
Stripes-SR99.73 ± 0.06
Chess-SR99.55 ± 0.14
Table 4. Average martensitic α′ fraction and thickness values of the L-PBF-processed Ti-6Al-4V reference and selectively rescanned samples.
SampleMartensitic α′ Fraction (%)Martensitic α′ Thickness (µm)
Non-Rescanned Region Rescanned RegionNon-Rescanned Region Rescanned Region
Unidirectional22 ± 1.5-0.66 ± 0.11-
Stripes34 ± 2.50.46 ± 0.09
Chess29 ± 2.10.64 ± 0.13
Unidirectional-SR28 ± 2.236 ± 1.20.52 ± 0.080.66 ± 0.07
Stripes-SR33 ± 1.343 ± 1.70.47 ± 0.110.67 ± 0.11
Chess-SR31 ± 0.933 ± 2.00.53 ± 0.110.71 ± 0.15
Disclaimer/Publisher’s Note: The statements, opinions and data contained in all publications are solely those of the individual author(s) and contributor(s) and not of MDPI and/or the editor(s). MDPI and/or the editor(s) disclaim responsibility for any injury to people or property resulting from any ideas, methods, instructions or products referred to in the content.