Article

Autonomous Underwater Vehicle Adaptive Altitude Control Framework to Improve Image Quality

1
School of ICT, University of Tasmania, Sandy Bay, TAS 7005, Australia
2
Australian Maritime College, University of Tasmania, Newnham, TAS 7248, Australia
3
School of Computing Technologies, RMIT University, GPO Box 2476, Melbourne, VIC 3001, Australia
*
Authors to whom correspondence should be addressed.
Drones 2025, 9(9), 608; https://doi.org/10.3390/drones9090608
Submission received: 25 July 2025 / Revised: 25 August 2025 / Accepted: 26 August 2025 / Published: 29 August 2025
(This article belongs to the Section Unmanned Surface and Underwater Drones)

Abstract

Autonomous underwater vehicles (AUVs) play a pivotal role in the exploration and monitoring of the sea floor. A primary challenge in surveying AUVs is consistently obtaining high-quality optical imagery data. A major cause of quality reduction is turbid water, which both attenuates and scatters light. The effects of turbidity can be minimized by lowering the operational altitude of the AUV, at the cost of increased survey duration and cost. Consequently, before conducting a survey, a trade-off must be made between the risk of acquiring suboptimal images and the additional time required to cover an area. In this research, we develop a computer-vision-based technique and control system that dynamically adjusts the altitude of an AUV based on real-time estimates of turbidity from collected images. Our testing in a simulated environment demonstrates that this system reliably improves the efficiency and quality of image collection.

1. Introduction

Autonomous underwater vehicles (AUVs) are free-swimming uncrewed robots. They operate independently of any external control or communication and follow pre-planned routes. AUVs are used in many sectors including environmental research, industry, and defense [1]. In these sectors, they serve many functions, such as surveying, cable inspection, and searching for naval mines. In this paper, we focus on underwater surveys. This involves taking images (optical and sonar) of the sea floor as well as recording other environmental properties such as salinity and temperature. Data collected during this process has a multitude of scientific applications.
Optical images of the sea floor are frequently collected in many of the roles undertaken by AUVs. While some AUVs use multi-spectral or RGB (Red, Green, Blue) color cameras, many use grayscale cameras. This is because grayscale cameras have better low-light performance. Additionally, many AUV use-cases do not require RGB color information. In comparison to sonar images, optical images have several benefits. They have a higher spatial resolution than sonar images, allowing for more information to be collected. Additionally, feature recognition surveys often require light reflectance values, which is something that cannot be provided by imaging sonar. However, optical images do have several limitations, most notably, the quality of optical images can be severely affected by turbid water, unlike in sonar images. Turbidity is the reduction of clarity in water, primarily caused by the increase in scattering and attenuation from contaminants in water [2,3]. These contaminants are a combination of particulate matter, such as sand and silt, along with organic matter such as algae or plankton. Exactly how these contaminants affect turbidity depends on many other factors, including temperature, pressure, and salinity [4].
There are also numerous factors other than turbidity that diminish the value of collected image data, such as lighting conditions, motion blur, and parallax effects (which can make stitching images more challenging). However, in this paper, we will focus on addressing the effects of turbidity. Images more strongly affected by turbidity have far lower contrast, resulting in a loss of useful information. Reflective or light-colored objects within the image will often have a halo around them, which will obscure the surrounding area [5]. Colors are heavily distorted, adding uncertainty in the collected data. The light from the AUV is attenuated by turbid water, resulting in the need to increase either the exposure time or the gain of the camera. Consequently, this adds either unwanted motion blur or noise to collected images. The exact impact of turbidity on the optical quality of water can be measured using Jerlov water types. The Jerlov classification system defines 10 water types. In order of increasing turbidity, these are: I, IA, IB, II, and III for oceanic water, and 1C, 3C, 5C, 7C, and 9C for coastal water [6]. Examples can be seen in Figure A1 and Figure A2.
As both the effects of attenuation and scattering are exacerbated by greater distances between the camera/light source and the sea floor [7], the effects of turbid water can be reduced by operating the AUV at a lower altitude. Doing so has the consequence of a lower volume of water between the AUV’s camera and the sea floor. Now, to cover the same area, the AUV needs to carry out additional survey passes. This increases the duration of the survey, increasing costs and subjecting the AUV to additional risk.
Currently, the path followed during these surveys is generated manually through an iterative process [8]. This involves having the AUV undertake only the very first part of the planned mission, then backtrack, and return back to the operator. The operator will then make adjustments to the planned route and then send the AUV to perform a slightly larger portion of the plan. This is repeated until the operator decides that it is safe to conduct the complete survey. This process is time consuming and costly.
The exact turbidity conditions of the environment are not always known when planning the mission, and may change over time, or in different areas [9]. This makes it difficult to plan the ideal altitude at which the AUV should operate. To collect images of consistently sufficient quality, the plan could be dynamically changed according to environmental conditions. To the best of our knowledge, very little work has been done to dynamically vary the navigation plan to reduce turbidity effects.
We address this by dynamically altering the altitude of the AUV to improve the quality of collected images, such that the survey time is not increased. Our system involves three stages: Firstly, the debris removal preprocessing stage, secondly, our D-L method which calculates how strongly images are affected by turbidity, and finally, a control stage, to generate a new target altitude for the AUV.
Our system will be developed in the context of the Australian Maritime College’s (AMC’s) nupiri muka AUV. This is a 7.5 m long torpedo-shaped AUV, capable of diving to 5000 m, with an endurance of 20–40 h. It is equipped with a grayscale camera, is under-actuated, and is used in many remote environments, including under ice shelves.
Section 2 presents a brief overview of related work in the area of improving the quality of underwater imaging. Section 3 describes the problem scenario and the proposed system, used to estimate the turbidity and dynamically change the AUV’s altitude. Section 4 evaluates the effectiveness of the proposed approach using a realistic simulation model. Finally, we conclude this article in Section 5 with some future work.

2. Related Work

The literature review focuses on illustrating existing ways of controlling AUVs based on image sensor data to minimize the effects of water turbidity. In this section, we present a brief overview of the current state of art in dynamic navigation plan generation, with literature focused on underwater image quality evaluation and improvement.

2.1. Dynamic Plan Generation

Here, we describe path generation or alteration techniques found as part of the review.
Many of the papers found as part of our review focused on topics such as following a reference path [10] or pre-set waypoints [11], adapting to water currents [12], and navigating around terrain features [13,14]. Some of the less relevant papers cover topics such as vehicle rendezvous [15] or navigation around underwater structures [16,17]. Furthermore, most of the papers covered obstacle avoidance techniques [11,12,13,14,15,18,19].
The most closely related article we found as part of our review was from Lee et al. [17]. In their article, they develop a system to improve the acquisition of fishery net inspection images. It uses a convolutional neural network (CNN) to alter the distance between the AUV and the netting, enabling it to collect better images. Although a CNN does function in this application, we opted against using one, due to their poor compatibility with our chosen turbidity measurement technique.
Additionally, the control system presented by Lee et al. differs from the requirements of our control system in several ways. Our system must be able to tolerate changes between the distance between the AUV and the seafloor. This distance can change unpredictably due to topographical variations. This is compounded by the larger size and limited maneuverability of surveying AUVs. As such, our control system must be able to determine an accurate target altitude immediately, as it will not necessarily have time to converge naturally, as is done by Lee et al. [17].
From our review, we found articles that cover many related topics. However, to the best of our knowledge, there are no works that are capable of optimizing the mission plan of a surveying AUV to minimize the effects of turbidity on underwater images.

2.2. Underwater Image Quality

As determining the quality of underwater images is a critical part of our methodology, we reviewed the works that focus on specifically evaluating the quality of the water given grayscale images. From this review, we found several different techniques for determining the quality/turbidity of images. These techniques can be divided into traditional techniques and AI techniques.

2.2.1. Traditional Techniques

Most of the traditional techniques we found were to reduce the effects of turbidity in images, rather than just measuring these turbidity effects. Despite that, these techniques can potentially still be used to calculate the turbidity by comparing the original turbid image with the resultant low turbidity image from the turbidity reduction algorithm.
A commonly described technique is dark channel prior (DCP) [20]. This functions by creating a new grayscale image with the value of each pixel set to the value of the darkest channel of each pixel in a set radius of the corresponding pixel in the source image. The resulting image is less affected by turbidity and can be compared with the original image to roughly determine the turbidity/haze at that location. While DCP is primarily designed for use above water, changes can be made to DCP to make it work more effectively in underwater environments [21,22]. Unfortunately, DCP will not work for our use case, as it requires multiple color channels.
Several papers [23,24] describe that the Laplace operator (n-dimensional, second-order derivative) can be useful in determining the amount of haze/turbidity in images. Similarly, the gradient from something such as the Sobel operator may also be used [17]. As these techniques are not reliant on multiple image channels, we determined that Laplacian based techniques may be suitable.
Another plausible technique referenced by several other papers [3,25,26,27], is to analyze the spatial frequency distribution of the image, such as with a Fourier transform, or a discrete cosine transform (DCT). Turbid water generally will reduce the higher frequency components of the image, while leaving the lower frequency components intact.

2.2.2. AI Techniques

There were also several AI-based techniques for estimating water turbidity. Most of these AI models were specifically designed for images taken outside of the water, such as from the surface, a satellite, or a photo of the water in a bottle [28,29,30,31]. Many also required specific conditions, such as controlled lighting.
The work presented by Rudy et al. [32] is most closely related to our scope. They presented an AI algorithm called Turbidivision [32], which is a convolutional neural network (CNN) model based on YOLOv8 [33]. Turbidivision should not require specific lighting or any other special conditions and can determine the turbidity of water with rather high accuracy. However, our focus is on determining the effects of turbidity on image quality, rather than determining the absolute turbidity. Additionally, Turbidivision is designed for color images.
Based on the above literature review, we were unable to find any algorithms capable of reliably estimating the effects of turbidity on captured images. We were also unable to find any algorithms capable of dynamically altering the navigation plan of AUVs, given the quality score. To address this gap, we proposed a novel control system that dynamically adjusts the altitude of an AUV to capture the high-quality image data.

3. Problem Scenario and Proposed Methods

In this paper, we assume the AUV is equipped with a grayscale camera and altimeter. We consider that the AUV will navigate in the varying quality of water, e.g., from high turbidity to low turbidity. An initial navigation plan will be given to guide the AUV’s movement underwater. The aim of our proposed control system is to dynamically alter the altitude of the AUV. This allows high-quality images to be captured while maximizing the AUV’s coverage area. Decreasing the duration of the survey can also, in turn, lower the cost of deployment.
The proposed system consists of three stages, as shown in Figure 1. These are the preprocessing stage, where collected images are cleaned up such that they contain fewer debris or other artifacts that may interfere with the next stage; the turbidity estimation stage, where the turbidity effects present in the clean images are calculated; and finally, the control stage, where the image scores are combined with sensor readings to determine a new target altitude for the AUV. The new target altitude is then sent to the navigation system of the AUV. Our system requires minimal sensor inputs. Specifically, it requires an image from a camera, and the current altitude from an altimeter. The altitude reading is used to allow calculation of an absolute target altitude, rather than a relative one. This allows the AUV to more rapidly reach the point of optimal image quality.

3.1. Image Preprocessing

In captured images, in addition to turbidity, there are other types of artifacts which can affect image quality, such as suspended particles. The first step is to remove these as much as possible from the image. This process is done through several stages of traditional image manipulation. This process uses elements similar to already established image restoration techniques [34,35].
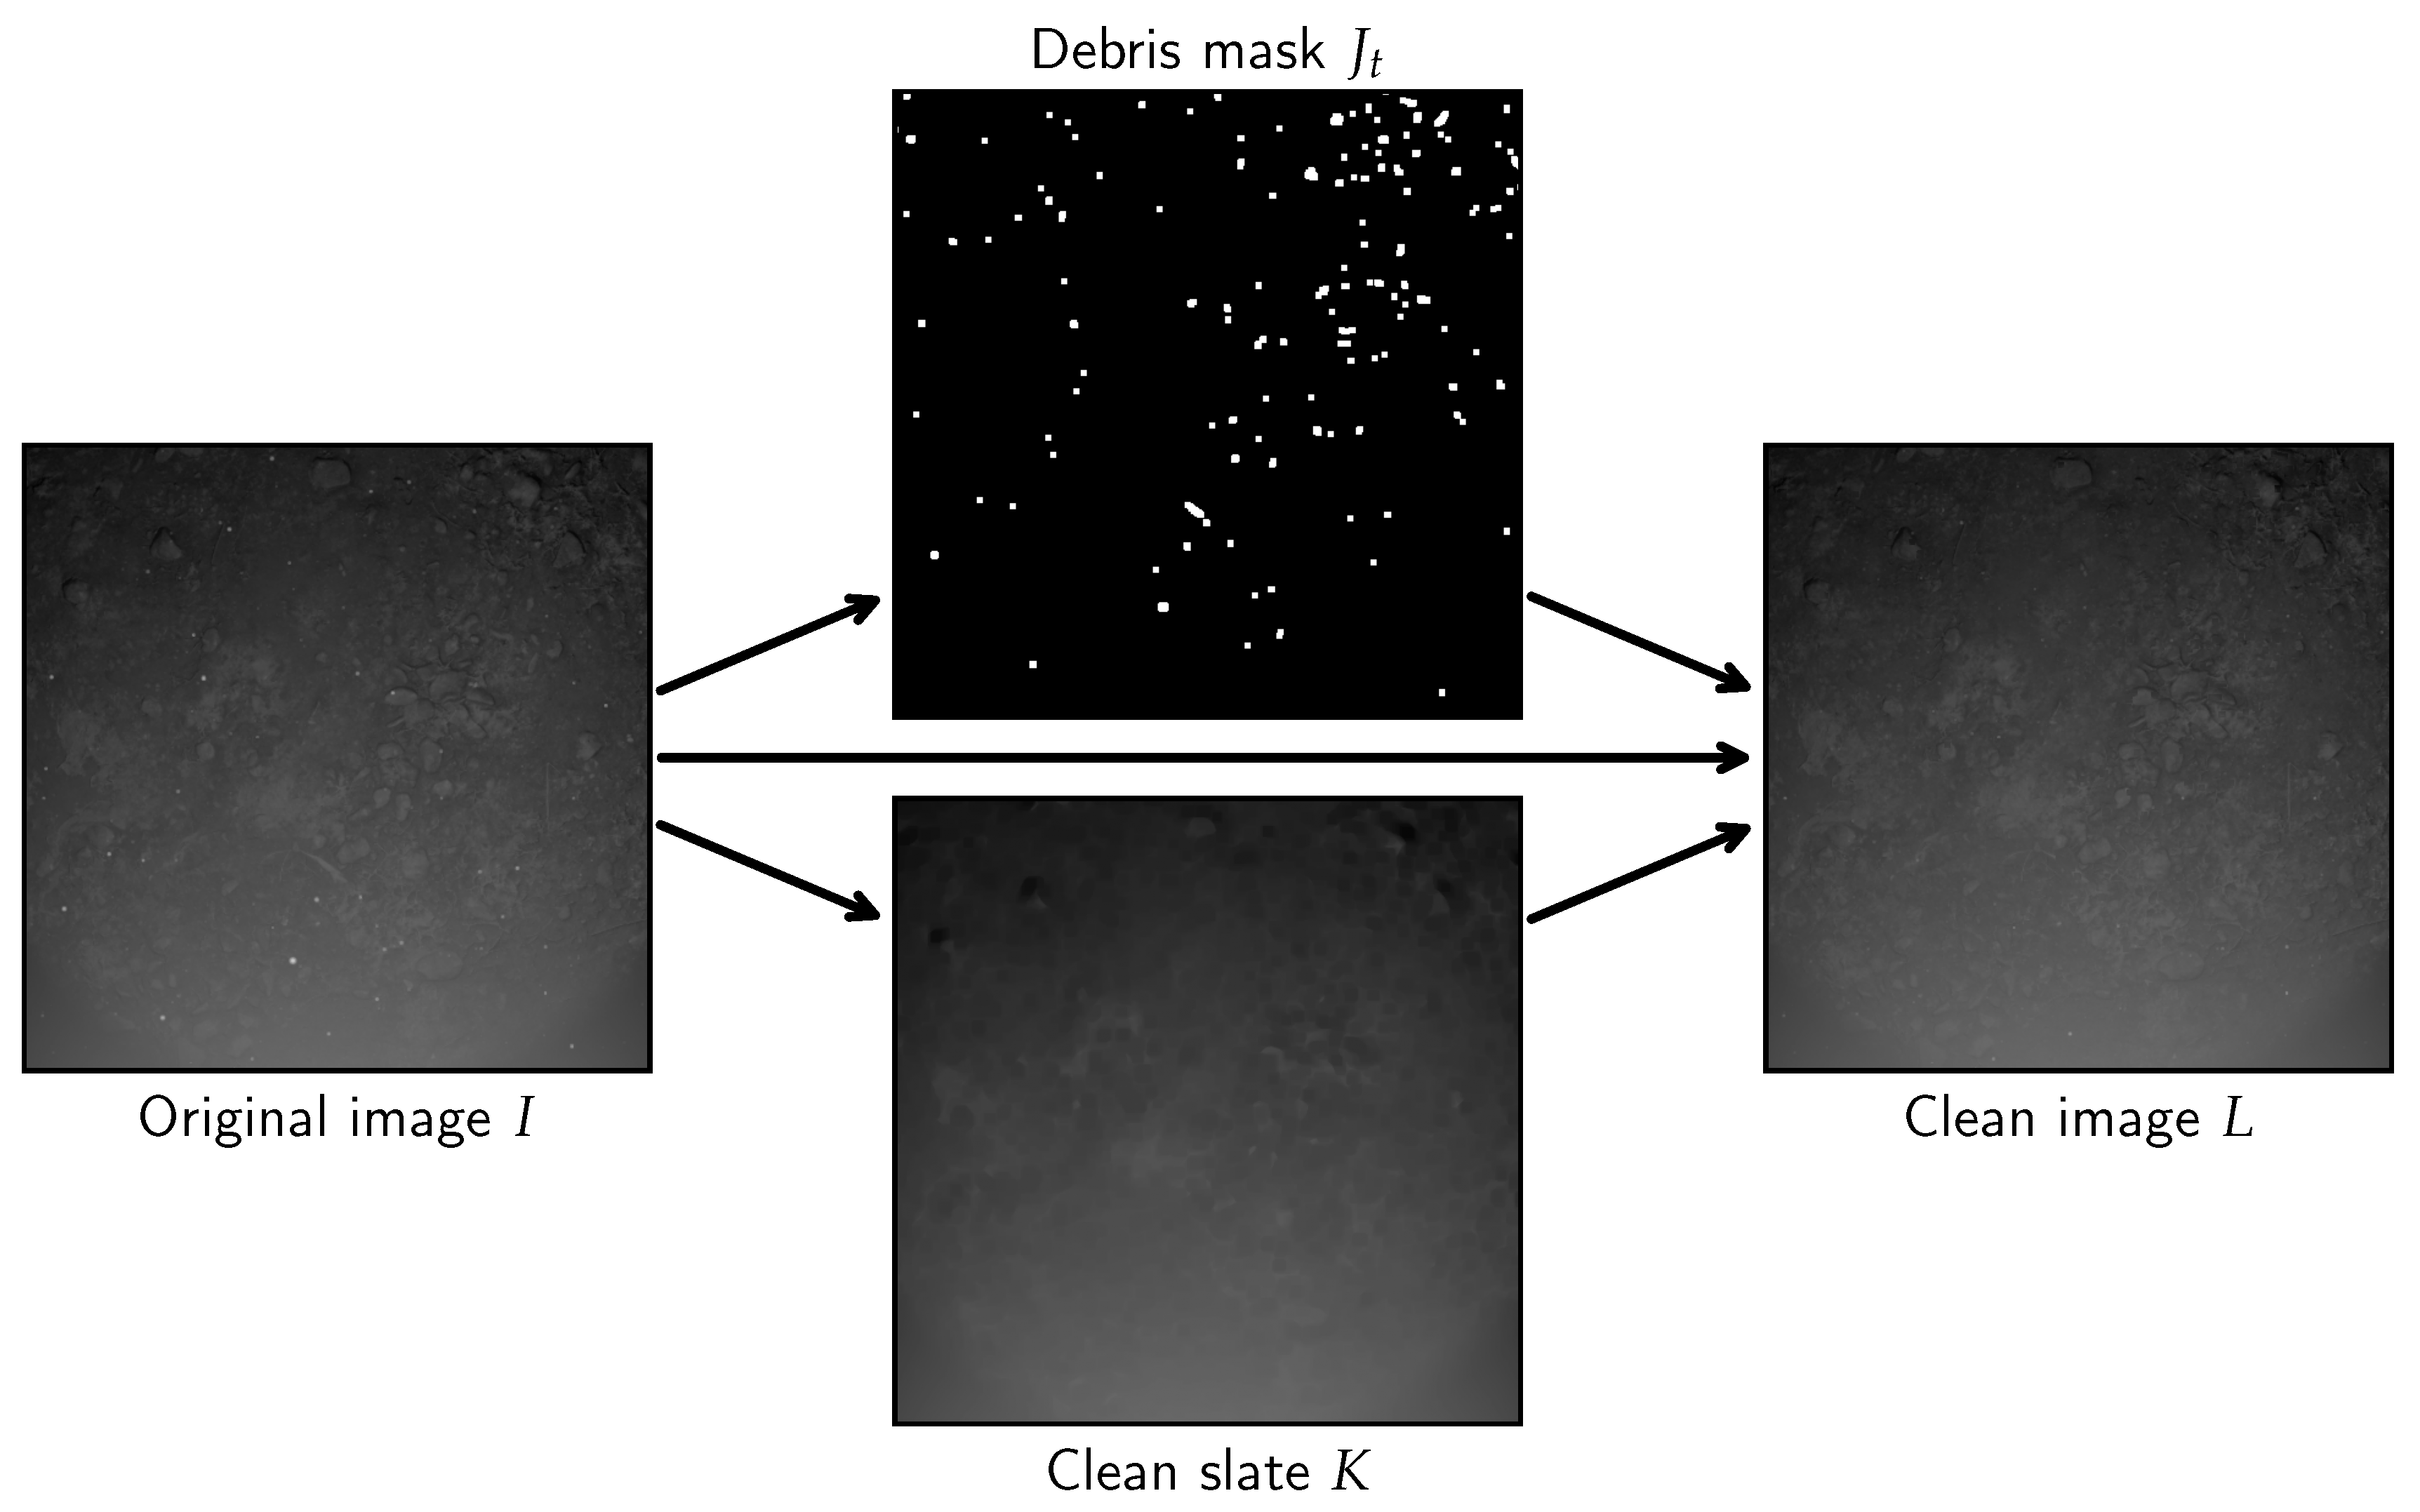
Starting with the source image I ( x , y ) , a mask J ( x , y ) is created, highlighting the locations of each piece of debris. This mask is generated by blurring I, using a median blur filter with kernel α , and subtracting it from I, leaving only high frequency elements. A grayscale erode ⊖ and a grayscale dilate ⊕ are then applied to the resultant image, with the dilation having a larger kernel γ size than the erode β . Doing so will remove noise and texture variation spots from the mask, as well as expanding the mask elements to be slightly larger than they were before the erode. This allows any missed edges of the particles to be covered.
J ( x , y ) = I ( x , y ) median ( u , v ) α x y ( I ( u , v ) ) β γ
Subsequently, a threshold is applied to J, thus, creating a binary image J t ( x , y ) only containing elements above the set threshold t.
J t ( x , y ) = 0 J ( x , y ) t 1 J ( x , y ) > t
A clean slate image K ( x , y ) containing minimal details is created. K is created by applying a median blur with kernel δ to the original image and then applying an erosion with kernel ε . This will remove most of the details within the image, including bright outliers.
K ( x , y ) = median ( u , v ) δ x y ( I ( u , v ) ) ε
Finally, a useful, clean version of the image L ( x , y ) is created. This is done by replacing parts of the original image I with the clean-slate K, based on the value of the mask J t .
L ( x , y ) = I ( x , y ) J t ( x , y ) 1 K ( x , y ) J t ( x , y ) = 1
This process results in an image lacking most of the debris particles, but is otherwise intact. A diagram of the described process can be seen in Figure 2.
As this process is designed to remove particles that are visibly brighter than the surroundings, it cannot directly remove particles that are darker than the background. However, darker particles can be removed by inverting I, applying the technique, and then inverting the result.

3.2. Image Quality Estimation

In this section, we present our proposed D-L Algorithm, which calculates the image quality by combining the advantages of two independent methods, one based on the discrete cosine transform (DCT) and the other based on the Laplace transform.

3.2.1. DCT Based Method

The first method is based around the DCT and generally provides consistent results. However, it handles unfocused images poorly. This method is based on measuring the frequency domain of the image.
Two independent median blurs are applied to L. The resultant image from the larger blur kernel η is then subtracted from the one with a smaller kernel ζ . The result of this is then passed through a DCT, creating a 2D image M ( x , y ) of height and width θ . With the values in each row of this image representing the distribution of frequencies in the corresponding row of the input image.
M x , y = dct median ( u , v ) ζ x y L u , v median ( u , v ) η x y L u , v
Next, this is converted to a 1D list of frequencies. This could be done by averaging all the values in each column. However, if there is any significant shadow over a portion of the source image, the result will be affected. To combat this, only the highest λ portion of values in each column will be used to create the average. This averaging gives a list N x , containing the magnitude of each of the different frequency components of the image.
N ( x ) = y = 1 λ θ sort M x , y λ θ
To select the appropriate frequencies, N x can be multiplied by w ( x ) a weight function (weighted more strongly to the middle frequencies), for all frequencies x N : x θ . To correct for the number of frequency bins and make the results comparable with the Laplacian based method, the DCT size θ is divided by the sum of all the weighted frequencies. It is then multiplied and added with two correction constants μ and ξ , giving the final score of this method O.
O = θ x = 1 θ N ( x ) w x μ + ξ

3.2.2. Laplacian Based Method

For the second method P, the variance, of the Laplacian 2 , of L is calculated. Our first correction constant is then divided by the variance, this is then multiplied and added with our other two correction constants ϖ and ρ .
P = 1 Var ( 2 L ) ϖ + ρ
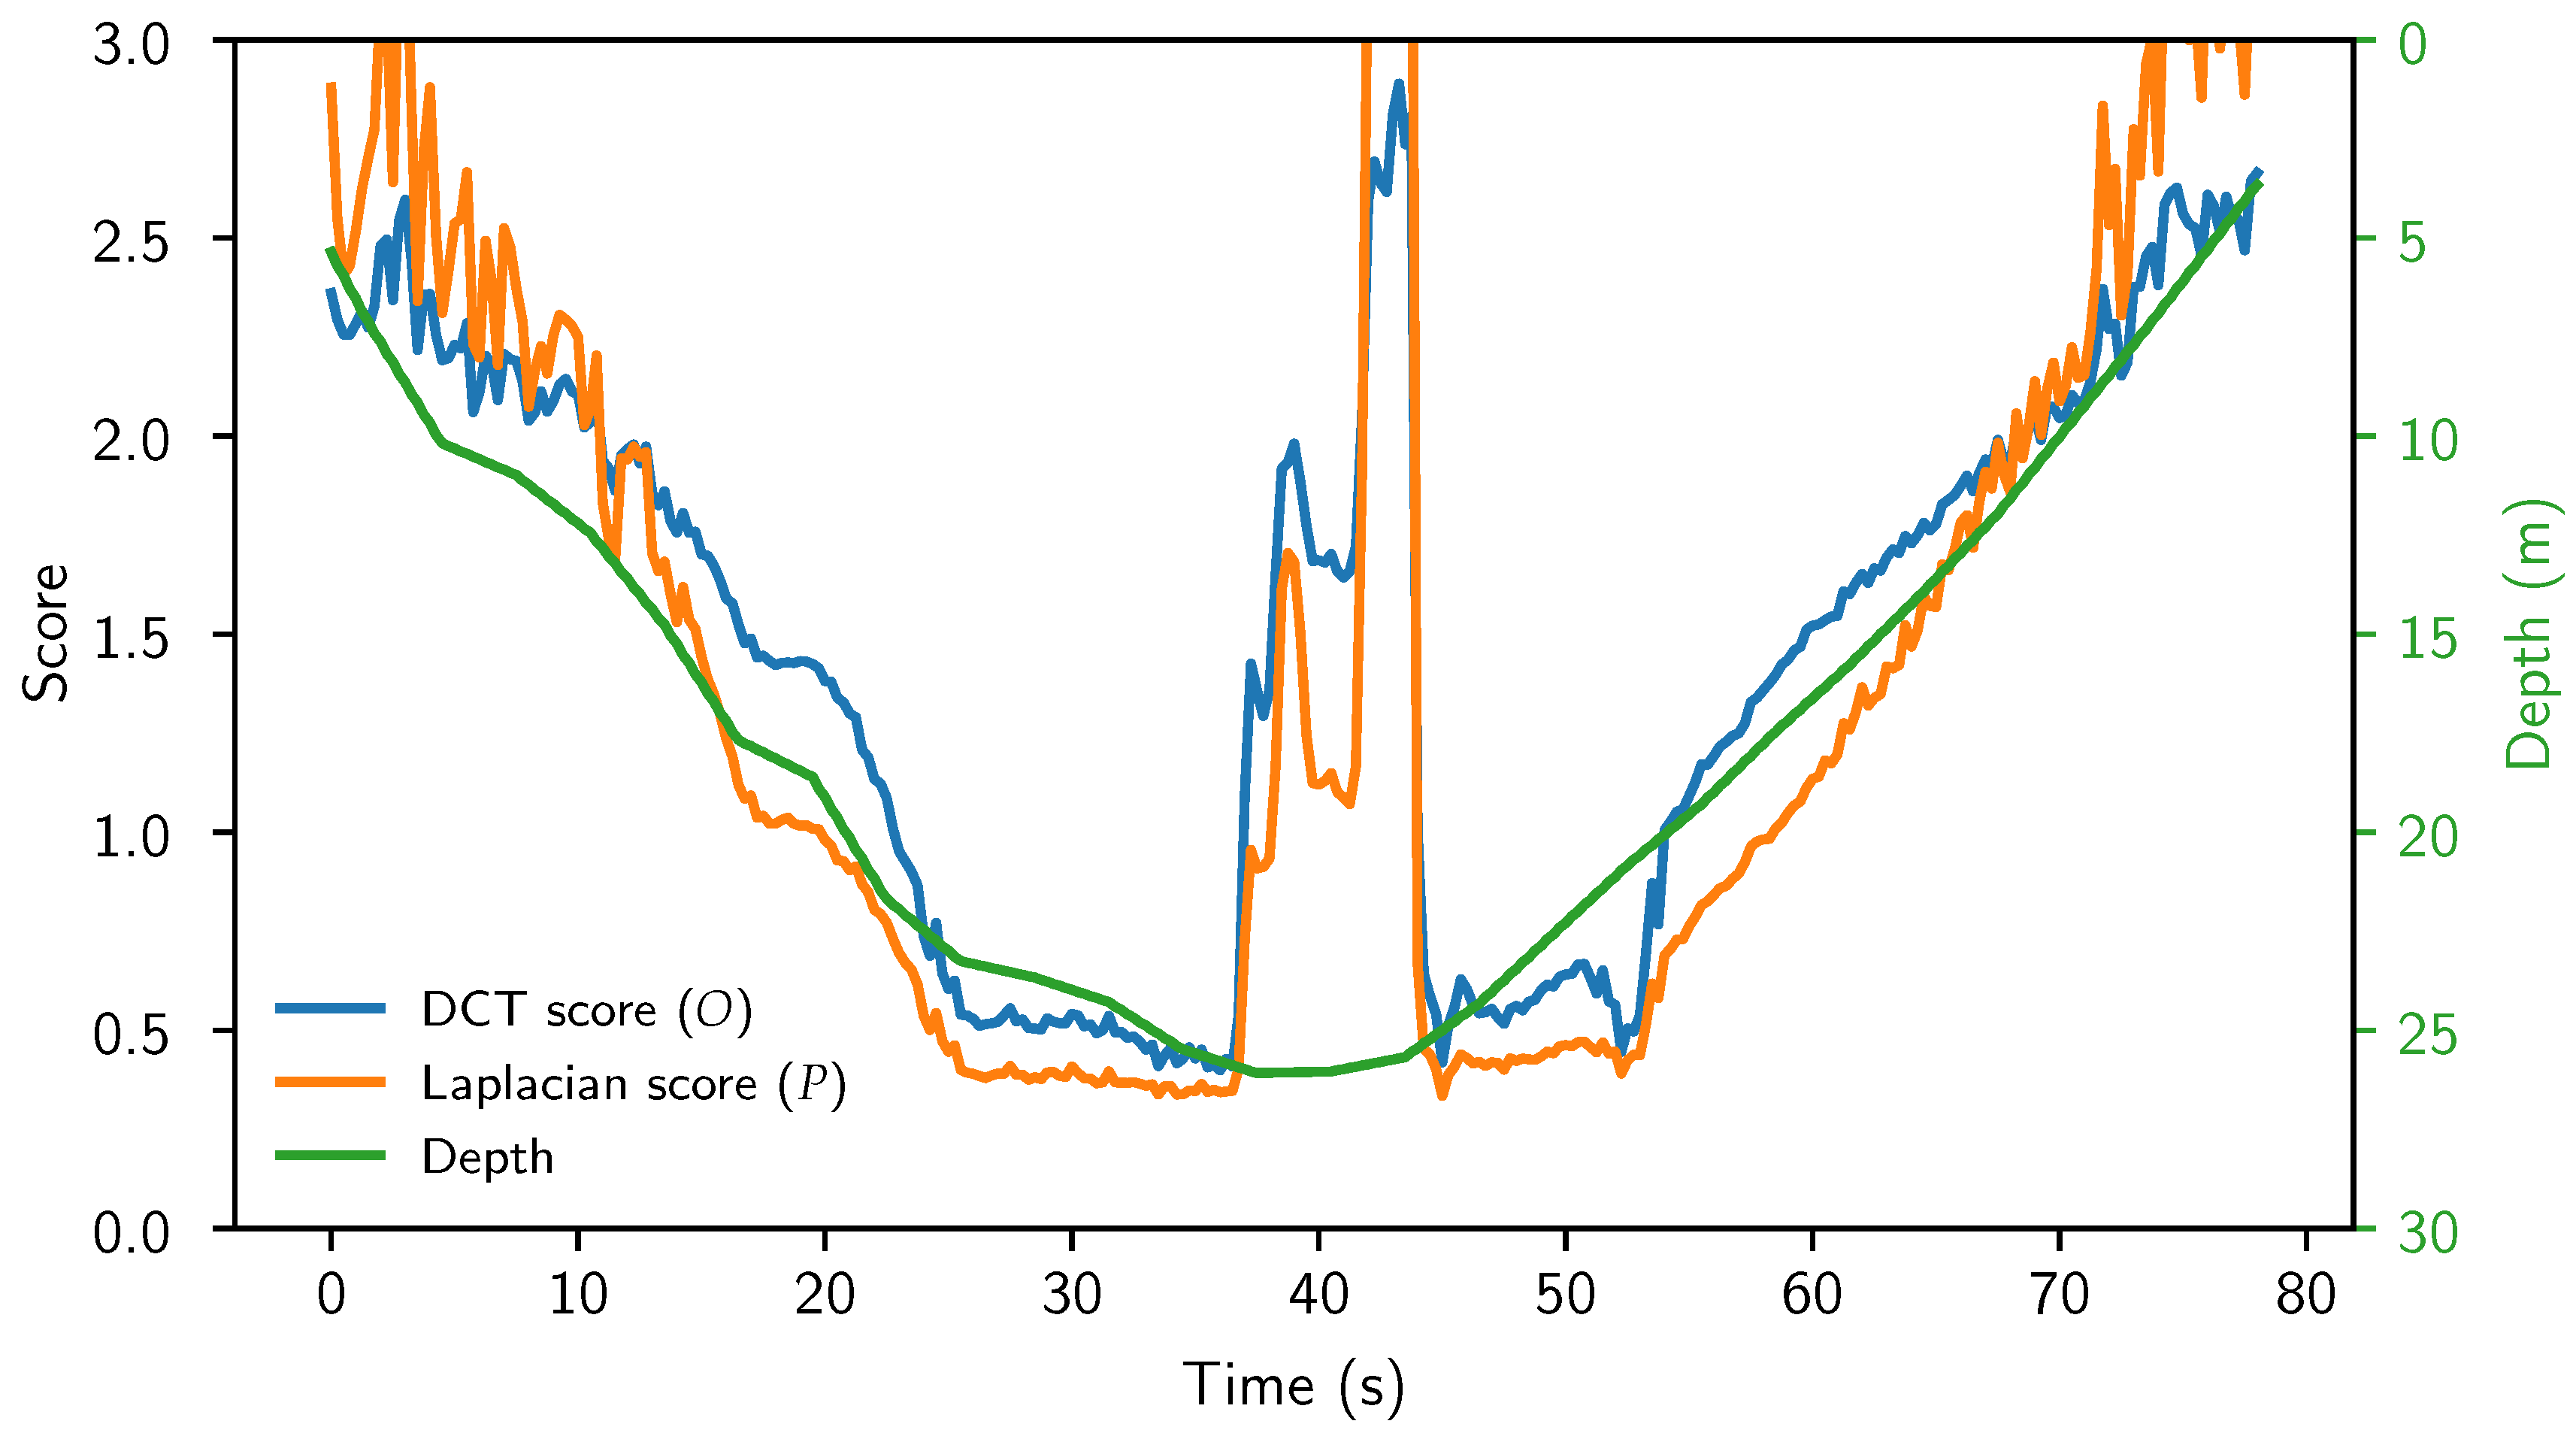
In Figure 3 we can see how the DCT and Laplace based algorithms compare. Note, lower scores correspond to higher quality images. This graph consists of the scores generated by the DCT and Laplacian based algorithms from a series of images taken as part of an unpublished underwater survey in Orford, Tasmania. The images were collected by a GoPro that was lowered into the ocean. The depth reading is from a CTD (Conductivity Temperature Depth) sensor attached to the GoPro.
We can see that in deeper areas (center of figure) the Laplacian based algorithm is less affected than the DCT algorithm by focus issues near the seafloor. However, when further from the sea floor, the DCT algorithm performs better, having less noise in its estimation. The spike in both techniques from ∼35–45 s is due to the camera’s view being obstructed by the seafloor as they collide.

3.2.3. Proposed Method for Image Quality Estimation (D-L Method)

As we mentioned earlier, each of the methods has its advantages; therefore, we propose the D-L Method to combine the results of both methods. In our proposed method, the final image quality score Q is computed using a weighted average of the results of the two methods. From testing, we determined that applying a higher weight σ to the lower of the two values leads to better results.
Q = σ O + ( 1 σ ) P O < P σ P + ( 1 σ ) O O P
Values of Q higher than 1 represent images with unacceptably high levels of turbidity, and values less than 1 represent images with acceptable image quality. While values less than 1 are acceptable in quality, to optimize for faster surveys, the AUV should still rise to a higher altitude such that the score of new images is close to 1. The correction constants μ , ξ , ϖ and ρ can be adjusted such that O = P = Q = 1 where I is an image that has the desired amount of turbidity effects.

3.2.4. Control Algorithm

To determine the AUV’s target operating altitude, we used the following process:
Our algorithm consists of dividing the current measured altitude a by the image quality score Q, giving us a rudimentary target altitude a r .
a r = a Q a s = a m i n a m i n > a r a r a m i n a r a m a x a m a x a m a x < a r
a r is then restricted to a pre-defined “safe operating range” ( a m i n , a m a x ) , giving a s . A rolling average of the b most recent a s values is then calculated, giving us our final target altitude a t . The target altitude is then transmitted to the AUV’s control system.

3.3. Hyperparameter Selection

To determine the values of hyperparameters used in our system, a manual approach was used. While such an approach is not optimal, it allows for flexibility in algorithm design and does not require the development of a complicated classification system or labeled training dataset. Additionally, due to the nature of our framework, the optimal value for most hyperparameters is unlikely to differ as hyperparameters used in the later stages of the framework are changed, making our system well suited to manual tuning.
To select the values of our hyperparameters, we utilized real images collected as part of the Orford survey, as well as simulated images from our 3840 image dataset described in Section 4.3.2.
The values of α , β , γ , δ , ε , ζ , and η were all specifically chosen assuming a 512 × 512 px image and a FOV (field of view) of 65°. If the resolution or FOV are changed, these constants will likely need to be changed as well. Furthermore, if the speed of the AUV is significantly increased above 1 ms 1 , or if images are no longer collected at a rate of 2.5 Hz, the averaging period t may need to be altered.

3.3.1. Debris Removal Related Parameters

To determine α , β , and γ , we chose values such that J would highlight as much debris as possible, while highlighting as little of the terrain as possible. The value of t was chosen such that any substantial highlights in J are included in J t , while any noise highlights are excluded.
We chose the values of δ and ε , such that K has no visible debris, while trying to retain large-scale terrain details.

3.3.2. Image Quality Estimation Parameters

The initial value for ζ was chosen such that the median blur would remove fine surface details (<∼1 cm), while still keeping macro-scale details (>∼1 cm) such as rocks. The value of η was chosen such that the median blur would remove as much surface detail (<50 cm) while still keeping ambient light data intact (>50 cm).
The value of 0.1 for λ was chosen as it removes areas in shadow while retaining most of the useful data. Changes to λ did not result in any significant beneficial changes to O, and as a result it did not require tuning.
We adjusted the position and width of our window function so that its peak covered the frequencies that were most significantly affected by water quality. Subsequently, the position and width were manually tuned to further increase the correlation between O and the turbidity level in the evaluation images.
For the initial values of O’s correction constants, we chose 0 for ξ as we did not expect to need a bias at this stage. We selected 20 for μ as it resulted in a reasonable trade-off between image turbidity and coverage.
We chose the correction constants for P, such that scores from P generally matched those of O. ϖ and ρ were tuned so that P’s higher scores were slightly higher than that of O and P’s low scores were slightly lower than O’s. This allows the weighted averaging in Q to take advantage of the lower noise of O, and the better low-altitude performance of P.
To determine the value of σ we evaluated Q with σ values from 0.1 to 0.9 using an interval of 0.1. From this testing we determined that 0.7 produced the most consistent results.

3.3.3. Control Parameters

We chose 2 m for our minimum safe altitude, and 15 m for our maximum safe altitude, as AUVs conducting optical image based surveys will typically operate within these bounds. The primary purpose of b is to minimise noise in our target altitudes and prevent oscillations. To determine its value we started with a period of one reading, and increased it until there was minimal oscillation in target altitude.

4. Evaluation and Results

4.1. Evaluation Environment

To evaluate our proposed system, we chose to use a combination of simulated and real-world data. Using a simulation environment provides a more customizable and repeatable environment, whereas the real-world data provides a more complete picture of exactly how our model will work in practice. For the simulation environment to be useful it needs to meet the following requirements:
1.
It must support simulation of underwater environments.
2.
It must be able to produce images with physically accurate turbidity effects.
3.
It must support dynamic (movable) underwater lighting.
4.
It would ideally be compatible with the ROS (Robot Operating System).
After conducting a literature review, we found several potentially suitable simulation environments. These were: Project DAVE [36], UNAV-SIM [37], Stonefish [38], and HoloOcean [39].
Project Dave and its predecessor UUV Simulator [40] are frameworks that expand on the capabilities of the ROS simulator Gazebo. Both simulators have accurate underwater physics; however, their graphics capabilities are very limited, and do not support rendering of any complex lighting or turbidity effects.
Another simulator, UNAV-SIM, has acceptable underwater lighting effects and also supports ROS integration. As it is based on Unreal Engine, it consumes a significant amount of computational resources.
Like UNAV-SIM, HoloOcean [39] is based on Unreal Engine. It has realistic looking graphics and supports a range of sensors. Environments and AUVs are created using the Unreal Engine editor. As with UNAV-SIM, the Unreal Engine environment provides a rather large overhead in both performance and installation size.
Stonefish [38] is a C++ underwater simulation library. It has excellent simulation of underwater lighting, even using real-world units (Jerlov water types [2]). In addition to having comprehensive turbidity simulation, it also has optional oceanic debris particles to add to the realism. It supports movable lights and has ROS integration. The environment and AUV are specified by an easy to configure URDF [41] file.
Among these four simulators, we chose Stonefish to simulate our experimental environment due to its support for very realistic turbidity effects, high performance, comparatively low resource requirements, and high flexibility.

4.2. Evaluation Methodology

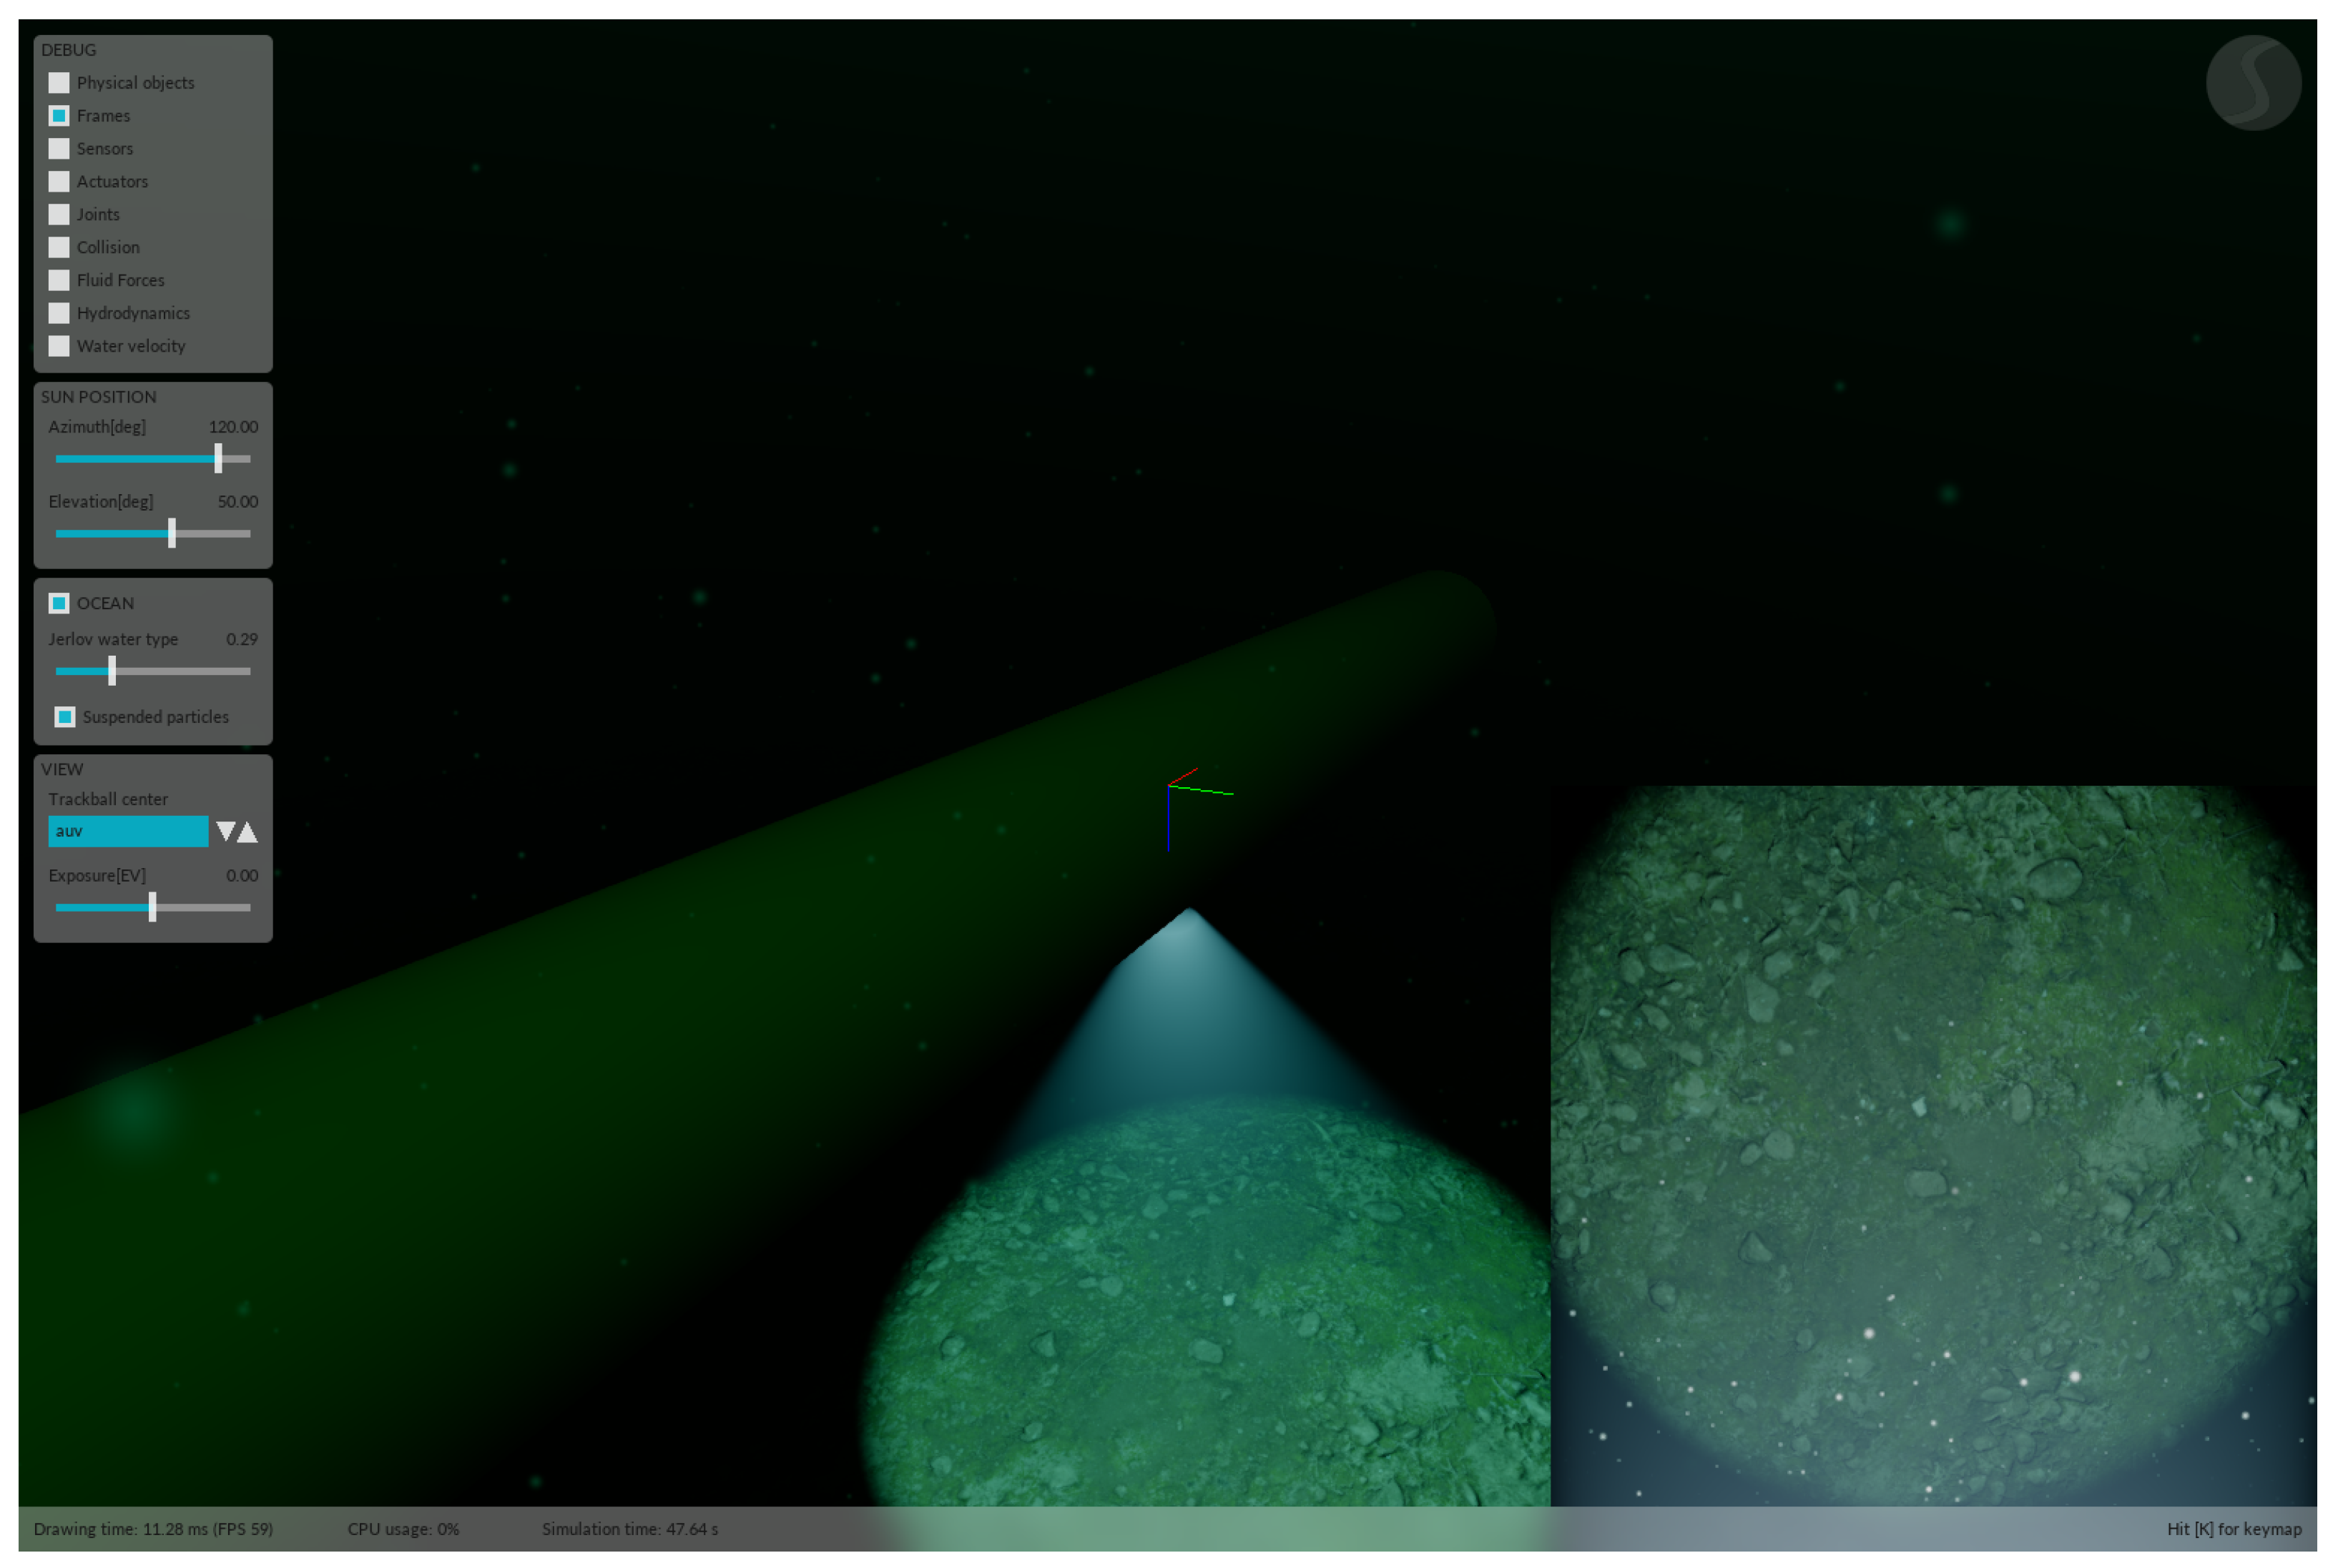
To evaluate the performance of our system we utilized the Stonefish simulation environment. In this simulation environment, we created a virtual AUV, based upon the nupiri muka. The simulated AUV’s thrusters are controlled by a basic PD controller and an ultrasonic rangefinder, allowing the AUV to maintain a target altitude above the seafloor. This, in conjunction with the physics simulation capabilities of Stonefish, enables the AUV to have physically accurate motion. An example of our simulation environment can be seen in Figure 4.
There are two main goals in the evaluation of the proposed AUV control system. The first is to prove the efficacy of our D-L method in reliably determining the quality of images. The second goal is to evaluate the performance of the proposed vehicle control algorithm in determining the ideal operating altitude of the AUV.

4.3. Evaluation Results

4.3.1. Debris Removal

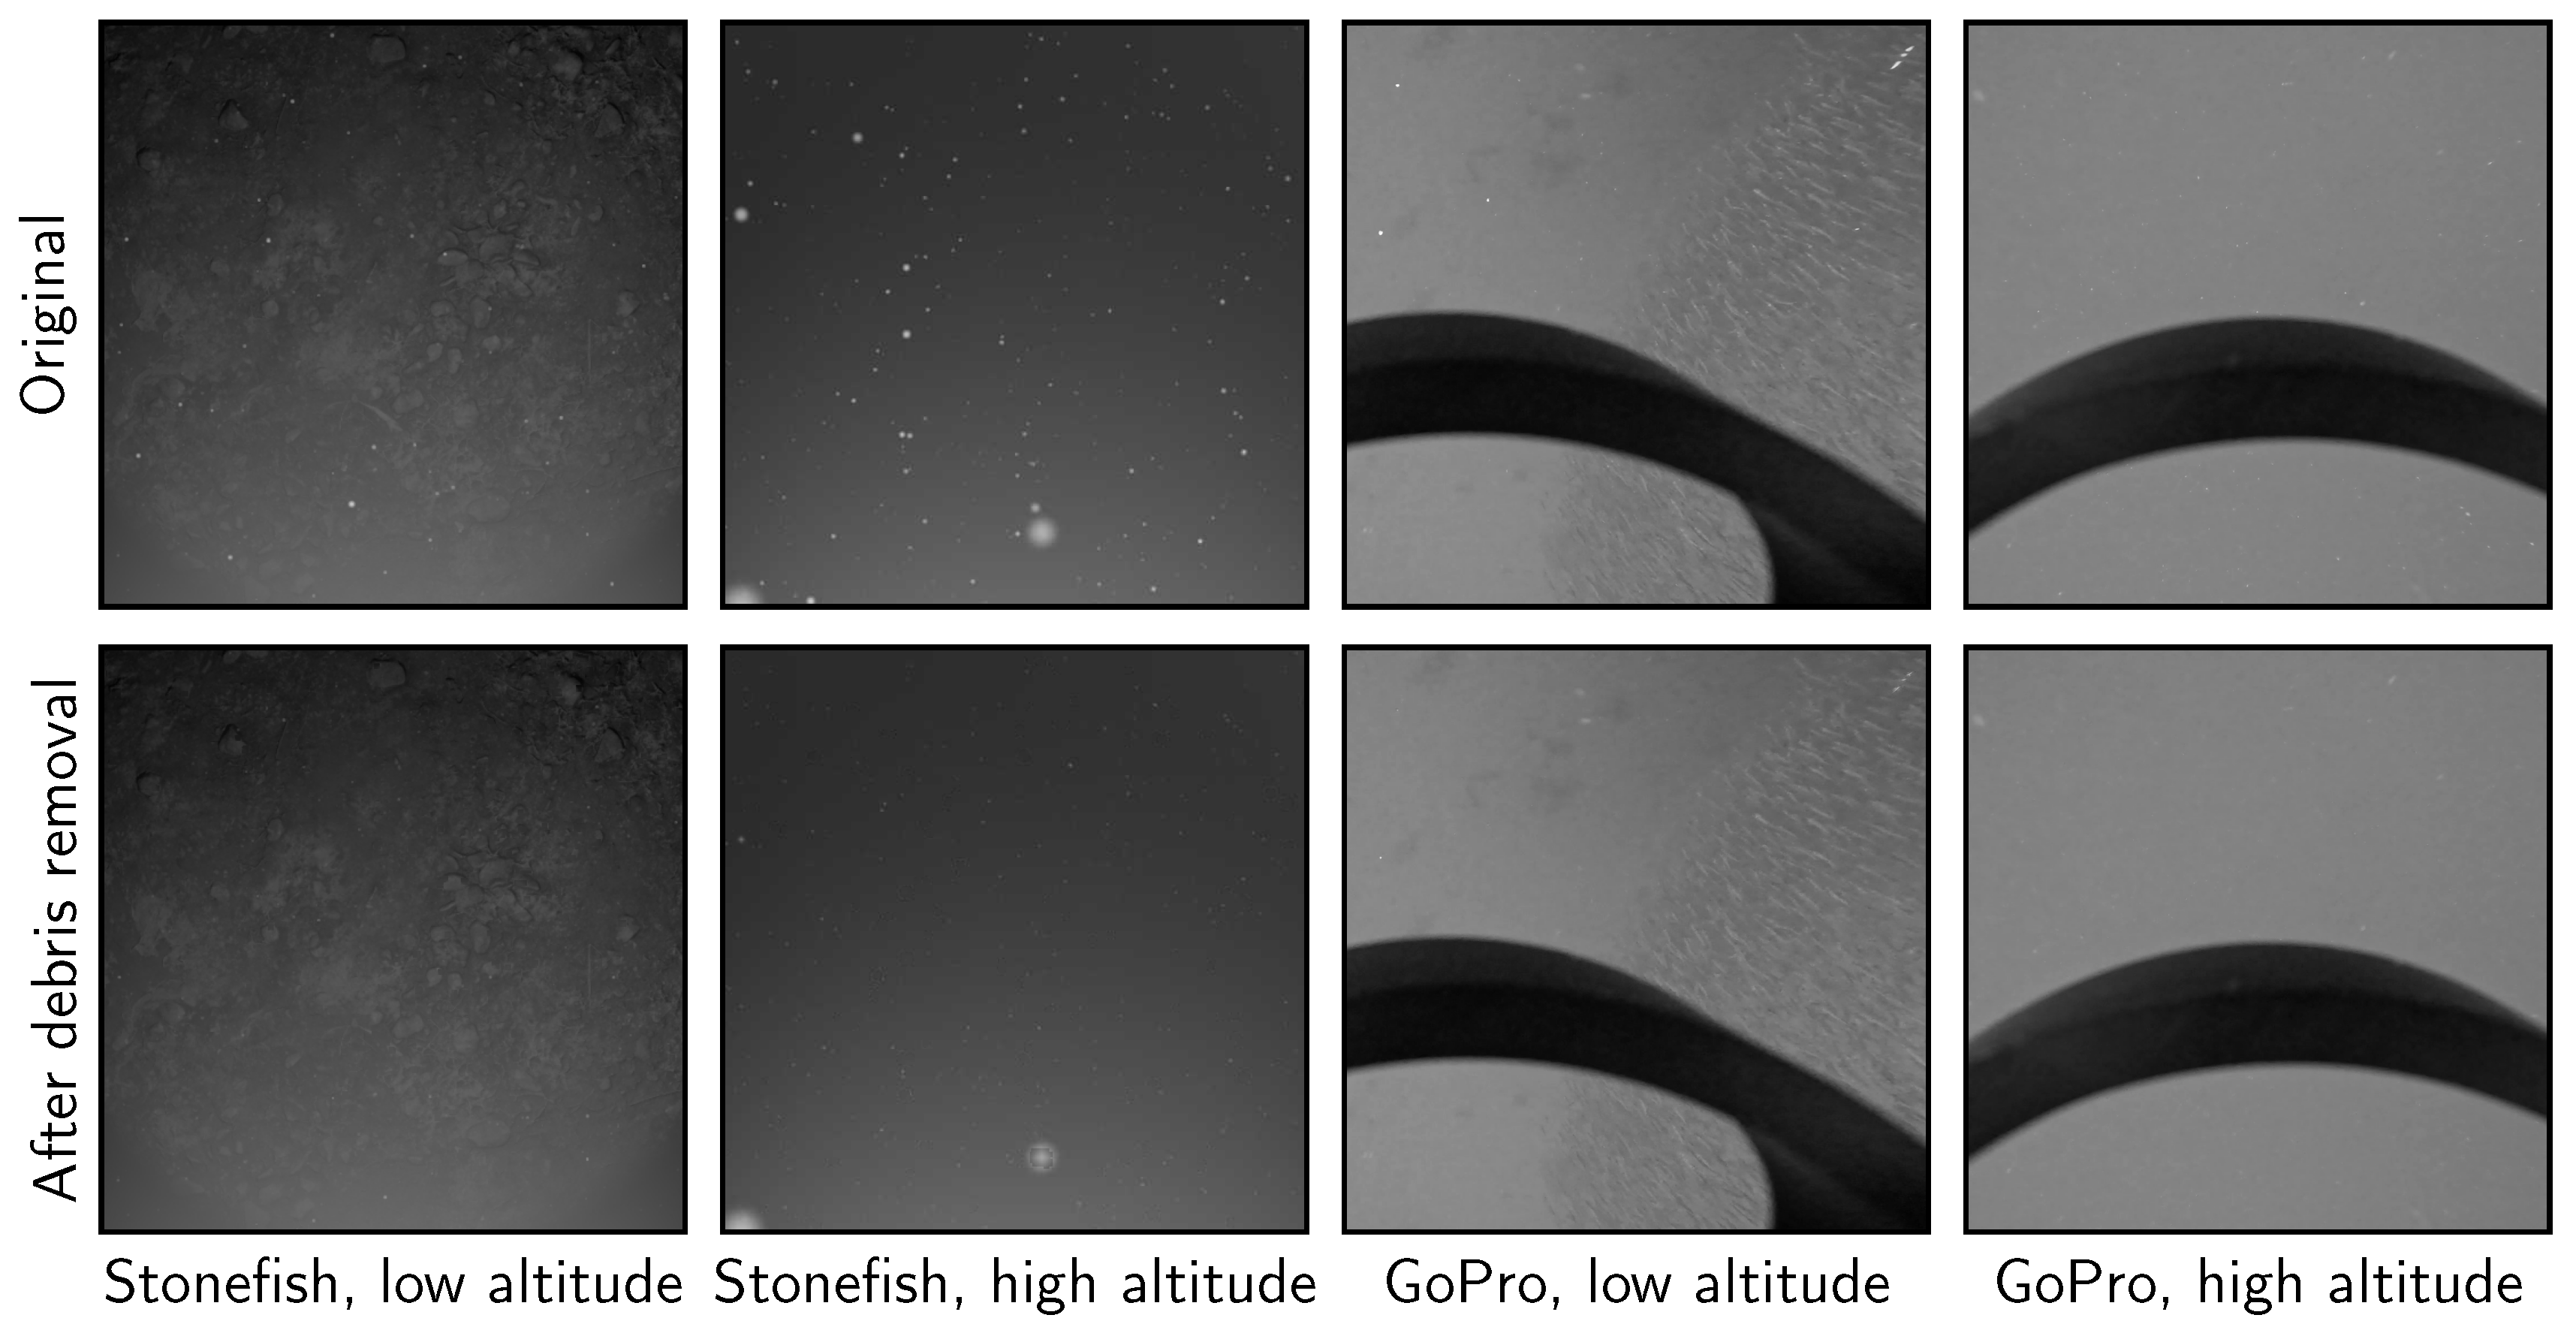
To evaluate the effectiveness of the debris removal algorithm, we tested it using images from our simulator as well as real images from the Orford survey. We can see in Figure 5 that it can reliably remove most debris from the images while not affecting other parts of the image.

4.3.2. Image Quality Estimation

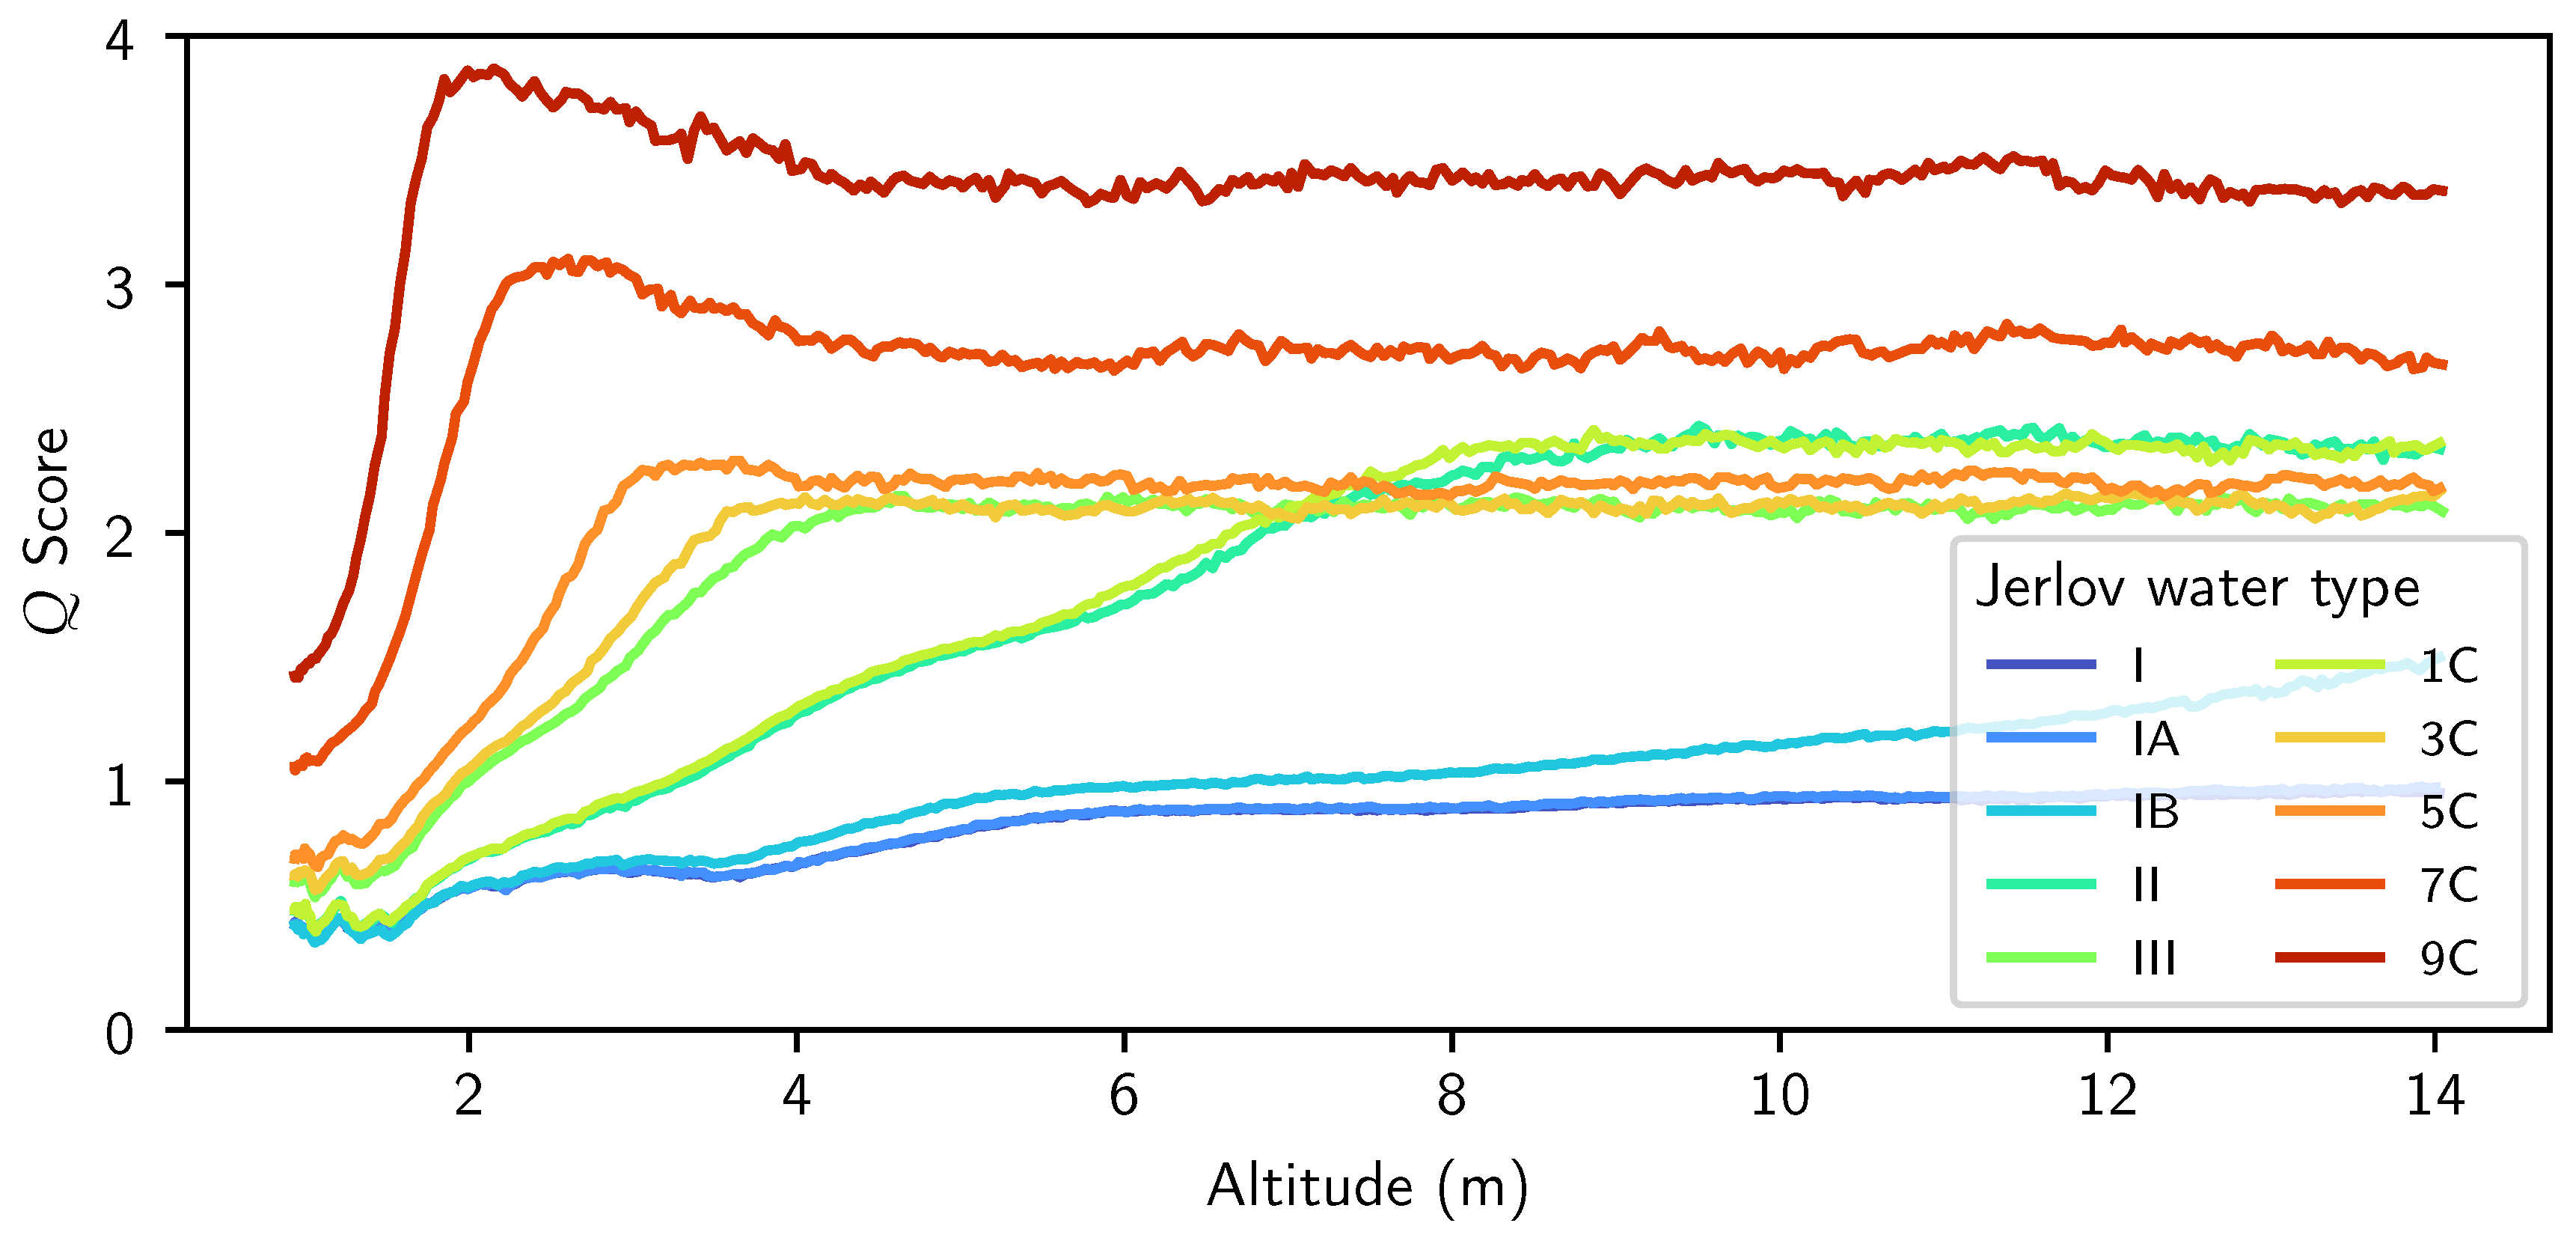
To evaluate our model, we collected 348, 512 × 512 px images at altitudes from ∼1 m to ∼14 m. This was repeated for each of the 10 Jerlov water types. Subsequently, we converted the images to grayscale and calculated the Q scores of each of these images. As Jerlov water types are based on a two-dimensional model of scattering and absorption, there is a non-linear relationship between the water types and the exact effects on images. As part of this process, we evaluated the runtime performance of our system. Which was able to process all 3480 images in around 26.2 s (∼6.9 ms each) on an Intel i7-5930k based computer.
As can be seen in Figure 6, our system can reliably give higher scores (vertical axis) to images that are collected at higher altitudes (horizontal axis) or in more turbid water (different series). These values have minimal noise and match the expected sigmoid [7] relationship between the score and the altitude. Note the overlapping lines for water types I and IA. This overlap is due to the high similarity between the scattering coefficients of type I and type IA water.
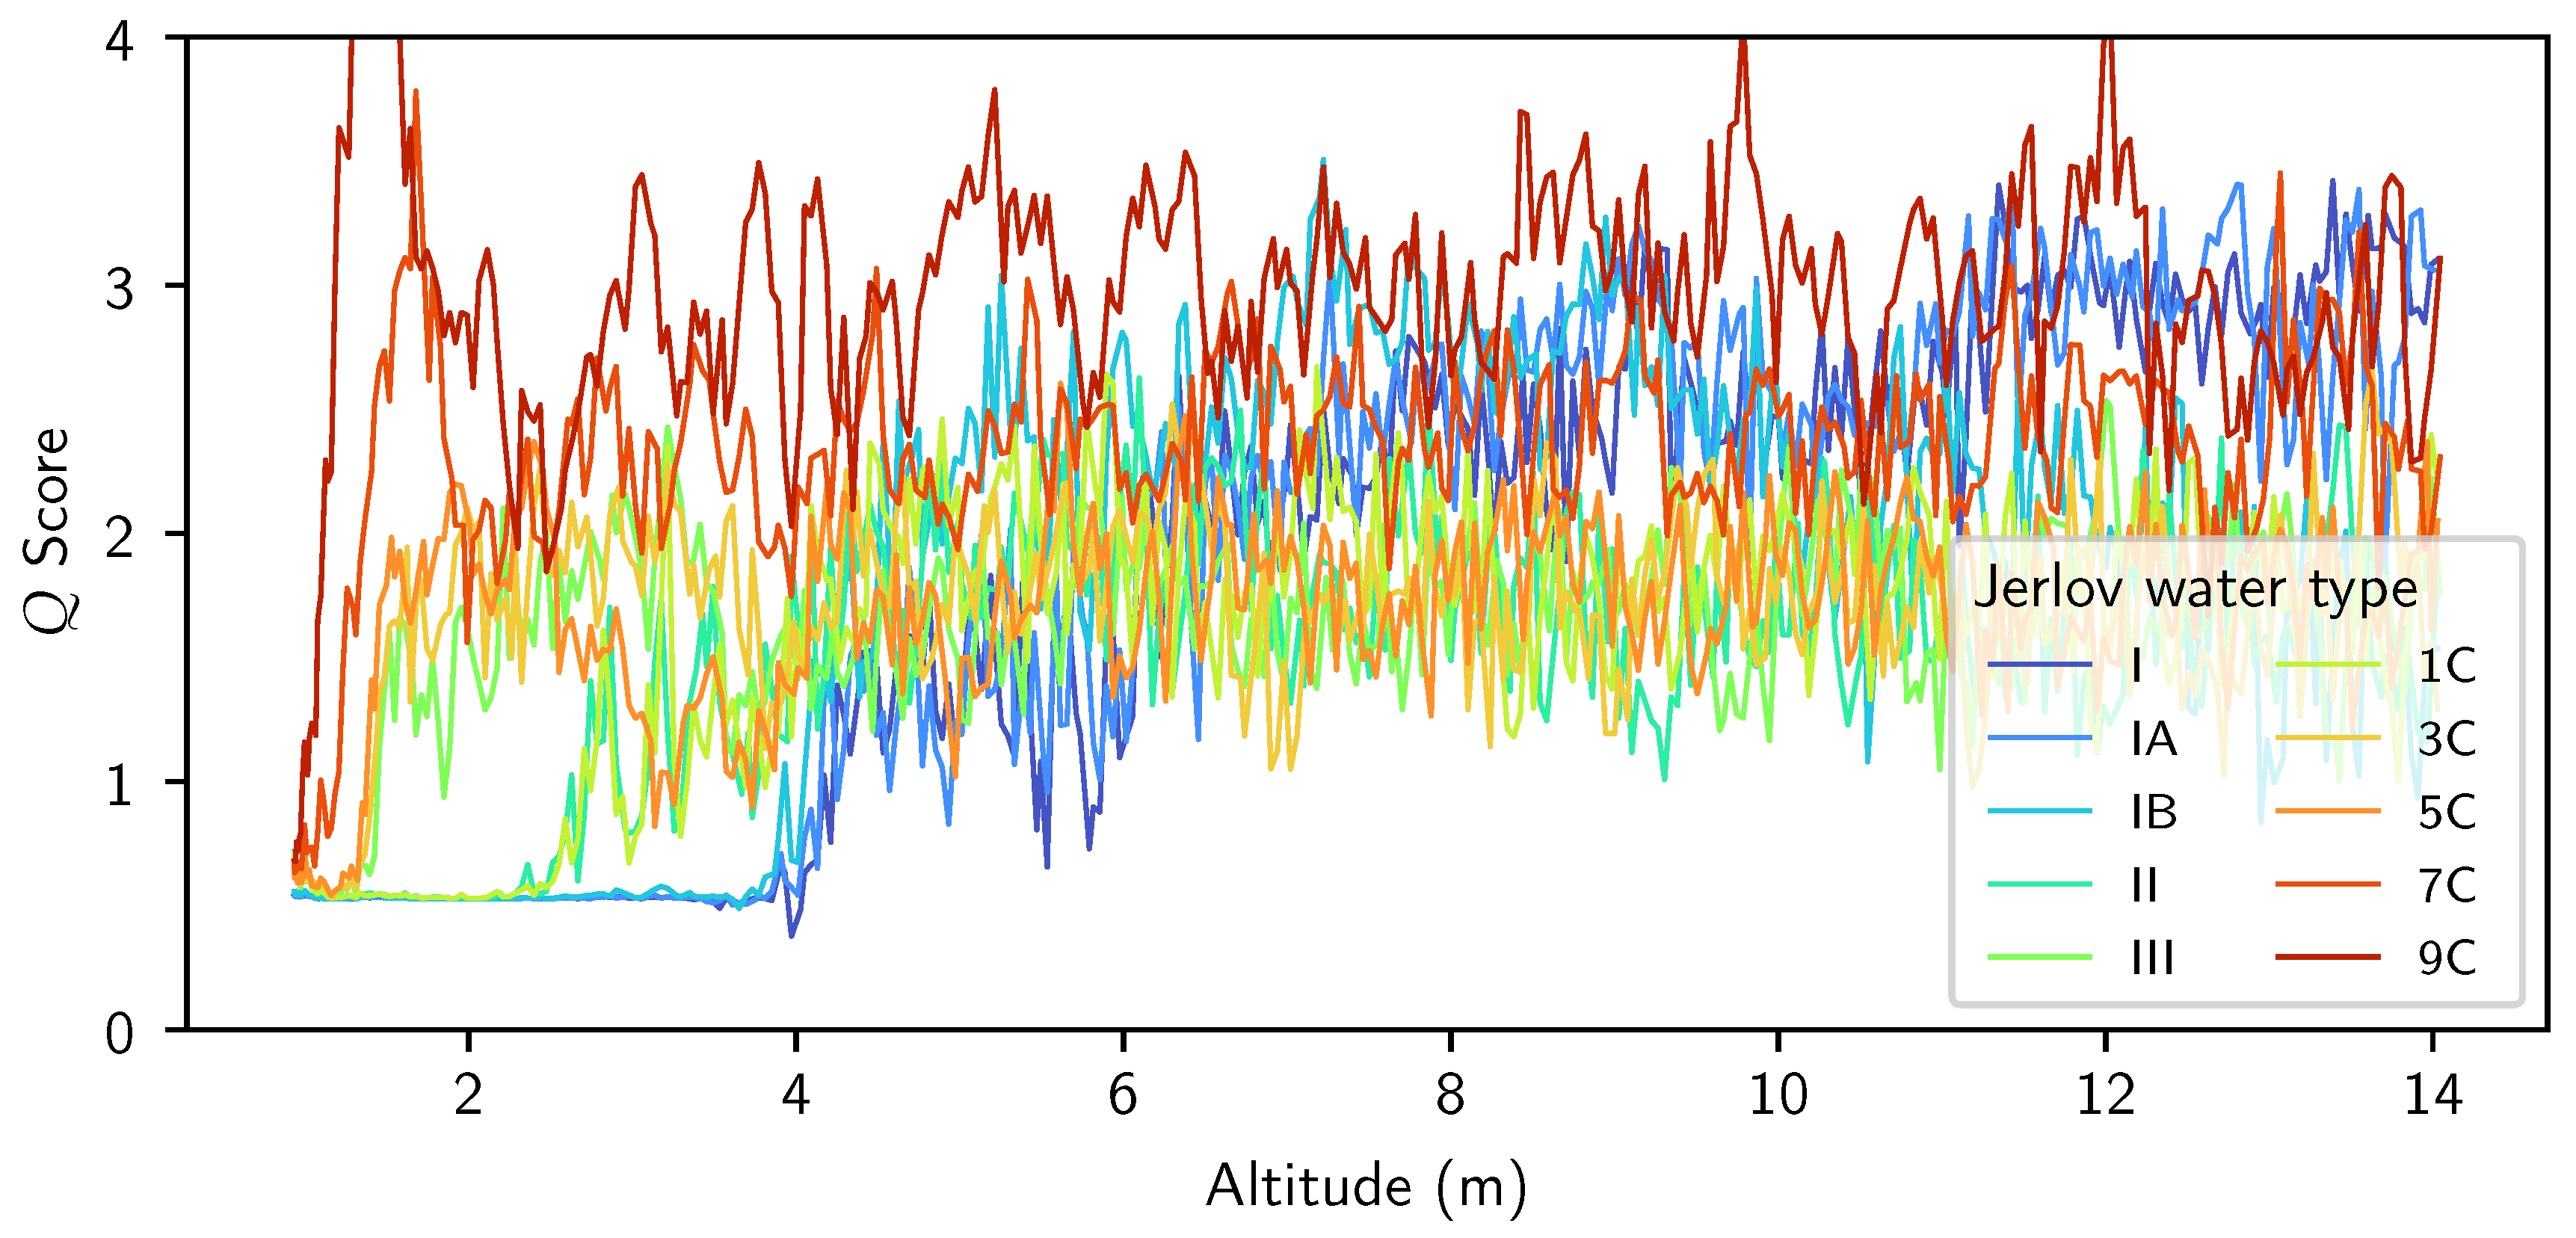
In addition to evaluating our own model, we also evaluated the performance of the Turbidivision CNN [32] model using the same methodology. We found that the Turbidivision model could not reliably determine the strength of the turbidity effects on the image. This can be seen in Figure 7. We believe that this is due to two main factors. Firstly, this is not the target application of Turbidivision, which is designed to calculate the absolute turbidity, rather than the effect it has on the image. Secondly, Turbidivision was designed for use with color images, so when it is given a grayscale image, it will not perform as well.

4.3.3. Control System

To evaluate the overall performance of the system we simulated a scenario where the AUV surveys the area between a point of high turbidity (1C), representing a river outlet, and an area of low turbidity (I), representing the ocean, with a 100 m separation between the two points. Our AUV travels between the two points at a speed of 1 ms 1 , relative to the seafloor. The Turbidity of the water is set based on the current position of the AUV. More specifically, the absorption and scattering coefficients of the water are created by linearly interpolating between the properties of the Jerlov water types at the positions in Table 1.
To evaluate the benefits of our system, we compared it against a number of controls. Rather than the target altitude being dynamically generated by our system, the target altitude in the controls was pre-set, representative of typical AUV mission planning. We chose a range of 2–5 m with an interval of 0.5 m. This bottom end of the range was chosen as it represents the lowest safe altitude, and the top end of the range was chosen as images above that point rarely contained any useful information.
The test involved taking downwards facing images at 2.5 Hz, which were saved for further analysis. Additionally, in the dynamic altitude test, the images were used to calculate the target altitudes, which were subsequently transmitted to the AUV’s navigation controller. In addition to collecting the images, we also measured the distance between the camera and the section of terrain visible in each corner of the image, allowing us to determine the coordinates of those points, and calculate the area visible to the camera.
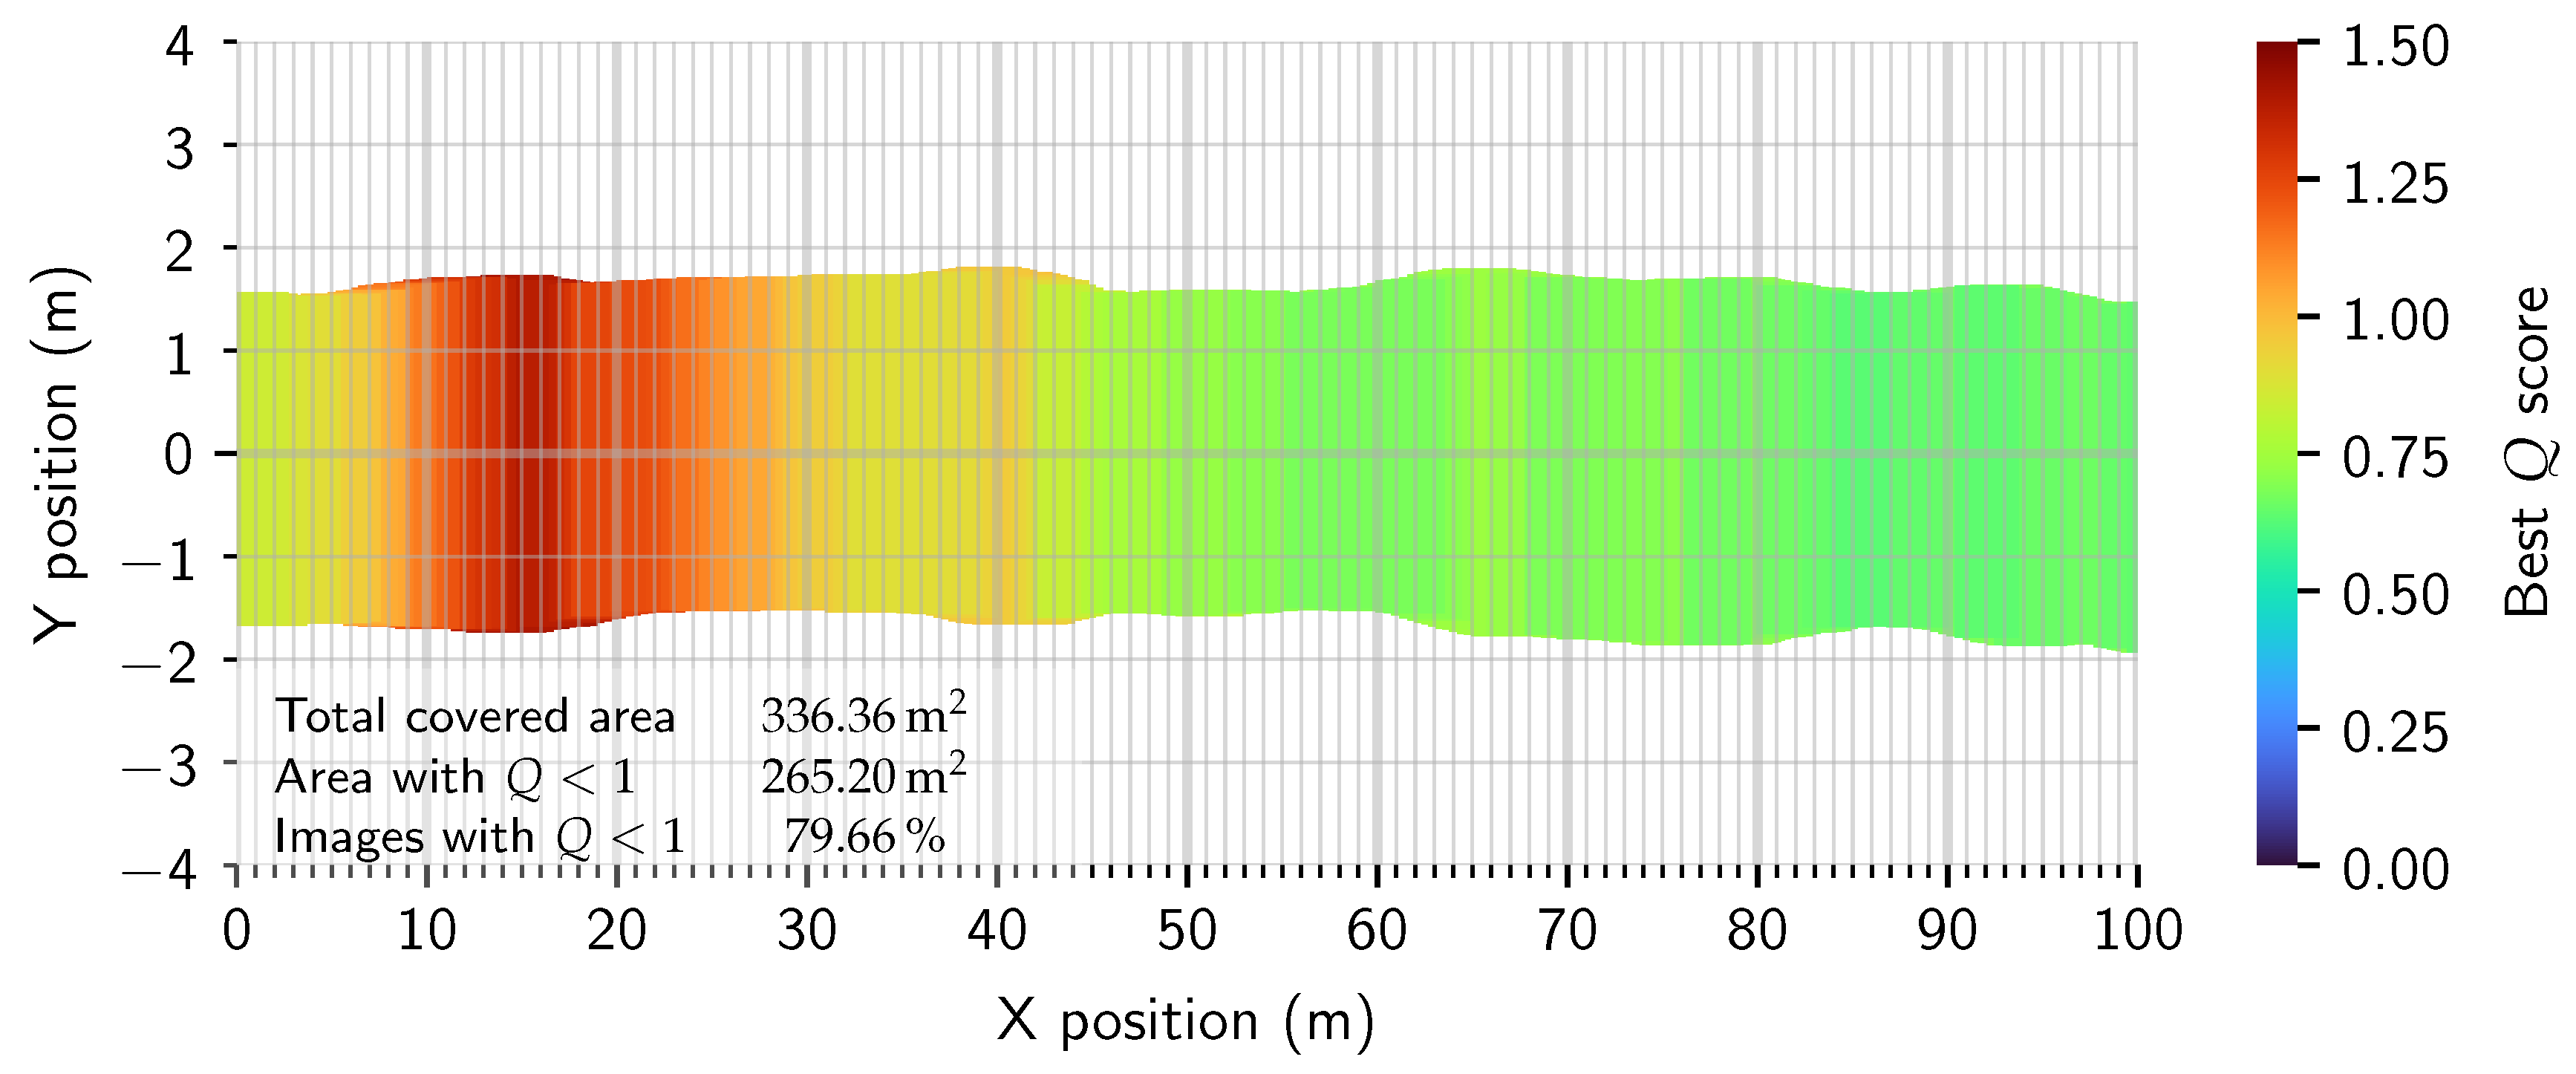
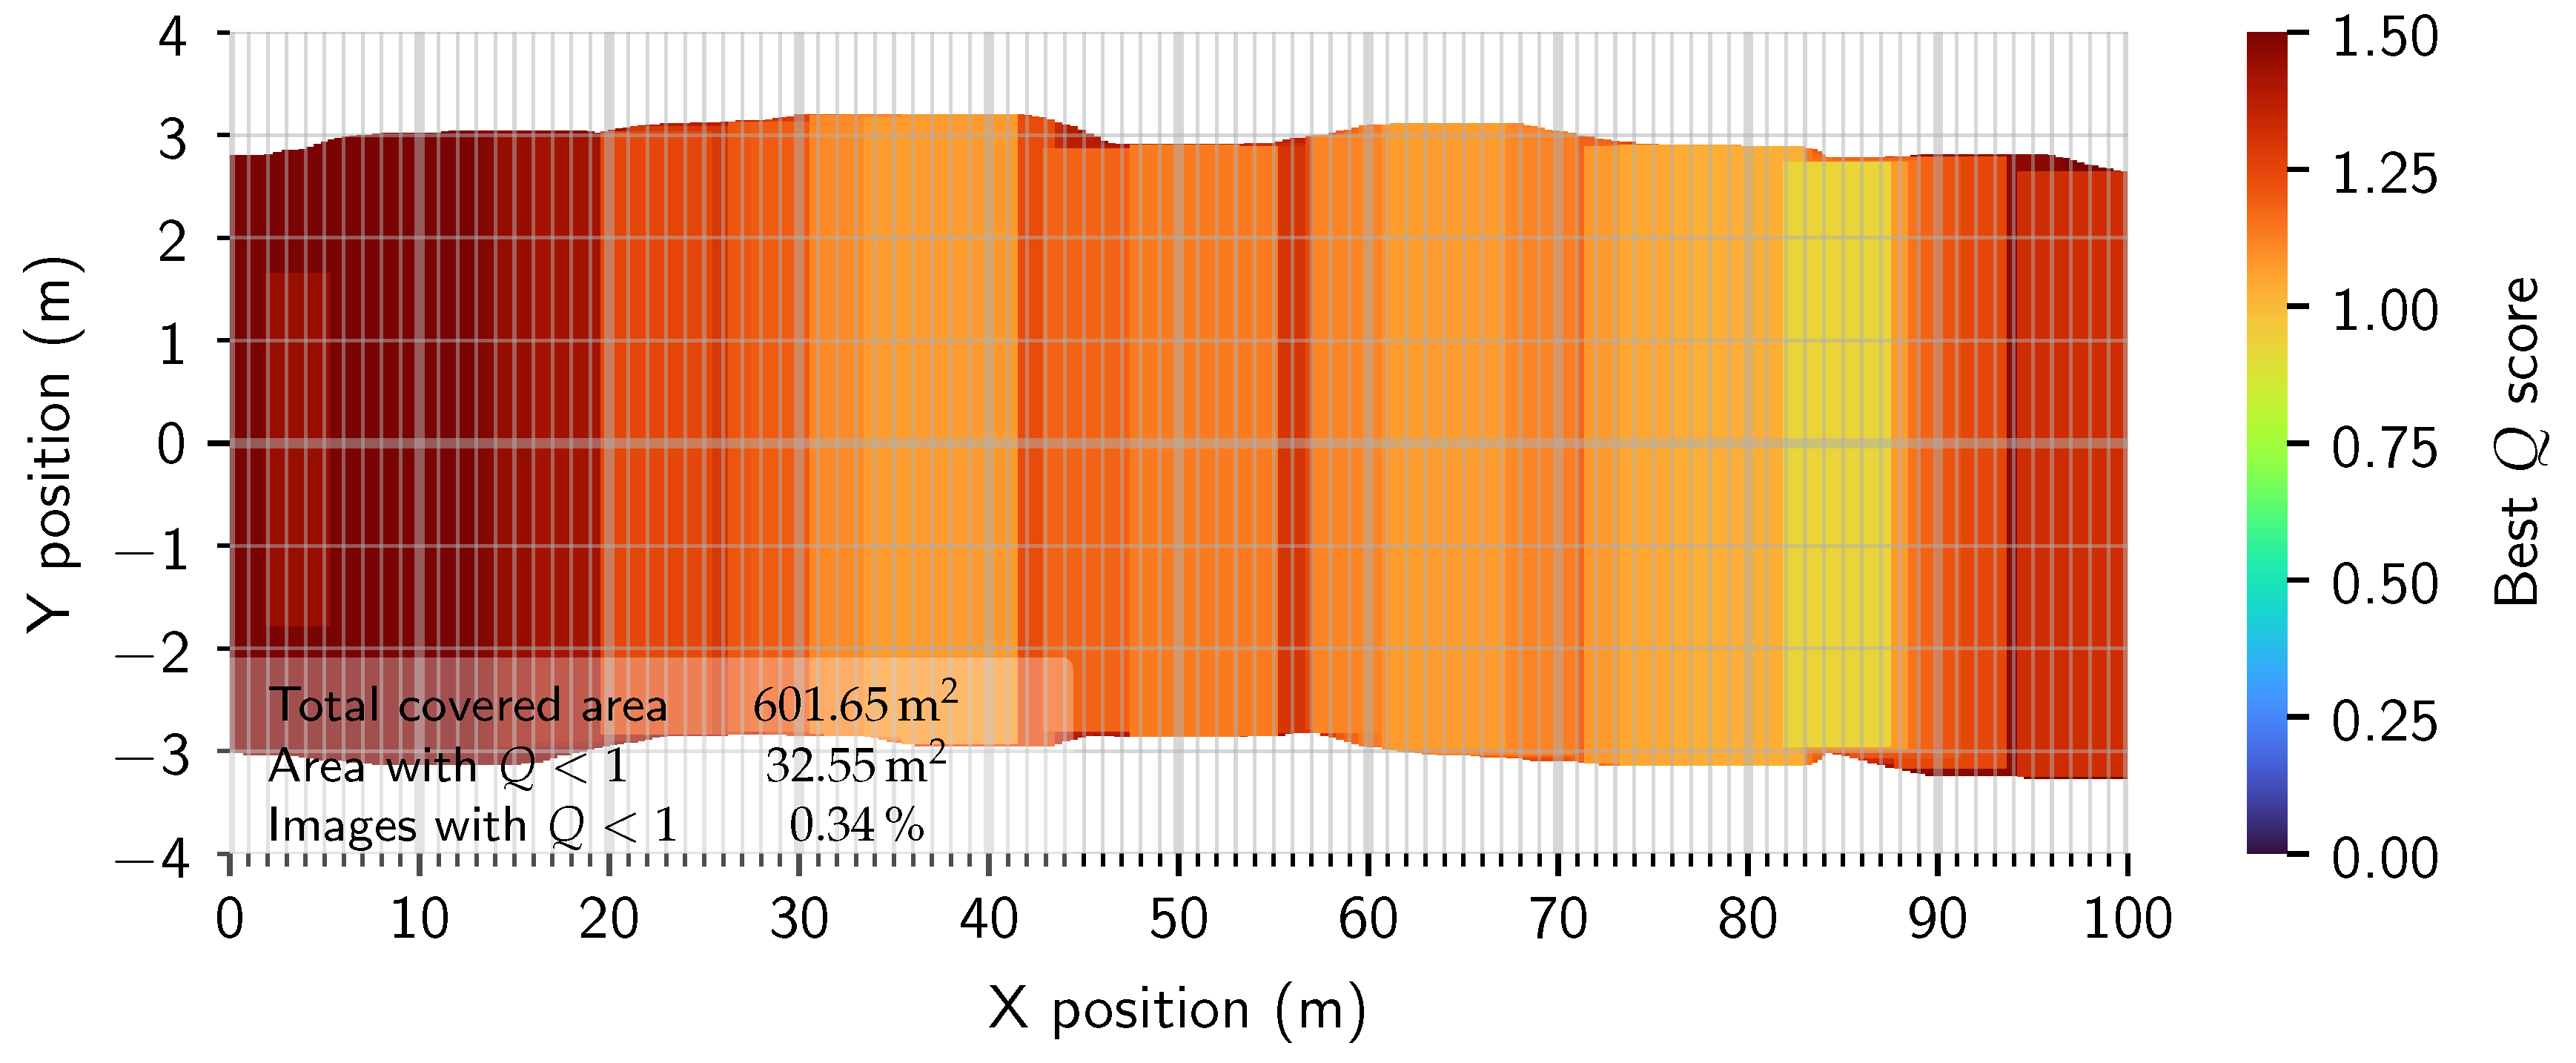
To evaluate the collected data, we calculated the Q value of each image. We then created a 100 m × 10 m array of 1 cm2 cells, and set the value of each cell to the lowest Q value of any image covering that cell. Subsequently, we counted the number of cells that had a value stored in them, giving us the total area covered by the AUV. We also counted the number of cells that had a Q score less than 1, giving us an estimate of the usable area.
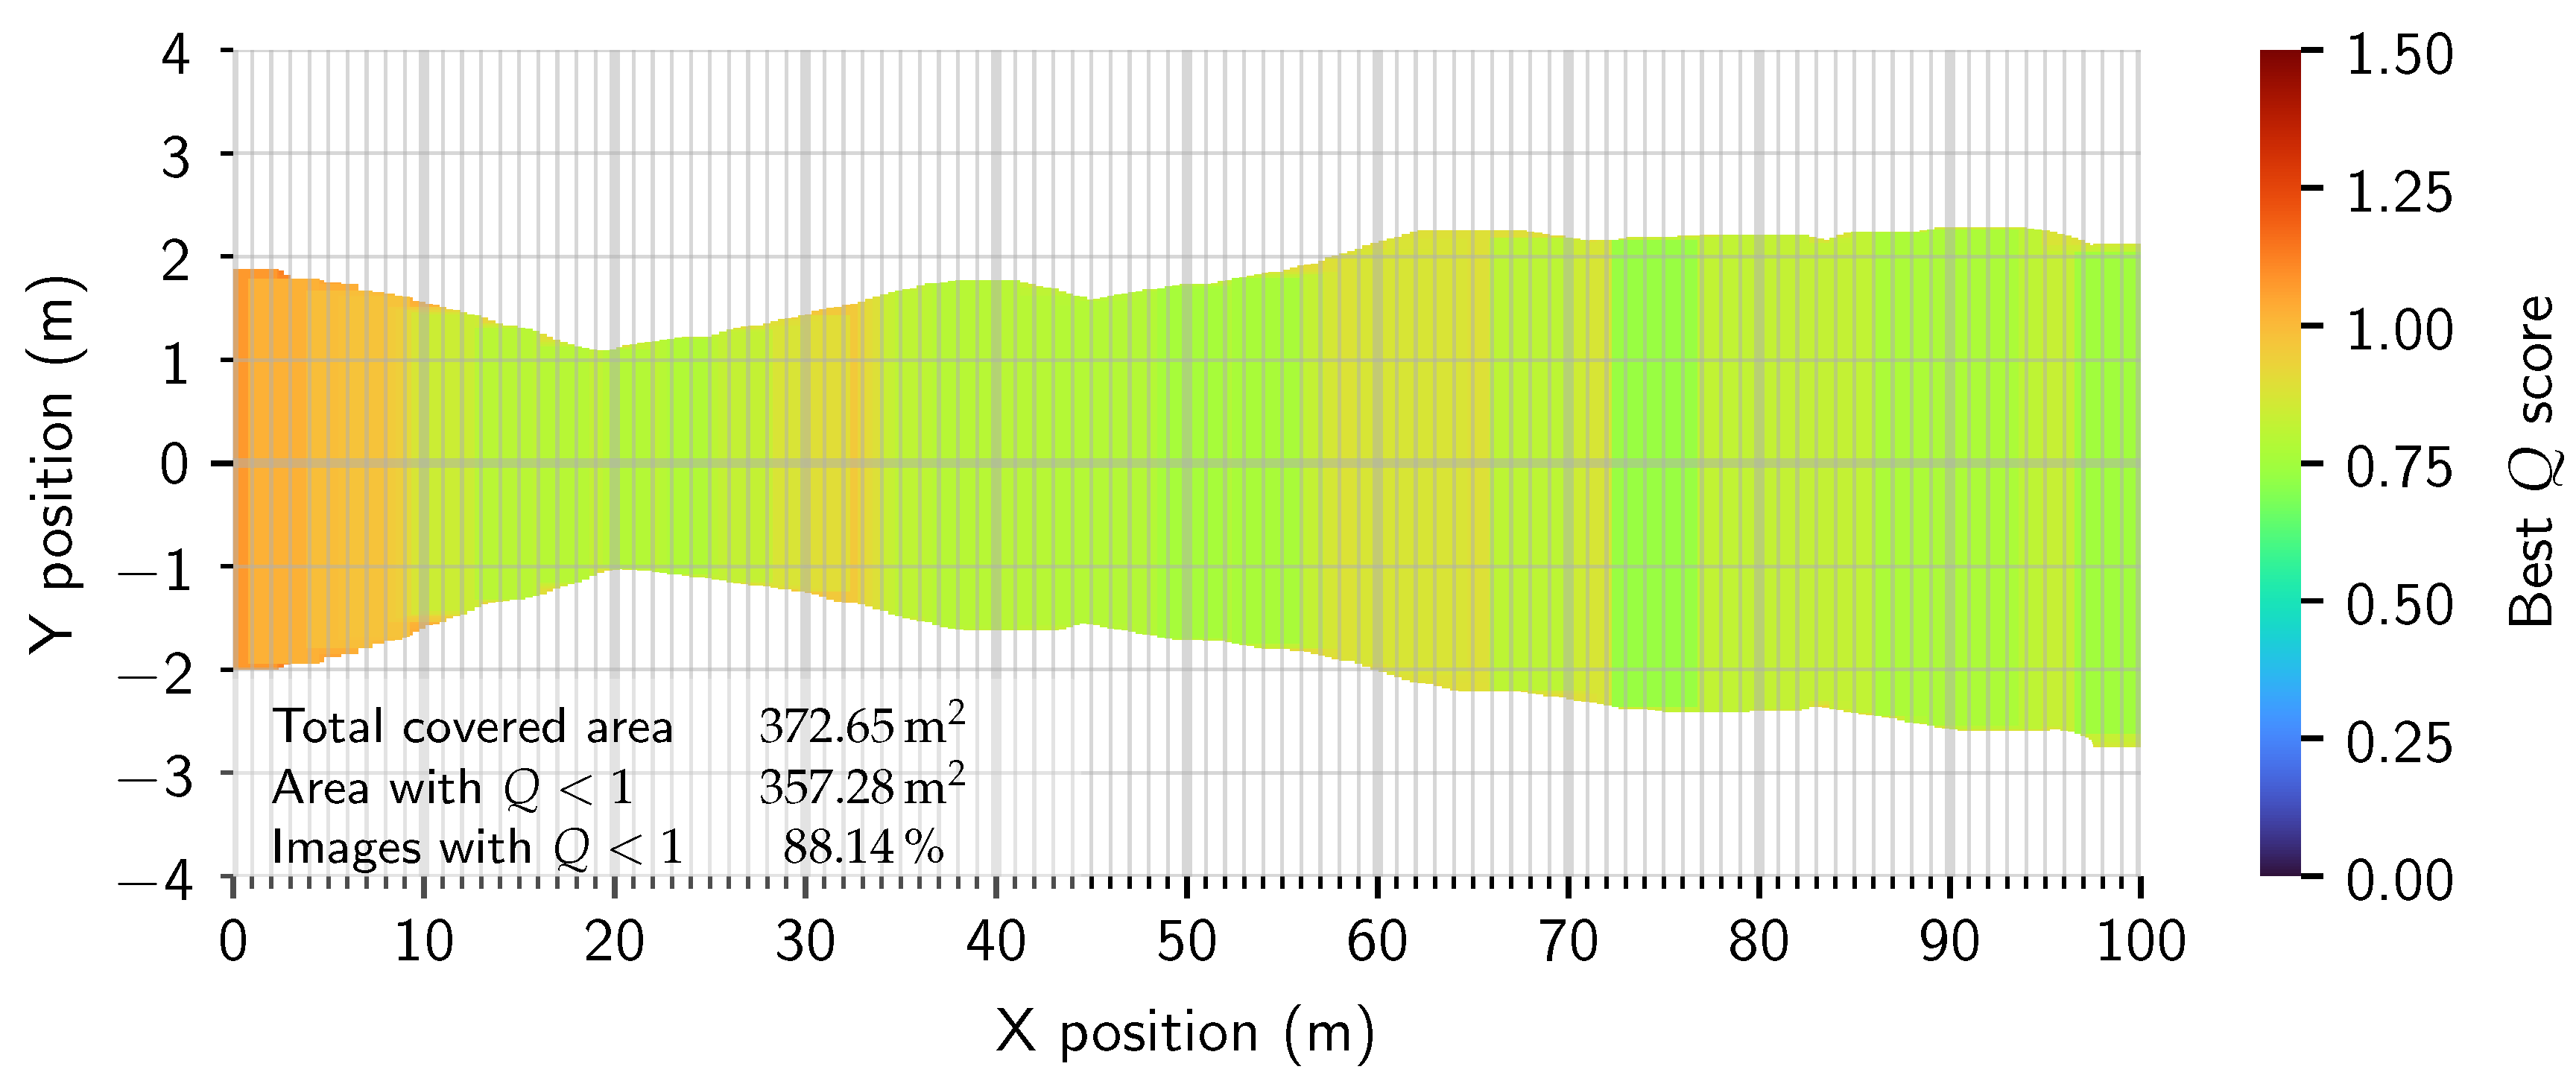
In Figure 8, Figure 9, Figure 10, Figure 11, Figure 12, Figure 13, Figure 14 and Figure 15 we can see a top-down representation of each test. The shaded area represents the region that was in-frame of the AUV’s camera during the test, with its shade corresponding to the lowest Q score at that point. Additionally, some key statistics about each test is visible. These statistics include: the area of the sea floor that is in-frame, the area covered by images with Q scores below 1, and the percentage of collected images which have Q scores below 1.
In Figure 8 and Figure 9, we can see that the majority of the surveyed area is covered by images of acceptable quality. However, due to the low altitudes of the tests, the total area in frame of AUV’s camera was limited to 206 m2 in the 2 m test, and 270 m2 in the 2.5 m test. All 206 m2 of the 2 m test were covered by images with a Q score <   1 and 244 m2 were covered in the 2.5 m test.
In Figure 10 and Figure 11 we can see that most areas have low Q scores, except for areas near the start of the test, which have much higher scores. This is due to the AUV’s inability to adjust to the changing turbidity. In the 3 m test, 265 m2 of the survey area is covered by images with Q scores less than 1. The 3.5 m test had worse results, at only 231 m2.
In the 4 m, 4.5 m, and 5 m tests, Figure 12, Figure 13 and Figure 14 we can see that significant regions of the survey area are not covered by images with Q scores <   1 . This is because the images taken by the AUV’s camera are more strongly affected by the more turbid water.
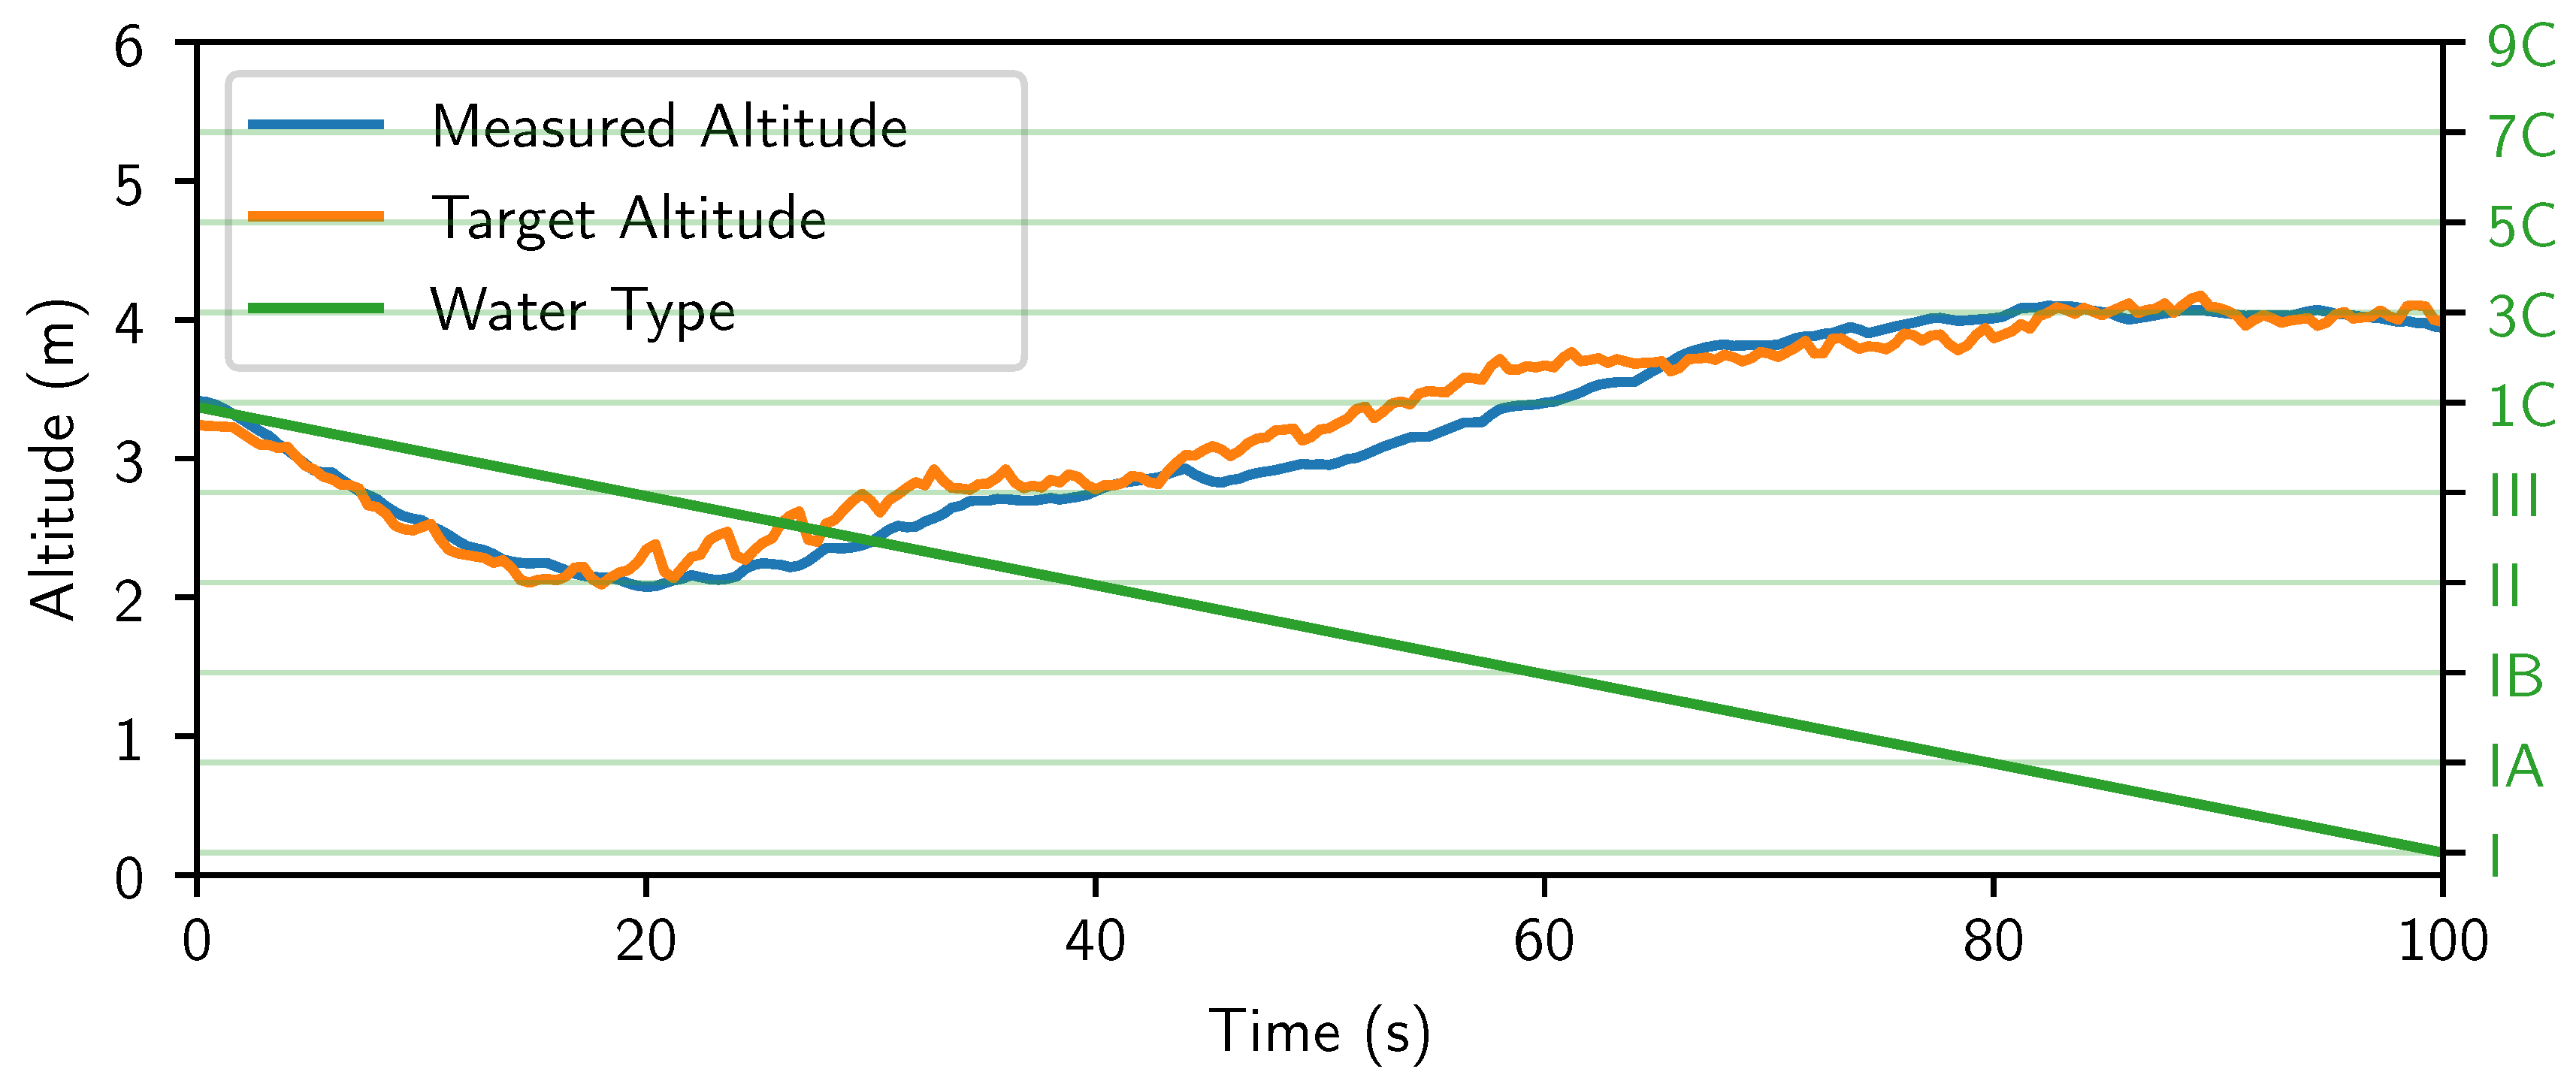
These results are in contrast to our algorithm, where by dynamically altering the altitude we can cover 373 m2 of the survey area with high-quality images. With 88% of the acquired images meeting the quality requirement of a Q score less than 1. As can be seen in Figure 15 and Table 2, using our dynamic control system, we were able to collect more useful information than is possible with the fixed altitude methods. The target and measured altitudes can be seen in Figure 16, where they can be compared with the Jerlov water type at that time-point.

5. Conclusions and Future Works

In this article, we proposed, developed, and tested a real-time method of dynamically altering the altitude of an AUV in response to changes in image quality from turbid water. This allows for more consistent acquisition of high-quality images.
This method is enabled by the development of our D-L algorithm, which reliably returns a measure of how strongly an image is affected by turbid water. The D-L algorithm determines the amount of useful information in the image using the spatial frequency distribution of the image, as well as the variance of the Laplacian of that image. A preprocessing stage is used to filter noise and debris from the image to minimize their effects on the results.
Even though we addressed an important gap, there are some limitations which need to be addressed in future works, specifically:
Evaluation of our system has been mainly limited to simulations. The next step would be to perform field testing with a physical AUV. This would allow for more thorough validation of the system, both in terms of its ability to function in varied environments and the system’s interactions with vehicle dynamics.
While our system alters the altitude of the AUV to increase coverage area, it does not have any horizontal control capabilities; thus, it cannot take advantage of the higher coverage to speed up surveys. The next step would be to develop a system that alters the horizontal component of the survey plan based on the covered area.
In our tests, when compared against the best fixed-altitude survey, our dynamic altitude algorithm increased the area covered by quality images by 35%. With the future development of a dynamic horizontal path planning algorithm, the increased coverage from our system could be used to decrease the duration of a survey without a meaningful reduction in image quality. However, it is difficult to determine the exact speed-up without developing such an algorithm. The use of a horizontal path planing algorithm would likely require an small increase in the overlap between passes, slightly increasing survey duration. Additionally, changing altitude may also increase survey duration; however, this is likely to be minuscule. We believe that the time cost of changing altitude and the additional overlap would be significantly less than the gains provided by our system.

Author Contributions

Conceptualization, P.K.; methodology, S.L.; software, S.L.; validation, S.L. and P.K.; formal analysis, S.L.; investigation, S.L.; writing—original draft preparation, S.L.; writing—review and editing, S.L., P.K., S.G. and Q.B; visualization, S.L.; supervision, P.K. and S.G.; project administration, P.K., S.G., W.Y., M.B.A. and Q.B; funding acquisition, P.K., S.G., W.Y., M.B.A. and Q.B.; All authors have read and agreed to the published version of the manuscript.

Funding

This research was funded by Antarctic and Southern Ocean Mission Integrator (ASOMI), University of Tasmania.

Data Availability Statement

The raw data supporting the conclusions of this article may be made available by the authors on request.

Conflicts of Interest

The authors declare no conflicts of interest.

Abbreviations

The following abbreviations are used in this manuscript:
AMCAustralian Maritime College
AUVAutonomous Underwater Vehicle
CNNConvolutional Neural Network
CTDConductivity, Temperature, Depth
DCPDark Channel Prior
DCTDiscrete Cosine Transform
FOVField of View
RGBRed, Green, Blue
ROSRobot Operating System

Appendix A

Table A1. Variable descriptions and values.
NameDescriptionValue
IImage from AUV cameraSensor reading (512 × 512 monochrome image)
JGrayscale image with values corresponding to the significance of debris in ICalculated
J t Variant of J using t as a thresholdCalculated
KBlurred and eroded variant of I, missing most detailsCalculated
LClean variant of I with debris removedCalculated
MFrequency distribution of LCalculated
N1D frequency data consisting of the mean of the top λ proportion of values in each bin of MCalculated
OImage score using frequency domain techniqueCalculated
PImage score using Laplacian techniqueCalculated
QFinal image scoreCalculated
aCurrent measured altitudeSensor reading
a r Rough target altitudeCalculated
a m i n Min safe altitude2 m
a m a x Max safe altitude15 m
a s Safe rough target altitudeCalculated
a t Final target altitudeCalculated
bSize of rolling average10 (4 s at 2.5 Hz)
tThreshold used for J t 8/255
wWeight function used to calculate O394 px Blackman window shifted right by 26 px
α Blur kernel for I15 px window
β Erosion kernel for I3 px window
γ Dilation kernel for I5 px window
δ Blur kernel for K5 px window
ε Erosion kernel for K7 px window
ζ Blur kernel for M11 px window
η Blur kernel for M25 px window
θ Width of ISensor reading (512 px)
λ Portion of values to keep in N0.1 (10%)
μ Correction factor for the DCT based algorithm15
ξ Correction bias for the DCT based algorithm0
ϖ Correction factor for the Laplacian based algorithm2.1
ρ Correction bias for the Laplacian based algorithm0.2
σ Weight to use in lower value in the final averaging in Q0.7

Appendix B

Figure A1. Color images taken in Stonefish at 2.5 m altitude, in differing water types.
Drones 09 00608 g0a1
Figure A2. Grayscale images taken in Stonefish at 2.5 m altitude, in differing water types.
Drones 09 00608 g0a2

References

  1. Yuh, J. Design and Control of Autonomous Underwater Robots: A Survey. Auton. Robot. 2000, 8, 7–24. [Google Scholar] [CrossRef]
  2. Solonenko, M.G.; Mobley, C.D. Inherent optical properties of Jerlov water types. Appl. Opt. 2015, 54, 5392. [Google Scholar] [CrossRef]
  3. Hansen, L.I.N. Turbidity Measurement Based on Computer Vision. Master’s Thesis, Aalborg University, Aalborg, Denmark, 2019. Available online: https://projekter.aau.dk/projekter/files/306657262/master.pdf (accessed on 20 July 2025).
  4. Hu, L.; Zhang, X.; Perry, M.J. Light scattering by pure seawater: Effect of pressure. Deep Sea Res. Part I Oceanogr. Res. Pap. 2019, 146, 103–109. [Google Scholar] [CrossRef]
  5. Čejka, J.; Bruno, F.; Skarlatos, D.; Liarokapis, F. Detecting Square Markers in Underwater Environments. Remote Sens. 2019, 11, 459. [Google Scholar] [CrossRef]
  6. Jerlov, N.G. Marine Optics; Elsevier: Amsterdam, The Netherlands, 1976; Volume 14. [Google Scholar]
  7. Álvarez Tuñón, O.; Jardón, A.; Balaguer, C. Generation and Processing of Simulated Underwater Images for Infrastructure Visual Inspection with UUVs. Sensors 2019, 19, 5497. [Google Scholar] [CrossRef] [PubMed]
  8. King, P.; Ziurcher, K.; Bowden-Floyd, I. A risk-averse approach to mission planning: Nupiri muka at the Thwaites Glacier. In Proceedings of the 2020 IEEE/OES Autonomous Underwater Vehicles Symposium (AUV)(50043), St. Johns, NL, Canada, 30 September–2 October 2020; IEEE: Piscataway, NJ, USA, 2020. [Google Scholar] [CrossRef]
  9. Neukermans, G.; Ruddick, K.; Greenwood, N. Diurnal variability of turbidity and light attenuation in the southern North Sea from the SEVIRI geostationary sensor. Remote Sens. Environ. 2012, 124, 564–580. [Google Scholar] [CrossRef]
  10. Shen, C.; Shi, Y.; Buckham, B. Model predictive control for an AUV with dynamic path planning. In Proceedings of the 2015 54th Annual Conference of the Society of Instrument and Control Engineers of Japan (SICE), Hangzhou, China, 28–30 July 2015; IEEE: Piscataway, NJ, USA, 2015; pp. 475–480. [Google Scholar] [CrossRef]
  11. Yan, Z.; Li, J.; Wu, Y.; Zhang, G. A Real-Time Path Planning Algorithm for AUV in Unknown Underwater Environment Based on Combining PSO and Waypoint Guidance. Sensors 2018, 19, 20. [Google Scholar] [CrossRef]
  12. Kruger, D.; Stolkin, R.; Blum, A.; Briganti, J. Optimal AUV path planning for extended missions in complex, fast-flowing estuarine environments. In Proceedings of the Proceedings 2007 IEEE International Conference on Robotics and Automation, Rome, Italy, 10–14 April 2007; IEEE: Piscataway, NJ, USA, 2007; pp. 4265–4270. [Google Scholar] [CrossRef]
  13. Galceran, E.; Campos, R.; Palomeras, N.; Ribas, D.; Carreras, M.; Ridao, P. Coverage Path Planning with Real-time Replanning and Surface Reconstruction for Inspection of Three-dimensional Underwater Structures using Autonomous Underwater Vehicles: Coverage Path Planning with Real-time Replanning and Surface Reconstruction. J. Field Robot. 2014, 32, 952–983. [Google Scholar] [CrossRef]
  14. Hert, S.; Tiwari, S.; Lumelsky, V. A terrain-covering algorithm for an AUV. Auton. Robot. 1996, 3, 91–119. [Google Scholar] [CrossRef]
  15. MahmoudZadeh, S.; Yazdani, A.; Sammut, K.; Powers, D. Online path planning for AUV rendezvous in dynamic cluttered undersea environment using evolutionary algorithms. Appl. Soft Comput. 2018, 70, 929–945. [Google Scholar] [CrossRef]
  16. Kondo, H.; Ura, T. Navigation of an AUV for investigation of underwater structures. Control Eng. Pract. 2004, 12, 1551–1559. [Google Scholar] [CrossRef]
  17. Lee, H.; Jeong, D.; Yu, H.; Ryu, J. Autonomous Underwater Vehicle Control for Fishnet Inspection in Turbid Water Environments. Int. J. Control. Autom. Syst. 2022, 20, 3383–3392. [Google Scholar] [CrossRef]
  18. Lim, H.S.; King, P.; Chin, C.K.; Chai, S.; Bose, N. Real-time implementation of an online path replanner for an AUV operating in a dynamic and unexplored environment. Appl. Ocean Res. 2022, 118, 103006. [Google Scholar] [CrossRef]
  19. Antonelli, G.; Chiaverini, S.; Finotello, R.; Schiavon, R. Real-time path planning and obstacle avoidance for RAIS: An autonomous underwater vehicle. IEEE J. Ocean. Eng. 2001, 26, 216–227. [Google Scholar] [CrossRef]
  20. He, K.; Sun, J.; Tang, X. Single Image Haze Removal Using Dark Channel Prior. IEEE Trans. Pattern Anal. Mach. Intell. 2011, 33, 2341–2353. [Google Scholar] [CrossRef]
  21. Codevilla, F.M.; Silva Da Costa Botelho, S.; Drews, P.; Duarte Filho, N.; De Oliveira Gaya, J.F. Underwater Single Image Restoration Using Dark Channel Prior. In Proceedings of the 2014 Symposium on Automation and Computation for Naval, Offshore and Subsea (NAVCOMP), Rio Grande, Brazil, 11–13 March 2014; IEEE: Piscataway, NJ, USA, 2014; pp. 18–21. [Google Scholar] [CrossRef]
  22. Gao, Y.; Li, H.; Wen, S. Restoration and Enhancement of Underwater Images Based on Bright Channel Prior. Math. Probl. Eng. 2016, 2016, 3141478. [Google Scholar] [CrossRef]
  23. Li, X.; Yu, S.; Gu, H.; Tan, Y.; Xing, L. Underwater Image Clearing Algorithm Based on the Laplacian Edge Detection Operator. In Proceedings of the 2nd International Conference on Artificial Intelligence, Robotics, and Communication, Fuzhou, China, 25–27 November 2022; Springer: Singapore, 2023; pp. 159–172. [Google Scholar] [CrossRef]
  24. Hao, Y.; Hou, G.; Tan, L.; Wang, Y.; Zhu, H.; Pan, Z. Texture enhanced underwater image restoration via Laplacian regularization. Appl. Math. Model. 2023, 119, 68–84. [Google Scholar] [CrossRef]
  25. Jiang, B.; Zhang, W.; Zhao, J.; Ru, Y.; Liu, M.; Ma, X.; Chen, X.; Meng, H. Gray-Scale Image Dehazing Guided by Scene Depth Information. Math. Probl. Eng. 2016, 2016, 1–10. [Google Scholar] [CrossRef]
  26. Bazeille, S.; Quidu, I.; Jaulin, L.; Malkasse, J.P. Automatic underwater image pre-processing. In Proceedings of the CMM’06, Brest, France, 26–19 October 2006; Available online: https://hal.science/hal-00504893v1/file/BAZEILLE_06a.pdf (accessed on 20 July 2025).
  27. Pavlic, M.; Belzner, H.; Rigoll, G.; Ilic, S. Image based fog detection in vehicles. In Proceedings of the 2012 IEEE Intelligent Vehicles Symposium, Madrid, Spain, 3–7 June 2012; IEEE: Piscataway, NJ, USA, 2012; pp. 1132–1137. [Google Scholar] [CrossRef]
  28. Rabaa, Y.; Benazza-Benyahia, A. Estimation of Water Turbidity by Image-Based Learning Approaches. In Proceedings of the International Conference on Artificial Intelligence and Green Computing, Beni Mellal, Morocco, 15–17 March 2023; Springer: Cham, Switzerland, 2023; pp. 63–77. [Google Scholar] [CrossRef]
  29. Feizi, H.; Sattari, M.T.; Mosaferi, M.; Apaydin, H. An image-based deep learning model for water turbidity estimation in laboratory conditions. Int. J. Environ. Sci. Technol. 2022, 20, 149–160. [Google Scholar] [CrossRef]
  30. Mohammed, A. Determine Water Turbidity by Using Image Processing Technology. Int. J. Intell. Syst. Appl. Eng. 2024, 12, 4260–4265. [Google Scholar]
  31. Zhou, N.; Chen, H.; Chen, N.; Liu, B. An Approach Based on Video Image Intelligent Recognition for Water Turbidity Monitoring in River. ACS ES&T Water 2024, 4, 543–554. [Google Scholar] [CrossRef]
  32. Rudy, I.M.; Wilson, M.J. Turbidivision: A machine vision application for estimating turbidity from underwater images. PeerJ 2024, 12, e18254. [Google Scholar] [CrossRef] [PubMed]
  33. Jocher, G.; Chaurasia, A.; Qiu, J. Ultralytics YOLOv8. 2023. Available online: https://github.com/ultralytics/ultralytics (accessed on 25 July 2025).
  34. Yuan, C.; Li, Y. Switching median and morphological filter for impulse noise removal from digital images. Optik 2015, 126, 1598–1601. [Google Scholar] [CrossRef]
  35. Singh, I.; Neeru, N. Performance Comparison of Various Image Denoising Filters under Spatial Domain. Int. J. Comput. Appl. 2014, 96, 21–30. [Google Scholar] [CrossRef]
  36. Zhang, M.M.; Choi, W.S.; Herman, J.; Davis, D.; Vogt, C.; McCarrin, M.; Vijay, Y.; Dutia, D.; Lew, W.; Peters, S.; et al. DAVE Aquatic Virtual Environment: Toward a General Underwater Robotics Simulator. In Proceedings of the 2022 IEEE/OES Autonomous Underwater Vehicles Symposium (AUV), Singapore, 19–21 September 2022; IEEE: Piscataway, NJ, USA, 2022. [Google Scholar] [CrossRef]
  37. Amer, A.; Álvarez Tuñón, O.; Uğurlu, H.İ.; Le Fevre Sejersen, J.; Brodskiy, Y.; Kayacan, E. UNav-Sim: A Visually Realistic Underwater Robotics Simulator and Synthetic Data-Generation Framework. In Proceedings of the 2023 21st International Conference on Advanced Robotics (ICAR), Abu Dhabi, United Arab Emirates, 5–8 December 2023; IEEE: Piscataway, NJ, USA, 2023; pp. 570–576. [Google Scholar] [CrossRef]
  38. Cieslak, P. Stonefish: An Advanced Open-Source Simulation Tool Designed for Marine Robotics, With a ROS Interface. In Proceedings of the OCEANS 2019-Marseille, Marseille, France, 17–20 June 2019; IEEE: Piscataway, NJ, USA, 2019. [Google Scholar] [CrossRef]
  39. Potokar, E.; Ashford, S.; Kaess, M.; Mangelson, J.G. HoloOcean: An Underwater Robotics Simulator. In Proceedings of the 2022 International Conference on Robotics and Automation (ICRA), Philadelphia, PA, USA, 23–27 May 2022; IEEE: Piscataway, NJ, USA, 2022; pp. 3040–3046. [Google Scholar] [CrossRef]
  40. Manhaes, M.M.M.; Scherer, S.A.; Voss, M.; Douat, L.R.; Rauschenbach, T. UUV Simulator: A Gazebo-based package for underwater intervention and multi-robot simulation. In Proceedings of the OCEANS 2016 MTS/IEEE Monterey, Monterey, CA, USA, 19–23 September 2016; IEEE: Piscataway, NJ, USA, 2016; pp. 1–8. [Google Scholar] [CrossRef]
  41. urdf-ROS Wiki. Available online: https://wiki.ros.org/urdf (accessed on 25 July 2025).
Figure 1. Diagram of proposed altitude control system.
Drones 09 00608 g001
Figure 2. Debris removal process.
Drones 09 00608 g002
Figure 3. Comparison between DCT and Laplacian based techniques.
Drones 09 00608 g003
Figure 4. AUV in Stonefish simulation environment. Color view from AUV camera visible in bottom right corner.
Drones 09 00608 g004
Figure 5. Demonstration of debris removal algorithm.
Drones 09 00608 g005
Figure 6. Evaluation of D-L algorithm at varied altitudes and water types.
Drones 09 00608 g006
Figure 7. Evaluation of Turbidivision model at varied altitudes and water types.
Drones 09 00608 g007
Figure 8. Evaluation of AUV coverage at an altitude of 2 m.
Drones 09 00608 g008
Figure 9. Evaluation of AUV coverage at an altitude of 2.5 m.
Drones 09 00608 g009
Figure 10. Evaluation of AUV coverage at an altitude of 3 m.
Drones 09 00608 g010
Figure 11. Evaluation of AUV coverage at an altitude of 3.5 m.
Drones 09 00608 g011
Figure 12. Evaluation of AUV coverage at an altitude of 4 m.
Drones 09 00608 g012
Figure 13. Evaluation of AUV coverage at an altitude of 4.5 m.
Drones 09 00608 g013
Figure 14. Evaluation of AUV coverage at an altitude of 5 m.
Drones 09 00608 g014
Figure 15. Evaluation of AUV coverage with dynamic altitude.
Drones 09 00608 g015
Figure 16. AUV target and measured altitude during the dynamic altitude control test.
Drones 09 00608 g016
Table 1. Water types key-points evaluation environment.
Distance from start0 m20 m40 m60 m80 m100 m
Water type1CIIIIIIBIAI
Table 2. Variable descriptions and values.
AltitudeArea CoveredArea with Q   <   1 Images with Q   <   1
dynamic372.65 m 2 357.28 m 2 88.14 %
2.0 m205.55 m 2 205.55 m 2 100.00 %
2.5 m270.38 m 2 244.37 m 2 89.46 %
3.0 m336.36 m 2 265.20 m 2 79.66 %
3.5 m402.59 m 2 231.37 m 2 63.39 %
4.0 m469.36 m 2 234.19 m 2 52.54 %
4.5 m536.59 m 2 151.34 m 2 16.55 %
5.0 m601.65 m 2 32.55 m 2 0.34 %
Disclaimer/Publisher’s Note: The statements, opinions and data contained in all publications are solely those of the individual author(s) and contributor(s) and not of MDPI and/or the editor(s). MDPI and/or the editor(s) disclaim responsibility for any injury to people or property resulting from any ideas, methods, instructions or products referred to in the content.