1. Introduction
As urban populations continue to grow and private vehicle ownership rises, cities worldwide are experiencing increasing pressure on their transportation systems. Conventional approaches to traffic monitoring, such as loop detectors, fixed CCTV cameras, or manual counts, are often limited in spatial scope, data richness, and flexibility. These limitations can hinder the ability of planners and policymakers to accurately diagnose systemic traffic issues or evaluate the potential impact of infrastructure changes [
1].
In recent years, advances in unmanned aerial vehicle (UAV) technologies have opened new possibilities for real-time, high-resolution urban sensing [
2]. UAVs offer a flexible, cost-effective, and scalable means of capturing aerial traffic footage. Their ability to provide a synchronized, top-down view of vehicle movements, intersection dynamics, and pedestrian interactions makes them particularly well suited for complex urban traffic environments. Despite their growing popularity in traffic research, few studies have demonstrated how UAV data can be operationalized within a full decision-making workflow—from observation to simulation and infrastructure intervention [
3,
4].
This study addresses this gap by presenting a comprehensive methodology for UAV-supported traffic monitoring and infrastructure scenario analysis. The research was conducted in Astana, Kazakhstan, a capital city undergoing rapid urban expansion and facing increasing congestion in key districts. A 300-hectare mixed-use area was selected for analysis, encompassing over 30 high-priority intersections and road segments. Synchronized UAV observations at 30 points were conducted during peak morning and evening hours to capture the real-time dynamics of urban traffic flow across the entire zone.
The purpose of this study is twofold:
To demonstrate the feasibility and analytical value of synchronous, simultaneous UAV-based traffic monitoring conducted at multiple distributed observation points across an interconnected urban area, capturing network-wide traffic dynamics in real time.
To develop and validate a comprehensive, data-driven methodology for infrastructure strategy selection, using the traffic parameters derived from this UAV network to support simulation-based evaluation and multi-criteria decision making.
By emphasizing distributed, time-synchronized UAV observations and their integration into a structured decision support workflow, this research contributes a replicable approach for urban mobility planning. This study highlights how aerial traffic sensing can serve not only short-term operational diagnostics but also long-term strategic infrastructure development within the broader context of smart city systems.
The integration of UAVs into traffic monitoring has progressed from initial exploratory studies to more sophisticated applications. Early research focused on assessing the feasibility of using UAVs for traffic data collection, comparing their effectiveness to traditional methods. For instance, Coifman et al., in [
5], explored the potential of fixed-wing UAVs for gathering traffic parameters such as vehicle counts and speeds, demonstrating the viability of aerial platforms in capturing traffic dynamics.
As UAV technology advanced, studies began to emphasize the development of frameworks and methodologies to guide UAV-based traffic studies. Kanistras et al., in [
6], provided a comprehensive survey of UAV systems for traffic monitoring, discussing various UAV platforms and their suitability for different traffic surveillance applications. This work underscored the importance of selecting appropriate UAV types based on specific monitoring objectives and environmental conditions.
Various research has explored automated traffic analysis from drone-captured road videos to identify vehicles within images, followed by tracking techniques to monitor vehicle movements and ultimately calculate their speeds [
7,
8,
9].
One study [
10] utilized Yolo v3 [
11] to detect diverse vehicle types from UAV video footage. The research in [
12] presents a method for detecting moving targets in urban environments using drones with cameras. Despite a limited camera field of view, the approach combines frame registration, image subtraction, thresholding, and morphological operations to identify moving vehicles.
Recent research has focused on enhancing the accuracy and efficiency of UAV-based traffic monitoring through advanced methodologies and technologies. The integration of deep learning techniques has significantly improved vehicle detection and tracking capabilities. Another study [
13] proposed a deep neural network-based method for estimating vehicle speeds from UAV-recorded videos, achieving high precision and recall rates in vehicle detection and speed estimation.
Research has also employed Haar-like feature-based cascade frameworks to identify vehicle positions and dimensions through bounding boxes, with convolutional neural network methodologies [
14,
15] applied to these detection outputs to enhance final classification accuracy.
The development of universal guiding frameworks has been pivotal in standardizing UAV-based traffic studies. A notable contribution in this area is the work in [
16], which presents a comprehensive framework to ensure the safe and efficient execution of UAV-based traffic monitoring, addressing aspects such as flight planning, data collection protocols, and data processing techniques.
The research in [
17] investigated UAV applications within transportation systems, with particular emphasis on traffic monitoring and accident prevention capabilities. UAVs represent an economical solution for traffic surveillance, route optimization, and collision investigation while improving information precision and responsiveness. The analysis explores both fully autonomous drone platforms and systems requiring human oversight for traffic monitoring operations, examining technical and operational barriers alongside the necessary equilibrium for real-world deployment.
A systematic literature review [
18] examined scholarly contributions regarding UAV applications in civil engineering, with particular focus on traffic monitoring implementations. Following the PRISMA methodology, researchers identified 34 relevant publications across five academic databases. Evidence suggests this area remains an emerging field in early developmental stages. Anticipated advancements in sophisticated image processing techniques and UAV construction technologies are expected to generate exponential growth in potential applications. These developments promise substantial societal benefits, particularly in mitigating urban challenges such as traffic congestion and collision incidents in major metropolitan areas worldwide.
The author of [
19] introduces an innovative framework for incorporating unmanned aerial vehicles (UAVs) into intelligent transportation systems (ITSs), which will be essential for future smart city development. It surveys current progress, obstacles, and future trajectories in this emerging domain. The study also documents existing UAV-enabled ITS implementations while identifying critical challenges and research opportunities.
Existing research on traffic prediction and vehicle trajectory classification has established important foundations for advancements in intelligent transportation systems. A contribution [
20] introduced the Cell Transformer, which uses HD map data and discretized lane segments to forecast traffic states at signalized intersections. Building upon trajectory analysis methodologies, the authors of [
21] developed a machine learning framework that transforms UAV-captured vehicle trajectories into multiple sequence representations (space–time, speed–time, and azimuth–time).
Despite advances in UAV applications for traffic monitoring, several gaps exist in current research. Most studies demonstrate the technical feasibility of extracting traffic parameters from drone footage but fail to operationalize these capabilities within comprehensive planning workflows. Research typically focuses on isolated technical aspects without integration into end-to-end decision support systems.
The spatial synchronization of multiple observation points remains underexplored, with previous studies typically deploying UAVs at single intersections, limiting the ability to capture network-wide traffic dynamics. Limited research connects UAV-derived data directly to infrastructure scenario modeling, particularly in rapidly developing urban contexts, where traditional monitoring infrastructure is insufficient.
This study addresses these gaps by proposing and validating a comprehensive and replicable methodology for UAV-assisted urban traffic monitoring, modeling, and scenario evaluation. The research introduces a multi-stage workflow that includes synchronized multi-node UAV data collection, video-based traffic parameter extraction, simulation model development, and multi-criteria decision making for infrastructure planning. The proposed approach is grounded in a formal mathematical framework that enhances reproducibility and transferability across urban contexts.
This study addresses these gaps through several contributions:
A complete methodological framework transforming UAV-collected traffic data into actionable infrastructure decisions, encompassing the entire workflow from observation design to multi-criteria decision making.
Demonstration of synchronized multi-point UAV observations across a 300-hectare urban district, capturing network-wide traffic dynamics during peak periods.
Mathematical formalization of the UAV-to-decision pipeline, enhancing reproducibility and transferability to other urban contexts.
Validation of UAV-based traffic monitoring utility in a rapidly developing urban environment in Kazakhstan, contributing to the geographical diversity of case studies.
Empirical evidence on the effectiveness of different infrastructure intervention strategies based on UAV-calibrated simulation models.
The remainder of this paper is structured as follows.
Section 2 details the comprehensive methodological approach, beginning with the overall framework and mathematical formulation, followed by descriptions of the study area, UAV specifications, observation design, video processing techniques, and simulation model development.
Section 3 presents empirical findings from the GreenLine district in Astana, including the spatial distribution of UAV observations, traffic volumes, turning movement patterns, and comparative analysis of infrastructure improvement scenarios.
Section 4 examines the advantages and limitations of the UAV-based monitoring approach, discusses practical and policy implications, and outlines promising directions for future research.
Section 5 concludes with a summary of findings and recommendations for future research directions.
2. Materials and Methods
2.1. Framework of the UAV-Based Traffic Monitoring Study
Figure 1 illustrates the comprehensive methodological framework developed for the UAV-based traffic monitoring study conducted in Astana, Kazakhstan. This systematic workflow demonstrates how aerial data collection translates into actionable traffic management decisions through several interconnected stages.
The process begins with UAV flight planning, where a coordinated fleet of drones is strategically positioned across the study area. This leads to synchronous video collection from over 30 observation nodes during peak traffic periods, capturing time-synchronized traffic conditions throughout the network.
The workflow continues with video processing, where detection and tracking algorithms extract critical traffic parameters such as vehicle speeds and flow rates. These measurements are organized into a comprehensive traffic data matrix that serves as the foundation for subsequent analysis.
The traffic data matrix feeds into a simulation model that replicates traffic behavior across the entire study area. Through rigorous calibration and validation procedures, the model is refined to accurately represent actual traffic conditions observed in the UAV footage.
Once validated, the model enables scenario simulation to evaluate alternative infrastructure interventions. Performance indicators including delays, average speeds and congestion indices quantify the effectiveness of each scenario. These metrics inform a decision-making process where multiple criteria are weighted to identify the optimal scenario that best addresses traffic issues in the study area.
The methodology’s systematic approach ensures that insights gained from aerial observation translate directly into actionable improvements for urban mobility.
2.2. Framework for UAV-Based Traffic Monitoring and Infrastructure Decision Support
To ensure analytical consistency, traceability, and transferability, the complete methodology implemented in this study is described through a structured mathematical framework. This framework formalizes each step of the workflow—starting from the design of UAV-based observations, through the conversion of video data into quantitative traffic parameters, and continuing to the modeling, evaluation, and decision-making processes used to select optimal infrastructure scenarios.
is a set of observation nodes (intersections or segments).
Nodes are selected to maximize spatial representativeness:
where
is priority function based on traffic load, connectivity, or proximity to critical objects (e.g., schools, hospitals).
Temporal monitoring is performed during two peak periods:
—morning observation window;
—evening observation window;
—duration of observation.
Each UAV records video over node for time , producing video footage at the point with geographic coordinate at moment .
Post-processing techniques (e.g., object detection, tracking algorithms) are used to extract discrete vehicle trajectories for each vehicle at node . From these, the following core traffic parameters are derived, speed , flow rate , density and average speed , where is number of vehicles at location during time or interval , and is length of the road segment or observation window at location .
These are organized into a structured time-indexed matrix
representing all observed traffic indicators at time
.
where
denotes control delay or observed queuing time. Matrix
feeds the simulation model to reproduce or evaluate traffic behavior over time.
Let is set of scenarios including baseline . Each scenario defines a modified parameter set . Relevant performance indicators for comparison include average vehicle delay, average travel speed, emissions, network throughput. These indicators form the basis of multi-criteria evaluation.
For each scenario
, a microscopic or hybrid simulation model
is used to replicate observed traffic behavior and assess proposed infrastructure scenarios. Here,
represents the set of time-indexed traffic matrices
derived from UAV data across the full observation period.
Model calibration is performed by minimizing the discrepancy between simulated and observed indicators.
where
and
are the simulated and observed performance vectors, respectively.
To select the optimal scenario, a multi-criteria utility function is used. First, performance indicators (scenario , criterion ) are transformed into a dimensionless score , so that all criteria can be compared fairly.
There are two types of criteria:
Benefit criteria (higher is better), e.g., speed, throughput.
Cost criteria (lower is better), e.g., delay, emissions.
For benefit criteria (e.g., speed, throughput):
If is the maximum, . If is the minimum, .
For cost criteria (e.g., delay, emissions):
If is the lowest cost, . If is the worst, .
Then, a weighted sum model computes the utility score:
where
is the weight assigned to criterion
.
The best scenario is selected as
This mathematical framework supports the structured transformation of UAV-based traffic observations into actionable planning insights and enables reproducible, evidence-based comparison of infrastructure alternatives in urban settings.
Table 1 summarizes the symbols used in the normalization and utility score computation formulas described above.
As an illustrative example, consider three hypothetical scenarios evaluated on two criteria, average delay (cost-type) and average speed (benefit-type), with equal weights
. The raw performance values are shown in
Table 2.
For speed (benefit type):
Normalized scores and utility scores are computed in
Table 3.
The computed utility scores reveal a clear ranking among the three hypothetical scenarios. Scenario C, which demonstrates the lowest average delay and highest average speed, achieves the maximum utility score of 1.00 and is, thus, identified as the optimal scenario under the given weighting scheme. This example demonstrates how the normalization and weighting process supports transparent and quantitative measurement.
2.3. Study Area and Objectives
This study was conducted in the city of Astana, the capital of Kazakhstan, which is experiencing rapid urban growth and increasing transportation demand. The selected study area covers approximately 300 hectares in a strategically important urban GreenLine. This area includes a diverse mix of land uses—residential neighborhoods, commercial zones, schools, and public transportation corridors—resulting in complex and fluctuating traffic patterns during peak periods.
The choice of this zone was motivated by several factors: its representation of typical traffic issues encountered in fast-developing urban environments; the presence of multiple intersections and road segments known to experience recurrent congestion; ongoing and planned urban development projects in the vicinity that require informed transport planning; and the area’s potential as a pilot zone for implementing smart mobility solutions based on UAV data.
The overarching objective of this study was to test and validate the use of UAVs for real-time, multi-point urban traffic monitoring and to demonstrate how these data could be transformed into actionable insights for traffic modeling and infrastructure planning.
Specific research objectives included the following: designing and executing a synchronous UAV monitoring operation to capture traffic conditions across multiple nodes during morning and evening peak periods; processing aerial video to extract traffic parameters such as flow rates, vehicle speeds, and delays; integrating the UAV-derived data into a calibrated traffic simulation model of the study area; developing and evaluating alternative infrastructure development scenarios based on simulation outputs; and proposing optimal interventions to improve traffic flow, reduce delays, and enhance multimodal accessibility.
By focusing on a high-priority zone within Astana, we aimed to generate transferable methodologies and results that can be extended to other districts and cities seeking to leverage UAV technology in support of smart urban planning.
2.4. UAV Platform and Sensor Specifications
The aerial traffic monitoring campaign relied on a coordinated fleet of unmanned aerial vehicles (UAVs) equipped with high-resolution visual sensors. The UAVs were selected based on their ability to meet operational requirements, such as flight stability, sufficient flight time, real-time video capture, and compliance with local aviation regulations for urban deployments.
The UAVs used in this study belonged to the category of small, commercially available quadcopters with the following typical characteristics: maximum flight altitude up to 120 m above ground level (in accordance with local regulations); operational endurance 20–30 min per flight, depending on environmental conditions; hovering capability: stable hover with GPS assistance, allowing for fixed-point observation; control range up to 5 km with line-of-sight communication; return-to-home function, obstacle avoidance sensors, and geofencing.
Each UAV was assigned to a predefined observation node and programmed to maintain a stationary or slowly orbiting position to continuously record video from a consistent angle during the entire monitoring window.
The UAVs were equipped with integrated cameras optimized for overhead traffic monitoring: sensor type CMOS visual sensor; video resolution minimum 1080p (Full HD) at 30 frames per second; field of view with wide-angle lens (~85–100 degrees), providing comprehensive coverage of intersections and road segments; video stabilization with gimbal-mounted camera for vibration compensation and smooth image capture; storage with onboard SD card storage with backup wireless streaming where feasible.
The quality of video output was sufficient for vehicle detection, classification, and motion tracking via post-processing. To ensure consistent visual quality, UAVs were operated during daylight under favorable weather conditions (clear or lightly overcast skies, wind speeds below 6 m/s).
All UAV operations were conducted in line with national civil aviation authority regulations, which include altitude restrictions, no-fly zones (e.g., near airports and sensitive infrastructure), and mandatory line-of-sight operation. Pilots were certified and trained to operate in urban environments, and additional safety measures, including predefined emergency landing protocols, were implemented.
By carefully selecting the UAV platforms and configuring them for stable, high-resolution video capture, the research team ensured that the collected footage would be both legally compliant and technically sufficient for detailed traffic analysis.
2.5. Observation Design and Data Collection
The design of the UAV-based observation campaign was guided by the need to obtain a comprehensive, time-synchronized view of traffic conditions across a large and complex urban area. The approach combined strategic site selection, coordinated flight scheduling, and standardized observation protocols to ensure high data quality and spatial-temporal consistency.
More than 30 observation nodes were selected within the 300-hectare study area, including key intersections, arterial road segments, and access roads to residential complexes, schools, and commercial centers. These points were chosen based on historical traffic congestion reports and complaints from residents, expert assessments of geometric design constraints and traffic signal performance, proximity to key mobility generators and attractors, and need to cover a balanced mix of primary and secondary roads.
The distribution of observation points ensured broad coverage of traffic behavior across the entire district.
To capture representative traffic patterns, observations were conducted during two critical peak periods: morning peak 07:45–08:45 and evening peak 18:15–19:15.
These periods coincide with typical commuting times, school drop-offs, and evening returns, thus reflecting the highest variation and demand in traffic flow.
Each UAV was assigned a fixed observation point and recorded continuous video footage for a full 60 min duration during both the morning and evening time windows. Observations for all points were synchronized to occur simultaneously, ensuring that the resulting dataset would represent a coherent snapshot of the entire traffic network at given time intervals.
The synchronized observation strategy allowed for the accurate mapping of directional traffic flows between locations; identification of upstream and downstream congestion interactions; and network-wide performance analysis under comparable conditions.
Each UAV captured video in high-definition format, maintaining a top-down view of the traffic scene. Operators ensured that the entire intersection or road segment was clearly visible, camera angles were adjusted to minimize distortion and maximize field of view, and redundant recordings were made for selected locations to ensure data integrity.
Weather forecasts and real-time conditions were checked prior to each deployment to avoid issues with wind, rain, or low visibility. In the event of adverse weather or technical failures, alternate flight days were scheduled to maintain dataset consistency.
The structured, systematic approach to observation design ensured that the drone-collected video data would be both spatially comprehensive and temporally aligned, providing a robust foundation for subsequent video processing and traffic modeling.
2.6. Video Processing and Traffic Parameter Extraction
Following the UAV-based data collection phase, the recorded aerial video footage was processed to extract key traffic performance metrics. This stage transformed raw visual data into structured, machine-readable inputs suitable for simulation modeling and quantitative analysis.
All video files were reviewed to ensure clear visibility of road markings and vehicles; continuous coverage for the entire 60 min observation window; and sufficient resolution and frame rate for reliable vehicle detection and tracking. Clips with visual obstructions (e.g., birds, strong sun glare, or partial occlusion from trees) were flagged, and corrective measures such as frame interpolation or exclusion were applied.
The bounding boxes for each detected vehicle in a segment were extracted from each video frame.
Each vehicle’s trajectory was reconstructed in two-dimensional space, and vehicle motion vectors were computed to estimate instantaneous speed. These trajectories enabled the calculation of turning movements, entry/exit volumes, and signal compliance behavior at intersections.
Using the vehicle trajectory data, several parameters were computed for each location and time interval: flow rate (the number of vehicles passing a reference line divided by the time interval); average speed (the mean of all individual vehicle speeds); and density (the number of vehicles divided by segment length). These parameters formed the basis of the traffic data matrix used in simulation calibration.
Using the vehicle trajectory and timing data, additional performance indicators were derived: travel time for each vehicle across the observation zone; control delay at signalized intersections; queue length estimation using temporal-spatial clustering of stopped or slow-moving vehicles; and illegal or unsafe behavior detection, such as red-light running or lane blockages.
The final outputs were structured into standardized datasets suitable for import into traffic simulation platforms: time-stamped vehicle counts and movements by turning direction, segment-based speed and flow profiles, and point-based arrival/departure curves for intersection analysis. All data were geo-referenced and timestamped, enabling seamless alignment with the digital traffic network model. The structured datasets served as the direct input for model calibration and validation in the next research phase.
2.7. Traffic Data Aggregation and Structuring
Once traffic parameters were extracted from the UAV video footage, the next step involved aggregating and structuring the data into consistent formats suitable for traffic simulation, scenario testing, and visualization. This process ensured that detailed micro-level observations were transformed into mesoscopic and network-wide representations compatible with the modeling platform.
To smooth fluctuations and allow for a consistent comparison across locations, the extracted data were aggregated into uniform time intervals. A standard aggregation interval of 5 min was applied across all observation points, resulting in 12 data intervals per 1 h session.
For each time interval and observation node, the following aggregated values were computed: vehicle flow (sum of vehicles passing through during the time interval), average speed (mean of all individual vehicle speeds in the interval), density estimate (flow divided by average speed) and delay (difference between actual travel time and free-flow travel time over the segment length). These time-series data enabled the creation of temporal traffic profiles for each location.
Each observation point was geolocated using UAV GPS metadata and aligned to a digital road network. Traffic parameters were mapped to links (road segments) for flow and speed profiles; nodes (intersections) for turning movements and delays; and approaches for signal control data preparation.
The UAV-observed movements were categorized into standard movement classes: left turn, though, right turn for each approach, and entry and exit volumes for each leg of the intersection. These were used to define the origin-destination demand matrices at the microscopic scale for each time interval.
Prior to model integration, the dataset underwent quality control procedures to correct or filter out anomalies: noise smoothing for speed fluctuations using moving average filters; outlier removal for implausible trajectories or vehicle behaviors (e.g., negative speeds); and data imputation for minor missing segments using interpolation techniques.
The final structured datasets were exported into model-compatible formats, including CSV tables of flows and turning counts per node and interval, XML or JSON files for direct import into simulation engines Vissim 2023 [
22] and shape files and GIS layers for geospatial visualization and scenario overlays.
This structured dataset formed the base model input used for simulation calibration and future scenario analysis. It provided a complete, time-resolved picture of current traffic conditions across the entire monitored area, with direct links to real-world UAV observations.
2.8. Simulation Model Development
The traffic simulation model served as the analytical core of this study, enabling the transformation of UAV-derived traffic observations into a dynamic representation of real-world traffic conditions. This model provided the basis for scenario testing, infrastructure planning, and performance forecasting.
A microscopic or hybrid traffic simulation platform was selected for its ability to accurately simulate individual vehicle behaviors and interactions; represent real-time variations in traffic flow and signal control; and support calibration based on high-resolution observational data. The platform supported full integration of the spatial network, signal timing plans, traffic demands, and turning movements derived from UAV observations.
The base network for the study area was constructed using detailed geographic data, supplemented by aerial imagery and UAV footage for geometry verification; field observations for signal phasing and lane usage; and GIS layers for alignment of road links, nodes, and intersection layouts. Each link was defined by its length, number of lanes, speed limit, and capacity. Intersections were modeled with complete phase sequences, clearance times, and permissible turning movements.
Traffic demand inputs were derived from the aggregated UAV data, including hourly volume per movement (left, though, right); directional split ratios at intersections; and time-varying flow profiles for each segment. These inputs formed the origin-destination (OD) matrices and movement distributions for each simulation period (morning and evening peaks). The OD demand matrix represents the number of vehicles moving from each origin to each destination at each time interval. These matrices were generated using inverse modeling techniques from entry/exit counts and turning volumes.
Behavioral models were configured to reflect local driving patterns, including car-following models with calibrated sensitivity and reaction parameters; lane-changing models accounting for aggressive merging behavior and intersection conflicts; and signal compliance models to reflect observed red-light running or early departures. Vehicle classes were assigned based on UAV classification output, with different acceleration, deceleration, and space headway profiles.
Each simulation run represented a 1 h peak period, discretized into small time steps (e.g., 1 s). The model was executed multiple times using different random seeds to capture variability and ensure statistical robustness. Simulation outputs included travel time per vehicle and per link; queue lengths and wait times at intersections; and network-wide indicators such as vehicle hours traveled and average delay. These outputs were later compared to UAV-observed metrics during calibration and used to evaluate the impact of proposed infrastructure scenarios.
2.9. Calibration and Validation
The credibility and predictive power of the simulation model depend heavily on accurate calibration and validation using real-world data. In this study, high-resolution UAV-derived traffic parameters provided an exceptional empirical foundation for adjusting the simulation model to reflect actual traffic conditions.
The calibration process aimed to minimize the discrepancies between simulated and observed traffic performance indicators. Specifically, the following key metrics were used as calibration targets: average vehicle speed per segment; vehicle flow rates at major links and turning movements; queue lengths at intersections; and average travel times across predefined routes. The goal was to find the optimal model parameters that would minimize the sum of squared differences between simulated values and observed values across all indicators.
Calibration was conducted iteratively using a combination of manual tuning, guided by visual comparisons of trajectories and delay patterns; automated optimization algorithms, where feasible, to adjust model parameters to minimize error functions; and expert review, based on local traffic knowledge and consistency with expected behavioral norms. The calibration procedure prioritized critical intersections and corridors identified as congestion hotspots during the UAV monitoring stage.
Once calibrated, the model was validated using a separate set of observational data not used during calibration. The validation process involved comparing simulation output (speed, delay, queue length) with UAV-derived values; checking the temporal dynamics of traffic buildup and dissipation across multiple time intervals; and ensuring that the model reproduced spatial patterns of congestion consistent with aerial observations.
Key statistical measures used for validation included mean absolute percentage error (MAPE), which calculates the average percentage difference between simulated and observed values, and root mean squared error (RMSE), which measures the square root of the average squared differences between predicted and actual values:
where
is the simulated value of traffic performance indicator
produced by traffic model;
is the observed value of the same indicator
, derived directly from UAV video data (i.e., empirical measurements).
Validation thresholds followed accepted industry guidelines, with further refinement applied to key decision-critical nodes.
The calibrated and validated model accurately reproduced traffic performance under baseline conditions. It was deemed reliable for use in forecasting the effects of proposed infrastructure interventions under similar demand scenarios.
2.10. Infrastructure Scenario Development
With the calibrated and validated simulation model in place, this study proceeded to the development of alternative infrastructure scenarios aimed at improving traffic performance within the study area. These scenarios were formulated based on insights gained from the UAV observations and simulation outputs, combined with urban planning objectives and practical implementation constraints.
Each infrastructure development scenario was designed to address specific inefficiencies or bottlenecks identified in the baseline analysis, including excessive queueing at intersections; conflict-heavy turning movements; poor coordination of signal phases; and delays near residential complexes, schools, and public transport stops. The scenario design process followed these key principles: targeted interventions (localized changes focused on high-impact nodes or corridors); feasibility (only technically and financially implementable measures were considered); minimal disruption (preference for interventions requiring minimal structural reconstruction); and multimodal impact (consideration of pedestrian, cyclist, and public transport flows where relevant).
The proposed scenarios included a variety of infrastructure and operational interventions, such as intersection geometry changes (addition or extension of left-turn lanes; channelization of right-turn movements; realignment of skewed intersections); signal timing and phasing adjustments (optimization of green splits based on UAV-measured demand; introduction of protected turn phases; implementation of adaptive signal control in key corridors); reconfiguration of road segments (conversion of underused lanes to bus-only lanes or parking removal; installation of pedestrian refuge islands or dedicated crossings); and public transport and access improvements (relocation of bus stops to reduce blockages and delays; designation of drop-off/pick-up zones at schools and public facilities). Each proposed change was encoded into a modified version of the digital traffic network model for simulation.
Each scenario was formally defined by a modified set of parameters, including revised network topology; updated signal timing plans; adjusted routing assumptions; and new control or access restrictions where applicable. All changes were documented with schematic diagrams and GIS overlays to ensure traceability and facilitate comparison across scenarios.
A total of five infrastructure scenarios were developed, in addition to the baseline model:
—Baseline (current conditions)
—Signal timing optimization only
—Intersection redesign at two major nodes
—Combined geometry and signal adjustments
—Public transport and pedestrian enhancements
—Integrated scenario (full package of modifications)
These scenarios were subjected to performance testing in the next phase of this study to determine their relative effectiveness and practicality.
2.11. Scenario Simulation and Performance Evaluation
Each proposed infrastructure scenario was simulated under identical traffic demand and environmental conditions as the baseline model, allowing for a direct comparison of their impacts on traffic performance. The goal of this phase was to quantify how each intervention would affect traffic flow, delays, congestion, and system-wide efficiency.
All scenarios were implemented in the calibrated simulation model. Key features of the simulation process included consistent input parameters, including origin-destination matrices and behavioral models; peak-hour replication, with separate simulations for morning and evening periods; and multiple simulation runs using different random seeds to ensure statistical reliability of outputs. The simulation duration was set to 60 min of modeled time, with a warm-up period of 10–15 min to stabilize traffic dynamics.
For each scenario, a suite of key performance indicators was computed, covering multiple dimensions of traffic system performance: travel efficiency (average travel time per vehicle, average speed, vehicle hours traveled); congestion and delay (average vehicle delay, total network delay, intersection-specific delay heatmaps); throughput and capacity utilization (number of vehicles served, queue lengths and spillbacks); environmental impact (estimated vehicle emissions and fuel consumption using speed-emissions models); and multimodal effects where applicable (changes in bus delay or headway regularity, pedestrian crossing wait times). All indicators were aggregated both at the network level and per corridor or intersection, enabling a granular understanding of performance changes.
Each scenario’s outputs were compared against the baseline scenario to determine relative improvements, calculated as the difference between the baseline indicator value and the scenario indicator value.
2.12. Decision-Making Model
To determine the most effective infrastructure scenario, a structured decision-making model was applied, using a multi-criteria evaluation framework. This allowed us to consider diverse and often competing performance goals, such as minimizing delay, reducing emissions, improving travel time, and enhancing multimodal accessibility, within a unified analytical approach.
A set of quantitative and qualitative performance indicators was chosen based on their relevance to urban mobility policy, stakeholder preferences, and data availability. The final evaluation included the following criteria: average vehicle delay (cost type); network throughput (benefit type); average travel time (cost-type); vehicle emissions (cost type); implementation cost (cost type); and Multimodal accessibility (qualitative/benefit-type). Each criterion was normalized to allow for comparisons across different units and scales.
Performance values for each scenario under each criterion were normalized using min–max scaling.
The overall utility score for each scenario was computed using the weighted sum model, calculated as the sum of the products of each criterion’s weight and normalized score. Scenarios were ranked based on this utility score, and the scenario with the highest score was selected as the recommended infrastructure intervention.
To ensure the robustness of the decision, a sensitivity analysis was conducted by varying the weights and observing the stability of the scenario rankings. This helped identify scenarios that were consistently effective across different planning priorities and risk tolerances.
The scenario with the highest score under most weighting configurations—and demonstrating improvements in both operational and environmental metrics—was selected for recommendation. The results were presented with both numerical rankings and visual decision matrices for transparency and stakeholder engagement.
In this study, equal weights were initially assigned to all criteria in the multi-criteria decision analysis (MCDA) utility function to ensure a neutral, baseline comparison of scenario performance. This approach was chosen to avoid bias in the absence of formal stakeholder input during the initial evaluation phase.
Recognizing the potential influence of weight distribution on scenario rankings, a one-way sensitivity analysis was conducted to test the robustness of the results. In this analysis, the weight of each criterion was independently increased by increments of 10% (while proportionally adjusting others) to observe the impact on the overall utility scores and final ranking of scenarios.
The analysis confirmed that Scenario S5 remained the top-ranked alternative under all tested weighting configurations, followed closely by Scenario S3. While minor shifts were observed in the ranking of middle-performing scenarios, the general performance hierarchy proved stable across a range of plausible weight assignments. This finding reinforces the robustness of the recommended intervention strategy.
A summary of the sensitivity analysis results is provided in
Appendix A for reference.
3. Results
This section presents the findings from the UAV-based traffic monitoring, baseline condition analysis, infrastructure scenario simulations, and multi-criteria evaluation process. The results are reported at both the network-wide level and at specific nodes of interest, with emphasis on measurable improvements in traffic performance, congestion relief, and system efficiency.
3.1. Study Area: GreenLine District, Astana
The experimental study was conducted in the GreenLine district of Astana, Kazakhstan (
Figure 2). This area exemplifies modern urban planning, integrating residential neighborhoods with a cohesive concept of convenience and accessibility. The district features a blend of monolithic residential complexes, landscaped public spaces, and a network of pedestrian-friendly boulevards, such as the GreenLine Boulevard, designed for walking and outdoor activities. The architectural style combines cozy and modern elements, with facades made of composite lighting, HPL panels, clinker brick, and fiber concrete. The area is well equipped with amenities, including educational institutions like the Quantum STEM School, shopping centers, kindergartens, restaurants, and recreational facilities, making it an ideal location for studying urban traffic dynamics and infrastructure optimization.
3.2. UAV-Based Traffic Observation Points
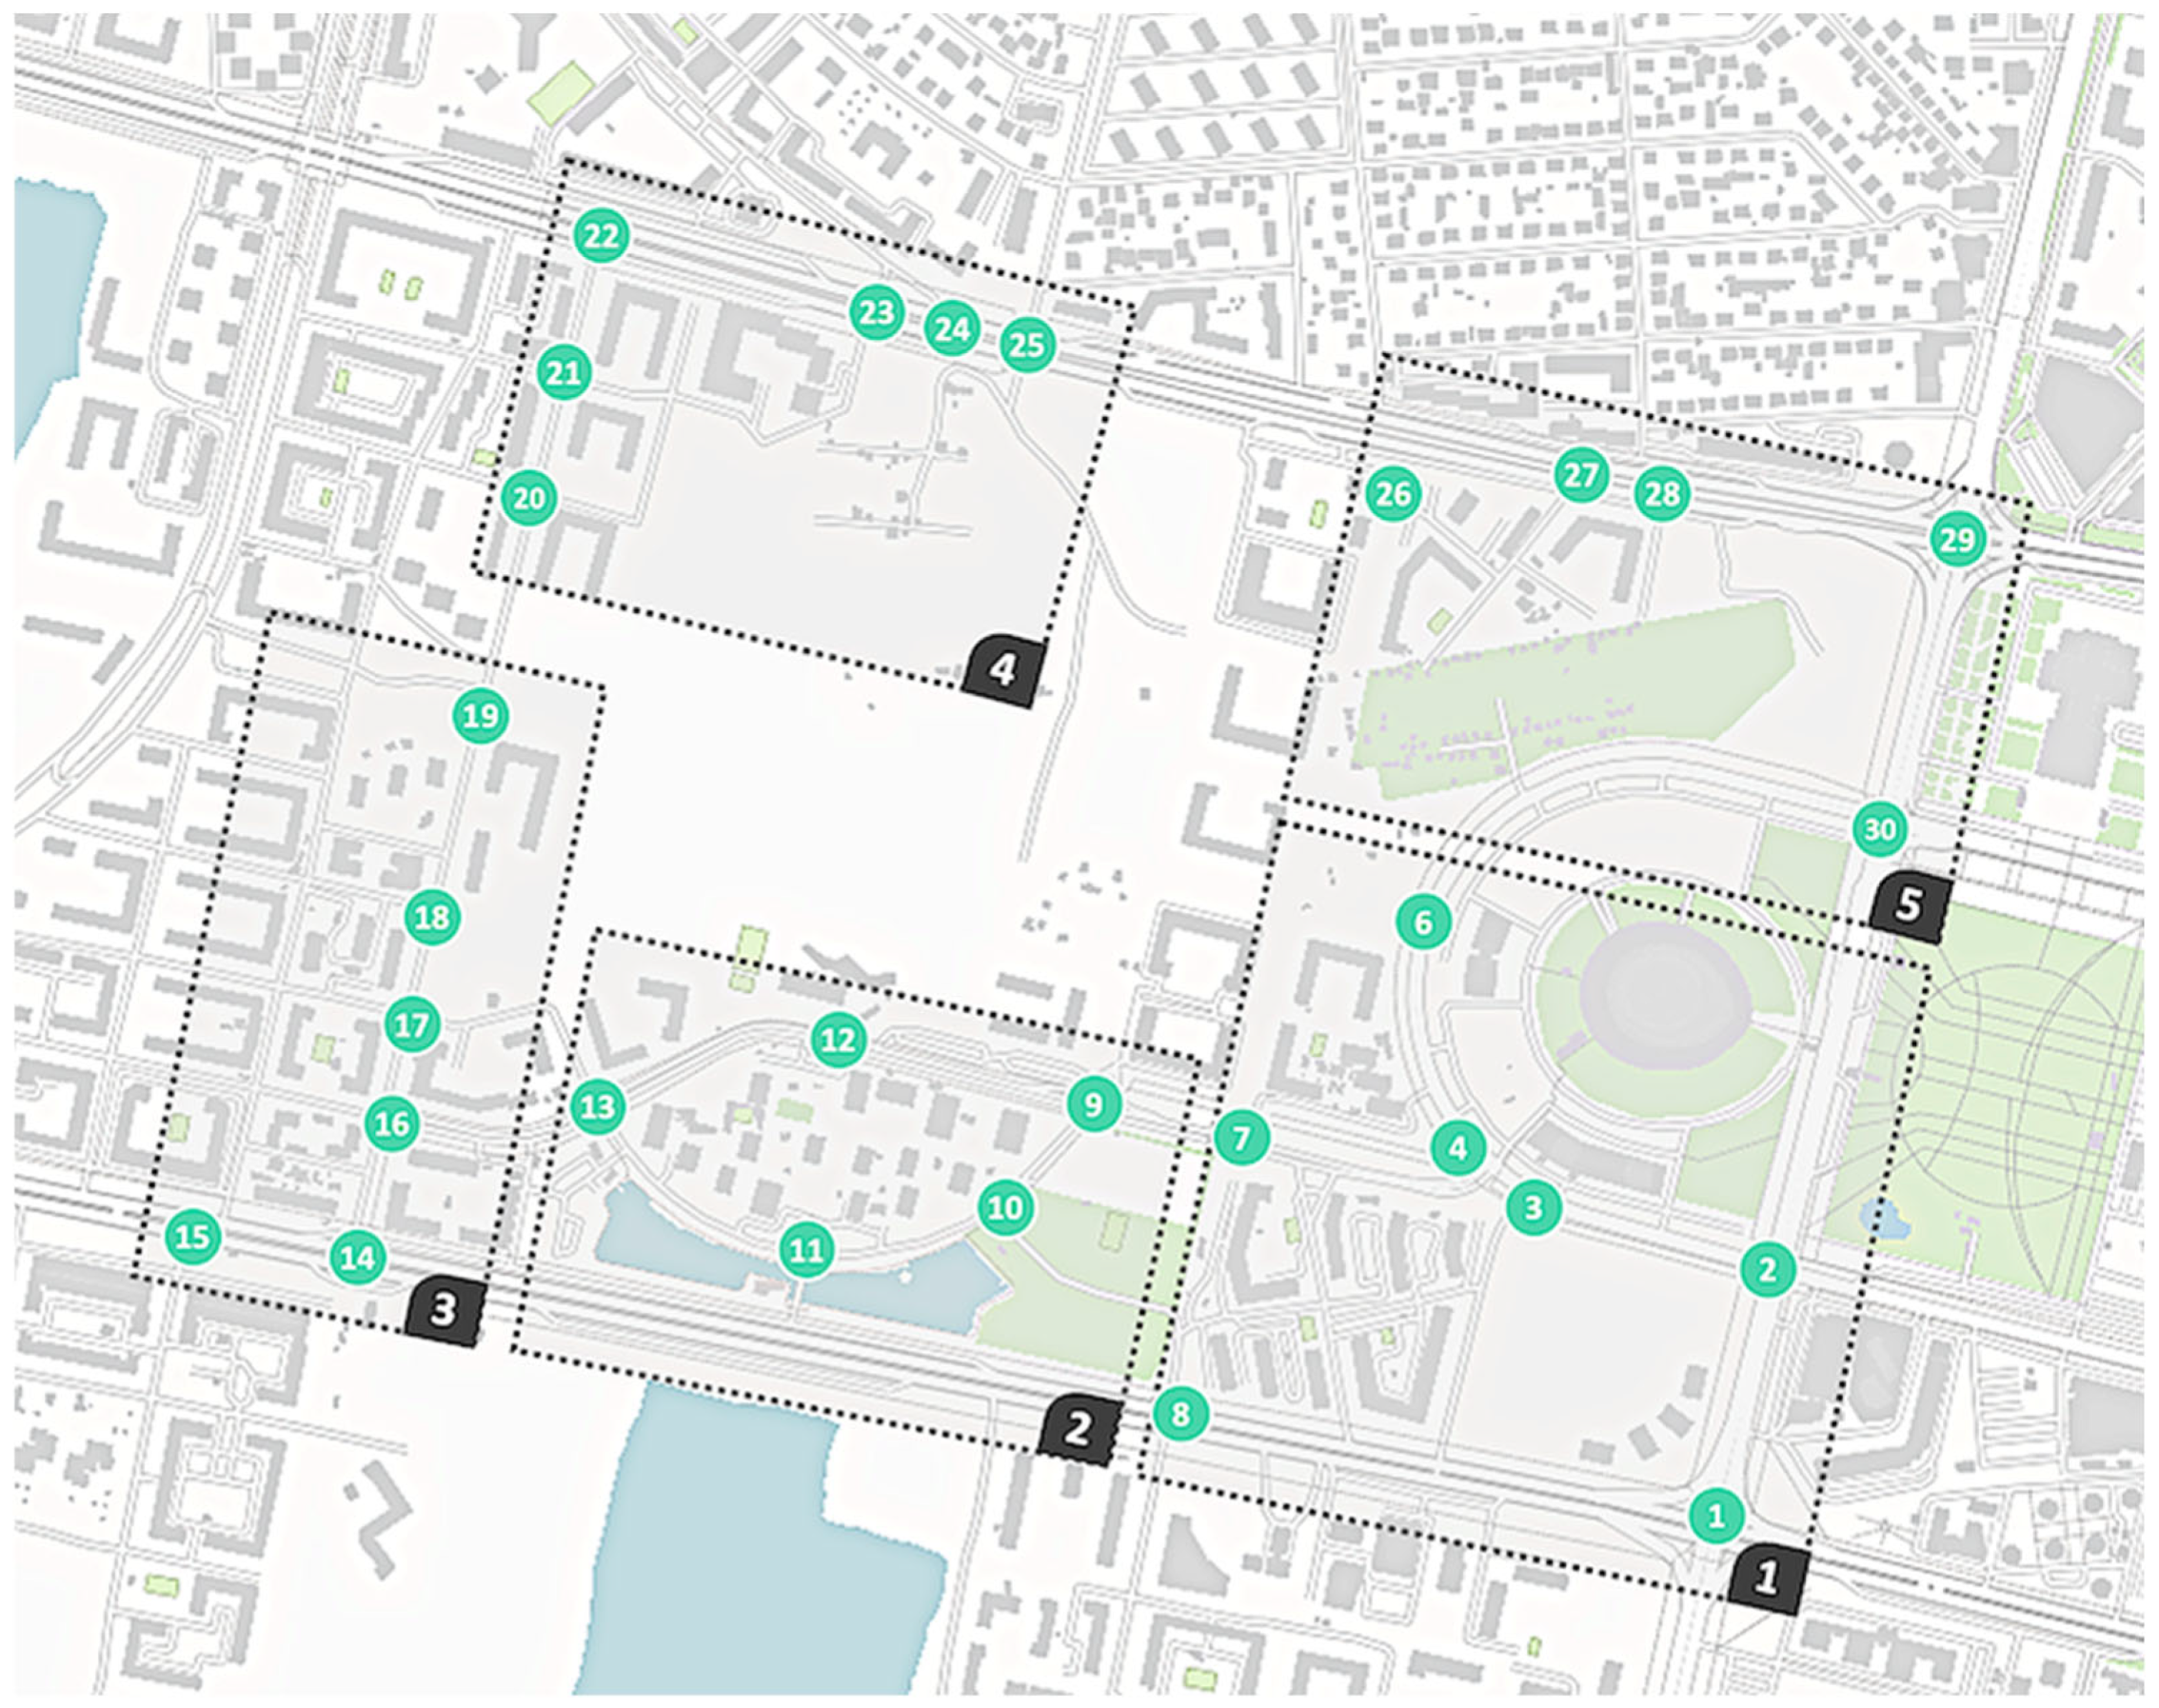
To obtain a synchronized and spatially rich dataset for traffic modeling, a comprehensive drone-based traffic monitoring campaign was conducted within the GreenLine district of Astana. Observations were carried out simultaneously at 30 selected points, enabling direct comparison across multiple traffic hubs under identical time conditions.
These points were strategically distributed across signalized intersections, critical pedestrian crossings, and arterial links to capture the representative dynamics of the local urban transport system. This spatial distribution ensured that both vehicular flow corridors and potential bottlenecks were included in the observation scope.
The layout of UAV monitoring locations is presented in
Figure 3, which illustrates the coverage area and IDs assigned to each monitored segment. The spatial synchronization of the data collection process provided a unique advantage in constructing an accurate baseline model and in evaluating the impact of different infrastructure development scenarios.
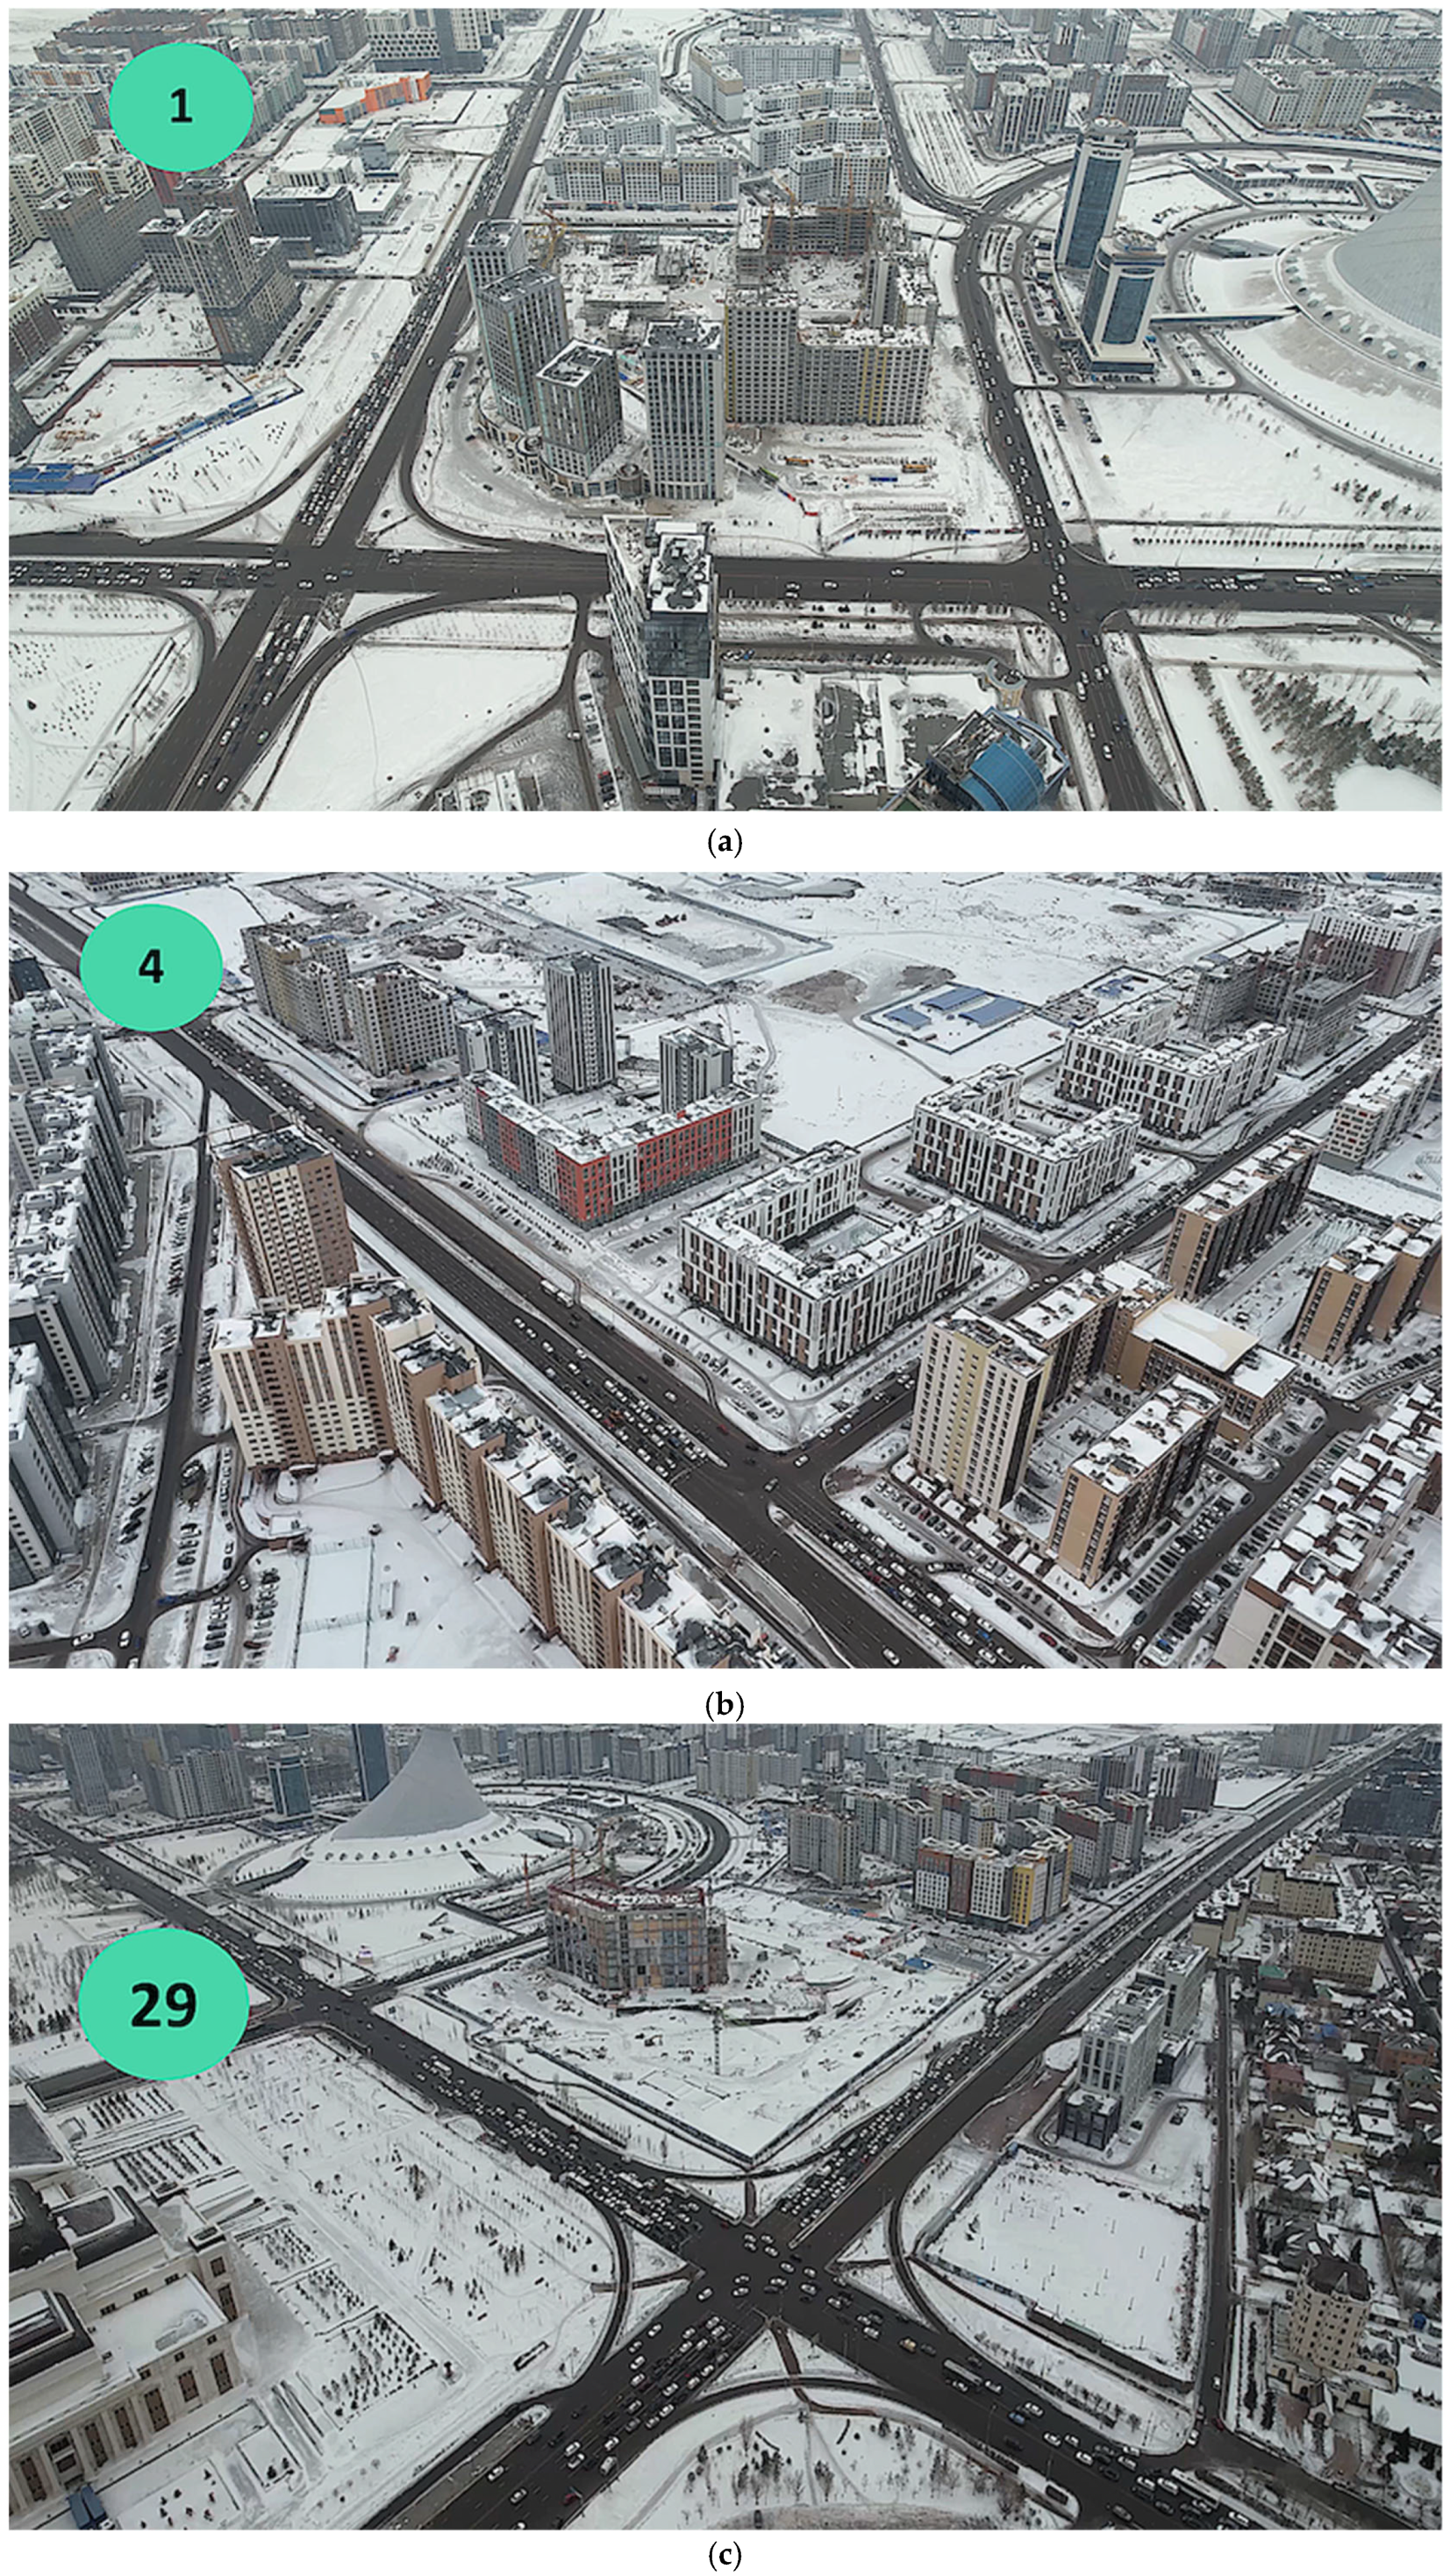
To evaluate localized traffic patterns and intensity, drone monitoring was conducted at each of the 30 selected observation points during both the morning and evening peak periods.
Figure 4 illustrates examples of the spatial distribution of UAV-based traffic monitoring conducted during the morning peak period (07:45–08:45) in different monitoring points.
Each drone hovered at a predefined altitude and position, enabling full aerial visibility of intersections, pedestrian crossings, and adjacent road segments. This configuration allowed for the collection of uninterrupted video footage over all critical links and intersections without overlap or blind spots. The captured data include directional flow rates, queue formation, turning movement behavior, and interaction with non-motorized users, such as cyclists and pedestrians.
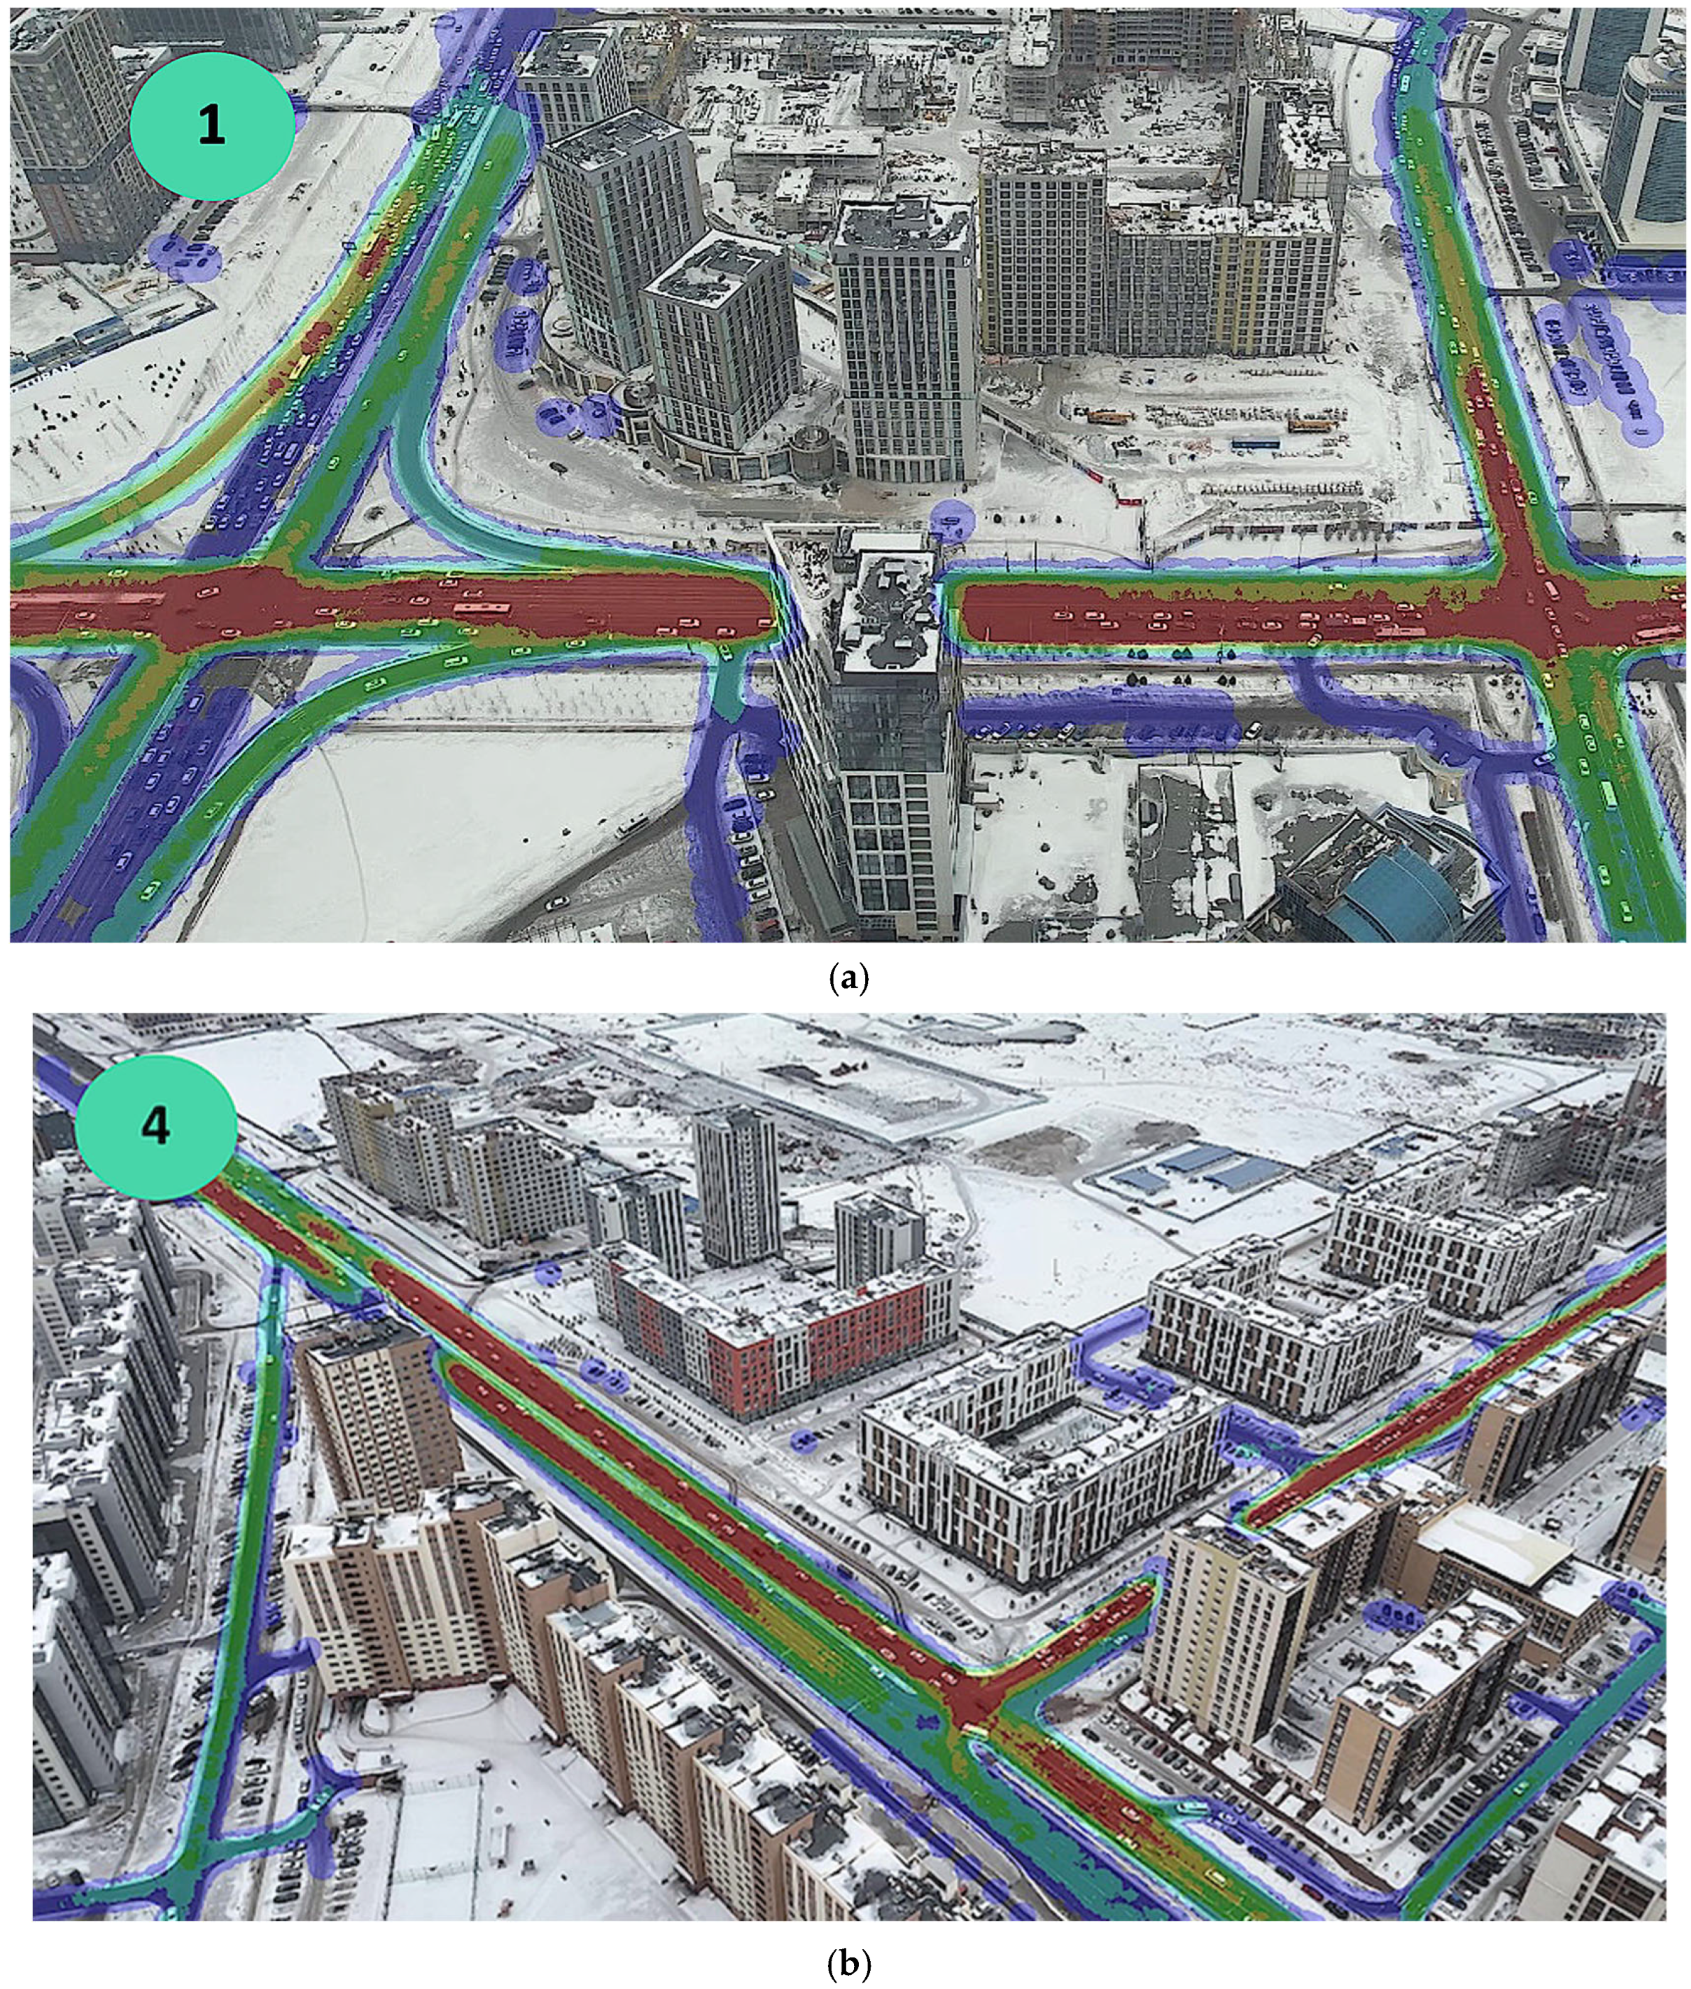
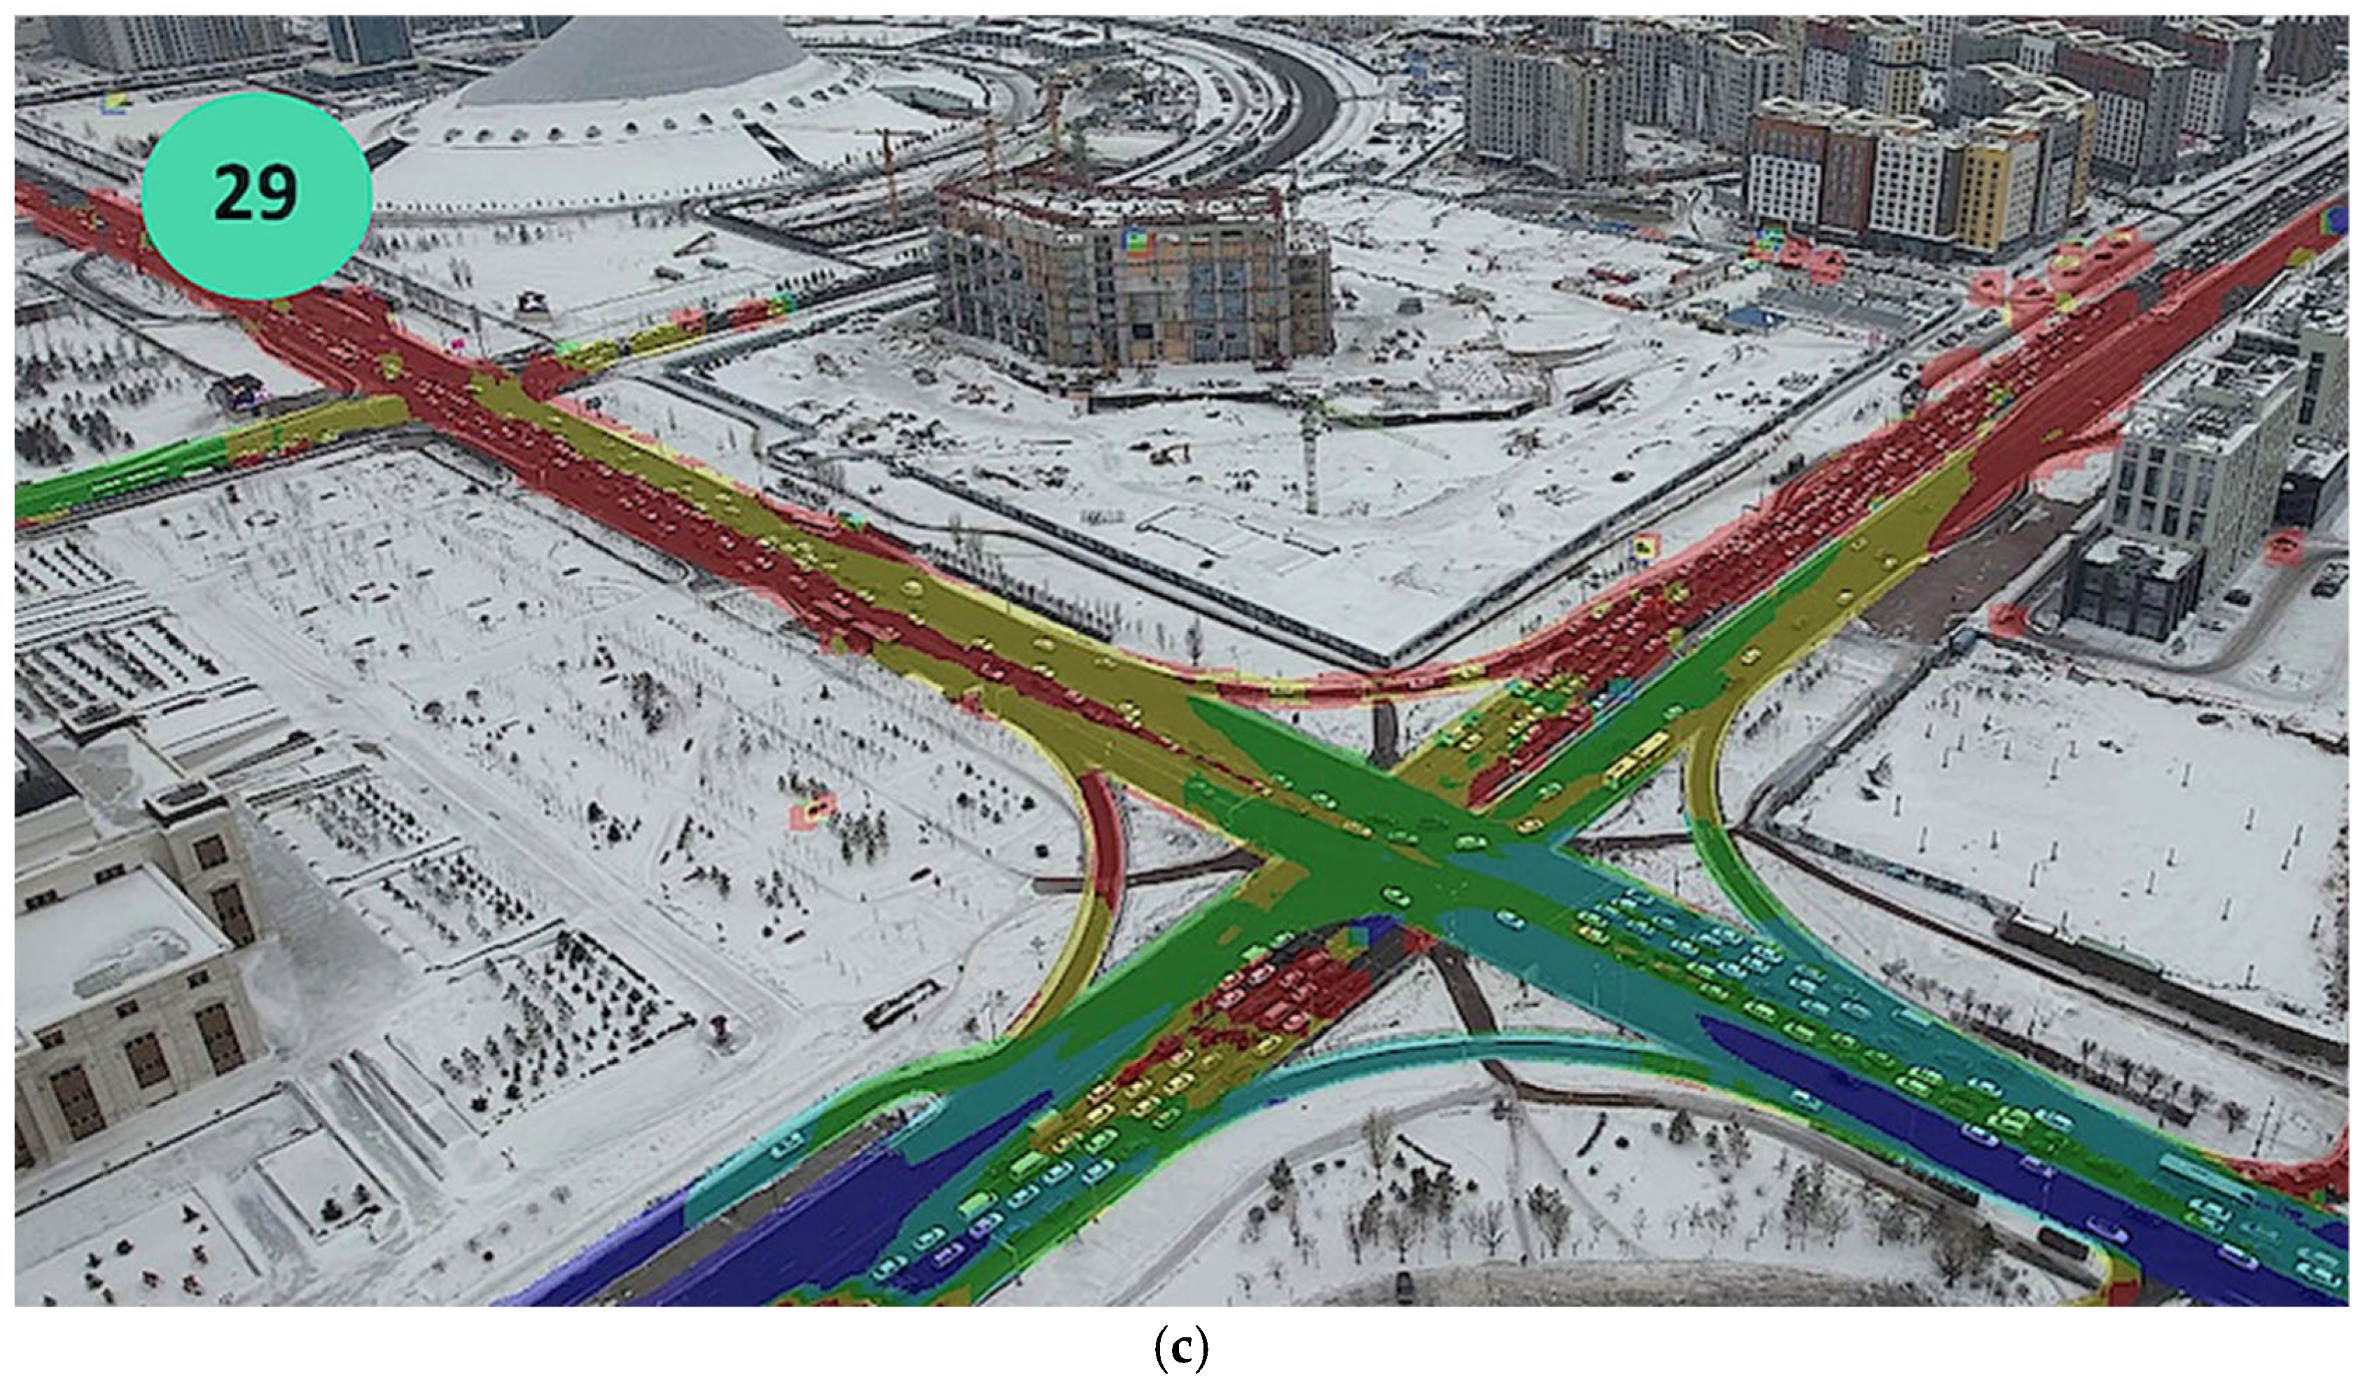
Figure 5 offers an example of the visualization of directional traffic intensity and point-specific flow structure observed during UAV monitoring across the GreenLine district. These maps illustrate traffic volumes not just by location but also by movement direction, enabling a nuanced understanding of corridor usage and intersection load asymmetries during peak periods.
Each arrow or segment on the map represents a recorded directional traffic flow, measured in vehicles per hour, based on UAV-captured video processed through trajectory analysis and counting algorithms.
These directional data added significant value to both calibration and scenario modeling, allowing for the precise validation of turning movement proportions and realistic modeling of signal timing impacts. It also enabled the identification of flow conflict zones and supported targeted proposals for the reallocation of lane space or intersection reconfiguration.
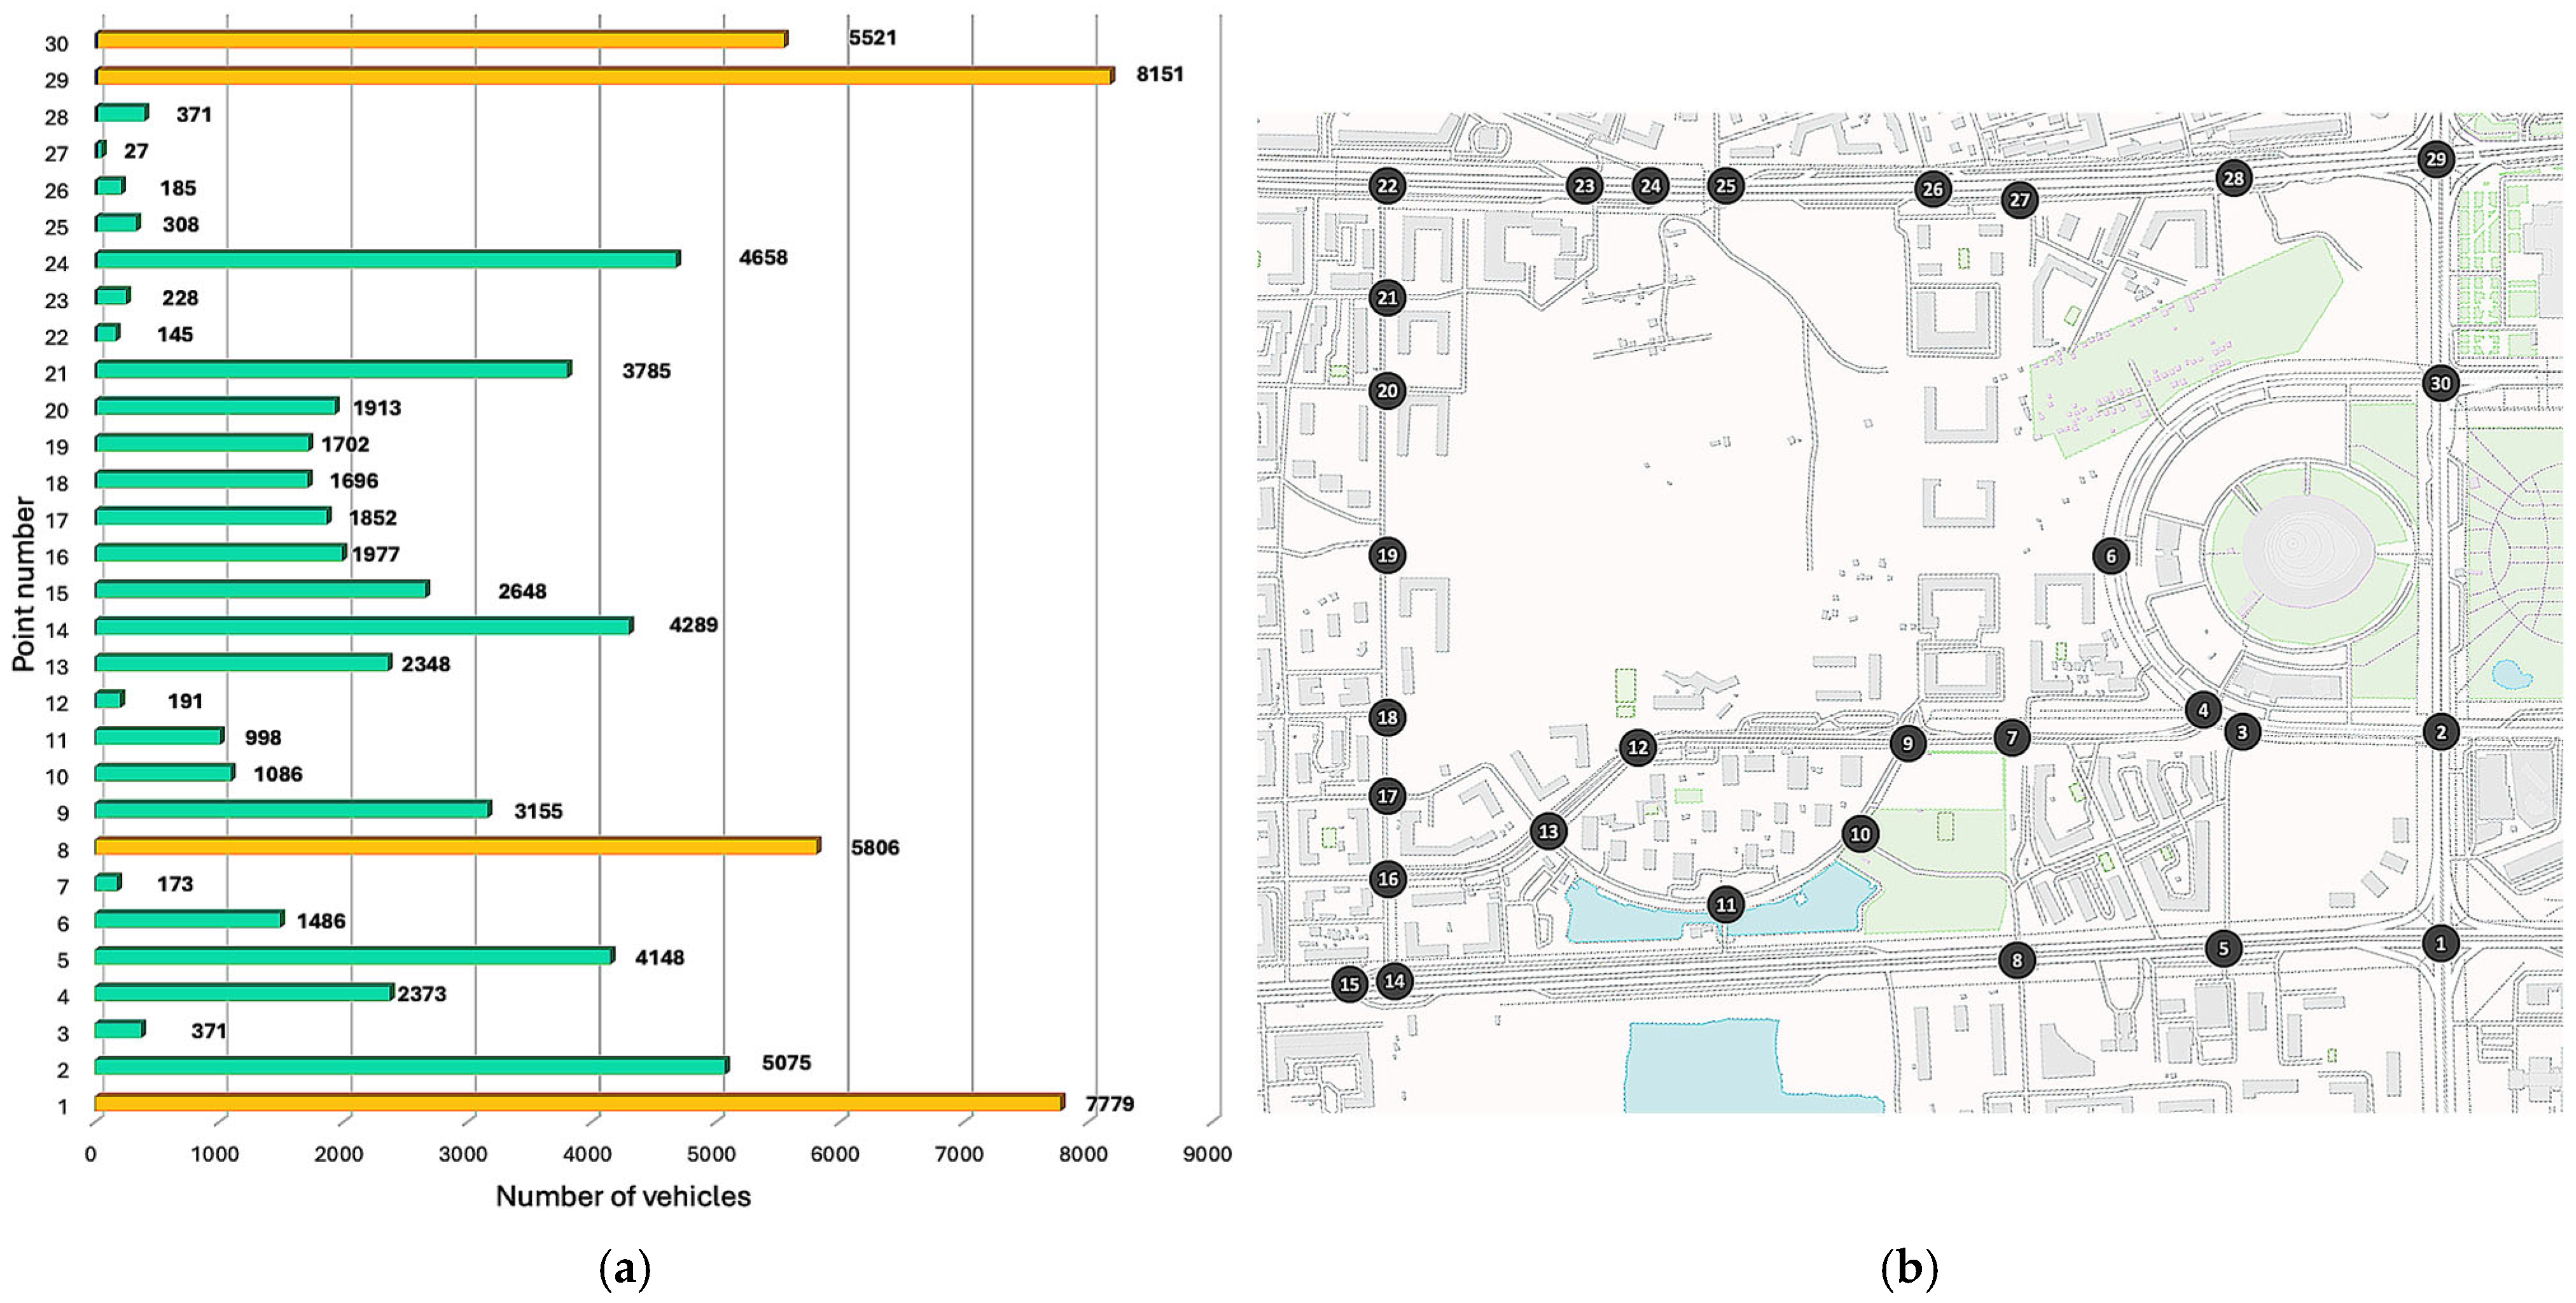
The results of the UAV-based monitoring campaign during the morning peak hour (07:45–08:45) are presented in
Figure 6, which illustrates both the quantitative distribution of vehicle volumes across 30 observation points and their geographic location within the GreenLine district. In total, 73,314 vehicles were recorded within the study area during this one-hour window, highlighting significant morning traffic activity.
The volume data reveal considerable spatial heterogeneity in terms of traffic load. The highest traffic intensities were observed at point 29 (8151 vehicles), point 7 (5806 vehicles), and point 1 (7779 vehicles)—all located along major corridors and intersections serving as primary entry or distribution points for the district. These locations function as key arterial nodes facilitating inbound traffic during the morning peak.
In contrast, internal or lower-order intersections, such as points 11, 13, 21, and 27, experienced significantly lower volumes (ranging from 27 to 998 vehicles), corresponding to their predominantly residential or peripheral character.
The combined use of UAVs and synchronized data collection enabled a comprehensive and consistent capture of spatial traffic dynamics, offering both quantitative flow data and a contextual understanding of traffic patterns throughout the area. This dataset was essential for constructing and calibrating the simulation model, as well as for identifying priority locations for infrastructure improvements.
Figure 7 provides a detailed representation of turning movement patterns and directional traffic distribution at each monitored intersection in the GreenLine district, based on UAV footage collected during the morning peak hour. For every intersection, the map displays the absolute number of vehicles per approach and exit, as well as movement percentages, capturing the internal structure of traffic flow in all directions.
The UAV monitoring technique makes it possible to reconstruct real-world turning patterns at scale without the need for sensors or manual counts. The availability of directional split data is essential for calibrating turning ratios in simulation models, validating signal phasing assumptions, and identifying imbalanced or high-conflict movements that may benefit from control strategy adjustments.
Moreover, the data highlight spatial asymmetries in traffic behavior, such as intersections where outbound movements dominate due to their orientation toward major exits from the district. This information directly informed the development of infrastructure scenarios, allowing modelers to test the effects of rechanneling flows, modifying turn lanes, or optimizing signal logic.
3.3. Development of Infrastructure Improvement Scenarios for Simulation-Based Evaluation
To assess the potential impact of various infrastructure and operational changes on traffic performance within the GreenLine district, a series of simulation-based intervention scenarios were developed:
Scenario S0—baseline (current conditions). Represents the existing geometric layout, traffic signal settings, and control policies, serving as the reference point for comparative evaluation.
Scenario S1—signal timing optimization only. Involves adjustments to the green phase durations, offsets, and cycle lengths at signalized intersections based on demand patterns observed through UAV monitoring. No physical changes to road layout are implemented.
Scenario S2—intersection redesign at two major nodes. Introduces geometric modifications at two high-traffic intersections, including lane reconfiguration, improved turning radii, and clearer channelization, without altering signal control.
Scenario S3—combined geometry and signal adjustments. Applies a hybrid of S1 and S2 by implementing both signal timing improvements and geometric upgrades at selected locations to examine synergistic effects.
Scenario S4—public transport and pedestrian enhancements. Prioritizes non-motorized and public transport users by adding or widening pedestrian zones, introducing dedicated bus lanes, and modifying curbside usage, with minimal impact on general traffic capacity.
Scenario S5—integrated scenario (full package). Combines all previous interventions into a coordinated package, including signal optimization, intersection upgrades, multimodal prioritization, and access control strategies. This scenario represents a comprehensive rethinking of corridor-level performance and equity.
The development of these scenarios was informed by observed traffic behavior, bottleneck locations, and flow asymmetries captured through synchronized UAV observations. All five alternatives were simulated under identical demand conditions to enable a fair and controlled comparison of their impacts across multiple key performance indicators.
Each of the five development scenarios was simulated under identical demand conditions.
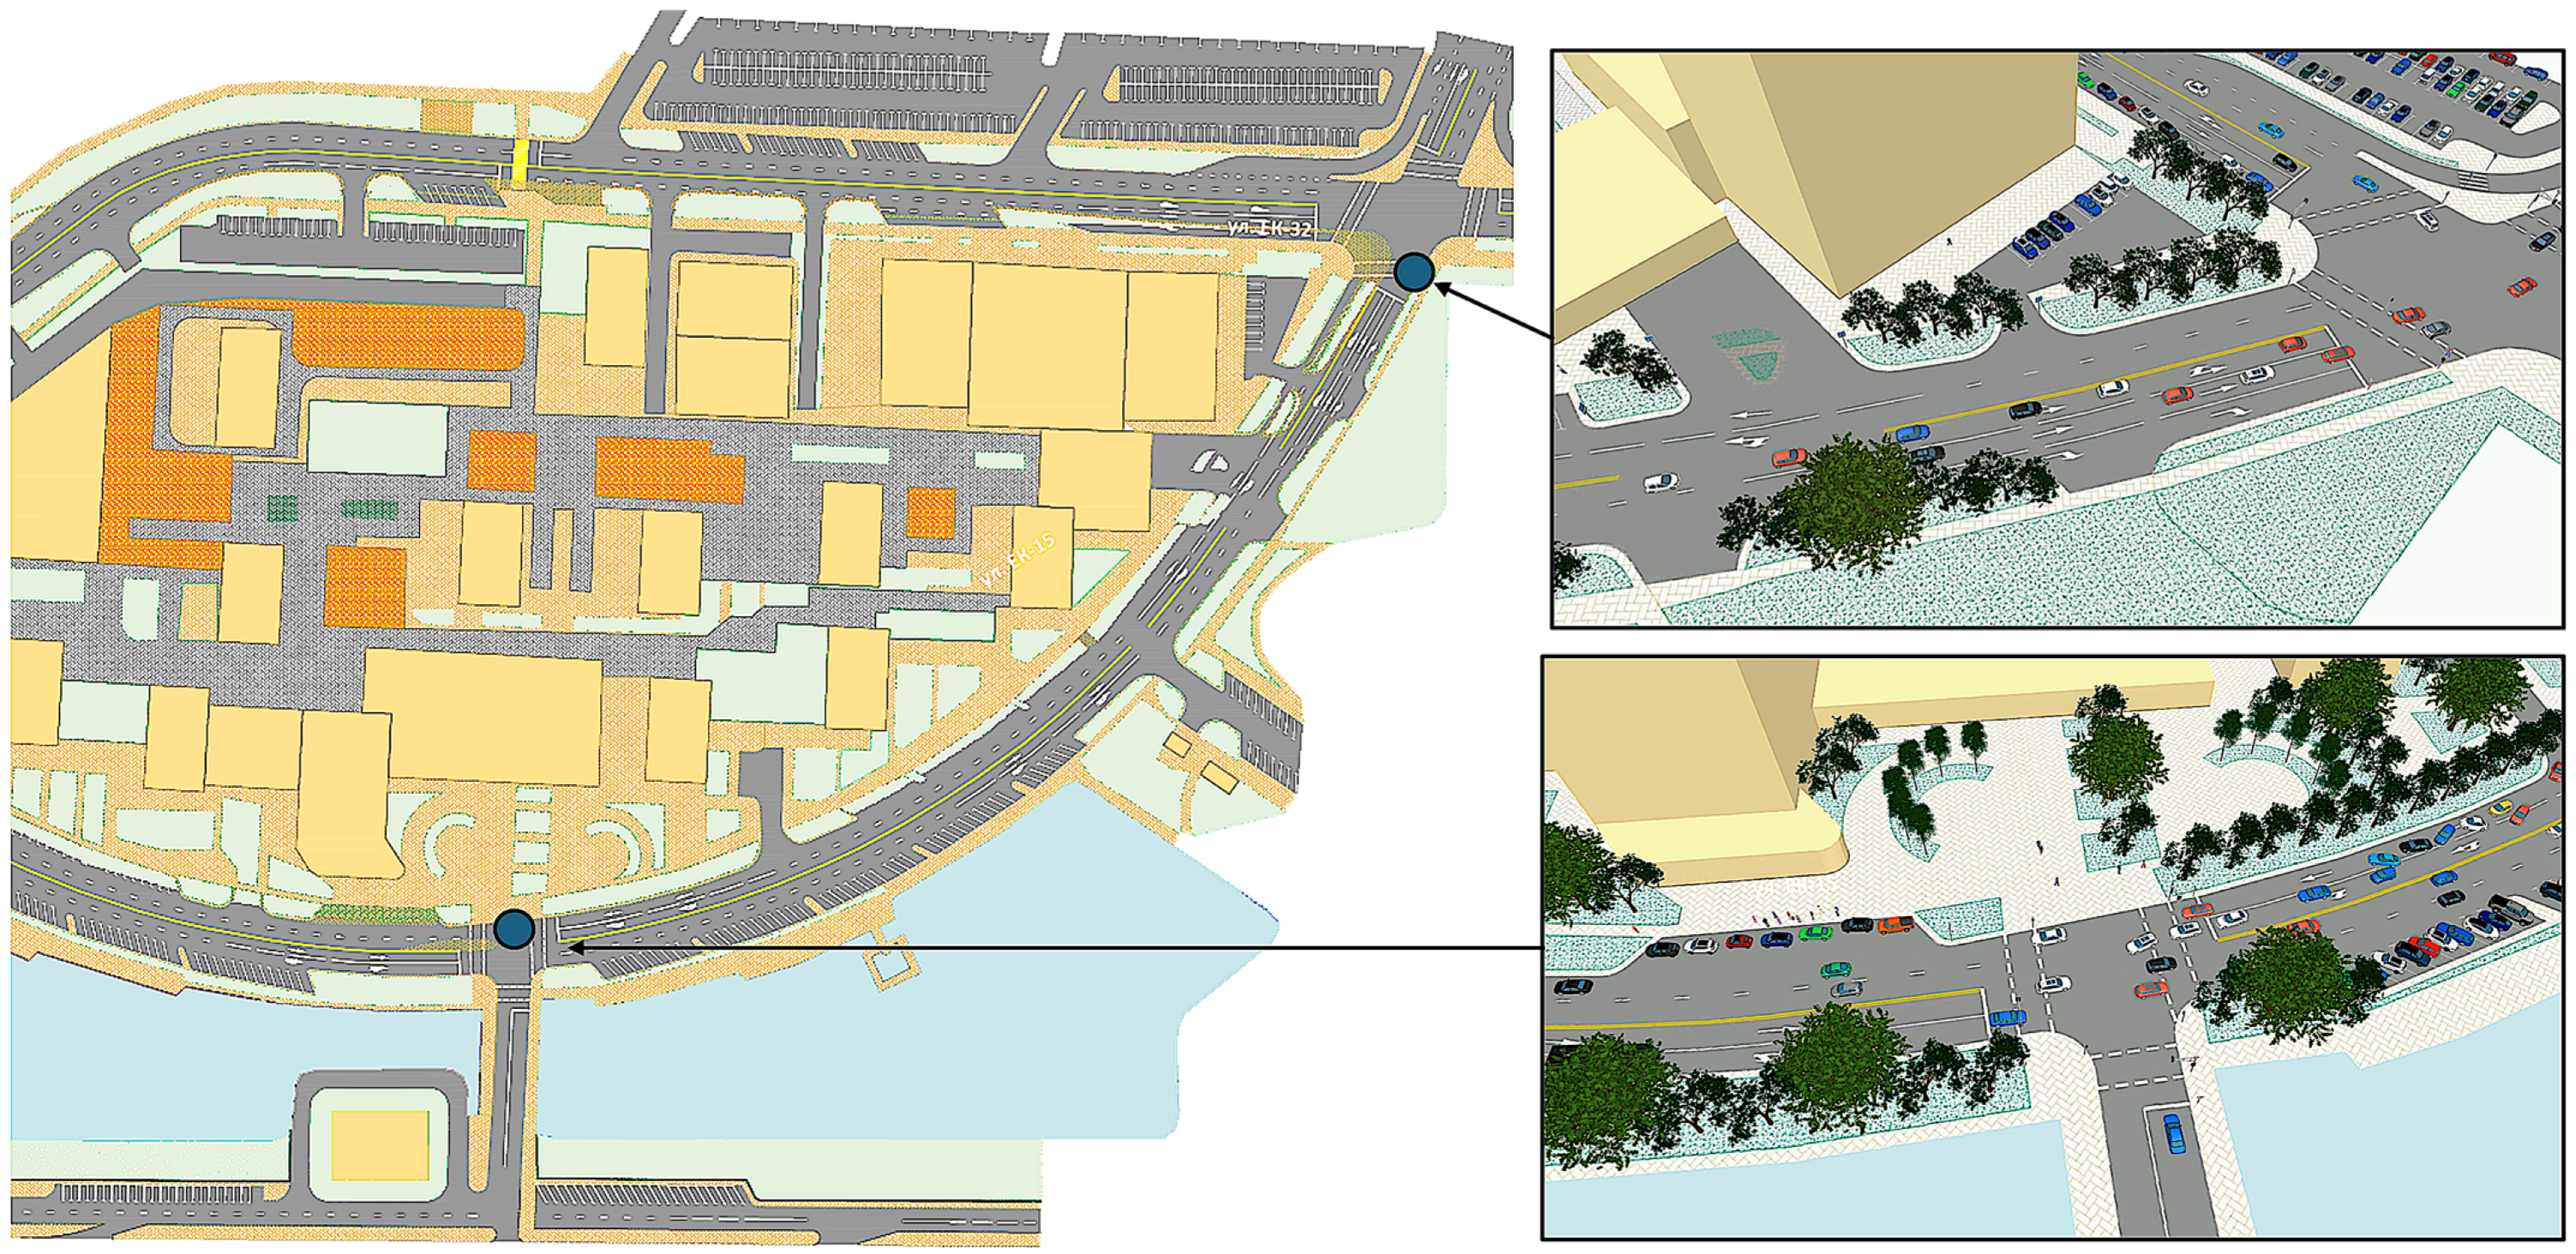
Figure 8 illustrates an example of how data collected through UAV monitoring were used to develop a detailed simulation model of a representative road segment in the GreenLine district. The central image presents the segment layout along EK-32 street, highlighting the exact geometry, surrounding land use, and access points. Based on the recorded UAV video, traffic volumes, turning movements, and queuing behavior were extracted and incorporated into the simulation environment.
The insets on the right show two rendered simulation views, reproducing the actual traffic patterns observed during the morning peak period. These include complex flows through multi-lane segments, vehicle interactions at turning points, and real-world conflicts caused by on-street parking and pedestrian infrastructure. The upper inset visualizes queue formation and lane utilization under constrained conditions, while the lower inset shows controlled access into a residential side street with mixed traffic types and limited visibility—conditions directly observable in the UAV footage.
This localized simulation model demonstrates the high fidelity and behavioral realism achievable when UAV-based empirical data are used to inform simulation parameters. The scenario includes not only macro-level flows but also micro-level interactions such as lane changes, deceleration at turning zones, and vehicle–pedestrian coexistence in shared spaces. This type of model served as a building block for scaling up to the full network-wide simulation and was essential for testing the impacts of small-scale geometric changes and signal logic variations.
3.4. Comparative Analysis of Scenario Modeling Outcomes
The performance outcomes of all modeled infrastructure scenarios are summarized in
Table 4, which presents key traffic indicators, including average vehicle delay, average travel speed, total emissions, maximum queue length, and total vehicle throughput. The results provide a comprehensive view of the relative effectiveness of each intervention strategy in improving traffic conditions in the GreenLine district.
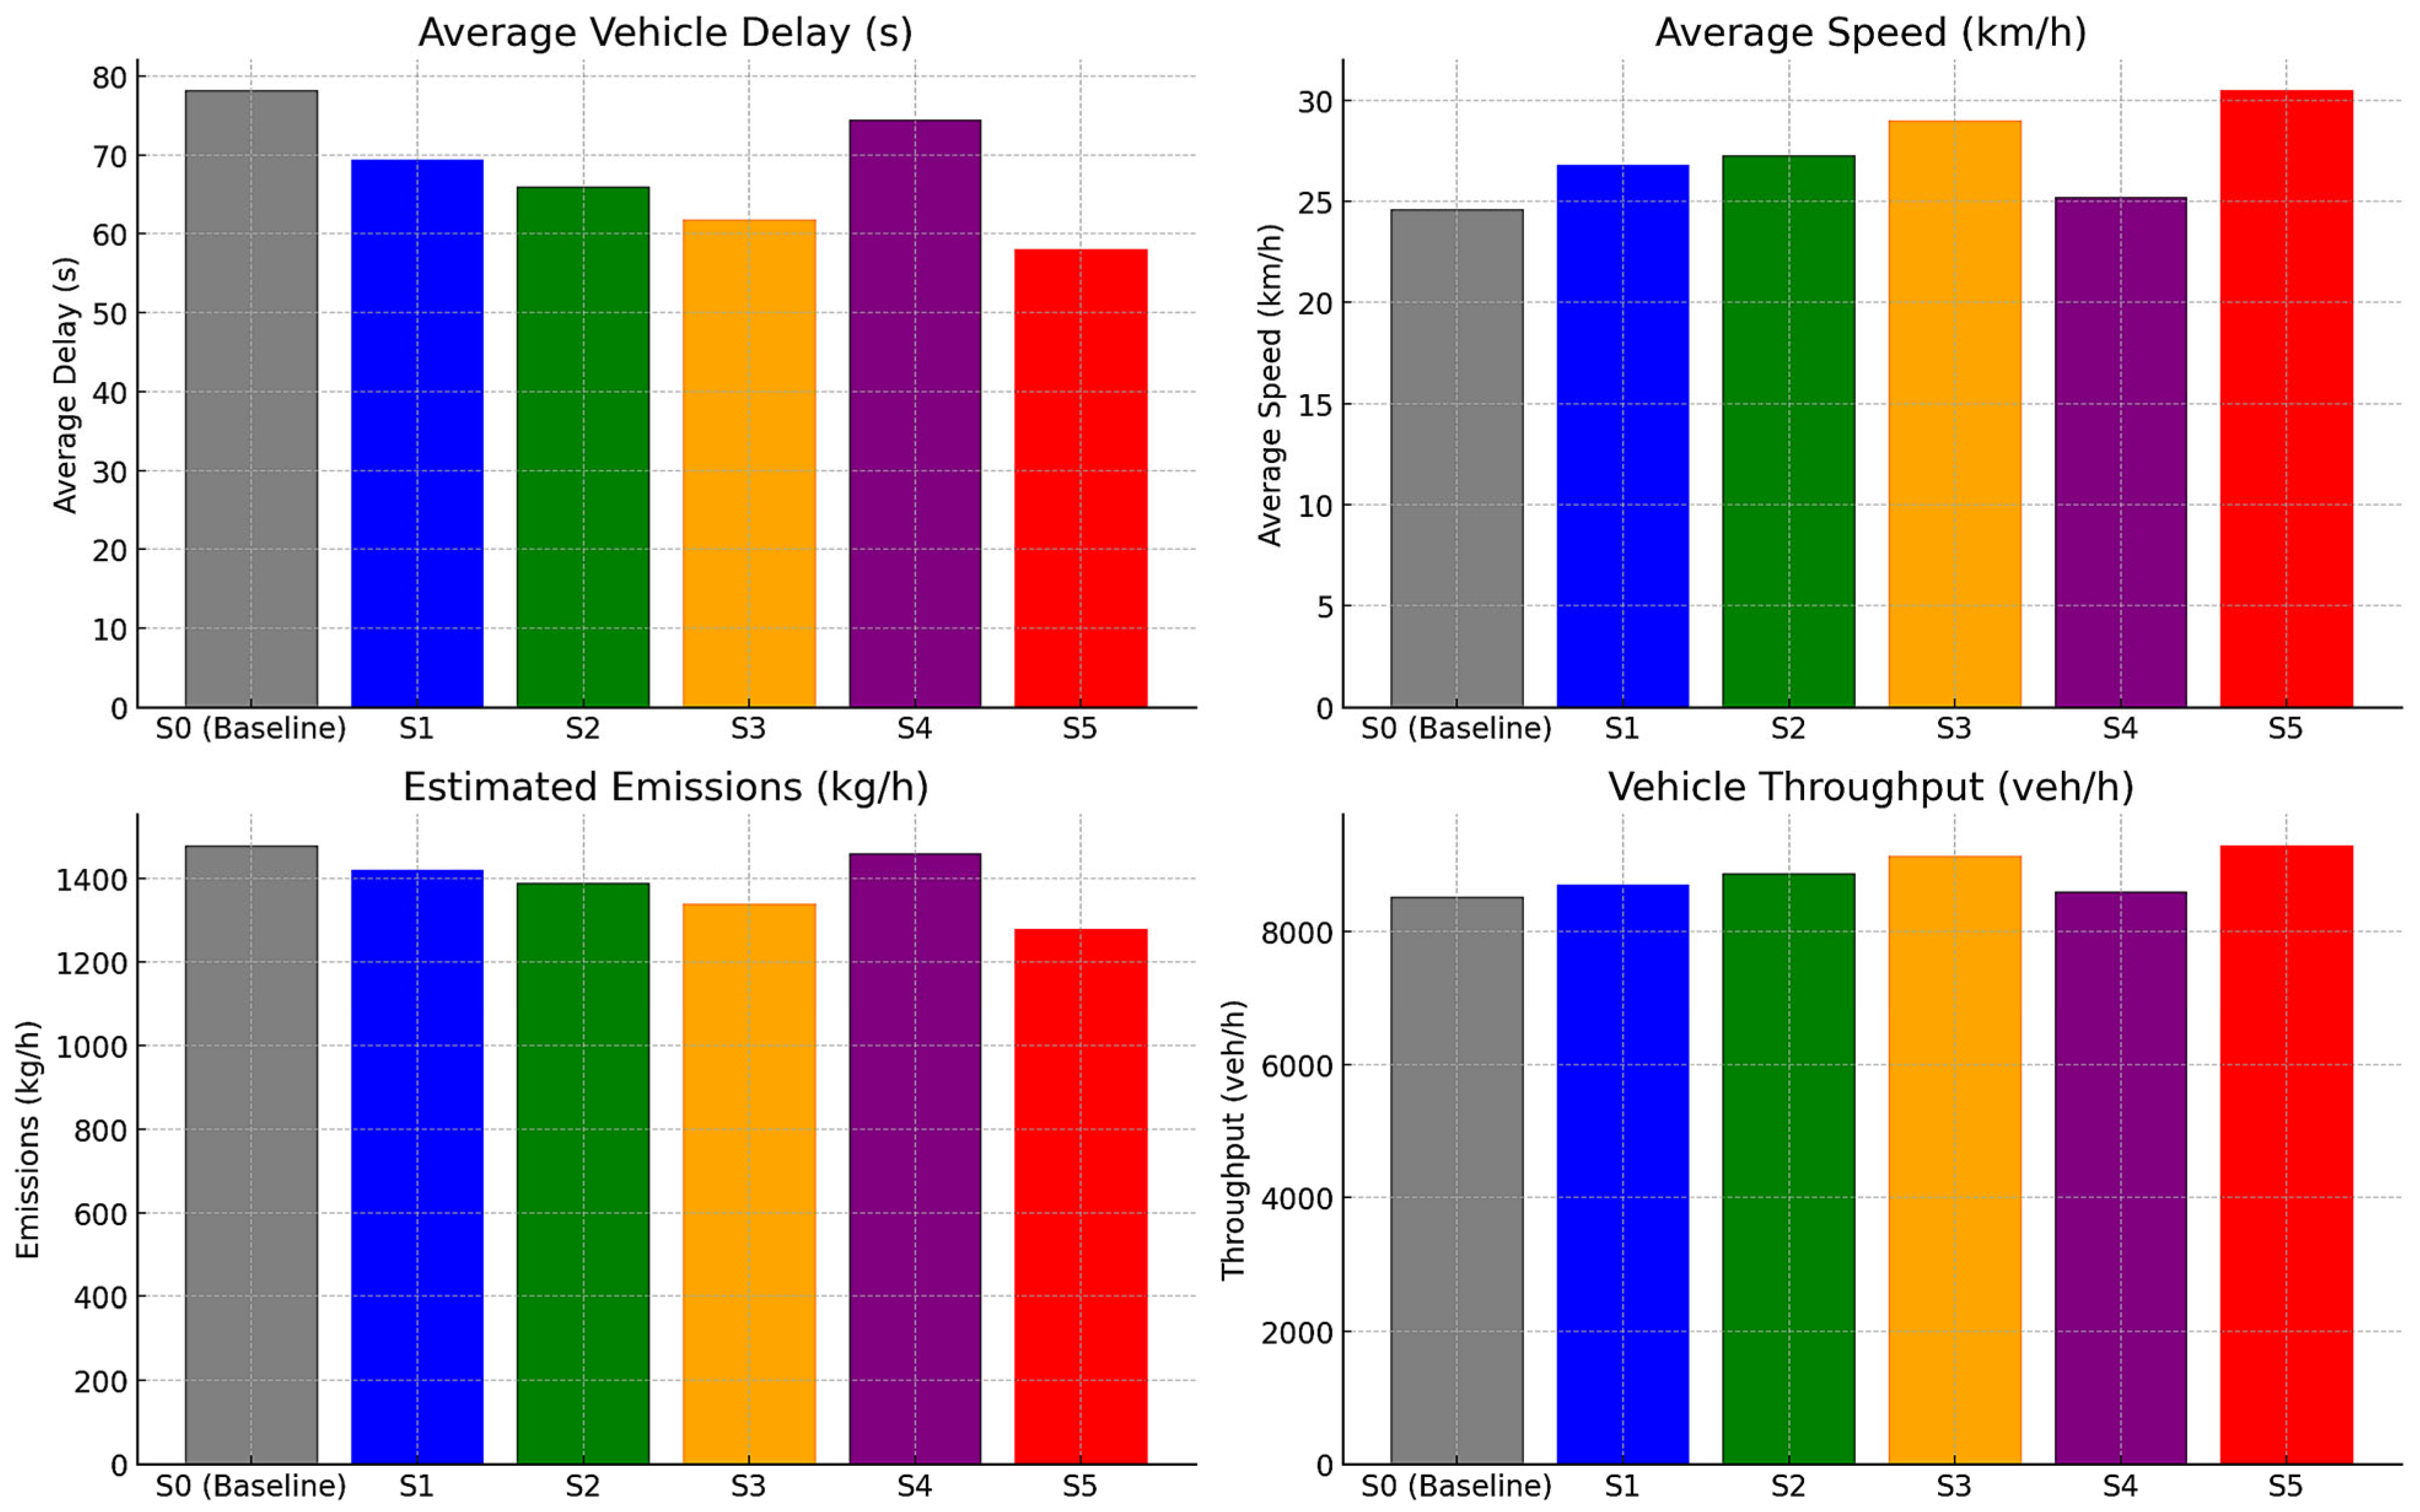
Figure 9 shows a visual comparison of infrastructure scenario performance across four key traffic indicators: average delay, average speed, emissions, and throughput.
The baseline scenario (S0) represents the current infrastructure and signal control settings. It exhibits the highest average delay (78.2 s), lowest speed (24.6 km/h), highest emissions (1480 kg/h), and longest queues (92.0 m), indicating systemic congestion and inefficiencies in the existing network. All alternative scenarios demonstrate performance improvements across multiple indicators, validating the potential of targeted interventions.
Among them, Scenario S5, which combines signal optimization, intersection redesign, and multimodal improvements, yields the most substantial gains. It achieves the lowest average delay (58.1 s), the highest average speed (30.5 km/h), and a 13.5% reduction in emissions compared to the baseline. Queue lengths are reduced by more than 30%, and total throughput increases to 9310 vehicles/hour, the highest of all tested scenarios.
Scenarios S1, S2, and S3 each provide incremental improvements. S3, which integrates geometry and signal enhancements, closely approaches the performance of S5, with particularly notable improvements in speed (29.0 km/h) and emissions (1340 kg/h). S2, which applies only geometric changes, outperforms S1 (signal timing only) in all indicators except emissions, suggesting that layout adjustments have a stronger standalone effect than control optimization.
By contrast, Scenario S4, focused on pedestrian and public transport enhancement, shows only a marginal improvement in emissions and slightly worsens traffic delay and throughput compared to the baseline. This indicates that without accompanying vehicle flow improvements, modal prioritization alone may negatively affect overall vehicular performance under high-demand conditions.
The results underscore the importance of integrated and balanced interventions. Scenario S5’s superior performance across all indicators affirms that simultaneous attention to geometry, control logic, and multimodal needs yields the most resilient and efficient traffic solution for rapidly developing urban areas.
4. Discussion
4.1. Advantages of UAV-Based Monitoring
The use of unmanned aerial vehicles (UAVs) in this study offered several significant advantages over conventional traffic monitoring methods, both in terms of data quality and operational flexibility. Most notably, UAVs enabled synchronous, multi-point observation of traffic conditions across a wide urban area, something that is practically unachievable with fixed ground sensors or manual field counts. This synchronous capture was crucial for understanding not just isolated intersection behavior but also network-level interactions such as queue spillbacks, directional imbalances, and corridor-wide congestion propagation.
The high spatial and temporal resolution of the UAV footage provided a clear view of real-world traffic dynamics. Unlike traditional loop detectors or roadside cameras, which typically offer point-based or low-angle views, UAVs delivered a top-down perspective that captured full intersection layouts, vehicle trajectories, and pedestrian interactions. This allowed for the accurate extraction of key performance parameters, such as delay, queue length, turning movements, and illegal maneuvers (e.g., red-light running or lane blocking). These parameters were directly used to calibrate simulation models, significantly improving their realism and predictive power.
Additionally, UAV deployment proved to be a cost-effective and rapidly deployable solution. The ability to conduct observations without installing any physical infrastructure made it especially suitable for temporary studies, rapidly evolving districts, or areas undergoing construction. The UAV approach also minimized disruption to traffic and avoided the need for intrusive data collection equipment, which can bias driver behavior or cause temporary flow disturbances.
From a planning perspective, UAV-generated visuals were highly effective in communicating traffic problems to stakeholders, including municipal planners, engineers, and the public. Aerial video clips and heatmap overlays created a compelling, intuitive representation of congestion points and infrastructure bottlenecks, enhancing transparency in decision making.
UAVs functioned not only as data collection tools but as strategic enablers of smarter, evidence-based urban mobility planning. Their integration into the infrastructure analysis process added a level of precision, adaptability, and visual clarity that traditional monitoring systems struggle to achieve.
4.2. Limitations of the Study
This study demonstrated the effectiveness of UAV-based traffic monitoring and scenario modeling, though several limitations should be acknowledged to properly contextualize the findings and guide future research.
The temporal scope was limited to two specific peak periods (morning and evening) on selected weekdays, which may not fully capture midday, weekend, or seasonal variations in traffic demand. Additional flight sessions across multiple days and months would improve the temporal representativeness and strengthen the baseline condition analysis.
Regulatory and environmental constraints affected the research, as UAV operations had to comply with local civil aviation regulations that restricted flight altitude, established no-fly zones, and required line-of-sight operation. These limitations constrained the maximum coverage area and necessitated careful coordination. Additionally, adverse weather conditions including wind, rain, and low light restricted the number of deployable observation windows and occasionally impacted video quality.
The UAV-based data collection in this study was limited to two critical weekday peak periods—morning and evening. This approach was chosen to capture the periods of highest traffic demand and to ensure optimal use of UAV flight time under favorable weather conditions. However, this limited temporal scope does not fully reflect midday, late-night, or weekend traffic dynamics, which may exhibit different patterns due to land use, travel purposes, or modal preferences. To improve temporal representativeness, future research should explore extended UAV monitoring campaigns covering multiple days, time periods, and seasonal variations. Such longitudinal datasets would enable the modeling of more complex travel behaviors, support demand forecasting, and enhance the validity of infrastructure planning decisions across broader use cases. Additionally, periodic monitoring could help evaluate the long-term impacts of implemented interventions.
Data accuracy and processing sensitivity presented challenges, as the accuracy of vehicle detection and trajectory tracking depends significantly on video resolution, lighting conditions, and occlusions. Minor tracking errors or misclassifications could influence calculated performance metrics like speed or delay. While quality control procedures were implemented, manual correction or cross-validation with ground truth data would enhance reliability.
Limited multimodal modeling was another constraint, as fully integrated multimodal analysis was beyond this study’s scope. While pedestrian interactions and public transport impacts were considered qualitatively, bicycle flows, micromobility devices, and dynamic pedestrian routing were not explicitly modeled, limiting the depth of accessibility-related insights.
Implementation factors constituted a final limitation, as scenarios were evaluated primarily on traffic performance. The real-world implementation of infrastructure changes involves additional factors, such as land acquisition, utility relocation, political support, and public acceptance, which were not modeled but play crucial roles in project feasibility.
This study’s calibration and validation processes relied solely on UAV-derived traffic parameters due to the unavailability of conventional ground-based data sources such as loop detectors, GPS probe data, or Bluetooth sensors within the study area. While the high spatial and temporal resolution of UAV data enabled detailed simulation calibration, the absence of independent ground-truth datasets limits the robustness of cross-validation. The authors acknowledge this as a methodological limitation. In future studies, it is recommended to supplement UAV data with conventional fixed-point or probe-based traffic measurements where feasible. Such hybrid validation would allow for comparative performance assessments and further enhance the credibility of UAV-supported modeling frameworks in practical applications.
Despite these limitations, this study presents a robust and replicable methodological framework that establishes a foundation for more comprehensive UAV-supported traffic planning initiatives.
4.3. Implications for Practice and Policy
The outcomes of this study have significant implications for urban transport practitioners, policymakers, and planners working with limited budgets in complex environments. The workflow combining UAV monitoring, simulation modeling, and scenario evaluation offers a replicable and cost-effective decision support tool addressing both short-term operational issues and long-term strategic planning.
UAVs enable detailed, real-time observations of traffic behavior at multiple locations simultaneously, providing rich empirical data for targeted infrastructure investments. Planners can identify high-impact intervention points, test multiple scenarios in simulation, and select solutions delivering the greatest system-wide benefits with minimal disruption or cost.
UAV monitoring requires minimal infrastructure compared to permanent sensor installations or extensive fieldwork and can be deployed quickly and flexibly. This makes it valuable for pilot projects, temporary observations during construction or events, and recurring traffic audits in evolving neighborhoods. The affordability and versatility of drones democratize access to advanced monitoring capabilities, particularly beneficial for mid-sized or resource-constrained cities.
UAV-captured video and simulation outputs enable clear communication of traffic issues and proposed solutions to diverse audiences, including government agencies, political leaders, local businesses, and the public. Visual evidence of congestion or improvement potential promotes transparency, enhances stakeholder engagement, and accelerates consensus building.
From a policy perspective, this study aligns with broader smart city objectives, including reducing carbon emissions, improving accessibility, and optimizing public transport integration. The methodology supports key performance indicators tied to urban sustainability frameworks or mobility-as-a-service platforms.
The results highlight opportunities for institutional innovation. Transportation authorities could incorporate UAV-based assessments into standard project evaluation workflows, integrate them with real-time control systems, or use them as input to urban digital twin models. With appropriate regulatory frameworks, UAV data could be shared across departments, connecting traffic management, urban planning, emergency services, and environmental monitoring.
The methods and findings presented in this research can accelerate the transition from reactive, intuition-based infrastructure planning to proactive, data-informed, and citizen-centered urban mobility management.
4.4. Future Research Directions
Building on the methodological and practical insights of this study, several avenues for future research can be pursued to expand the scope, depth, and applicability of UAV-assisted traffic analysis in urban environments.
One promising direction is the integration of UAV data streams with real-time adaptive traffic management systems. Future studies could explore the development of automated pipelines where aerial video is processed in near real time and fed into intelligent traffic control algorithms, such as AI-driven signal optimization or dynamic rerouting recommendations. This would enable cities to shift from static planning to responsive, real-time traffic regulation.
While this study focused on peak-hour snapshots, longitudinal UAV monitoring over multiple days, seasons, or event types could provide deeper insight into temporal variability in traffic patterns. This would support more robust demand forecasting, resilience analysis, and the evaluation of behavioral adaptation to new infrastructure.
Future research could focus on machine learning pipelines that automatically convert UAV footage into simulation-ready inputs, including automated trajectory extraction, turning movement classification, and anomaly detection. These tools could reduce manual processing time and improve scalability.
The next generation of UAV-supported traffic studies should place greater emphasis on pedestrians, cyclists, micromobility users, and public transport interactions. Aerial views are uniquely positioned to capture complex interactions between vehicle and non-vehicle flows. Future simulations could integrate behaviorally calibrated pedestrian models or include dedicated cycling infrastructure analysis.
As cities begin to adopt digital twins, UAV-derived traffic data can be used to feed, calibrate, and validate these virtual representations of urban systems. This would enable the simulation of not only infrastructure interventions but also broader urban changes such as land use shifts, population growth, or climate events.


 ,
, 