1. Introduction
The proliferation of small unmanned aerial vehicles (UAVs) has created unprecedented security challenges for critical infrastructure protection, border surveillance, and public safety [
1]. While UAVs offer numerous beneficial applications in areas such as delivery services, agricultural monitoring, and search and rescue operations, their potential misuse for illicit activities, including smuggling, espionage, and attacks on sensitive facilities, necessitates robust detection and tracking systems [
2].
Infrared imaging has emerged as a crucial technology for UAV detection due to its ability to operate in day/night conditions and various weather scenarios [
3]. However, detecting small UAVs in infrared imagery presents significant technical challenges. UAVs typically appear as small targets with limited thermal signatures, occupying only a few pixels in the image [
4]. The problem is further compounded by complex backgrounds, atmospheric interference, and the inherent limitations of infrared sensors, including low signal-to-noise ratio and poor contrast [
5].
Traditional infrared image processing methods often struggle to balance noise reduction with feature preservation, leading to blurred target edges and reduced detection accuracy [
6]. Moreover, conventional object detection algorithms designed for visible-light imagery fail to adequately address the unique characteristics of infrared small target detection, particularly the lack of texture information and the prevalence of false alarms from background clutter [
7].
Recent advances in deep learning have shown promise for infrared target detection, with methods such as YOLO variants achieving reasonable performance in certain scenarios [
8]. However, these architectures face fundamental challenges when applied to the specific problem of infrared small target (IST) detection, particularly for UAVs. The core issue stems from the inherent conflict between the design of standard CNNs and the nature of ISTs. Firstly, the extensive down-sampling (e.g., to 32 × 32 stride) in backbones like YOLO critically erodes the limited pixel-level evidence of ISTs, which may comprise only a few pixels. This irreversible information loss at the earliest stages makes subsequent detection exceedingly difficult. Secondly, the anchor-based proposal mechanisms in many YOLO versions are poorly suited for small infrared targets, as predefined anchors often vastly exceed the target size, leading to poor matching and learning inefficiency. Furthermore, the loss functions (e.g., IoU) and feature fusion strategies optimized for larger objects in natural images fail to effectively leverage the faint, high-frequency cues that are paramount for distinguishing ISTs from cluttered backgrounds. Consequently, these approaches struggle with the extremely small and low-signature targets that characterize UAV detection scenarios [
9]. While computational burden is a concern, these architectural limitations are a primary bottleneck. The need for real-time processing further constrains the complexity of viable solutions, as practical deployment requires processing speeds sufficient for responsive countermeasures [
10].
This paper addresses these challenges through a comprehensive framework that combines advanced image preprocessing with specialized feature extraction tailored for infrared small target detection. Our main contributions are as follows:
(1) An improved Gaussian filtering algorithm that incorporates a vertical weight function within a robust estimation model to adaptively re-weight the contribution of each pixel during convolution. This core modification preserves edge information significantly better than conventional filtering, thereby providing higher-quality images for subsequent detection tasks.
(2) A novel SODMamba backbone architecture featuring Deep Feature Perception Modules (DFPMs) that exploit high-frequency components to enhance small target features while suppressing background noise.
(3) Comprehensive evaluation on a custom SIDD dataset containing 4737 infrared images across four distinct scenarios, demonstrating superior performance compared to state-of-the-art methods.
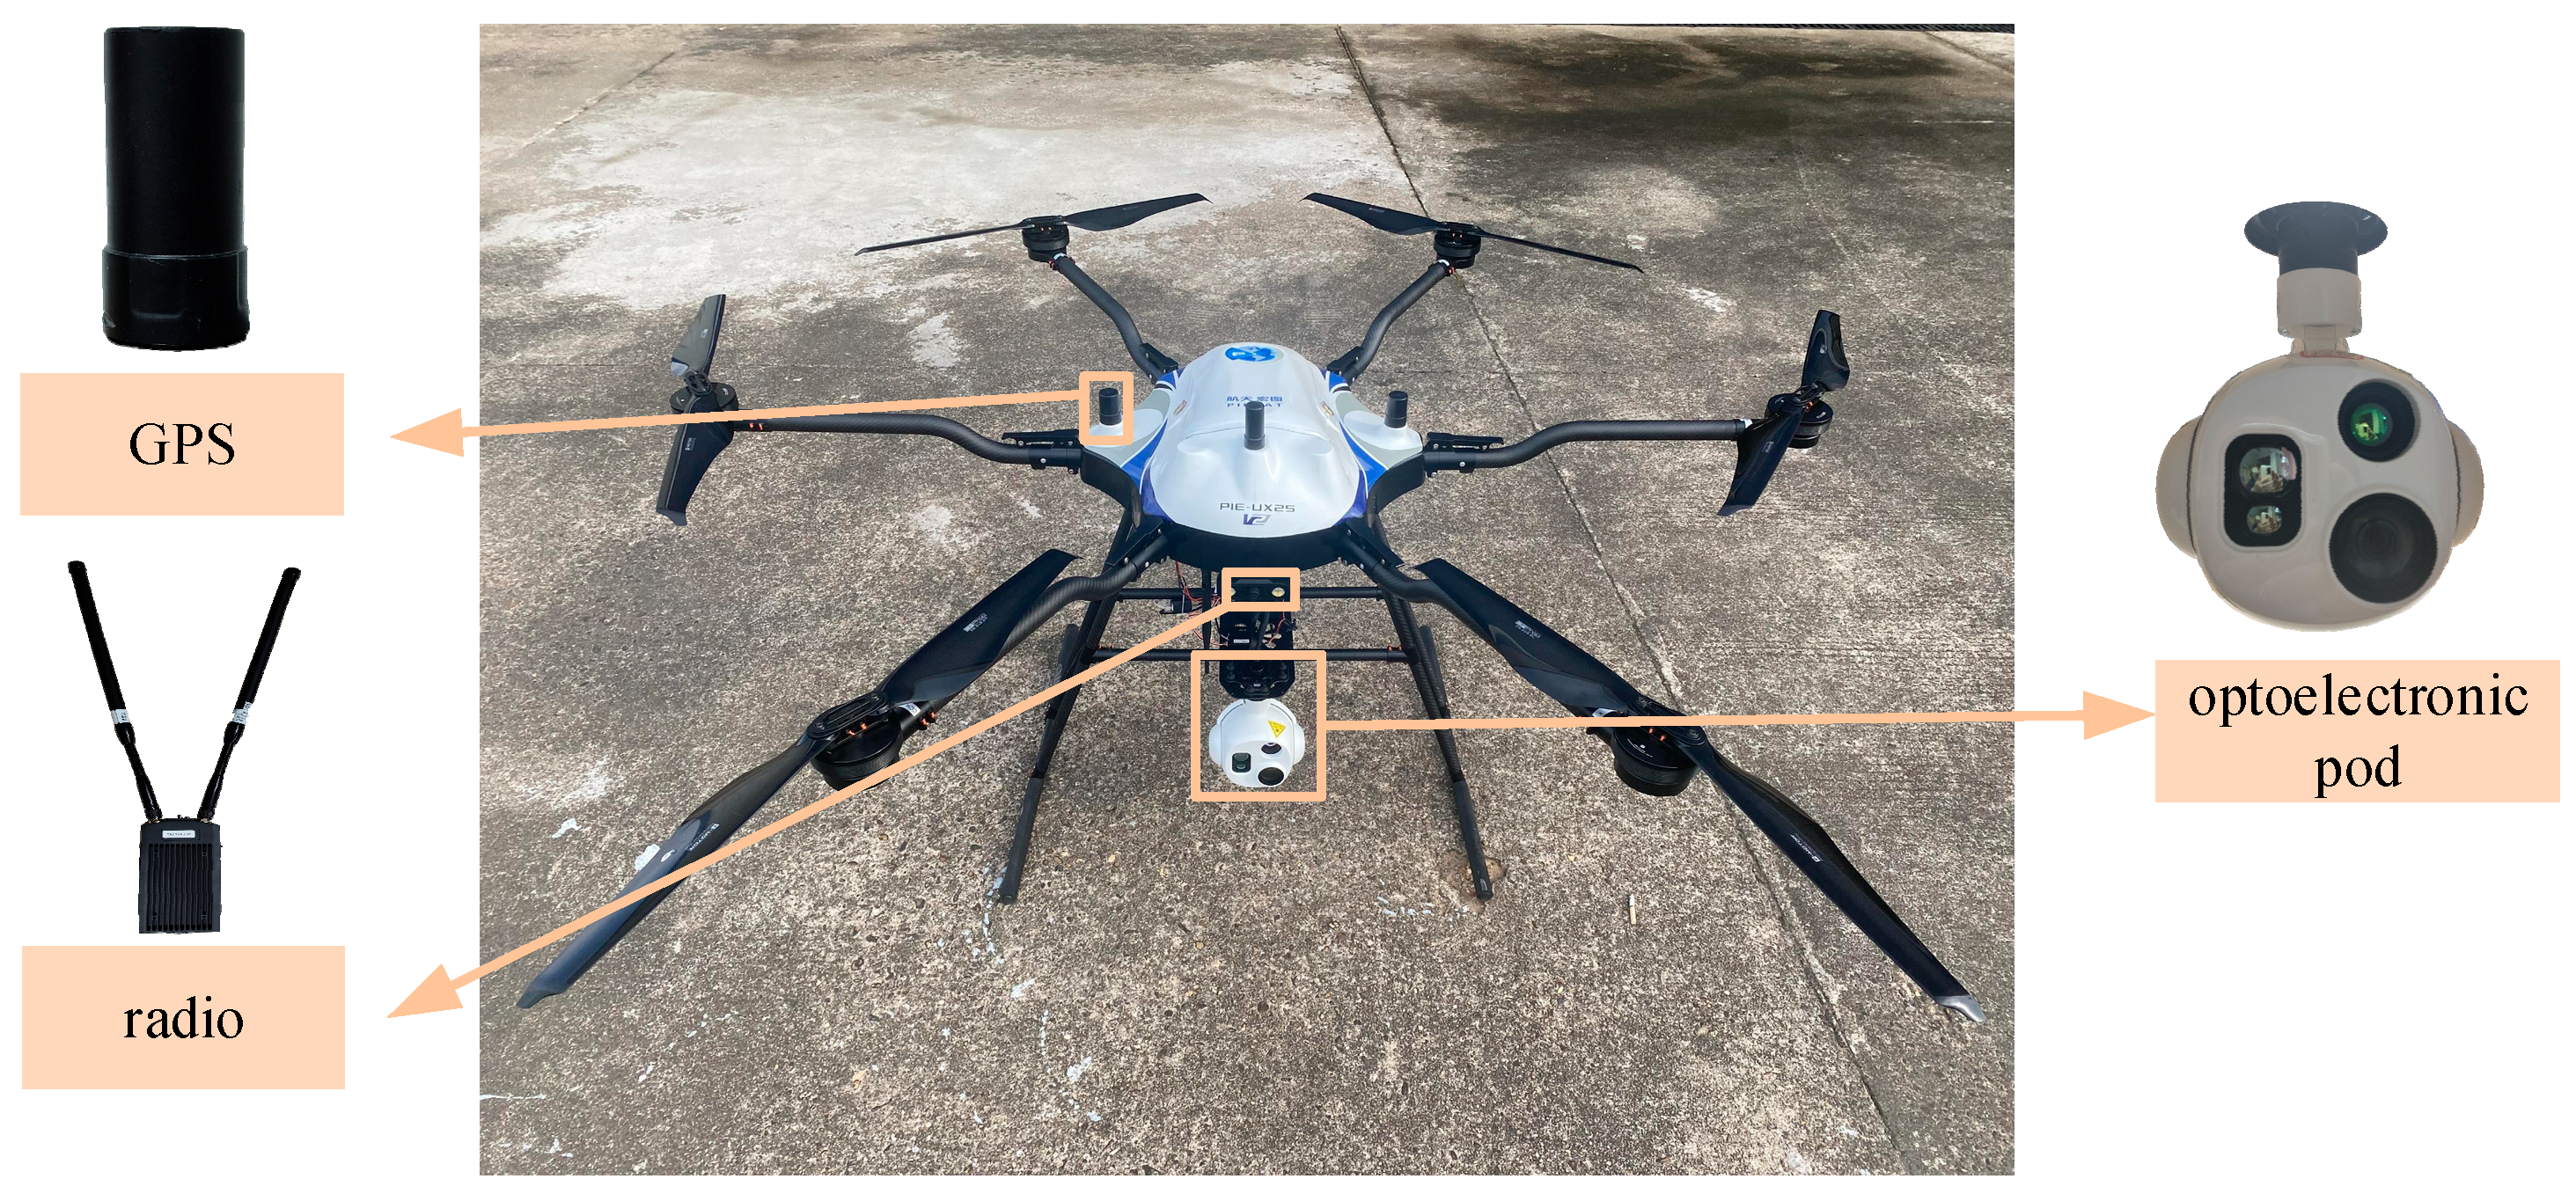
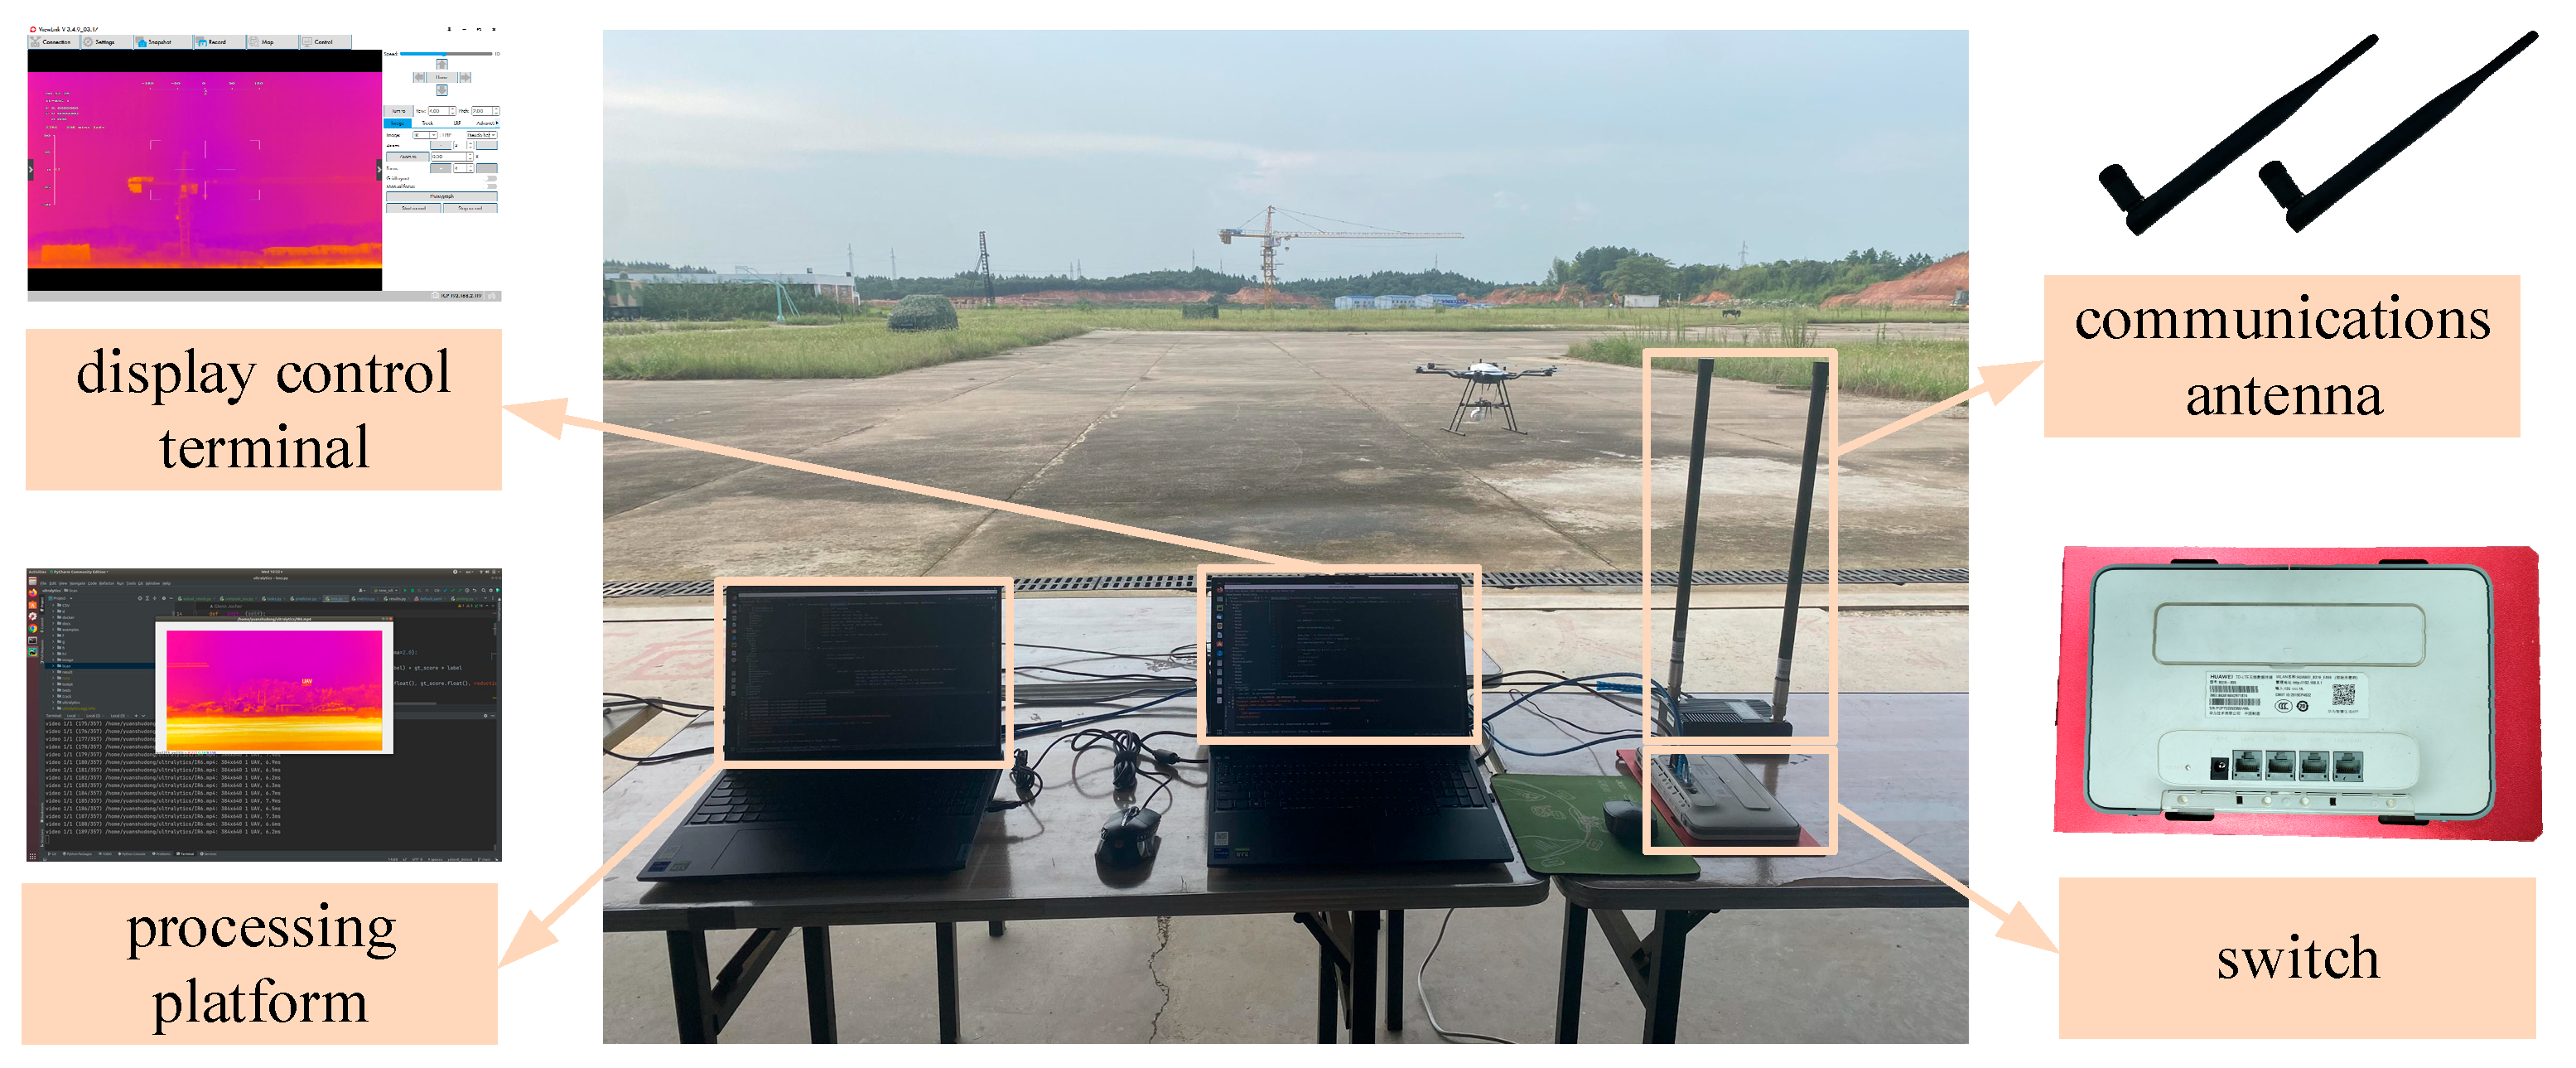
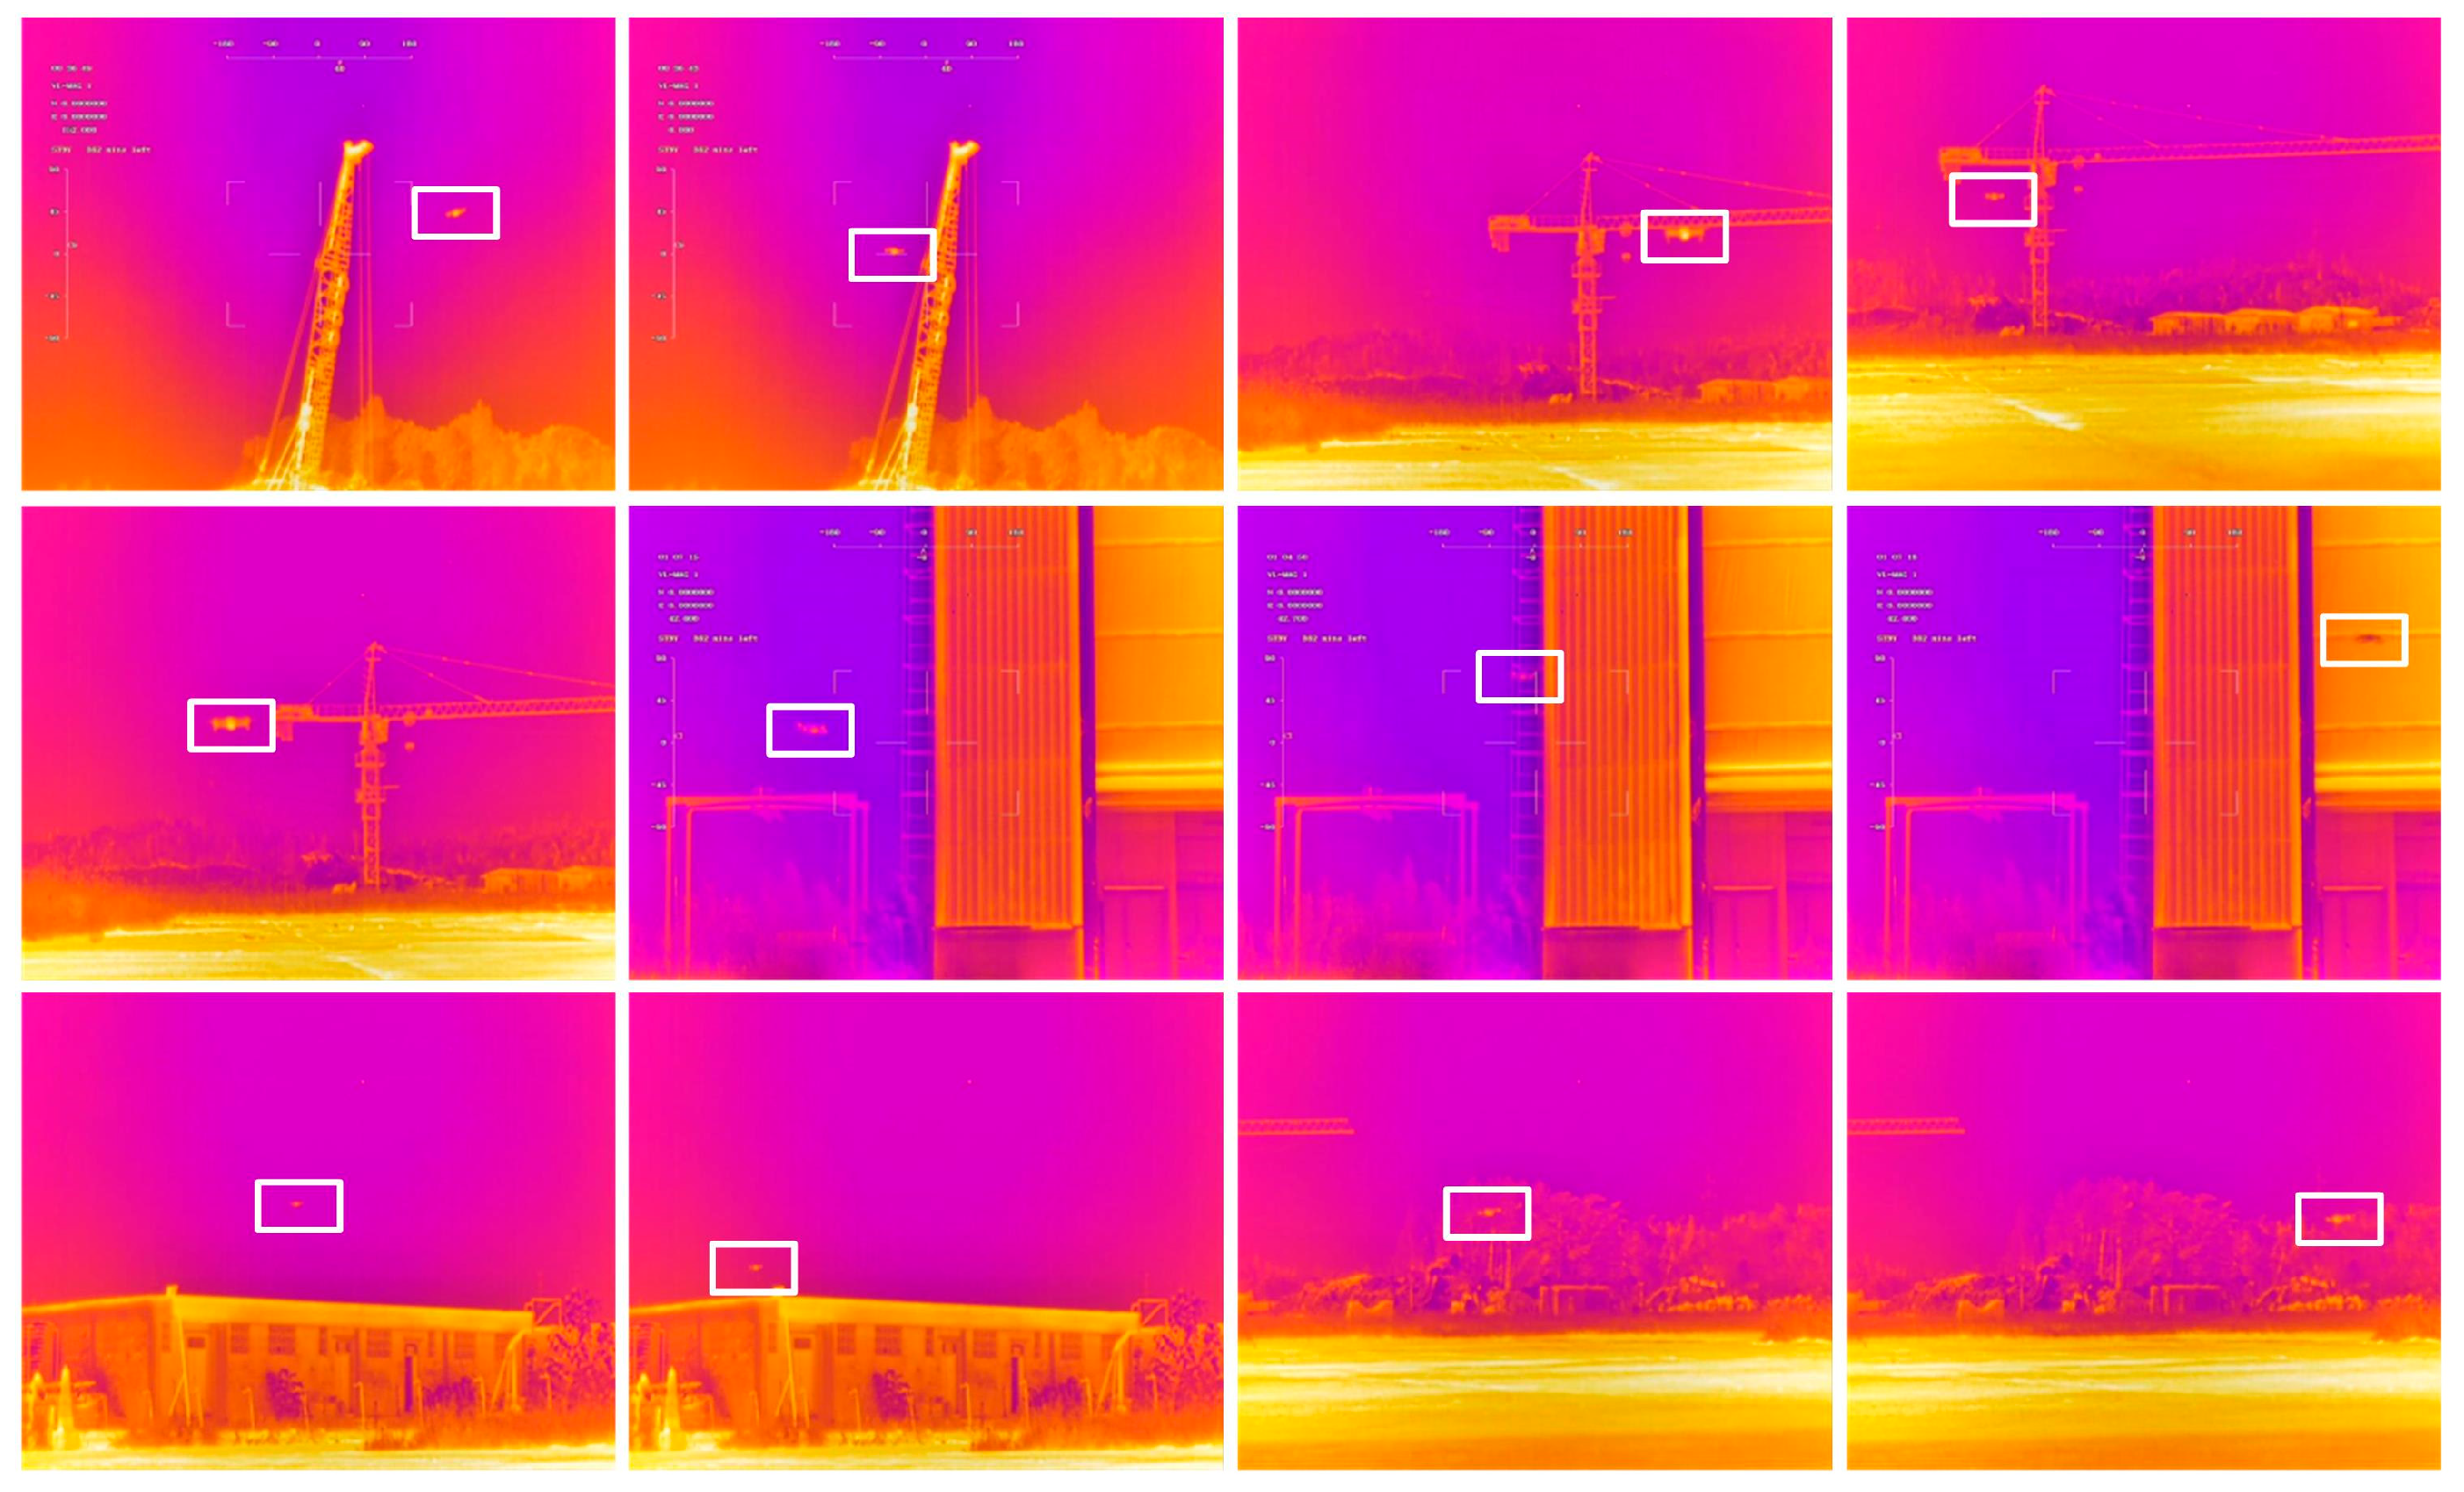
(4) Real-world validation using a complete UAV detection system, confirming the practical applicability of our approach with real-time processing capabilities.
The remainder of this paper is organized as follows:
Section 2 reviews related work in infrared image enhancement and target detection.
Section 3 presents our proposed method in detail.
Section 4 and
Section 5 describe experimental results on benchmark and real-world datasets. Finally,
Section 6 concludes the paper and discusses future directions.
3. Proposed Method
3.1. Overall Framework
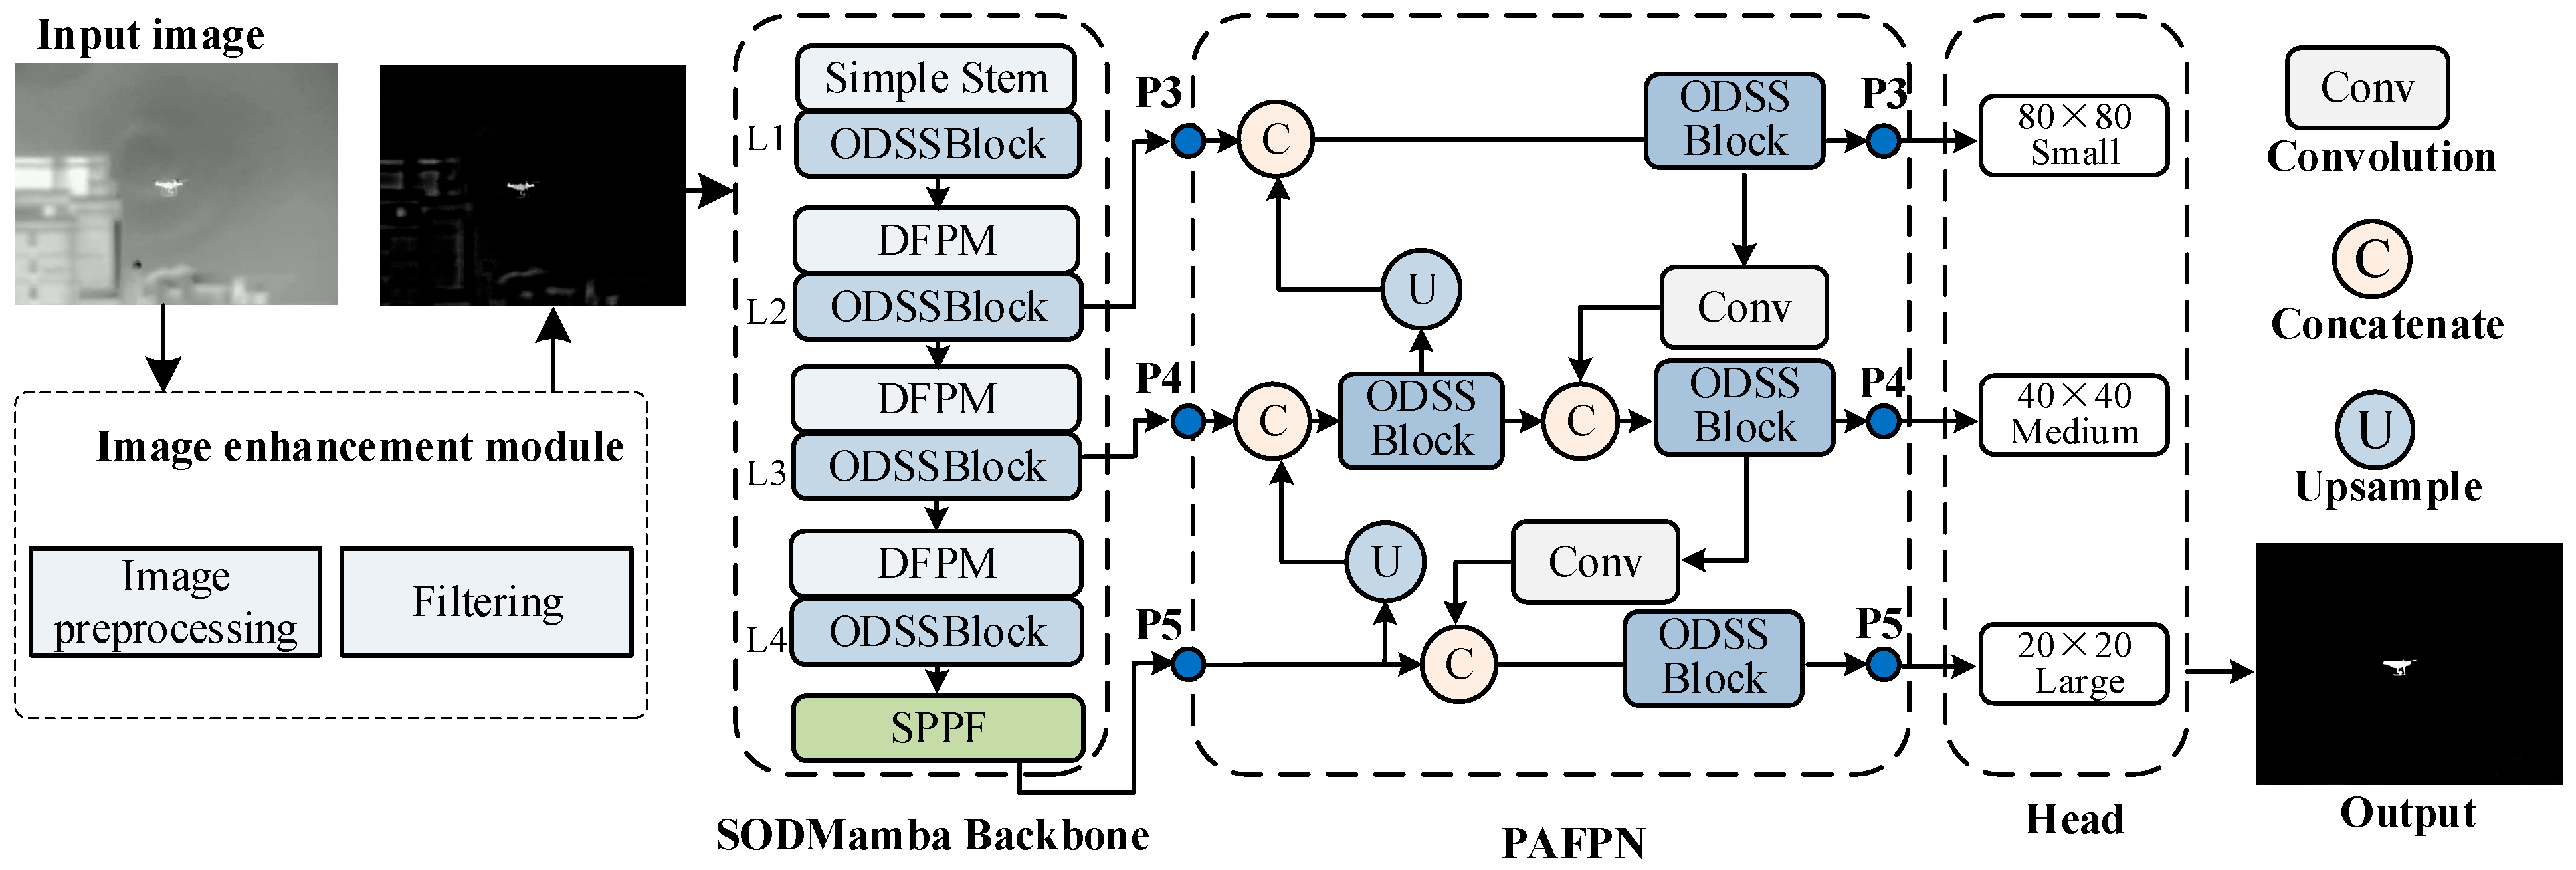
The proposed architecture presents a comprehensive object detection framework that integrates advanced image preprocessing with a hierarchical feature extraction backbone. The overall structure consists of four main components: an image enhancement module, the SODMamba backbone, a path aggregation feature pyramid network (PAFPN), and a multi-scale detection head.
Figure 1 shows the diagram of the proposed infrared target detection.The input image first passes through an image enhancement module, which performs preprocessing operations. This module employs an improved Gaussian filtering technique that incorporates a vertical weight function to effectively handle abnormal feature values and achieve superior denoising performance. This enhancement step ensures more stable and reliable feature extraction in subsequent stages. The enhanced image is then fed into the SODMamba backbone, which adopts a hierarchical architecture with four distinct levels (L1–L4). The backbone begins with a Simple Stem containing an ODSSBlock for initial feature extraction. Each subsequent level incorporates a deep feature perception module (DFPM) paired with an ODSSBlock, enabling the network to capture both local and global feature representations effectively. The DFPM modules leverage high-frequency perception capabilities to enhance feature discrimination. At the final stage, an SPPF module aggregates multi-scale contextual information.
The extracted features from levels P3, P4, and P5 are then processed through the PAFPN, which facilitates bidirectional feature fusion. The PAFPN employs a combination of upsampling operations, concatenation mechanisms, and ODSSBlocks to merge features across different scales, ensuring rich semantic and spatial information is preserved throughout the network. Finally, the detection head processes the multi-scale features through three parallel branches corresponding to different spatial resolutions: 80 × 80 for small objects, 40 × 40 for medium objects, and 20 × 20 for large objects. This multi-scale design enables the network to effectively detect objects of varying sizes within the input image, producing the final detection output.
3.2. Image Enhancement Module
Infrared images suffer from significant noise interference and blurred edge features, which are detrimental to feature extraction and learning-based detection. While Gaussian filtering demonstrates good performance in noise removal, the traditional Gaussian filtering method operates on the fundamental principle of convolution based on the Gaussian function, where the filter kernel weights are determined by the Gaussian function. During the filtering process, the gray value of each pixel in the image is replaced by the weighted average of pixels within its neighborhood, with weights calculated according to the Gaussian distribution; pixels closer to the central pixel receive higher weights. As a linear filtering method, Gaussian filtering inevitably loses some high-frequency information of the image while removing noise, such as edges and details, resulting in blurred image features that are unfavorable for subsequent object detection operations.
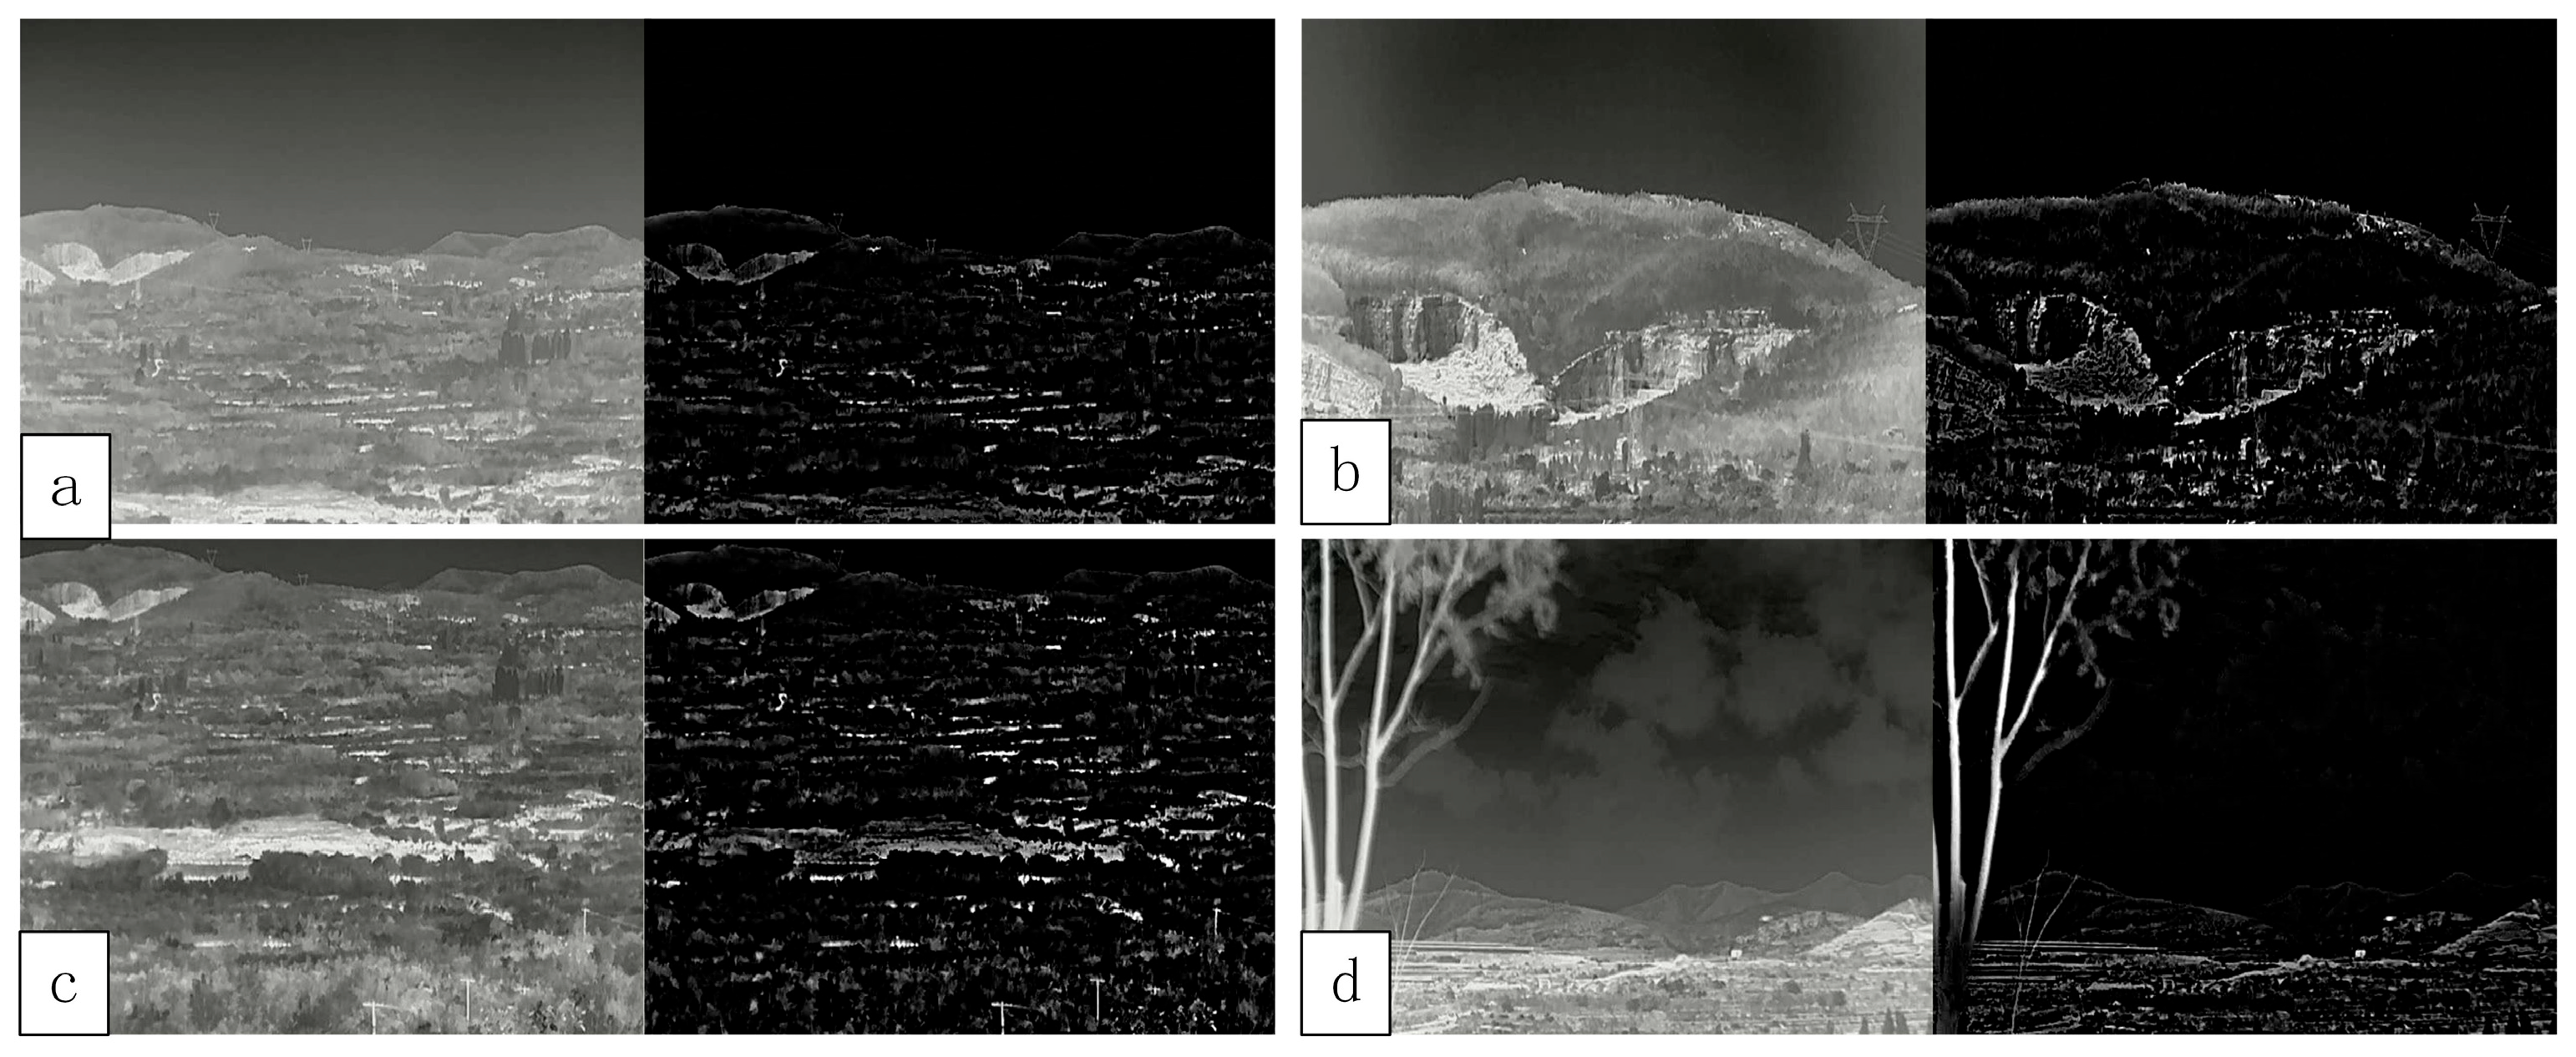
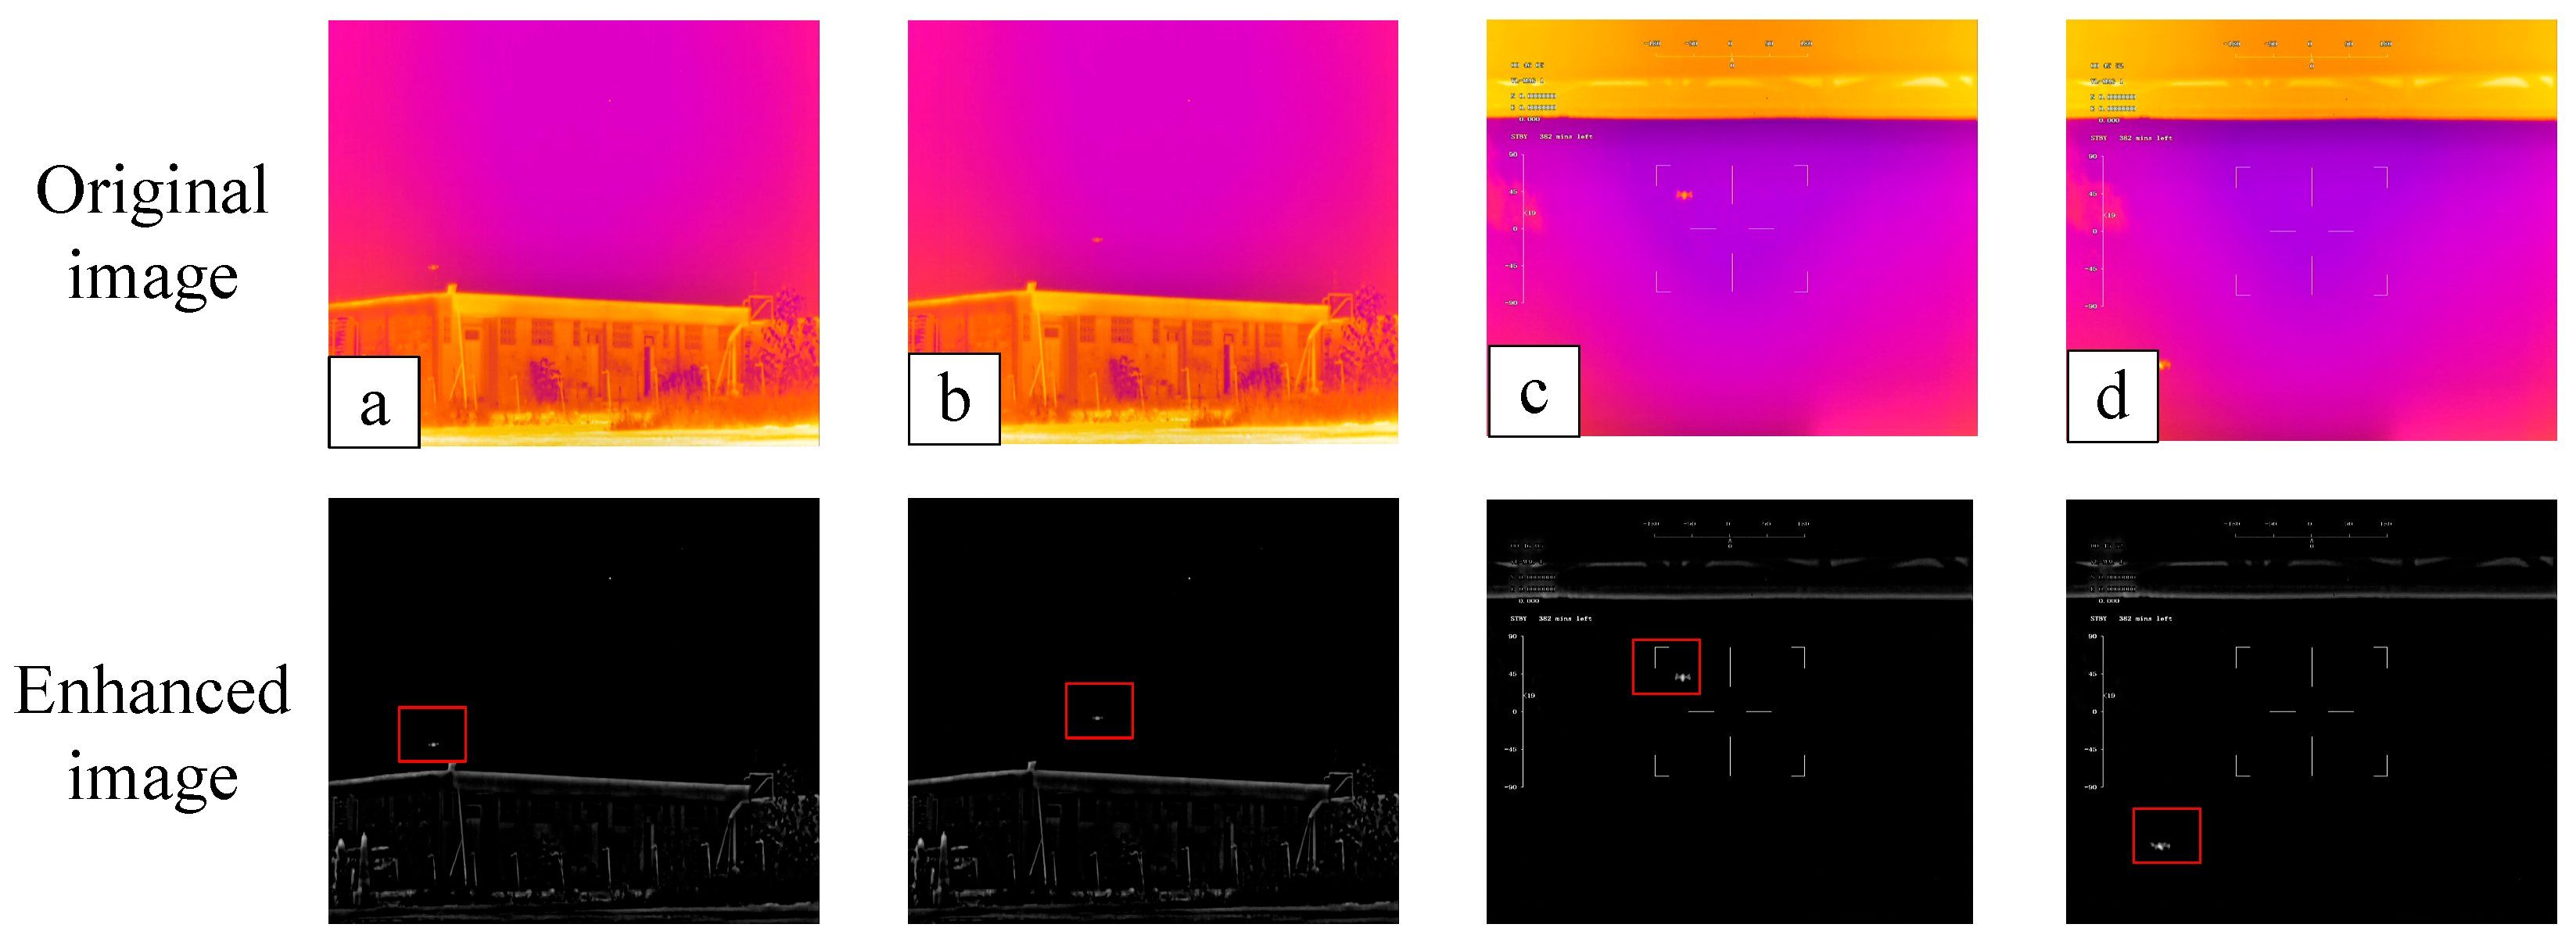
Figure 2 shows examples of infrared images.
This paper presents an improved Gaussian filtering algorithm for infrared image enhancement. The proposed enhancement algorithm builds upon conventional Gaussian filtering by integrating grayscale transformation enhancement and maximum variance thresholding techniques while incorporating a vertical weight function to better preserve image features, thereby providing higher-quality images for subsequent target detection tasks.
To mitigate the feature blurring issues inherent in traditional Gaussian filtering approaches for image processing, grayscale transformation enhancement and maximum variance thresholding methods are employed as preprocessing techniques. The former adjusts the grayscale dynamic range to accentuate contrast between bright and dark regions while enhancing detailed features. The latter improves feature extraction accuracy and reduces noise interference by segmenting the image into background and foreground components, ultimately yielding infrared images with enhanced visual clarity and more prominent features that facilitate subsequent processing operations.
For tangent orientation determination, a grayscale means square deviation calculation method utilizing one-dimensional templates is adopted. By quantifying the local grayscale dispersion, this approach effectively reduces noise interference while maintaining consistency between tangent and texture directions, thereby further improving the efficacy of subsequent edge feature extraction.
Regarding the enhancement of Gaussian filtering, the introduction of a vertical weight function eliminates the influence of anomalous feature values, resulting in superior noise suppression and improved image processing stability.
3.2.1. Image Preprocessing
A series of preprocessing operations was applied to the image, including grayscale transformation, enhancement, and binarization processing. After linear stretching of the original image’s grayscale values, this approach effectively addresses issues of underexposure and low contrast, resulting in clearer images with more prominent features. The subsequent operation involves binarization processing, which segments the image into background and target regions. The employed method is the maximum variance thresholding technique, with the specific procedure as follows:
Let
T denote the total number of pixels in the image to be processed, with an average grayscale value
. Let
a represent the segmentation threshold between background and target. The proportion of pixels belonging to the target relative to the entire image is denoted as
, with its average grayscale value
. Similarly, the proportion of pixels belonging to the background relative to the entire image is denoted as
, with its average grayscale value
. The following equations are established:
Subsequently, the inter-class variance between the background and foreground pixels is calculated using the following equation.
By substituting Equation (1) into Equation (2), the final formula for inter-class variance is obtained as
Finally, through an iterative approach, an optimal threshold a is identified that maximizes the inter-class variance, which serves as the required threshold for binarization processing.
3.2.2. Improved Gaussian Filtering for Image Enhancement
Traditional Gaussian filtering often yields poor performance when dealing with abnormal feature values in images, struggling to eliminate their influence and consequently affecting subsequent object detection. To address this issue, we improved the traditional Gaussian filtering algorithm by incorporating a vertical weight function. This modification enables better handling of abnormal feature values, achieves improved denoising performance, and enhances the stability of processing results. The robust Gaussian filter is expressed as follows:
where α is an independent variable representing the position of the image contour.
represents the surface profile;
denotes the low-frequency baseline signal;
is the newly introduced vertical weight function;
indicates the convolution operation of the Gaussian weight function;
represents the frequency response function; and
,
are the integration limits. The appropriate vertical weight function
is obtained through iterative operations.
The robust Gaussian filtering centerline is then calculated using the following formula:
where
represents the convolution operation of the surface profile;
denotes the frequency response function.
Discretizing the above results yields
where
is the Gaussian weight function.
During the iterative process of
, Gaussian filtering is applied to both
and
, while introducing a residual function, resulting in the following expression:
where
mid denotes the median value, and
represents the integral function.
Finally, a robust estimation model is constructed. This section employs the
Tukey biweight estimator as the vertical weight function, which achieves better model stability and effectively excludes the influence of abnormal feature values. The
Tukey biweight estimator is expressed as
where
U represents the ratio of the deviation-related parameter to the parameter median. The final robust estimation model is formulated as
The improvement in traditional Gaussian filtering explained in this section is achieved by constructing a robust estimation model for Gaussian filtering. Through iterative processes, the influence of abnormal feature values is eliminated, resulting in better denoising performance and improved image quality.
3.3. SODMamba Backbone Network
The SODMamba backbone serves as the primary feature extraction engine of our proposed network, designed to hierarchically capture and refine features from the enhanced infrared image. As illustrated in
Figure 1, the backbone adopts a multi-level architecture (L1–L4), progressively processing the input through a series of specialized modules. It begins with the Simple Stem for initial patch embedding and feature dimension adjustment. Subsequently, each level integrates ODSSBlocks for robust local feature modeling, interspersed with deep feature perception modules (DFPMs) to specifically amplify the high-frequency cues critical for small drone targets. This design ensures a balanced focus on both local details and global context, making it particularly adept at handling the challenges of infrared small target detection.
3.3.1. Deep Feature Perception Module (DFPM)
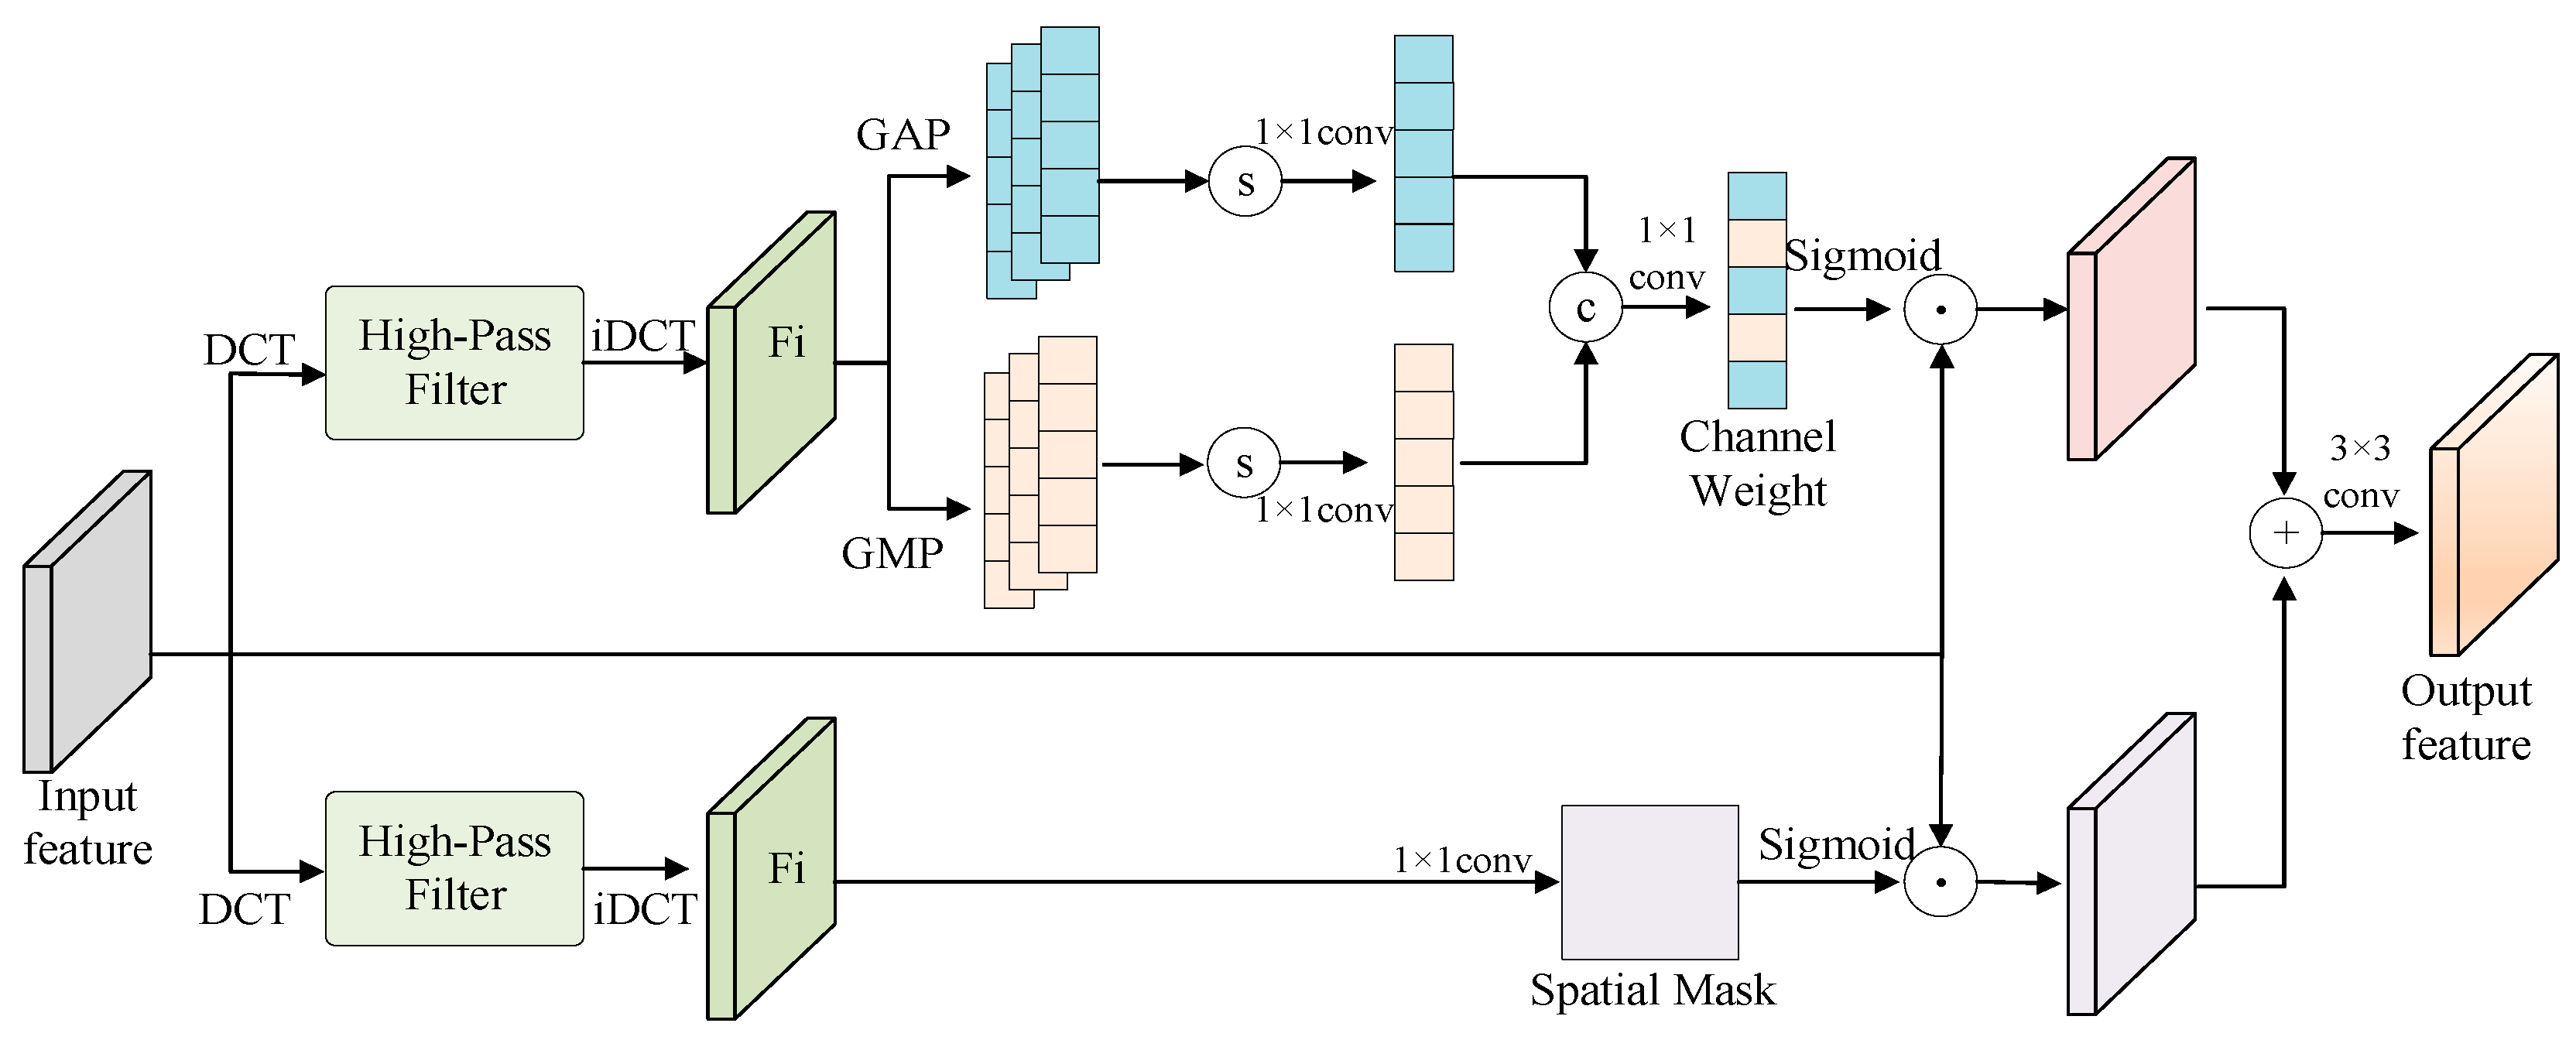
Figure 3 shows the structure of DFPM. DFPM leverages the characteristic that small target features primarily correspond to high-frequency components in images. It extracts high-frequency responses from input feature maps through a high-pass filter, filtering out low-frequency background information. Subsequently, the high-frequency responses are utilized to generate channel attention weights and spatial attention weights, respectively: channel weights highlight channels containing more small target features, while spatial weights focus on regions where small targets are located. Finally, weighted fusion enhances the representation of small targets in the original features.
DFPM consists of three core components:
High-Frequency Feature Generator: Extracts high-frequency responses through discrete cosine transform (DCT) and a high-pass filter (controlled by the parameter α for filtering range). In our experiments, we employed a 5 × 5 high-pass filter kernel and set α = 0.25. This value was empirically determined to optimally preserve the high-frequency cues of small targets while effectively suppressing low-frequency background noise. The parameter α determines the fraction of low-frequency DCT coefficients to be filtered out.
Channel Path (CP): Applies global average pooling (GAP) and global max pooling (GMP) to high-frequency responses, generates channel weights through convolutional layers, and dynamically allocates importance to each channel;
Spatial Path (SP): Aggregates channel information of high-frequency responses through 1 × 1 convolution to generate spatial masks, localizing pixel regions containing small targets. The outputs from both paths are element-wise multiplied and added, and then processed through a 3 × 3 convolution to obtain enhanced features.
When DFPM is integrated into the backbone, it further enhances high-frequency details of small targets in detection network output features while suppressing background noise. Through dynamic weight allocation, it enables the detection network to focus more on small target regions, improving detection accuracy for small targets in complex scenes and reducing missed detections and false positives.
3.3.2. Simple Stem
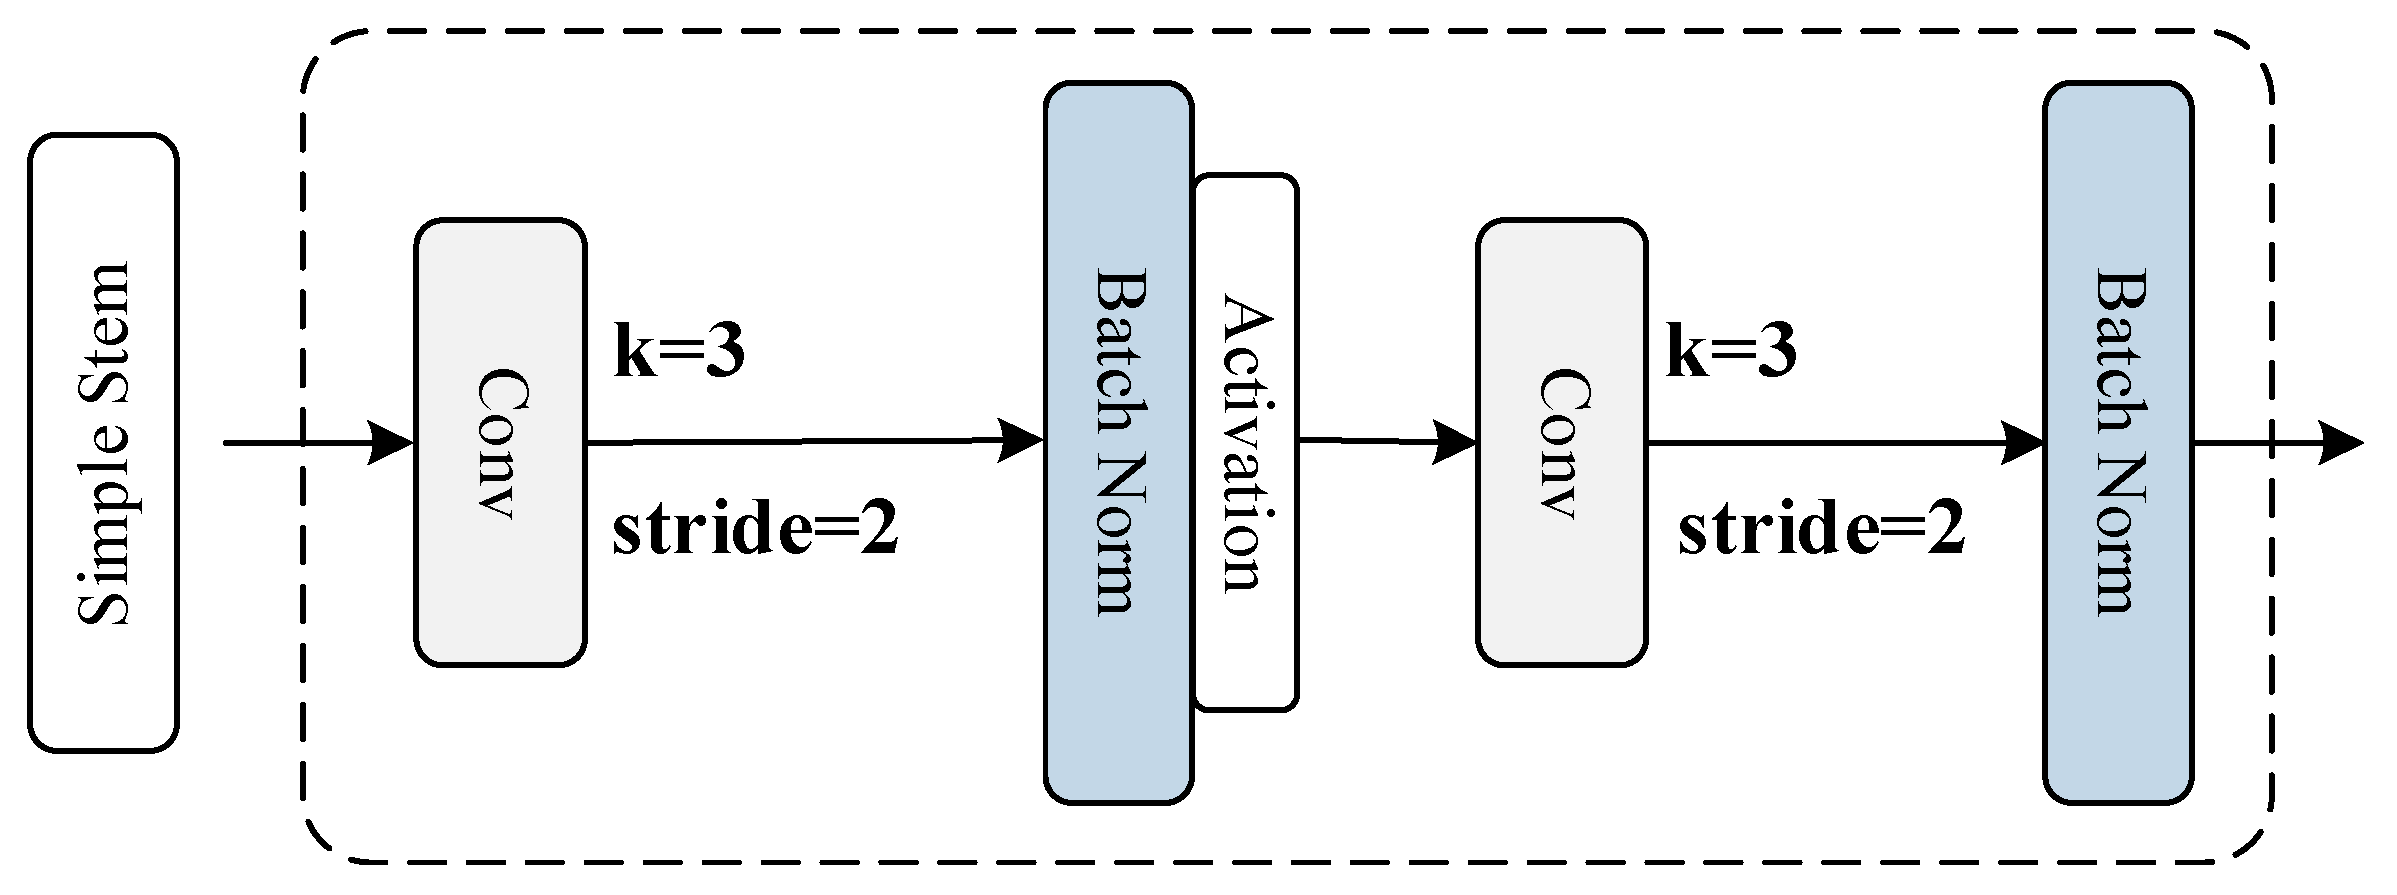
Figure 4 shows the structure of Simple Stem. Traditional sampling process, a convolution kernel with size 4 and stride 4 is typically used to segment the input image into non-overlapping patches for subsequent processing. However, this aggressive downsampling can lead to a significant loss of fine-grained spatial information and high-frequency details, which is particularly detrimental for detecting small targets that may only span a few pixels [
35]. We propose a Simple Stem approach, redesigning the initial layers with two sequential convolutions of kernel size 3 and stride 2. This design generates overlapping patches, which helps to preserve more detailed information from the input image, especially crucial edge and texture features that are essential for identifying small infrared targets. While halving the hidden layer channels after each convolution to maintain computational efficiency, this overlapping patch strategy provides a richer feature representation for the subsequent network layers.
3.3.3. ODSSBlock
ODSSBlock is comprised of three sub-modules: LSBlock, RGBlock, and SS2D. Through sequential processing of input images, it preserves richer and deeper feature information, facilitating subsequent deep learning and establishing more reliable models. Meanwhile, batch normalization ensures efficient and stable training and inference processes.
Figure 5 illustrates the overall structure of ODSSBlock.
Through batch normalization, layer normalization, and residual connections, ODSSBlock enables effective information flow when stacked in deep architectures. The overall formulation is as follows:
where
denotes the activation function,
BN represents batch normalization,
indicates depthwise convolution, and
is the input image.
where
SS2D and
RG represent the corresponding modules, and
LN denotes layer normalization.
Figure 6 shows the structure of SS2D. SS2D consists of three main steps: Scan Expansion, S6 Block, and Scan Merge, with the algorithm workflow illustrated below:
Scan Expansion expands the input image in different directions to generate four distinct sub-images. When viewed from the four corners of the image, the expansion directions of the four sub-images are symmetrical, originating from each corner and proceeding clockwise in an S-shaped pattern to complete image expansion. The advantage of multi-directional image expansion is comprehensive coverage of all image regions, enabling better feature extraction, providing richer information, and improving the efficiency and effectiveness of multi-dimensional image feature capture. After image expansion, the S6 Block processes the sub-images through feature extraction, and finally, the four sub-images are recombined through Scan Merge to output an image of the same size as the original.
Figure 7 shows the structure of S6 Block. The core of S6 Block is the State Space Model (SSM), which maps input vectors
to output vectors
through implicit intermediate states
, enabling parameter updates and learning. The basic operational workflow is as follows:
3.4. PAFPN Module
Following the backbone, the path aggregation feature pyramid network (PAFPN) module acts as the neck of our detection architecture, responsible for effectively fusing the multi-scale features extracted from the backbone’s different levels (P3, P4, and P5). The PAFPN facilitates bidirectional (top-down and bottom-up) information flow. It employs upsampling operations and concatenation to merge semantically strong features from higher levels with spatially rich features from lower levels. This process is further refined through ODSSBlocks, enhancing the representational power of the fused features. The output is a set of strengthened feature maps at multiple scales, each containing rich semantic information and precise spatial details, which are then fed into the detection head for precise target localization and classification.
4. Experiments on the Dataset
4.1. Dataset and Metrics
4.1.1. Dataset
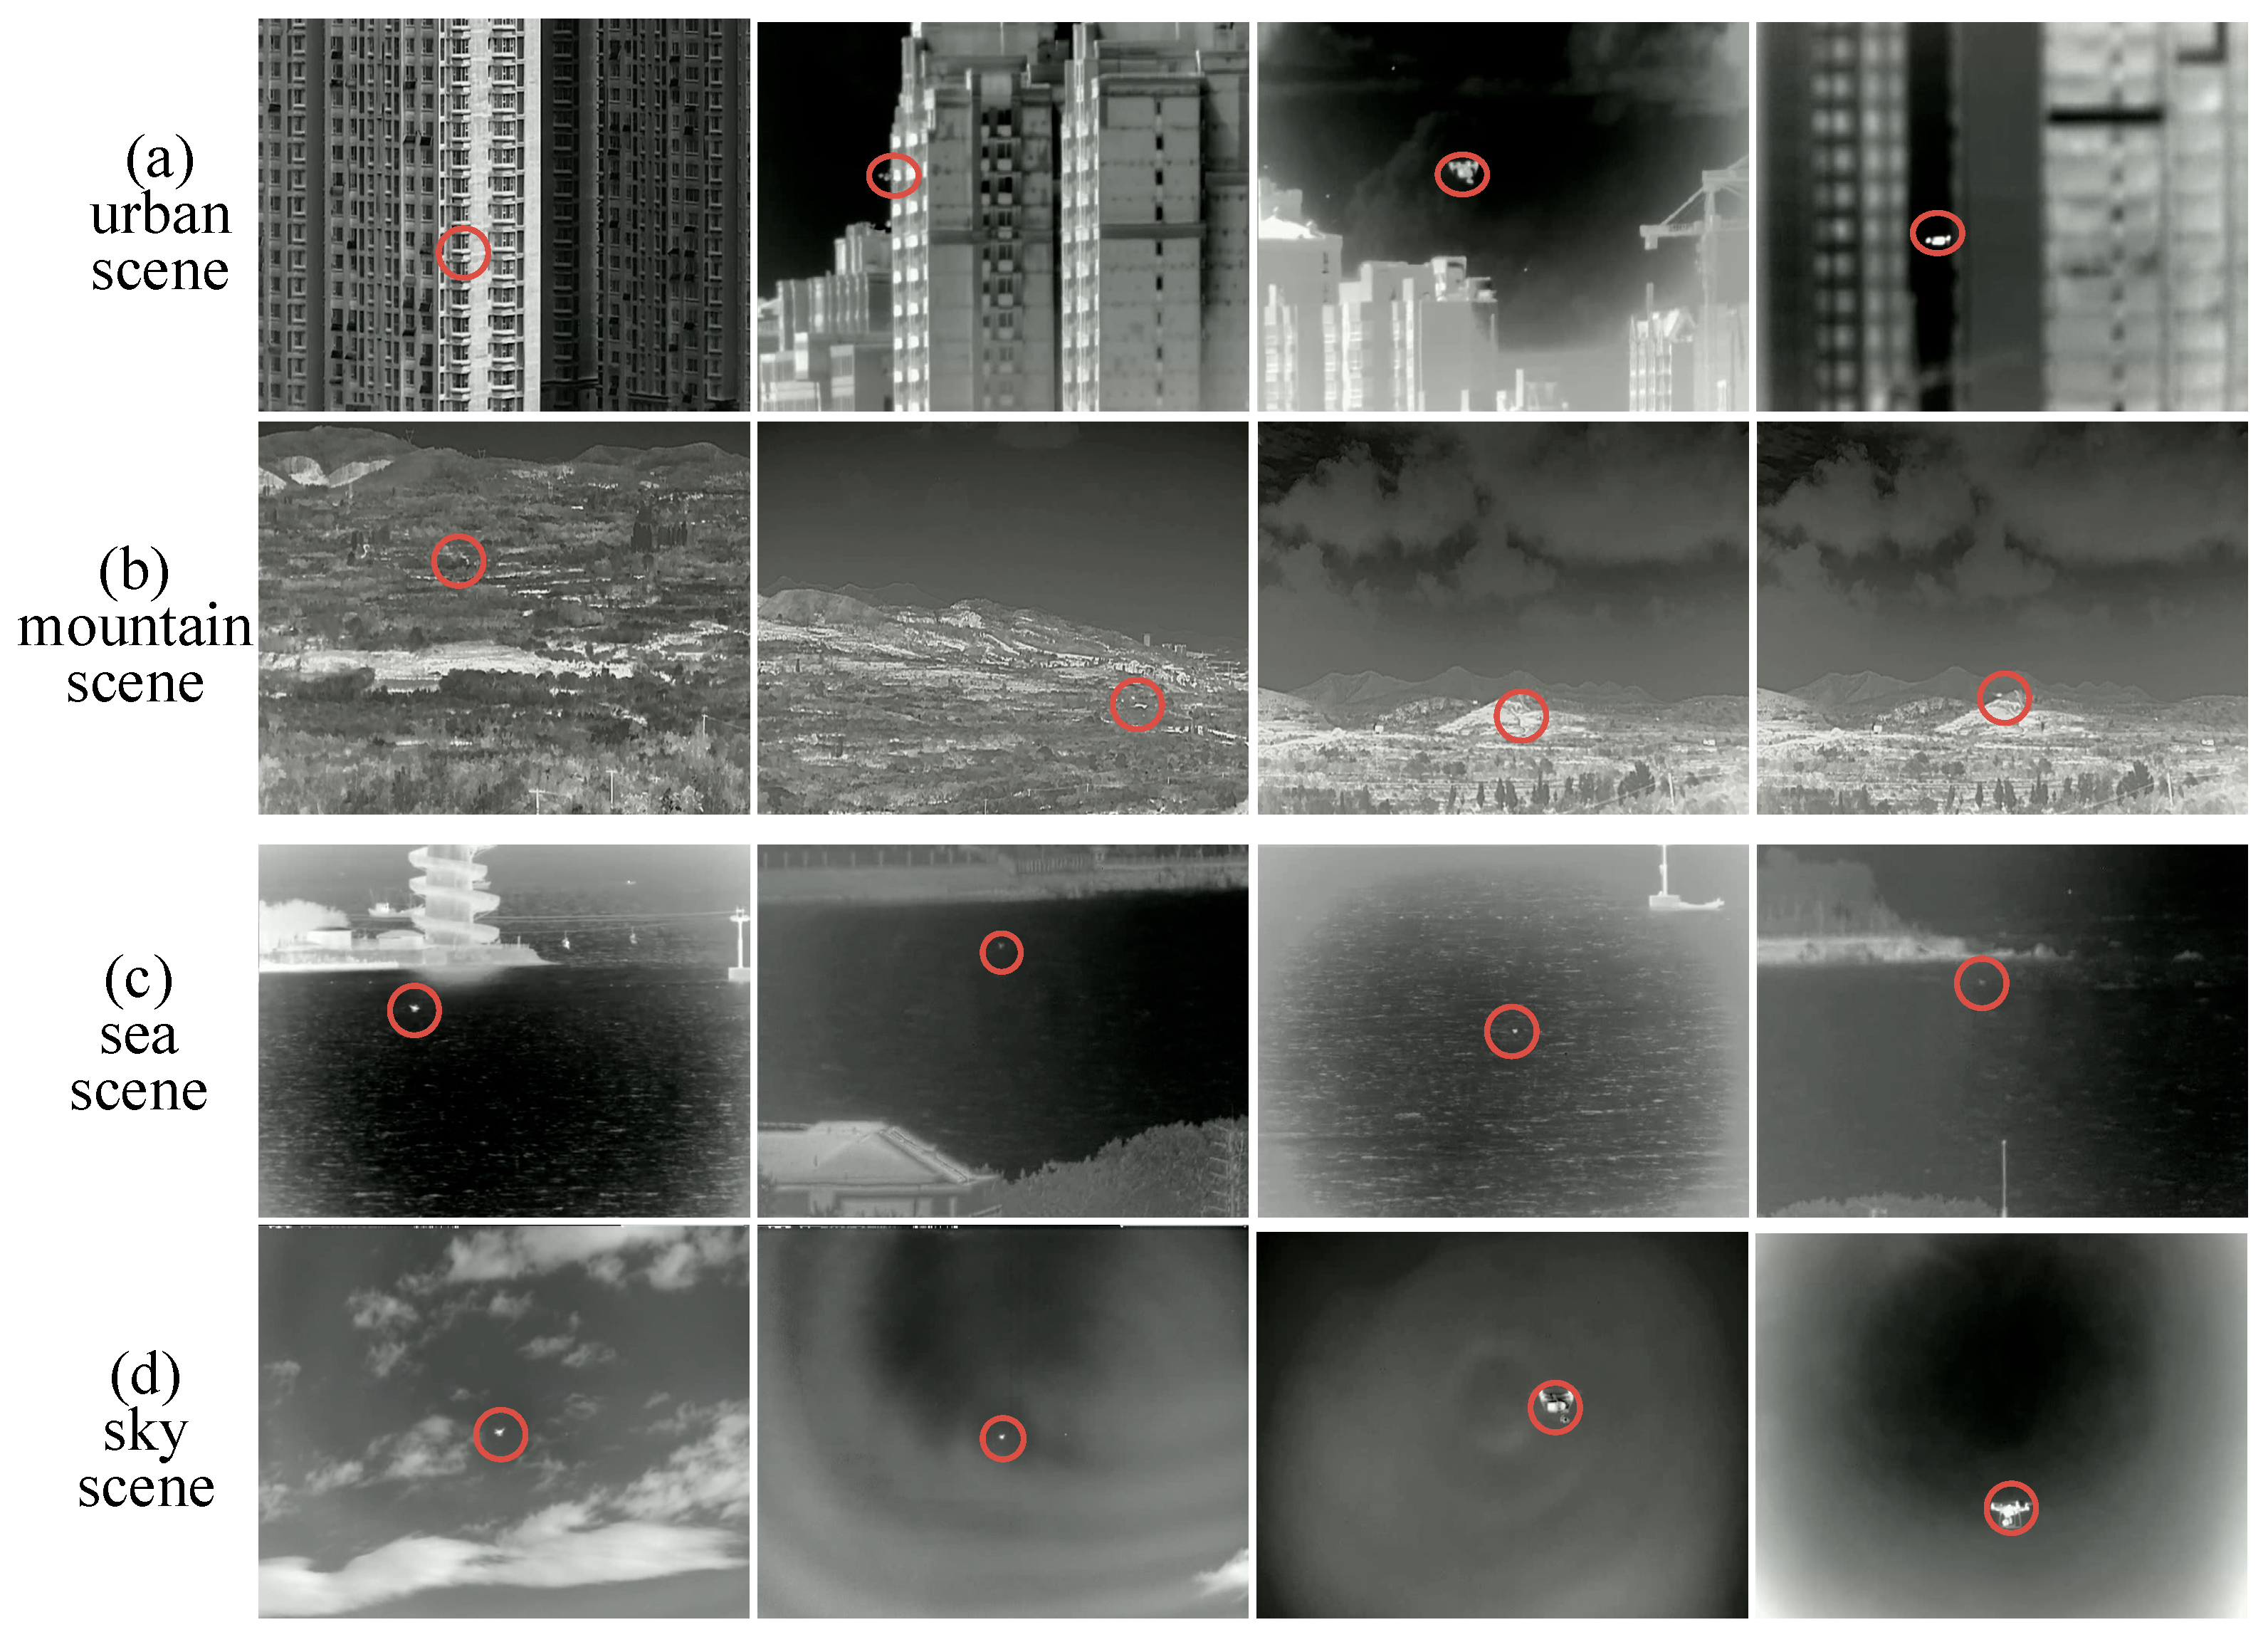
To address the insufficient datasets in current drone target detection research, we selected publicly available infrared image datasets from ground/aerial backgrounds and partial data from the 1st CVPR Anti-UAV dataset to create a custom dataset. Targets in different scenes and scales are classified and annotated at the pixel level to construct the SIDD dataset. All images were meticulously annotated at the pixel level. The annotation was performed using the LabelMe annotation tool. The labeling criterion for a positive sample was defined as any visible drone within the image. For each drone instance, a polygon mask was drawn to tightly enclose all visible parts of the drone body, including the rotors, even in cases of partial occlusion or extreme blur. Images containing no drones were excluded from the dataset. To simulate realistic drone intrusion scenarios as closely as possible, the SIDD dataset is divided into four scenarios to investigate the impact of different backgrounds on low-altitude infrared drone target detection accuracy.
Table 1. Shows the number of training and test sets in SIDD. The SIDD dataset contains 4737 infrared images with 640 × 512 pixel resolution with different backgrounds, including 1093 urban scene images, 2151 mountain scene images, 713 sea surface scene images, and 780 sky scene images. The dataset was split with 80% for algorithm training and 20% for testing.
Figure 8 shows sample images from the SIDD dataset, displaying urban, mountain, sea surface, and sky scenarios from top to bottom. In all four scenarios, a quadrotor drone serves as the detection target, with drone targets marked by red circles.
4.1.2. Metrics
This paper treats drone target detection as an instance segmentation task. Therefore, classic instance segmentation evaluation metrics were used to compare the performance of different algorithms, including average precision (AP) and model parameters, to assess the detection performance of various algorithms.
Average Precision: In instance segmentation tasks, IoU is typically used to determine whether prediction results are positive samples. IoU refers to the ratio of intersection to union between the predicted target mask and the ground truth region.
The definition of precision and recall is as follows:
where
TP (true positive) refers to the number of samples correctly predicted as positive by the model.
FP (false positive) refers to the number of samples predicted as positive but actually negative.
FN (false negative) refers to the number of samples predicted as negative but actually positive. The precision–recall (
P-R) curve is a visualization method for evaluating detection algorithm performance, plotted with precision as the
x-axis and recall as the
y-axis. The mAP (mean average precision) value is obtained by calculating the area under the
P-R curve to assess detection accuracy.
This study uses to evaluate the model’s detection capability for small targets (targets smaller than 32 × 32 pixels in the image), mAP@0.5:0.95 to evaluate the average value when IoU thresholds are {0.5, 0.55, ⋯, 0.95}, and mAP@0.5 to evaluate the value when the IoU threshold is 0.5.
Model Parameters: The numerical values of parameters contained in the model, including weight matrices in convolutional and fully connected layers used in the model. The size of model parameters reflects the model complexity to some extent.
4.2. Implementation Details
The experiments in this chapter were conducted on the Ubuntu 18.04 operating system with the PyTorch 1.8.0 deep learning framework. All detection algorithms were trained for 50 epochs on a custom SIDD dataset. During training, 2 images were processed per iteration, with an initial learning rate of 0.0025, weight decay of 0.005, and AdaGrad as the training optimizer. The hardware setup consists of an NVIDIA GeForce RTX3060 GPU (Santa Clara, CA, USA) with 6 GB graphics memory, an AMD Ryzen 7-5800H CPU (Santa Clara, CA, USA), and 16 GB system memory.
4.3. Image Enhancement Results
We conducted experimental verification of the improved Gaussian filtering infrared enhancement algorithm on the aforementioned datasets. To more intuitively demonstrate the experimental results, this section presents a comparison between the original dataset images and the processed images. In each group of images, the left side shows the unprocessed image, while the right side displays the image after improved Gaussian filtering and infrared enhancement processing. The following four tables present the experimental contrast data, with the contrast formula defined as follows:
where
STD represents contrast, and
represents pixel values.
Figure 9,
Figure 10,
Figure 11 and
Figure 12 show the comparison results in the urban, mountain, sea and sky scene respectively.
Table 2,
Table 3,
Table 4 and
Table 5 show the contrast data in the urban, mountain, sea and sky scene respectively. To provide a more comprehensive assessment following the reviewer’s suggestion, we employed two additional standard image quality metrics: peak signal-to-noise ratio (PSNR) and structural similarity index (SSIM). The PSNR measures the ratio between the maximum possible power of a signal and the power of distorting noise, expressed in decibels (dB). A higher PSNR value typically indicates lower distortion and higher fidelity to the original image. The SSIM assesses the perceptual quality by measuring the similarity between two images based on their luminance, contrast, and structure. Its value ranges from −1 to 1, with a value closer to 1 indicating higher structural similarity.
Based on the analysis of the experimental data and images above, among the four scenarios, the urban scene exhibited the highest noise levels in the original images, presenting the greatest processing difficulty. This is reflected in the lower post-enhancement PSNR and SSIM values for this scenario, as the algorithm worked aggressively to suppress noise and enhance contrast, inevitably altering the image structure significantly. The sea and sky scenes demonstrated more favorable results in terms of absolute contrast improvement, with the sea scene also showing relatively higher PSNR values, indicating a better balance between enhancement and fidelity in these less cluttered environments. For the mountain scene, while the original image quality was relatively high and the processing results were satisfactory, the inherent similarity between the target and background textures limited the absolute contrast gain. The moderate PSNR and SSIM values here indicate a perceptible but less drastic transformation compared to the urban scene.
Crucially, the interpretation of the low PSNR and SSIM values requires an understanding of the enhancement objective. These metrics measure fidelity to the original image. However, the goal of our algorithm is not faithful reconstruction but rather strategic alteration to optimize the image for subsequent target detection. The significant reduction in these fidelity metrics is a direct consequence of the aggressive contrast stretching and noise suppression that define our approach. This is a justified trade-off, as the ultimate validation is the superior detection performance achieved using the enhanced images, as conclusively demonstrated in
Section 4.4.
Overall, the improved Gaussian filtering-based infrared enhancement algorithm achieved its primary goal of producing images with higher contrast and reduced noise, providing more distinct features for the detection network, despite the inherent reduction in similarity to the original images as captured by PSNR and SSIM.
4.4. Target Detection Results Compared with Other Methods
The detection performance of various models in the urban scene is shown in
Table 6. The three key metrics of the proposed method in this paper reached 66.1%, 66.8%, and 96%, respectively, all ranking first. With only 6.2 M parameters, significantly smaller than most models, it demonstrates substantial advantages in both detection performance and real-time capability.
The detection performance for the mountain scene is presented in
Table 7. The three key metrics of the proposed method reached 42.6%, 42.6%, and 74.1%, respectively, with the first two metrics ranking first, demonstrating strong small target detection capability. The third metric also performed well, only slightly lower than Mask-RCNN.
Table 8 shows the detection performance for the sea scene. The proposed method’s three key metrics reached 45.8%, 45.8%, and 92%, respectively. While performance remained good, compared to the previous two scenarios, the first two metrics ranked second, 0.5% lower than Mask-RCNN, still demonstrating high small target detection capability. The third metric was 1.3% lower than Mask-RCNN and 1% lower than YOLOv7.
The detection performance for the sky scene is shown in
Table 9. The proposed method’s three key metrics reached 73.4%, 73.4%, and 98.7%, respectively, all ranking first. Due to the simple sky background, all models showed high performance overall, but the proposed method still demonstrated exceptional target detection performance and real-time capability.
Based on the data from these four scenarios, it can be concluded that the proposed method shows significant improvement in small target detection, particularly in scenarios where other models perform poorly, while maintaining extremely high processing speed and high precision.
The qualitative comparison of experimental results: The qualitative comparison of experimental results under four different backgrounds is shown in
Figure 13, arranged from top to bottom as urban, mountain, ocean, and sky backgrounds, and from left to right showing the experimental results of the various models. Red boxes indicate correct target detection results, yellow circles indicate incorrect detection results, and no display indicates undetected targets. For ease of overall comparison, the detected target portions are magnified in the upper right corner marked by red boxes.
The comparative experiments show that the BoxInst algorithm produced detection errors in ocean backgrounds, Mask-RCNN produced detection errors in mountain backgrounds, and YOLACT++ produced incorrect detection results in urban backgrounds. Overall, the proposed method demonstrated superior detection performance, achieving good detection results across all background types.
Combining quantitative and qualitative experimental results, the proposed method effectively completes low-altitude small UAV target detection tasks in complex scenarios while maintaining a small parameter size and high real-time performance, comprehensively improving target detection performance.
4.5. Ablation Studies
To justify the contribution of the proposed image enhancement method, we carried out an ablation study comparing the final detection performance (mAP) of the full model against versions using: (a) no image enhancement, (b) a simple baseline like contrast-limited adaptive histogram equalization (CLAHE), and (c) the proposed image enhancement. The results of the ablation study on image enhancement methods are presented in
Table 10. The quantitative comparison unequivocally demonstrates the contribution of our proposed enhanced Gaussian filtering method to the final detection performance. Across all four challenging scenarios, our method consistently achieved the highest scores in all three metrics (mAP@0.5:0.95, mAP@0.5, and mAPs).
Notably, the performance gain is most substantial in the most complex urban environment, where our method outperforms both “no enhancement” and CLAHE by a significant margin. This indicates that our method is particularly effective at handling severe noise and clutter, which are predominant in such scenes. While CLAHE also provides a noticeable improvement over no enhancement, its effect is less pronounced than our method, especially for the more stringent mAP@0.5:0.95 metric. This suggests that our proposed enhancement offers a more robust and targeted improvement, likely due to its integrated noise suppression and edge-preserving capabilities, which are crucial for preparing the image for small target detection. The results in the simpler sky scene, where all methods perform well, further confirm that our enhancement does not degrade performance in already favorable conditions. In conclusion, this ablation study validates that our proposed image enhancement module is a key contributor to the state-of-the-art performance of the overall detection framework, justifying its design complexity through superior results.
6. Conclusions
This paper presented a comprehensive framework for infrared UAV target detection that addresses the fundamental challenges of small target detection in complex backgrounds. Through the integration of an improved Gaussian filtering-based image enhancement module and a specialized deep learning architecture, we achieved significant improvements in both detection accuracy and processing efficiency. The proposed improved Gaussian filtering algorithm successfully addressed the limitations of traditional filtering approaches by incorporating a vertical weight function that effectively handles abnormal feature values. Experimental results demonstrated substantial contrast improvements across diverse scenarios, with the enhanced images showing clearer target features and reduced noise interference. This preprocessing step proved crucial for improving the performance of subsequent detection algorithms. Our SODMamba backbone, featuring deep feature perception modules (DFPMs) and ODSSBlocks, demonstrated exceptional capability in extracting and preserving small target features. The DFPM’s focus on high-frequency components proved particularly effective for enhancing small UAV signatures while suppressing background clutter. The hierarchical architecture with multi-scale detection heads enabled robust detection across varying target sizes and distances. Comprehensive experiments on the custom SIDD dataset validated the superiority of our approach. The method achieved outstanding performance across all four scenarios (urban, mountain, sea, and sky), with particularly notable improvements in challenging urban environments where existing methods struggled. Real-world validation using a complete UAV detection system further confirmed the practical value of our approach. Despite the additional challenges of real-time data acquisition and processing, the system maintained robust detection performance, demonstrating its readiness for deployment in actual security applications. Despite these strengths, the current computational footprint of the model may present a challenge for deployment on extremely resource-constrained edge devices.
Future work will focus on several directions: (1) extending the method to handle even smaller targets and longer detection ranges, (2) incorporating temporal information for improved tracking capabilities, (3) optimizing the model for edge deployment through techniques such as model pruning, quantization, and knowledge distillation to significantly reduce its computational and memory requirements without substantial loss in performance, and (4) exploring the integration with other sensor modalities for more robust multi-sensor fusion systems.
