Article

Assessment of the Permanent Gully Morphology Measurement by Unmanned Aerial Vehicle Photogrammetry with Different Flight Schemes in Dry–Hot Valley of Southwest China

1
Yunnan Key Laboratory of Soil Erosion Prevention and Green Development, Yunnan University, Kunming 650500, China
2
State Key Laboratory for Vegetation Structure Function and Construction (VegLab), Institute of International Rivers and Eco-Security, Yunnan University, Kunming 650500, China
3
Institute of Scientific and Technical Information of Kunming, Kunming 650021, China
4
Ministry of Education Key Laboratory for Transboundary Ecosecurity of Southwest China, Institute of International Rivers and Eco-Security, Yunnan University, Kunming 650500, China
*
Author to whom correspondence should be addressed.
Drones 2025, 9(10), 696; https://doi.org/10.3390/drones9100696
Submission received: 29 July 2025 / Revised: 12 September 2025 / Accepted: 8 October 2025 / Published: 10 October 2025
(This article belongs to the Section Drones in Ecology)

Abstract

Unmanned Aerial Vehicle (UAV) photogrammetry technique offers significant potential for generating highly detailed digital surface models (DSM) of gullies. However, different flight schemes can considerably influence measurement accuracy. The objectives were (i) to evaluate the influences of flight altitude, photo overlap, Ground Control Points (GCPs), and other environmental factors on the accuracy of the UAV-derived DSMs and (ii) to analyze the main factors affecting the accuracy of UAV gully monitoring and explore flight schemes that balance accuracy and efficiency. The results indicated that DSM accuracy improved markedly as the number of GCPs increased from 0 to 3, with consideration given to both horizontal and vertical distribution. However, further increases in the number of GCPs did not lead to significant improvements. The accuracy of DSMs increased with a decrease in the flight altitude, but was not substantially affected by photo overlap when it exceeded 50%/40% The accuracy of DSM was significantly reduced by shadows, and flight altitude rather than slope gradient was identified as the key factor leading to high-error checkpoints (error > 0.1 m). The proportion of point clouds penetrating tree canopies decreased when the flight altitude was 150 m or higher, which could help reduce the influence of vegetation on the accuracy of DSMs. In general, with a reasonable spatial distribution of GCPs, flight altitude is the primary factor affecting monitoring accuracy. However, when balancing accuracy and efficiency, the optimal flight scheme was determined to be a flight altitude of 70 m, photo overlap of 80%/70%, and nine GCPs.

1. Introduction

Gully erosion is an intense form of soil erosion, and the three-dimensional gully channels usually cut deeply into the ground [1]. Once formed, gullies can expand rapidly in a short period, leading to severe land degradation, damage to the natural environment, and negative social and economic impacts on human society [2]. The accurate determination of the three-dimensional morphology of gullies can provide key basic data for gully erosion development mechanisms and model prediction, which is one of the most important issues in gully erosion research [3].
The morphological characteristics of different parts of the gully are significantly different, such as steep gully sidewalls and relatively flat gully beds, and the erosion rates also tend to vary significantly [4]. Consequently, a variety of techniques and methods have been introduced to monitor gully morphology. Due to the complex and irregular morphology of gullies [5], many traditional measurement methods (e.g., erosion pins and tapes) lack high accuracy and cannot meet the research needs of gully erosion [3,6]. With the development of “3S” technology, data have been acquired using emerging measurement methods, such as photogrammetry [7,8,9,10,11], laser scanning [2,12], and real-time kinematic RTK-GPS [13,14].
Unmanned Aerial Vehicles (UAVs) have been used in the field of gully erosion research in recent years due to their advantages such as easy operation, flexibility, and low cost [15,16,17]. UAVs can operate in complex terrain, enabling high-altitude, large-area monitoring as well as low-altitude, high-accuracy monitoring of smaller areas. UAV photogrammetry is increasingly used in gully erosion studies worldwide [18,19,20,21], generating topographic data with centimeter [22,23,24] and millimeter-level resolution point clouds [25]. UAVs can also be used to quickly measure the morphological parameters of gullies [26,27,28], calculate the amount of erosion in gullies [18,29,30,31], and quantify the source of sediment [25]. Multi-scale gully erosion surveys using UAVs have proven to be very successful and promising [32,33].
However, owing to the different requirements for spatial scale and accuracy, previous studies [8,26,27,32] have used widely varying flight schemes for investigating gullies (Flight altitude: 15–500 m; front overlap: 60–80%; and side overlap 30–80%). Few studies have specifically assessed the impact of the flight altitude and photo overlap on the accuracy of later data. Ground Control Points (GCPs) could help to enhance the accuracy of the DSM produced by UAV images significantly, normally requiring a reasonable horizontal distribution. However, for negative topography, such as gullies that cut deep into the ground, whether the vertical distribution of GCPs affects the monitoring accuracy also needs further study. Other environmental factors such as vegetation and shadows also affect the accuracy of UAV-based gully erosion measurements [19,34,35,36]. Due to significant variations in parameter settings across different studies, comparing monitoring results between studies and conducting comprehensive data analysis introduces considerable uncertainty. However, due to significant variations in measurement schemes across different studies and the critical influence of parameters such as flight altitude, image overlap, and GCPs on accuracy, a systematic analysis of their impact on gully erosion measurement error is essential. Furthermore, an inherent trade-off exists between measurement precision and efficiency: high-density data acquisition often reduces field operational efficiency and increases computational processing time. Consequently, developing an optimized monitoring framework that balances accuracy and operational practicality is of great significance for standardizing methodologies and enhancing efficiency in gully erosion research.
The dry–hot valley of Jinsha River is a typical ecological fragile zone [37] with intensive gully erosion in southwest China (Figure 1). The large number (over 3 km.km−2) of gullies with huge sizes (depths normally over 10 m) was widely developed in the region. Traditional monitoring methods such as 3D Laser scanner and RTK-GPS are challenging and time-consuming, making it difficult to obtain high-accuracy gully erosion data [37,38]. It is essential to explore UAV technology in this area to capture the development process and morphological characteristics of gully erosion. We chose a permanent gully in this area and used different UAV flight schemes and GCP placement schemes to collect gully photo data to analyze the accuracy and error of the Digital Surface Model (DSM) produced by different schemes. The aims of this study were to evaluate the effects of different flight schemes on measurement accuracy of a permanent gully channel, and to explore flight schemes that balance accuracy and efficiency based on the analysis of factors influencing error.

2. Materials and Methods

2.1. Study Area

The Yuanmou County (101°35′–102°05′ E, 25°25′–26°07′ N) is located in the lower reaches of the Jinsha River, Yunnan Province, southwest China, and is a typical dry–hot valley region. The average annual temperature and precipitation are 21.8 °C and 634 mm, respectively. Rainfall is mainly concentrated from June to October (the rainy season). The annual evaporation is approximately six times higher than the annual rainfall [39]. The main soil types are dry red soil (Rhodoxeralfs in USDA Soil Taxonomy) and vertisols (Torrerts in USDA Soil Taxonomy), and the tropical savanna is the dominant vegetation landscape in this region [38,40]. The density of the gully network is 3–5 km/km2, with the highest density of 7.4 km/km2 in this region [39]. Gullies in this region are often large in scale, with deep incisions (>10 m) into the earth’s surface [40]. In this study, we selected a permanent gully channel in this area (Figure 1) with typical vegetation species (Heteropogon contortus and Dodonaea viscosa) and dry red soils [39,41].

2.2. Measurement Methods

2.2.1. Field Monitoring

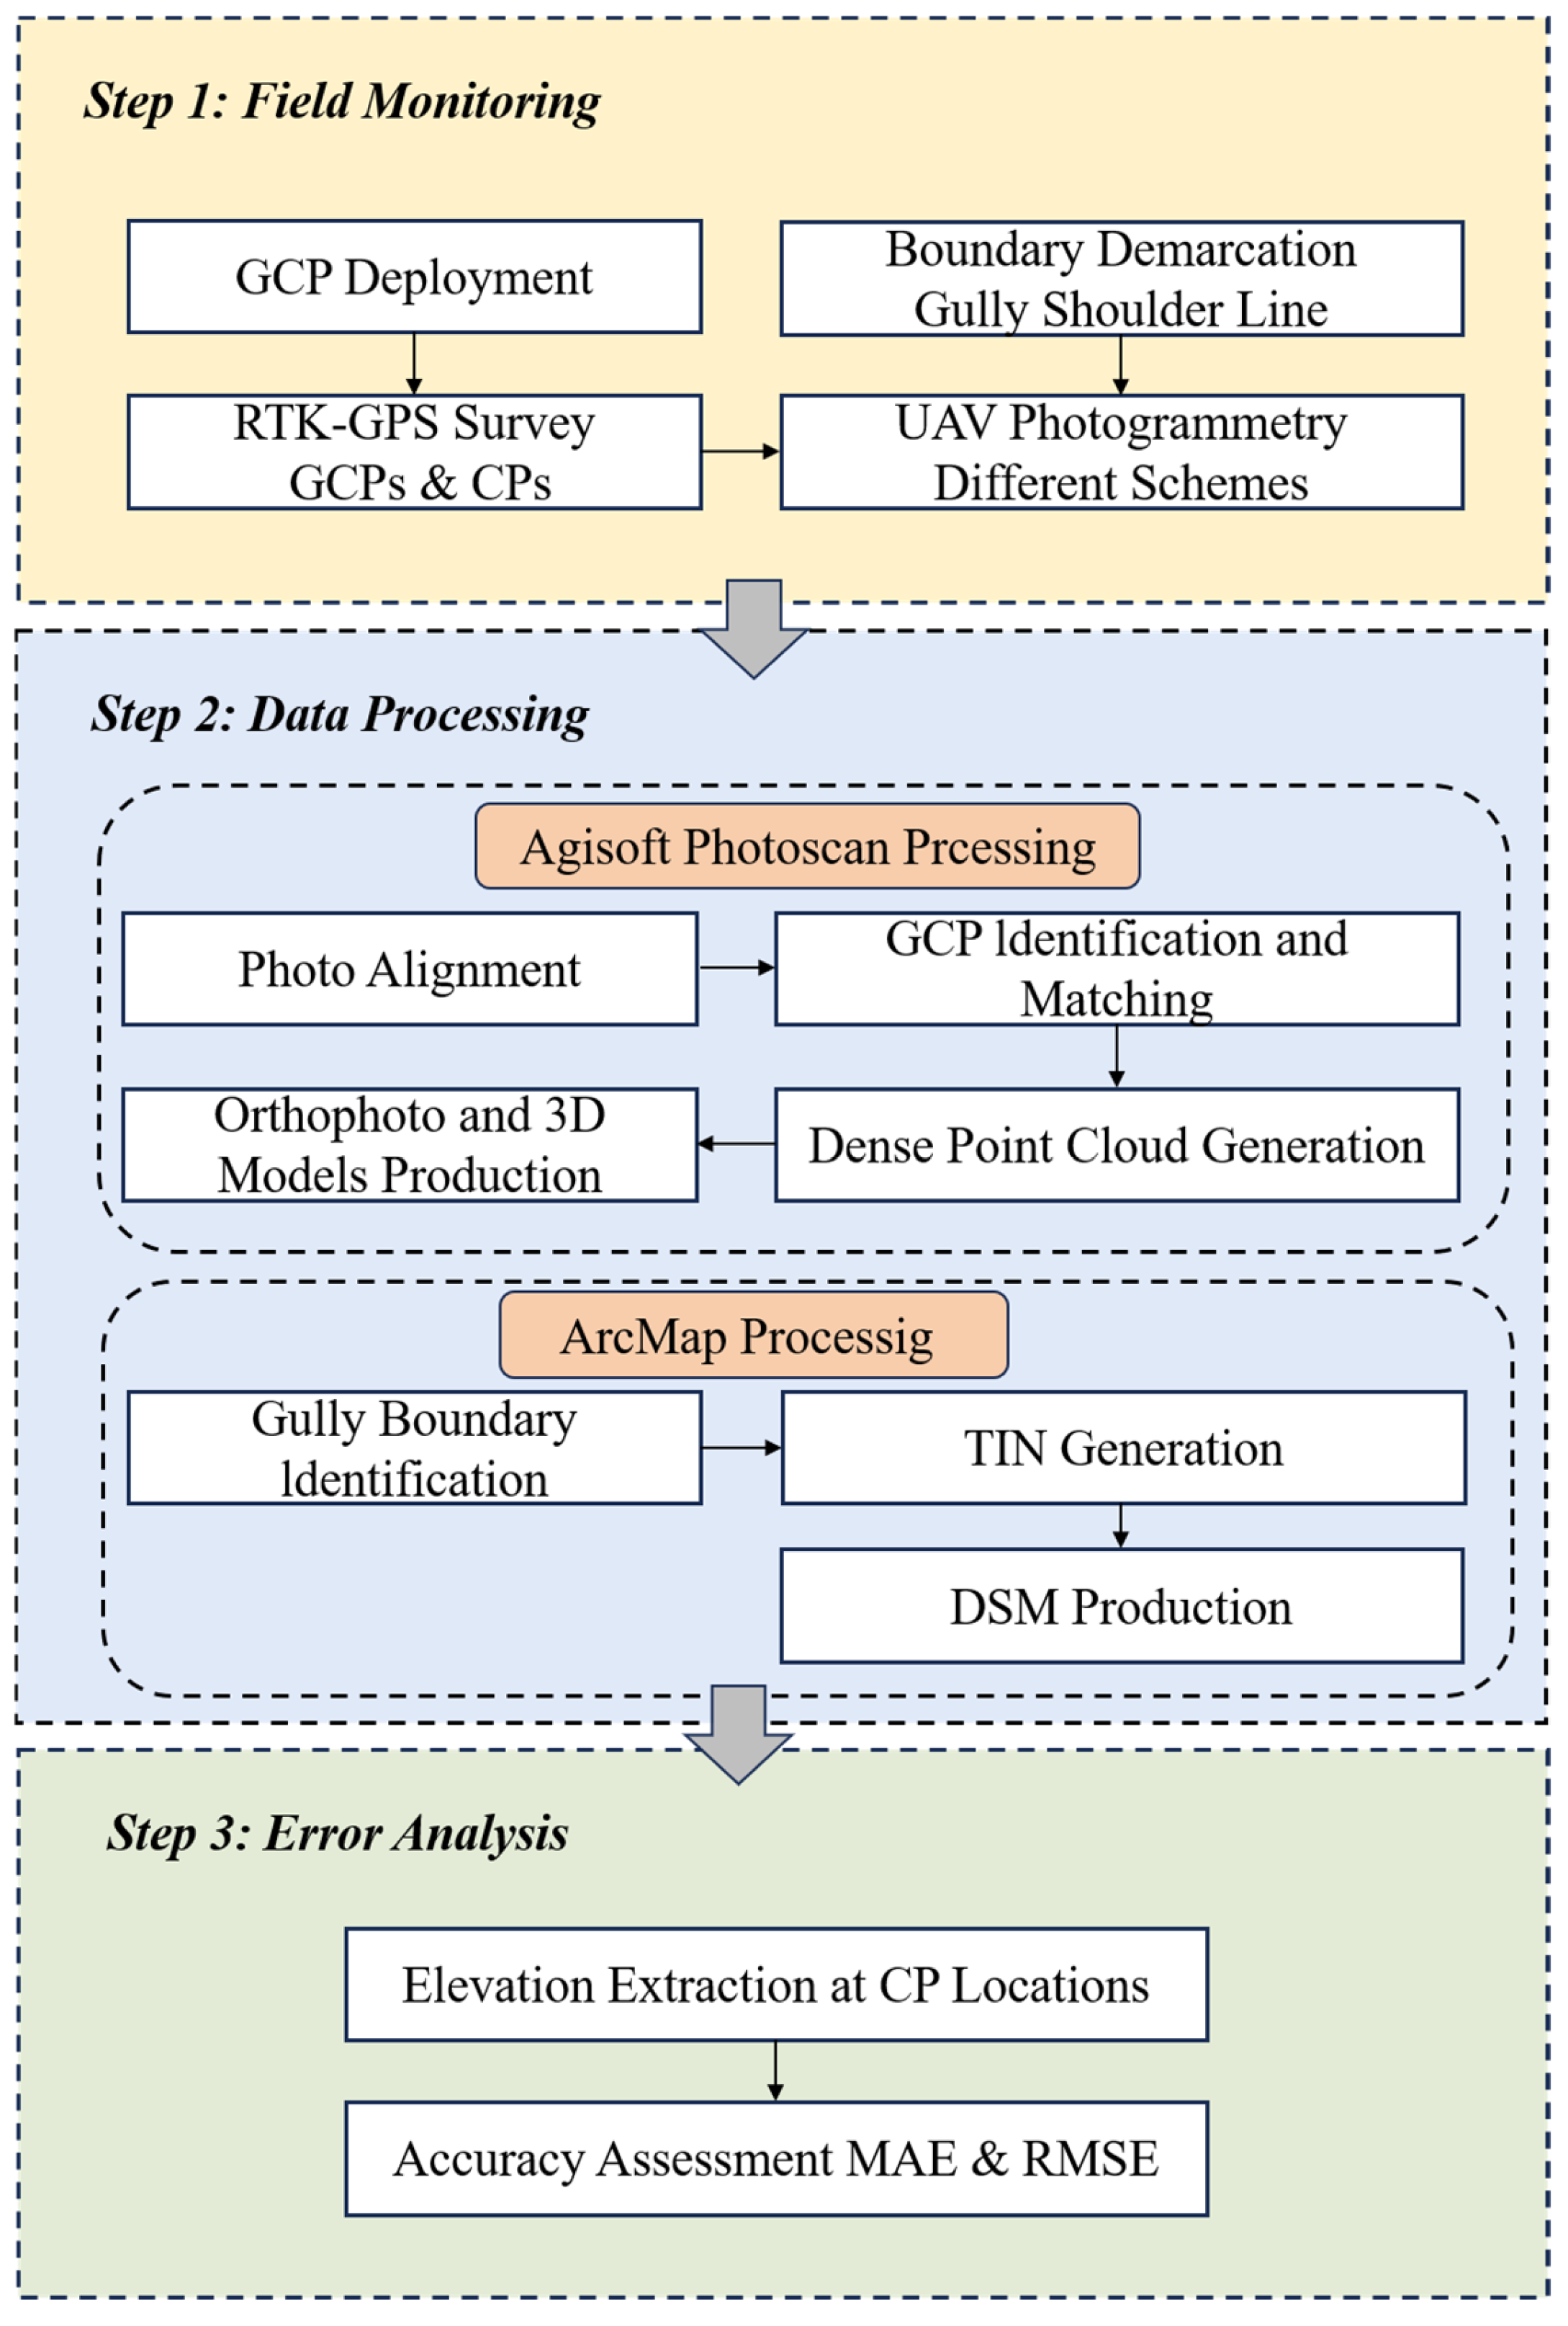
Field monitoring included ground control point placement and measurement, checkpoint (CP) measurement, and photo acquisition (Figure 2). The location and quantity of GCPs affect the accuracy of subsequent products [22]. We evenly laid 35 GCPs (Figure 1) in three parts of the selected permanent gully at different elevations: the gully shoulder line (GS, 11 points, average elevation of 1009.00 m), the middle of the gully sidewall (GW, 14 points, average elevation of 998.35 m), and the gully bed (GB, 10 points, average elevation of 990.29 m). The iron sheets with red cross markings on the ground can be recognized by the naked eye in aerial photos during data processing. After the GCPs were laid out, the elevation and coordinates of each point were measured separately using the high-accuracy real-time kinematic Global Positioning System (RTK-GPS ZHD V90BX, with a horizontal accuracy of 1 cm + 1 ppm and a vertical accuracy of 2 cm + 1 ppm), with the georeferencing system set to WGS 1984. During the placement of the GCPs, 200 CPs were randomly measured in the gully using the RTK-GPS equipment, of which 50 were on the gully shoulder line, 75 on the gully sidewall, and 75 on the gully bed. Furthermore, RTK-GPS was used to measure a series of points along the gully shoulder line as the uniform boundary of the gully. Additionally, no rainfall events occurred in the study area during field monitoring.
The UAV used in this study was a DJI PHANTOM 4 RTK (DJI, Shenzhenm China). It is a four-rotor high-accuracy drone that can provide centimeter-level positioning data in real time (with the horizontal positioning accuracy of the RTK being 1 cm + 1 ppm and the vertical positioning accuracy being 1.5 cm + 1 ppm). The UAV has an endurance of approximately 30 min, a 1” CMOS camera sensor (DJI, Shenzhen, China) with a 20 MP resolution, and a 35 mm format equivalent: 24 mm, f/2.8–f/11 lens. After the measurement of the GCPs and CPs was completed, we chose a suitable spot near the gully for takeoff and landing, and used the UAV to capture photos. We used the GS RTK App (V02.02.0503) to plan the remote control flight routes and boundaries according to the research object. The flight area was approximately 48,000 m2, and the camera on the UAV was configured to maintain a fixed downward orientation while flying.

2.2.2. Data Processing

We used the Agisoft Photoscan Professional (1.4.5) and ArcMap (10.4) to process the UAV field data (Figure 2). The graphics workstation model was the Dell Precision 7750, configured with an Intel Core i7-10750H processor (Intel, Santa Clara, CA, USA) and an NVIDIA GeForce RTX 3000 graphics card (NVIDIA, Santa Clara, CA, USA). The UAV images were imported into the PhotoScan professional software (1.4.5) for processes such as aligning the photos, identifying and matching GCPs, optimizing cameras, and creating dense point clouds to generate topographic point clouds, orthophotos, and 3D models of the different schemes [42,43]. The topographic point clouds and orthophotos were imported into ArcMap 10.4, and the gully boundary was identified based on the points on the gully shoulder line measured by the RTK-GPS. The point clouds located inside the gully boundary were used to generate a triangulated irregular network (TIN) for each scheme, and then the TIN was converted into a DSM with a cell size of 0.1 m using the “3D Analyst” tools (ArcMap 10.4).

2.2.3. Error Analysis

The CP txt file was imported into ArcMap 10.4, and the elevation values of the DSM (Estimated values) were extracted from the CP coordinates using the “Extract Values to Points” in the “Spatial Analyst” tools (ArcMap 10.4). They were then compared with the elevation values (Observed values) of the RTK-GPS measurements to analyze the errors. The accuracy of the different schemes was evaluated using the mean absolute error (EMAE, Equation (1)) and root mean square error (ERMSE, Equation (2)):
E MAE = 1 n i = 1 n | ( Z i Z i ) |
E RMSE = 1 n i = 1 n ( Z i * Z i ) 2 0.5
In Equations (1) and (2), n is the number of checkpoints, Z i * is the elevation value of checkpoint i measured by the RTK-GPS, and Zi is the elevation value corresponding to checkpoint i in the DSM.
In addition, the slope gradients of the gully were extracted from the DSMs generated for each scheme using the “Surface Analysis” tools in “3D Analyst” (ArcMap 10.4). A fixed DSMb was generated using only points at the gully boundary measured by RTK-GPS with the same cell size of 0.1 m as the DSMs of different schemes, and the volumes and average depths of the gully were calculated by subtracting the DSMs of each scheme from the DSMb. Checkpoints with errors greater than 10 cm were considered high-error checkpoints (HECPs).

2.3. Schemes

The main factors affecting the UAV measurement results included the distribution and number of GCPs, flight altitude, and photo overlap. These factors were examined separately. When testing one factor, the other two factors were kept constant (Table 1).
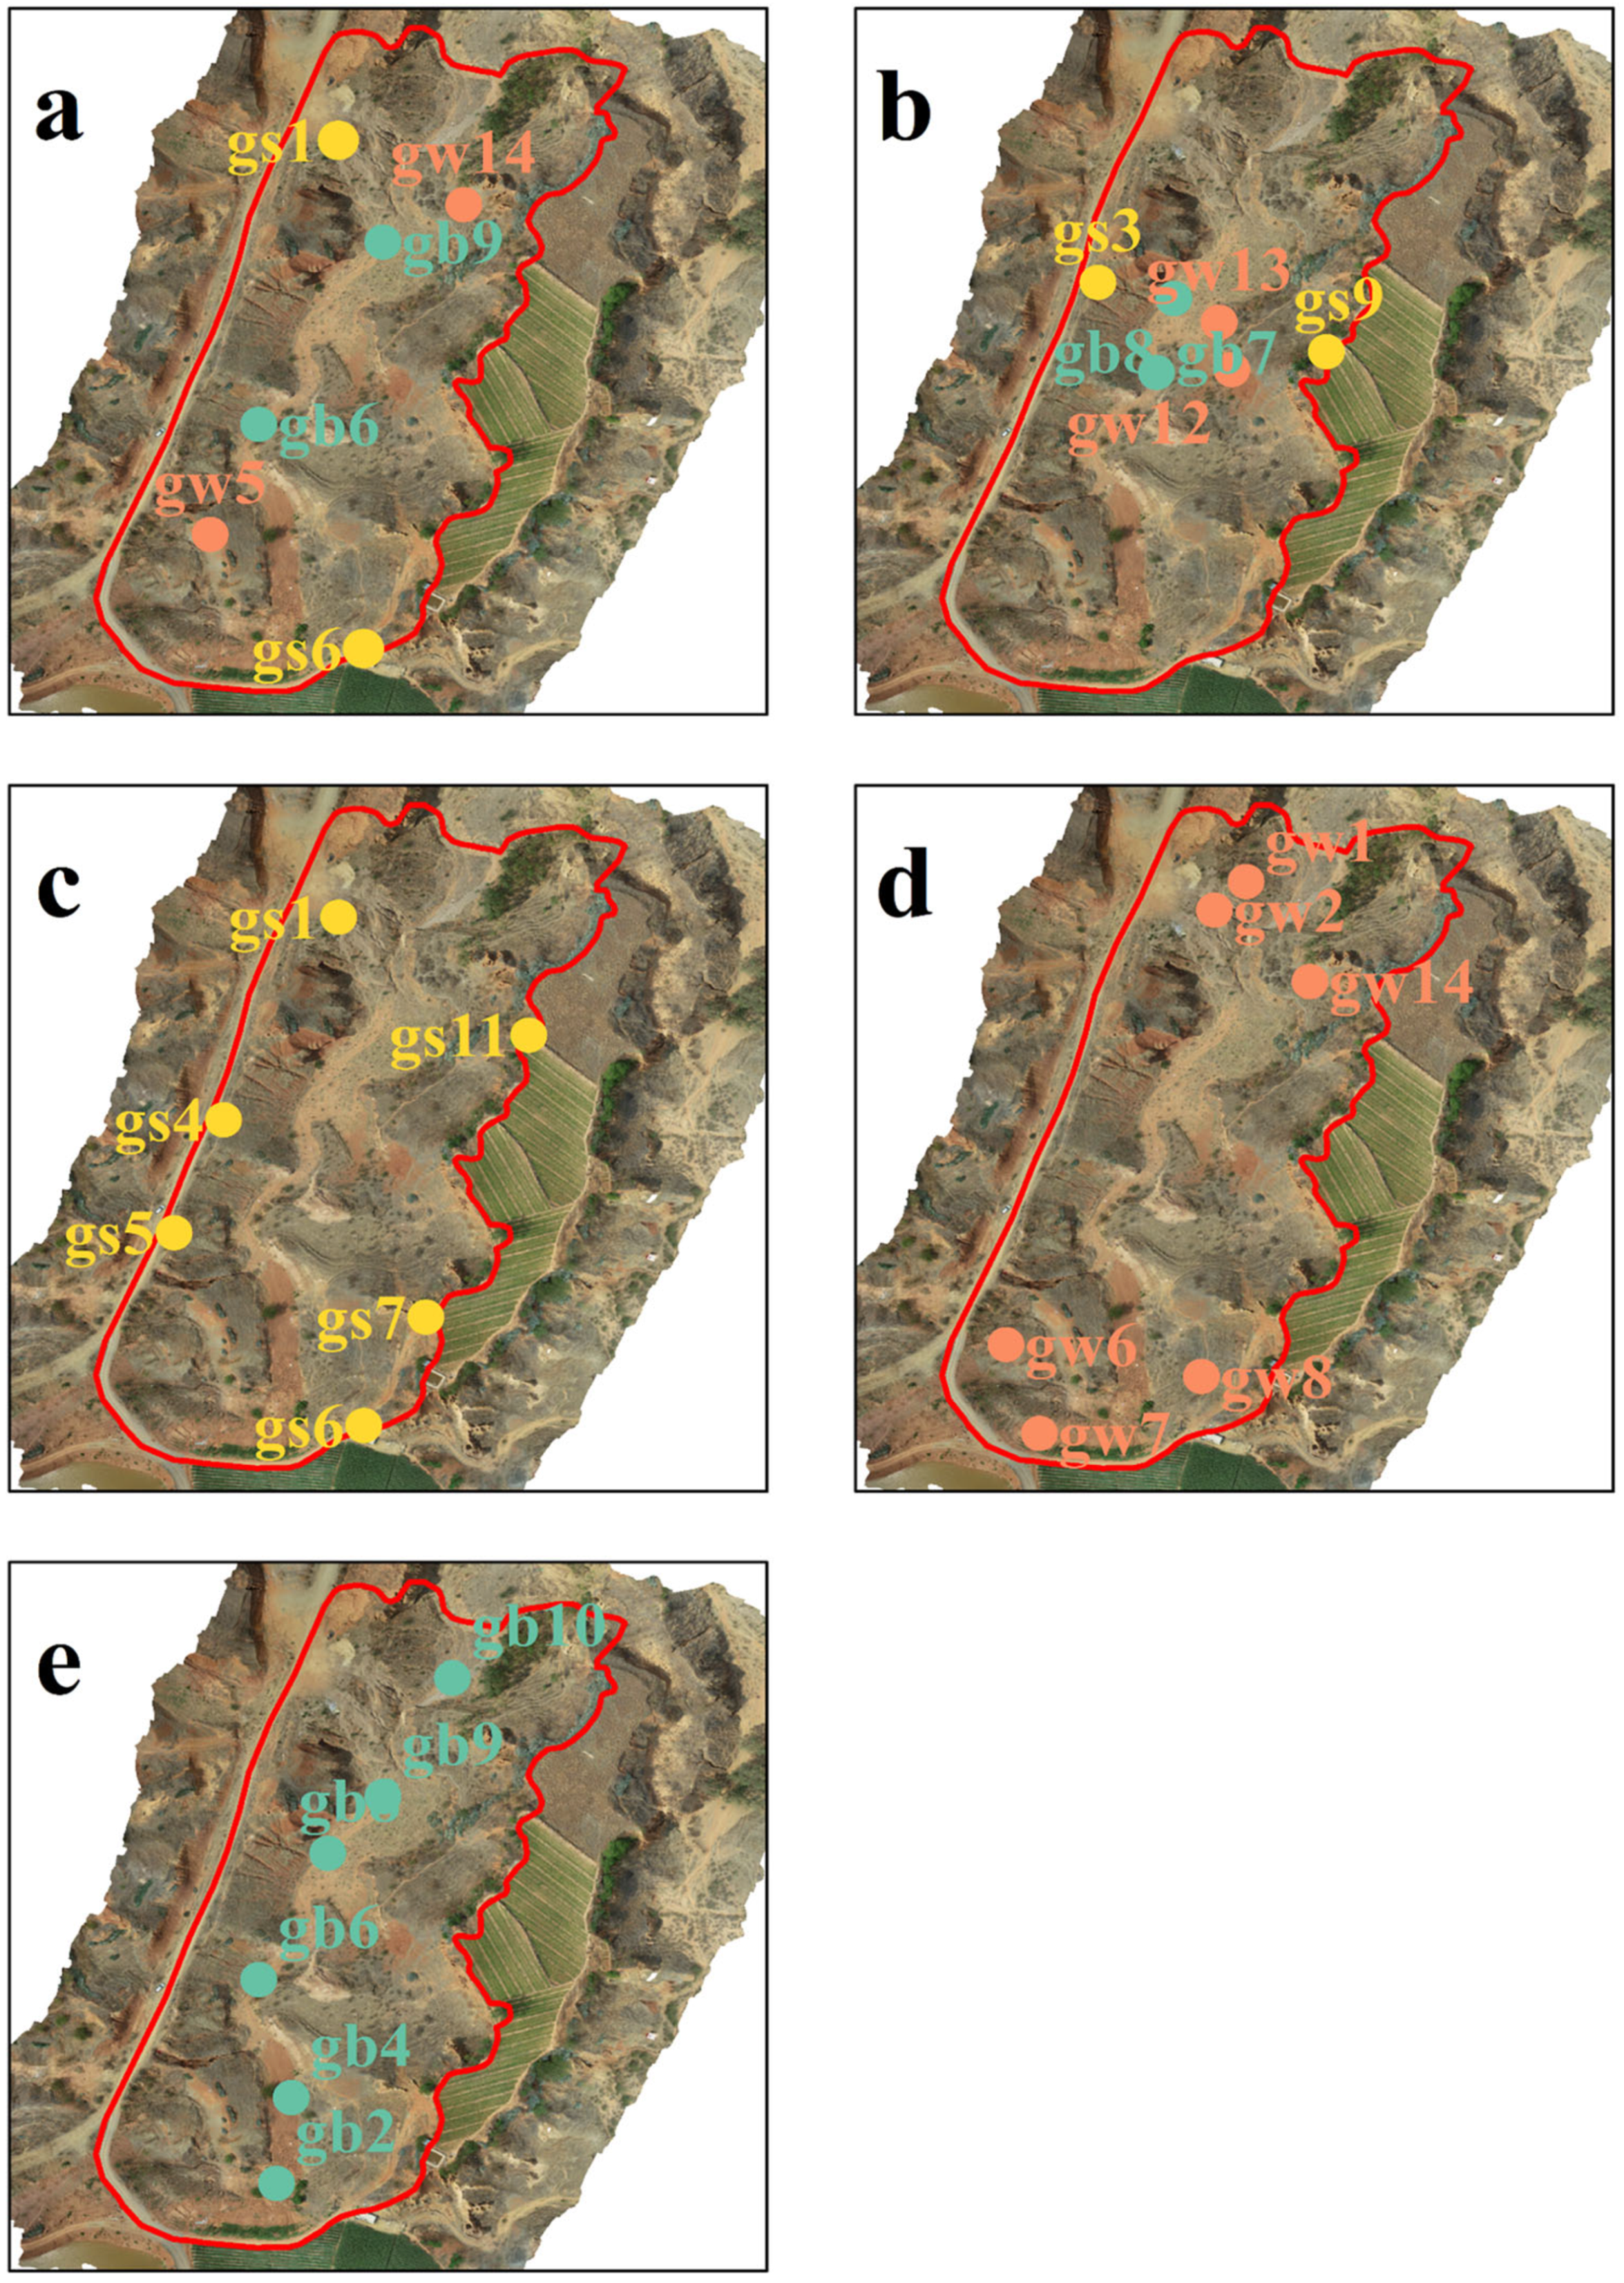
Five different schemes of GCP placement were adopted, all with the same number of six GCPs (Figure 3): consideration of the distribution in both the elevation and horizontal directions (Scheme A); consideration of only the elevation distribution of GCPs (Scheme B); and good distribution in the horizontal direction, but with GCPs set only on the gully shoulder line (Scheme C), gully sidewall (Scheme D), or gully bed (Scheme E). Scheme A was adopted to check the influence of the number of GCPs. 9 schemes were set with the number of GCPs ranging from 0 to 24 control points, evenly distributed in the gully shoulder line, sidewall and gully bed.
For the flight scheme, the flight altitude was set at 30, 50, 70, 100, 150, 200, and 250 m. The photo overlap remained constant at 80%/70% when the flight altitude changed. In addition, three types of photo overlap schemes were tested: changing only the front overlap, only the side overlap, or both. Similarly, the flight altitude remained constant at 100 m when the photo overlap changed. The distribution and number of GCPs were kept consistent across different schemes of flight altitude and photo overlaps (Table 1). We selected time slots without significant wind interference for each UAV flight to mitigate its impact on the drone. Additionally, to avoid shadow interference, all flights were conducted on overcast days or between 11 a.m. and 2 p.m. on sunny days, when the valley experiences minimal shadows caused by sunlight. To examine the impact of shadows on measurement errors, we collected photographic data under the same scheme during the shaded period in the gully between 8:00 a.m. and 10:00 a.m. on a sunny day. Upon completion of field monitoring, we exported the flight time and number of photographs captured for each scheme from the RS RTK App. Concurrently, during data processing, we use a timer to record the time spent processing each scheme.

3. Results

3.1. GCP Scheme

3.1.1. Number of GCPs

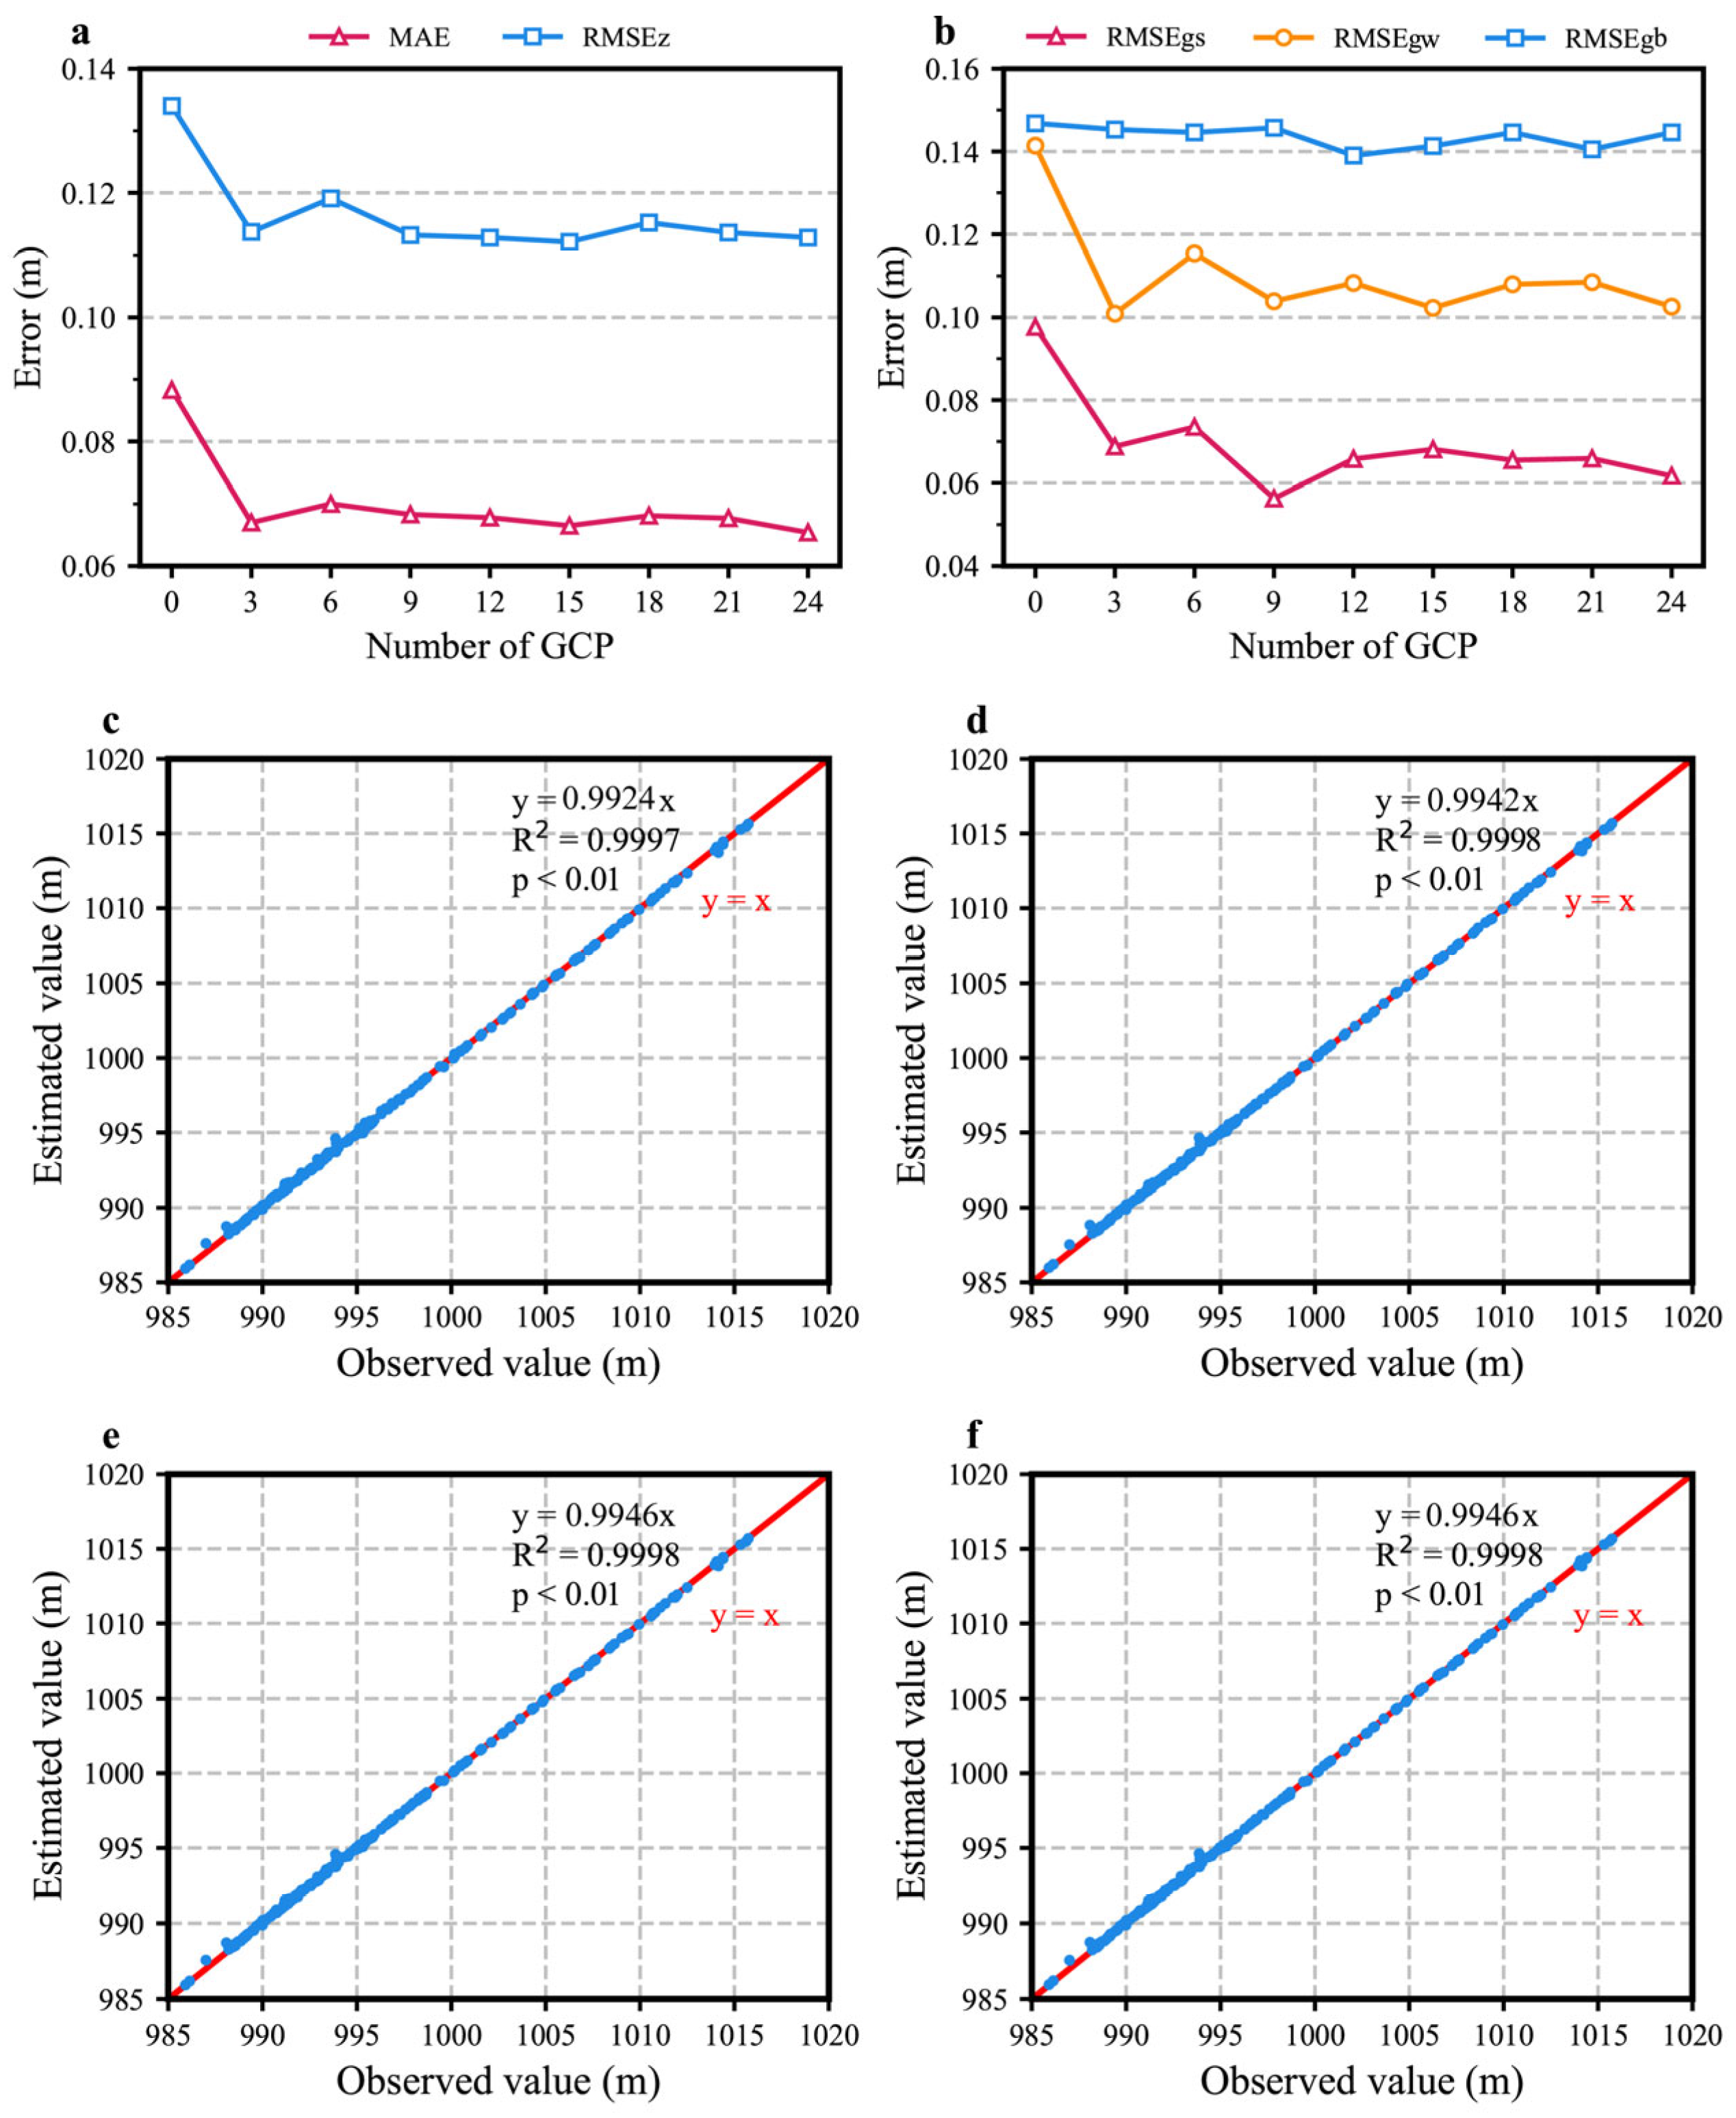
The accuracy of the DSM increased significantly when the number of GCPs increased from 0 to 3, as evidenced by the MAE decreasing from 0.0883 to 0.0654 and the RMSE decreasing from 0.1340 to 0.1191. As the number of GCPs increased from 3 to 24, the accuracy of the DSM did not improve significantly. The MAE remained at 0.06 and 0.07, and the RMSE remained at 0.11 to 0.12 (Figure 4a). The accuracy showed a decreasing trend from the gully shoulder line to the sidewall to the gully bed (Figure 4b). All DSMs predicted elevation well, and R2 values were higher than 0.9997, at a significance level of 0.001 (Figure 4c–f).

3.1.2. Location of GCPs

We used six GCPs for each of the five distribution schemes to analyze variations in the DSM accuracy. The results indicated that an improved spatial distribution of GCPs significantly enhanced the DSM accuracy. Scheme A showed the lowest MAE and RMSE (Table 2), with only three HECPs were distributed in the gully beds. The schemes considering only the horizontal distribution also clearly enhanced the DSM accuracy; scheme C had the second-lowest MAE and RMSE with only two HECPs. Scheme B, which considered only the vertical distribution, did not significantly enhance the quality of the DSM.

3.2. Flight Scheme

3.2.1. Flight Altitude

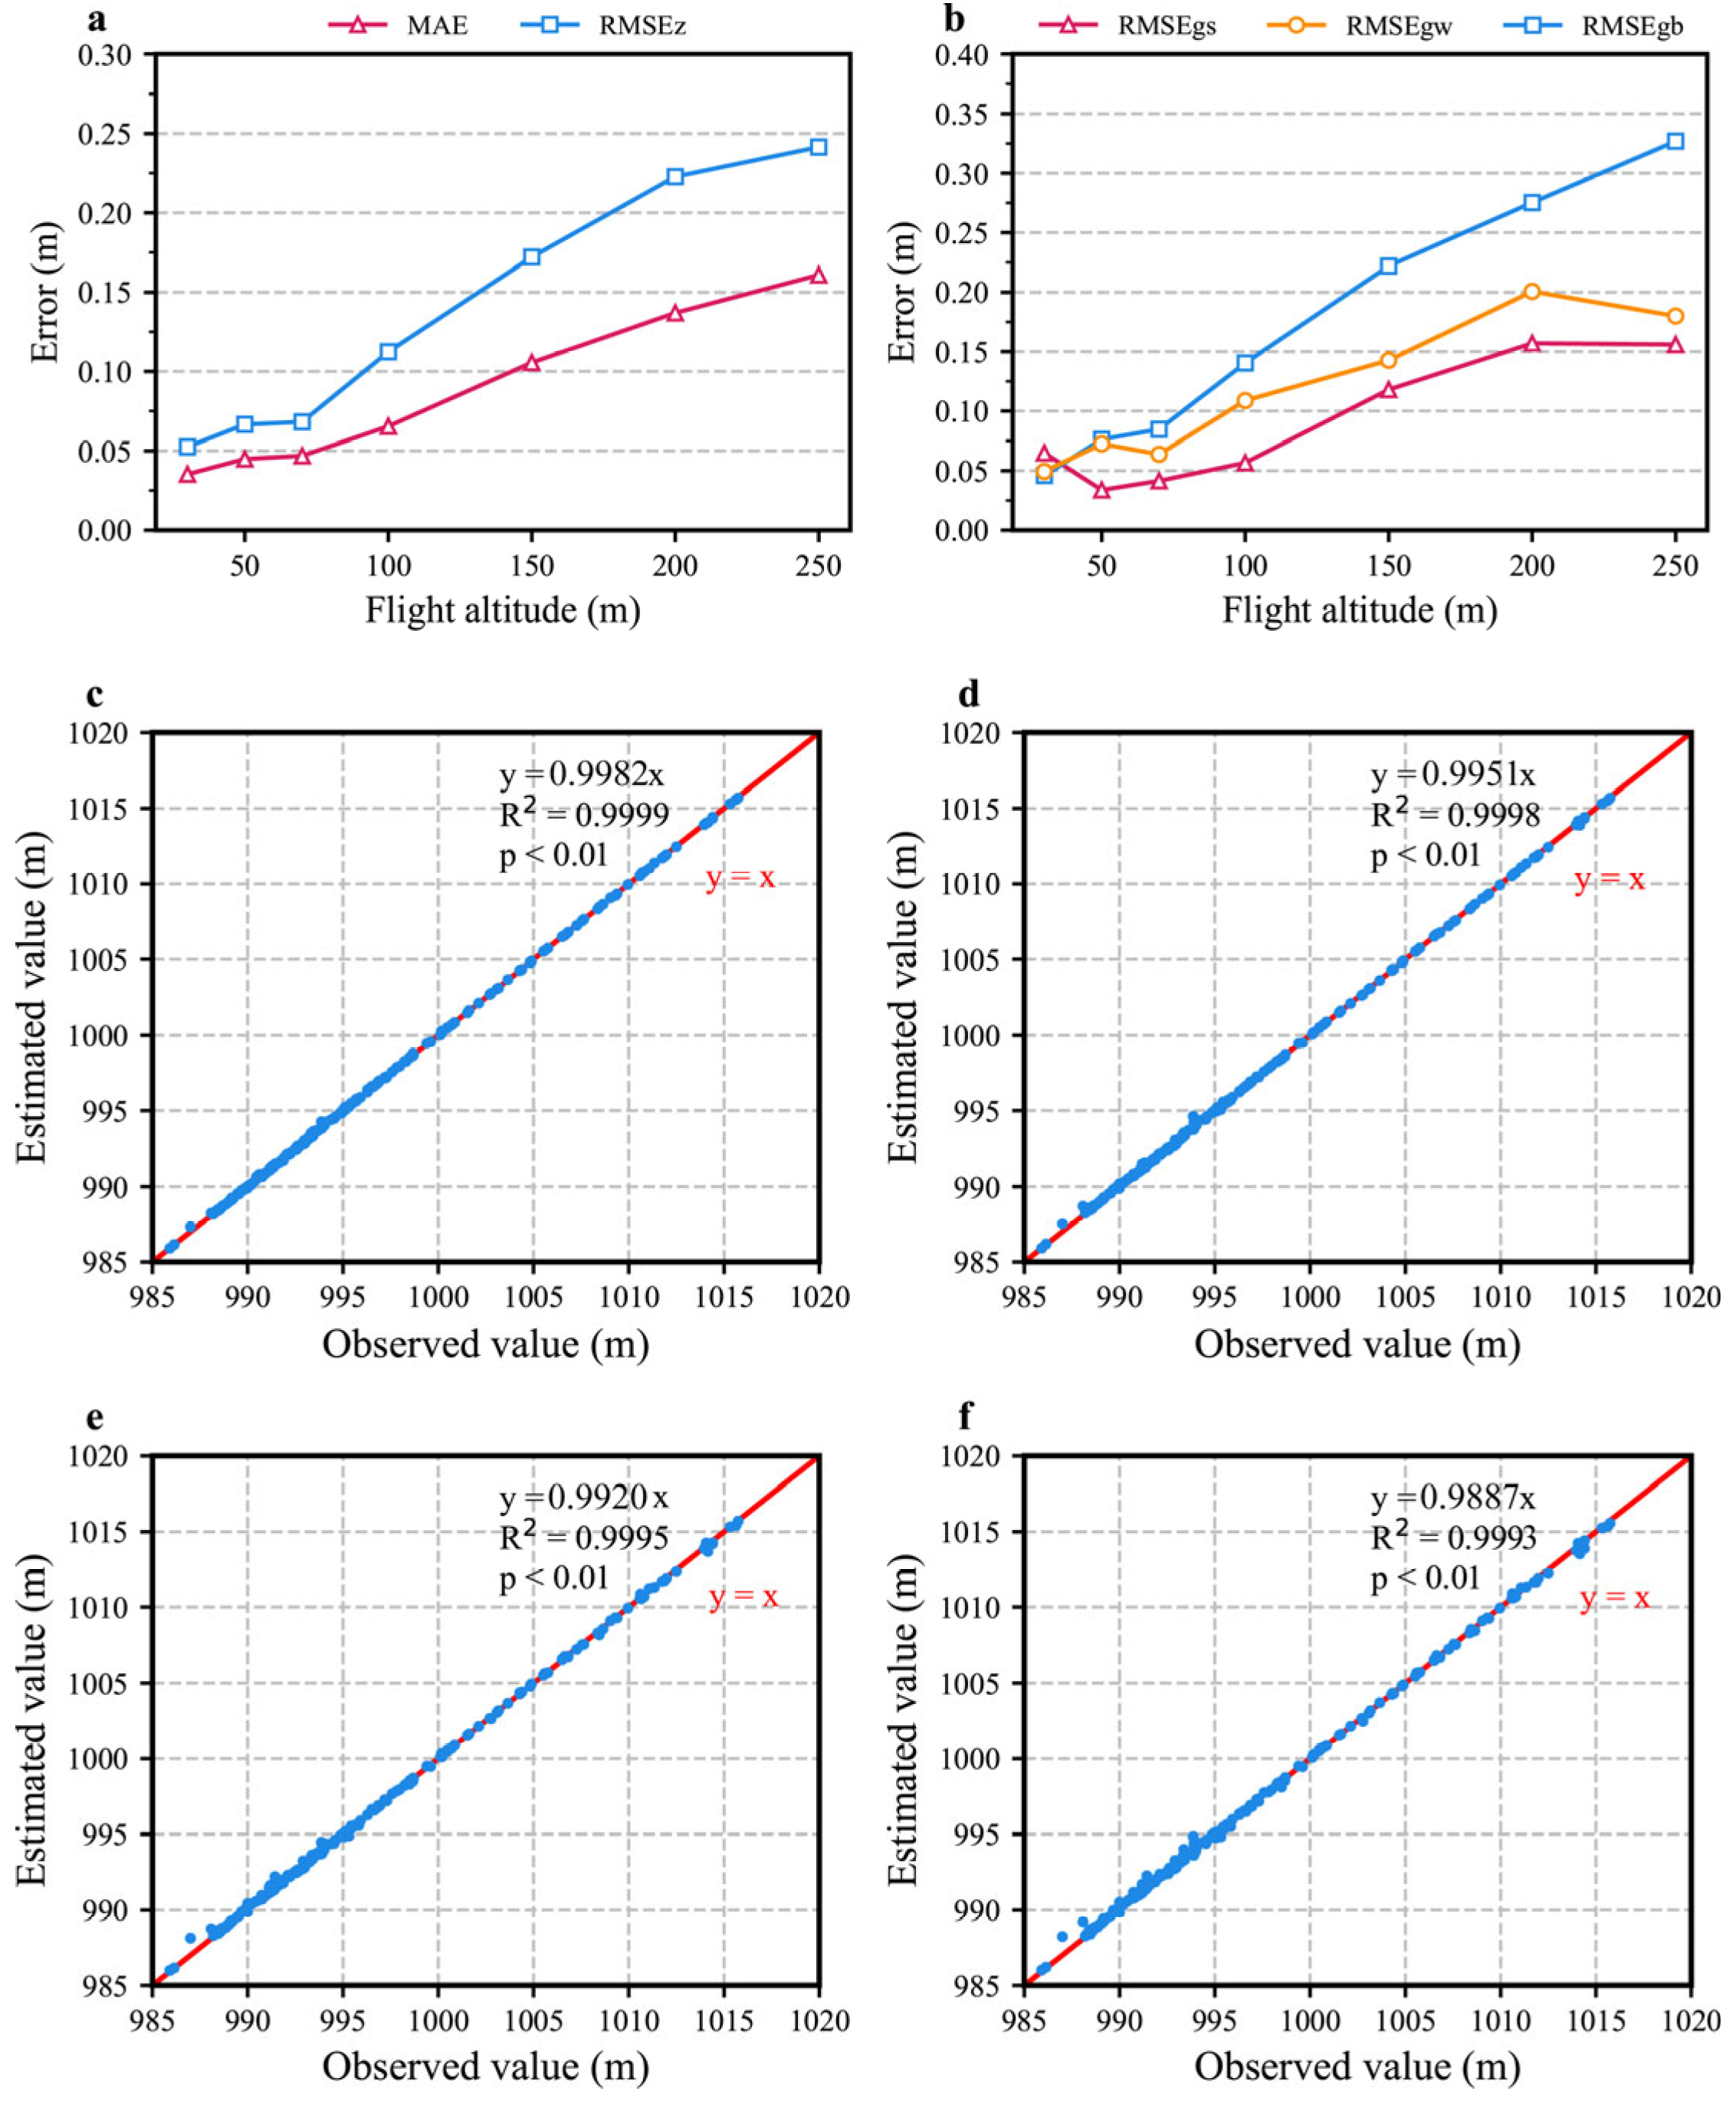
The flight altitude was set at seven levels ranging from 30 to 250 m. As the flight altitude increased, monitoring accuracy gradually decreased (Figure 5), showing consistent trends in both MAE and RMSEz. When the flight altitude was 250 m, the MAE and RMSEz were 0.1609 and 0.2415 m, respectively, which were approximately 4.6 times higher than those when the flight altitude was 30 m. The error of the checkpoints in different parts of the gully increased with an increase in the altitude; the gully bed (RMSEgb) exhibited the most significant error variation. Figure 5c–f demonstrate small differences between the values measured by RTK-GPS and those derived from the UAV-generated DSM across all flight altitudes, with R2 exceeding 0.99 and the regression slopes approaching 1. However, both R2 and the slope showed a continuous declining trend as the flight altitude increased.

3.2.2. Photo Overlaps

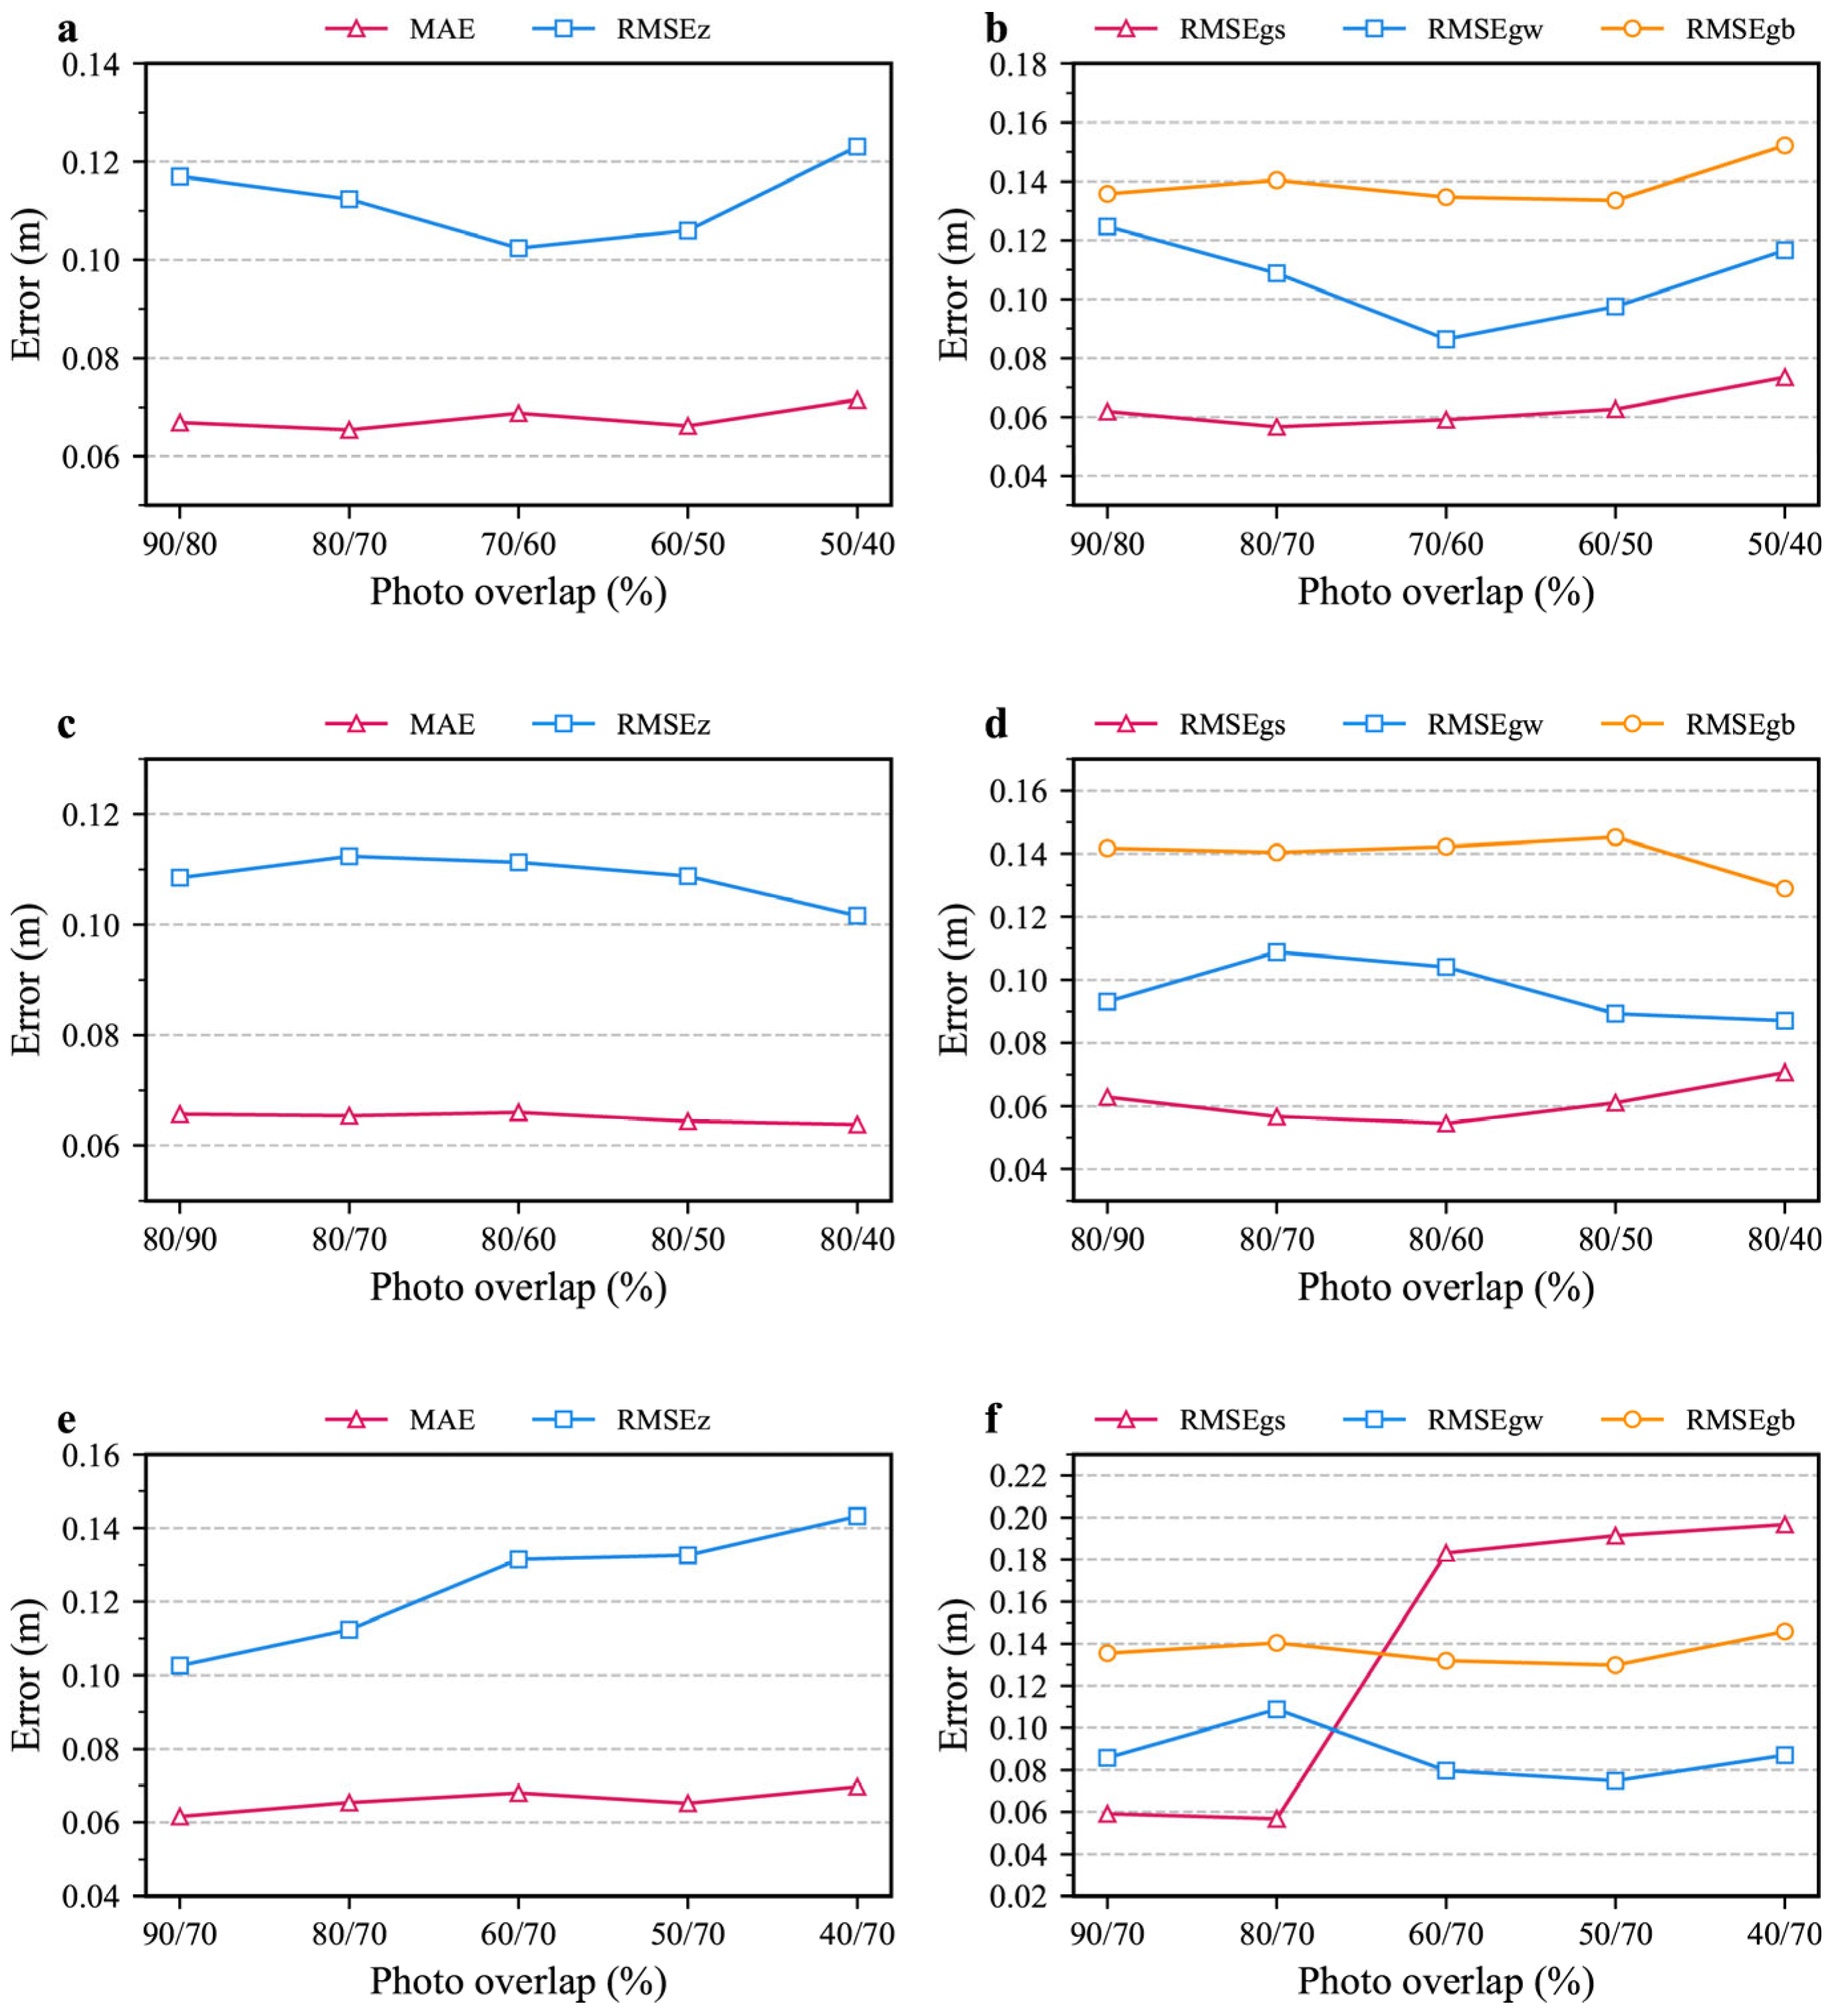
The error variations in the different schemes were not significant when both the front and side overlaps were changed; the MAE and RMSEz ranged from 0.0637 to 0.0715 m and 0.1024 to 0.1231 m, respectively (Figure 6a,b). Similar trends were also observed when only the side overlap changed (Figure 6c,d). Both the MAE and RMSEz showed clearly increasing trends as the front overlap decreased; the error at 40%/70% was approximately 0.0697 m for MAE and 0.1432 m for RMSEz (Figure 6e). The significant increase in error may be attributed to the sudden increase in error at the shoulder line when the front overlaps was less than the side overlap (Figure 6f).

3.3. Topography of the Gully

The boundary of the gully was also measured by RTK-GPS and applied to all series of measurements, which implies that the length and area of the gully were fixed in all schemes at 300 m and 32,600 m2, respectively. As the flight schemes changed, the depths and volumes changed with variations in the DSMs. The average depth, maximum depth, and volume were 10.43 m, 23.81 m, and 303,049.37 m3, respectively, obtained from the most accurate set of schemes (Flight altitude: 30 m; photo overlap: 80%/70%; 11 GCPs: and placement as scheme A), which was set to the observed values of the gully topographic parameters. The average depth and volume are important parameters of gully morphology, and the average depth ratio (estimated value/observed value) and volume ratio (estimated value/observed value) of the gullies were calculated for different GCP numbers, flight altitudes, and photo overlap schemes (Figure 7).
The two parameters gradually deviated from the observed values as the flight altitude increased. The average depth and volume of the gully were 10.25 m and 297,822.29 m3 at a flight altitude of 250 m, respectively, which differed from the observed values by 1.72%. The differences between the average depth and volume data of the gullies obtained from the different overlap schemes were small, ranging from 0.995 to 1 (Figure 7e,f).

3.4. Environmental Factors Affecting Accuracy

Gullies are often cut deep into the earth’s surface, causing frequent shadows in the gully channels when exposed to the sun, which significantly influences the accuracy of monitoring [44,45]. We compared the error of two DSMs produced by the same schemes (70 m flight altitude, 80%/70% overlap, and nine GCPs with the distribution of scheme A). The first had no shadows in the gully while the second had approximately 45% of the area covered by shadows. A total of 53 checkpoints were located inside the shadows in the second DSM, and the MAE and RMSE of the two DSMs were calculated. The results showed that the measurement accuracy decreased when shadowed parts were present in the gully, indicating that shadows introduced errors (Figure 8).
The gully sidewall showed dramatic changes in both slope and depth. Based on the DSMs produced using the optimal scheme, the distribution of 67 low-error checkpoints (<0.1 m) was not significantly related to the slope and depth of the gully (Figure 9). The locations of the 8 HECPs did not exhibit significant relationships with the slope, but 7 of the 8 HECPs were located at the depths of around 10 m or more. An increase in gully depths equaled to an increase in shooting distance at the same flight altitude. Combined with the relatively high error in the gully beds with the highest depths compared to the shoulder line and gully sidewall (Figure 4b), the flight altitude (shooting distance) rather than the slope gradient was the main factor affecting the occurrence of HECPs.
Seven trees were found in the selected gully, which affected the monitoring of the surface elevation of the gully and created abrupt elevation changes where they grew, potentially causing larger errors in the generated point cloud. Based on the orthophoto and checkpoint locations, we identified 20 checkpoints located within 1 m of the seven trees. The MAE of these checkpoints was 0.0931 m, which was significantly higher than the MAE of the DSM produced by the optimal scheme (0.0469 m). Some of the points inside the tree area had similar elevation values to the points around the tree (the difference was below 0.1 m), which indicated that these points penetrated the canopy of the trees. The proportion of penetration points decreased significantly when the flight altitude was 150 m or higher.

4. Discussion

4.1. Differences Between UAV Photogrammetry and Other Techniques

UAV monitoring has become one of the common technologies applied for field gully monitoring, along with other RTK-GPS, LiDAR, and photogrammetric techniques (Table 3). Compared to RTK-GPS [13,14], UAV techniques have a clear advantage in terms of both data accuracy and operational efficiency, and they avoid human interference during monitoring since surveyors do not need to enter the gully channel. When using RTK-GPS technology alone for measurement, a single gully often requires hundreds to thousands of measurement points. However, by integrating with UAV technology, the optimal solution proposed in this study achieves the same centimeter-level accuracy with only 9 GCPs, significantly improving survey efficiency. However, RTK-GPS is not affected by vegetation or shadow interference, which enables it to produce real DEMs of the earth’s surfaces. LiDAR, which is available for both terrestrial and aerial applications [46,47], allows direct access to large amounts of accurate point cloud data with high measurement accuracy [2,12]. However, LiDAR is also affected by vegetation, and the instrumentation and operational costs are significantly higher than those of UAVs, especially for long-term observation. Ground-based LiDAR systems face angular limitations when surveying negative terrain. When measuring 4 gully head plots with an area about 100 m2 on an in situ experiments, 12 reflectors were positioned around the plots also measured by RTK GPS, and the survey station requires frequent relocation [12]. These factors can lead to reduced accuracy and efficiency [48,49]. In addition, improved photogrammetric techniques were recently adopted for gully monitoring, which share data processing workflows with UAV techniques [8,50]. These techniques are more suitable for simulation tests of rill and gully headcuts with small spatial scales, and are only suitable for monitoring specific field sites, such as selected cross-sections [8]. In contrast, UAV techniques have been applied to in situ experiments ranging from several square meters to gully erosion regions covering several square kilometers.
Establishing standardized methods to measure gully topography with high accuracy is important for developing prediction models of gully erosion rates [3]. For UAV techniques, various flight schemes have been adopted to monitor gullies (Table 4). Based on the results, although the gully area and depth monitored in this study are the largest among comparable studies, our monitoring accuracy (RMSE) is second only to that reported by D’Oleire-Oltmanns et al. 2012 [32]. While that study did not specify its photo overlap settings, the monitored gully area was only 2.7% of ours, and it utilized 80 GCPs, which may explain its high precision. Koci’s study 2017 [19] covered a total area exceeding 400,000 m2, with gullies accounting for less than 0.1% of the total area. The number of GCPs used was the lowest among the compared studies, and no mention was made of considering vertical distribution in GCP placement. These factors may explain why, despite employing flight altitudes and overlap rates similar to our 70 m and 100 m flight schemes, their error was significantly higher than ours. Wang et al. 2022 [28] employed a flight plan almost identical to our 100 m scheme, with a similar number of GCPs. However, the actual target watershed area monitored in their study was 8.27 km2, and they did not specify whether vertical elevation differences were considered in GCP distribution. Their reported RMSE was 1.8 times higher than that in our study. Guan et al. 2021 [51] used a flight altitude of 300 m, which is 50 m higher than our maximum altitude of 250 m. Although their photo overlap rate was similar to ours and they deployed 33 GCPs, the overall error remained significantly higher. The excessively high flight altitude is likely the primary reason for their elevated RMSE.

4.2. Accuracy and Efficiency of the UAV Measurements

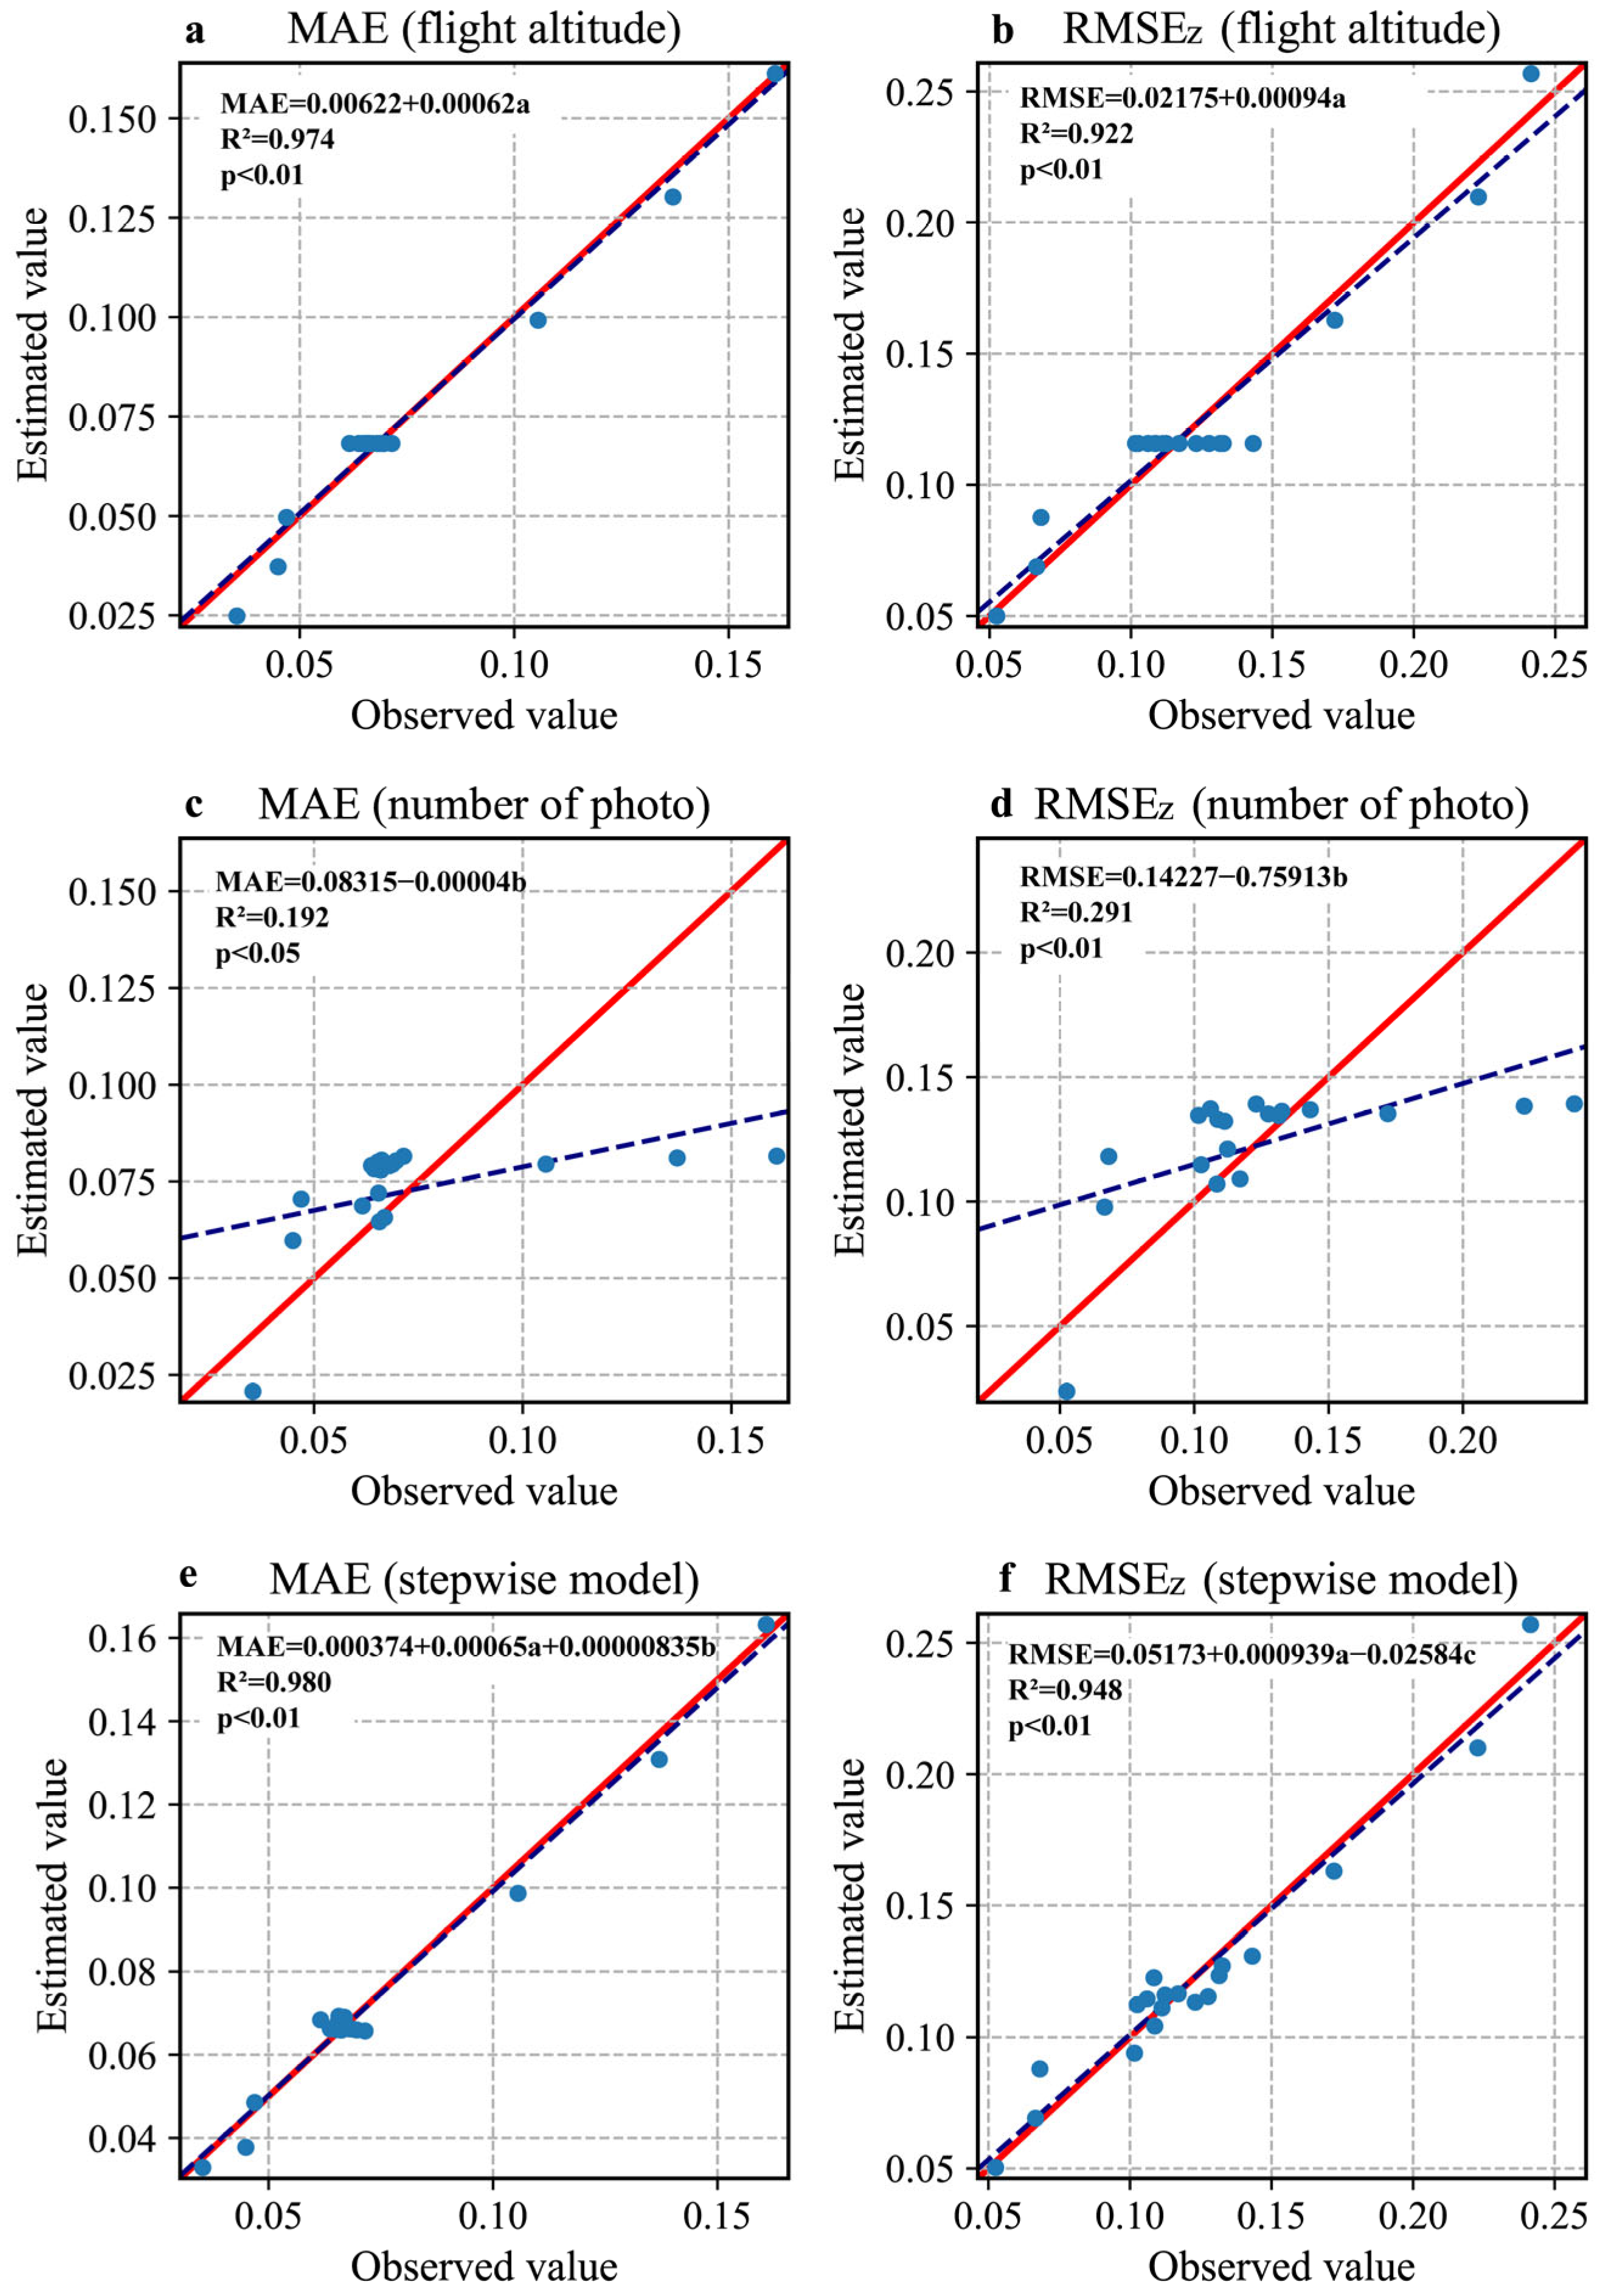
With 11 GCPs distributed as in Scheme A (Figure 3a), flight altitude is a more critical factor affecting error than photo overlap. Both MAE and RMSE exhibit a significant linear increasing trend as flight altitude increases, with R2 values exceeding 0.9 and significance reaching the 0.01 level (Figure 10a,b). At the same flight altitude, variations in photo overlap lead to changes in the number of photos, but the R2 values between MAE/RMSE and the number of photos corresponding to the overlap level were only 0.19 and 0.29, respectively (Figure 10c,d). To further distinguish the relative importance of predictors, we performed bidirectional stepwise regression analysis (based on the AIC criterion) to select key variables, and then applied the Lindeman–Merenda–Gold (LMG) method to decompose the model R2 and quantify each factor’s contribution. The stepwise regression analysis revealed that although the error models for MAE and RMSE constructed based on flight altitude and the number of photos achieved R2 values of 0.98 and 0.95, respectively, Flight altitude remains the primary influencing factor, with its contribution rates to the models reaching 87.9% and 97.0%, respectively (Figure 10e,f).
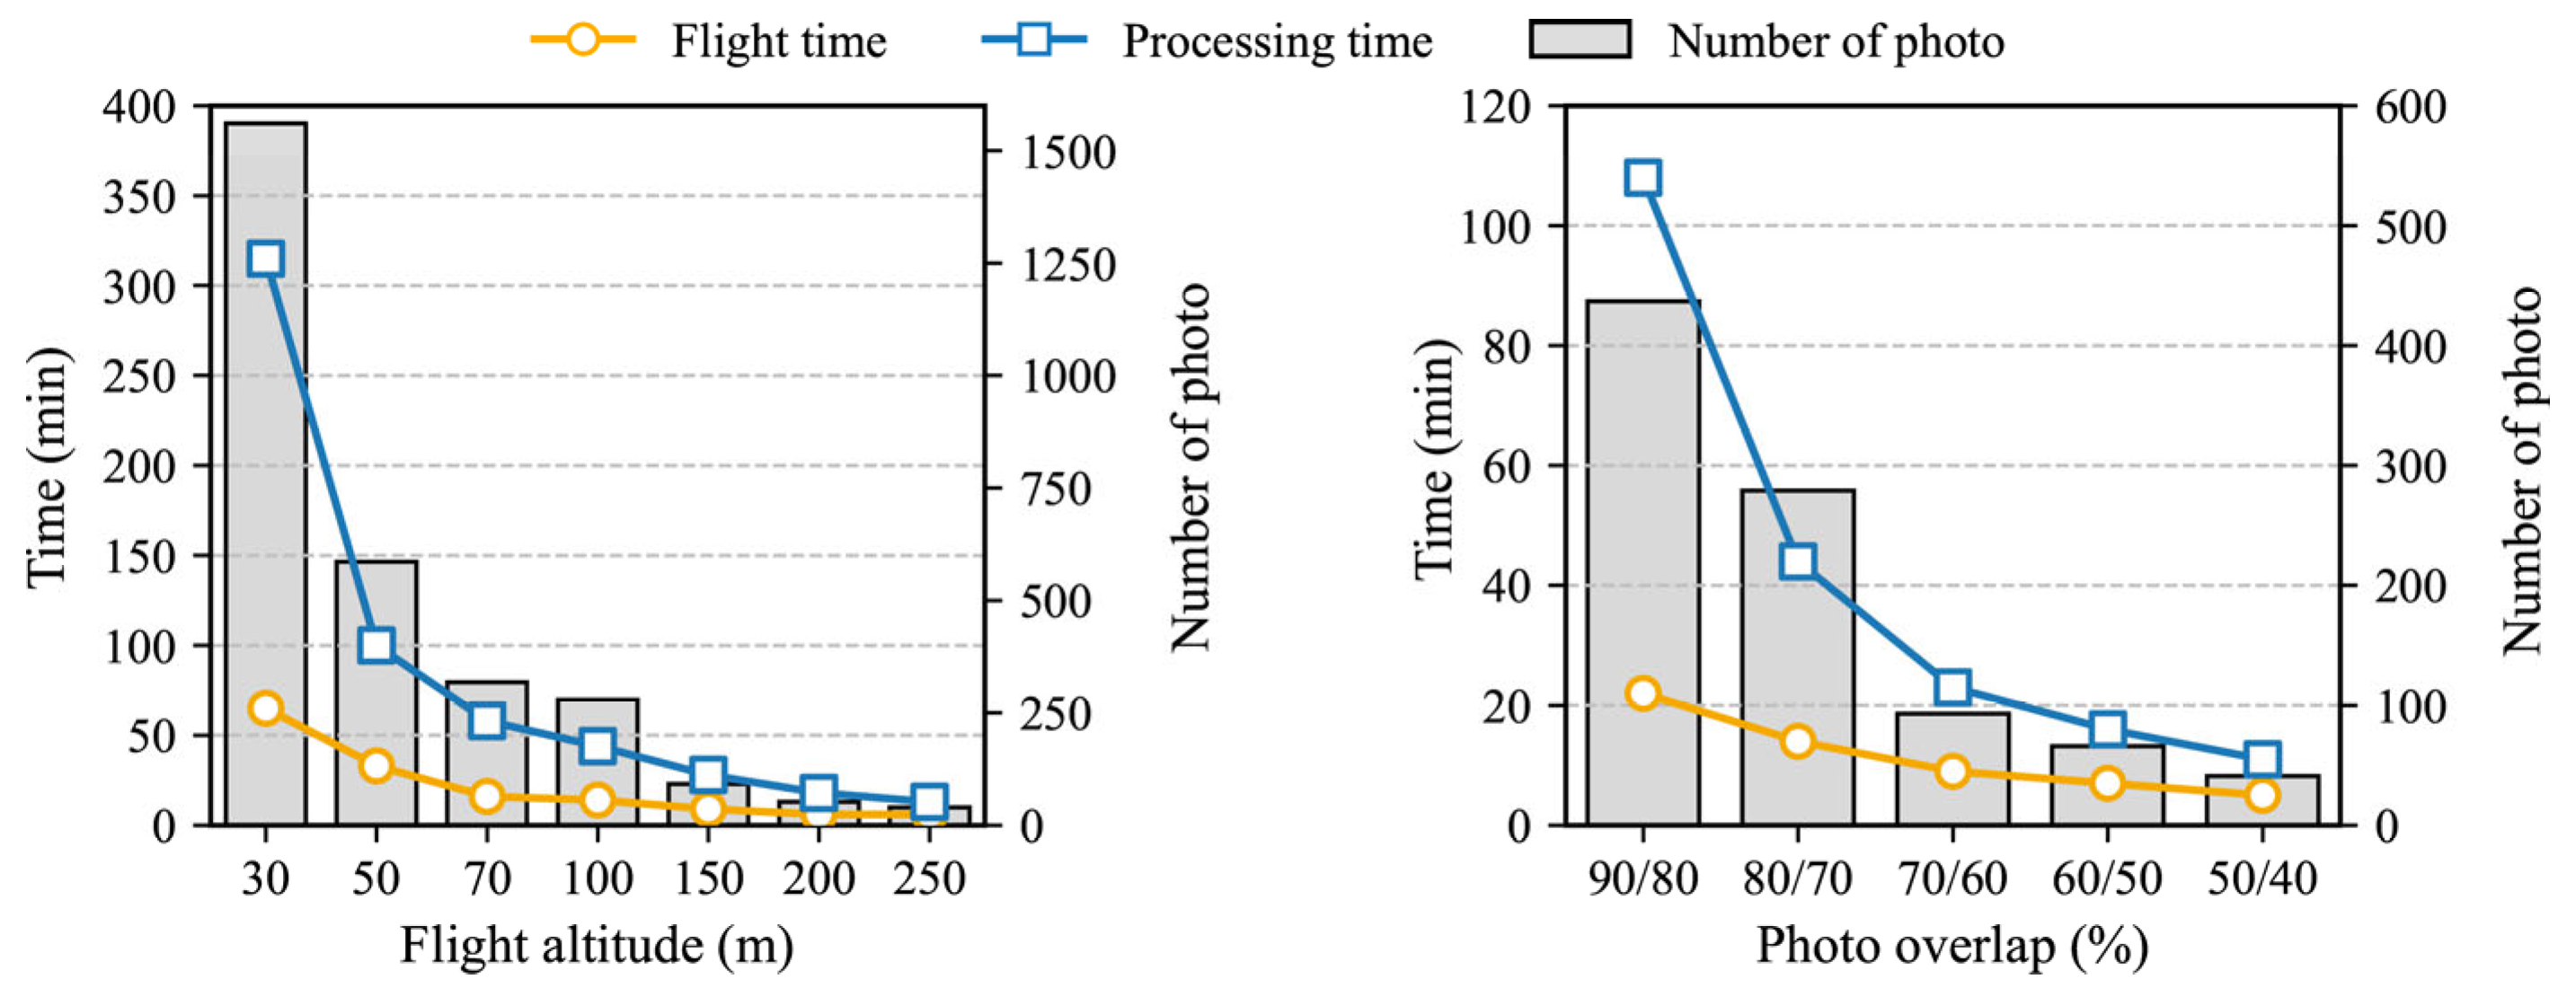
Theoretically, a scheme with a low flight altitude, high photo overlap, and large number of GCPs could help obtain a high-precision DSM of gullies, but the efficiency of field monitoring and data processing would significantly decrease at the same time. Three main issues determine the efficiency of UAV techniques: the total number of flights in the field, data processing in the lab, and time required to set the GCPs in the gully area. With an increase in the flight altitude and decrease in photo overlap, both the flight times and number of photos decreased significantly, which indicated a substantial improvement in the efficiency of both field monitoring and data processing in the lab (Figure 11).
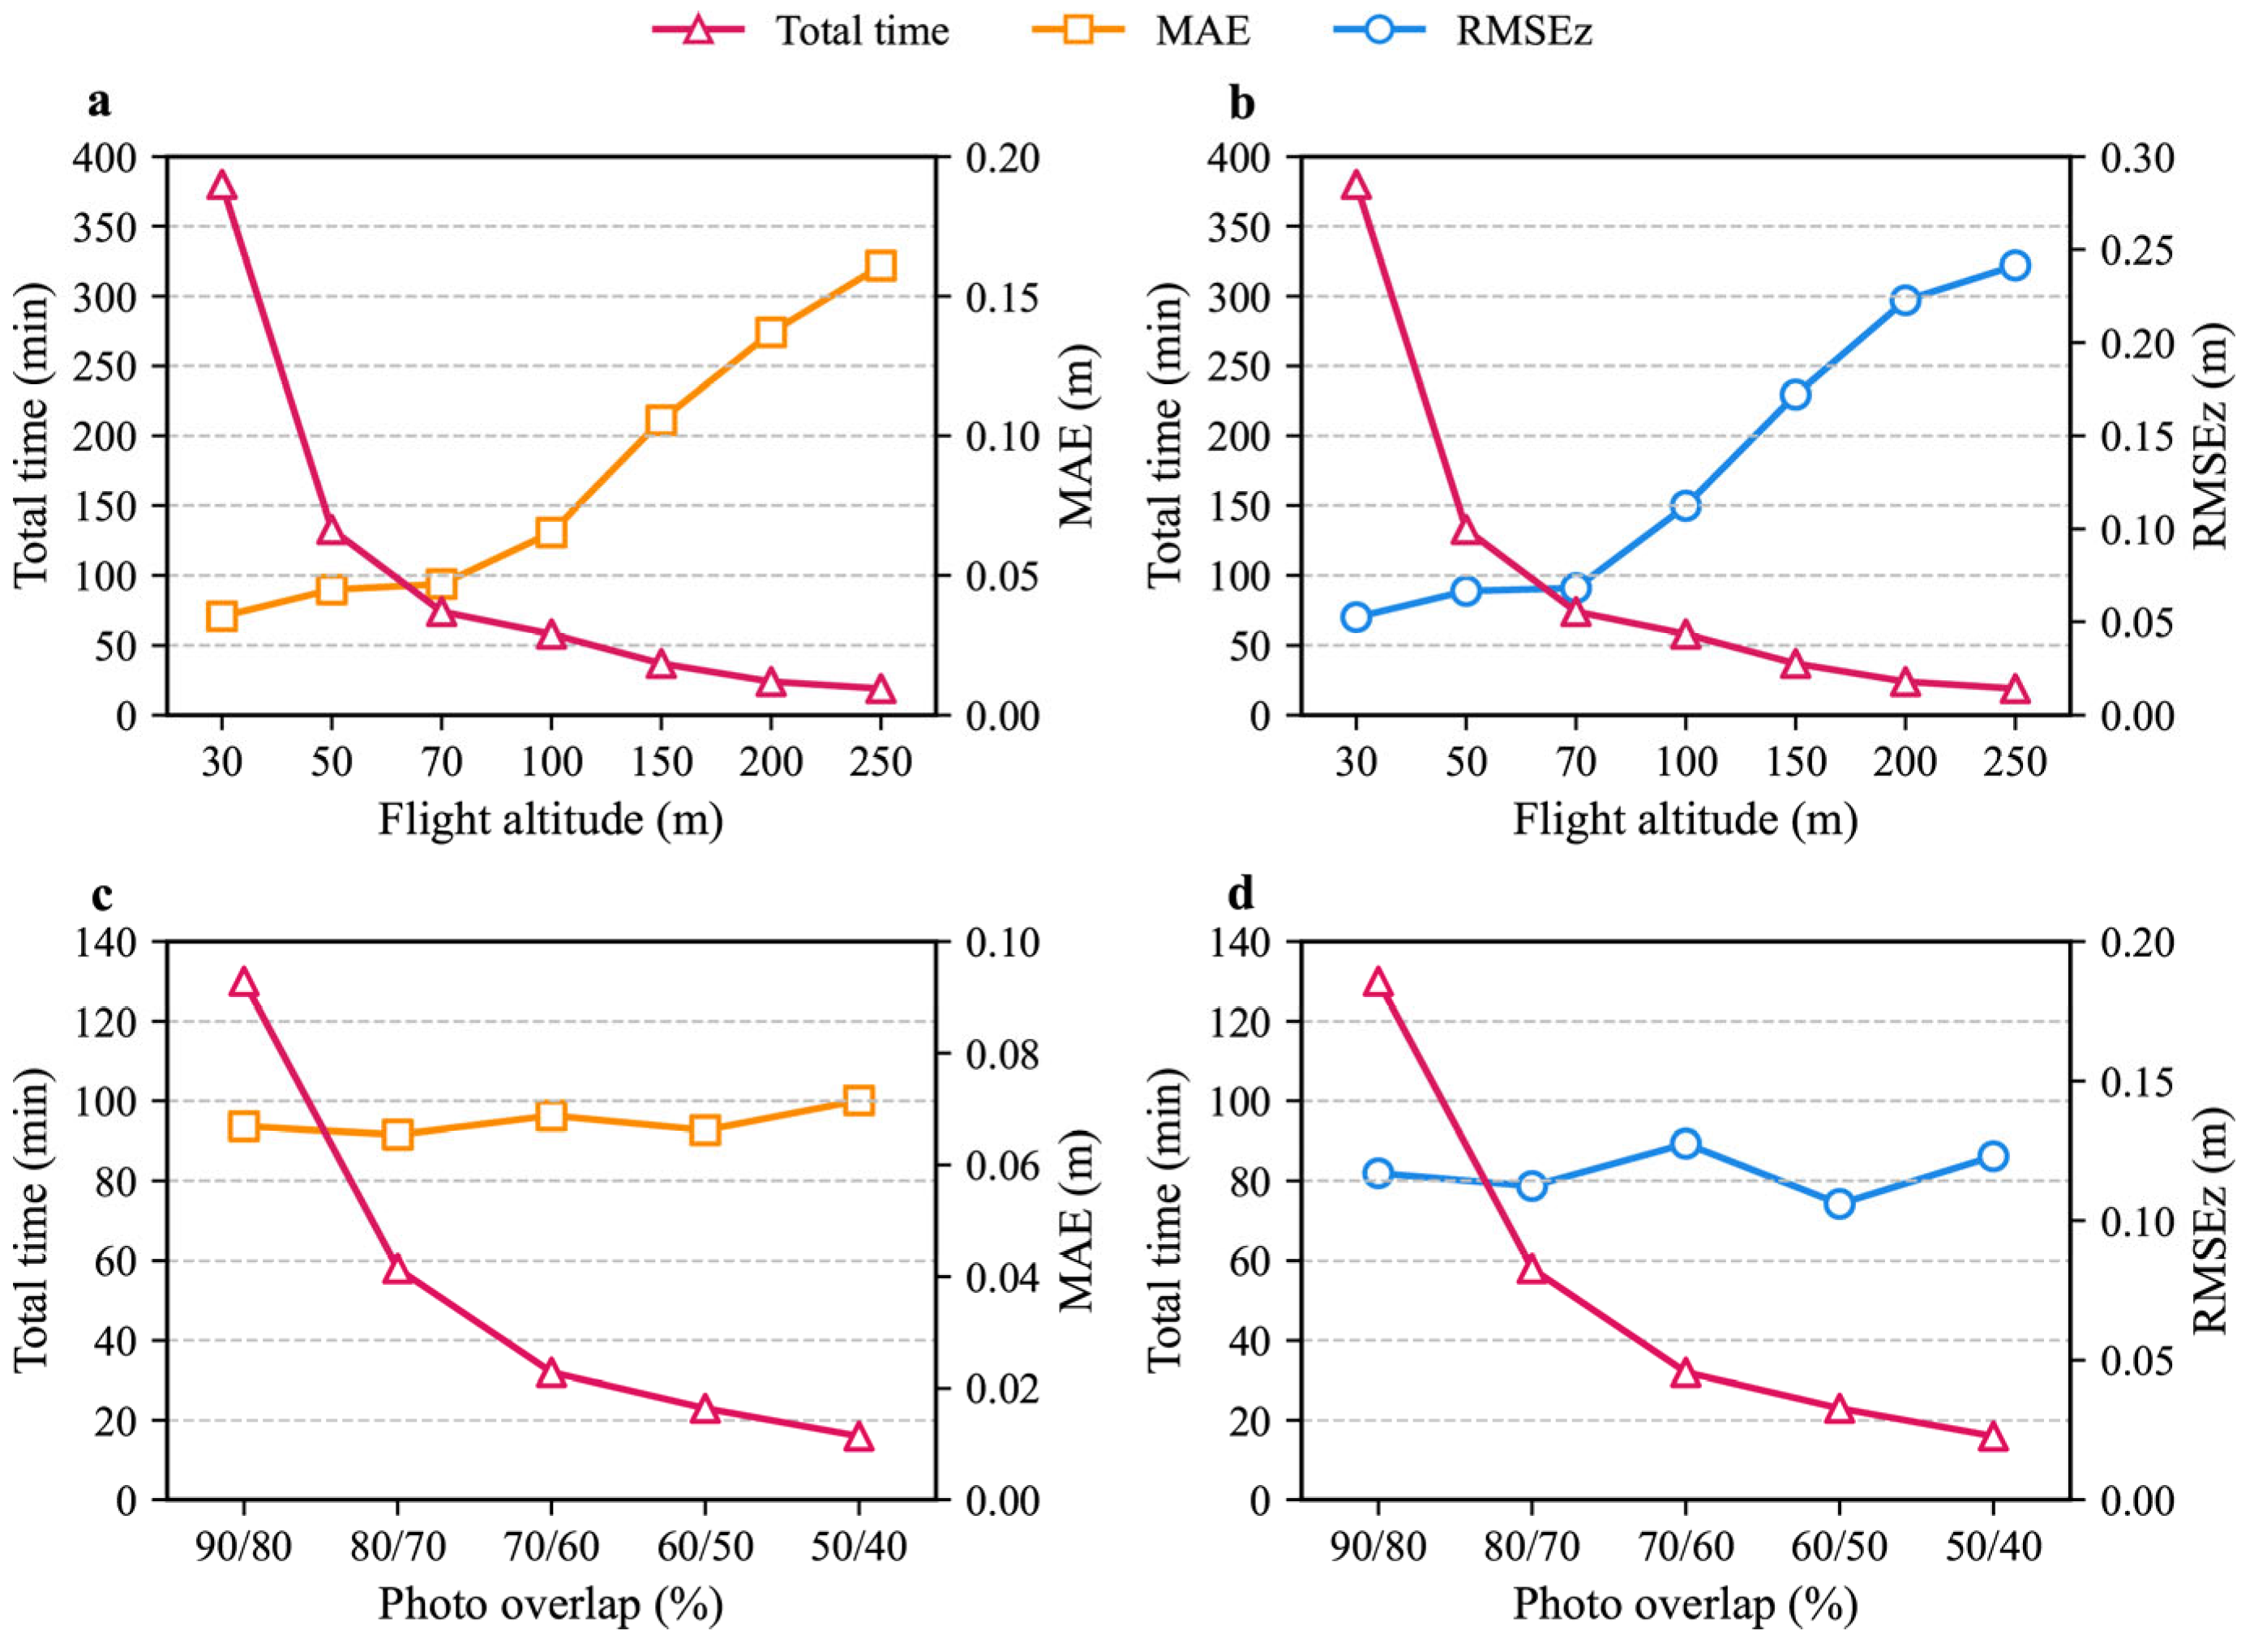
According to the line graph of the total time (field monitoring and data processing) plotted against MAE and RMSEz (Figure 12a,b), the total time and error curves intersect within the range of 60–70 m. A flight altitude of approximately 65 m can meet the data accuracy and efficiency requirements. The high photo overlaps clearly increased the total time, but had a limited influence on accuracy (Figure 12c,d). Considering both data acquisition efficiency and accuracy, and based on our error analysis, the optimal scheme was determined to be a flight altitude of 70 m, an photo overlap of 80%/70%, and nine GCPs with a balanced horizontal and vertical distribution (Scheme A). The sizes of the gullies change significantly: their lengths may range from several meters to over 1 km, the depths may range from 0.5 m to 20–30 m [3]. Consequently, the optimal monitoring scheme may also vary. We suggest that flight altitude and overlap settings could be determined with reference to our results; however, the number of GCPs should be adjusted according to the size of the monitoring area. The DSM generated with GCPs distributed only on the gully shoulder line (Table 2, Scheme C) achieved the second highest accuracy and the lowest number of HECPs. When gully depths are small (less than 5 m), the vertical distribution of GCPs may not need to be considered. For monitoring critical gully sites that require high detail, such as gully headcuts and plunge pools, the flight altitude may be reduced to less than 5 m [52].

4.3. Limitation

The gully shoulder line is the area demarcating the boundary between the gully and the upstream catchment, serving as a critical zone for defining the extent of the gully and monitoring its areal development processes. However, due to the gradual transition from slope to gully and interference from vegetation cover in many areas, accurately identifying the precise location of the gully shoulder line through visual interpretation of UAV images remains challenging [53]. Therefore, RTK-GPS measurements are still essential to determine the gully shoulder line (Figure 3), compensating for the limitations of UAV-based monitoring in these areas.
Light conditions and wind speed are also important environmental factors affecting the accuracy of UAV gully measurement. Although this study was conducted over a total of three weeks, and we attempted to maintain consistent lighting conditions by flying at the same time each day (the experiments were conducted during the dry season when the dry–hot valley region experiences predominantly clear skies), we cannot guarantee completely identical light conditions from day to day. Additionally, while flights were conducted only when no significant wind interference was perceived at ground level, we could not ensure consistency in wind speeds at flight altitude across different days. From the results, it appears that light and wind speed did not affect the overall trend of accuracy changes across different flight schemes, but they may have caused some fluctuations in accuracy between individual measurement sets (Figure 5 and Figure 6).

5. Conclusions

In this study, we used UAV techniques to monitor a typical gully in the Yuanmou dry–hot valley with different GCPs and flight schemes. The results indicated the following:
(1)
The accuracy of the DSMs significantly increased as the flight altitude decreased; however, photo overlap did not significantly influence the accuracy. The accuracy increased sharply when the number of GCPs increased from zero to three. As the number increased, both the MAEs and RMSEs showed gently decreasing trends. Based on statistical analysis, flight altitude is the most critical factor affecting monitoring accuracy.
(2)
Considering both the data accuracy and monitoring efficiency, the optimal scheme for gully monitoring was a flight altitude of approximately 70 m, 9 GCPs with a reasonable distribution in both horizontal and vertical directions, and an overlap of 80%/70%. The MAE was approximately 4.7 cm and the RMSE was approximately 6.8 cm; the total monitoring time was approximately 180 min.
(3)
Shadows from sunlight clearly reduced the accuracy of the UAV data. The flight altitude rather than the slope gradient was the main factor affecting the occurrence of HECPs. Maintaining point clouds that penetrate trees could help reduce the influence of vegetation on the accuracy of DSMs, which decreased significantly when the flight altitude was 150 m or higher.

Author Contributions

Conceptualization, Y.D. and J.H.; methodology, J.Y. and Y.D.; software, J.Y.; validation, J.Y., X.W. and G.W.; formal analysis, J.Y.; investigation, J.Y., X.W., G.W. and X.Z.; resources, Y.D.; data curation, J.Y. and Y.D.; writing—original draft preparation, J.Y.; writing—review and editing, Y.D.; visualization, J.Y.; supervision, Y.D. and J.H.; project administration, Y.D.; funding acquisition, Y.D. All authors have read and agreed to the published version of the manuscript.

Funding

Financial support was provided by the National Key R&D Program of China (Grant Number: 2023YFD1901201), Fundamental Research Projects of Yunnan Province (Grant No. 202301BF070001-007), the National Natural Science Foundation of China (Grant No. 42267053, U24A20581), the Training Program of the Innovation Guidance and Scientific and Technological Enterprise of Yunnan Province (202304BT090019), and the Chongqing Natural Science Foundation (CSTB2022NSCQ-MSX1535), and Dong Yifan was supported by the Xingdian Youth Talent Support Program of Yunnan Province.

Data Availability Statement

Data can be shared after the application is approved.

Acknowledgments

The authors gratefully acknowledge support from the Yuanjiang Dry hot Valley Water and Soil Conservation Observation and Research Station of Yunnan Province, Yunnan University, and Institute of Mountain Hazards and the Environment of the Chinese Academy of Sciences for field monitoring and data processing. The author also extends sincere gratitude to Liu Zhoujiang and Liu Anran for their invaluable support in data analysis.

Conflicts of Interest

The authors declare that they have no competing financial interests or personal relationships that may have influenced the work reported in this study.

References

  1. Valentin, C.; Poesen, J.; Li, Y. Gully Erosion: Impacts, Factors and Control. Catena 2005, 63, 132–153. [Google Scholar] [CrossRef]
  2. Marzolff, I.; Poesen, J. The Potential of 3D Gully Monitoring with GIS Using High-Resolution Aerial Photography and a Digital Photogrammetry System. Geomorphology 2009, 111, 48–60. [Google Scholar] [CrossRef]
  3. Poesen, J.; Nachtergaele, J.; Verstraeten, G.; Valentin, C. Gully Erosion and Environmental Change: Importance and Research Needs. Catena 2003, 50, 91–133. [Google Scholar] [CrossRef]
  4. Maulana, E.; Sartohadi, J.; Setiawan, M.A. Understanding Gully Erosion Development Through a Geomorphological Approach. Soil Water Res. 2025, 20, 84–92. [Google Scholar] [CrossRef]
  5. Betts, H.D.; Trustrum, N.A.; De Rose, R.C. Geomorphic Changes in a Complex Gully System Measured from Sequential Digital Elevation Models, and Implications for Management. Earth Surf. Process. Landf. 2003, 28, 1043–1058. [Google Scholar] [CrossRef]
  6. Dong, Y.; Li, F.; Zhang, Q.; Lei, T. Determining Ephemeral Gully Erosion Process with the Volume Replacement Method. Catena 2015, 131, 119–124. [Google Scholar] [CrossRef]
  7. Martínez-Casasnovas, J.A. A Spatial Information Technology Approach for the Mapping and Quantification of Gully Erosion. Catena 2003, 50, 293–308. [Google Scholar] [CrossRef]
  8. Wells, R.R.; Momm, H.G.; Bennett, S.J.; Gesch, K.R.; Dabney, S.M.; Cruse, R.; Wilson, G.V. A Measurement Method for Rill and Ephemeral Gully Erosion Assessments. Soil Sci. Soc. Am. J. 2016, 80, 203–214. [Google Scholar] [CrossRef]
  9. Liu, Y.; Han, K.; Rasdorf, W. Assessment and Prediction of Impact of Flight Configuration Factors on UAS-Based Photogrammetric Survey Accuracy. Remote Sens. 2022, 14, 4119. [Google Scholar] [CrossRef]
  10. Castillo, C.; Marín-Moreno, V.J.; Pérez, R.; Muñoz-Salinas, R.; Taguas, E.V. Accurate Automated Assessment of Gully Cross-Section Geometry Using the Photogrammetric Interface Freexsapp. Earth Surf. Process. Landf. 2018, 43, 1726–1736. [Google Scholar] [CrossRef]
  11. Nesbit, P.; Hugenholtz, C. Enhancing UAV–Sfm 3D Model Accuracy in High-Relief Landscapes by Incorporating Oblique Images. Remote Sens. 2019, 11, 239. [Google Scholar] [CrossRef]
  12. Su, Z.; Xiong, D.; Dong, Y.; Li, J.; Yang, D.; Zhang, J.; He, G. Simulated Headward Erosion of Bank Gullies in the Dry-Hot Valley Region of Southwest China. Geomorphology 2014, 204, 532–541. [Google Scholar] [CrossRef]
  13. Wu, Y.; Zheng, Q.; Zhang, Y.; Liu, B.; Cheng, H.; Wang, Y. Development of Gullies and Sediment Production in the Black Soil Region of Northeastern China. Geomorphology 2008, 101, 683–691. [Google Scholar] [CrossRef]
  14. Shellberg, J.G.; Spencer, J.; Brooks, A.P.; Pietsch, T.J. Degradation of the Mitchell River Fluvial Megafan by Alluvial Gully Erosion Increased by Post-European Land Use Change, Queensland, Australia. Geomorphology 2016, 266, 105–120. [Google Scholar] [CrossRef]
  15. Díaz-Varela, R.A.; De La Rosa, R.; León, L.; Zarco-Tejada, P.J. High Resolution Airborne UAV Imagery to Assess Olive Tree Crown Parameters Using 3D Photo Reconstruction: Application in Breeding Trials. Remote Sens. 2015, 7, 4213–4232. [Google Scholar] [CrossRef]
  16. Hosseinalizadeh, M.; Kariminejad, N.; Chen, W.; Pourghasemi, H.R.; Alinejad, M.; Mohammadian Behbahani, A.; Tiefenbacher, J.P. Spatial Modelling of Gully Headcuts Using UAV Data and Four Best-First Decision Classifier Ensembles (Bftree, Bag-Bftree, RS-Bftree, And RF-Bftree). Geomorphology 2019, 329, 184–193. [Google Scholar] [CrossRef]
  17. Gómez Gutiérrez, Á.; Schnabel, S.; Lavado Contador, F.; De Sanjosé, J.J.; Atkinson, A.D.J.; Pulido Fernández, M.; Sánchez Fernández, M. Studying the Influence of Livestock Pressure on Gully Erosion in Rangelands of SW Spain by Means of the UAV+Sfm Workflow. Boletín Asoc. Geógrafos Españoles 2018, 78, 66–88. [Google Scholar] [CrossRef]
  18. Yang, S.; Guan, Y.; Zhao, C.; Zhang, C.; Bai, J.; Chen, K. Determining the Influence of Catchment Area on Intensity of Gully Erosion Using High Resolution Aerial Imagery: A 40-Year Case Study from the Loess Plateau, Northern China. Geoderma 2019, 347, 90–102. [Google Scholar] [CrossRef]
  19. Koci, J.; Jarihani, B.; Leon, J.X.; Sidle, R.C.; Wilkinson, S.N.; Bartley, R. Assessment of UAV and Ground-Based Structure from Motion with Multi-View Stereo Photogrammetry in a Gullied Savanna Catchment. ISPRS Int. J. Geo-Inf. 2017, 6, 328. [Google Scholar] [CrossRef]
  20. Zheng, F.; Xu, X.; Qin, C. A Review of Gully Erosion Process Research. Trans. Chin. Soc. Agric. Mach. 2016, 47, 47–59. (In Chinese) [Google Scholar] [CrossRef]
  21. Medeiros, B.M.; Cândido, B.; Jimenez, P.A.J.; Avanzi, J.C.; Silva, M.L.N. UAV-Based Soil Water Erosion Monitoring: Current Status and Trends. Drones 2025, 9, 305. [Google Scholar] [CrossRef]
  22. Eltner, A.; Baumgart, P.; Maas, H.G.; Faust, D. Multi-Temporal UAV Data for Automatic Measurement of Rill and Inter Rill Erosion on Loess Soil. Earth Surf. Process. Landf. 2015, 40, 741–755. [Google Scholar] [CrossRef]
  23. Liu, K.; Ding, H.; Tang, G.; Na, J.; Huang, X.; Xue, Z.; Yang, X.; Li, F. Detection of Catchment-Scale Gully Affected Areas Using Unmanned Aerial Vehicle (UAV) on the Chinese Loess Plateau. ISPRS Int. J. Geo-Inf. 2016, 5, 238. [Google Scholar] [CrossRef]
  24. Pineux, N.; Lisein, J.; Swerts, G.; Bielders, C.L.; Lejeune, P.; Colinet, G.; Degré, A. Can DEM Time Series Produced by UAV Be Used to Quantify Diffuse Erosion in an Agricultural Watershed? Geomorphology 2017, 280, 122–136. [Google Scholar] [CrossRef]
  25. Cândido, B.M.; James, M.; Quinton, J.; Lima, W.; De Silva, M.L.N. Sediment Source and Volume of Soil Erosion in a Gully System Using UAV Photogrammetry. Rev. Bras. Ciência Solo 2020, 44, e0200076. [Google Scholar] [CrossRef]
  26. Marzolff, I.; Ries, J.B.; Poesen, J. Short-Term Versus Medium-Term Monitoring for Detecting Gully-Erosion Variability in a Mediterranean Environment. Earth Surf. Process. Landf. 2011, 36, 1604–1623. [Google Scholar] [CrossRef]
  27. Zhao, C.; Jiao, J.; Shui, J.; Wang, H.; Chen, T.; Chen, Y.; An, S.; Guo, M.; Yang, H. Comparative Analysis on Morphological Characteristics of Erosion Gullies Measured by an Unmanned Aerial Vehicle and Traditional Ground Survey in South Central Tibet. Bull. Soil Water Conserv. 2019, 39, 120–127. (In Chinese) [Google Scholar] [CrossRef]
  28. Wang, Z.; Zhang, G.; Wang, C.; Xing, S. Gully Morphological Characteristics and Topographic Threshold Determined by UAV in a Small Watershed on the Loess Plateau. Remote Sens. 2022, 341, 15–27. [Google Scholar]
  29. Glendell, M.; Mcshane, G.; Farrow, L.; James, M.R.; Quinton, J.; Anderson, K.; Brazier, R.E. Testing the Utility of Structure-from-Motion Photogrammetry Reconstructions Using Small Unmanned Aerial Vehicles and Ground Photography to Estimate the Extent of Upland Soil Erosion. Earth Surf. Process. Landf. 2017, 42, 1860–1871. [Google Scholar] [CrossRef]
  30. Peter, K.D.; d’Oleire-Oltmanns, S.; Ries, J.B.; Marzolff, I.; Ait Hssaine, A. Soil Erosion in Gully Catchments Affected by Land-Levelling Measures in the Souss Basin, Morocco, Analysed by Rainfall Simulation and UAV Remote Sensing Data. Catena 2014, 113, 24–40. [Google Scholar] [CrossRef]
  31. Stöcker, C.; Eltner, A.; Karrasch, P. Measuring Gullies by Synergetic Application of UAV and Close Range Photogrammetry a Case Study from Andalusia, Spain. Catena 2015, 132, 1–11. [Google Scholar] [CrossRef]
  32. D’Oleire-Oltmanns, S.; Marzolff, I.; Peter, K.D.; Ries, J.B. Unmanned Aerial Vehicle (UAV) for Monitoring Soil Erosion in Morocco. Remote Sens. 2012, 4, 3390–3416. [Google Scholar] [CrossRef]
  33. Herwitz, S.R.; Johnson, L.F.; Dunagan, S.E.; Higgins, R.G.; Sullivan, D.V.; Zheng, J.; Lobitz, B.M.; Leung, J.G.; Gallmeyer, B.; Aoyagi, M.; et al. Imaging from an Unmanned Aerial Vehicle: Agricultural Surveillance and Decision Support. Comput. Electron. Agric. 2004, 44, 49–61. [Google Scholar] [CrossRef]
  34. Cook, K.L. An Evaluation of the Effectiveness of Low-Cost Uavs and Structure from Motion for Geomorphic Change Detection. Geomorphology 2017, 278, 195–208. [Google Scholar] [CrossRef]
  35. Candiago, S.; Remondino, F.; De Giglio, M.; Dubbini, M.; Gattelli, M. Evaluating Multispectral Images and Vegetation Indices for Accuracy Farming Applications from UAV Images. Remote Sens. 2015, 7, 4026–4047. [Google Scholar] [CrossRef]
  36. Mlambo, R.; Woodhouse, I.H.; Gerard, F.; Anderson, K. Structure from Motion (Sfm) Photogrammetry with Drone Data: Low Cost Method for Monitoring Greenhouse Gas Emissions from Forests in Developing Countryes. Forests 2017, 8, 68. [Google Scholar] [CrossRef]
  37. Xiong, D.; Yan, D.; Long, Y.; Lu, X.; Han, J.; Han, X.; Shi, L. Simulation of Morphological Development of Soil Cracks in Yuanmou Dry-Hot Valley Region, Southwest China. Chin. Geogr. Sci. 2010, 20, 112–122. [Google Scholar] [CrossRef]
  38. Dong, Y.; Xiong, D.; Su, Z.; Yang, D.; Zheng, X.; Shi, L.; Poesen, J. Effects of Vegetation Buffer Strips on Concentrated Flow Hydraulics and Gully Bed Erosion Based on In Situ Scouring Experiments. Land Degrad. Dev. 2018, 29, 1672–1682. [Google Scholar] [CrossRef]
  39. Wang, X.; Zhong, X.; Liu, S.; Li, M.H. A Non-Linear Technique Based on Fractal Method for Describing Gully-Head Changes Associated with Land Use in an Arid Environment in China. Catena 2008, 72, 106–112. [Google Scholar] [CrossRef]
  40. Dong, Y.; Xiong, D.; Su, Z.; Li, J.; Yang, D.; Shi, L.; Liu, G. The Distribution of and Factors Influencing the Vegetation in a Gully in The Dry Hot Valley of Southwest China. Catena 2014, 116, 60–67. [Google Scholar] [CrossRef]
  41. Zhang, J.; Tian, G.; Li, Y.; Lindstrom, M. Requirements for Success of Reforestration Projects in a Semiarid Low-Mountain Region of The Jinsha River Basin, Southwestern China. Land Degrad. Dev. 2002, 13, 395–401. [Google Scholar] [CrossRef]
  42. Lucieer, A.; Jong, S.M.; De Turner, D. Mapping Landslide Displacements Using Structure from Motion (Sfm) and Image Correlation of Multi-Temporal UAV Photography. Prog. Phys. Geogr. Earth Environ. 2014, 38, 97–116. [Google Scholar] [CrossRef]
  43. Jiang, S.; Jiang, C.; Jiang, W. Efficient Structure from Motion for Large-Scale UAV Images: A Review and a Comparison of Sfm Tools. ISPRS J. Photogramm. Remote Sens. 2020, 167, 230–251. [Google Scholar] [CrossRef]
  44. Campo-Bescõs, M.A.; Flores-Cervantes, J.H.; Bras, R.L.; Casalí, J.; Girál-Dez, J. Evaluation of a Gully Headcut Retreat Model Using Multi-Temporal Aerial Photographs and Digital Elevation Models. J. Geophys. Res. Earth Surf. 2013, 118, 2159–2173. [Google Scholar] [CrossRef]
  45. Flores-Cervantes, J.H.; Istanbulluoglu, E.; Bras, R.L. Development of Gullies on the Landscape: A Model of Headcut Retreat Resulting from Plunge Pool Erosion. J. Geophys. Res. Earth Surf. 2006, 111, F01010. [Google Scholar] [CrossRef]
  46. Liu, X. Airborne Lidar for DEM Generation: Some Critical Issues. Prog. Phys. Geogr. 2008, 32, 31–49. [Google Scholar] [CrossRef]
  47. Perroy, R.L.; Bookhagen, B.; Asner, G.P.; Chadwick, O.A. Comparison of Gully Erosion Estimates Using Airborne and Ground-Based Lidar on Santa Cruz Island, California. Geomorphology 2010, 118, 288–300. [Google Scholar] [CrossRef]
  48. Sanz-Ablanedo, E.; Chandler, J.H.; Rodríguez-Pérez, J.R.; Ordóñez, C. Accuracy of Unmanned Aerial Vehicle (UAV) and SfM Photogrammetry Survey as a Function of the Number and Location of Ground Control Points Used. Remote Sens. 2018, 10, 1606. [Google Scholar] [CrossRef]
  49. James, M.R.; Robson, S.; d’Oleire-Oltmanns, S.; Niethammer, U. Optimising UAV Topographic Surveys Processed with Structure-From-Motion: Ground Control Quality, Quantity and Bundle Adjustment. Geomorphology 2017, 280, 51–66. [Google Scholar] [CrossRef]
  50. Agüera-Vega, F.; Carvajal-Ramírez, F.; Martínez-Carricondo, P. Assessment of Photogrammetric Mapping Accuracy Based on Variation Ground Control Points Number Using Unmanned Aerial Vehicle. Meas. J. Int. Meas. Confed. 2017, 98, 221–227. [Google Scholar] [CrossRef]
  51. Guan, Y.; Yang, S.; Zhao, C.; Lou, H.; Chen, K.; Zhang, C.; Wu, B. Monitoring Long-Term Gully Erosion and Topographic Thresholds in the Marginal Zone of the Chinese Loess Plateau. Soil Tillage Res. 2021, 205, 104800. [Google Scholar] [CrossRef]
  52. Dong, Y.; Duan, X.; Huang, J.; Yang, J.; Xiong, D.; Yang, C.; Guiquan, Y. The Validation of a Gully Headcut Retreat Model in Short-Term Scale Based on an In-Situ Experiment in Dry-Hot Valley. J. Soils Sediments 2021, 21, 2228–2239. [Google Scholar] [CrossRef]
  53. Casalí, J.; Giménez, R.; Campo-Bescós, M.A. Gully geometry: What are we measuring? Soil 2015, 1, 509–513. [Google Scholar] [CrossRef]
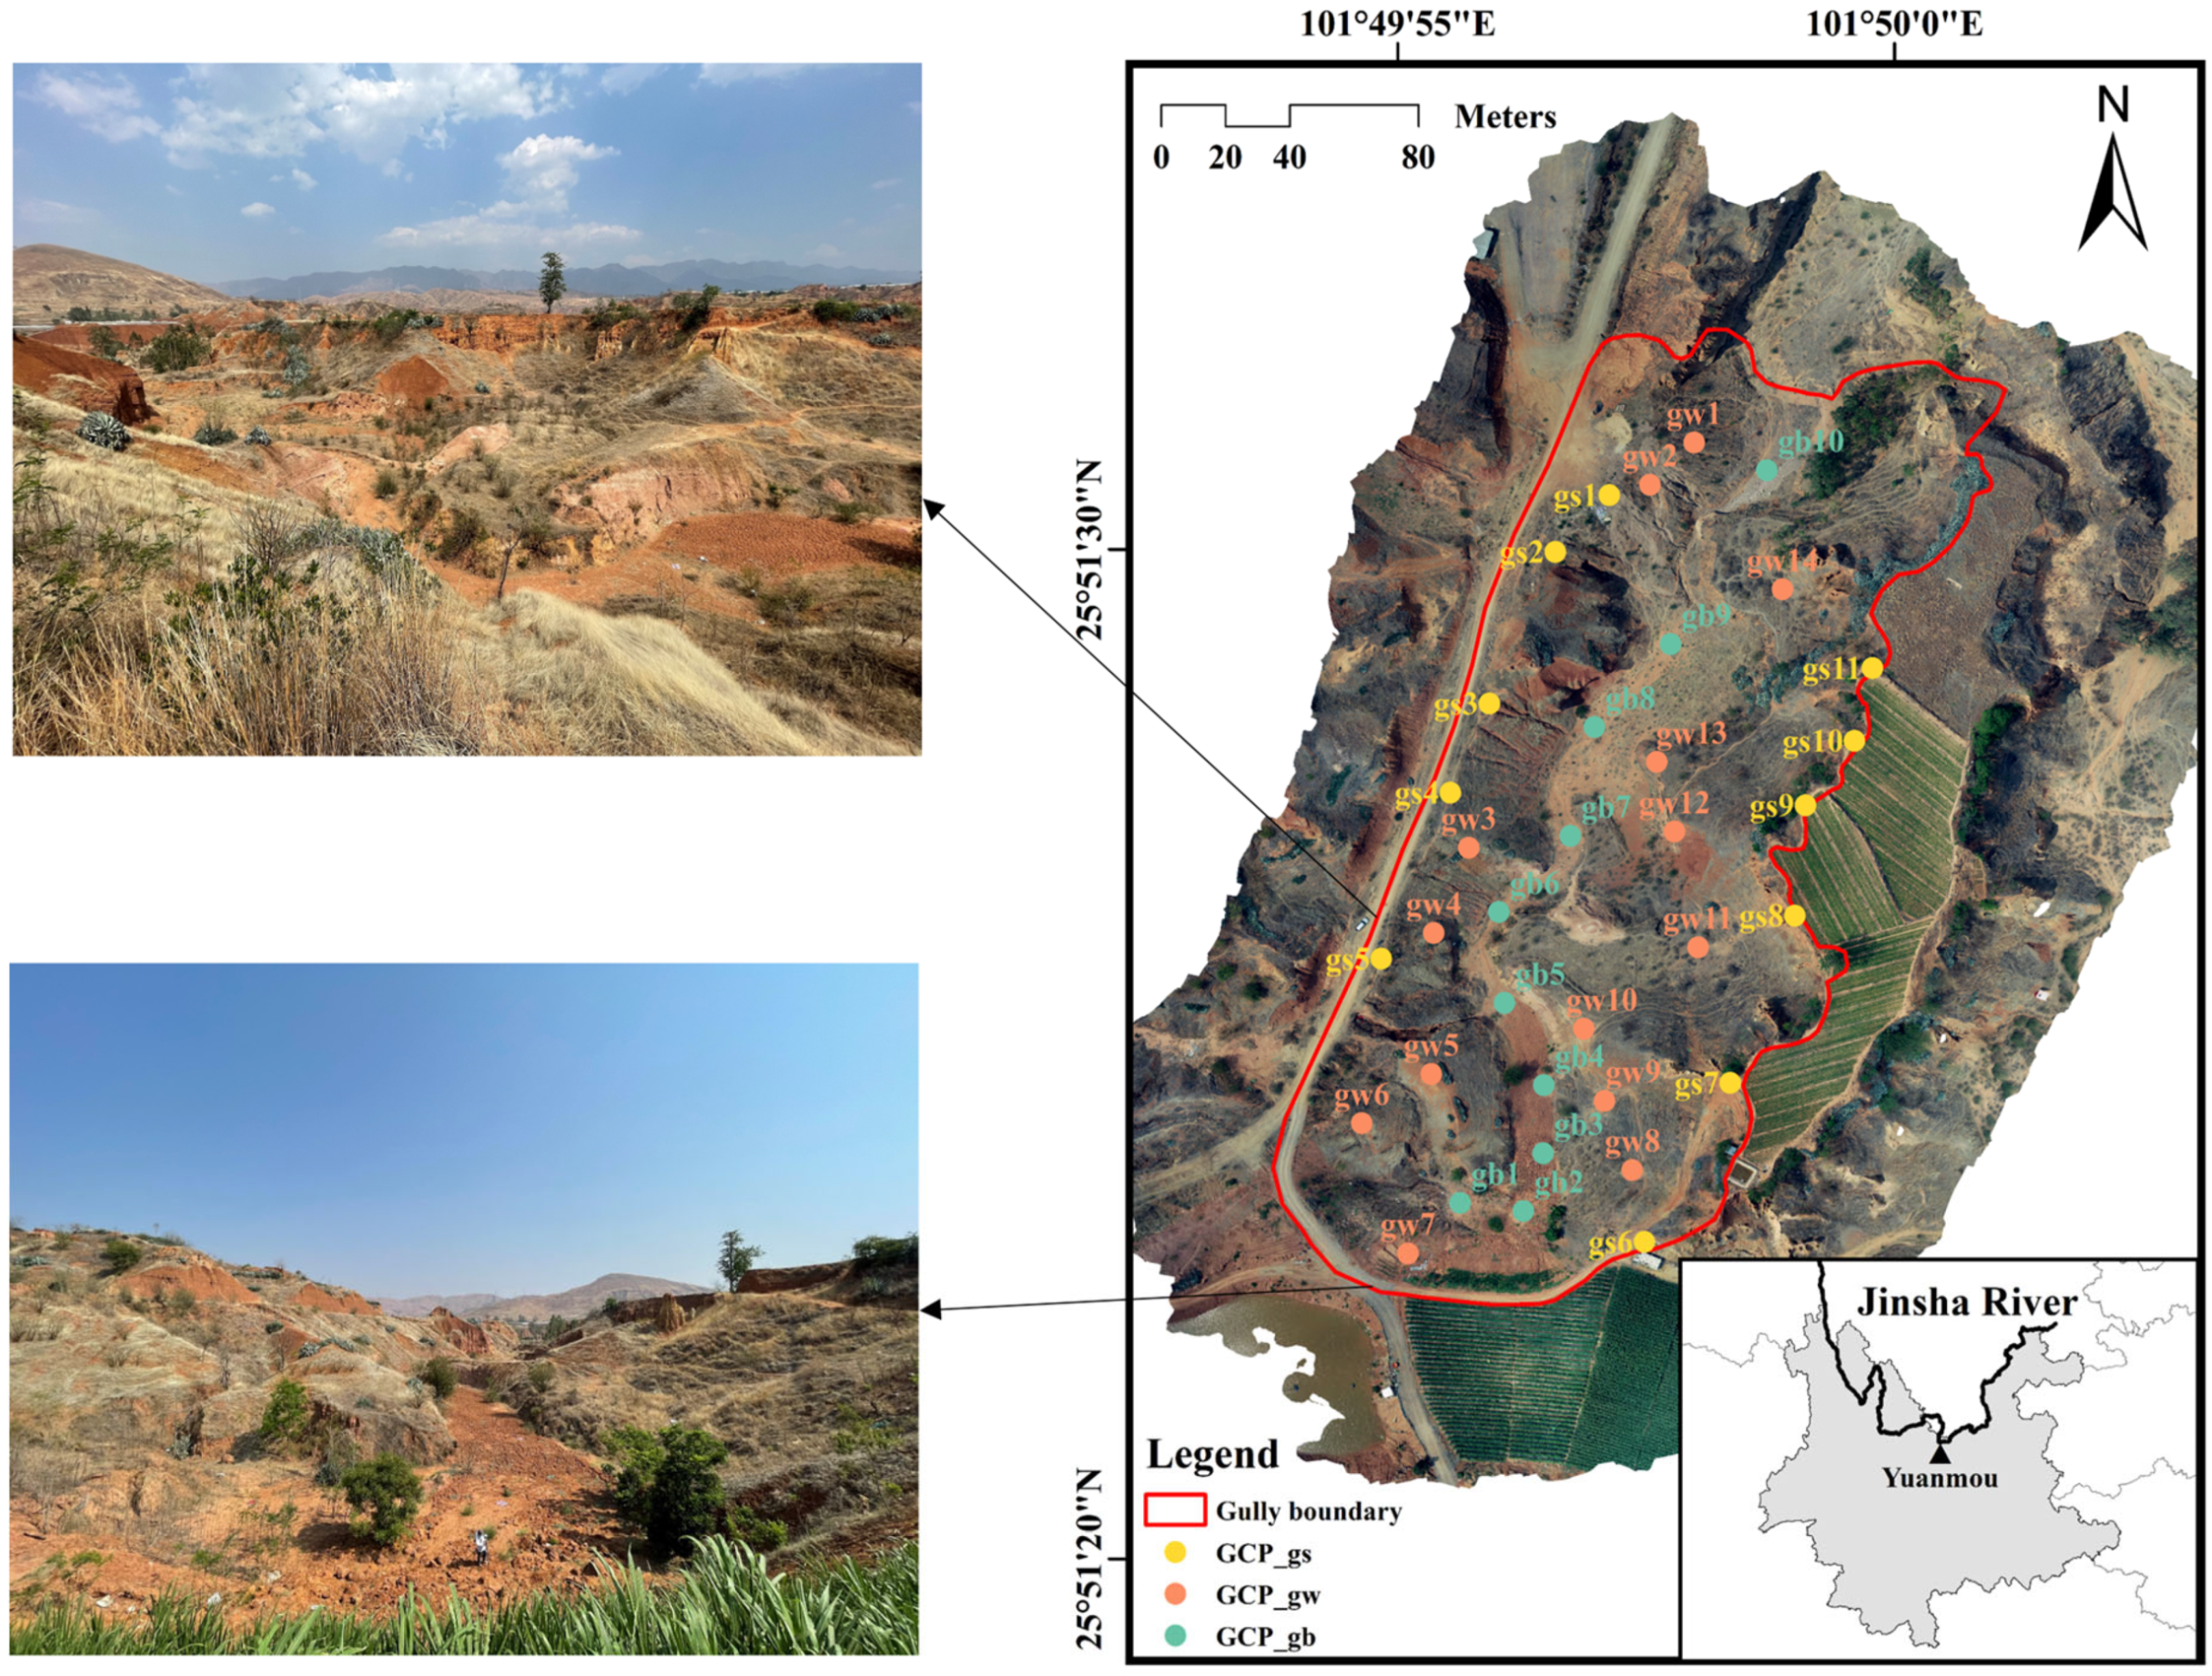
Figure 1. Location of the study area. The maps shows the orthophoto and distribution of GCPs on gully shoulder line (GCP_gs), gully sidewall (GCP_gw) and gully bed (GCP_gb). These two photos were taken on the side and head of the gully using a smartphone.
Drones 09 00696 g001
Figure 2. The measurement methods roadmap. Comprising three parts: field monitoring, data processing and error analysis.
Drones 09 00696 g002
Figure 3. Schemes of GCP placement locations ((a) consideration of the distribution both in the elevation and horizontal directions; (b) consideration of only the elevation distribution; (c) all of the GCPs placed on the gully shoulder line; (d) all of the GCPs placed on the gully sidewall; and (e) all of the GCPs placed on the gully bed).
Drones 09 00696 g003
Figure 4. Errors for different numbers of GCP schemes. (a) MAE and RMSEz of the DSM generated using different numbers of GCPs. (b) RMSE of different parts of the gully. Scatter diagram of the observed and estimated values is shown in (cf). No GCPs were used for (c); the number of GCPs were 6 for (d), 12 for (e), and 18 for (f). Blue dots represent the estimated value and observed value of 200 CPs.
Drones 09 00696 g004
Figure 5. Errors for different flight altitude schemes. (a) MAE and RMSEz of the DSM generated by acquiring data at different flight altitudes (b) RMSE of the different parts of the gully. Scatter diagram of the observed and estimated values shown in (cf); the flight altitude is 50, 100, 150, and 200 m, respectively. Blue dots represent the estimated value and observed value of 200 CPs.
Drones 09 00696 g005
Figure 6. Errors for different photo overlap schemes. (a,b) Both front and side overlap gradually decreased. (c,d) Gradual decrease in side overlap only. (e,f) Gradual decrease in front overlap only.
Drones 09 00696 g006
Figure 7. Average depth and volume ratios of different schemes. (a,b) Schemes of different numbers of GCPs. (c,d) Schemes of different flight altitude. (e,f) Schemes of different photo overlap parameters.
Drones 09 00696 g007
Figure 8. Error of checkpoints when there were shadows in the gully.
Drones 09 00696 g008
Figure 9. Slope gradient and depth distribution of 75 gully side wall checkpoints.
Drones 09 00696 g009
Figure 10. The error estimated using the empirical models by flight altitude and number of photo vs. measured values. The red line represents the 1:1 line, and the black dashed line is the corresponding fitting effect line. Linear regression effect of flight altitude on MAE and RMSE (a,b), Linear regression effect of number of photo on MAE and RMSE (c,d). Stepwise regression of three parameters (flight altitude, number of photo or overlap) (e,f).
Drones 09 00696 g010
Figure 11. Number of photos, flight time, and processing time of different flight schemes.
Drones 09 00696 g011
Figure 12. Total time and error for different flight altitudes and photo overlap schemes. (a,b) are the flight altitude scheme; (c,d) are the photo overlap schemes.
Drones 09 00696 g012
Table 1. Parameters of different schemes. GS is Gully Shoulder Line, GW is Gully SideWall, and GB is Gully Bed. A: GCPs selected from all three parts of the gully (GS, GW, GB), evenly distributed in both horizontal and vertical directions. B: select the GCPs of three parts of the gully, GCPs are clustered close to each other. C D and E: GCPs selected from only the gully shoulder line (C), gully sidewall (D), and gully bed (E) parts, respectively.
SchemeGCPs PositionGCPs NumberFlight Altitude (m)Photo Overlap (%)Number of Schemes
GCP placement location schemes5 categories: scheme A, B, C, D and E610080/705
GCP number
schemes
Each of 3 parts: GS GW and GB0, 3, 6, 9, 12, 15, 18, 21 and 2410080/7010
Flight altitude schemesgs3,5,6,11 gw2,7,11 gb4,7,9,111130, 50, 70, 100, 150, 200, and 25080/707
Photo overlap schemesgs3,5,6,11 gw2,7,11 gb4,7,9,111110090/80, 80/70, 70/60, 60/50, 50/40, 80/90, 80/60, 80/50, 80/40, 90/70, 60/70, 50/70, 40/7013
Total35
Table 2. The accuracy of the DSMs and number of HCEPs under different schemes of GCPs distribution.
SchemeNumber of GCPMAE (m)RMSE (m)Number of HECPs
-00.08830.134055
A60.07000.11913
B60.10100.139445
C60.07220.11922
D60.07240.12007
E60.09460.135934
Table 3. Efficiency of different measuring technologies [8,12,38].
EquipmentMonitoring ObjectsPoint Density (Point. m2)Monitoring Efficiency RMSE (m)Reference
RTK GPSGully headcuts20–30 300–400 points per hour0.031Dong et al., 2018 [38]
LiDARGully headcuts10,000–12,000>480,000 per hour0.006Su et al. 2014 [12]
Paired photographsCross-sections500,000 to >5 million/<0.001Wells et al. 2016 [8]
Table 4. Measurement parameters of UAV measured gully in different studies [19,28,32,51].
Gully Area (m2)Gully Depth (m)Resolution of Image (MP)Flight Altitude (m)OverlapNumber of GCPsRMSE
(m)
Reference
350–7500.5–1.5 at headcuts1286–9980/756–70.230–0.915Koci et al. 2017 [19]
8694.3
maximum
1270-800.007–0.027D’Oleire-Oltmanns et al. 2012 [32]
4589 in average9.7 in average-30080/56330.38Guan et al.
2021 [51]
15–34000.5–12.22010080/70100.20Wang et al. 2022 [28]
32,60010.5 in average2070, 100, 25080/70110.06, 0.11, 0.24This study
Disclaimer/Publisher’s Note: The statements, opinions and data contained in all publications are solely those of the individual author(s) and contributor(s) and not of MDPI and/or the editor(s). MDPI and/or the editor(s) disclaim responsibility for any injury to people or property resulting from any ideas, methods, instructions or products referred to in the content.