Abstract
In this work, an innovative perception-guided approach is proposed for landing zone detection and realization of Unmanned Aerial Vehicles (UAVs) operating in unstructured environments ridden with obstacles. To accommodate secure landing, two well-established tools, namely fuzzy systems and visual Simultaneous Localization and Mapping (vSLAM), are implemented into the landing pipeline. Firstly, colored images and point clouds acquired by a visual sensory device are processed to serve as characterizing maps that acquire information about flatness, steepness, inclination, and depth variation. By leveraging these images, a novel fuzzy map infers the areas for risk-free landing on which the UAV can safely land. Subsequently, the vSLAM system is employed to estimate the platform’s pose and an additional set of point clouds. The vSLAM point clouds presented in the corresponding keyframe are projected back onto the image plane on which a threshold fuzzy landing score map is applied. In other words, this binary image serves as a mask for the re-projected vSLAM world points to identify the best subset for landing. Once these image points are identified, their corresponding world points are located, and among them, the center of the cluster with the largest area is chosen as the point to land. Depending on the UAV’s size, four synthesis points are added to the vSLAM point cloud to execute the image-based visual servoing landing using image moment features. The effectiveness of the landing package is assessed through the ROS Gazebo simulation environment, where comparisons are made with a state-of-the-art landing site detection method.
1. Introduction
In recent years, Unmanned Aerial Vehicles (UAVs) have played a pivotal role not only in daily domestic applications but also in the rapid development of industrial applications. UAVs have been long-established in diverse areas, including ecological monitoring [1,2], smart agriculture [3,4], high-voltage power transmission [5,6], and radar tomography [7]. The forthcoming transportation technology may be contingent upon multirotor devices owing to their lack of interaction with the environment, which is currently being addressed by proposing aerial manipulation systems equipped with a variety of sensors for controlling the UAV’s pose and speed or collecting data. Regardless of the task at hand, the issue of autonomous landing must be tackled, particularly when the system encounters harsh weather conditions or technical difficulties that necessitate an emergency landing to avoid crashing the aerial vehicle.
Autonomous landing of UAVs comprises landing zone detection, path planning, obstacle avoidance, and target tracking. To achieve this, incorporating visual data is suggested to be a promising solution, especially in GPS-denied environments [8]. There are two key factors that affect the design and testing of the landing approach: the type of environment in which the drone aims to land and the technique that is employed for Safe Landing Zone (SLZ) detection. The former can be classified as either an indoor or outdoor environment with the variation of using a static (fixed) or dynamic (moving) landing zone [9]. Furthermore, visual markers can be used to facilitate the landing procedure; in other words, the landing location can be either known or unknown. Readers can find the upsides and downsides of each of these scenarios described thoroughly in [10]. Generally speaking, SLZ approaches can be categorized as vision-based, non-vision-based, or hybrid approaches. Most of existing research focuses on addressing the issue of autonomous landing in known environments in which UAVs detect predefined marks or man-made structures; nonetheless, in real-world applications of the UAVs, these techniques are perceived as unacceptable since unknown or extreme scenes can pose a major setback.
Safe landing site detection approaches for unforeseen environments have enjoyed continuously growing attention these decades. Three-dimensional reconstruction of the surroundings plays a significant role in a safe landing pipeline. Techniques such as structure from motion, LiDAR, and stereo-ranging contribute to generating a geometry map. Localization plays a pivotal role in the safe landing process. To this end, a dynamic localization framework with asynchronous LiDAR–camera fusion was designed in [11] and utilized to estimate the absolute attitude and position observations of UAVs in outdoor, unknown environments. Recently, fusing the information from a swarm of UAVs using the iterative closest point algorithm and a graph-based SLAM was performed to enhance the localization and mapping [12]. The semantic segmentation using deep neural networks [13] was utilized to discriminate the areas that are most likely suitable for landing. The main advantage of semantic maps over traditional geometry maps is the high-level perception of the scene in cases where the scene is flat but hazardous for landing, such as rivers or lakes; nonetheless, the semantic segmentation is prone to error when there are small objects, like debris, close to the segmented areas. To address these issues, feature extraction and matching were used to robustly localize the landing area in [14]. Visual SLAM and deep semantic segmentation were integrated to offer a comprehensive landing framework for realizing autonomous navigation and landing in unknown indoor environments [15]. The suggested model processes the RGB and depth images and then employs the ORB-SLAM2 to construct the sparse map. Afterward, a 3D semantic map was developed by combining a deep learning model and a SLAM system. Providing poor information about uniform and low-contrast surfaces due to the sparse point cloud is the main drawback of the SLAM system. To remedy this, Chatzikalymnios et al. [16] suggested a method that utilizes the scene’s disparity map and point cloud from stereo processing to evaluate terrain factors and quantify them into map metrics.
Visual clues can not only be used to create the map of the environment but are also utilized to perform the landing as well. An example is the approach proposed by Dougherty et al. in [17], where a CMOS camera was utilized to tackle the problem of landing on a flat inclined surface without prior information regarding the orientation of the landing surface. Visual servoing is a technique that employs visual features such as corner points, lines, or ovals to control the camera’s pose. The position-based visual servoing (PBVS) utilizes a calibrated camera and the geometric model of the target to estimate its pose with respect to the camera [18,19]. Image-based visual servoing (IBVS), on the other hand, calculates the feature errors and uses an interaction matrix (a.k.a. image jacobian) to find the camera’s Cartesian velocity. Furthermore, depending on the configuration of the camera, two eye-in-hand (or end-point closed-loop) and eye-off-hand (end-point open-loop) groups are available [20].
Previous research had several shortcomings. First, the vast majority of these studies relied on GPS information, which is inadequate in areas where signals are blocked. Second, human expertise has not been incorporated into the landing systems as a fuzzy system, despite its potential as a tremendous asset. Third, in most outdoor environments, employing man-made markers is not feasible. Lastly, in studies that used stereo-ranging, the limited range was not considered as a constraining factor. This motivates us to propose a novel landing pipeline that addresses these problems.
To tackle the above issues, a combination of ORB-SLAM3, stereo range point cloud, and fuzzy inference is utilized to detect the safe zone site for landing. First, depth images are processed to provide information on flatness and depth variation. The stereo-ranging point clouds are used to acquire data regarding the steepness and inclination of the terrain. Then a fuzzy inference engine that performs a pixel-wise operation on the four images characterizing the terrain data is incorporated to create a novel fuzzy landing score map. Nevertheless, owing to the limited resolution of the radar sensors, the 3D constructed point cloud is not complete; to remedy this, the sparse ORB-SLAM3 point cloud is used. By using the thresholded fuzzy landing score map as a mask for the back-projected ORB-SLAM3 point cloud, a subset of world points that are the best for landing is detected. By using clustering techniques and calculating the local flatness, the best world point for landing is identified. Afterward, a set of synthetic point clouds will be created by considering the area of the UAV. Finally, an IBVS using the image moments is performed to complete the autonomous landing. The main contributions of this study are summarized as follows:
- A novel fuzzy landing score map to reliably characterize the proper landing site is proposed.
- To address the problem of the limited resolution of stereo range cameras, the monocular ORB-SLAM point cloud is exploited to identify the best subset of the point cloud for landing.
- A novel technique for adding synthetic world points to serve as the corner features for IBVS is suggested.
- A new method that integrates the ORB-SLAM3 localization with image moment-based IBVS is offered to perform the landing.
- The close-to-real-world ROS Gazebo simulations for the indoor/outdoor, unknown environments are conducted to verify the effectiveness of the landing pipeline.
The content of this paper is as follows: In Section 2, the landing zone detection structure, including its subsystems, will be thoroughly discussed. The images characterizing the terrain considered for landing are also investigated in this section. Furthermore, the IBVS controller design and stability analyses are carried out. The simulation results using the Gazebo simulator are presented next in Section 3, where a comparison is made between the proposed method and the state-of-the-art method to demonstrate its effectiveness. The results and potential future contributions have been briefly discussed in Section 4. Eventually, the concluding remarks are expressed in Section 5.
2. Methodology
The system structure is illustrated in Figure 1. As shown, the landing pipeline comprises four main subsystems. First, the sensors integrated into the RGB-D camera acquire the frames needed for SLAM system initialization and tracking. Afterward, a 3D sparse map of the environment is generated using the ORB-SLAM3 system. Likewise, there exists a secondary set of map points and a depth image computed using stereo-ranging. The depth information and stereo-ranging point clouds are used to generate four images that characterize the terrain’s appropriateness for landing. To achieve a 2D landing map, a rule-based fuzzy system is utilized to infer where is safe for landing by assigning a score to each corresponding pixel. The last subsystem filters the undesirable ORB-SLAM 3D points, identifying a single cluster with the best flatness. Finally, a vision-based landing is executed based on the SLAM pose estimation and moment of an artificially created image.
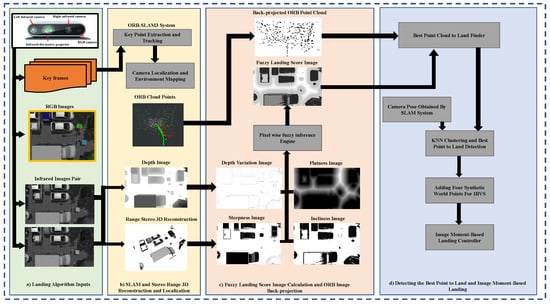
Figure 1.
The proposed landing system structure. The major subsystems are highlighted. The blocks highlighted in green represent the inputs. The yellow area corresponds to the vSLAM system. The red section illustrates the fuzzy map construction and postprocessing of vSLAM keypoints. The area highlighted in purple shows the IBVS landing subsystem. The black arrows show the data direction.
2.1. Dense Stereo Reconstruction
The estimation of the world points using two images taken by two different (or similar) cameras with distinct poses is known either as sparse or dense reconstruction. The former involves three major steps: feature extraction, stereo matching, and matching refinement. The disparity is calculated for each matched point in the pair of images and can be converted into three-dimensional Cartesian coordinates. However, in the latter, the depth is estimated for all pixels in the image pair using similarity measures in template matching techniques given a range of disparity. Assuming that the disparity is calculated for all points in the image space, one may use the following equations to derive the coordinates of each world point corresponding to each pixel [18]:
where is the principal point coordinate (in pixels), b is the baseline of the stereo camera, usually reported in , f is the focal length of the camera in pixels, is the effective pixel size, and are the coordinates of the left and right conjugate points, respectively, is the disparity. One issue with infrared cameras is their limited range for optimal performance. For instance, the well-established RealSense D435 and D415 cameras are reported to yield the best performance within a limited range, according to [21].
2.2. Visual Monocular ORB-SLAM3 System
The vSLAM system realizes a simultaneous estimation of the body pose and point cloud generation. The core components of the visual ORB-SLAM consist of initialization, tracking, local mapping, and loop closure [22]. It is well acknowledged that the depth information cannot be recovered with a single image, with which one may encounter at the beginning stage of the algorithm. To cope with this issue, the initialization subsystem starts extracting the ORB features for each keyframe and matching them with subsequent frames. When the number of matched features exceeds a pre-specified threshold, the initial point cloud is reconstructed solely based on these two frames. The concept of the epipolar pencils rotating around the baseline is afterward utilized to recover the pose information. Based on (2), the image points and can be projected onto each other using a 2D homography matrix . Furthermore, Equation (3) indicates the epipoles and the image points are co-planar, and the position of is constrained by the epipolar lines:
The planar homography and fundamental matrices are obtained in parallel threads. Depending on the scene’s parallax and the existence of planar elements, one of the mentioned models is selected to solve the above equations with the normalized direct linear transformation and eight-point algorithms leveraging RANSAC serving as a remedy to eliminate outliers.
2.3. Landing Zone Detection Algorithm
There are several key factors hindering the safety of landing that one can encounter in real-world scenarios. The flatness of the terrain of landing, for instance, holds crucial significance in the context of landing where the environment is perceived as unknown. Furthermore, there is a possibility of crashing the landing gear or UAV overthrow if the slope of the terrain exceeds a limit. Lastly, the area should be sufficiently large for the UAV to land—an area twice the size of the UAV, as suggested in some studies like [16].
The proposed landing algorithm is initiated when the UAV is hovering above the area approximately considered for landing. A prerequisite of the autonomous landing is that the pitch and roll angles of the UAV are kept small and close to zero just before the landing point is detected [16]. However, it is emphasized that this assumption does not limit this approach owing to the fact that the concept of the virtual camera has been incorporated into the control system formulation, compensating for the effects of the non-zero roll and pitch angles. In addition, the camera should be oriented downward with a pitch angle of approximately 90 degrees.
The first map metric established in the processing steps relies on obtaining the local variance of the depth image using a fixed window applied to each pixel. The depth discontinuities like edges can account for high intensity levels. Once the variance image is obtained, a pixel-intensity transformation is utilized to map the variance values to a gray-scale image where the higher variance is represented by black (zero intensity) and the lower variances with white (full intensity). The same pixel-wise transformation as proposed by [16] is adopted:
Therein, represents the pixel intensity of the depth image variance image. A min–max normalization (5) is applied to the image after each intensity transformation described as follows:
where and are the minimum and maximum pixel intensities, respectively. The details of the algorithm’s implementation are given in Algorithm 1. In the second line of this algorithm, the element-wise product, denoted by ⊙, is used to calculate the square of mean image.
| Algorithm 1 Algorithm for obtaining depth variance map |
| Input: depth image, window size Output: DepthVarMap
|
To obtain the flatness image, edges in the depth image are detected using the Canny edge detector with the pixel intensity , and spatial variables of the output and input images are denoted by p and q, respectively. Next, the minimum Euclidean distance of each pixel in the generated binary image to the non-zero intensity pixels is calculated as follows [23]:
The elements of how to derive the flatness image from the depth image are presented in Algorithm 2.
| Algorithm 2 Algorithm for obtaining the flatness map |
| Input: depth image Output: FlatnessMap
|
Being flat is not solely sufficient for landing, and how inclined the surface is should also be taken into consideration. To achieve this, the three-space points generated by dense stereo reconstruction are established. The principal curvature of the surfaces rendered by the point cloud can serve as a measure indicating the inclination. A k-means clustering algorithm is employed on the candidate point set to identify the dense landing sites within the scene. The covariance of each patch is calculated, and the eigenvectors of each yield the principal curvature components. The third component of the principal curvature vector indicates the inclination of the patch. The following relation describes how the inclination image is obtained:
Therein, is the vector of principal curvature, and is the maximum value of the vector. A min-max normalization (5) is essential after this operation. Algorithm 3 shows the overall steps to compute the inclination map.
| Algorithm 3 Algorithm for computing the inclination map |
| Input: Point Cloud Patches Output: InclinationMap
|
Steepness of each pixel in the depth map cannot be obtained in the image space; instead, cloud point normal vectors are used to determine this metric. The angle between the normal and the z-axis of the world reference frame is a measure showing how steep the surface is. Accordingly, the dot product of the normal and the unit vector yields the angle. Nonetheless, the angle corresponding to each pixel should be mapped to a pixel intensity. As a result, the following formulation can be used to generate the steepness image [23]:
where , expressed in the inertial frame, is the normal vector, and is the angle between the normal and world frame coordinate z-axis. Algorithm 4 outlines the procedure to obtain the steepness of the image.
| Algorithm 4 Procedure for obtaining the steepness map |
| Input: Point Cloud Patches Output: SteepnessMap
|
2.4. Fuzzy Landing Map
Once the four map metrics are obtained using the image processing techniques implemented on the depth image and point cloud, a final map that combines these maps is required to ascertain safe landing site detection. A fuzzy inference engine is utilized to generate a fuzzy landing score image in which the intensity values of each pixel in each of the four images are considered the input vector of the fuzzy system, and the output is the intensity of the landing image. Despite the wide variety of fuzzy systems, the Mamdani-type system is chosen in this paper. This model has been used widely to express the relationship between inputs and outputs.
2.5. Finding the Best Points to Land
Once the fuzzy landing map is constructed, binary thresholding may be used to create a binary mask serving as a filter to eliminate a subset of active ORB-SLAM3 world points. Nevertheless, the world points corresponding to the current keyframe should be projected back onto the image plane so that a grayscale image with the active keypoints as pixels with one intensity (white-colored pixels) is generated. Once a subset of the image points is identified, reverse indexing is utilized to recover the three-space ORB points. As a result, a k-means clustering technique is applied to the candidate point set to detect the best set of the dense landing points. The points organized in a k-d tree are searched to find their corresponding normal vectors, and if they are close to each other, they are classified as a unique group. The centroid of the cluster with the minimum normal variance is selected as the safest landing point. The number of clusters can impact the identification of the flattest patch if its area does not meet the minimum dimensions constraint, resulting in discarding the selection by the algorithm. Conversely, setting the number of clusters to a small value can lead to inaccuracies and the detection of unsafe landing zones. For the image-based control to be performed, there should be at least three corner points. To achieve this, the best point to land is considered as , and the dimensions of the rectangular area on which the UAV aims to land are , so the coordinates of the synthesis points are selected to be as follows:
2.6. Reference Frame Attachment
The coordinate reference frames are depicted in Figure 2. Before presenting the governing dynamics of the UAV and the image features, the coordinate systems should be determined to facilitate transformations between frames. The inertial frame is shown with where the axis is parallel to the gravitational acceleration vector . The and axes point North and East, respectively, and should be treated as positive directions when deriving the system’s equations of motion. indicates the fixed-body frame, which is initially aligned with the inertial reference frame. To discuss the dynamics of visual data, the real and virtual camera frames are defined as and , respectively. The latter is an imaginary coordinate frame coinciding with the camera frame with a different orientation. More specifically, while the yaw angles are the same, the roll and pitch angles of the virtual frame differ in the sense that they are always kept zero with respect to the inertial frame, ensuring that two and planes remain parallel. The Z–Y–X Tait–Bryan angles (intrinsic rotation) are utilized here to obtain the rotation of a coordinate frame.
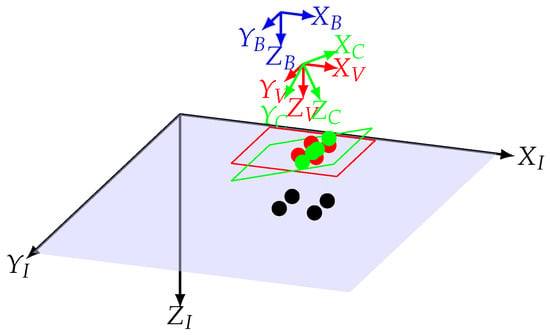
Figure 2.
The coordinate frames and image planes. The blue coordinate frame indicates the body-fixed frame, the red represents the virtual camera frame, the green shows the real camera frame, and the black represents the inertial frame. The black dots are world points, while the green and red dots illustrate the corresponding projected points on the real and virtual camera image planes, respectively.
2.7. Quadrotor’s Equations of Motion
In this section, the UAV’s translational and rotational equations of motion, expressed in the fixed-body frame, are derived employing the Newton–Euler equation of rigid body dynamics [24], as follows:
where m is the mass of the UAV, is the moment of inertia of the UAV, is the moment vector expressed in body frame, and is the total thrust force generated by the four propellers. g is the acceleration due to gravity, is the angular velocity vector, is the position of the UAV, and is the linear speed of the UAV. Nevertheless, if there is a transformation between the UAV and the camera, then the speed of the camera is a function of the speed of the UAV. Since there is no prismatic or revolute joint between the camera and UAV, the linear speed of the camera and the UAV is the same in the virtual frame; thus, . Hence, the UAV’s translational dynamics must be expressed in the virtual camera frame. With this frame attachment, the following rotation matrices are obtained:
Using the transformations (12) to (15), the thrust force in the virtual frame can be expressed as follows:
The force exerted by the gravity is calculated as follows:
The following equation describing the UAV’s translational dynamics can be expressed in the virtual reference frame as follows:
The attitude dynamics equations are derived with respect to the body-fixed frame.
2.8. Visual Data Dynamics
To derive the image feature dynamics, first, the world points are expressed w.r.t the camera coordinate frame as follows:
By expanding the rotation matrix in terms of the basic rotations, one can obtain the following:
As it is seen in Figure 2, the pitch and roll angles are zero for the virtual camera frame. Hence,
Thus, the coordinates of the world point in the virtual frame are as follows:
Differentiating (23) with respect to time results in the following:
Given that the time derivative of the rotation matrix is equal to the product of a skew-symmetric matrix of angular velocity and the rotation matrix itself, it follows that
where . Because the pitch and roll angles of the virtual plane are zero, . Therein represents the unit vector aligned with the z-axis of the inertial frame. Substituting into (26) yields:
where is the unit vector describing the z-axis of the virtual frame. In (27), since the rotation occurs around the z-axis of the virtual frame, it can be inferred that and are aligned, and the rotation does not affect the orientation of the z-axis of the virtual frame. Therefore, (24) can be rewritten as follows:
Based on (23), the coordinates of a point in the image plane will be represented as in (28), which gives
The equation above can be reformulated in terms of the linear velocities of the camera, as follows:
Let , the virtual image plane coordinates are reported as follows:
where f is the focal length of the camera identified by calibration. To obtain the dynamics of the virtual image plane coordinates, the derivative of (32) should be taken, incorporating (31) in the process:
The features chosen to control the motion of the UAV are defined as follows:
Therein, and , are the central gravity coordinates, and the moments are defined as follows:
Furthermore, a is defined leveraging the second central moments:
The dynamics of the image features in the virtual image plane is represented by , which serves as the setpoint for a:
where is the depth value when the camera is at the desired pose.
2.9. IBVS Control Design
The block diagram of the control system is illustrated in Figure 3. The best corner points for landing, , were obtained in the previous section in (10). Considering the camera projection matrix , the projected points on the camera frame are generated by the estimated camera pose using ORB-SLAM3 in Section 2.2. Using a calibrated camera with the intrinsic parameters , the pixel coordinates can be obtained. The control law is to minimize the image feature error, ensuring that the image features reach their predetermined values in finite time. The vector of image feature error can be defined as follows:
Therein, and are the pre-specified and current values of the image feature vectors, respectively. An acceptable error for each element of can be considered to be less than 1 pixel. By substituting (39) into (33), the dynamics of the feature error are obtained as follows:
With the assumption that the desired feature vector is constant, differentiating (40) with respect to time yields the following relation:
By utilizing the equations that describe the dynamics of the UAV in the virtual image frame, the above equation can be expressed in terms of the feature error vector. Consequently, combining the UAV dynamics with the image dynamics results in
where
It is required to determine the control vector that can globally and asymptotically stabilize both the feature error and its derivative . To accomplish this, a cascaded controller is introduced. In this setup, the feed-forward open-loop block provides the desired values for , , and , which are computed by the outer loop controller. The thrust is applied directly to the UAV, while the desired values are used in the attitude control loop due to the UAV’s under-actuated characteristics. Let be the control effort capable of stabilizing the closed-loop system. As a result, one can obtain the following:
The attitude loop employs a straightforward PD controller to track the desired pitch and roll angles as follows:
The magnitude of the thrust vector is described as follows:
The attitude inner loop control laws can be stated as follows:
A new variable, namely filter error, is introduced here:
Based on what is stated in [25], if one can prove that the filtered error is bounded, the image feature error and its time differentiation will also be limited. According to [26], the following relations are satisfied:
wherein represents the smallest singular value of . Moreover, the feature error is upper bound by
The first derivative of filtered feature error, , can be derived as follows using (42):
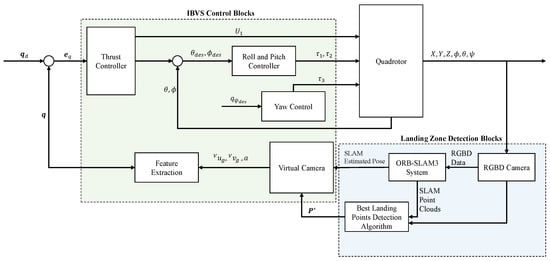
Figure 3.
The proposed control system block diagram includes two major subsystems: IBVS Control and Landing Zone Detection, highlighted in light green and blue, respectively.
Theorem 1.
The image feature error dynamics stated in (55) is globally asymptotically stable under the following closed-loop control law:
Proof.
To prove the stability of the error dynamics, the control law suggested in (56) is substituted into (55). Consequently, after simplification, the following error dynamics are derived:
Therein, and are selected to be positive definite matrices, representing the control gains in diagonal matrix configuration. Let the following be the Lyapunov candidate in which :
By taking the derivative of V with respect to time:
By substituting (55) into (59), one can get:
Expanding the above equation, one can obtain:
By selecting as a positive definite matrix, it is guaranteed that is negative semidefinite, and the filtered error always remains bounded. As a result, the closed-loop system is always stable, completing the proof.
Lemma 1.
The following equation holds whenever is a diagonal matrix and and , consequently:
Proof.
Based on Lemma 1, (62) can be simplified as follows:
Readers may refer to [27] for the proof.
□
□
To ensure the stability of the dynamics of the yaw controller, the following image feature based on the second-order moments is defined:
The scalar feature in (65) yields information regarding the orientation of the target in the virtual image plane for the UAV heading control. Nevertheless, one can take advantage of the fact that the target is not skewed and use the angle between the line connecting any two features in the image plane and the positive u-axis of the pixel coordinate frame. Accordingly, the image feature tracking error related to the heading angle is as follows:
where is the desired angle of the line with respect to the positive u-axis of the pixel coordinates frame. The following proportional control is used here to track the desired heading angle:
therein, is a positive real number.
3. Results
To demonstrate the effectiveness and efficiency of the landing algorithm in an outdoor and indoor, unknown environment, three worlds were built in the Gazebo (Gazebo simulation software: [online]. Available: https://gazebosim.org, accessed on 1 June 2024) simulator software shown in Figure 4. A simulated Parrot Bebop Drone equipped with an Intel RealSense Depth Camera D435 facing downwards, capturing the depth images and point cloud. The specifications of the drone used in the simulations are outlined in Table 1 [28]. The dimensions of the multirotor are (mm), which is considered in the landing strategy as a parameter. Based on the dimensions of the UAV, the values of are set to 656 mm. The ROS publisher and subscriber nodes are developed in C++14 and Python 3.8.10 and executed by a 12th Gen Intel(R) Core(TM) i7-12700 CPU. The entire landing operation is completed within a 20 s interval. Four different scenarios are considered, where in the first two the Gazebo world is the same but the initial position of the UAV differs, while in the third and last scenarios, two different environments are created to assess the robustness of the algorithm.
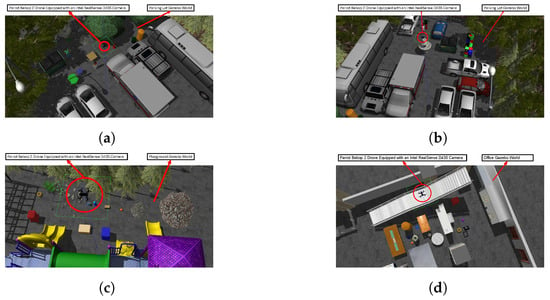
Figure 4.
The created Gazebo worlds along with the Parrot Bebop 2 drone encircled with a red circle. (a) The parking lot simulation environment; (b) the parking lot environment from a secondary viewpoint; (c) The playground environment; (d) the office simulation environment.

Table 1.
Simulated Parrot Bebop drone and camera parameters.
The pixel intensities are normalized to ensure a consistent domain. Triangular membership functions are then adopted for both the input and output fuzzy spaces, each with an equal support set representing the degree of appropriateness for landing. Three membership functions within the universe of discourse for each input variable are defined. In addition, the output space is fuzzified with seven membership functions that indicate the safety of landing at specific pixel coordinates. The construction of the rule base underwent two major phases. In the first phase, the general form of the rules was designed based on human approximate reasoning. For instance, if flatness and steepness are appropriate but the other two metrics have large degrees in the intermediate membership functions, the point is highly suitable for landing. The second stage involved fine-tuning the input and output membership functions, which was achieved through numerous trials and errors.
The Visual Monocular ORB-SLAM3 package (ORB-SLAM3: [online]. Available: https://github.com/UZ-SLAMLab/ORB_SLAM3, accessed on 1 June 2024) with the ROS-enabled branch is adopted in the simulations. The realsnese RGB image topic in ROS has been mapped to the input frame topic of the ORB-SLAM3. Additionally, the frame attachment is required to be adjusted according to the frames defined for the camera. The configuration file is also updated to match the intrinsics of the camera. For example, the focal length and principal values are set to and pixels, respectively. The distortion parameters are ignored in the simulations, and the frame per second is set to 30. The ORB feature extractor finds 1000 ORB points along with their corresponding descriptors for each frame. The number of levels and the scale factor between them in the image pyramid are reported to be 8 and , respectively.
3.1. The First Scenario
The initial position of the quadrotor is in the world reference frame, and the goal is to reach an altitude of approximately 2 at some safe landing location in the world. Figure 5 illustrates the four landing metrics characterizing the terrain when the fuzzy landing image is applied. The appropriateness of the landing site is illustrated through a reversed heat map convention where the zero-intensity pixels are the best, and conversely, the light-colored pixels indicate the least suitable locations. For a more straightforward visual representation, heat maps were used to display the complement of the original pixel values rather than the values themselves. The depth variance map (Figure 5a) is constructed with a window size of 3 and shows the existing depth discontinuities of the scene; however, the surface of the trees, for example, is counted as safe regions for landing. Compared with the depth variance image, the flatness image introduces more reliable information, which has been incorporated into the rule base of the fuzzy system. The inclination map metric (Figure 5c) determines how inclined each surface is and is of high importance since it can enhance the performance of the landing site detection by assigning a low pixel intensity to the non-inclined surfaces. Nonetheless, some small objects, such as the postbox, are missed due to the large value of , expressed in (7). Lastly, Figure 5d illustrates the steepness map constructed using the point cloud based on (8) and (9). Even though it contributed to the identification of the areas with large steepness, it failed to eliminate the pine tree from the suitable spots for landing.
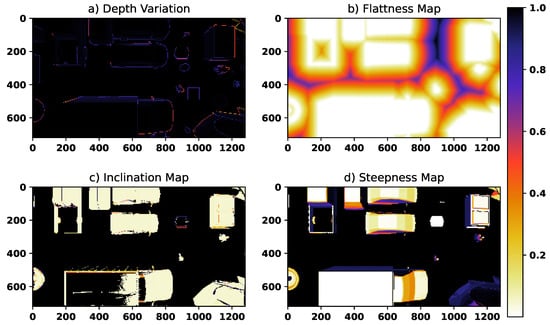
Figure 5.
The first scenario: terrain characterizing maps.
Figure 6 shows the fuzzy landing score map and other SLAM-based images used for finding the landing zone. The fuzzy landing map shows a good performance in combining the four landing map metrics by excluding all of the present objects and humans from the landing sites. Nonetheless, a minimum filter is applied to this fuzzy image to further enhance the safety of this landing map, and the result is shown in Figure 6Aa. Sparse SLAM world keypoints, which are active for this keyframe, back-projected into the image plane depicted in Figure 6Ab. The fuzzy image is then transformed into a binary image using global thresholding and then used as a mask on the SLAM back-projected keypoints to select a subset of them that are the best for landing (see Figure 6Ac). Among these points, the best points for landing that meet the quadrotor area constraint are selected as shown in (see Figure 6Ad).
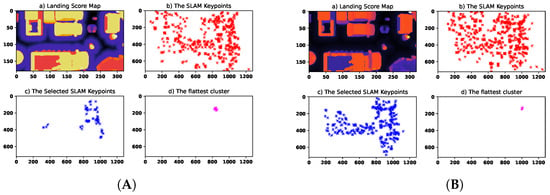
Figure 6.
The first scenario: the landing score maps and SLAM-based images. (A) The proposed method; (B) state-of-the-art method. In the heat maps, the black areas represent potential safe landing zones. The red, blue, and pink stars indicate the SLAM keypoints, the selected keypoints, and the flattest subset, respectively.
The suggested method was compared with the state-of-the-art landing method in [16], where Bayesian classification of landing points is suggested. The results of this method are highlighted in Figure 6Ba. Figure 6Bd demonstrates the back-projected active SLAM keypoints in the image plane. The filtered subset of these points and the corresponding image points of the SLAM flattest 3D patch are shown in Figure 6Bc and Bd, respectively. Areas such as the back of the pick-up truck are detected as good sites for landing, whereas in the proposed method that area is marked as areas not recommended for landing. An additional advantage is the safety of the landing, as the suggested method avoids landing close to areas where there is an object or person. However, the time taken to construct the fuzzy landing image is about 984 ms, while the same quantity is reported to be 454 ms for the Bayesian method. Despite these differences, the final detected landing mean of the world points is very close to each other. The coordinates of the world point are computed to be and meters for the proposed method and Bayesian method, respectively. Readers may refer to Table 2 to view the key experimental indicators for all scenarios. The fuzzy inference accounts for approximately 71.9% of the total average time required for landing zone detection, due to its high complexity. Moreover, the algorithm did not lead to any quadrotor crashes or risky landings across various scenarios. Finally, the mean Euclidean distance between the best landing points of the proposed method and the state-of-the-art method was 1.249 m across all scenarios.

Table 2.
Comparison of experimental indicators for all scenarios.
The key parameters used in the IBVS control system and image processing blocks are listed in Table 3. The parameter controls the upper and lower limits, eliminates the steady-state offset, and controls the convergence rate of the image feature tracking error. and , where , affect the transient response characteristics of roll and pitch angles, respectively. The window size in Algorithm 1 impacts the sensitivity to depth variations. By using two threshold values, Algorithm 2, one can identify and link edges. Narrower bounds result in more edges but can also be affected by image noise. The kernel size in the distance transformation controls the accuracy of the distance to the nearest nonzero pixel. The KNN search radius can influence the number of patches in point clouds.

Table 3.
The parameters values used in the simulations.
The mean of the detected cluster of the world points is considered the center of the square with sides obtained from the quadrotor dimensions that will be used to conduct IBVS landing for both techniques. The results of the perception-guided landing using image moment features presented in (11)–(62) are shown Figure 7a and b for the proposed method and the state-of-the-art method, respectively. The target pose of the camera is considered to be a fronto-parallel view in both cases. The feature error development is outlined in Figure 8, where the feature errors defined in (39) finally converge to a small value, indicating that the camera reached the desired pose. It is worth highlighting that there is a static transformation between the camera optical frame and the quadrotor frame; consequently, the twist applied to the camera is mapped to the quadrotor local frame.
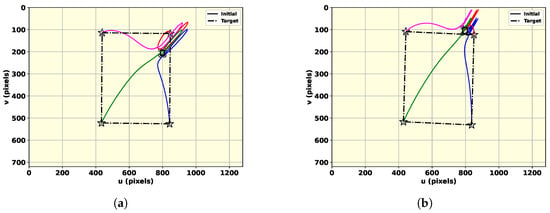
Figure 7.
The first scenario: Image-plane feature motion, where circles show the initial feature position and the stars indicate the desired position. The trace of each of the features is distinguished by using four different colors. (a) The fuzzy map; (b) the Bayesian method.
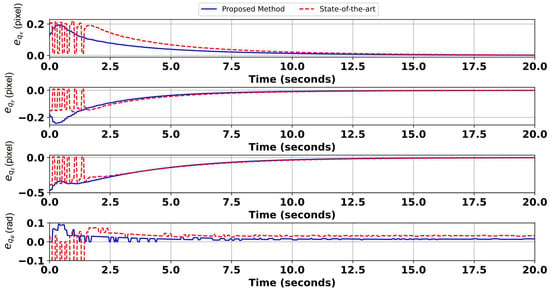
Figure 8.
The first scenario: the feature error development.
3.2. The Second Scenario
In the second scenario, the same environment is adopted as in the first scenario. However, the quadrotor is spawned in a different position compared with the first experiment to showcase the robustness of the method against the initial position variations. The UAV is initially at the expressed in the inertial frame. Heat maps illustrated in Figure 9 report the previously discussed metrics. The edges are assigned low scores in Figure 9a, while the flatness map discarded has proved highly effective by excluding the trees and the cars despite eliminating safe space as shown in Figure 9b. The inclination map also obtains the vast majority of hazardous locations for landing with minor inaccuracies such as misclassifying the back of the pickup truck located on the bottom left corner of the map, as it can be observed in Figure 9c. Figure 9d indicates the steepness of the terrain, which lacks precision in detecting small objects like debris. The results of the fuzzy and Bayesian inference, which combine all of the maps, are illustrated in Figure 10A and B, respectively. It is evident that the best image points to land are obtained in the bottom right corner, where there are no objects. Lastly, the image plane trajectories for both methods and the evolution of the image feature error are depicted in Figure 11 and Figure 12, respectively. These two figures indicated that the features will converge to their desired values in less than 10 s.
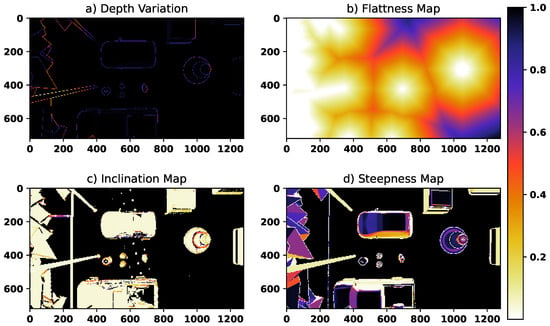
Figure 9.
The second scenario: terrain characterizing maps with the initial absolute position (−3, 12, 9).
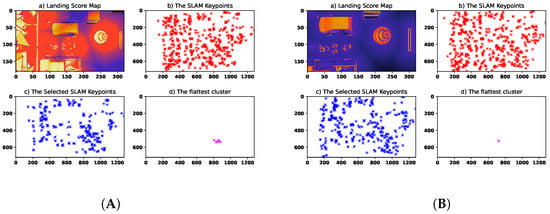
Figure 10.
The second scenario: the landing score maps and SLAM-based images. (A) The proposed method; (B) state-of-the-art method. In the heat maps, the black areas represent potential safe landing zones. The red, blue, and pink stars indicate the SLAM keypoints, the selected keypoints, and the flattest subset, respectively.
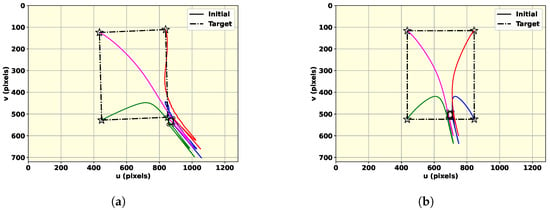
Figure 11.
The second scenario: image-plane feature motion, where circles show the initial feature position and the stars indicate the desired position. The trace of each of the features is distinguished by using four different colors. (a) The fuzzy map; (b) the Bayesian method.
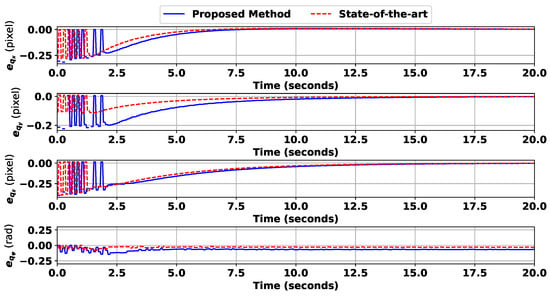
Figure 12.
The second scenario: the feature error development.
3.3. The Third Scenario
The third scenario employs a different world in comparison to the other two. A playground has been selected as an environment to show the versatility of the suggested approach. The results of the simulation are presented in Figure 13, Figure 14, Figure 15 and Figure 16. The environment is more cluttered and unstructured than in the first scenario. The left part of the map, as seen in Figure 13, is occupied by trees and an electricity pole, both of which are correctly identified by the steepness and inclination map. Figure 14A,B show the results for the designed approach and the state-of-the-art method, respectively. It can be generally deduced that the suggested approach is more reliable since there is more space between the points for landing an object with depth variations. The rest of the figures, Figure 15 and Figure 16, show how the IBVS control is successfully established, similar to the other scenarios.
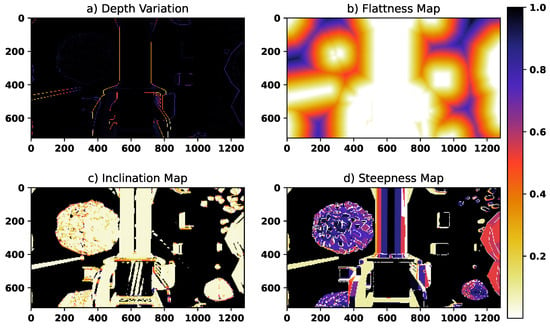
Figure 13.
The third scenario: terrain characterizing maps with the initial absolute position (0, 0, 7).
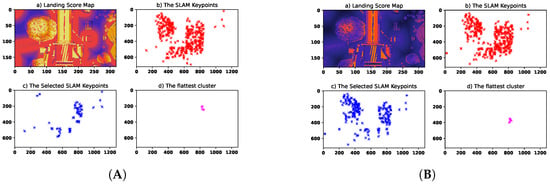
Figure 14.
The third scenario: the landing score maps and SLAM-based images. (A) The proposed method; (B) state-of-the-art method. In the heat maps, the black areas represent potential safe landing zones. The red, blue, and pink stars indicate the SLAM keypoints, the selected keypoints, and the flattest subset, respectively.
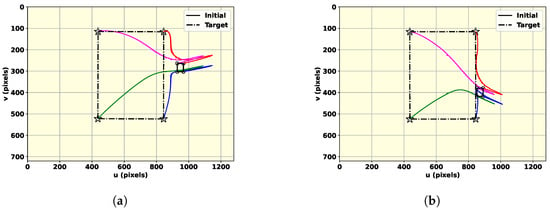
Figure 15.
The third scenario: image-plane feature motion, where circles show the initial feature position and the stars indicate the desired position. The trace of each of the features is distinguished by using four different colors. (a) The fuzzy map; (b) the Bayesian method.
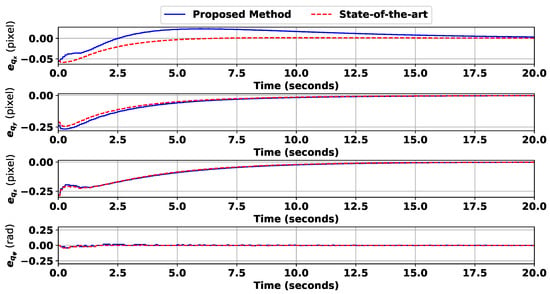
Figure 16.
The third scenario: the feature error development.
3.4. The Fourth Scenario
An indoor office environment is considered to assess the performance of the landing technique. The quadrotor is initially positioned at expressed in the global frame. Figure 17 illustrates the map metrics for the initial frame. As shown in this figure, the edges are assigned with high-intensity values in the depth variation, and the flat areas are detected correctly. Furthermore, the stairs are identified as regions with high inclination and steepness. Figure 18A,B indicates the fuzzy and Bayesian maps for this scene, where a subset of SLAM keypoints are selected as the best landing point. The image-plane features and tracking error are shown in Figure 19 and Figure 20, respectively. These figures validate that the image feature tracking error converges to zero in a finite time.
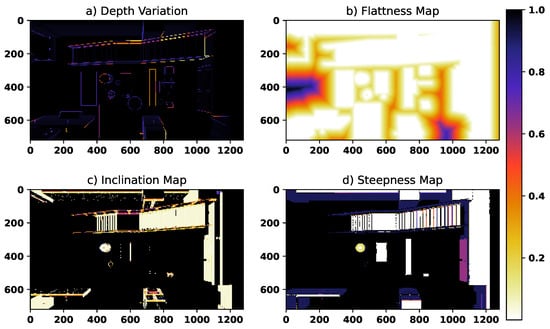
Figure 17.
The fourth scenario: terrain characterizing maps with the initial absolute position (0, 0, 10).
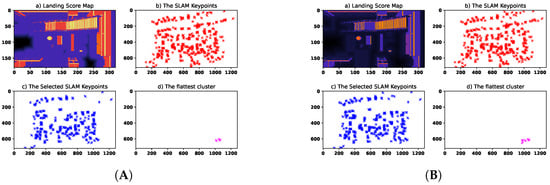
Figure 18.
The fourth scenario: the landing score maps and SLAM-based images. (A) The proposed method; (B) state-of-the-art method. In the heat maps, the black areas represent potential safe landing zones. The red, blue, and pink stars indicate the SLAM keypoints, the selected keypoints, and the flattest subset, respectively.
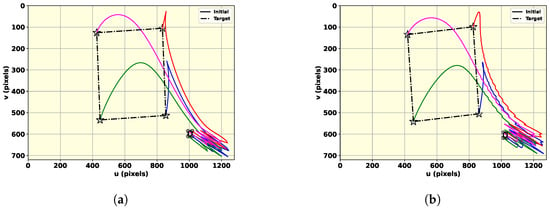
Figure 19.
The fourth scenario: image-plane feature motion, where circles show the initial feature position and the stars indicate the desired position. The trace of each of the features is distinguished by using four different colors. (a) The fuzzy map; (b) the Bayesian method.
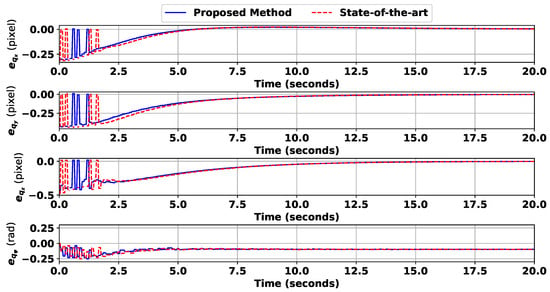
Figure 20.
The fourth scenario: the feature error development.
3.5. Sensitivity Analysis Environmental Conditions
In this subsection, the effect of changing ground materials and illumination variations was investigated on the landing metrics and fuzzy map. The experiments were conducted while the initial position of the UAV and scenery elements, such as the solar panels (except for the ground), remained stationary. Three distinct ground types were considered: grassy, hard, and sandy, to cover a reasonable range of materials. The results, along with the maps, are illustrated in Figure 21, Figure 22 and Figure 23 for grassy, hard, and sandy ground, respectively. Depth variation and flatness demonstrated high sensitivity to these factors; however, inclination and steepness remained almost unchanged, showing tolerance toward these variations. The final fuzzy map shows similar outputs, demonstrating the method’s effectiveness and strong generalization, particularly in areas with a high risk of landing. Additionally, the proposed algorithm was tested under both low and high illumination conditions and observed no changes in the fuzzy landing map. This can be attributed to the fact that this work relies on dense stereo reconstruction using depth data.
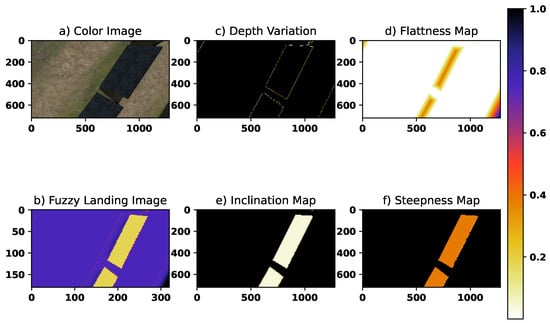
Figure 21.
The grassy ground. The color bar applies to sub-figures (b–f).
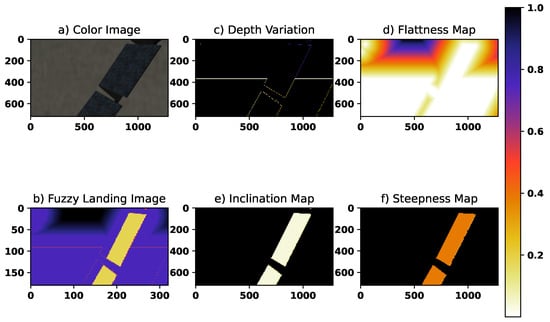
Figure 22.
The hard ground. The color bar applies to sub-figures (b–f).
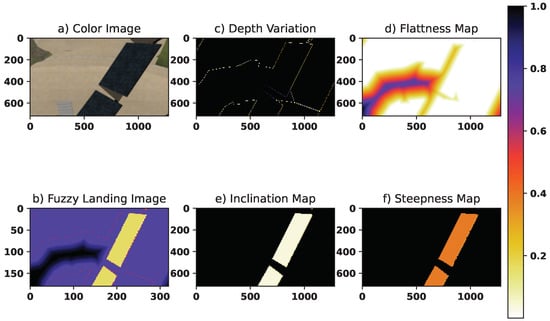
Figure 23.
The sandy ground. The color bar applies to sub-figures (b–f).
4. Discussion
The performance of the proposed landing algorithm has been assessed for various conditions, including different initial conditions and distinct Gazebo worlds. Despite the absence of all man-made markers and the environment being cluttered with a diverse range of objects exhibiting different dimensions, the designed method demonstrated not only its applicability in detecting the best landing zone if there exists any, but it also performed an IBVS control method based on the image moments enabling autonomous landing. The image feature tracking error remained bound in all experiments and converged to zero. It is worth highlighting that large tracking errors can lead to the UAV landing in hazardous zones or even crashing during operation. Potential future works could be devoted to integrating the semantic maps into the designed algorithm to enhance the perception of the environment. Another direction could involve improving the robustness of the method through multi-sensor fusion frameworks, leading to superior pose estimation. Optimizing the fuzzy system’s rules and membership functions using the ground-truth landing points and iterative offline learning can lead to the enhancement of the system’s accuracy. Lastly, integrating finite-time IBVS methods can lower the convergence time, leading to a more time-efficient landing process. Incorporating this landing approach addresses new challenges, such as emergency landings in GPS-denied, unknown environments. The parallel computation made feasible by the emergence of powerful onboard GPUs may potentially reduce the fuzzy system computations, resulting in a more time-efficient algorithm.
5. Conclusions
This work introduces a novel algorithm for safe landing zone detection based on a fuzzy landing map and ORB-SLAM3. Four distinct images are constructed using RGB-D images and the constructed dense stereo point cloud. Based on fuzzy inference, a landing map is then generated, capable of eliminating the areas hazardous for landing. Next, the point cloud generated by the active sparse ORB-SLAM3 is incorporated into the algorithm to alleviate the limited range of the RGB-D camera by identifying a subset of keypoints that are optimal for landing. Third, four synthetic world points are added to the SLAM world points, and an IBVS technique is then performed to complete the landing using the estimated pose from the SLAM system. Eventually, an IBVS controller is suggested to stabilize the image feature error. Stability analyses showed that the control method is able to converge to the predefined desired image. Exemplary ROS Gazebo simulations are provided to demonstrate the effectiveness of the methods in four different scenarios. The results ensured that the landing algorithm can not only tolerate various initial UAV positions but also the change in the environment. The proposed solution was lastly compared with the state-of-the-art method to verify the superiority and effectiveness.
Author Contributions
S.S. developed the formulation and simulations and authored the manuscript. N.A. assisted with the fuzzy system simulation and writing, and H.M. helped with the ROS Gazebo simulation environment. F.J.-S. supervised S.S. in problem formulation and contributed to the manuscript’s authorship. I.M. contributed to this research by providing funding and supervision. All authors have read and approved the published version of the manuscript.
Funding
This work was financially Supported by National Research Council Canada, grant number AI4L-128-1 and Natural Sciences and Engineering Research Council of Canada, grant number 2023-05542.
Data Availability Statement
The data that support the findings of this study are available from the corresponding author upon reasonable request.
Conflicts of Interest
The authors declare no conflicts of interest.
References
- Zheng, L.; Hamaza, S. ALBERO: Agile Landing on Branches for Environmental Robotics Operations. IEEE Robot. Autom. Lett. 2024, 9, 2845–2852. [Google Scholar] [CrossRef]
- Lian, X.; Li, Y.; Wang, X.; Shi, L.; Xue, C. Research on Identification and Location of Mining Landslide in Mining Area Based on Improved YOLO Algorithm. Drones 2024, 8, 150. [Google Scholar] [CrossRef]
- Sefercik, U.G.; Nazar, M. Consistency Analysis of RTK and Non-RTK UAV DSMs in Vegetated Areas. IEEE J. Sel. Top. Appl. Earth Obs. Remote. Sens. 2023, 16, 5759–5768. [Google Scholar] [CrossRef]
- Shen, J.; Wang, Q.; Zhao, M.; Hu, J.; Wang, J.; Shu, M.; Liu, Y.; Guo, W.; Qiao, H.; Niu, Q.; et al. Mapping Maize Planting Densities Using Unmanned Aerial Vehicles, Multispectral Remote Sensing, and Deep Learning Technology. Drones 2024, 8, 140. [Google Scholar] [CrossRef]
- Li, Z.; Wang, Q.; Zhang, T.; Ju, C.; Suzuki, S.; Namiki, A. UAV High-Voltage Power Transmission Line Autonomous Correction Inspection System Based on Object Detection. IEEE Sens. J. 2023, 23, 10215–10230. [Google Scholar] [CrossRef]
- Boukabou, I.; Kaabouch, N. Electric and Magnetic Fields Analysis of the Safety Distance for UAV Inspection around Extra-High Voltage Transmission Lines. Drones 2024, 8, 47. [Google Scholar] [CrossRef]
- Gao, S.; Wang, W.; Wang, M.; Zhang, Z.; Yang, Z.; Qiu, X.; Zhang, B.; Wu, Y. A Robust Super-Resolution Gridless Imaging Framework for UAV-Borne SAR Tomography. IEEE Trans. Geosci. Remote. Sens. 2024, 62, 1–17. [Google Scholar] [CrossRef]
- Abdollahzadeh, S.; Proulx, P.L.; Allili, M.S.; Lapointe, J.F. Safe Landing Zones Detection for UAVs Using Deep Regression. In Proceedings of the 2022 19th Conference on Robots and Vision (CRV), Toronto, ON, Canada, 31 May–2 June 2022; pp. 213–218. [Google Scholar] [CrossRef]
- Alsawy, A.; Moss, D.; Hicks, A.; McKeever, S. An Image Processing Approach for Real-Time Safety Assessment of Autonomous Drone Delivery. Drones 2024, 8, 21. [Google Scholar] [CrossRef]
- Shah Alam, M.; Oluoch, J. A survey of safe landing zone detection techniques for autonomous unmanned aerial vehicles (UAVs). Expert Syst. Appl. 2021, 179, 115091. [Google Scholar] [CrossRef]
- Xu, Y.; Chen, Z.; Deng, C.; Wang, S.; Wang, J. LCDL: Toward Dynamic Localization for Autonomous Landing of Unmanned Aerial Vehicle Based on LiDAR–Camera Fusion. IEEE Sens. J. 2024, 24, 26407–26415. [Google Scholar] [CrossRef]
- Friess, C.; Niculescu, V.; Polonelli, T.; Magno, M.; Benini, L. Fully Onboard SLAM for Distributed Mapping with a Swarm of Nano-Drones. IEEE Internet Things J. 2024, 11, 32363–32380. [Google Scholar] [CrossRef]
- Symeonidis, C.; Kakaletsis, E.; Mademlis, I.; Nikolaidis, N.; Tefas, A.; Pitas, I. Vision-based UAV Safe Landing exploiting Lightweight Deep Neural Networks. In Proceedings of the 2021 4th International Conference on Image and Graphics Processing, Sanya, China, 1–3 January 2021; ICIGP’21. pp. 13–19. [Google Scholar] [CrossRef]
- Subramanian, J.A.; Asirvadam, V.S.; Zulkifli, S.A.B.M.; Singh, N.S.S.; Shanthi, N.; Lagisetty, R.K.; Kadir, K.A. Integrating Computer Vision and Photogrammetry for Autonomous Aerial Vehicle Landing in Static Environment. IEEE Access 2024, 12, 4532–4543. [Google Scholar] [CrossRef]
- Yang, L.; Ye, J.; Zhang, Y.; Wang, L.; Qiu, C. A semantic SLAM-based method for navigation and landing of UAVs in indoor environments. Knowl. -Based Syst. 2024, 293, 111693. [Google Scholar] [CrossRef]
- Chatzikalymnios, E.; Moustakas, K. Landing site detection for autonomous rotor wing UAVs using visual and structural information. J. Intell. Robot. Syst. 2022, 104, 27. [Google Scholar] [CrossRef]
- Dougherty, J.; Lee, D.; Lee, T. Laser-based guidance of a quadrotor uav for precise landing on an inclined surface. In Proceedings of the 2014 American Control Conference, Portland, OR, USA, 4–6 June 2014; pp. 1210–1215. [Google Scholar] [CrossRef]
- Corke, P. Vision-Based Control. In Robotics, Vision and Control: Fundamental Algorithms in Python; Springer: Berlin/Heidelberg, Germany, 2011; Chapter 16. [Google Scholar]
- Janabi-Sharifi, F.; Marey, M. A Kalman-Filter-Based Method for Pose Estimation in Visual Servoing. IEEE Trans. Robot. 2010, 26, 939–947. [Google Scholar] [CrossRef]
- Sepahvand, S.; Wang, G.; Janabi-Sharifi, F. Image-to-Joint Inverse Kinematic of a Supportive Continuum Arm Using Deep Learning. arXiv 2024, arXiv:2405.20248. [Google Scholar] [CrossRef]
- Tadic, V.; Toth, A.; Vizvari, Z.; Klincsik, M.; Sari, Z.; Sarcevic, P.; Sarosi, J.; Biro, I. Perspectives of RealSense and ZED Depth Sensors for Robotic Vision Applications. Machines 2022, 10, 183. [Google Scholar] [CrossRef]
- Campos, C.; Elvira, R.; Rodríguez, J.J.G.; Montiel, J.M.M.; Tardós, J.D. ORB-SLAM3: An Accurate Open-Source Library for Visual, Visual–Inertial, and Multimap SLAM. IEEE Trans. Robot. 2021, 37, 1874–1890. [Google Scholar] [CrossRef]
- Johnson, A.E.; Klumpp, A.R.; Collier, J.B.; Wolf, A.A. Lidar-Based Hazard Avoidance for Safe Landing on Mars. J. Guid. Control. Dyn. 2002, 25, 1091–1099. [Google Scholar] [CrossRef]
- Jabbari Asl, H.; Yoon, J. Robust image-based control of the quadrotor unmanned aerial vehicle. Nonlinear Dyn. 2016, 85, 2035–2048. [Google Scholar] [CrossRef]
- Chaumette, F. Image moments: A general and useful set of features for visual servoing. IEEE Trans. Robot. 2004, 20, 713–723. [Google Scholar] [CrossRef]
- Lewis, F.L.; Selmic, R.; Campos, J. Neuro-Fuzzy Control of Industrial Systems with Actuator Nonlinearities; Society for Industrial and Applied Mathematics: Philadelphia, PA, USA, 2002. [Google Scholar]
- Sepahvand, S.; Amiri, N.; Pourgholi, M.; Fakhari, V. Robust controller design for a class of MIMO nonlinear systems using TOPSIS function-link fuzzy cerebellar model articulation controller and interval type-2 fuzzy compensator. Iran. J. Fuzzy Syst. 2023, 20, 89–107. [Google Scholar] [CrossRef]
- M’Gharfaoui, I. Implementation of an Image-Based Visual Servoing System on a Parrot Bebop 2 UAV. Ph.D. Thesis, Politecnico di Torino, Torino, Italy, 2019. [Google Scholar]
Disclaimer/Publisher’s Note: The statements, opinions and data contained in all publications are solely those of the individual author(s) and contributor(s) and not of MDPI and/or the editor(s). MDPI and/or the editor(s) disclaim responsibility for any injury to people or property resulting from any ideas, methods, instructions or products referred to in the content. |
© 2024 by the authors. Licensee MDPI, Basel, Switzerland. This article is an open access article distributed under the terms and conditions of the Creative Commons Attribution (CC BY) license (https://creativecommons.org/licenses/by/4.0/).