Abstract
Multi-unmanned systems are primarily composed of unmanned vehicles, drones, and multi-legged robots, among other unmanned robotic devices. By integrating and coordinating the operation of these robotic devices, it is possible to achieve collaborative multitasking and autonomous operations in various environments. In the field of surveying and mapping, the traditional single-type unmanned device data collection mode is no longer sufficient to meet the data acquisition tasks in complex spatial scenarios (such as low-altitude, surface, indoor, underground, etc.). Faced with the data collection requirements in complex spaces, employing different types of robots for collaborative operations is an important means to improve operational efficiency. Additionally, the limited computational and storage capabilities of unmanned systems themselves pose significant challenges to multi-unmanned systems. Therefore, this paper designs an edge–end–cloud integrated multi-unmanned system payload management and computing platform (IMUC) that combines edge, end, and cloud computing. By utilizing the immense computational power and storage resources of the cloud, the platform enables cloud-based online task management and data acquisition visualization for multi-unmanned systems. The platform addresses the high complexity of task execution in various scenarios by considering factors such as space, time, and task completion. It performs data collection tasks at the end terminal, optimizes processing at the edge, and finally transmits the data to the cloud for visualization. The platform seamlessly integrates edge computing, terminal devices, and cloud resources, achieving efficient resource utilization and distributed execution of computing tasks. Test results demonstrate that the platform can successfully complete the entire process of payload management and computation for multi-unmanned systems in complex scenarios. The platform exhibits low response time and produces normal routing results, greatly enhancing operational efficiency in the field. These test results validate the practicality and reliability of the platform, providing a new approach for efficient operations of multi-unmanned systems in surveying and mapping requirements, combining cloud computing with the construction of smart cities.
1. Introduction
In recent years, unmanned systems, as an innovative technological means, have quietly been changing people’s lives and have the potential to revolutionize the commercial and industrial sectors. From smart agriculture to intelligent logistics, from drones to autonomous vehicles, unmanned systems have permeated various fields and are becoming essential tools for solving real-world problems. The collection of three-dimensional scene information using unmanned devices has become a hot research topic. Unmanned devices offer advantages such as flexibility, high accuracy, good adaptability, and wide data collection range, greatly enhancing the accuracy and efficiency of surveying and mapping work and gradually transitioning from manned to unmanned surveying. Different types of unmanned systems and surveying scenarios impose different requirements on the performance of ground stations, particularly in terms of computing capabilities. Traditional integration models struggle to meet the demands of distributed and high-performance computing. On one hand, large-scale ground station systems are often deployed on dedicated computers, which suffer from poor portability and high maintenance costs. When the computing capabilities fail to meet application requirements, the solution typically involves adding hardware. On the other hand, ordinary ground station devices can only control a single unmanned device at a time, which is not conducive to the collaborative operations of multiple unmanned systems.
With the development of cloud computing and internet technology, many applications with high demands for computing capabilities have migrated to cloud platforms. This not only effectively reduces hardware costs but also meets the dynamic computing requirements of different task scenarios. Cloud computing is a comprehensive technology that integrates virtualization, big data, and communication, providing computing and various services to end terminals through cloud servers [1]. Edge computing focuses on pushing computation and data processing to the edge of the network, enabling faster response and processing of data [2]. The end serves as an interface between the physical and digital worlds, which in unmanned systems means an unmanned device that is equipped with sensing, data collection, and real-time response capabilities. The combination of edge–end–cloud synergizes edge computing, end devices, and cloud computing with each other to achieve efficient data processing and computational resource management [3]. Edge devices, as edge nodes, can quickly process and filter data, transmitting key information to the cloud for further analysis and processing. The cloud, in turn, provides powerful computing capabilities and storage resources capable of handling large-scale data and complex computing tasks. End devices play a role in data collection and real-time response. The edge–end–cloud combined model brings broad application prospects to various industries, enabling real-time data analysis and making more intelligent decisions.
The collaborative operation of multiple unmanned systems has become an important trend in the field of robotics [4]. Multiple unmanned systems, through the collaboration of multiple intelligent agents, can accomplish complex tasks that a single intelligent agent cannot handle alone. They have a wide range of applications in military [5], search and rescue [6], agriculture [7], and other fields. Most unmanned systems consist of the same type of intelligent agents, with individual functions that limit the system’s capabilities. However, multi-unmanned systems composed of different types of agents have advantages when performing specific tasks. For example, a multi-unmanned system composed of drones and unmanned vehicles can expand the field of view of the unmanned vehicle, while the unmanned vehicle can alleviate the spatial limitations of the drones, enabling the completion of more complex tasks. Zhao et al. [8] proposed a dynamic, collaborative task allocation model for heterogeneous unmanned platforms and researched the task allocation problem. The experimental results demonstrated that the hybrid improved algorithm, Hy-CAN, utilized by the authors, effectively improves system efficiency. Xin Z et al. [9] developed a swarm of unmanned systems for exploring complex scenarios, and their research showed that through optimization algorithms and collaborative control strategies, a swarm of drones can achieve efficient and stable collaborative operations. Stolfi et al. [10] proposed a novel mobile monitoring system called CROMM-MS, which aims to patrol and detect individuals escaping restricted areas. This system addresses the collaborative operation problem among heterogeneous unmanned systems (UAVs, UGVs, and UMVs) and has shown promising results in experiments. The above examples fully illustrate that the shortcomings of a single unmanned system can be solved through the cooperation between multiple unmanned systems.
The fusion and representation of multi-source data in multi-unmanned systems for surveying and mapping have achieved a series of accomplishments in practical applications. Potena C et al. [11] applied drones and unmanned vehicles in map construction for precision agriculture. The drone’s camera captured images of the farmland, obtaining a planar map, while the unmanned vehicle captured images between crops, obtaining specific information about the farmland. The team designed an efficient algorithm to fuse the data obtained from drones and unmanned vehicles, resulting in an accurate 3D map of the farmland and crops. Tagarakis et al. [12] utilized unmanned vehicles (UAVs) and unmanned ground vehicles (UGVs) for mapping orchards. They fused the results of aerial and ground mapping systems to provide the most accurate representation of trees. Similarly, Asadi et al. [13] employed multiple unmanned systems for data collection in construction scenarios. Their unmanned systems demonstrated collaborative navigation and mapping capabilities in indoor and complex environments. Multi-unmanned systems have shown many successful cases in collaborative surveying and mapping. However, there are still many issues regarding the accuracy of experimental results, requiring further in-depth research.
Currently, research on cloud-based management of unmanned devices mostly focuses on monitoring a single type of unmanned device, leaving room for research on the management of multiple types of unmanned devices. Pino M et al. [14] proposed a cloud platform that combines drones and a cloud platform applied in precision agriculture and aerial mapping. This platform enables two-way communication with drones and further manages multiple drones. Koubaa A et al. [15] developed a drone tracking system called DroneTrack, where the cloud platform invokes drones to track moving targets. Experimental results showed that DroneTrack achieved an average tracking accuracy of 3.5 m for slow-moving targets. DJI, a company based in Shenzhen, has developed the DJI FlightHub 2 cloud platform [16]. They studied an integrated cloud platform for UAV mission management to achieve comprehensive, real-time situational awareness. Nanjing Dayi Innovation Technology has developed a cloud platform for kite line drones [17], enabling real-time monitoring, flight planning, and data storage management for drones. These systems have achieved operational management of a single type of unmanned device. However, when faced with multi-drone operations in complex environments, there is still a lack of a stable and efficient management platform.
In response to the aforementioned issues, we designed an intelligent service platform that integrates multiple functions, including payload management for multi-unmanned systems, scene data acquisition management, dynamic tracking and real-time display of unmanned devices’ video footage, online processing and visualization of multi-sensor data, as well as storage and analysis of massive data. This platform efficiently accomplishes various tasks related to data collection by multi-unmanned systems in complex scenarios, addressing the challenges of managing multiple unmanned devices. It is characterized by its user-friendly interface and strong functionality, and it significantly enhances the autonomy and intelligence of unmanned device management.
2. Platform Architecture
As shown in Figure 1, the overall architecture of IMUC consists of the following three layers: (i) Device layer, which includes connected hardware of multiple unmanned systems (such as unmanned vehicles, drones, etc.). Each unmanned device is equipped with a microcomputer (for real-time computing requirements and information exchange with the cloud), sensors (mounted on unmanned devices to collect spatial scene data, with different sensors used for different task scenarios), and a control platform (used to drive the motion of unmanned systems). (ii) Transmission layer, which facilitates efficient information transfer between the cloud layer and the device layer. This layer utilizes ROS Bridge and MQTT (Message Queuing Telemetry Transport) protocols, with JSON and XML being the main data formats. (iii) Cloud layer, which provides a range of services and components in a cloud computing environment. This includes distributed computing, cloud storage, cloud service components, and interface design. These components and services leverage the cloud platform to provide large-scale computing and storage capabilities, meeting the users’ requirements for high performance, scalability, and reliability.
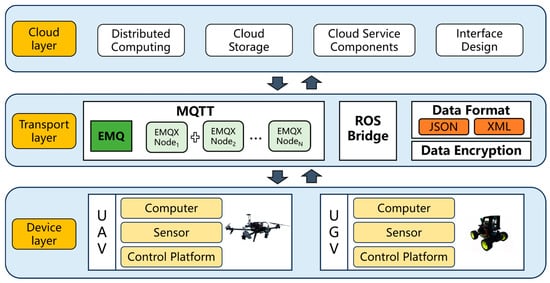
Figure 1.
Platform architecture diagram.
Below, this article explains each layer of the platform separately.
2.1. Device Layer
The device layer primarily consists of unmanned devices that perform data acquisition tasks, including commonly used unmanned drones, unmanned vehicles, and other similar devices. These unmanned devices can execute tasks assigned by the cloud platform, such as spatial data collection and target tracking. This layer connects various network elements and services and uses wireless network technologies to connect to the cloud platform. It receives control commands published by the platform and executes corresponding operations. The robot operating system (ROS) is widely used as middleware for developing robot applications and represents a significant milestone in modular programming for robots [18]. In the era where unmanned devices are extensively employed, the integration of unmanned systems with the Internet of Things (IoT) world has made remote operations remarkably simple [19,20].
2.2. Transport Layer
The transmission layer is responsible for transferring data between the device layer and the cloud layer, as well as handling network management and resource allocation tasks. The cloud layer can transmit task-defined strategies to the multiple unmanned systems in the device layer through the transmission layer, which is accomplished with the help of internet protocol-based interface components. Additionally, network communication plays a crucial role in transmitting data from unmanned devices to the cloud layer, offering more efficient data transfer compared to traditional communication methods like telemetry wireless communication. In this paper, the MQTT (Message Queuing Telemetry Transport) protocol and ROSBridge protocol are primarily used. MQTT is a lightweight, open, and simple messaging protocol based on the publish–subscribe model and client/server architecture. It is adaptable to constrained device resources, low bandwidth, and unstable network environments. ROSBridge protocol, built on the WebSocket protocol, serves as a bridge between ROS and other communication protocols or platforms. It enables bidirectional communication, allowing ROS to interact and communicate with other systems [21]. In terms of data transmission, instruction-based information mainly utilizes the JSON and XML data formats, with JSON (JavaScript Object Notation) being the primary format. JSON is a lightweight data interchange format that is particularly suitable for transferring data between web applications and APIs. Similarly, the XML format has also been considered for use in the platform. However, due to the relatively verbose nature of XML, it may introduce additional network overhead. Therefore, in resource-constrained environments of unmanned devices, the JSON format is prioritized. This way, whether it is a drone, a quadruped robot, or any other device, they can exchange data in a predefined data format, enabling interoperability. Additionally, coordination and synchronization among devices are achieved through the aforementioned protocols, where messages are published and subscribed to, facilitating device status sharing and event triggering.
The fundamental security and privacy requirements of the Internet of Things (IoT) encompass confidentiality, integrity, availability, authenticity, and privacy protection. These requirements reflect the platform’s capability and functionality in addressing threats and security vulnerabilities [22,23]. During data transmission, ensuring the security of data transfer between the cloud and devices is crucial, especially when sensitive and critical information is involved [24]. The operational process of unmanned devices typically involves receiving remote commands and control signals from the cloud for remote operations. These commands and control signals are transmitted through various transmission sources at different rates, and we can ensure data security through various measures and technologies. Heidari et al. [25] proposed a deep learning-based blockchain Intrusion Detection System (IDS) method called BIIR. They developed a secure D2X and D2D communication model and a blockchain mechanism for secure information transmission. System testing demonstrated that this method can effectively identify attacks. Prabhu Kavin et al. [26] introduced an innovative key generation algorithm based on elliptic curve cryptography (ECC), aiming to generate highly secure keys. Additionally, they introduced a new binary-based two-stage encryption and decryption algorithm, which references the key values based on elliptic curve encryption to ensure effective protection of user data in the cloud environment. In this paper, we employed TLS/SSL technology for data encryption. TLS/SSL combines public key encryption and symmetric key encryption to achieve end-to-end data encryption. Moreover, it provides an authentication mechanism to verify the identity of the cloud and devices. This ensures effective protection of data transmission from the cloud to the device, ensuring data security and privacy.
2.3. Cloud Layer
The cloud layer primarily consists of distributed computing, cloud storage, cloud service components, and interface design. The vast computing and storage capabilities provided by the cloud platform can be utilized for parallel computing of large-scale data in complex spatial scenarios and for storing data streams containing environment, location, and task information collected from multiple sensors. In terms of data storage, conventional location, attribute, and instruction data are stored using the lightweight and efficient non-relational cross-platform database MongoDB. Spatial scene data, on the other hand, is stored using the relational database PostgreSQL [27,28]. Different types of data are stored in different databases, which greatly improves the efficiency of data extraction during massive data analysis. The cloud layer provides functional components required for tasks, enabling data processing, visualization, and issuing of relevant task instructions. Offloading a significant amount of data processing tasks to the cloud layer can greatly reduce the computational burden on the device layer, thereby enhancing task execution efficiency. Interface design defines the data transmission format, message semantics, and communication behavior, adhering to principles such as consistency, security, and flexibility. This improves the reliability and scalability of the system while reducing development and maintenance costs.
3. Software Architecture
IMUC utilizes various technologies to build different components and implement various functionalities. As shown in Figure 2, on the frontend, we use JavaScript, HTML, and CSS as foundational technologies and employ Vue.js as the frontend framework to achieve dynamic user interfaces. Additionally, we utilize ElementUI as a UI design tool to provide aesthetically pleasing and user-friendly interface elements. On the server side, we adopt Node.js as the backend technology stack and use the Express framework to build server-side applications. This allows us to efficiently handle client requests and interact with databases and other services. To support data storage and management, we utilize both the NoSQL database MongoDB and the relational database PostgreSQL to meet the requirements of different types of data. For mapping functionalities, we use Leaflet as the mapping library and integrate it with TianDiTu and Cesium to provide map display and interaction features on the platform. Furthermore, we employ the Potree library for three-dimensional point cloud rendering, enabling visualization and analysis of point cloud data. Finally, to achieve real-time data transmission and communication, we employ a data transfer mechanism based on WebSocket technology. This approach ensures real-time data transfer and bidirectional communication between the client and the server, improving the platform’s responsiveness and real-time capabilities.
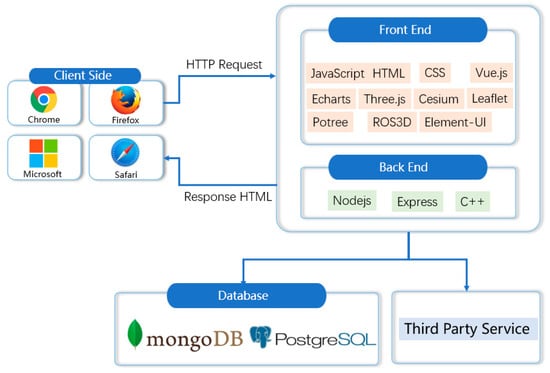
Figure 2.
Software architecture.
4. Related Work
We present our related work in this section. As shown in Figure 3, we divide the main content of IMUC into five parts for introduction, and will explain in detail the technical content involved.

Figure 3.
Related work.
4.1. Data Exchange between Edge, Device, and Cloud Platforms
Data exchange, as one of the core technologies of the platform, plays a crucial role. By utilizing efficient data exchange techniques, it ensures real-time transmission of data between the edge, edge devices, and cloud platforms. This means that data collected by edge devices can be quickly and accurately delivered to the cloud servers, enabling the cloud to access the latest data for real-time monitoring, analysis, and decision-making. The platform consists of various hardware devices and software, and data exchange technology enables cross-platform collaboration, allowing different devices and systems to seamlessly exchange and share data. This collaboration promotes interoperability between components, enhancing the flexibility and scalability of the entire platform. The main aspects of platform data exchange are as follows:
4.1.1. Camera Data
The data captured by the high-definition camera mounted on the unmanned device is transmitted to the platform using the MQTT protocol. First, the edge device encodes the captured raw photos. Then, the device connects to the MQTT broker and takes advantage of its high-concurrency real-time data streaming capabilities to transmit the encoded stream to the platform. The platform automatically decodes the data and stores the images in JPG format on the server.
4.1.2. Lidar Data
To achieve real-time transmission of laser data collected by unmanned devices, the ROSBridge protocol is used, and data downsampling is performed before transmission to reduce data storage and transmission costs. The frontend processes the transmitted data using ROSLIB and utilizes Three.js for graphical rendering. Three.js is an open-source 3D graphics library based on JavaScript, used to create and display interactive 3D graphics scenes and animations on web pages. Three.js provides various renderer options, allowing 3D scenes to be rendered into HTML5 Canvas, WebGL, or SVG, facilitating fast rendering of massive 3D point cloud data. The laser data processing described above is performed on streaming data and has characteristics such as low latency and high reliability. Additionally, to enable comprehensive data mining and analysis, the platform also implements a real-time accumulation display of laser data, with the maximum accumulation configurable by users. Currently, open-source packages like ROS3D do not yet support the accumulation of laser data on the web client.
4.1.3. Video Data
For the transmission of video data, we use Mjpg_Server at the edge layer to publish video streaming services and employ the ROSBridge protocol for data transmission. This allows for convenient transmission of real-time video streams captured by unmanned device cameras to the cloud platform, enabling remote monitoring and storage. Additionally, the video frames are embedded with object detection results that can identify pedestrians in the video. This means that users can access real-time video through this platform and accurately detect and recognize pedestrians in the video. The object detection algorithm used here is YOLOv4 (You Only Look Once version 4) [29], which is an advanced object detection algorithm that has achieved significant improvements in accuracy and speed. The general framework of this object detector is shown in Figure 4. Finally, the platform supports displaying the received video stream data on the web client, allowing users to watch and monitor the video stream in real time through a web interface. In summary, users can access the platform through a web browser to obtain video data and object detection results from the unmanned device camera.

Figure 4.
YOLOV4 object detector.
4.1.4. Location Data
The platform supports real-time transmission of location information received by GPS devices mounted on unmanned devices to the cloud platform. The location data primarily includes longitude, latitude, and altitude information. When the unmanned device carries a GPS device during a mission, the GPS device periodically retrieves the device’s location information, including the current longitude, latitude, and altitude. By connecting with the unmanned device, the platform can transmit this location information in real-time to the cloud platform.
4.1.5. Command Data
During the execution of specific tasks, the platform sends the operator’s decision information to the edge or directly to the device using the ROSBridge protocol. This includes motion commands, start/stop commands, data feedback commands, and more. Through these instructions, the operator can control the movement and navigation of the unmanned device.
4.2. Active Perception Based on Change Detection in Complex Scenes
To address the issues of low efficiency, repetition, randomness, and untimeliness in data acquisition tasks in complex scenes, as shown in Figure 5, we integrated the Global Remote Sensing Real-time Monitoring and Point-to-Point Update Cloud Platform [30]. This platform can detect persistent changes in the task area and can push the location information of the changed areas to our platform. This allows our platform to promptly respond to real-time task requirements and take appropriate measures during execution to achieve the following goals:
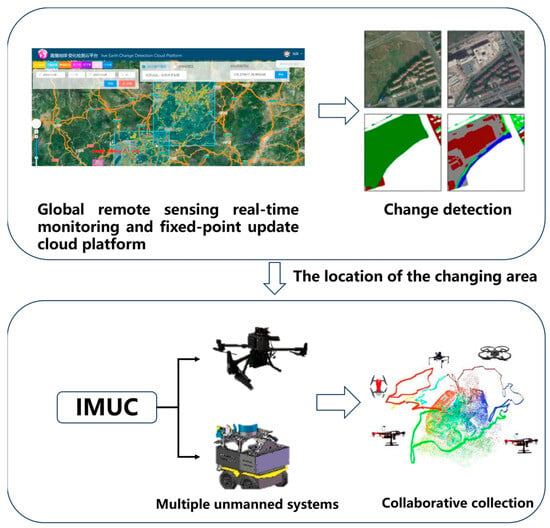
Figure 5.
Data collection process based on change detection.
- Efficiency improvement: By utilizing the detection capabilities of the Global Remote Sensing Real-time Monitoring and Point-to-Point Update Cloud Platform, we can quickly obtain information about changes in the task area. This eliminates the need for extensive searching or blind sampling, saving time and resources;
- Task optimization: By obtaining real-time location information of the changed areas, we can perform targeted data acquisition and processing for these regions. This allows us to more accurately capture the changes in the task area, thereby improving the quality and effectiveness of data acquisition;
- Timely response: Due to the continuous monitoring of changes in the task area by the Global Remote Sensing Real-time Monitoring and Point-to-Point Update Cloud Platform, our platform can receive these change notifications promptly and respond quickly. This means that we can adjust the task execution strategy in real-time to meet the evolving task requirements.
4.3. Rapid Online Fusion Processing of Multi-Sensor Data
4.3.1. Image Online Stitching
For the online image splicing part, we used the OpenREALM [31] image splicing framework. The process of this framework is shown in Figure 6, which mainly includes five parts: Pose Estimation, Densification, Surface Generation, Ortho Rectification, and Mosaicing.

Figure 6.
OpenREALM image stitching process.
First, in the Pose Estimation stage, ORBSLAM2 [32] is used to estimate the camera pose matrix. If the tracking is successful, the frames are processed in a georeferenced manner. The incoming frames may be queued until the estimated error is below a certain threshold before they can be published. In the Densification stage, the suitability of the input frames is checked, and based on the pose recognition, the initialization of the depth map is created. Then, the frames are passed to the densifier interface, where the PSL reconstruction framework is used. After dense reconstruction, the depth map is projected into a 3D point cloud, covering any previously existing sparse points. The Surface Generation stage utilizes the open-source library “Grid Map” proposed by Peter Fankhauser [33]. It is defined by regions of interest and the Ground Sampling Distance (GSD). Multiple layers of data can be stacked, where each cell of the grid is composed of a multi-dimensional information vector. OpenREALM also re-implements some modules to address the efficiency issues of dynamically growing maps in Grid Map. In the Ortho Rectification stage, a “grid-based ortho-mosaicking” technique is chosen. It maps each pixel in the image to a corresponding cell in the grid and uses interpolation and other techniques to estimate the values of each cell. The Mosaicing stage is the final processing stage, where all previously collected data are fused into a single scene representation. Here, all sequentially dense-reconstructed and rectified frames form a high-resolution mosaic.
In our platform, we face the challenge of achieving real-time online stitching of images from multiple unmanned systems involving the input of data from multiple sensors. To address this issue, as shown in Figure 7, we plan to modify the OpenREALM framework and introduce a multi-threading mechanism to enable parallel processing of data from multiple sensors. With this approach, we can simultaneously handle data from multiple sensors and ultimately fuse the stitched data into a unified scene. This will improve the efficiency and real-time capability of our platform.

Figure 7.
Online stitching of multi-sensor images.
4.3.2. Multi-Source Laser Data Fusion
During the data acquisition process, we employed multiple laser sensors to work collaboratively, where each sensor may provide laser scan data from different angles or coverage areas. To obtain high-quality and consistent data, we preprocessed the collected laser data at the edge by performing operations such as noise removal, filtering, and calibration. Next, we aligned the data from different sensors to a common coordinate system to ensure they were represented in the same frame of reference. To eliminate differences in position and orientation, we utilized point cloud registration algorithms to match and align the point cloud data from different sensors. Finally, we fused the registered point cloud data to merge the data provided by different sensors into a unified point cloud model [34]. This allows us to visualize the complete point cloud data on the web interface. Through this process, we can obtain more comprehensive and accurate environmental information, providing a foundation for subsequent analysis and applications.
4.4. Cloud-Based Unmanned System Payload Management and Monitoring
4.4.1. Multi-Unmanned System Payload Management
- Device management: The platform supports the connection of various types of devices, including drones, unmanned vehicles, and robotic dogs, among others. We need to input the model, IP address, and basic information such as the task name and operators involved for each device. The basic information we submit is automatically stored in the server’s database and synchronized to the device information panel. Through such a device management mechanism, we can scientifically track and manage critical information on various devices. This includes device models, allowing us to accurately identify and differentiate different types of devices; IP addresses, enabling precise device localization within the network; and task names and operator information, facilitating the recording and tracking of device usage. This scientific device management approach not only helps ensure the accuracy and traceability of device operations but also provides comprehensive control over device connectivity status and task assignment. Additionally, by storing basic information in a server-side database and synchronizing it with the device information panel, we can have real-time awareness of device status and attributes, offering users more convenient device management services;
- Group control settings: Group control settings allow for customizing the parameters required for data transmission operations across multiple unmanned devices before starting a mission. This primarily includes setting the main control IP, topics for laser data and camera data for different unmanned devices, color settings for laser data from different sources, waypoint planning object settings, remote control object switching, as well as maximum linear and angular velocity settings. Once we have completed the settings, the data will be updated in the server parameters. Through group control settings, we can customize the operational parameters of unmanned devices to meet the specific requirements of tasks. By setting the color of laser data from different sources, we can better distinguish and visualize information from different data sources. The setting of waypoint planning objects allows us to precisely specify the navigation of unmanned devices in missions. The ability to switch remote control objects, as well as the setting of maximum linear and angular velocities, provides flexible control over the motion behavior of unmanned devices. Group control settings are of significant importance for the collaborative work of multiple unmanned devices, as they can enhance work efficiency and reduce costs and resource inputs.
4.4.2. Device Monitoring
- Equipment tracking: The platform can receive real-time location information returned by unmanned equipment and, at the same time, update the trajectory information generated during its movement into the image map. Through this function, users can clearly understand the activity trajectory of each unmanned device. We also automatically differentiate colors for different unmanned device trajectories, allowing users to easily distinguish and identify the trajectory paths of different devices. This feature will provide users with real-time and intuitive location information displays to better monitor and analyze the movement of unmanned devices. By observing the movement patterns and trajectories of unmanned devices, users can gain a better understanding of the activity range of the devices. This is of significant importance for tasks such as mission supervision, location analysis, and path optimization;
- Remote control of devices: Under normal communication conditions, the platform can remotely control the movement of unmanned devices using the NippleJS virtual joystick. NippleJS is a JavaScript library used to create interfaces for virtual joystick touch functionality. This feature allows temporary takeover of unmanned vehicles when they are unable to navigate autonomously or encounter risks. The vector controller provided by NippleJS enables simultaneous control of the angular velocity and linear velocity of the device’s movement;
- Device waypoint planning control: The waypoint planning feature empowers users to autonomously define waypoints on the map interface. It also reads the control object specified in the group control settings and sends the set waypoints to the designated unmanned devices. Upon receiving the instructions, the devices autonomously explore and navigate to the specified waypoints. During this process, the devices collect real-time scene data from their surrounding environment and transmit it back to the platform. This feature enables remote control of unmanned devices for efficient data collection. Users can utilize this functionality to flexibly plan waypoints for the devices, meeting the specific requirements of the tasks. The devices autonomously navigate according to the predefined sequence of waypoints, collecting crucial environmental information. This remote control approach not only enhances the efficiency of data collection but also reduces the complexity and risks associated with manual operation.
4.5. Cloud Route Planning and Massive Data Visualization
4.5.1. Cloud Route Planning
Global route planning is the foundation for multi-unmanned system operations and provides decision-making support for executing tasks with unmanned devices. In our platform, global route planning considers two factors, area data and the number of devices, to determine the global routes. The platform automatically sends the route data as task information to the unmanned devices, which autonomously carry out the assigned tasks within the specified time frame. As shown in Figure 8, the platform automatically plans the global routes based on the user-defined task area and the number of unmanned devices. These global routes serve as initial paths, and during the data collection process, if the devices encounter obstacles, they rely on their obstacle-avoidance capabilities.
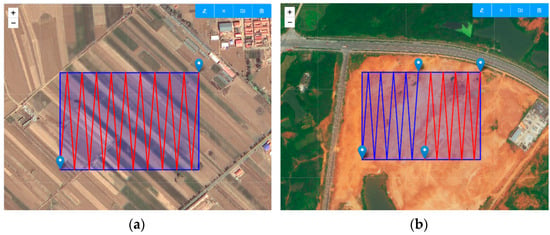
Figure 8.
Global route planning. (a) Global route planning under a single unmanned device; (b) Global route planning under multiple unmanned devices.
The pseudocode of the global route planning algorithm is as follows: Algorithm 1.
| Algorithm 1. Global Route Planning Algorithm |
|
4.5.2. Mass Data Visualization
When conducting surveying and mapping tasks with multiple unmanned systems, it is common to collect a large amount of environment point cloud data across different flight missions. However, this poses significant challenges when it comes to displaying such massive amounts of data on a web browser. Firstly, environment point cloud data can be extremely large, containing millions or even billions of points. Transferring and loading such large-scale data faces limitations in network bandwidth and storage capacity. Traditional browser technologies may encounter performance bottlenecks when dealing with such a large volume of data, resulting in slow loading speeds or even the inability to load and display the data properly. Secondly, processing and visualizing point cloud data require significant computational resources. Browsers typically run on terminal devices such as personal computers, tablets, or smartphones, which have limited computing power. Therefore, real-time processing and visualization of point cloud data in a browser can lead to performance degradation, lagging, or crashes. To overcome these challenges, the platform adopts the Potree [35] point cloud visualization framework. Potree provides various tools for point cloud data processing, analysis, and visualization, enabling users to intuitively understand the distribution, shape, and features of the data. It employs a range of optimization techniques, such as hierarchical storage and progressive loading of point cloud data, to enhance data transfer and loading efficiency. By segmenting point cloud data into multiple levels and dynamically loading data based on the user’s perspective and needs, Potree enables fast point cloud data visualization while reducing the burden on network transmission and device computation.
For web visualization of massive point cloud data, we implemented the following solution: Firstly, we uploaded the LAS-format point cloud data to a cloud server using a POST request. Secondly, the server-side program on the cloud server incorporates the PotreeConverter, a point cloud format conversion tool embedded in Potree. It automatically converts the LAS-format point cloud data into the format required by Potree. Lastly, we utilized Potree for the visualization and rendering of the massive point cloud data. Potree uses a modified nested octree (MNO) structure, as shown in Figure 9, to divide the point cloud data into spherical point clouds, significantly improving the speed of data browsing. To provide a richer point cloud rendering experience, the platform has designed multiple rendering modes based on intensity values, elevation values, RGB values, GPS time, categories, and level of detail (LOD), as depicted in Figure 10. These rendering modes allow users to display point cloud data in various ways according to their preferences and requirements.

Figure 9.
Spherical point cloud divided into MNO ((a) Level 0; (b) Level 1; (c) Level 2; (d) Level 3).
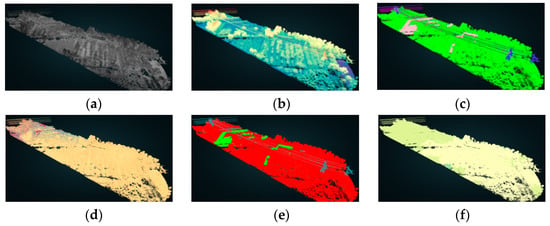
Figure 10.
Transmission line point cloud rendering: (a) intensity coloring; (b) elevation coloring; (c) RGB coloring; (d) GPS time coloring; (e) classification coloring; (f) LOD level coloring.
In addition, the platform has also designed point cloud rendering capabilities based on the open-source 3D mapping framework Cesium, which adds another visualization method for point cloud data. Cesium ion, with its cloud storage capability, is a platform that provides tilesets and 3D geospatial data. We can upload data to CesiumJS applications, thereby reducing the platform’s burden of storing large-scale point cloud data. Figure 11 illustrates the display effect of accessing point cloud data stored on Cesium ion.
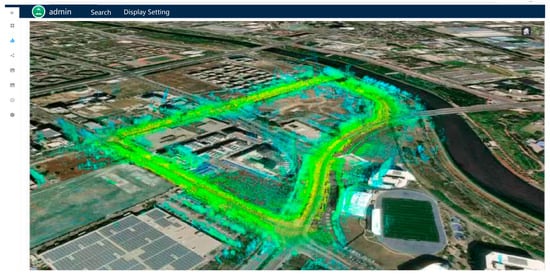
Figure 11.
Display point cloud data on Cesium.
Lastly, we also integrated point cloud measurement capabilities into the platform. The functionality primarily includes distance, area, and angle measurements. The measurement tools utilize GPU point-picking techniques to automatically capture the currently hovered point or the nearest surrounding 3D points to obtain point data. This approach provides fast and accurate measurements. The measurement methods are depicted in Figure 12, illustrating distance, area, and angle measurements, respectively.

Figure 12.
Point cloud measurement tools: (a) distance measurement; (b) angle measurement; (c) area measurement.
5. Experiment and Comparison
5.1. Hardware Platform
The hardware setup for this experiment consists of two unmanned ground vehicles (UGVs) and one unmanned aerial vehicle (UAV). As shown in Figure 13, the UGVs utilize the BUNKER chassis, which employs a tracked differential drive mechanism capable of differential rotation. The LIDAR sensor used is the XT32 3D laser, with a maximum range of 120 m. The UGVs are equipped with an Intel NUC11 computer, a monocular camera, and an i300 IMU. The UAV used is the Prometheus450, developed by AMOVLAB, as depicted in Figure 14. Additionally, we employ MESH network communication to enhance data transmission distance and efficiency, ensuring efficient data transfer during mission execution. Among the sensors carried by unmanned devices, GNSS (Global Navigation Satellite System) is primarily used to receive positioning information, thereby determining the three-dimensional position in the geographic space. LIDAR (Light Detection and Ranging) is a system that uses laser beams to detect targets and measure distances to objects. Laser rangefinders have highly accurate ranging capabilities, with precision reaching the centimeter level. IMU (Inertial Measurement Unit) is an inertial measurement system composed of sensors such as accelerometers, gyroscopes, and magnetometers. It is a self-contained navigation system that does not require an external reference frame, relies on external information, or is affected by weather conditions and external disturbances. IMU is used to measure object acceleration and angular velocity. The camera is primarily used to capture image data of the surrounding environment.
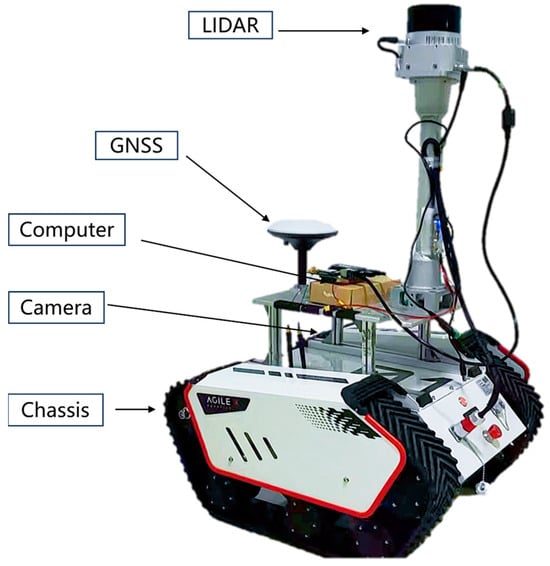
Figure 13.
Hardware composition of unmanned ground vehicle.
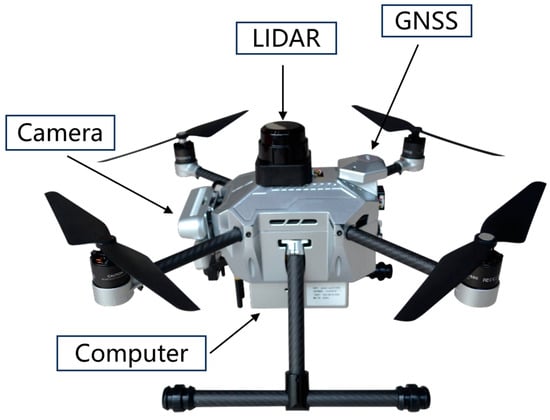
Figure 14.
Hardware composition of unmanned aerial vehicle.
5.2. Lab Environment
The location for this experiment is in the vicinity of a laboratory building at Wuhan University. This location offers a complex environment that provides rich conditions for the experiment. The terrain here is diverse, including various scenarios such as obstacles, bends, ramps, and tall buildings. These factors were important considerations when selecting the experimental site. The presence of diverse obstacles allows us to simulate the operation of unmanned devices in complex environments and test their obstacle-avoidance capabilities within the platform’s mission planning. The existence of bends and ramps enables us to test the stability of unmanned devices and the accuracy of navigation on different terrains. Additionally, the surrounding tall buildings provide an ideal environment to test the data transmission capability and signal stability of the platform and unmanned devices in densely populated areas. These complex environmental conditions present certain challenges for conducting multi-unmanned system data collection operations on the platform.
5.3. Experiment Procedure
The basic flowchart of the experiment is shown in Figure 15. Firstly, the operator places the unmanned devices in designated positions. The tester accesses the platform web page through a browser to perform basic operations such as adding devices and group control settings. Next, the tester draws the mission area and sends the mission information to the unmanned devices. The devices autonomously explore the mission area based on the planned waypoints. Finally, the collected environmental data are transmitted to the platform and displayed on the web interface.
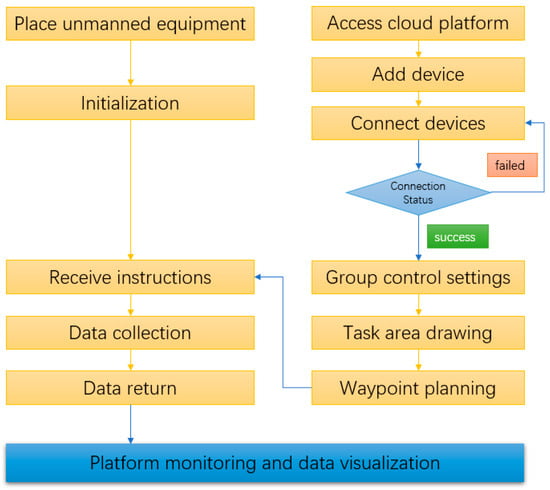
Figure 15.
Experimental flow chart.
Figure 16 illustrates the planned waypoint data on the platform, where the unmanned vehicle autonomously explores and navigates to these positions. The blue dots indicate the current position of the unmanned vehicle, the red dots represent the target waypoints, and the red lines depict the traveled trajectory. We also conducted tests for scenarios with multiple unmanned vehicles, as shown in Figure 17. The map uses different colors to differentiate the trajectories of different unmanned vehicles. On the right side, the real-time accumulated LiDAR data are displayed. The red point cloud data represent the data collected by unmanned vehicle 1, while the blue point cloud data represent the data collected by unmanned vehicle 2. Here, the point cloud data from different sources are transformed into the same coordinate system, allowing for the visualization of accumulated point clouds from multiple vehicles in the same scene. Figure 18 displays the trajectory of two unmanned vehicles during their operation. The platform records their motion trajectories and visualizes them. From the trajectory map, it can be observed that both unmanned vehicles can consistently upload their position data, and their trajectories exhibit good closure, covering all the targets in the test area.
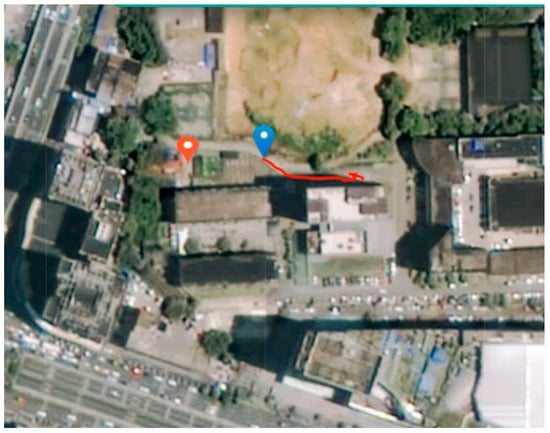
Figure 16.
Waypoint planning.
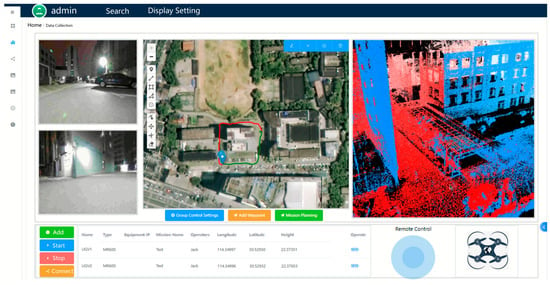
Figure 17.
Multi-unmanned vehicle operation.

Figure 18.
Trajectory diagram during unmanned vehicle testing: (a) UGV1 trajectory map; (b) UGV2 trajectory map.
Similarly, we conducted tests by connecting the drone to the platform, as shown in Figure 19. The platform accurately receives GNSS data transmitted by the drone and updates its position in real-time on the map. During the operation, the connection between the platform and the drone remains stable, ensuring the reliability of intelligent decision-making on the platform.

Figure 19.
Drone operations: (a) real-time position feedback during drone operations; (b) drone trajectory map.
5.4. Experimental Results and Analysis
The overall experiment consisted of 10 field tests. Among them, the platform was tested in conjunction with multiple unmanned vehicles for five tests, resulting in a total data acquisition of approximately 2782.8855 MB. These data include 1601.23 MB of LiDAR data, 1181.34 MB of camera data, and 0.3155 MB of GNSS data. The specific information is shown in Table 1. The platform was also tested in conjunction with the drone for five tests, resulting in a total data acquisition of approximately 381.0309 MB. These data include 380.856 MB of camera data and 0.1749 MB of GNSS data. The specific information is shown in Table 2.

Table 1.
Multi-autonomous vehicle test results.

Table 2.
Drone test experimental results.
During the data collection process, all devices were able to receive commands and complete the data acquisition tasks without any data loss. The display of accumulated LiDAR data was smooth, allowing for normal manipulation of point cloud data in a 3D scene. Over time, the LiDAR data were incrementally updated. For camera data, the images were displayed smoothly, enabling clear identification of the surrounding scenes. The reception of GNSS data was normal, and the information panel refreshed quickly. There were no significant deviations between the positioning information of the unmanned devices and their actual positions. Throughout the operation, the platform was able to monitor the status of the devices and visualize the data collection results. This ensured the high-quality completion of the experiment and improved its reliability and accuracy.
5.5. Platform Performance Testing
We conducted performance testing on the platform in an intranet environment. The test computer had an Intel Core i7-12700H@2.30 GHz CPU, 16 GB of memory, and an NVIDIA GeForce RTX 3050 GPU. As shown in Table 3, we used the locust tool to simulate different numbers of unmanned devices sending requests to the platform to test its stress tolerance. The test duration was set to 1 min. We can observe that the average response time of the platform increases with the number of drones, and the maximum response time generally follows an upward trend. For example, when the number of unmanned devices is 20, the maximum response time of the platform is 29 ms, which is acceptable. Additionally, no request failures occurred among the 147,630 requests, demonstrating the high stability of the platform. Table 4 displays the resource usage of the platform after a period of stable operation. The platform’s CPU usage remains below 10%, memory usage stays within 1 GB, and GPU usage is controlled below 55%. From the resource usage, we can observe that the GPU usage of the platform is relatively high, mainly due to the rendering of a large amount of 3D data. Table 5 shows the transmission rates of the platform’s main data types. The transmission rates for LiDAR data, camera data, and other instruction data are approximately 0.52 MB/s, 0.36 MB/s, and 0.12 MB/s, respectively. The speed of data transmission is primarily influenced by the network environment.

Table 3.
Performance testing of connecting different numbers of unmanned devices.

Table 4.
Resource usage.

Table 5.
Data transfer rate.
5.6. Platform Comparison
Here, we compare our platform with similar tools/platforms, as shown in Table 6 We used seven different functionalities as comparison indicators. The first functionality is the ability to add new unmanned devices to the platform, which can be configured through the platform. The second functionality is the ability to manage multiple unmanned devices, including viewing their current status and location, as well as modifying the configuration of each device. The third functionality involves real-time monitoring of GPS coordinates, speed, and video streaming from the unmanned devices. The fourth functionality is the ability to plan global routes for unmanned devices based on the mission area. The fifth functionality is the online stitching of aerial images collected by unmanned devices. The sixth functionality is the online display of multi-sensor data, including LiDAR data, camera data, GNSS data, etc. The seventh functionality is point cloud data processing, enabling cloud-based functions such as clipping, rendering, and measurement of point cloud data.

Table 6.
Platform comparison.
6. Discussion
As an integrated platform, IMUC plays a significant role in supporting and optimizing the collaborative operations of multiple unmanned systems, which is of great importance for the development of the surveying and mapping industry. In the discussion section of this paper, we delve into the technical challenges faced by the platform and explore potential solutions. Additionally, we explore the possibility of integrating the platform with artificial intelligence and machine learning technologies. Finally, we consider the difficulties that this platform may encounter in its application in the surveying and mapping industry and propose possible solutions.
- Technical Challenges Faced: First and foremost, we are highly concerned with improving the data transmission speed in practical operations, as it greatly affects the real-time performance of the platform. In the field of unmanned systems, optimizing data transmission speed is crucial for efficient and intelligent task execution. Currently, the real-time performance of the platform heavily relies on the quality of the network environment. Our current solution mainly involves compressing and simplifying data as much as possible to reduce data transmission time. However, this solution has limitations. With the continuous development of communication technology, faster and more stable communication networks and protocols will meet the demand for high-capacity data transmission. Secondly, we face the challenge of slow web-based rendering of large-scale 3D data. Rendering speed can be improved by constructing octree indexes and using level-of-detail (LOD) techniques to adjust the level of detail. However, as data volume continues to increase, more advanced technologies and algorithms are needed to support the browsing speed of massive 3D data. We are exploring the use of cloud computing and distributed computing methods for rendering large-scale 3D data. By distributing rendering tasks to multiple computing nodes for parallel processing, rendering speed can be accelerated, and the real-time capabilities of the system can be improved. Additionally, leveraging the elasticity and scalability of cloud computing resources, we can dynamically adjust the scale of computing resources to accommodate different scales and complexities of 3D geospatial data, as per the requirement;
- Integration of Artificial Intelligence and Machine Learning: The integration of artificial intelligence (AI) and machine learning (ML) technologies holds significant importance in data transmission and processing. By leveraging these technologies, intelligent allocation and scheduling of tasks can be achieved. Based on factors such as the nature of the tasks, priority, status, and capabilities of the robotic devices, algorithms can autonomously determine which robots should be assigned tasks and arrange the execution order of tasks to achieve optimal task completion efficiency. Additionally, when performing real-time analysis and processing of raw data, useful information or features can be extracted, noise or outlier data can be filtered, and data compression and storage methods can be optimized to improve data processing efficiency and performance. We will conduct in-depth research and apply these technologies to the platform to achieve more efficient and intelligent applications;
- Applications in the Surveying and Mapping Industry: Through this platform, the surveying and mapping industry can achieve more efficient and accurate geographical data collection and processing, resulting in significant value and impact. The platform simplifies the surveying and mapping process by automating data collection, analysis, and visualization, thus improving efficiency and productivity. It reduces manual work and time-consuming tasks, helping to save time and resources. Figure 20 shows the application direction of the surveying and mapping industry and its main technical routes. Our platform is applied in the surveying and mapping industry and brings practical help. For example, emergency disaster rescue operations can assist rescue personnel in remote operations and visualize the situation at the disaster site. This not only quickly reconstructs the field conditions but also improves safety by reducing actual contact with hazardous environments or complex terrains. However, applying this platform to the surveying and mapping industry may face some potential obstacles. Firstly, there are concerns regarding data quality and security. The surveying and mapping industry has high requirements for data quality, including high accuracy and high resolution. It is necessary to implement appropriate data quality control measures to ensure accuracy during the data collection process. Additionally, it is essential to strengthen data security and privacy protection to ensure data integrity. Secondly, there is the challenge of transmitting and visualizing multi-sensor data in complex surveying scenarios. As we encounter increasingly complex scenarios, we often deploy more sensors, which complicates data integration and visualization. This requires continuous iteration of data transformation and standardization tools, as well as data integration techniques, to achieve the fusion of multi-source data.
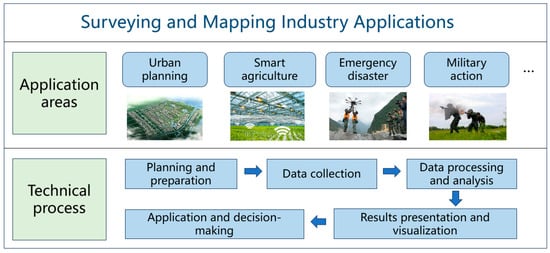 Figure 20. Surveying and mapping industry applications.
7. Conclusions
This paper aims to improve the efficiency of collaborative data collection operations using multiple unmanned systems in complex scenarios. We utilize cloud computing and cloud storage to alleviate the computational and storage limitations of single-machine modes. The platform we designed and developed offers several significant advantages, including:
- Our platform adopts a batch-streaming hybrid data transmission mechanism. This mechanism allows us to achieve the transmission and exchange of heterogeneous payload data from multiple sources, ensuring real-time and complete data delivery. Whether it is structured or unstructured data, both can be efficiently and reliably transmitted and exchanged through this platform;
- By enhancing the management and monitoring capabilities of multiple unmanned systems in the cloud, our platform ensures safety during actual operations. This includes, but is not limited to, real-time tracking of the geographical positions of unmanned devices, monitoring the operational status of devices, and receiving real-time feedback from alarm systems. Additionally, the platform enables fast online fusion processing and collaborative perception of data from multiple sensors;
- Our platform achieves multiple functionalities through the visual design of cloud-based task and route planning. These functionalities include multi-layer switching, editing and visual computation of payload parameters, offline playback of archived data, and statistical analysis of massive data. Users can efficiently perform route planning, adjust payload parameters, view archived data, and conduct data analysis through a clean and intuitive interface. This greatly enhances the convenience and efficiency of operating unmanned systems.
In summary, this paper constructed an integrated and efficient computing platform that is controlled by a cloud-based central brain, with edge computing and intelligent terminal interactions. The achievements of this work are of great significance in improving the efficiency of collaborative data collection operations using multiple unmanned systems in complex scenarios. Future research will further explore how to optimize data visualization and enhance the real-time performance of the system. We will consider more factors and study more efficient task allocation and route planning algorithms to cope with increasingly complex environments and task requirements. Additionally, we will also consider expanding the functionality of the platform to adapt to a wider range of application domains and scenarios.
Author Contributions
Conceptualization, J.T. and R.Z. (Ruofei Zhong); methodology, J.T. and R.Z. (Ruofei Zhong); software, J.T. and Y.Z.; validation, J.T., Y.Z. and R.Z. (Ruizhuo Zhang); resources, J.T., R.Z. (Ruofei Zhong), R.Z. (Ruizhuo Zhang) and Y.Z.; data curation, J.T. and R.Z. (Ruizhuo Zhang); writing—original draft preparation, J.T.; writing—review and editing, J.T., R.Z. (Ruofei Zhong), R.Z. (Ruizhuo Zhang) and Y.Z.; visualization, J.T.; supervision, J.T. and R.Z. (Ruofei Zhong). All authors have read and agreed to the published version of the manuscript.
Funding
This work was supported in part by the National Key Technologies Research and Development Program of China under Grant 2022YFB3904101, in part by the National Natural Science Foundation of China under Grant U22A20568 and 42071444.
Data Availability Statement
Data are contained within the article.
Acknowledgments
The on-site testing work and testing environment have been supported by the research team of Chen Chi from the Institute of Space Intelligence at Wuhan University. We would like to express our sincere gratitude.
Conflicts of Interest
The authors declare no conflicts of interest.
References
- Lei, G.P. Research on Optimization of Cloud-based Control System for Agricultural Drone in Crop Protection. J. Agric. Mech. Res. 2023, 45, 5. [Google Scholar]
- Cao, K.; Liu, Y.; Meng, G.; Sun, Q. An overview on edge computing research. IEEE Access 2020, 8, 85714–85728. [Google Scholar] [CrossRef]
- Kim, B.; Jang, J.; Jung, J.; Han, J.; Heo, J.; Min, H. A Computation Offloading Scheme for UAV-Edge Cloud Computing Environments Considering Energy Consumption Fairness. Drones 2023, 7, 139. [Google Scholar] [CrossRef]
- Xu, Y.; Li, L.; Sun, S.; Wu, W.; Jin, A.; Yan, Z.; Yang, B.; Chen, C. Collaborative Exploration and Mapping with Multimodal LiDAR Sensors. In Proceedings of the 2023 IEEE International Conference on Unmanned Systems (ICUS), Hefei, China, 13–15 October 2023. [Google Scholar]
- Nohel, J.; Stodola, P.; Flasar, Z.; Křišťálová, D.; Zahradníček, P.; Rak, L. Swarm Maneuver of Combat UGVs on the future Digital Battlefield. In Proceedings of the International Conference on Modelling and Simulation for Autonomous Systems, Prague, Czech Republic, 20–21 October 2022; Springer International Publishing: Cham, Switzerland, 2022; pp. 209–230. [Google Scholar]
- Zhang, Y.; Yu, J.; Tang, Y.; Deng, Y.; Tian, X.; Yue, Y.; Yang, Y. GACF: Ground-Aerial Collaborative Framework for Large-Scale Emergency Rescue Scenarios. In Proceedings of the 2023 IEEE International Conference on Unmanned Systems (ICUS), IEEE, Hefei, China, 13–15 October 2023; pp. 1701–1707. [Google Scholar]
- Berger, G.S.; Teixeira, M.; Cantieri, A.; Lima, J.; Pereira, A.I.; Valente, A.; de Castro, G.G.R.; Pinto, M.F. Cooperative Heterogeneous Robots for Autonomous Insects Trap Monitoring System in a Precision Agriculture Scenario. Agriculture 2023, 13, 239. [Google Scholar] [CrossRef]
- Zhao, M.; Li, D. Collaborative task allocation of heterogeneous multi-unmanned platform based on a hybrid improved contract net algorithm. IEEE Access 2021, 9, 78936–78946. [Google Scholar] [CrossRef]
- Zhou, X.; Wen, X.; Wang, Z.; Gao, Y.; Li, H.; Wang, Q.; Yang, T.; Lu, H.; Cao, Y.; Xu, C.; et al. Swarm of micro flying robots in the wild. Sci. Robot. 2022, 7, eabm5954. [Google Scholar] [CrossRef] [PubMed]
- Stolfi, D.H.; Brust, M.R.; Danoy, G.; Bouvry, P. UAV-UGV-UMV multi-swarms for cooperative surveillance. Front. Robot. AI 2021, 8, 616950. [Google Scholar] [CrossRef]
- Potena, C.; Khanna, R.; Nieto, J.; Siegwart, R.; Nardi, D.; Pretto, A. AgriColMap: Aerial-ground collaborative 3D mapping for precision farming. IEEE Robot. Autom. Lett. 2019, 4, 1085–1092. [Google Scholar] [CrossRef]
- Tagarakis, A.C.; Filippou, E.; Kalaitzidis, D.; Benos, L.; Busato, P.; Bochtis, D. Proposing UGV and UAV systems for 3D mapping of orchard environments. Sensors 2022, 22, 1571. [Google Scholar] [CrossRef]
- Asadi, K.; Suresh, A.K.; Ender, A.; Gotad, S.; Maniyar, S.; Anand, S.; Noghabaei, M.; Han, K.; Lobaton, E.; Wu, T. An integrated UGV-UAV system for construction site data collection. Autom. Constr. 2020, 112, 103068. [Google Scholar] [CrossRef]
- Pino, M.; Matos-Carvalho, J.P.; Pedro, D.; Campos, L.M.; Seco, J.C. Uav cloud platform for precision farming. In Proceedings of the 2020 12th International Symposium on Communication Systems, Networks and Digital Signal Processing (CSNDSP), IEEE, Porto, Portugal, 20–22 July 2020; pp. 1–6. [Google Scholar]
- Koubaa, A.; Qureshi, B. DroneTrack: Cloud-Based Real-Time Object Tracking Using Unmanned Aerial Vehicles Over the Internet. IEEE Access 2018, 6, 13810–13824. [Google Scholar] [CrossRef]
- DJI. Skysense Cloud Platform. Available online: https://enterprise.dji.com/flighthub-2?site=enterprise&from=nav (accessed on 29 August 2023).
- Kitebeam Aerospace Company. Kitebeam Unmanned Platform. Available online: https://kitebeam.com (accessed on 27 August 2023).
- Rottmann, N.; Studt, N.; Ernst, F.; Rueckert, E. Ros-mobile: An android application for the robot operating system. arXiv 2020, arXiv:2011.02781. [Google Scholar]
- Labib, N.S.; Brust, M.R.; Danoy, G.; Bouvry, P. The rise of drones in internet of things: A survey on the evolution, prospects and challenges of unmanned aerial vehicles. IEEE Access 2021, 9, 115466–115487. [Google Scholar] [CrossRef]
- Rana, B.; Singh, Y. Internet of things and UAV: An interoperability perspective. In Unmanned Aerial Vehicles for Internet of Things (IoT) Concepts, Techniques, and Applications; John Wiley & Sons: Hoboken, NJ, USA, 2021; pp. 105–127. [Google Scholar]
- Penmetcha, M.; Kannan, S.S.; Min, B.C. Smart cloud: Scalable cloud robotic architecture for web-powered multi-robot applications. In Proceedings of the 2020 IEEE International Conference on Systems, Man, and Cybernetics (SMC), IEEE, Toronto, ON, Canada, 11–14 October 2020; pp. 2397–2402. [Google Scholar]
- Yahuza, M.; Idris, M.Y.I.; Ahmedy, I.B.; Wahab, A.W.A.; Nandy, T.; Noor, N.M.; Bala, A. Internet of drones security and privacy issues: Taxonomy and open challenges. IEEE Access 2021, 9, 57243–57270. [Google Scholar] [CrossRef]
- Wazid, M.; Das, A.K.; Lee, J.-H. Authentication protocols for the internet of drones: Taxonomy, analysis and future directions. J. Ambient Intell. Humanized Comput. 2018, 1–10. [Google Scholar] [CrossRef]
- Yang, W.; Wang, S.; Yin, X.; Wang, X.; Hu, J. A review on security issues and solutions of the Internet of Drones. IEEE Open J. Comput. Soc. 2022, 3, 96–110. [Google Scholar] [CrossRef]
- Heidari, A.; Navimipour, N.J.; Unal, M. A Secure Intrusion Detection Platform Using Blockchain and Radial Basis Function Neural Networks for Internet of Drones. IEEE Internet Things J. 2023, 10, 8445–8454. [Google Scholar] [CrossRef]
- Prabhu Kavin, B.; Ganapathy, S.; Kanimozhi, U.; Kannan, A. An enhanced security framework for secured data storage and communications in cloud using ECC, access control and LDSA. Wirel. Pers. Commun. 2020, 115, 1107–1135. [Google Scholar] [CrossRef]
- Matallah, H.; Belalem, G.; Bouamrane, K. Comparative study between the MySQL relational database and the MongoDB NoSQL database. Int. J. Softw. Sci. Comput. Intell. IJSSCI 2021, 13, 38–63. [Google Scholar] [CrossRef]
- Makris, A.; Tserpes, K.; Spiliopoulos, G.; Zissis, D.; Anagnostopoulos, D. MongoDB Vs PostgreSQL: A comparative study on performance aspects. GeoInformatica 2021, 25, 243–268. [Google Scholar] [CrossRef]
- Bochkovskiy, A.; Wang, C.Y.; Liao, H.Y.M. Yolov4: Optimal speed and accuracy of object detection. arXiv 2020, arXiv:2004.10934. [Google Scholar]
- Zhong, R.; Li, Q.; Zhou, C.; Li, X.; Yang, C.; Zhang, S.; Zhao, K.; Du, Y. Design and implementation of global remote sensing real-time monitoring and fixed-point update cloud platform. Natl. Remote Sens. Bull. 2022, 26, 324–334. [Google Scholar] [CrossRef]
- Kern, A.; Bobbe, M.; Khedar, Y.; Bestmann, U. OpenREALM: Real-time mapping for unmanned aerial vehicles. In Proceedings of the 2020 International Conference on Unmanned Aircraft Systems (ICUAS), IEEE, Athens, Greece, 1–4 September 2020; pp. 902–911. [Google Scholar]
- Mur-Artal, R.; Tardós, J.D. Orb-slam2: An open-source slam system for monocular, stereo, and rgb-d cameras. IEEE Trans. Robot. 2017, 33, 1255–1262. [Google Scholar] [CrossRef]
- Fankhauser, P.; Hutter, M. A universal grid map library: Implementation and use case for rough terrain navigation. Robot Oper. Syst. (ROS) Complet. Ref. 2016, 1, 99–120. [Google Scholar]
- Xu, Y.; Chen, C.; Wang, Z.; Yang, B.; Wu, W.; Li, L.; Wu, J.; Zhao, L. PMLIO: Panoramic Tightly-Coupled Multi-LiDAR-nertial Odometry and Mapping. ISPRS GSW 2023, 5, 703–708. [Google Scholar] [CrossRef]
- Schütz, M. Potree: Rendering Large Point Clouds in Web Browsers; Technische Universität Wien: Wiedeń, Österreich, 2016. [Google Scholar]
- OpenDroneMap Team. WebODM Software. Available online: https://www.opendronemap.org/webodm/ (accessed on 21 August 2023).
- PX4 Team. QGroundControl Software. Available online: http://qgroundcontrol.com/ (accessed on 23 August 2023).
- Foxglove Company. Foxglove Official Website. Available online: https://console.foxglove.dev/ (accessed on 20 August 2023).
Disclaimer/Publisher’s Note: The statements, opinions and data contained in all publications are solely those of the individual author(s) and contributor(s) and not of MDPI and/or the editor(s). MDPI and/or the editor(s) disclaim responsibility for any injury to people or property resulting from any ideas, methods, instructions or products referred to in the content. |
© 2024 by the authors. Licensee MDPI, Basel, Switzerland. This article is an open access article distributed under the terms and conditions of the Creative Commons Attribution (CC BY) license (https://creativecommons.org/licenses/by/4.0/).